JP2017524924A - Raman spectroscopy system, apparatus and method for analyzing, characterizing and / or diagnosing the type or nature of a sample or tissue such as abnormal growth - Google Patents
Raman spectroscopy system, apparatus and method for analyzing, characterizing and / or diagnosing the type or nature of a sample or tissue such as abnormal growth Download PDFInfo
- Publication number
- JP2017524924A JP2017524924A JP2016575728A JP2016575728A JP2017524924A JP 2017524924 A JP2017524924 A JP 2017524924A JP 2016575728 A JP2016575728 A JP 2016575728A JP 2016575728 A JP2016575728 A JP 2016575728A JP 2017524924 A JP2017524924 A JP 2017524924A
- Authority
- JP
- Japan
- Prior art keywords
- raman
- tissue
- illumination
- spectrum
- probe
- Prior art date
- Legal status (The legal status is an assumption and is not a legal conclusion. Google has not performed a legal analysis and makes no representation as to the accuracy of the status listed.)
- Granted
Links
Images




Classifications
-
- G—PHYSICS
- G01—MEASURING; TESTING
- G01N—INVESTIGATING OR ANALYSING MATERIALS BY DETERMINING THEIR CHEMICAL OR PHYSICAL PROPERTIES
- G01N21/00—Investigating or analysing materials by the use of optical means, i.e. using sub-millimetre waves, infrared, visible or ultraviolet light
- G01N21/62—Systems in which the material investigated is excited whereby it emits light or causes a change in wavelength of the incident light
- G01N21/63—Systems in which the material investigated is excited whereby it emits light or causes a change in wavelength of the incident light optically excited
- G01N21/65—Raman scattering
-
- A—HUMAN NECESSITIES
- A61—MEDICAL OR VETERINARY SCIENCE; HYGIENE
- A61B—DIAGNOSIS; SURGERY; IDENTIFICATION
- A61B1/00—Instruments for performing medical examinations of the interior of cavities or tubes of the body by visual or photographical inspection, e.g. endoscopes; Illuminating arrangements therefor
- A61B1/012—Instruments for performing medical examinations of the interior of cavities or tubes of the body by visual or photographical inspection, e.g. endoscopes; Illuminating arrangements therefor characterised by internal passages or accessories therefor
- A61B1/018—Instruments for performing medical examinations of the interior of cavities or tubes of the body by visual or photographical inspection, e.g. endoscopes; Illuminating arrangements therefor characterised by internal passages or accessories therefor for receiving instruments
-
- A—HUMAN NECESSITIES
- A61—MEDICAL OR VETERINARY SCIENCE; HYGIENE
- A61B—DIAGNOSIS; SURGERY; IDENTIFICATION
- A61B5/00—Measuring for diagnostic purposes; Identification of persons
- A61B5/0059—Measuring for diagnostic purposes; Identification of persons using light, e.g. diagnosis by transillumination, diascopy, fluorescence
- A61B5/0075—Measuring for diagnostic purposes; Identification of persons using light, e.g. diagnosis by transillumination, diascopy, fluorescence by spectroscopy, i.e. measuring spectra, e.g. Raman spectroscopy, infrared absorption spectroscopy
-
- A—HUMAN NECESSITIES
- A61—MEDICAL OR VETERINARY SCIENCE; HYGIENE
- A61B—DIAGNOSIS; SURGERY; IDENTIFICATION
- A61B5/00—Measuring for diagnostic purposes; Identification of persons
- A61B5/0059—Measuring for diagnostic purposes; Identification of persons using light, e.g. diagnosis by transillumination, diascopy, fluorescence
- A61B5/0082—Measuring for diagnostic purposes; Identification of persons using light, e.g. diagnosis by transillumination, diascopy, fluorescence adapted for particular medical purposes
- A61B5/0084—Measuring for diagnostic purposes; Identification of persons using light, e.g. diagnosis by transillumination, diascopy, fluorescence adapted for particular medical purposes for introduction into the body, e.g. by catheters
-
- G—PHYSICS
- G01—MEASURING; TESTING
- G01J—MEASUREMENT OF INTENSITY, VELOCITY, SPECTRAL CONTENT, POLARISATION, PHASE OR PULSE CHARACTERISTICS OF INFRARED, VISIBLE OR ULTRAVIOLET LIGHT; COLORIMETRY; RADIATION PYROMETRY
- G01J3/00—Spectrometry; Spectrophotometry; Monochromators; Measuring colours
- G01J3/02—Details
- G01J3/0205—Optical elements not provided otherwise, e.g. optical manifolds, diffusers, windows
- G01J3/0218—Optical elements not provided otherwise, e.g. optical manifolds, diffusers, windows using optical fibers
-
- G—PHYSICS
- G01—MEASURING; TESTING
- G01J—MEASUREMENT OF INTENSITY, VELOCITY, SPECTRAL CONTENT, POLARISATION, PHASE OR PULSE CHARACTERISTICS OF INFRARED, VISIBLE OR ULTRAVIOLET LIGHT; COLORIMETRY; RADIATION PYROMETRY
- G01J3/00—Spectrometry; Spectrophotometry; Monochromators; Measuring colours
- G01J3/28—Investigating the spectrum
- G01J3/44—Raman spectrometry; Scattering spectrometry ; Fluorescence spectrometry
-
- G—PHYSICS
- G01—MEASURING; TESTING
- G01N—INVESTIGATING OR ANALYSING MATERIALS BY DETERMINING THEIR CHEMICAL OR PHYSICAL PROPERTIES
- G01N21/00—Investigating or analysing materials by the use of optical means, i.e. using sub-millimetre waves, infrared, visible or ultraviolet light
- G01N21/17—Systems in which incident light is modified in accordance with the properties of the material investigated
- G01N21/25—Colour; Spectral properties, i.e. comparison of effect of material on the light at two or more different wavelengths or wavelength bands
- G01N21/27—Colour; Spectral properties, i.e. comparison of effect of material on the light at two or more different wavelengths or wavelength bands using photo-electric detection ; circuits for computing concentration
- G01N21/274—Calibration, base line adjustment, drift correction
-
- A—HUMAN NECESSITIES
- A61—MEDICAL OR VETERINARY SCIENCE; HYGIENE
- A61B—DIAGNOSIS; SURGERY; IDENTIFICATION
- A61B2560/00—Constructional details of operational features of apparatus; Accessories for medical measuring apparatus
- A61B2560/02—Operational features
- A61B2560/0223—Operational features of calibration, e.g. protocols for calibrating sensors
-
- G—PHYSICS
- G01—MEASURING; TESTING
- G01J—MEASUREMENT OF INTENSITY, VELOCITY, SPECTRAL CONTENT, POLARISATION, PHASE OR PULSE CHARACTERISTICS OF INFRARED, VISIBLE OR ULTRAVIOLET LIGHT; COLORIMETRY; RADIATION PYROMETRY
- G01J3/00—Spectrometry; Spectrophotometry; Monochromators; Measuring colours
- G01J3/12—Generating the spectrum; Monochromators
- G01J2003/1226—Interference filters
- G01J2003/123—Indexed discrete filters
-
- G—PHYSICS
- G01—MEASURING; TESTING
- G01N—INVESTIGATING OR ANALYSING MATERIALS BY DETERMINING THEIR CHEMICAL OR PHYSICAL PROPERTIES
- G01N2201/00—Features of devices classified in G01N21/00
- G01N2201/06—Illumination; Optics
- G01N2201/061—Sources
- G01N2201/06113—Coherent sources; lasers
- G01N2201/0612—Laser diodes
-
- G—PHYSICS
- G01—MEASURING; TESTING
- G01N—INVESTIGATING OR ANALYSING MATERIALS BY DETERMINING THEIR CHEMICAL OR PHYSICAL PROPERTIES
- G01N2201/00—Features of devices classified in G01N21/00
- G01N2201/08—Optical fibres; light guides
-
- G—PHYSICS
- G01—MEASURING; TESTING
- G01N—INVESTIGATING OR ANALYSING MATERIALS BY DETERMINING THEIR CHEMICAL OR PHYSICAL PROPERTIES
- G01N2201/00—Features of devices classified in G01N21/00
- G01N2201/12—Circuits of general importance; Signal processing
-
- G—PHYSICS
- G01—MEASURING; TESTING
- G01N—INVESTIGATING OR ANALYSING MATERIALS BY DETERMINING THEIR CHEMICAL OR PHYSICAL PROPERTIES
- G01N2201/00—Features of devices classified in G01N21/00
- G01N2201/12—Circuits of general importance; Signal processing
- G01N2201/129—Using chemometrical methods
Landscapes
- Physics & Mathematics (AREA)
- Health & Medical Sciences (AREA)
- Life Sciences & Earth Sciences (AREA)
- Spectroscopy & Molecular Physics (AREA)
- General Health & Medical Sciences (AREA)
- Pathology (AREA)
- Surgery (AREA)
- Engineering & Computer Science (AREA)
- General Physics & Mathematics (AREA)
- Biomedical Technology (AREA)
- Heart & Thoracic Surgery (AREA)
- Medical Informatics (AREA)
- Molecular Biology (AREA)
- Biophysics (AREA)
- Animal Behavior & Ethology (AREA)
- Public Health (AREA)
- Veterinary Medicine (AREA)
- Nuclear Medicine, Radiotherapy & Molecular Imaging (AREA)
- Chemical & Material Sciences (AREA)
- Analytical Chemistry (AREA)
- Biochemistry (AREA)
- Immunology (AREA)
- Optics & Photonics (AREA)
- Radiology & Medical Imaging (AREA)
- Theoretical Computer Science (AREA)
- Mathematical Physics (AREA)
- Investigating, Analyzing Materials By Fluorescence Or Luminescence (AREA)
- Endoscopes (AREA)
Abstract
ラマンスペクトルを使用する異常成長などのサンプルや組織のタイプ及び/又は性質の特徴付け、同定又は診断は、FP及びHW波長範囲などの2つの異なる波長範囲におけるラマンスペクトル内の異なるスペクトルサブインターバルを分析して、一方又は両方の波長範囲における1以上の基準マーカーとの一致を同定し;該一致から、該サンプルや組織のタイプ及び/又は性質を特徴付け、同定し又は診断することを含む。FP及びHWラマンスペクトルは、単一回折格子を用いて同時に検出又は取得することができる。Characterization, identification or diagnosis of sample and tissue types and / or properties such as abnormal growth using Raman spectra analyze different spectral subintervals in the Raman spectrum in two different wavelength ranges such as FP and HW wavelength ranges Identifying a match with one or more reference markers in one or both wavelength ranges; characterizing, identifying or diagnosing the type and / or nature of the sample or tissue from the match. The FP and HW Raman spectra can be detected or acquired simultaneously using a single diffraction grating.
Description
技術分野
本発明の態様は、異常な又は明らかに異常な増殖(例えば癌として)といった、励起エネルギー(例えば、コリメートイルミネーション)が向けられるサンプル又は組織のタイプ又は性質の高精度同定のためのラマン分光システム及び方法に関する。特に、ただし排他的ではないが、本発明の態様により、胃腸成長などの異常組織の生体内及び生体外でのリアルタイム高精度診断が可能になる。
TECHNICAL FIELD Aspects of the present invention provide for Raman spectroscopy for high-precision identification of the type or nature of a sample or tissue to which excitation energy (eg, collimated illumination) is directed, such as abnormal or apparently abnormal growth (eg, as cancer). The present invention relates to a system and method. In particular, but not exclusively, aspects of the present invention enable real-time, high-precision diagnosis of abnormal tissues, such as gastrointestinal growth, in vivo and in vitro.
背景
内視鏡などの低侵襲技術を用いて、新生物胃腸成長などの組織の性質を正確かつ迅速に特徴づけ、同定することが非常に望ましい。例えば、結腸直腸癌(CRC)は、後期に発見されたときには死亡率の高い一般的な疾患である。結腸ポリープの同定及び根絶は、結腸直腸死亡率及び罹患率を低下させるために最も重要な手段の1つである。悪性形質転換のリスクがほとんど又はまったくない過形成性ポリープと顕著な悪性潜伏期を伴う腺腫との区別は、従来の大腸内視鏡検査技術を用いた臨床的課題として残っている。
It is highly desirable to accurately and quickly characterize and identify tissue properties, such as neoplastic gastrointestinal growth, using minimally invasive techniques such as background endoscopes. For example, colorectal cancer (CRC) is a common disease with a high mortality rate when discovered late. The identification and eradication of colon polyps is one of the most important tools for reducing colorectal mortality and morbidity. The distinction between hyperplastic polyps with little or no risk of malignant transformation and adenomas with significant malignant latency remains as a clinical challenge using conventional colonoscopy techniques.
毎年120万を超える新たな癌症例及び608,700人の死亡が予測されるため、CRCは現代世界において大きな問題となっている。治癒期における前癌性ポリープ(すなわち腺腫)の早期同定は、ポリープ切除や内視鏡粘膜切除(EMR)などの適切な治療的介入と共に、依然として結腸直腸死亡率及び罹患率を低下させる最も重要な手段である。既存の大腸内視鏡アプローチには、多くの基本的な臨床的限界がある。これは、従来の大腸内視鏡検査がピットパターン、血管パターンなどのポリープの肉眼的粘膜特徴の視覚化に完全に依存し、かつ、組織に関する生体分子情報がほとんど又は全く得られないためである。そのため、現在のケア基準では、結腸直腸検査中に同定された全ての疑わしいポリープ状病変や異常成長の切除が推奨されている。このアプローチは、労働集約的であり、高コストの組織病理学的評価をもたらし、全てのポリープ状病変の3分の1〜2分の1が過形成であることが判明しているため患者に不必要なリスクをもたらす。ポリープ切除術の絶対リスクは比較的小さいと考えられるが、大腸内視鏡検査中に出血、穿孔といった最も一般的な合併症の原因が依然としてある。既存の臨床上の課題及び近年の広範な結腸直腸ポピュレーションベースのスクリーニングプログラムの導入を考慮すると、高度な内視鏡的アプローチの要望は決して高まっていない。そのため、最近の研究は、生体内診断及び分析を改善するための、より洗練された分子イメージング及び分光法の開発に向けられている。 CRC is a major problem in the modern world as more than 1.2 million new cancer cases and 608,700 deaths are predicted each year. Early identification of precancerous polyps (ie, adenomas) during the healing phase is most important, with appropriate therapeutic interventions such as polypectomy and endoscopic mucosal resection (EMR), still reducing colorectal mortality and morbidity Means. Existing colonoscopy approaches have many basic clinical limitations. This is because conventional colonoscopy is completely dependent on the visualization of macroscopic mucosal features of polyps such as pit patterns and blood vessel patterns, and little or no biomolecular information about the tissue is available. . Therefore, current care standards recommend resection of all suspicious polypoid lesions and abnormal growth identified during colorectal examination. This approach is labor intensive and results in a costly histopathological assessment, and it has been shown to patients that one-third to one-half of all polypoid lesions have been found to be hyperplastic. Brings unnecessary risk. Although the absolute risk of polypectomy appears to be relatively small, the most common complications such as bleeding and perforation remain during colonoscopy. In view of existing clinical challenges and the introduction of recent extensive colorectal population-based screening programs, the demand for advanced endoscopic approaches is never growing. As such, recent research has been directed toward the development of more sophisticated molecular imaging and spectroscopy to improve in vivo diagnostics and analysis.
結腸組織標本に対する生体外ラマン分光法の適用により、異なる病理学的タイプ(すなわち、正常、過形成性ポリープ、腺腫及び腺癌)間の区別のために89%〜99%の範囲の奨励精度が得られることが実証されている。これには、ラマン分光法が病理学的タイプの性質を同定するためにポリープの除去が依然として必要なため、上記の従来の内視鏡技術と同じ問題がある。さらに、ラマン分光法から生体内臨床診断への転換には多くの障壁が存在している。これらの障壁としては、本質的に弱い組織ラマン散乱、長時間の捕捉時間(>5秒)、基本的に低融点シリカ干渉による長い(>1.9m)小型化光ファイバープローブ設計を開発することが必要なこと、高い捕集効率及び深い分解能が挙げられる。プローブは低溶融シリカで作製する必要がある。というのは、融合シリカは、弱いラマンシグナルを妨害する強力なラマンシグナル及び蛍光バックグラウンドを有するからである。今日まで、これらの技術的な制限は未解決のままである。 Application of in vitro Raman spectroscopy to colonic tissue specimens has resulted in recommended accuracy ranging from 89% to 99% for differentiation between different pathological types (ie normal, hyperplastic polyps, adenomas and adenocarcinoma) Proven to be obtained. This has the same problems as the conventional endoscopic techniques described above because Raman spectroscopy still requires polyp removal to identify pathological type properties. In addition, there are many barriers to the transition from Raman spectroscopy to in vivo clinical diagnosis. These barriers include the development of miniaturized optical fiber probe designs that are inherently weak tissue Raman scattering, long acquisition times (> 5 seconds), and long (> 1.9 m) basically due to low melting silica interference. What is needed is high collection efficiency and deep resolution. The probe must be made of low fused silica. This is because fused silica has a strong Raman signal and a fluorescent background that interferes with the weak Raman signal. To date, these technical limitations remain unresolved.
迅速なラマン分光技術の開発及び共焦点機能を備えた光ファイバーラマンプローブの小型化を含めた近年の技術的進歩により、内視鏡検査進行中に生体内(すなわち、光学生検)でのリアルタイム組織病理学的評価が可能になった。結腸直腸ポリープのラマン分光法の研究は、いわゆるフィンガープリント(FP)スペクトル範囲(例えば、800〜1800cm-1)に限定される傾向があった。このスペクトル範囲は、組織ラマンシグナルがより強いのみならず、光ファイバーラマン由来のシリカバックグラウンドからの干渉がより少ないため、高波数(HW)レジーム(例えば、2800〜3600cm-1)の使用がいくらか注目されてきた。しかしながら、現在のところ、このタイプの技術を実行可能な選択肢にするのに十分な精度を有する、生体内での癌性細胞の同定を可能にする技術は存在していない。生体内及び生体外での癌性細胞のより正確な同定を可能にするラマン分光技術に対する要望が存在している。 Recent technological advances, including rapid development of Raman spectroscopy and miniaturization of fiber optic Raman probes with confocal functions, allow real-time organization in vivo (ie, optical student examination) during endoscopy Pathological evaluation became possible. Raman spectroscopic studies of colorectal polyps tended to be limited to the so-called fingerprint (FP) spectral range (eg, 800-1800 cm −1 ). This spectral range not only has a stronger tissue Raman signal, but also less interference from the silica background derived from fiber optic Raman, so some attention is paid to the use of high wavenumber (HW) regimes (eg 2800-3600 cm −1 ). It has been. At present, however, no technology exists that allows the identification of cancerous cells in vivo with sufficient accuracy to make this type of technology a viable option. There is a need for Raman spectroscopy techniques that allow for more accurate identification of cancerous cells in vivo and in vitro.
概要
本発明に係る実施形態の目的は、例えば本質的に身体の任意の部分における癌などとしての異常成長といった組織のタイプ及び/又は性質を特徴付け、同定し及び/又は診断するための従来技術及び現在の内視鏡技術に関連する問題の少なくともいくつかを克服することである。さらに別の目的は、内視鏡検査(例えば大腸内視鏡検査などの胃腸内視鏡検査)中に生体内でポリープ及び前癌などの異常組織のタイプ又は性質を迅速に特徴付け、同定し及び/又は診断するためのラマン分光法に基づく高精度システム及び方法を提供することである。
Overview The purpose of embodiments according to the present invention is to prior art for characterizing, identifying and / or diagnosing the type and / or nature of tissue, for example, abnormal growth as a cancer in essentially any part of the body And to overcome at least some of the problems associated with current endoscopic techniques. Yet another object is to quickly characterize and identify the type or nature of abnormal tissues such as polyps and precancers in vivo during endoscopy (eg, gastrointestinal endoscopy such as colonoscopy). And / or providing a high accuracy system and method based on Raman spectroscopy for diagnosis.
本発明に係る様々な実施形態は、生体内における生体分子レベルでの高精度光学生検を可能にするラベルフリー振動分光技術を提供する、光ファイバーラマン分光法のためのシステム及び方法を記載する。複数の実施形態は、内視鏡検査進行中にFPスペクトル範囲とHWスペクトル範囲の両方からの同時測定を組み合わせることを可能にする。生体内及び生体外ラマン測定のためにFPスペクトル範囲とHWスペクトル範囲とを組み合わせるための理論的根拠は多様である:
(i)FP範囲内の組織ラマン信号を圧倒する強力な自己蛍光を呈する場合のある組織(例えば、胃、肺、結腸、肝臓)について、HW範囲は依然として診断情報を伴う強力な組織ラマンピークを含むことができる。
(ii)FP及びHW範囲は、補完生体分子情報(例えば、タンパク質、脂質、DNA及び水)を含むため、組織の特徴付け及び診断を改善することができる。
(iii)結合が異なれば異なるスペクトル範囲で振動するので、2つの異なるスペクトル範囲(FP及びHW)を使用すると、単一スキャンで得られる生体分子情報が増加する。
Various embodiments in accordance with the present invention describe systems and methods for fiber optic Raman spectroscopy that provide label-free vibrational spectroscopy techniques that enable high-precision optical student examination at the biomolecule level in vivo. Embodiments allow combining simultaneous measurements from both the FP and HW spectral ranges during endoscopy. The rationale for combining the FP and HW spectral ranges for in vivo and in vitro Raman measurements varies:
(I) For tissues that may exhibit strong autofluorescence overwhelming tissue Raman signals within the FP range (eg, stomach, lung, colon, liver), the HW range still has a strong tissue Raman peak with diagnostic information. Can be included.
(Ii) FP and HW ranges include complementary biomolecular information (eg, proteins, lipids, DNA and water), which can improve tissue characterization and diagnosis.
(Iii) Different bonds vibrate in different spectral ranges, so using two different spectral ranges (FP and HW) increases the biomolecular information obtained in a single scan.
本発明の一実施形態によれば、FP及びHW光ファイバー共焦点ラマン分光技術(例えば、FP及びHWスペクトルの同時取得を含む)を組み合わせることにより、身体の検査中に生体内において癌、前癌及び/又は他の異常成長のリアルタイム診断を改善することができる。また、FPとHWとを組み合わせた技術を組織サンプルに対して生体外で使用して、身体の任意の部分からのサンプルに存在する異常成長のタイプをより正確に同定することもできる。 According to one embodiment of the present invention, by combining FP and HW fiber optic confocal Raman spectroscopy techniques (eg, including simultaneous acquisition of FP and HW spectra), cancer, precancer and And / or other real-time diagnosis of abnormal growth can be improved. A technique that combines FP and HW can also be used in vitro on a tissue sample to more accurately identify the type of abnormal growth present in the sample from any part of the body.
本発明の一態様によれば、ラマン分光装置は、イルミネーションを組織に向けるように構成された第1のイルミネーション源と、組織によって散乱されたイルミネーションからFP及びHWラマンスペクトルを同時に検出するように構成されたラマン分光器と、FP及びHW波長範囲における検出ラマンスペクトルの離散スペクトルサブインターバル(例えば、3〜15程度又は5〜10の離散スペクトルインターバル、この場合、所定の又はそれぞれのサブインターバルは、約10〜約30cm-1又は約20cm-1のスペクトル幅を有することができる)を分析して一方又は両方の波長範囲において1以上の基準マーカーとの一致を同定するための、少なくとも1個の処理ユニット及び該少なくとも1個の処理ユニットによって実行可能なプログラム命令を保存するメモリを含むコンピュータ化制御及び分析モジュールとを備える。 According to one aspect of the invention, a Raman spectrometer is configured to simultaneously detect a FP and HW Raman spectrum from a first illumination source configured to direct illumination to the tissue and the illumination scattered by the tissue. And a discrete spectral subinterval of the detected Raman spectrum in the FP and HW wavelength ranges (e.g. about 3-15 or 5-10 discrete spectral intervals, in this case the predetermined or each subinterval is approximately At least one treatment to identify a match with one or more fiducial markers in one or both wavelength ranges) (which may have a spectral width of 10 to about 30 cm −1 or about 20 cm −1 ) Executable by the unit and the at least one processing unit And a computerized control and analysis module comprises a memory for storing program instructions.
複数の実施形態では、ラマン分光器は単一の広帯域回折格子を有する。第1イルミネーション源は、励起エネルギーを生成して組織に適用するためのコリメートイルミネーション源を備え、装置は、コリレートイルミネーションを組織に送り、かつ、検出されたラマンスペクトルを組織からラマン分光器に戻すためのプローブをさらに備える。 In embodiments, the Raman spectrometer has a single broadband diffraction grating. The first illumination source comprises a collimated illumination source for generating and applying excitation energy to the tissue, the apparatus sends the collimated illumination to the tissue and returns the detected Raman spectrum from the tissue to the Raman spectrometer. A probe for further comprising.
1以上の基準マーカーは、検出されたラマンスペクトルにおいて特定のピークを含む又は特定のピークであることができる。コンピュータ化制御及び分析モジュールは一致に基づいて異常成長を診断するための少なくとも1個の処理ユニットによって実行可能なプログラム命令を含むことができる。 The one or more reference markers can include or be a specific peak in the detected Raman spectrum. The computerized control and analysis module can include program instructions executable by at least one processing unit for diagnosing abnormal growth based on the match.
プローブは、共焦点の光ファイバープローブを備える又は共焦点の光ファイバープローブであることができる。装置は、プローブが保持される器具チャネルを有する細長いシャフトを有する内視鏡をさらに備えることができる。 The probe can comprise a confocal fiber optic probe or can be a confocal fiber optic probe. The apparatus can further comprise an endoscope having an elongated shaft having an instrument channel in which the probe is held.
コンピュータ化制御及び分析モジュールは、コリメートイルミネーションの出力を動的に調節し及び/又はコリメートイルミネーションに組織がさらされる時間を動的に調節するための少なくとも1個の処理ユニットによって実行可能なプログラム命令を含むことができる。 The computerized control and analysis module can execute program instructions executable by at least one processing unit to dynamically adjust the output of the collimated illumination and / or dynamically adjust the time that the tissue is exposed to the collimated illumination. Can be included.
装置は、少なくとも1の較正基準に対してプローブ又はラマン装置全体を標準化するように構成された較正装置を備えることができる。 The apparatus may comprise a calibration device configured to standardize the entire probe or Raman device against at least one calibration standard.
この装置は、追加のイルミネーションを組織に出力するように構成された追加のイルミネーション源と、第1イルミネーション源によるイルミネーション出力と追加のイルミネーション源による追加のイルミネーション出力との間のイルミネーション干渉を補うように構成されたホットミラーフィルタとを備える。 The apparatus compensates for illumination interference between an additional illumination source configured to output additional illumination to the tissue, and an illumination output from the first illumination source and an additional illumination output from the additional illumination source. And a configured hot mirror filter.
本発明の一態様によれば、ラマン分光法装置によって実行される方法は、第1イルミネーション源によるイルミネーション出力を組織に向け;該組織によって散乱されたイルミネーションからのプローブFP及びHWラマンスペクトルを同時に検出し;該検出されたラマンスペクトルにおける離散スペクトルサブインターバル(例えば、約3〜15又は約5〜10の離散スペクトルサブインターバル、ここで、所定の又は各スペクトルサブインターバルは約10〜30cm-1又は約20cm-1のスペクトル幅を有することができる)をFP波長範囲及びHW波長範囲の両方において分析して、一方又は両方の波長範囲内において1以上の基準マーカーとの一致を同定することを含む。 According to one aspect of the present invention, a method performed by a Raman spectroscopy apparatus directs illumination output from a first illumination source to tissue; simultaneously detects probe FP and HW Raman spectra from illumination scattered by the tissue. Discrete spectral subintervals in the detected Raman spectrum (eg, about 3-15 or about 5-10 discrete spectral subintervals, where the predetermined or each spectral subinterval is about 10-30 cm −1 or about the can) have a spectral width of 20 cm -1 was analyzed for both FP wavelength range and HW wavelength range, comprising identifying a match between one or more reference markers in the wavelength range of one or both.
FP及びHWラマンスペクトルを同時に検出することは、単一広帯域回折格子を使用してFP及びHW波長範囲の両方においてイルミネーションを回折させることを含むことができる。 Detecting the FP and HW Raman spectra simultaneously can include diffracting the illumination in both the FP and HW wavelength ranges using a single broadband diffraction grating.
この方法は、一致に基づいて異常成長の性質を診断することを含むことができる。1以上の基準マーカーは、検出されたラマンスペクトルにおける特定のピークを含む又は特定のピークであることができる。 The method can include diagnosing the nature of abnormal growth based on the match. The one or more reference markers can include or be a specific peak in the detected Raman spectrum.
この方法は、イルミネーション出力を動的に調節し及び/又は組織がイルミネーションにさらされる時間を動的に調節することをさらに含むことができる。 The method can further include dynamically adjusting the illumination output and / or dynamically adjusting the time that the tissue is exposed to illumination.
この方法は、組織をイルミネーションにさらす前に、少なくとも1つの較正基準に対してプローブ又はラマン装置全体を標準化するように較正又は標準化手順を実行することを含むことができる。 The method can include performing a calibration or standardization procedure to standardize the entire probe or Raman device against at least one calibration standard prior to exposing the tissue to illumination.
この方法は、第1イルミネーション源によるイルミネーション出力を組織に向けつつ追加のイルミネーション源を使用して組織に追加のイルミネーションを向け;ホットミラーフィルタを使用して第1イルミネーション源によるイルミネーション出力と追加のイルミネーション源による追加のイルミネーション出力との間のイルミネーション干渉を補うことを含む。 This method directs additional illumination to the tissue using an additional illumination source while directing the illumination output from the first illumination source to the tissue; using a hot mirror filter to provide illumination output and additional illumination from the first illumination source. Compensating for illumination interference between additional illumination output by the source.
ここで、本発明に係る実施形態のさらなる理解を提供するために、単なる例示として添付の図面を参照する。図面は、限定的なものと解釈されるべきではなく、寸法は一定の縮尺ではない場合がある。 For the purpose of providing a further understanding of embodiments according to the present invention, reference will now be made by way of example only to the accompanying drawings in which: The drawings should not be construed as limiting and the dimensions may not be to scale.
詳細な説明
ラマン分光法は、非弾性光散乱の基本原理に基づくユニークな光学的振動技術を表す。入射レーザ光が分子の偏光変化を誘発すると、入射光子のわずかな割合(108の〜1)が、サンプル中の分子の特定のラマン活性振動モードに対応する周波数シフトにより非弾性的に散乱される。異なる分子及び異なる結合が異なる周波数で振動する。したがって、ラマン分光法は、組織中のタンパク質、脂質及びデオキシリボ核酸(DNA)、水などの多数の細胞間及び/又は細胞内成分から多数の特定の生体分子情報を得ることができる。
DETAILED DESCRIPTION Raman spectroscopy represents a unique optical vibration technique based on the fundamental principle of inelastic light scattering. When the incident laser light induces a change in molecular polarization, a small fraction of the incident photons (10 8 -1) are scattered inelastically by a frequency shift corresponding to the particular Raman active vibrational mode of the molecules in the sample. The Different molecules and different bonds vibrate at different frequencies. Thus, Raman spectroscopy can obtain a number of specific biomolecule information from a number of intercellular and / or intracellular components such as proteins, lipids and deoxyribonucleic acid (DNA), water, etc. in tissues.
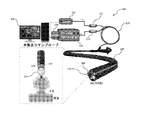
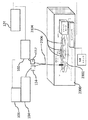
図1は、本発明の一実施形態に係る光ファイバー共焦点ラマン分光法システム若しくは装置又は光ファイバー共焦点ラマン分光器100を示す。このシステム100は、フィンガープリント(FP)スペクトル範囲及び高波数(HW)方式でラマン分光測定を同時に行うことができる。本発明の実施形態に係るFP及びHWスペクトル範囲の組み合わせ測定値を取得し分析することによって、例えば、胃腸組織を特徴付け、同定し及び/又は診断するための生体分子情報の生体内及び生体外分析の精度の向上が可能になる。
FIG. 1 shows a fiber optic confocal Raman spectroscopy system or apparatus or fiber optic
光ファイバー共焦点ラマン分光器100は、近赤外(NIR)ダイオードレーザ102などのコリメートイルミネーション源と、ハイスループット反射イメージング分光器104と、NIR最適化電荷結合素子(CCD)カメラ106と、光ファイバー110によってレーザ102と分光器104の両方に光学的に結合されたプローブ108とを備える。プローブ108は、内視鏡の細長シャフト105(例えば、細長シャフト105によって与えられる器具チャネル内)によって保持できる。光ファイバーラマン分光器100は、レーザ光照射のバックグラウンド除去のためのバンドパスフィルタ112と、散乱レーザ光及びファイバーバックグラウンド干渉を除去しながら組織ラマン信号を通過させるロングパスフィルタ114とをさらに備えることができる。コンピュータ又はマイクロコントローラシステム124は、ラマン分光器動作の態様を制御しかつラマンスペクトル分析を実行するための自動化/コンピュータ化制御及び分析モジュールを与えることができる。
A fiber optic
代表的な実施形態では、近赤外ダイオードレーザ102は、例えばB&W Tek社によって製造された装置と一致するように、300mWの最大出力及び785nmの波長を有することができる。NIRレーザ102は、プローブ108の先端116で励起エネルギーを発生させ、これがプローブ108によって「照射」された任意の種に振動を生じさせ、それによりラマンスペクトルを生じさせることができる。他のタイプのコリメートイルミネーションを使用してダイオードレーザ102を交換することができる。分光器104は、例えば約−70℃までの熱電冷却を備えることができる。分光器104は、プリンストン・インスツルメント社によって製造されたActon LS785 f/2などの装置と一致することができる。カメラ106は、プリンストン・インスツルメント社によって製造されたPixies 400BR eXcelonと一致する。このような実施形態では、分光器100は、約11cm-1の分解能で400〜3600cm-1のスペクトル範囲内の生体内ラマンスペクトルを取得することができる。例示されたデバイスは代表例として示されるものであり、限定的なものではない。
In an exemplary embodiment, the near-
水銀−アルゴンスペクトル較正ランプの原子発光線を、波長較正のために使用することができる。このランプは、米国フロリダ州ダニーデンのオーシャンオプティクス社製のHG−1及びAR−1と一致するランプとすることができる。全ての波長較正スペクトルは、米国カリフォルニア州サンディエゴのEG&G Gamma Scientific社により製造されるRS−10などのタングステン較正ランプを使用して、システムの波長依存性に対して補正される。 The atomic emission line of a mercury-argon spectrum calibration lamp can be used for wavelength calibration. This lamp may be a lamp that matches HG-1 and AR-1 manufactured by Ocean Optics of Dunedin, Florida. All wavelength calibration spectra are corrected for the wavelength dependence of the system using a tungsten calibration lamp such as RS-10 manufactured by EG & G Gamma Scientific, San Diego, CA.
いくつかの実施形態では、FP及びHWスペクトルを測定するために、組織ラマン信号は、異なるレーザ励起周波数を連続的に切り替えることによって、又は 国際特許出願PCT/SG2014/000063号に開示されているように高分解能で全スペクトル範囲(すなわち、150〜1950cm-1;1750〜3600cm-1)をカバーするように二重透過格子を使用することによって測定できる。 In some embodiments, to measure the FP and HW spectra, the tissue Raman signal can be obtained by continuously switching between different laser excitation frequencies or as disclosed in International Patent Application PCT / SG2014 / 000063. Can be measured by using a double transmission grating to cover the entire spectral range (ie 150-1950 cm -1 ; 1750-3600 cm -1 ) with high resolution.
図2は、例えば内視鏡的にアクセス可能な臓器及び身体部分における組織の特徴付け及び診断の精度を改善するような態様でFP及びHWスペクトルを同時に測定するための単一の反射格子を利用する広帯域光ファイバー共焦点ラマン分光システム又は装置(例えば、400〜3600cm-1)200である、ここで詳述する追加の実施形態を示す。 FIG. 2 utilizes a single reflection grating to simultaneously measure FP and HW spectra in a manner that improves the accuracy of tissue characterization and diagnosis, for example, in endoscopically accessible organs and body parts FIG. 6 illustrates an additional embodiment detailed herein, which is a broadband optical fiber confocal Raman spectroscopy system or apparatus (e.g., 400-3600 cm −1 ) 200.
システム200は、近赤外(NIR)ダイオードレーザ202(λex=785nm)と、熱電冷却されたNIR最適化電荷結合素子(CCD)カメラ206を備える高スループット反射分光器204と、特別に設計された1.8mm(外径)光ファイバー共焦点ラマンプローブ208とを備える。システム200は、ラマン分光器の動作の態様を制御しかつラマンスペクトル分析を実行するための自動化/コンピュータ化制御及び分析モジュールを与えるように構成されたコンピュータ/マイクロコントローラシステム124をさらに備える。より詳細には、コンピュータ/マイクロコントローラシステム124は、本発明の一実施形態に係る特定のラマンスペクトル取得及び分析動作、手順又はプロセスを実行するためのメモリ常駐プログラム命令を実行するように構成された1以上の処理ユニットを備えることができる。
The
カスタマイズされた金被覆広帯域反射格子(例えば、830g/mm、〜約800nmで>90%の回折効率を有する)を光ファイバー共焦点ラマンシステム200に組み込み又は統合して、〜11cm-1のスペクトル分解能でスペクトル範囲全体(400〜3600cm-1)をカバーする。光ファイバー共焦点ラマン内視鏡プローブ208は、レーザ光供給及び生体内組織ラマン信号収集の両方のために使用される。共焦点ラマン内視鏡プローブ208は、既に国際特許出願PCT/SG2014/000063号に記載されており、中心光デリバリファイバー(直径200μm、NA=0.22)を取り囲む複数の200μmフィルタ被覆斜角収集ファイバー(NA=0.22)を備える。小型の1.0mmサファイアボールレンズ(NA=1.78)を共焦点プローブ208のファイバー先端に連結して励起光を組織にしっかりと集中させ、上皮内層(組織深さ<200μm)からの効果的なラマンスペクトル収集を可能にする。光ファイバー共焦点ラマンプローブ208は、医療用内視鏡の器具チャネルに挿入でき、かつ、本発明の一実施形態に係る広帯域共焦点ラマン内視鏡技術を使用した生体内組織の特徴付け及び診断のために上皮と穏やかに接触した状態で配置できる。
A customized gold-coated broadband reflective grating (eg, 830 g / mm, having a diffraction efficiency of> 90% at ~ 800 nm) is incorporated or integrated into the fiber optic
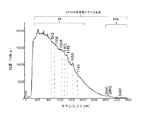
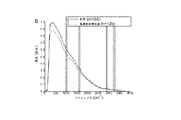
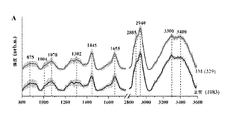
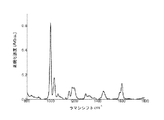
図3は、FP及びHW領域の両方をカバーする、胃腸粘膜から測定した広帯域FP及びHWラマンとそれに付随する自己蛍光スペクトルの例を示す。高分解能組織ラマンピークが、次のような暫定的な分子割り当てでFP範囲内において付随する自己蛍光のトップで観察される:
・v(C−C)タンパク質に関連する853cm-1、
・フェニルアラニンのvs(C−C)環揺らぎに関連する1004cm-1、
・脂質のv(C−C)に関連する1078cm-1、
・タンパク質のアミドIIIv(C−N)及びδ(N−H)に関連する1265cm-1、
・タンパク質のCH3CH2ねじれ及び揺れに関連する1302cm-1、
・タンパク質及び脂質のδ(CH2)変形に関連する1445cm-1、
・タンパク質のアミドIv(C=O)に関連する1655cm-1、及び
・脂質のv(C=O)に関連する1745cm-1。
HW領域には、次のような強いラマンピークも見られる:
・脂質の対称及び非対称CH2伸縮に関連する2850及び2885cm-1、
・タンパク質のCH3伸縮に関連する2940cm-1、
・水OH伸縮振動の広いラマンバンドに関連する3100〜3600cm-1の領域における3400cm-1。
FIG. 3 shows an example of broadband FP and HW Raman and associated autofluorescence spectra measured from the gastrointestinal mucosa covering both the FP and HW regions. A high-resolution tissue Raman peak is observed at the top of the accompanying autofluorescence within the FP range with the provisional molecular assignment as follows:
853 cm −1 associated with v (C—C) protein,
1004 cm -1 related to the vs (CC) ring fluctuation of phenylalanine,
1078 cm -1 related to lipid v (C-C),
1265 cm -1 related to protein amides IIIv (CN) and δ (NH),
1302 cm -1 associated with CH 3 CH 2 twist and shake of the protein,
1445 cm -1 associated with δ (CH 2 ) deformation of proteins and lipids,
· Associated with the protein of amide Iv (C = O) 1655cm -1 , and-lipid v (C = O) to the associated 1745 cm -1.
The following strong Raman peaks are also seen in the HW region:
2850 and 2885 cm −1 associated with lipid symmetric and asymmetric CH 2 stretching,
2940 cm -1 associated with CH 3 stretching of the protein,
3400 cm −1 in the 3100-3600 cm −1 region associated with the broad Raman band of water OH stretching vibration.
本発明の実施形態に係るこの広帯域技術は、FP若しくはHW範囲のいずれか又はFP及びHWスペクトル領域の両方を、組織分析、同定、特徴付け及び/又は診断のために同時に使用することを可能にするため、CCDを急速に飽和させる強烈な自己蛍光を発する内視鏡的にアクセス可能な器官に特に有用である。コンピュータ/マイクロコントローラシステム124は、例えば、グラフィカルユーザインタフェース(GUI)に向けられたユーザ入力に応答して、組織の分析、同定、特徴付け及び/又は診断のためにFPスペクトル領域、HWスペクトル領域又はFP領域とHW領域の両方を選択的に使用するように構成できる。
This broadband technology according to embodiments of the present invention allows either FP or HW range or both FP and HW spectral regions to be used simultaneously for tissue analysis, identification, characterization and / or diagnosis. Therefore, it is particularly useful for endoscopically accessible organs that emit intense autofluorescence that rapidly saturates the CCD. The computer /
一実施形態は、FP領域がCCDの動的範囲を超えている場合には、診断のためにHWスペクトル領域を使用することを含む。別の実施形態では、FP及びHWスペクトル領域の両方を、組織の特徴付け、同定及び/又は診断に使用する。広帯域光ファイバー共焦点ラマン内視鏡プラットフォームは、測定されたCCD飽和レベル及び/又は組織タイプに応じて、異なるスペクトル領域(例えば、HW、FP又は同時FP及びHWのいずれか)間での切り替えを可能にする。 One embodiment includes using the HW spectral region for diagnosis if the FP region exceeds the dynamic range of the CCD. In another embodiment, both the FP and HW spectral regions are used for tissue characterization, identification and / or diagnosis. Broadband fiber optic confocal Raman endoscope platform allows switching between different spectral regions (eg, HW, FP or simultaneous FP and HW) depending on measured CCD saturation level and / or tissue type To.
本発明の一実施形態に係る組織の特徴付け、同定若しくは診断技術又は方法は、広帯域FP及びHWスペクトルからの補完診断情報を利用する。一般に、組織の生物医学的スペクトルは極めて複雑である。異なる組織型間のラマンスペクトルの微妙な分子差を貴重な診断情報に変換するためには、主成分分析(PCA)などの洗練された多変量統計分析技術が必要である。これは、それぞれFP又はHW領域のいずれかについての組織診断及び特徴付けのために全体の(すなわち、連続的な)ラマンスペクトルを利用することによって広く実施されている。 A tissue characterization, identification or diagnostic technique or method according to one embodiment of the present invention utilizes complementary diagnostic information from broadband FP and HW spectra. In general, the biomedical spectrum of a tissue is extremely complex. Sophisticated multivariate statistical analysis techniques such as principal component analysis (PCA) are required to convert subtle molecular differences in Raman spectra between different tissue types into valuable diagnostic information. This has been widely implemented by utilizing the entire (ie, continuous) Raman spectrum for tissue diagnosis and characterization for either the FP or HW region, respectively.
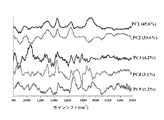
PCAは、ラマンスペクトルを主成分(PC)などの直交成分の線形結合に分解することによって、データセットのスペクトル変動が最大化されるようにラマンスペクトルの次元を縮小する。したがって、PCAは、典型的には、生物医学ラマンスペクトルの分類のためにサポートベクトルマシン(SVM)、ロジスティック回帰(LR)及び線形判別分析(LDA)などの効果的なクラスタリングアルゴリズムと統合されている。PCAはデータの削減と分析に非常に効率的である。 PCA reduces the dimensions of the Raman spectrum so that the spectral variation of the data set is maximized by decomposing the Raman spectrum into linear combinations of orthogonal components such as principal components (PC). Thus, PCA is typically integrated with effective clustering algorithms such as Support Vector Machine (SVM), Logistic Regression (LR) and Linear Discriminant Analysis (LDA) for classification of biomedical Raman spectra. . PCA is very efficient for data reduction and analysis.
あるいは、部分的最小二乗法(PLS)−判別分析(DA)は、適切なY指標マトリックスにおける群親和性を表す、ゼロ及び1のクラスメンバーシップを符号化することによって分類問題のために適用されている。PLS−DAはPCAの基本原理を採用しているが、スペクトル変動と群親和性との共分散を最大にすることで潜在変数(LV)などの要素をさらに回転させるため、LVは、スペクトルデータセットにおける最も顕著な変化よりもむしろ診断に関連する変数を説明する。ほとんどの場合、これにより、診断上重要なスペクトル変化が最初の数LVで保持されることが確保される。 Alternatively, partial least squares (PLS) -discriminant analysis (DA) is applied for classification problems by encoding zero and one class memberships that represent group affinity in the appropriate Y index matrix. ing. PLS-DA adopts the basic principle of PCA, but LV uses spectral data to further rotate elements such as latent variables (LV) by maximizing the covariance between spectral variation and group affinity. Describes variables relevant to diagnosis rather than the most significant changes in the set. In most cases, this ensures that diagnostically important spectral changes are retained in the first few LVs.
ほとんどの多変量アルゴリズム(例えば、PCA又はPLS−DA)は、もともと大量の無関係のスペクトル変数に対処するようには設計されていない。換言すれば、ラマンスペクトルにおけるいくつかのスペクトル領域は、例えば、大きな分散、干渉、組織間変動などのため診断モデルに悪影響を及ぼす可能性がある。 Most multivariate algorithms (e.g., PCA or PLS-DA) are not originally designed to deal with large numbers of unrelated spectral variables. In other words, some spectral regions in the Raman spectrum can adversely affect the diagnostic model due to, for example, large dispersion, interference, inter-tissue variability, and the like.
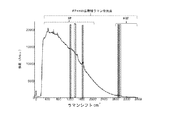
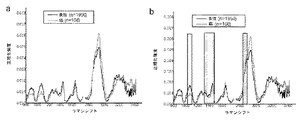
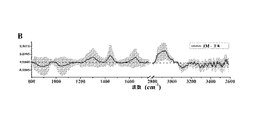
一実施形態では、例えば、広帯域光ファイバー共焦点ラマン分光システム200を使用して行われるFP及びHWスペクトル測定によって得られるようなFP及びHWスペクトル範囲からの補完情報を利用する新規な診断技術又は手順を提供する。このような実施形態は、離散的スペクトルサブインターバル(例えば、約3〜15又は約5〜10の離散的スペクトルサブインターバル)を使用し、その際、所定の又は各スペクトルサブインターバルは、診断のために連続スペクトル範囲ではなく広帯域FP及びHWラマンスペクトルにおける約10〜30cm-1又は約20cm-1のスペクトル幅を有することができる。図4は、補完情報がFP、すなわち800〜1800cm-1及びHW、すなわち2800〜3600cm-1のスペクトル範囲の両方から抽出された胃腸の広帯域ラマン測定の例を示す。図5A〜5Bは、それぞれFP及びHW範囲における5次多項式減算後の同じラマンスペクトルを示し、特定のラマンピークをより明確に示す。本発明の実施形態に係るFP及びHW領域からのスペクトルサブインターバルの使用は、以下にさらに説明するように、前癌及び癌などの異常増殖の生体内ラマン内視鏡診断の精度を有意に改善又は向上させることが分かった。
In one embodiment, a novel diagnostic technique or procedure that utilizes complementary information from FP and HW spectral ranges, such as obtained by, for example, FP and HW spectral measurements performed using broadband optical fiber confocal
本発明に係る実施形態は、結腸直腸異常増殖などの胃腸異常増殖の診断に関する。生体内結腸直腸組織から測定された生FP及びHWラマンスペクトルは、弱い組織ラマンシグナル、強烈な自己蛍光バックグラウンド及びノイズの組み合わせを表す。ラマン信号を見て分析するためには、バックグラウンドとノイズを処理又は除去しなければならない。したがって、生スペクトルは、スペクトル雑音を低減するために、3ピクセルの窓幅を有するSavitzky Golayフィルタなどの一次平滑化フィルタによって前処理される。FP領域(800〜1800cm)において、5次多項式は、ノイズ平滑化スペクトルにおける自己蛍光バックグラウンドをフィッティングするために最適であることが見出され、次いで、この多項式を、較正されたFPスペクトルから減算して組織ラマンスペクトルそのものを生じさせる。HW範囲(2800〜3600cm-1)では、一次直線フィットが、より弱い自己蛍光ベースラインを除去するのに最適であることが見出される。このような各受信信号の前処理は約30ms以内に完了するため、処理後のラマンスペクトル及び診断結果は、コンピュータスクリーンなどの表示装置上にリアルタイムで表示できる。 Embodiments according to the invention relate to the diagnosis of abnormal gastrointestinal growth such as colorectal abnormal growth. Raw FP and HW Raman spectra measured from in vivo colorectal tissue represent a combination of weak tissue Raman signal, intense autofluorescence background and noise. In order to view and analyze the Raman signal, the background and noise must be processed or removed. Thus, the raw spectrum is pre-processed by a first order smoothing filter such as a Savitzky Golay filter with a 3 pixel window width to reduce spectral noise. In the FP region (800-1800 cm), a fifth order polynomial is found to be optimal for fitting the autofluorescence background in the noise smoothed spectrum, and then this polynomial is subtracted from the calibrated FP spectrum. Thus, the tissue Raman spectrum itself is generated. In the HW range (2800-3600 cm −1 ), a linear linear fit is found to be optimal for removing weaker autofluorescence baselines. Since the preprocessing of each received signal is completed within about 30 ms, the processed Raman spectrum and the diagnostic result can be displayed in real time on a display device such as a computer screen.
前処理後にラマンスペクトルを分析してピーク及び/又はマーカーを決定する。次いで、これらのピーク又はマーカーを使用して、スペクトルが由来する組織の性質(病変又は異常増殖の性質)を評価し、特徴付け又は決定する。これは、既知の制御スペクトル、基準マーカーなどとの適切な比較手段を使用してコンピュータシステムによって行うことができる。本明細書で使用されるときに、用語「基準マーカー」は、ラマンスペクトル内の1以上の個々のピーク又は実際にはラマンスペクトル全体を含むものとする。1以上のラマン基準マーカーが異常な細胞増殖の所定の性質を示す場合には、取得されたスペクトルと基準マーカーとの比較は、ルックアップテーブルなどを使用して行うことができる。多くの異なるタイプの比較技術又は方法を使用できることが分かるであろう。比較を行い、そして最良の一致を決定したら、存在する異常細胞増殖のタイプを、任意の適切な手段によってシステム200のユーザに示すことができる。これは、コンピュータ画面上の視覚的表現及び/又は可聴メッセージを含むことができる。
After pretreatment, the Raman spectrum is analyzed to determine peaks and / or markers. These peaks or markers are then used to evaluate, characterize or determine the nature of the tissue from which the spectrum is derived (the nature of the lesion or overgrowth). This can be done by a computer system using suitable comparison means with known control spectra, fiducial markers, and the like. As used herein, the term “reference marker” is intended to include one or more individual peaks in the Raman spectrum or indeed the entire Raman spectrum. If one or more Raman reference markers exhibit a predetermined property of abnormal cell growth, a comparison between the acquired spectrum and the reference marker can be performed using a look-up table or the like. It will be appreciated that many different types of comparison techniques or methods can be used. Once the comparison is made and the best match is determined, the type of abnormal cell growth present can be indicated to the user of
システム200の実施形態のトライアルでは、合計50人の続発症候性患者について大腸内視鏡検査をした。これらの患者は、貧血、出血などの様々な結腸直腸徴候の監視又はスクリーニングのための検査を提示していた。大腸内視鏡検査の前に、患者にポリエチレングリコール(PEG)電解質腸製剤を投与した。静脈内投与したプロポフォールを使用して鎮静を行った。内視鏡検査者は、検査の間に結腸を洗浄し、そして共焦点ラマンスキャンの前にポリープ及び結腸直腸病変を生理食塩水でさらに洗い流して交絡因子(すなわち、残存便及び体液など)をさらに減少させた。典型的な検査の間に、内視鏡を遠位結腸に向け、身体からのプローブの引き抜き中に疑わしい病変についてラマンスキャン(n〜15スペクトル)を実施した。各組織ラマン測定値を約0.1〜0.5秒の期間内に得た。これにより、結腸直腸ポリープの迅速な調査が可能になった。結腸ポリープ(〜10%)と非接触状態で得られた任意のラマンスペクトルを、HotellingのT2及びQ−残存統計に関連する主成分分析(PCA)法を用いてオンライン臨床ソフトウェアによって自動的に廃棄した。PCA方法は、先の国際特許出願PCT/SG2014/000063の主題であり、以下のように機能する:
・新規外れ値検出スキームを、オンラインフレームワークの高レベルのモデル固有フィードバックツールとして機能するようにHotellingのT2及びQ−残存統計と結合された主成分(PCA)に基づいて導入する。HotellingのT2及びQ−残差は、モデルフィット内外の情報を提供する2つの独立したパラメータである。
・取得されたスペクトル品質(すなわち、プローブ−組織接触モード、プローブ処理変動、白色光干渉、青色光干渉、交絡因子など)を制御するための指標としてHotellingのT2及びQ−残差パラメータを使用して、聴覚フィードバックをオンラインラマン診断システムに統合し、臨床医のためにリアルタイム分光スクリーニング及びプローブ取扱のアドバイスを容易にする。
・スペクトルがさらなる分析のために確認された場合には、これらを生体内癌診断の確率モデルに送る。このソフトウェアは、多数の患者のスペクトルデータベースに基づいて、部分最小二乗弁別解析(PLS−DA)、PCA線形判別分析(LDA)、アリコロニー最適化(ACO)−LDA、分類及び回帰ツリー(CART)、サポートベクターマシン(SVM)、アダプティブブースティング(AdaBoost)などを含めた、予めレンダリングされた多変量統計モデル間で即座に切り替えることができる。
In a trial of an embodiment of the
Introduce a new outlier detection scheme based on principal components (PCA) combined with Hotelling's T 2 and Q-residual statistics to serve as a high-level model-specific feedback tool for the online framework. Hotelling's T 2 and Q-residues are two independent parameters that provide information inside and outside the model fit.
Uses Hotling's T 2 and Q-residual parameters as indicators to control acquired spectral quality (ie, probe-tissue contact mode, probe processing variation, white light interference, blue light interference, confounding factors, etc.) It integrates auditory feedback into an online Raman diagnostic system, facilitating real-time spectroscopic screening and probe handling advice for clinicians.
If the spectra are confirmed for further analysis, send them to the in vivo cancer diagnosis probabilistic model. This software is based on multiple patient spectral databases, partial least squares discrimination analysis (PLS-DA), PCA linear discriminant analysis (LDA), ant colony optimization (ACO) -LDA, classification and regression tree (CART) Instantly switch between pre-rendered multivariate statistical models, including support vector machines (SVM), adaptive boosting (AdaBoost), etc.
ラマンスキャンを完了し結果を保存した後に、各組織標本を取り出し、ホルマリンで固定し、切片にし、ヘマトキシリン及びエオシン(H&E)で染色し、組織病理学的検査のために送った。結腸直腸組織を以下の3つの臨床的に重要なカテゴリーに分類した:
(i)良性(正常及び過形成性ポリープ)
(ii)低悪性度及び高悪性度の腺腫(管状、尿細管性、絨毛状)
(iii)腺癌。
After completing the Raman scan and storing the results, each tissue specimen was removed, fixed in formalin, sectioned, stained with hematoxylin and eosin (H & E), and sent for histopathological examination. Colorectal tissue was classified into three clinically important categories:
(I) benign (normal and hyperplastic polyps)
(Ii) Low-grade and high-grade adenomas (tubular, tubular, villous)
(Iii) Adenocarcinoma.
本発明の一実施形態に係る同時FP及びHW光ファイバー共焦点ラマン技術を組織学的評価と比較して、生体内において様々な新生物と腫瘍性でない結腸直腸病変とを区別することができるかどうか決定した。 Whether simultaneous FP and HW fiber optic confocal Raman technology according to one embodiment of the present invention can be compared with histological evaluation to distinguish between various neoplasms and non-neoplastic colorectal lesions in vivo Were determined.
比較には、同時FP及びHW光ファイバー共焦点ラマン分光法を現在使用されている技術の代わりに使用するのに十分に正確であるかどうかを検証するための結果の統計解析の使用が含まれていた。病理組織学的特徴付けの一致を評価するためにコーエンのκ統計値を計算した。フィッシャーの事後最小有意差(LSD)試験による分散分析(ANOVA)を使用して群間の平均の差異を試験した。多変量統計分析を使用して臨床診断のための有意なラマンスペクトル特徴を抽出した。確率的部分最小二乗法(PLS)判別分析(DA)を組織診断に適用した。「一患者抜き」(leave−one patient−out)交差検証を使用してPLS−DAモデルの複雑さを評価及び最適化し、オーバーフィッティングのリスクを軽減した。レシーバ動作特性(ROC)曲線を作成し、そして曲線下面積(AUC)を計算して、FP及びHW光ファイバー共焦点ラマン分光法が生体内で非新生物ポリープから新生物を区別することができることを評価した。 The comparison includes the use of statistical analysis of the results to verify whether simultaneous FP and HW fiber optic confocal Raman spectroscopy is accurate enough to replace the currently used technique. It was. Cohen's kappa statistic was calculated to assess the consistency of histopathological characterization. The mean difference between groups was tested using analysis of variance (ANOVA) with Fisher's post hoc least significant difference (LSD) test. Multivariate statistical analysis was used to extract significant Raman spectral features for clinical diagnosis. Stochastic partial least squares (PLS) discriminant analysis (DA) was applied to tissue diagnosis. “Leave-one patient-out” cross-validation was used to assess and optimize the complexity of the PLS-DA model to reduce the risk of overfitting. Create a receiver operating characteristic (ROC) curve and calculate the area under the curve (AUC) that FP and HW fiber optic confocal Raman spectroscopy can distinguish neoplasms from non-neoplastic polyps in vivo. evaluated.
特定の群の被験者又は患者に対して本発明に係る実施形態を使用した結果を示すために例示として与える実験では、52/(23〜83)の平均/範囲年齢の50人の患者(男性27人及び女性23人)を光ファイバー共焦点ラマン検査のために登録した。13人の患者に低悪性度の異形成を有する腺腫(11個の管状腺腫及び2個の尿細管腺腫)が認められた。3人の患者は、進行期の結腸直腸腺癌と関連していた。0.89のコーエンのカッパは、3つの組織グループの病理所見の間で高レベルの一致を示した。126個の病変又は異常増殖から合計1731の生体内結腸直腸ラマンスペクトルが首尾よく得られた。これらの病変のうち、1397は良性であり、235は腺腫であり、99は腺癌であった。これは組織病理検査によって確認された。上行性、横行性、下行性、S状結腸、直腸などの病理学的亜型及び解剖学的位置を含めた患者及び病変の詳細な分布を表1に要約する。 In an experiment given by way of example to show the results of using an embodiment according to the invention for a particular group of subjects or patients, 50 patients (male 27) with an average / range age of 52 / (23-83) 23 women and women) were registered for fiber optic confocal Raman examination. Thirteen patients had low-grade dysplasia adenomas (11 tubular adenomas and 2 tubular adenomas). Three patients were associated with advanced colorectal adenocarcinoma. Cohen's kappa of 0.89 showed a high level of agreement between the pathological findings of the three tissue groups. A total of 1731 in vivo colorectal Raman spectra were successfully obtained from 126 lesions or abnormal growths. Of these lesions, 1397 were benign, 235 were adenomas, and 99 were adenocarcinomas. This was confirmed by histopathology. The detailed distribution of patients and lesions including pathological subtypes and anatomical locations such as ascending, transverse, descending, sigmoid colon, rectum are summarized in Table 1.
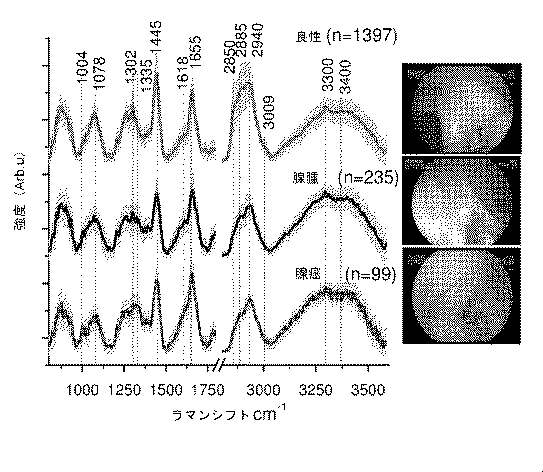
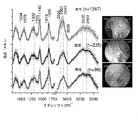
図6は、良性、腺腫及び腺癌の異常増殖について測定された平均生体内共焦点ラマンスペクトル±1標準偏差(SD)(陰影を付した明るい灰色)を示す。暫定的な割り当てを有する顕著な組織ラマンピークがFP範囲内において次の周囲で観察できる:
・v(C−C)タンパク質に関連する853cm-1、
・フェニルアラニンのvs(C−C)環揺らぎに関連する1004cm-1、
・脂質のv(C−C)に関連する1078cm-1、
・タンパク質のアミドIIIv(C−N)及びδ(N−H)に関連する1265cm-1、
・脂質のCH2ねじれ及び揺れに関連する1302cm-1、
・タンパク質及び脂質のδ(CH2)変形に関連する1445cm-1、
・ポルフィリンのv(C=C)に関連する1618cm-1、
・タンパク質のアミドIv(C=O)に関連する1655cm-1、
・脂質のv(C=O)に関連する1745cm-1。
HW領域には、次のような強いラマンピークも見られる:
・それぞれ脂質の対称及び非対称CH2伸縮に関連する2850及び2885cm-1、
・タンパク質のCH3伸縮に関連する2940cm-1、
・タンパク質の非対称=CH伸縮に関連する3009cm-1、
・アミドA(タンパク質のNH伸縮)に関連する〜約3300cm-1、並びに
・組織の細胞外及び細胞外空間におけるOH−結合の局所構造及び相互作用に直接関係するOH伸縮振動に関連するOHの広いラマンバンド〜3200及び〜3400cm-1。
FIG. 6 shows the mean in vivo confocal Raman spectrum ± 1 standard deviation (SD) (light gray shaded) measured for benign, adenoma and adenocarcinoma abnormal growth. A prominent tissue Raman peak with a tentative assignment can be observed within the FP range around:
853 cm −1 associated with v (C—C) protein,
- phenylalanine v s (C-C) 1004cm -1 associated with the ring fluctuation,
1078 cm -1 related to lipid v (C-C),
1265 cm -1 related to protein amides IIIv (CN) and δ (NH),
-1302 cm -1 related to CH 2 twisting and shaking of lipids,
1445 cm -1 associated with δ (CH 2 ) deformation of proteins and lipids,
1618 cm -1 related to v (C = C) of porphyrin,
1655 cm −1 associated with the amide Iv (C═O) of the protein,
1745 cm −1 related to lipid v (C═O).
The following strong Raman peaks are also seen in the HW region:
2850 and 2885 cm -1 associated with lipid symmetric and asymmetric CH 2 stretching, respectively,
2940 cm -1 associated with CH 3 stretching of the protein,
Protein asymmetry = 3009 cm -1 related to CH stretching
• about 3300 cm −1 associated with amide A (protein NH stretching), and • OH associated with OH stretching vibrations directly related to the local structure and interaction of OH-bonds in the extracellular and extracellular space of tissues. Broad Raman bands ~ 3200 and ~ 3400 cm- 1 .
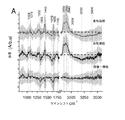
図7Aは、異なる結腸直腸病変間でのピーク強度、シフト及びバンド広がりなどの特徴的なスペクトル特徴を解析する良性腺腫、良性腺癌及び腺腫−腺癌±1SD(陰影を付けた明るい灰色)の異なるスペクトルを示す。 FIG. 7A shows benign adenoma, benign adenocarcinoma and adenoma-adenocarcinoma ± 1SD (light gray with shading) analyzing characteristic spectral features such as peak intensity, shift and band broadening between different colorectal lesions. Different spectra are shown.
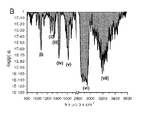
図7Bは、全スペクトル範囲内のラマン強度のそれぞれについて計算されたp値(ANOVA)の対数プロット(779の強度のセットを有する800〜1800cm-1及び2800〜3600cm-1の範囲の各ラマンスペクトル)を示す。 7B is the Raman spectrum in the range of 800~1800Cm -1 and 2800~3600Cm -1 having a set of intensity of logarithmic plot (779 calculated p value for each of the Raman intensity within the entire spectral range (ANOVA) ).
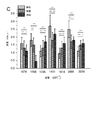
図7Cは、約(i)1078cm-1(ii)1265cm-1(iii)1335cm-1(iv)1431cm-1(v)1618cm-1(vi)2885cm-1及び(vii)3200cm-1でのFP及びHW範囲の両方からの最も診断的に有意なラマンピーク強度(平均±1SD)のヒストグラムを示す。 FIG. 7C shows about (i) 1078 cm −1 (ii) 1265 cm −1 (iii) 1335 cm −1 (iv) 1431 cm −1 (v) 1618 cm −1 (vi) 2885 cm −1 and (vii) 3200 cm −1 . Shown are histograms of the most diagnostically significant Raman peak intensities (mean ± 1SD) from both the FP and HW ranges.
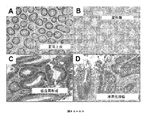
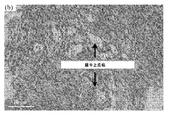
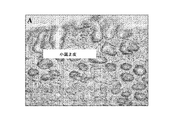
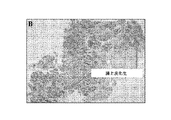
生体内ラマンスペクトルは、異なる病理分類の代表的な組織病理学スライドと相関していた。図8Aは、軽度リンパ形質細胞浸潤を伴う正常腸型粘膜における杯細胞の広範な存在を示す。図8Bは、ゴブレット型過形成ポリープの星形腺を有するポリープ様形状を示す。図8Cは、過密核を有する密集細胞を示す低グレード異形成を伴う管状腺腫を示す。図8Dは、顕著な細胞異常及び構造異常を伴う侵襲性腺癌を示す。図8A〜Dの組織病理学的特徴は、異なる病変タイプの細胞及び形態学的特徴を明らかにするのに対し、FP及びHW光ファイバー共焦点ラマン分光法は、図7A〜Cに示される結腸直腸発癌に関連する上皮において生じる生体分子変化を明らかにする。 In vivo Raman spectra were correlated with representative histopathology slides of different pathological classifications. FIG. 8A shows the extensive presence of goblet cells in normal intestinal mucosa with mild lymphoid plasma cell infiltration. FIG. 8B shows a polyp-like shape with a star-shaped gland of a goblet-type hyperplastic polyp. FIG. 8C shows a tubular adenoma with low grade dysplasia showing a confluent cell with a confluent nucleus. FIG. 8D shows invasive adenocarcinoma with significant cellular and structural abnormalities. The histopathologic features of FIGS. 8A-D reveal cell and morphological features of different lesion types, whereas FP and HW fiber optic confocal Raman spectroscopy is shown in FIGS. 7A-C. To clarify biomolecular changes that occur in the epithelium associated with carcinogenesis.
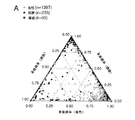
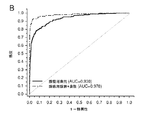
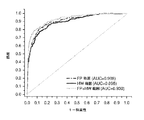
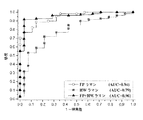
FP及びHWスペクトル範囲の両方からの相補的な生体分子情報を使用して、生体内診断のための光ファイバーラマン分光法が適用される。図9Aは、本発明の一実施形態に係るFP及びHW光ファイバー共焦点ラマン分光法を使用して、それぞれ(i)良性(n=1397)、(ii)腺腫(n=235)及び(iii)腺癌(n=99)に属する50人の結腸直腸患者からの三尖根確率的PLS−DAを用いて生成された事後確率を示す。感度と特異性との関係を図9Bに示すようなROC曲線の展開によって決定した。曲線下面積(AUC)は、それぞれ、腺腫を良性ポリープから区別し、腺癌を腺腫及び良性ポリープから区別するために0.930及び0.978である。ROC分析は、88.5%(208/235)の感度及び80.0%(1118/1397)の特異性を有する良性ポリープ状病変及び扁平障害から腺腫を区別できることを示す。腺癌は、スペクトルベースで92.9%(92/99)の感度及び96.51%(1575/1632)の特異性で検出された。図10に示すように、FP及びHWレジメンからの生体分子情報が診断のために補完的であるかどうかを調査するために、追加のROC分析を行った。AUCは、FP範囲(すなわち、800〜1800cm-1)に基づいて0.908であり、HW範囲(すなわち、2800〜3600cm-1)に基づいて0.895であった。一方、FP及びHWの両方の範囲からの補完情報を使用することによって、堅牢性が有意に改善され、0.930のAUCが得られた。これらの生体内での進歩的な結果に照らして、独自のFP及びHW光ファイバー共焦点ラマン分光法は、生体内での結腸直腸新生物のリアルタイムの客観的診断を可能にする非常に強力な光学モダリティを示す。 Optical fiber Raman spectroscopy for in vivo diagnostics is applied using complementary biomolecular information from both the FP and HW spectral ranges. FIG. 9A shows (i) benign (n = 1397), (ii) adenoma (n = 235) and (iii) using FP and HW fiber optic confocal Raman spectroscopy according to one embodiment of the present invention. Figure 3 shows the posterior probabilities generated using tricusp probabilistic PLS-DA from 50 colorectal patients belonging to adenocarcinoma (n = 99). The relationship between sensitivity and specificity was determined by developing an ROC curve as shown in FIG. 9B. The area under the curve (AUC) is 0.930 and 0.978, respectively, to distinguish adenoma from benign polyps and to distinguish adenocarcinoma from adenomas and benign polyps. ROC analysis shows that adenomas can be distinguished from benign polypoid lesions and flat disorders with a sensitivity of 88.5% (208/235) and a specificity of 80.0% (1118/1397). Adenocarcinoma was detected on a spectral basis with a sensitivity of 92.9% (92/99) and a specificity of 96.51% (1575/1632). As shown in FIG. 10, additional ROC analysis was performed to investigate whether biomolecular information from FP and HW regimens was complementary for diagnosis. The AUC was 0.908 based on the FP range (ie 800-1800 cm −1 ) and 0.895 based on the HW range (ie 2800-3600 cm −1 ). On the other hand, by using complementary information from both FP and HW ranges, the robustness was significantly improved and an AUC of 0.930 was obtained. In light of these in vivo progressive results, unique FP and HW fiber optic confocal Raman spectroscopy is a very powerful optical technology that allows real-time objective diagnosis of colorectal neoplasms in vivo. Indicates the modality.
大きな身体は、組織病理学的評価のコストを大幅に増加させる小さな結腸直腸過形成性ポリープ又は扁平ポリープ状病変を隠すことが知られている。結腸直腸検査のための最新の内視鏡様式を開発し採用するための最も重要な動機付けは、良性過形成性ポリープを腺腫から区別する能力である。本発明に係る実施形態は、FP及びHWスペクトル範囲をカバーする高品質の生体内共焦点ラマンスペクトルが結腸直腸ポリープから(例えば、同時に)測定できかつリアルタイムで分析でき、これを使用して図6に示すように新生物を同定する改善された方法を提供することができることを初めて実証する。本発明の実施形態に係る光ファイバー共焦点ラマン分光法は、図7A〜図7Cに示される腫瘍化に伴って上皮に生じる複数の生化学的及び生体分子変化を明らかにする。例えば、腫瘍性ポリープは、v(C−C)に関する1078cm-1;δ(CH2)に関する1431cm-1;脂質含量の相対的減少を示す対称及び非対称CH2伸縮に関するそれぞれ2850及び2885cm-1(p<0.001)のラマンピーク強度の有意な減少と関連していた。また、これらの結果は、腫瘍性上皮における細胞増殖の増加を示す、フェニルアラニンのvs(C−C)揺らぎに関連する1004cm-1での感受性バイオマーカー及びアミドのIv(C=O)に関連する1655cm-1でのバンドの広がりによって示されるような有意な上方調節タンパク質も示す。また、1618cm-1での腫瘍性ポリープにおける顕著なラマンピーク強度(p<0.001)も、抗原性の発症及び生じる新脈管形成に関連するヘモグロビン含量と強く関連している。
Large bodies are known to conceal small colorectal hyperplastic or flat polypoid lesions that significantly increase the cost of histopathological evaluation. The most important motivation for developing and adopting the latest endoscopic style for colorectal examination is the ability to distinguish benign hyperplastic polyps from adenomas. Embodiments in accordance with the present invention allow high quality in vivo confocal Raman spectra covering the FP and HW spectral ranges to be measured (eg, simultaneously) from colorectal polyps and analyzed in real time, using this FIG. We demonstrate for the first time that an improved method of identifying neoplasms can be provided as shown in. Optical fiber confocal Raman spectroscopy according to embodiments of the present invention reveals multiple biochemical and biomolecular changes that occur in the epithelium with neoplasia as shown in FIGS. 7A-7C. For example, neoplastic polyps, v (C-C) about 1078cm -1; δ (CH 2) about 1431cm -1; respectively about symmetric and asymmetric CH 2 stretching shows a relative decrease in
上記のピーク強度は分子内の特定の結合の振動に関連する。各タイプの結合は異なるピーク強度を有し、特定の結合に関連し得るピーク強度の同定は生体分子情報を明らかにすることができる。病変又は異常増殖が特定の1以上の結合を含み、特異的な関連ピーク強度を生じさせるという事実を用いて、異なるタイプの異常増殖を区別することができる。例えば、良性である異常増殖が特異的なピーク強度を示す場合には、そのピーク強度の後の検出は、後の状況において病変又は異常成長も良性である可能性が高いという決定をもたらす場合がある。 The peak intensity is related to the vibration of specific bonds in the molecule. Each type of bond has a different peak intensity, and identification of peak intensities that can be associated with a particular bond can reveal biomolecular information. The fact that a lesion or overgrowth contains one or more specific bonds and gives rise to specific associated peak intensities can be used to distinguish different types of overgrowth. For example, if an abnormal growth that is benign exhibits a specific peak intensity, subsequent detection of that peak intensity may result in a determination that the lesion or abnormal growth is also likely to be benign in a later situation. is there.
本発明の実施形態によれば、ピーク強度とバイオマーカーとの関連性を利用して、存在する異常増殖のタイプを同定することができる。これは、生体内及び生体外の両方で行うことができる。 According to an embodiment of the present invention, the type of abnormal growth present can be identified using the relationship between peak intensity and biomarker. This can be done both in vivo and in vitro.
いくつかの結果において、含水量は腺腫において著しく異なることが分かった。3200cm-1での広範な対称OH伸縮振動の強度の増加(p<0.001)は、腫瘍性上皮が結合水の増加含有量を保持していることを示しており、これは、水透過性を変化させ、それによって腫瘍細胞の水和を誘導するアクアポリンの発現によって部分的に説明することができる。結合水の増加は、疎水性脂質の同時減少と相互に関連している可能性がある。この所見の重要性は、脂質及び結合水に関連するピーク強度比(すなわち、I2885/I3200)を計算することによって分析した。このピーク比のみにより、81.3%(191/235)の感度及び80.4%(1132/1397)の特異度で良性ポリープと腺腫とを区別することができる。したがって、ポリープにおける脂質含有量及び水灌流は、その場での結腸直腸新生物のための非常に有用なバイオマーカーである。したがって、上皮ラマンスペクトルシグネチャと細胞及び組織生化学との直接的な相関は、in−situにおいて生体分子レベルでの結腸直腸発癌の理解を深めることができる。ピーク又はマーカーの使用は、存在する異常な増殖型のタイプを診断するために採用できる。 In some results, the water content was found to be significantly different in adenomas. A broad increase in the intensity of symmetrical OH stretching vibrations at 3200 cm −1 (p <0.001) indicates that the neoplastic epithelium retains an increased content of bound water, which is It can be explained in part by the expression of aquaporins that alter sex and thereby induce hydration of tumor cells. The increase in bound water may be correlated with the simultaneous decrease in hydrophobic lipids. The importance of this finding was analyzed by calculating the peak intensity ratio associated with lipid and bound water (ie, I 2885 / I 3200 ). Only this peak ratio can distinguish benign polyps from adenomas with a sensitivity of 81.3% (191/235) and a specificity of 80.4% (1132/1397). Thus, lipid content and water perfusion in polyps are very useful biomarkers for in situ colorectal neoplasia. Thus, a direct correlation between epithelial Raman spectral signatures and cellular and tissue biochemistry can deepen the understanding of colorectal carcinogenesis at the biomolecular level in situ. The use of peaks or markers can be employed to diagnose the abnormal proliferative type present.
タンパク質、脂質、DNA及びタンパク質結合と非結合水のコンホメーションを含めた幅広い補完的な光学バイオマーカーを利用することにより、図9A〜Bに示すように、腺腫の正確な診断を生体内で実現できることが初めて示された。腺腫は、スペクトルベースで88.5%(208/235)の感度及び80.0%(1118/1397)の特異性を有する良性のポリープ状病変及び扁平病変から区別できた。光ファイバー共焦点型ラマンプローブは浅い上皮層を選択的に調べるが、侵襲性癌細胞が顕著な生体分子異常と関連していることを示す腺腫から腺癌を効率的に識別することができた。 By utilizing a wide range of complementary optical biomarkers, including protein, lipid, DNA and protein-bound and unbound water conformations, accurate diagnosis of adenomas in vivo as shown in FIGS. 9A-B It was shown for the first time that it could be realized. Adenomas could be distinguished from benign polyp lesions and flat lesions with a sensitivity of 88.5% (208/235) and specificity of 80.0% (1118/1397) on a spectral basis. The fiber optic confocal Raman probe selectively examined the shallow epithelial layer, but was able to efficiently discriminate adenocarcinoma from adenomas showing that invasive cancer cells are associated with significant biomolecular abnormalities.
結腸直腸腫瘍の生体内検出及び診断のためのFP及びHW光ファイバー共焦点ラマン結腸鏡検査技術の有効性はその結果から明らかである。また、FP及びHWスペクトル範囲の両方を利用することにより、FP又はHW範囲単独のいずれよりも優れたAUCが得られることも実証されている。これらの実質的な結果は、生体内での結腸直腸診断を向上させるためのFP及びHW範囲からの補完生体分子情報の追加を確認してFP及びHWラマン分光法が誤って分類される割合を大幅に減少させることができることを実証するものである。例えば、HWスペクトル範囲は、FP範囲に含まれないCH2及びCH3伸縮部分のみならず水の局所コンホメーションに関する情報を含む。また、FP範囲とHW範囲との組み合わせを生体外での診断目的のためにも使用することができる。 The effectiveness of FP and HW fiber optic confocal Raman colonoscopy techniques for in vivo detection and diagnosis of colorectal tumors is evident from the results. It has also been demonstrated that by using both the FP and HW spectral ranges, an AUC superior to either the FP or HW ranges alone can be obtained. These substantive results confirm the addition of complementary biomolecular information from the FP and HW ranges to improve colorectal diagnosis in vivo and show the rate at which FP and HW Raman spectroscopy are misclassified. This demonstrates that it can be significantly reduced. For example, the HW spectral range includes information about the local conformation of water as well as the CH 2 and CH 3 stretches not included in the FP range. Also, the combination of the FP range and the HW range can be used for in vitro diagnostic purposes.
なお、FPラマン分光器技術とHWラマン分光器技術との組み合わせは、典型的には、FP及びHWスペクトル測定を同時に行うなどの好ましい操作方法である。しかし、生体内でのFP又はHWの使用は、異なるタイプの異常増殖を同定することができる結果をもたらす。その結果、本発明に係る実施形態は、FP単独、HW単独又はFPとHWの組み合わせ(例えば、同時)を使用することができる。 Note that the combination of the FP Raman spectroscopic technique and the HW Raman spectroscopic technique is typically a preferable operation method such as performing FP and HW spectrum measurements simultaneously. However, the use of FP or HW in vivo results in the ability to identify different types of overgrowth. As a result, embodiments according to the present invention can use FP alone, HW alone or a combination of FP and HW (eg, simultaneously).
また、離散スペクトルサブインターバル(これらを所定の値及び/又は基準マーカーともということもできる)を広帯域のFP及びHWスペクトルで使用することにより、改善された診断技術又は方法が得られることにも留意すべきである。 Note also that the use of discrete spectral subintervals (which can also be referred to as predetermined values and / or fiducial markers) in the wideband FP and HW spectra provides improved diagnostic techniques or methods. Should.
単一の金被覆広帯域反射格子の使用(例えば、FP及びHWスペクトルを同時に得るため)は、標的組織の特徴付け及び診断の精度向上のための、例えば、内視鏡手術中にリアルタイムで高精度により生体内で異常の可能性のある増殖又は異常増殖を特徴付ける/診断するための装置における重要な開発である。単一の金被覆広帯域反射格子は、従来技術の場合のように生体内測定中に回折格子を切り替える必要がないことを意味する。これには明らかに多くの利点がある。したがって、本発明の一実施形態に係るシステム又はデバイスは、いかなる切り替えプロセスも必要とすることなしに必要な測定を全て行うことができる。この装置は、複数の格子ではなく1つのみの格子を有するので、よりコンパクトで費用効果が高い。単一回折格子設計は二重格子設計と比較してスペクトル分解能が少し低下するが、このコンパクトシステムのスペクトル分解能は、通常、約10cm-1の範囲内である組織ラマンスペクトル帯域幅と一致するため、このコンパクトなシステムは、診断目的又は結果に影響を及ぼさない又は有意な影響を及ぼさないと考えられる。 The use of a single gold-coated broadband reflector grating (eg, to obtain FP and HW spectra simultaneously) is highly accurate in real time during endoscopic surgery, for example, for improved target tissue characterization and diagnostic accuracy. Is an important development in a device for characterizing / diagnosing a potentially abnormal or abnormal growth in vivo. A single gold-coated broadband reflective grating means that it is not necessary to switch the diffraction grating during in vivo measurements as in the prior art. This clearly has many advantages. Thus, a system or device according to one embodiment of the present invention can make all necessary measurements without requiring any switching process. This device is more compact and cost effective because it has only one grating rather than multiple gratings. Although the single grating design has a slight reduction in spectral resolution compared to the double grating design, the spectral resolution of this compact system is typically consistent with the tissue Raman spectral bandwidth that is in the range of about 10 cm −1. This compact system is believed to have no or no significant effect on diagnostic purposes or results.
光ファイバー共焦点ラマン分光法は、操作が簡単で、追加の内視鏡訓練や造影剤の投与を必要としない、客観的で途切れのないリアルタイムのコンピュータ化診断を提供する。生体内での腸上皮の機能的及び生体分子/生化学的評価を可能にすることにより、FP及びHW光ファイバー共焦点ラマン分光法の導入は、大腸内視鏡検査などの胃腸内視鏡検査に大きな影響を与えることになるであろう。この新規生体分子内視鏡アプローチは、臨床結腸直腸検査中に客観的かつ迅速な意思決定を可能にする。結腸直腸検査における光ファイバー共焦点ラマン分光法には、以下のような2つの重要な役割がある:
(i)直腸ポリープ切除術又はEMRのための小さな高リスク腺腫の同定を含む予防的介入アプローチ。本質的にリスクが明らかに低い過形成性ポリープ又は扁平な疑わしい病変をその場に残し、それにより医療費を効率的に削減することができる可能性がある。
(ii)光ファイバー共焦点ラマン分光法を使用して、結腸直腸腺癌の存在を高精度で効率的に確認又は拒絶することもできる。
Fiber optic confocal Raman spectroscopy provides objective, uninterrupted real-time computerized diagnostics that are simple to operate and do not require additional endoscopic training or administration of contrast agents. By enabling functional and biomolecular / biochemical evaluation of intestinal epithelium in vivo, the introduction of FP and HW fiber optic confocal Raman spectroscopy is useful for gastrointestinal endoscopy such as colonoscopy It will have a big impact. This new biomolecular endoscopic approach allows objective and rapid decision making during clinical colorectal examination. Fiber optic confocal Raman spectroscopy in colorectal examination has two important roles:
(I) Prophylactic intervention approach including identification of small high-risk adenomas for rectal polypectomy or EMR. It may be possible to leave hyperplastic polyps or flat suspicious lesions in place with an inherently low risk, thereby effectively reducing medical costs.
(Ii) Optical fiber confocal Raman spectroscopy can also be used to efficiently confirm or reject the presence of colorectal adenocarcinoma with high accuracy.
本発明に係る実施形態は、CRCの内視鏡及び腹腔鏡手術に使用する可能性を開き、それにより消化器専門医に切除代のリアルタイム評価及び定義のための客観的ツールならびに治療後有効性や分子レベルでの再発のフォローアップ評価を提供する。これは、完全な腫瘍切除及びその後のマージンアセスメントを補助して、再発の危険性を低減することができる。したがって、本発明の実施形態に係るFP及びHW光ファイバー共焦点ラマン分光法は、胃腸内視鏡の視野並びに他の身体部位において、リアルタイム生体内客観的組織評価を可能にすることによってスクリーニング設定及び治療結腸直腸適用の両方で使用することができる。 Embodiments according to the present invention open up the potential for use in CRC endoscopy and laparoscopic surgery, thereby enabling gastroenterologists to provide objective tools for real-time assessment and definition of resection margins and post-treatment efficacy Provide follow-up assessment of recurrence at the molecular level. This can assist in complete tumor resection and subsequent margin assessment to reduce the risk of recurrence. Thus, FP and HW fiber optic confocal Raman spectroscopy according to embodiments of the present invention enables screening setup and treatment by enabling real-time in vivo objective tissue assessment in the field of view of the gastrointestinal endoscope and other body parts. It can be used for both colorectal applications.
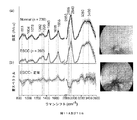
別の臨床例は、生体内で食道組織からフィンガープリント(FP)(すなわち800〜1800cm-1)及び高波数(HW)(すなわち、2800〜3600cm-1)ラマンスペクトルを同時に取得することによって内視鏡検査中に食道扁平上皮癌(ESCC)のリアルタイム生体内診断のために本発明に係る実施形態を使用した。この一連の実験では、日常的な内視鏡検査を受けている48人の食道患者から、合計1172個の高品質生体内FP/HW組織ラマンスペクトル(正常(n=860);ESCC(n=312))を得た。全生体内ラマンデータセットを2つの部分に分類した:すなわち、34人の食道患者からのトレーニング用の全データセットの80%(938の生体内FP/HWラマンスペクトル[正常(n=736);ESCC(n=202));同時に予測試験について合計データセットの残りの20%(14人の食道患者からの234の生体内FP/HWラマンスペクトル[正常(n=124);ESCC(n=110)])。 Another clinical example is endoscopically by simultaneously obtaining a fingerprint (FP) (ie 800-1800 cm −1 ) and high wavenumber (HW) (ie 2800-3600 cm −1 ) Raman spectrum from esophageal tissue in vivo. Embodiments according to the present invention were used for real-time in vivo diagnosis of esophageal squamous cell carcinoma (ESCC) during microscopic examination. In this series of experiments, a total of 1172 high quality in vivo FP / HW tissue Raman spectra from normal 48 esophageal patients undergoing endoscopy (normal (n = 860); ESCC (n = 312)). The whole in vivo Raman data set was classified into two parts: 80% of the total data set for training from 34 esophageal patients (938 in vivo FP / HW Raman spectra [normal (n = 736); ESCC (n = 202)); the remaining 20% of the total data set for predictive studies simultaneously (234 in vivo FP / HW Raman spectra from 14 esophageal patients [normal (n = 124); ESCC (n = 110) )]).
図11Aは、組織診断アルゴリズム開発のためのトレーニングデータセット(全データセットの80%)の平均生体内FP/HW組織ラマンスペクトル±1標準偏差(SD)(陰影領域)を示す。WLR誘導FP/HWラマン手順の対応する画像も示されている。暫定割り当て7〜18の顕著な食道組織ラマンピークがFP領域内で観察できる。すなわち、
・v(C−C)タンパク質に関連する853cm-1、
・フェニルアラニンの環揺らぎに関連する1004cm-1、
・脂質のv(C−C)に関連する1078cm-1、
・タンパク質のアミドIIIv(C−N)及びδ(N−H)に関連する1265cm-1、
・脂質のCH2ねじれ及び揺れに関連する1302cm-1、
・タンパク質及び核酸のCH3CH2ねじれに関連する1335cm-1、
・タンパク質及び脂質のδ(CH2)変形に関連する1445cm-1、
・ポルフィリンのv(C=C)に関連する1618cm-1、
・タンパク質のアミドIv(C=O)に関連する1655cm-1、及び
・リン脂質のv(C=O)に関連する1745cm-1。
HW領域18〜24においても、次のように強いラマンピークが観察される:
・脂質の対称及び非対称CH2伸縮に関連する2580及び2885cm-1、
・タンパク質のCH3伸縮に関連する2940cm-1、
・アミドA(タンパク質のNH伸縮)に関連する約3300cm-1、及び
・食道組織の細胞内及び細胞外空間におけるOH−結合の局所コンホメーション及び相互作用に関連する水の広範なラマンバンド(〜3250及び〜3400cm-1でピークに達するOH伸縮振動)。
FIG. 11A shows the mean in vivo FP / HW tissue Raman spectrum ± 1 standard deviation (SD) (shaded area) of a training data set (80% of the total data set) for developing a tissue diagnosis algorithm. A corresponding image of the WLR guided FP / HW Raman procedure is also shown. Significant esophageal tissue Raman peaks with provisional assignments 7-18 can be observed in the FP region. That is,
853 cm −1 associated with v (C—C) protein,
1004 cm -1 related to ring fluctuation of phenylalanine,
1078 cm -1 related to lipid v (C-C),
1265 cm -1 related to protein amides IIIv (CN) and δ (NH),
-1302 cm -1 related to CH 2 twisting and shaking of lipids,
1335 cm −1 associated with CH 3 CH 2 twist of proteins and nucleic acids,
1445 cm -1 associated with δ (CH 2 ) deformation of proteins and lipids,
1618 cm -1 related to v (C = C) of porphyrin,
Protein associated amide Iv (C = O) of 1655 cm -1, and phospholipid of v (C = O) to the associated 1745 cm -1.
Also in the HW region 18-24 , a strong Raman peak is observed as follows:
2580 and 2885 cm −1 related to lipid symmetric and asymmetric CH 2 stretching,
2940 cm -1 associated with CH 3 stretching of the protein,
• about 3300 cm −1 associated with amide A (protein NH stretching), and • a broad Raman band of water associated with local conformation and interaction of OH-bonds in the intracellular and extracellular space of esophageal tissue ( OH stretching vibrations reaching peaks at ˜3250 and ˜3400 cm −1 ).
図11Bは、ESCCと正常食道組織との差異ラマンスペクトル±1SD(陰影領域)を示し、食道の癌進行に関連するラマン活性成分の変化を反映する。ESCC及び正常組織のラマンスペクトルにおける有意差(p=1.3E−8、独立両側スチューデントt検定)は、食道癌の生体内診断のための同時FP/HWラマン内視鏡の潜在能力を示すものである。 FIG. 11B shows the difference Raman spectrum ± 1SD (shaded area) between ESCC and normal esophageal tissue, reflecting changes in Raman active components associated with esophageal cancer progression. Significant difference in ESCC and normal tissue Raman spectra (p = 1.3E-8, independent two-tailed Student's t-test) indicates the potential of simultaneous FP / HW Raman endoscope for in vivo diagnosis of esophageal cancer It is.
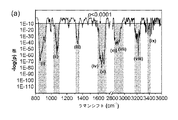
診断的に重要なラマン活性成分を解明するために、図12Aは、全スペクトル範囲(すなわち、800〜1800cm-1及び2800〜3600cm-1)におけるラマン強度のそれぞれについて計算されたp値(独立両側スチューデントt検定)の対数プロットを示す。特に、ESCCと正常食道との間に統計的に有意な差(p<1E−10)を有する次のスペクトル領域が見出された:タンパク質、脂質及び核酸に関連する840〜940cm-1、1025〜1100cm-1、1310〜1355cm-1、1585〜1690cm-1及び2830〜2975cm-1。3160〜3260cm-1及び3370〜3420cm-1の範囲の結合水においても、有意なスペクトル差が観察された。 To elucidate diagnostically important Raman active components, FIG. 12A shows p-values (independent two-sided) calculated for each of the Raman intensities in the entire spectral range (ie, 800-1800 cm −1 and 2800-3600 cm −1 ). (Student t-test) log plot. In particular, the following spectral regions with statistically significant differences (p <1E-10) between ESCC and normal esophagus were found: 840-940 cm −1 , 1025 associated with proteins, lipids and nucleic acids. ~1100cm -1, 1310~1355cm -1, 1585~1690cm -1 and 2830~2975cm -1. Significant spectral differences were also observed in bound water in the range of 3160-3260 cm −1 and 3370-3420 cm −1 .
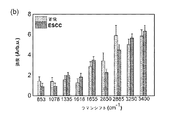
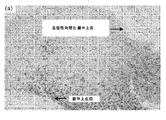
図12Bは、FP及びHWの両方の範囲、すなわち(i)853cm-1、(ii)1078cm-1、(iii)1335cm-1、(iv)1618cm-1、(v)1655cm-1、(vi)2850cm-1、(vii)2885cm-1、(viii)3250cm-1及び(ix)3400cm-1について最も統計的に異なるラマンピーク強度(平均±1SD)のヒストグラムを示す。図13に示すように、組織病理学によりESCCにおける顕著な細胞異常及び構造異常を同定し、異なるラマン活性成分を表す相対的に高い又は低いFP/HW組織ラマンバンドにより、ESCC形質転換を伴う食道組織の特異的生化学/生体分子変化を明らかにする。組織中の脂質、タンパク質、DNA及び水分含量に関連するFP/HWラマンスペクトルの変化は、ESCCを分子レベルで検出する同時FP/HWラマン分光法の能力を再確認する。 FIG. 12B shows the range of both FP and HW, namely (i) 853 cm −1 , (ii) 1078 cm −1 , (iii) 1335 cm −1 , (iv) 1618 cm −1 , (v) 1655 cm −1 , (vi ) Shows histograms of the most statistically different Raman peak intensities (mean ± 1SD) for 2850 cm −1 , (vii) 2885 cm −1 , (viii) 3250 cm −1 and (ix) 3400 cm −1 . As shown in FIG. 13, histopathology identifies prominent cellular and structural abnormalities in ESCC, and the esophagus with ESCC transformation by relatively high or low FP / HW tissue Raman bands representing different Raman active components Reveal specific biochemical / biomolecular changes in tissues. Changes in FP / HW Raman spectra related to lipid, protein, DNA and water content in tissues reaffirm the ability of simultaneous FP / HW Raman spectroscopy to detect ESCC at the molecular level.
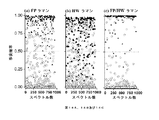
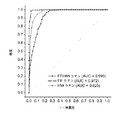
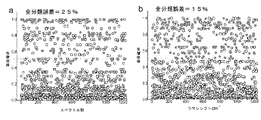
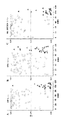
FP及びHWスペクトル範囲で同定された補完生化学/生体分子情報を利用して、生体内ESCC診断を強化するための強力な診断モデルを開発するために、PLS−DA及びLOPCVをトレーニングデータセット(全データセットの80%)について実施した。0.91のコーエンのカッパは、食道組織群についての独立した病理学者間で高レベルの一致を示した。図14は、(a)FP、(b)HW及び(c)統合FP/HWに対する各ラマン予測の交差検証PLS−DA事後確率の散布図を示す。統合FP/HWラマン分光法による診断精度は97.3%(感度97.0%(196/202)及び特異性97.4%(717/736))であり、これはFP(精度90.9%、感度93.6%(189/202)及び特異性90.2%(664/736))又はHW(精度85.5%、感度78.2%(158/202)及び特異性87.5%(644/736))ラマン技術単独を使用した場合よりも優れる。また、レシーバ動作特性(ROC)曲線も図15に示すように生成し、ROC曲線下積分面積はFP、HW及び統合FP/HW技術についてそれぞれ0.972,0.928及び0.995であった。上記の結果は、統合又は同時FP/HWラマン技術が、FP又はHWラマン技術単独と比較して生体内ESCC検出に最良の診断性能を提供することを確認するものである。 To develop powerful diagnostic models to enhance in vivo ESCC diagnostics using complementary biochemical / biomolecular information identified in the FP and HW spectral ranges, PLS-DA and LOPCV are training datasets ( 80% of all data sets). The Cohen Kappa of 0.91 showed a high level of agreement among independent pathologists for the esophageal tissue group. FIG. 14 shows a scatter plot of cross-validated PLS-DA posterior probabilities for each Raman prediction for (a) FP, (b) HW, and (c) integrated FP / HW. The diagnostic accuracy by integrated FP / HW Raman spectroscopy is 97.3% (sensitivity 97.0% (196/202) and specificity 97.4% (717/736)), which is FP (accuracy 90.9) %, Sensitivity 93.6% (189/202) and specificity 90.2% (664/736)) or HW (accuracy 85.5%, sensitivity 78.2% (158/202) and specificity 87.5 % (644/736)) better than using the Raman technique alone. A receiver operating characteristic (ROC) curve was also generated as shown in FIG. 15, and the integrated area under the ROC curve was 0.972, 0.928 and 0.995 for FP, HW and integrated FP / HW technologies, respectively. . The above results confirm that integrated or simultaneous FP / HW Raman technology provides the best diagnostic performance for in vivo ESCC detection compared to FP or HW Raman technology alone.
これら有望な診断結果を考慮して、独立した検査データセット(全データセットの20%)の予測診断のために、開発された同時FP/HWラマン分光法及び診断アルゴリズムを適用した。統合FP/HWラマン分光法により93.2%の予測精度(すなわち感度92.7%(102/110)及び特異度93.6%(116/124))を達成することができ、生体内ESCCについてFP(予測精度91.0%、感度90.9%(100/110)、特異性91.9%(113/124))又はHW(予測精度80.3%、感度76.4%(84/110)、特異性83.9%(104/124))ラマン技術単独を超える統合FP/HWラマン分光法の利点を実証することができる。 In view of these promising diagnostic results, the developed simultaneous FP / HW Raman spectroscopy and diagnostic algorithms were applied for predictive diagnosis of independent test datasets (20% of the total dataset). With integrated FP / HW Raman spectroscopy, a prediction accuracy of 93.2% (ie sensitivity 92.7% (102/110) and specificity 93.6% (116/124)) can be achieved, and in vivo ESCC FP (prediction accuracy 91.0%, sensitivity 90.9% (100/110), specificity 91.9% (113/124)) or HW (prediction accuracy 80.3%, sensitivity 76.4% (84 / 110), specificity 83.9% (104/124)) The advantages of integrated FP / HW Raman spectroscopy over Raman technology alone can be demonstrated.
さらなる実施形態では、例えば図2のシステム200を使用して子宮頸癌又は他のタイプの異常増殖を同定する、他のタイプの癌の同定を考慮した。
In further embodiments, the identification of other types of cancer was considered, for example, using the
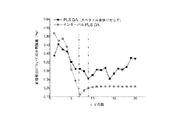
FP及びHWスペクトル領域から相補的なスペクトル間隔を選択するために、変数/特徴選択技術を広帯域ラマン内視鏡技術に取り入れる。変数/特徴選択の利点としては次のものが挙げられる:
1.予測性能を改善する;
2.モデルの複雑さを軽減する;及び
3.変数/特徴の重要性などの基礎的な分光プロセスへの洞察を得る。
In order to select complementary spectral spacing from the FP and HW spectral regions, a variable / feature selection technique is incorporated into the broadband Raman endoscope technique. The advantages of variable / feature selection include:
1. Improve predictive performance;
2. 2. reduce the complexity of the model; and Gain insight into basic spectroscopic processes such as the importance of variables / features.
一実施形態では、インターバルPLS−DAアルゴリズムを使用するが、原則として、他の複数の又は全ての特徴/変数選択技術又は方法を適用して、PCA−LDA、SVM、LRなどの任意のクラスタリングアルゴリズムのために補完的なスペクトル領域を選択することができる。この特徴/変数選択技術は、遺伝子アルゴリズム(GA)、群知能、選択比などであることができる。簡潔に言えば、ここで使用されるインターバルPLS−DAは、ラマンスペクトルにおけるインターバルの最良の組合せについて連続した徹底的なサーチを実行する。したがって、インターバルPLS−DAは、それぞれ変数のサブセット又はウィンドウのみを使用して個々のPLSモデルを作成する。所定のスペクトルデータセットについて200個のインターバルが存在する場合には、200個のPLS−DAモデルを計算する(すなわち、各インターバルについて1つ)。 In one embodiment, an interval PLS-DA algorithm is used, but in principle any other clustering algorithm such as PCA-LDA, SVM, LR, etc., applying other or all feature / variable selection techniques or methods. A complementary spectral region can be selected for. This feature / variable selection technique can be genetic algorithm (GA), swarm intelligence, selection ratio, and the like. Briefly, the interval PLS-DA used here performs a continuous exhaustive search for the best combination of intervals in the Raman spectrum. Thus, the interval PLS-DA creates individual PLS models using only a subset or window of variables, respectively. If there are 200 intervals for a given spectral data set, 200 PLS-DA models are calculated (ie, one for each interval).
モデル毎について一患者抜き交差検証を実行し、最高の診断精度を提供するインターバルを選択する。これは最適な単一インターバルモデルである。1つのみのインターバルが望ましい場合には、アルゴリズムはこの時点で停止する。しかし、複数のインターバルが望ましい場合(情報量を増やして予測性能を向上させるために)に、追加のサイクルを実行することができる。第2サイクルでは、最初に選択されたインターバルを全てのモデルで使用するが、新たなPLSモデルの新たなセットを作成するときには一度に1つずつ他の残りのインターバルのそれぞれと組み合わせる。このようにして、FP及びHW範囲からの補完的診断値の領域を抽出すると共に、貧弱な予測力の領域などの冗長な又は無関係なスペクトル範囲をモデルから除外する。 Perform cross-validation without one patient for each model and select the interval that provides the best diagnostic accuracy. This is an optimal single interval model. If only one interval is desired, the algorithm stops at this point. However, additional cycles can be performed when multiple intervals are desired (to increase the amount of information and improve prediction performance). In the second cycle, the first selected interval is used in all models, but is combined with each of the other remaining intervals one at a time when creating a new set of new PLS models. In this way, regions of complementary diagnostic values from the FP and HW ranges are extracted and redundant or unrelated spectral ranges such as poor predictive regions are excluded from the model.
FP及びHW範囲以外の他のスペクトル範囲(例えば、2000cm-1〜2800cm-1の間のいわゆるラマンサイレント範囲)を所定の用途に使用することができる。 Other spectral ranges other than FP and HW range (e.g., so-called Raman silent range between 2000cm -1 ~2800cm -1) can be used for a given application.
この実施形態の適用を実証するために、一連の子宮頸部患者からの広帯域スペクトルを取得した。異常Papスメアのためコルポスコピー処置を受けた合計44人の非妊娠女性患者(18〜70歳)を募集し検討した。生体内組織ラマンスペクトル測定の前に、5%酢酸溶液を、組織の色白化(子宮頸部における白色変色の程度は、前癌状態の程度に関連する)を評価するために子宮頸部に2分間局所塗布した。 To demonstrate the application of this embodiment, broadband spectra from a series of cervical patients were acquired. A total of 44 non-pregnant female patients (18-70 years old) who received colposcopy treatment for abnormal Pap smear were recruited and examined. Prior to in vivo tissue Raman spectrum measurement, 5% acetic acid solution was applied to the cervix to assess tissue whitening (the degree of white discoloration in the cervix is related to the degree of precancerous condition). Topically applied for minutes.
共焦点広帯域ラマン及びそれに付随する自己蛍光スペクトルは、光ファイバー共焦点プローブと組織と穏やかに接触させて測定した。図16Aは、正常(n=356)及び前癌(n=120)子宮頸部組織の平均生複合ラマン及び自家蛍光スペクトルを示す。正常及び前癌性の子宮頸部組織スペクトルは、次の付近の自己蛍光のトップに弱いラマン振動バンドを示す:
・構造タンパク質及びコラーゲンのグリコーゲン(CCH)変形芳香族及び(C−C)伸縮に関連する〜854cm-1、
・プロリン、バリン及びグリコーゲンのv(C−C)伸縮に関連する〜937cm-1、
・フェニルアラニンの(C−C)環揺らぎに関連する〜1001cm-1、
・リン脂質及び核酸に関連する〜約1095cm-1、
・アミドIIIに関連する〜1253cm-1、
・脂質/タンパク質(コラーゲン)のCH3CH2ねじれ態様に関連する〜約1313cm-1、
・タンパク質及び脂質のCH2屈曲態様に関連する〜約1445cm-1、
・タンパク質のアミドIバンド−(C=O)伸縮態様に関連する〜1654cm-1、
・タンパク質−CH3伸縮に関連する〜2946cm-1、及び
・水−(OH)伸縮に関連する〜約3400cm-1。
Confocal broadband Raman and the accompanying autofluorescence spectra were measured with gentle contact between the fiber optic confocal probe and the tissue. FIG. 16A shows the mean biocomplex Raman and autofluorescence spectra of normal (n = 356) and precancerous (n = 120) cervical tissue. Normal and precancerous cervical tissue spectra show a weak Raman vibration band at the top of the autofluorescence near:
˜854 cm −1 related to glycogen (CCH) deformed aromatics and (CC) stretch of structural proteins and collagen,
~ 937 cm -1 associated with v (CC) stretching of proline, valine and glycogen,
-1001 cm -1 related to (CC) ring fluctuation of phenylalanine,
Related to phospholipids and nucleic acids to about 1095 cm −1 ,
~ 1253 cm -1 associated with amide III,
- lipid / protein CH 3 CH 2 associated with the twist mode about 1313cm -1 in (collagen),
Related to the CH 2 bending aspect of proteins and lipids to about 1445 cm −1 ,
The amide I band of the protein-(C = O) ~ 1654 cm -1 related to the stretch mode,
• 2946 cm −1 associated with protein-CH 3 stretch, and • about 3400 cm −1 associated with water- (OH) stretch.
インターバル選択と統合された広帯域ラマン技術が子宮頸部前癌の診断を改善できることを実証するために、従来のPLS−DAを連続スペクトルに適用し(図16A)、そしてインターバルPLS−DAを適用して上記相補的領域を抽出する。図16Bは、インターバルPLS−DAの後に選択されたスペクトルサブ領域(すなわち、1000〜1020cm-1、1640〜1660cm-1、2890〜2910cm-1及び3290〜3310cm-1)を示す。 To demonstrate that broadband Raman technology integrated with interval selection can improve the diagnosis of cervical precancer, conventional PLS-DA was applied to the continuous spectrum (FIG. 16A), and interval PLS-DA was applied. To extract the complementary region. FIG. 16B shows the spectral sub-regions selected after interval PLS-DA (ie, 1000-1020 cm −1 , 1640-1660 cm −1 , 2890-2910 cm −1 and 3290-3310 cm −1 ).
図17は、PLS−DAモデルとインターバルPLS−DAモデルの両方についてのアルゴリズム複雑度(すなわち、LVの数)の関数としての分類誤差を示す。最小値は、それぞれ9及び5LVで見出すことができる。スペクトル全体ではなくFP領域とHW領域の両方からの補完スペクトル領域を使用することにより、精度が著しく向上する(分類誤差は25%から15%に減少する)ことは明らかである。この例は、不良な情報を含む領域を除去し、そしてFP及びHWスペクトルから補完的なサブインターバルを選択することにより、前癌の生体内検出の精度を〜約10%有意に改善できることを示す。これは、実際に、FP及びHW領域が組織の特徴付けのための補完情報を含むことを証明する。図18A及び図18Bの散布図は、確率的分類結果を示す。結果として、広帯域共焦点ラマン内視鏡技術からの離散的なインターバルによって、臨床医は疑わしい病変に関連するリスクのより正確な確率的基準を得ることができ、それによって物理的生検の指針を大幅に改善することができる。 FIG. 17 shows the classification error as a function of algorithm complexity (ie, the number of LVs) for both the PLS-DA model and the interval PLS-DA model. Minimum values can be found at 9 and 5 LV, respectively. It is clear that using the complementary spectral region from both the FP region and the HW region rather than the entire spectrum significantly improves the accuracy (classification error is reduced from 25% to 15%). This example shows that by removing regions containing bad information and selecting complementary subintervals from the FP and HW spectra, the accuracy of in vivo detection of precancer can be significantly improved by ~ 10%. . This actually proves that the FP and HW regions contain complementary information for tissue characterization. The scatter plots of FIGS. 18A and 18B show the probabilistic classification results. As a result, discrete intervals from broadband confocal Raman endoscopic techniques allow clinicians to obtain a more accurate probabilistic measure of risk associated with suspicious lesions, thereby guiding physical biopsy guidelines. It can be greatly improved.
疾患の家族歴などの事前情報を組み込むことによって、確率的分類(図18A及び18B)に閾値を課すことができることに留意すべきである。例えば、患者が高リスク群に属する場合には、装置は、前癌又は癌に対するより高い感受性を与える閾値を自動的に選択することができる。事前確率を生成する他のタイプのデータは、年齢、民族性、性別、飲酒習慣などの遺伝的、プロテオーム的、疫学的な画像化結果(CT、MRIなど)、症状などとすることができる。閾値を調節するためのオプションは、スペクトル測定を制御する臨床ラマン内視鏡ソフトウェアに組み込まれている。 It should be noted that thresholds can be imposed on probabilistic classification (FIGS. 18A and 18B) by incorporating prior information such as family history of disease. For example, if the patient belongs to a high risk group, the device can automatically select a threshold that gives a higher sensitivity to pre-cancer or cancer. Other types of data that generate prior probabilities can be genetic, proteomic, epidemiological imaging results (CT, MRI, etc.), symptoms, etc., such as age, ethnicity, gender, drinking habits. The option to adjust the threshold is built into the clinical Raman endoscope software that controls the spectral measurements.
広帯域共焦点ラマン内視鏡を使用したさらなる臨床例では、光ファイバー共焦点ラマンスペクトルを、胃悪性腫瘍の早期診断に焦点を当てて一連の胃患者から取得した。図19Aは、組織病理学的特徴付けによって確認された異なる組織型:良性(n=1950スペクトル)及び癌(n=108スペクトル)を示す90人の患者から測定した生体内共焦点FP及びHWラマンスペクトルの平均を示す。タンパク質、DNA及び脂質の顕著な組織ラマンピークが次の付近で観察できる:
・v(C−C)タンパク質に関連する936cm-1、
・フェニルアラニンのvs(C−C)環揺らぎに関連する1004cm-1、
・脂質のv(C−C)に関連する1078cm-1、
・タンパク質のアミドIIIv(C−N)及びδ(N−H)に関連する1265cm-1、
・タンパク質のCH2のねじれ及び揺れに関連する1302cm-1、
・タンパク質及び脂質のδ(CH2)変形に関連する1445cm-1、
・ポルフィリンのv(C=C)に関連する1618cm-1、
・タンパク質のアミドIv(C=O)に関連する1655cm-1、
・脂質のv(C=O)に関連する1745cm-1、
・タンパク質−CH3伸縮に関連する〜2946cm-1、及び
・水−(OH)伸縮に関連する〜3400cm-1。
In a further clinical example using a broadband confocal Raman endoscope, fiber optic confocal Raman spectra were obtained from a series of gastric patients with a focus on early diagnosis of gastric malignancies. FIG. 19A shows in vivo confocal FP and HW Raman measured from 90 patients showing different tissue types confirmed by histopathological characterization: benign (n = 1950 spectrum) and cancer (n = 108 spectrum). The average of the spectrum is shown. Prominent tissue Raman peaks of protein, DNA and lipid can be observed near:
936 cm −1 associated with v (C—C) protein,
1004 cm -1 related to the vs (CC) ring fluctuation of phenylalanine,
1078 cm -1 related to lipid v (C-C),
1265 cm -1 related to protein amides IIIv (CN) and δ (NH),
-1302 cm -1 associated with CH 2 twisting and shaking of the protein,
1445 cm -1 associated with δ (CH 2 ) deformation of proteins and lipids,
1618 cm -1 related to v (C = C) of porphyrin,
1655 cm −1 associated with the amide Iv (C═O) of the protein,
1745 cm −1 related to lipid v (C═O),
Protein -CH 3 related to stretch ~2946cm -1, and - water - (OH) associated with the expansion and contraction ~3400cm -1.
本発明に係る実施形態を実証するために、従来のPLS−DAを連続スペクトル並びにインターバルPLS−DAに適用する。図19Bは、インターバルPLS−DA(すなわち、〜1050〜1120cm-1、〜1323〜1490cm-1及び〜2850〜2870cm-1)の後の選択補完スペクトル領域を示す。 In order to demonstrate an embodiment according to the present invention, conventional PLS-DA is applied to continuous spectrum as well as interval PLS-DA. FIG. 19B shows selected complementary spectral regions after the interval PLS-DA (ie, 1050-1120 cm −1 , ˜1323-1490 cm −1 and ˜2850-2870 cm −1 ).
図20は、PLS−DAとインターバルPLS−DAの両方についてのアルゴリズム複雑度(すなわち、LVの数)の関数としての分類誤差を示す。両方のモデルについて5個のLVを使用して分類エラーの最小値を見出すことができる。図21A及び図21Bの散布図に示すように、スペクトル全体ではなくFP及びHW範囲内の補完的な診断重要なスペクトル領域を選択することにより、モデルはより正確になる(分類誤差は0.25%から0.18%に減少する)。感度は72.2%から75.9%に増加し、特異度は74.7%から87.9%に増加するところ、これは補完情報が胃癌の診断を改善することを示す。 FIG. 20 shows the classification error as a function of algorithm complexity (ie, number of LVs) for both PLS-DA and interval PLS-DA. Five LVs can be used for both models to find the minimum classification error. As shown in the scatter plots of FIGS. 21A and 21B, by selecting complementary diagnostic critical spectral regions within the FP and HW ranges rather than the entire spectrum, the model becomes more accurate (classification error is 0.25). % To 0.18%). The sensitivity increases from 72.2% to 75.9% and the specificity increases from 74.7% to 87.9%, indicating that complementary information improves the diagnosis of gastric cancer.
さらに別の臨床例は、内視鏡検査中に胃腸の化生病変(IM)−悪性病変の生体内検出のためにFP及びHW光ファイバーラマン内視鏡技術を同時に使用した本発明に係る実施形態を利用した。この例では、ラマン分光システム200は、近赤外(NIR)ダイオードレーザ(λex=785nm)(最大出力:300mW、B&W TEK社)、金被覆830gr/mm格子を備える高スループット反射イメージング分光器(Acton LS−785 f/2、プリンストン・インスツルメント社)及び熱電冷却NIR最適化電荷結合素子(CCD)カメラ(PIXIS:400BR−eXcelon、プリンストン・インスツルメント社)を備えていた。システム200は、〜9cm-1の分解能で400〜3600cm-1のスペクトル範囲内の生体内組織ラマンを取得した。1.8mmの外径を有する1.9m長の光ファイバーラマンプローブ108を、レーザ光の送達及び生体内上皮組織ラマン信号収集の両方のために利用した。内視鏡のために設計されたラマン内視鏡プローブ108は、中央の光送達ファイバー(直径200μm、NA=0.22)を取り囲む18×200μmの斜角収集ファイバー(NA=0.22)を備える。1.0mmサファイアボールレンズ(NA=1.78)をプローブのファイバー先端に連結して励起光を胃組織表面にしっかりと集束させ、上皮内層からの有効なラマンスペクトル収集を可能にする。光ファイバーラマン分光システム200の深さ選択能力は、微視的なプロービング容量(<0.02mm2)を用いてより浅い組織照合(<200μm)を確保し、それにより、より深い嵩高組織からの干渉及び信号希釈を低減すると共に、新生物の発症及び進行に関連する上皮を選択的又は優先的に照合する。水銀−アルゴンスペクトル較正ランプ(HG−1及びAR−1、米国フロリダ州ダニーデンのOcean Optics社)の原子発光線を波長較正のために使用した。タングステンキャリブレーションランプ(RS−10、米国カリフォルニア州サンディエゴのEG&G Gamma Scientific社)を使用してシステムの波長依存性について全ての波長較正スペクトルを補正した。FP/HW光ファイバーラマン内視鏡システム200全体は、フットペダル及びフィードバック(例えば、聴覚及び/又は視覚的確率的フィードバック)をリアルタイムで胃腸科医に提供するように構成された直観的ソフトウェアフレームワークを使用して制御可能である。
Yet another clinical example is an embodiment according to the present invention that simultaneously uses FP and HW fiber optic Raman endoscopic techniques for in vivo detection of gastrointestinal metaplasia (IM) -malignant lesions during endoscopy Was used. In this example, the
未処理スペクトルを3次Savitzky−Golayスムージングフィルタ(3ピクセルのウィンドウ幅)で前処理してスペクトルノイズが除去した。FP領域(800〜1800cm-1)では、5次多項式がノイズ平滑化スペクトルにAFバックグラウンドをフィッティングするのに最適であることが分かり、その後この多項式を測定FPスペクトルから差し引いてFP組織ラマンスペクトルそのものを得た。HW範囲(2800〜3600cm-1)では、AF背景を除去するために一次多項式近似を使用した。FP及びHWラマンスペクトルをFP及びHW範囲下積分面積にわたって正規化して、正常胃組織とIM胃組織と間のスペクトル形状及び相対ラマンバンド強度のさらに良い比較を可能にした。生のスペクトルデータを、全てMatlab環境(米国マサチューセッツ州のMathworks社)で開発されたソフトウェアによりオンラインで処理した。主成分分析(PCA)及び線形判別分析(LDA)を実施して、正常な胃組織とIMの胃組織との区別のための強力な診断アルゴリズムを開発した。1組織部位抜き交差検証を利用して、偏りのないように開発された診断モデルを評価した。複数のラマンスペクトル(10〜15)を各組織部位から1秒以内に取得し、大部分の投票戦略を最終的な分類のために適用した。診断結果は、リアルタイムでコンピュータ画面などの表示装置に表示可能であった。また、閾値を連続的に変化させることによりレシーバ作動特性(ROC)曲線も生成して全ての組織の正しい分類と誤った分類を決定した。全てのスペクトル前処理及び多変量統計解析を、Matlabプログラミング環境で記述されたスクリプトを使用してオンラインで実行した。 The raw spectrum was preprocessed with a third order Savitzky-Golay smoothing filter (3 pixel window width) to remove spectral noise. In the FP region (800-1800 cm −1 ), it can be seen that a fifth order polynomial is optimal for fitting the AF background to the noise smoothed spectrum, and this polynomial is then subtracted from the measured FP spectrum to obtain the FP tissue Raman spectrum itself. Got. In the HW range (2800-3600 cm −1 ), a first order polynomial approximation was used to remove the AF background. The FP and HW Raman spectra were normalized over the integrated area under the FP and HW ranges to allow a better comparison of spectral shape and relative Raman band intensity between normal and IM gastric tissues. All raw spectral data were processed online with software developed in the Matlab environment (Mathworks, Massachusetts, USA). Principal component analysis (PCA) and linear discriminant analysis (LDA) were performed to develop a powerful diagnostic algorithm for distinguishing between normal and IM gastric tissue. Using a cross-validation without one tissue site, we evaluated a diagnostic model that was developed so that there was no bias. Multiple Raman spectra (10-15) were acquired within 1 second from each tissue site and most voting strategies were applied for final classification. The diagnosis result could be displayed on a display device such as a computer screen in real time. A receiver operating characteristic (ROC) curve was also generated by continuously changing the threshold to determine the correct and incorrect classification of all tissues. All spectral preprocessing and multivariate statistical analyzes were performed online using scripts written in the Matlab programming environment.
合計1412の生体内ラマンスペクトル(すなわち正常(n=1083スペクトル)及びIM(n=329スペクトル))を、コンセンサス組織病理学的検査によって確認されるように115の部位(すなわち正常(n=88部位)及びIM(n=27部位)から取得することに成功した。 A total of 1412 in-vivo Raman spectra (ie normal (n = 1083 spectrum) and IM (n = 329 spectrum)) were analyzed in 115 sites (ie normal (n = 88 sites) as confirmed by consensus histopathology. ) And IM (n = 27 sites).
図22Aは、測定された(すなわち、正常及びIM)平均生体内ラマンスペクトル±標準偏差(SD)(網掛けの明るい灰色)を示す。暫定的割り当てを有する顕著な組織ラマンピークがFP範囲内で次の様に観察される:
・v(C−C)タンパク質に関連する875cm-1、
・フェニルアラニンのνs(C−C)環揺らぎに関連する1004cm-1、
・脂質のv(C−C)に関連する1078cm-1、
・脂質のCH2のねじれ及び揺れに関連する1302cm-1、
・タンパク質及び脂質のδ(CH2)変形に関連する1445cm-1、
・タンパク質のアミドIv(C=O)に関連する1655cm-1。
さらに、HW領域の強いラマンピークも観察される:
・脂質の対称及び非対称CH2伸縮に関連する2885cm-1、
・タンパク質のCH3伸縮に関連する2940cm-1、
・アミドA(タンパク質のNH伸縮)に関連する3300cm-1、
・組織の細胞外及び細胞外空間におけるOH結合の局所コンホメーション及び相互作用に関連する水の広範なラマンバンド(〜約3400cm-1にピークを有するOH伸縮振動)。
FIG. 22A shows the measured (ie normal and IM) mean in vivo Raman spectrum ± standard deviation (SD) (shaded light gray). A prominent tissue Raman peak with provisional assignment is observed within the FP range as follows:
875 cm -1 associated with v (C-C) protein,
1004 cm -1 related to the νs (C—C) ring fluctuation of phenylalanine,
1078 cm -1 related to lipid v (C-C),
1302 cm -1 associated with CH 2 twisting and shaking of lipids,
1445 cm -1 associated with δ (CH 2 ) deformation of proteins and lipids,
1655 cm -1 associated with protein amide Iv (C = O).
In addition, a strong Raman peak in the HW region is also observed:
2885 cm -1 associated with lipid symmetric and asymmetric CH 2 stretching,
2940 cm -1 associated with CH 3 stretching of the protein,
3300 cm -1 related to amide A (NH stretching of protein),
A broad Raman band of water (OH stretching vibration with a peak at ˜3400 cm −1 ) associated with local conformation and interaction of OH bonds in the extracellular and extracellular space of the tissue.
図22Bは、IM変換に関連する特徴的なスペクトル特徴(例えば、ピーク強度、シフト及びバンド広がり)を解消する差スペクトル(すなわち、IM−正常)±1SD(陰影付き明るいグレー)を示し、内視鏡検査でのIMの早期診断のためのFP/HWラマン分光法の可能性を確認する。 FIG. 22B shows a difference spectrum (ie, IM-normal) ± 1SD (shaded light gray) that eliminates characteristic spectral features associated with IM conversion (eg, peak intensity, shift and band broadening) To confirm the possibility of FP / HW Raman spectroscopy for early diagnosis of IM by microscopic examination.
図23A〜Bは、ラマン内視鏡を用いた対応する組織部位の代表的なヘマトキシリン及びエオシン(H&E)スライドを示す図であり、これは(a)正常胃粘膜(×200倍率);(b)広範な胃腸異形性を含み、それによって胃上皮が明らかな杯細胞(×100倍)を含む。病理組織学的特徴付けにより、胃組織における正常及び腸異形性病変の細胞及び形態学的特徴を明らかにすると共に、同時FP/HWラマン内視鏡検査により、上皮組織の特異的な生化学成分(例えば、タンパク質、脂質及び水)を分子レベルで解明する。 FIGS. 23A-B show representative hematoxylin and eosin (H & E) slides of corresponding tissue sites using a Raman endoscope, which are (a) normal gastric mucosa (× 200 magnification); ) Contains extensive gastrointestinal dysmorphism, thereby containing goblet cells (× 100 times) with obvious gastric epithelium. Histopathological characterization reveals cellular and morphological features of normal and intestinal dysmorphic lesions in gastric tissue, and specific biochemical components of epithelial tissue by simultaneous FP / HW Raman endoscopy Elucidate (eg proteins, lipids and water) at the molecular level.
高度な多変量診断アルゴリズムを開発し、そして3つの異なるラマン技術(FP、HW及び統合FP/HW)の間の組織診断性能を比較するために、PCA−LDAとスチューデントt検定とを取得した生体内組織ラマンスペクトルに対して実施して異なる組織型のスペクトルで観察された分かりにくい差異を評価した。図24に示すように、1組織部位抜き交差検証PCA−LDA診断アルゴリズムを診断有効PC(p<0.01)に基づいてさらに開発し、これはそれぞれラマンスペクトル変動の45.6%(PC1)、33.6%(PC2)、4.2%(PC3)、3.1%(PC4)及び1.2%(PC5)を占める。異なる重要なPCの特徴は区別される;特に、図24におけるピーク、トラフ及びスペクトル形状などのいくつかのPC特徴は、組織ラマンスペクトルパターンの特徴と類似する。第1の重要なPCは、スペクトルデータセット内で最大の分散を示す(すなわち、45.6%)のに対し、連続するPCは、徐々に小さくなる分散に寄与する特徴を示す。その後、5つの診断上重要なPCを、全て胃組織の診断及び分類のための1組織抜き交差検証技術と共にLDAモデルに供給する。 In order to develop an advanced multivariate diagnostic algorithm and to compare the tissue diagnostic performance between three different Raman techniques (FP, HW and integrated FP / HW), we have obtained a PCA-LDA and Student t-test. We performed it on body tissue Raman spectra to evaluate the indistinguishable differences observed in different tissue type spectra. As shown in FIG. 24, a cross-validation PCA-LDA diagnostic algorithm without one tissue site is further developed based on the diagnostic effective PC (p <0.01), which is 45.6% (PC1) of the Raman spectrum variation, respectively. 33.6% (PC2), 4.2% (PC3), 3.1% (PC4) and 1.2% (PC5). Different important PC features are distinguished; in particular, some PC features such as peaks, troughs and spectral shapes in FIG. 24 are similar to those of the tissue Raman spectral pattern. The first significant PC exhibits the largest variance in the spectral data set (ie, 45.6%), while successive PCs exhibit features that contribute to gradually decreasing variance. Thereafter, all five diagnostically important PCs are fed into the LDA model along with one tissue cross-validation technique for the diagnosis and classification of gastric tissue.
図25は、それぞれ(a)FP、(b)HW及び(c)統合又は同時FP/HWラマン法について計算されたようなPCA−LDAアルゴリズムモデリングによる正常及びIM病変の交差検証分類結果(事後確率)を示す。事後確率散布図に適用された閾値線(0.5)は、FP、HW及び統合FP/HWラマン分光技術について、それぞれ89.6%(103/115)、78.3%(90/115)及び91.3%(105/115)の診断精度(96.3%(26/27)、77.8%(21/27)、92.6%(25/27)の感度及び87.5%(77/88)、78.4%(69/88)、90.9%(80/88)の特異性)を生じさせた。この結果は、統合FP/HWラマン分光法がFP技術単独又はHW技術単独と比較して胃のIM診断に最も良く機能することを実証するものである。 FIG. 25 shows the results of cross-validation classification of normal and IM lesions (posterior probabilities) by PCA-LDA algorithm modeling as calculated for (a) FP, (b) HW and (c) integrated or simultaneous FP / HW Raman methods, respectively. ). The threshold lines (0.5) applied to the posterior probability scatter plot are 89.6% (103/115) and 78.3% (90/115) for FP, HW and integrated FP / HW Raman spectroscopy, respectively. And 91.3% (105/115) diagnostic accuracy (96.3% (26/27), 77.8% (21/27), 92.6% (25/27) sensitivity and 87.5% (77/88), 78.4% (69/88), 90.9% (80/88) specificity). This result demonstrates that integrated FP / HW Raman spectroscopy works best for IM diagnosis of the stomach compared to FP technology alone or HW technology alone.
図26は、FP、HW及び統合FP/HWラマン技術のために生成されたROC曲線を示し、胃のIM識別の診断感度と特異性との間の関係を明らかにする。FP、HW及び統合FP/HWラマン技術について、それぞれ曲線下積分面積(AUC)はそれぞれ0.94、0.79及び0.96であり、統合FP/HWラマン技術が生体内胃IM検出について最良の診断性能を提供することをさらに再確認した。全体として、上記の結果は、内視鏡検査中に生体内で胃前癌病変の早期診断を向上させるために開発された同時FP/HWラマン分光技術の大きな可能性を実証するものである。 FIG. 26 shows the ROC curves generated for FP, HW and integrated FP / HW Raman technologies and reveals the relationship between diagnostic sensitivity and specificity of gastric IM discrimination. For FP, HW and integrated FP / HW Raman technologies, the integrated area under the curve (AUC) is 0.94, 0.79 and 0.96 respectively, and the integrated FP / HW Raman technology is the best for in vivo gastric IM detection. It was further reconfirmed to provide the diagnostic performance of. Overall, the above results demonstrate the great potential of simultaneous FP / HW Raman spectroscopy technology developed to improve early diagnosis of gastric precancerous lesions in vivo during endoscopy.
図27は、FP範囲のみで口腔から測定されたラマンスペクトルのさらなる実施形態を示す。口腔(例えば、頬側及び咀嚼粘膜)内の異なる組織部位の間に顕著な解剖学的可変性があることに留意すべきである。この実施形態では、ヒドロキシアパタイトの956cm-1並びに脂質の1302cm-1及び1445cm-1などの大きな組織間分散の領域を、インターバル選択法を用いて排除する。したがって、変数/特徴選択技術を使用して、変動の大きいスペクトル領域を除外することにより診断アルゴリズムに対する解剖学的可変性の影響を低減することができる。これは重要なポイントであり、皮膚、口腔などを含めて他の臓器に適用される。 FIG. 27 shows a further embodiment of a Raman spectrum measured from the oral cavity only in the FP range. It should be noted that there are significant anatomical variability between different tissue sites within the oral cavity (eg, buccal and chewing mucosa). In this embodiment, a large tissue between distributed in areas such as 1302cm -1 and 1445cm -1 956cm -1 and lipid hydroxyapatite, eliminating using interval selection method. Thus, variable / feature selection techniques can be used to reduce the impact of anatomical variability on diagnostic algorithms by excluding highly variably spectral regions. This is an important point and is applied to other organs including the skin and oral cavity.
図28は、別個のスペクトルサブ領域に基づく確率論的診断モデルの実施後に予測を新たなスペクトルにリアルタイムで将来に向けて適用する方法の例を示す。これには、ファイバーバックグラウンド減算較正、スペクトルインターバルへの切り捨て、前処理、及び最終的に疾患分類のための予測子の適用することを含むいくつかのステップが含まれる。 FIG. 28 shows an example of how predictions can be applied to new spectra in the future in real time after implementation of a probabilistic diagnostic model based on distinct spectral sub-regions. This includes several steps including fiber background subtraction calibration, truncation to spectral intervals, preprocessing, and finally applying predictors for disease classification.
この実施形態は、先行技術に対していくつかの大きな利点を有する:診断のために広帯域スペクトル全体を使用する代わりに、この技術又は方法は、診断モデルを大幅に単純化する補足情報のサブセット(例えば5〜20%)のみを使用する。第2に、変数選択は、疾患の生化学的及び生体分子基礎への定性的な洞察を提供する。第3に、スペクトル範囲全体に基づくスペクトル分析と比較して、精度が有意に向上する。さらに、所定のスペクトル範囲が干渉又は交絡因子(例えば、血液)などを有する場合には、これらの効果を効率的に低減させることができる。 This embodiment has several significant advantages over the prior art: Instead of using the entire broadband spectrum for diagnosis, this technique or method is a subset of supplemental information that greatly simplifies the diagnostic model ( Only 5-20%) is used. Second, variable selection provides qualitative insights into the biochemical and biomolecular basis of disease. Third, accuracy is significantly improved compared to spectral analysis based on the entire spectral range. Furthermore, if the predetermined spectral range has interference or confounding factors (eg, blood), these effects can be efficiently reduced.
所定の例では、食道逆流に対する疑わしい症状の内視鏡的スクリーニングが予定されている患者は、以下を受ける:
・従来のWLR/NBI/AFI内視鏡撮像は、前癌(すなわち異形成)が疑われる大きなバレットセグメントの確定していない外観を示す遠位食道で実施される。
・その後、広帯域共焦点ラマン内視鏡技術を疑わしい組織セグメント内の客観的に標的となる生検に適用する。
・共焦点ラマン分類は、「正常」(病理又は胃炎の欠如)、「低リスク」(腸−異形性)及び「高リスク」(異形成/癌)に定義される。
・共焦点ラマンプローブは遠位食道の組織に対して配置され、診断はFP及びHW領域から抽出された補完情報に基づいてリアルタイムで与えられる。
・共焦点ラマン内視鏡技術は、後に生検される高リスク組織部位を標的とする。
In a given example, patients scheduled for endoscopic screening for suspicious symptoms for esophageal reflux will receive:
Conventional WLR / NBI / AFI endoscopic imaging is performed in the distal esophagus showing an undefined appearance of large Barrett segments suspected of being precancerous (ie, dysplasia).
• Then apply broadband confocal Raman endoscopic technology to objectively targeted biopsies in suspicious tissue segments.
The confocal Raman classification is defined as “normal” (pathology or lack of gastritis), “low risk” (gut-dysmorphism) and “high risk” (dysplasia / cancer).
Confocal Raman probe is placed against distal esophageal tissue and diagnosis is given in real time based on complementary information extracted from FP and HW regions.
• Confocal Raman endoscopy technology targets high-risk tissue sites that are later biopsied.
本発明に係る実施形態は、リアルタイム同時フィンガープリント(FP)及び高波数(HW)光ファイバー共焦点ラマン分光法が生体内での患者のスクリーニング中に実施できることを実証する。光ファイバー共焦点ラマン分光法は、結腸直腸発癌の間に上皮に生じるタンパク質、DNA、脂質及び水などの生体分子及び生化学的変化を明らかにする。FP及びHW範囲からの補完生体分子情報の使用は、FP又はHW範囲の単独使用と比較して、異常増殖の検出を改善する。FP及びHW光ファイバー共焦点ラマン分光法は、前癌及び癌の検出並びに特徴付けを改善する大きな可能性を有する。スペクトル全体のサブセットを使用することは、身体の多くの異なる部分における異常な成長の処理及び同定において顕著な利点を有する。FP及びHW範囲は、本明細書で検討される検出のタイプについて良好な結果をもたらすものとして特に同定されている。他のタイプの検出については、他の範囲がより有用であることが分かるであろう。 Embodiments according to the present invention demonstrate that real-time simultaneous fingerprint (FP) and high wave number (HW) fiber optic confocal Raman spectroscopy can be performed during in vivo patient screening. Fiber optic confocal Raman spectroscopy reveals biomolecules and biochemical changes such as proteins, DNA, lipids and water that occur in the epithelium during colorectal carcinogenesis. The use of complementary biomolecule information from the FP and HW ranges improves the detection of abnormal growth compared to single use of the FP or HW ranges. FP and HW fiber optic confocal Raman spectroscopy has great potential to improve pre-cancer and cancer detection and characterization. Using a subset of the entire spectrum has significant advantages in handling and identifying abnormal growth in many different parts of the body. The FP and HW ranges have been specifically identified as giving good results for the types of detection discussed herein. It will be appreciated that other ranges are more useful for other types of detection.
本発明に係る実施形態は、生物医学的ラマン分光法に限定されるものではなく、他の分野にも適用可能である。これらのものとしては、例えば、蛍光分光法、弾性散乱分光法、表面増強ラマン分光法、プロセス分析技術、水及び環境モニタリング、製薬プロセス/薬物送達制御、食品産業、品質管理産業、法医学などが挙げられる。このような実施形態では、イルミネーション源によって与えられる励起エネルギーは、組織を含む又は組織である必要のない標的サンプル(例えば、化学物質、水、又は環境物質/基質サンプル、医薬/薬物又は食品サンプル、又は別のタイプのサンプル)に向けられる。さらに、このような実施形態は、内視鏡又は内視鏡検査を必要としない。本明細書における用語「ラマン」についての言及は、上記のものを含めた他のタイプの分光法を包含するものとする。 Embodiments according to the present invention are not limited to biomedical Raman spectroscopy, but can be applied to other fields. These include, for example, fluorescence spectroscopy, elastic scattering spectroscopy, surface enhanced Raman spectroscopy, process analysis techniques, water and environmental monitoring, pharmaceutical process / drug delivery control, food industry, quality control industry, forensic medicine, etc. It is done. In such embodiments, the excitation energy provided by the illumination source is a target sample (eg, chemical, water or environmental / substrate sample, pharmaceutical / drug or food sample, which does not need to be or be tissue) Or another type of sample). Furthermore, such embodiments do not require endoscopy or endoscopy. Reference herein to the term “Raman” is intended to encompass other types of spectroscopy, including those described above.
本発明に係る実施形態は、肺、上部及び下部GI(例えば、食道、胃、結腸直腸)、肝臓、膀胱及び頭頸部(例えば、鼻咽頭、喉頭、経口)、頸部、皮膚、骨、又は従来の内視鏡、腹腔鏡若しくは関節鏡を使用することができる任意の他の場所などの任意の器官の診断プラットフォームとして機能することができる。 Embodiments according to the invention include lung, upper and lower GI (eg, esophagus, stomach, colorectal), liver, bladder and head and neck (eg, nasopharynx, larynx, oral), neck, skin, bone, or It can serve as a diagnostic platform for any organ, such as a conventional endoscope, laparoscope or any other location where an arthroscope can be used.
本発明に係る所定の実施形態を使用して得られた組織ラマンスペクトルのいくつかは、内視鏡照射干渉を被る可能性がある。これにより、異常な成長の診断を達成することが困難になる。結果として、さらなる実施形態は、このような干渉を排除するための解決策を提供する。 Some of the tissue Raman spectra obtained using certain embodiments according to the present invention may suffer from endoscopic irradiation interference. This makes it difficult to achieve an abnormal growth diagnosis. As a result, further embodiments provide a solution for eliminating such interference.
上記のような共焦点ラマンファイバープローブを誘導するために使用される本発明の一実施形態に係る三脚内視鏡撮像システムは、300Wの短アークキセノン光源と、胃腸(GI)内視鏡と、ビデオ信号プロセッサとを備える。キセノン光源を異なるセットのフィルタと結合させて、三次元内視鏡撮像(図示せず)のための異なるイルミネーション光をタンデムに提供する。フィルタは、例えば、WLR(赤色フィルタ、585〜655nm;緑色フィルタ、500〜575nm;青色フィルタ、390〜495nm)、AFI(青色フィルタ、390〜470nm;緑色フィルタ、反射率画像正規化用の540〜560nm)、NBI(緑色フィルタ、530〜550nm;青色フィルタ、390〜445nm)を含むことができる。 A tripod endoscope imaging system according to an embodiment of the present invention used to guide a confocal Raman fiber probe as described above includes a 300 W short arc xenon light source, a gastrointestinal (GI) endoscope, A video signal processor. A xenon light source is combined with a different set of filters to provide different illumination light in tandem for three-dimensional endoscopic imaging (not shown). Filters include, for example, WLR (red filter, 585 to 655 nm; green filter, 500 to 575 nm; blue filter, 390 to 495 nm), AFI (blue filter, 390 to 470 nm; green filter, 540 to 550 for reflectance image normalization) 560 nm), NBI (green filter, 530-550 nm; blue filter, 390-445 nm).
組織から放出された反射光又は蛍光は、GI内視鏡(図示せず)の遠位先端に取り付けられた2つの異なるCCD:WLR/NBI用の従来のCCDが1つ及びAFI観察用の高感度CCDが1個)を用いて検出される。内視鏡ショートアークキセノンランプは、>700nmのNIRスペクトル範囲に顕著な離散ピークを有するUV/VIS/NIRをカバーする広帯域連続光を放出する。 The reflected light or fluorescence emitted from the tissue is generated by two different CCDs attached to the distal tip of a GI endoscope (not shown): one conventional CCD for WLR / NBI and high for AFI observation. It is detected using a single sensitivity CCD). Endoscopic short arc xenon lamps emit broadband continuous light covering UV / VIS / NIR with significant discrete peaks in the NIR spectral range of> 700 nm.
785nmレーザ励起ストークスラマン分光法もNIR範囲に入るので、周囲キセノン光は組織ラマンシグナルを妨害し、生体内組織測定及び診断を完全に不明瞭にする可能性がある。そのため、ラマン内視鏡診断は、従来、キセノンイルミネーション光を「オフ」又は淡色にして実施されているが、これは臨床設定においては非常に望ましくない。 Since 785 nm laser-excited Stokes Raman spectroscopy is also in the NIR range, ambient xenon light can interfere with tissue Raman signals and completely obscure in vivo tissue measurements and diagnostics. As such, Raman endoscopic diagnosis is conventionally performed with xenon illumination light “off” or pale, which is highly undesirable in a clinical setting.
周囲キセノンイルミネーション干渉を除去するために、内視鏡システムにおけるキセノン光源の前にホットミラーローパスフィルタ(〜約700nmでのカットオフ、可視範囲の〜約95%の平均透過率)の統合により周囲の干渉を排除することを可能にする実施形態を提案する。この実施形態の適用を実証するために、異なる内視鏡照明条件下で生体内ラマンスペクトルを測定する。図29Aは、ホットミラーが組み込まれていない内視鏡検査中に得られた非接触組織ラマンスペクトルを示す。キセノン光からの主な干渉は、組織ラマン信号を完全に圧倒することが分かる。図29Bは、キセノンランプの前にホットミラーローパスフィルタを組み込んだ後の非接触モードでの組織ラマンスペクトルを示す。見て分かるように、キセノン干渉は実質的に排除される。高分解能の組織ラマンピークは、次のような暫定的な分子割り当てで観察できる:
・v(C−C)タンパク質に関連する853cm-1、
・フェニルアラニンのvs(C−C)環揺らぎに関連する1004cm-1、
・脂質のv(C−C)に関連する1078cm-1、
・タンパク質のアミドIIIv(C−N)及びδ(N−H)に関連する1265cm-1、
・タンパク質のCH3CH2ねじれ及び揺れに関連する1302cm-1、
・タンパク質及び脂質のδ(CH2)変形に関連する1445cm-1、
・タンパク質のアミドIv(C=O)に関連する1655cm-1、及び
・脂質のv(C=O)に関連する1745cm-1。
In order to eliminate ambient xenon illumination interference, the integration of a hot mirror low-pass filter (~ cutoff at ~ 700nm, average transmittance ~~ 95% of visible range) in front of the xenon light source in the endoscope system An embodiment is proposed that makes it possible to eliminate interference. To demonstrate the application of this embodiment, in vivo Raman spectra are measured under different endoscopic illumination conditions. FIG. 29A shows a non-contact tissue Raman spectrum obtained during endoscopy without a built-in hot mirror. It can be seen that the main interference from xenon light completely overwhelms the tissue Raman signal. FIG. 29B shows the tissue Raman spectrum in non-contact mode after incorporating a hot mirror low-pass filter in front of the xenon lamp. As can be seen, xenon interference is virtually eliminated. High-resolution tissue Raman peaks can be observed with provisional molecular assignments such as:
853 cm −1 associated with v (C—C) protein,
1004 cm -1 related to the vs (CC) ring fluctuation of phenylalanine,
1078 cm -1 related to lipid v (C-C),
1265 cm -1 related to protein amides IIIv (CN) and δ (NH),
1302 cm -1 associated with CH 3 CH 2 twist and shake of the protein,
1445 cm -1 associated with δ (CH 2 ) deformation of proteins and lipids,
· Associated with the protein of amide Iv (C = O) 1655cm -1 , and-lipid v (C = O) to the associated 1745 cm -1.
ラマンスペクトルをプローブが組織と接触した状態で測定した。図30Aは、ホットミラーの非存在下において接触モードで測定された組織ラマンスペクトルを示す。図30Bは、キセノンランプの前にホットミラーローパスフィルタを組み込んだ後の接触モードでの組織ラマンスペクトルを示す。全体的に、これらの結果は、ホットミラーが共焦点ラマンプローブの非接触モード及び接触モードの両方において生体内組織ラマンスペクトルからの周囲キセノン干渉を完全に排除することができることを示す。さらに、図から、キセノン干渉は、より多くの光がプローブヘッドに結合するため、ラマンプローブと組織との非接触モードで最も顕著であることが明らかである。したがって、この実施形態は、咳反射の刺激のため非接触モードが好ましい喉頭/気管支などの器官において、又はラマンプローブと組織との接触が出血及び癌細胞の広がりのリスクを誘発する場合のある進行腫瘍患者において特に価値のあるものである。 Raman spectra were measured with the probe in contact with the tissue. FIG. 30A shows a tissue Raman spectrum measured in contact mode in the absence of a hot mirror. FIG. 30B shows the tissue Raman spectrum in contact mode after incorporating a hot mirror low-pass filter in front of the xenon lamp. Overall, these results show that the hot mirror can completely eliminate ambient xenon interference from in vivo tissue Raman spectra in both non-contact and contact modes of the confocal Raman probe. Furthermore, it is clear from the figure that xenon interference is most noticeable in the non-contact mode between the Raman probe and the tissue because more light is coupled to the probe head. Thus, this embodiment is a progression in organs such as the larynx / bronchus where non-contact mode is preferred for stimulation of the cough reflex, or where the contact between the Raman probe and the tissue may induce the risk of bleeding and cancer cell spread. Of particular value in tumor patients.
なお、ホットミラーを使用した誘導のためのイルミネーション光のフィルタリングは内視鏡適用に限定されるものではなく、内部又は外部器官(例えば、皮膚、子宮頸部、膀胱、胃、食道、鼻咽頭、喉頭、口腔、結腸、直腸、肺など)のためにNIR組織分光法(すなわち、表面増強ラマン分光法(SERS)、NIR蛍光法又はNIR反射率法)を誘導するように使用される任意の光又は画像様式をフィルタリングするために一般的なものである。 Note that illumination light filtering for guidance using a hot mirror is not limited to endoscopic applications, but internal or external organs (eg, skin, cervix, bladder, stomach, esophagus, nasopharynx, Any light used to induce NIR tissue spectroscopy (ie, surface enhanced Raman spectroscopy (SERS), NIR fluorescence or NIR reflectometry) for the larynx, oral cavity, colon, rectum, lung, etc. Or it is common for filtering image formats.
したがって、その概念は、システム2100を示す図31に一般化されている。このシステム2100は、組織2104と接触させることができるプローブ2102を備える。このシステムは、NIRレーザ2106とスペクトログラフ2108とCCD2110とをさらに備える。プローブと分光器との間にエッジロングパスフィルタ2112が配置され、プローブとレーザとの間にバンドパスフィルタ2114が配置される。PC2116及び関連するソフトウェアを使用してシステムを制御する。また、組織は、ホットミラーローパスフィルタ2120を介してイルミネーション源2118によって照射される。このシステムは、この実施形態が使用される正確な用途に応じて、システムを構成する要素とこのような要素の方向及び位置との観点から変更できることが分かるであろう。
Therefore, the concept is generalized in FIG. The
機器の標準化は臨床ラマン分光法の進歩のペースよりはるかに遅れていることが知られている。組織ラマン分光法は、本質的に弱くかつ高分解能のピークに基づくため、この技術は機器の変化に非常に影響を受けやすい。したがって、生体内診断が異なるラマンシステム間で確実かつ一致したものであることを確保にするために、ヒト患者の臨床測定前にラマン内視鏡装置を試験/較正及び標準化するための技術を開発し使用することが不可欠である。 Instrument standardization is known to be far behind the pace of advances in clinical Raman spectroscopy. Since tissue Raman spectroscopy is based on intrinsically weak and high resolution peaks, this technique is very sensitive to instrumental changes. Therefore, in order to ensure that in-vivo diagnostics are reliably and consistent between different Raman systems, develop technology to test / calibrate and standardize the Raman endoscopic device before clinical measurement of human patients It is essential to use it.
図32は、(i)システムの起動、(ii)ラマン内視鏡システムの試験、(iii)患者におけるラマン内視鏡の適用を含む患者への適用前のラマン内視鏡を試験する基本原理を示す。光ファイバーラマン内視鏡を試験しかつ較正するシステムのために新たな装置及び技術又は方法を提案する。これには、オプティカルメカニカルデバイスと、光ファイバーラマン診断アプリケーションにおける自動システムテスト及び較正のためのラマンソフトウェアに実装された一連のプログラム命令ルーチンが含まれる。較正装置は、自動較正装置(例えば、水銀及びアルゴンランプ、NIRスペクトルエミッタ、レーザ光など)、光強度放射源、レーザパワーメータ、組織ファントムと共に、自動化光学器械部品(ステッピングモーター)及びラマン内視鏡検査システムの標準化のためのコントローラとから構成される。較正装置は、臨床ラマン内視鏡プラットフォームの不可欠な部分であるが、光ファイバーの一般的な試験及び較正のためのスタンドアローン装置として使用することもでき、様々なサンプル2304を取り入れる米国ニュージャージー州ニュートンのThorlabs社製FW102Cなどの付属ステッパー・モータ駆動フィルタホイール203を備える。可撓性光ファイバーラマンプローブ2306は、図33に概略的に示すように較正装置に取り付けることができる。
FIG. 32 illustrates the basic principles of testing a Raman endoscope prior to application to a patient, including (i) system activation, (ii) testing of the Raman endoscope system, and (iii) application of the Raman endoscope in the patient. Indicates. A new apparatus and technique or method is proposed for a system for testing and calibrating a fiber optic Raman endoscope. This includes an optical mechanical device and a series of program instruction routines implemented in Raman software for automated system testing and calibration in fiber optic Raman diagnostic applications. Calibration devices include automated calibration devices (eg, mercury and argon lamps, NIR spectral emitters, laser light, etc.), light intensity emitters, laser power meters, tissue phantoms, automated optical instrument parts (stepping motors) and Raman endoscopes And a controller for standardization of inspection systems. The calibration device is an integral part of the clinical Raman endoscope platform, but it can also be used as a stand-alone device for general optical fiber testing and calibration in Newton, New Jersey, USA, which incorporates
フィルタホイールの回転は、臨床ラマンソフトウェアにおけるレーザ励起及び取得と同期している。スペクトルは、フィルタホイールの各サンプルから取得され、保存される。較正/試験ルーチンで実行されるステップは、CCD特性(すなわち、温度、暗電流)、レーザ励起パワー、及び溶融石英ファイバーバックグラウンド、システム応答較正/試験のための蛍光材料、波長較正/試験のための材料及び最後に組織のファントムの測定を含む。測定された信号は、ラマン内視鏡システムのパラメータ(例えば、強度応答、波長精度、バックグラウンドノイズなど)を再較正するために使用できる。 The rotation of the filter wheel is synchronized with laser excitation and acquisition in clinical Raman software. A spectrum is acquired from each sample of the filter wheel and stored. The steps performed in the calibration / test routine are: CCD characteristics (ie, temperature, dark current), laser excitation power, and fused silica fiber background, fluorescent material for system response calibration / test, wavelength calibration / test Material and finally the measurement of the tissue phantom. The measured signal can be used to recalibrate the parameters (eg, intensity response, wavelength accuracy, background noise, etc.) of the Raman endoscope system.
次に、得られた信号の例と共に、較正装置のフィルタホイールに組み込まれたルーチン及び基準サンプルについて説明する。図34は、較正装置を使用する患者に使用する前にラマン内視鏡を検査するための手順(2400)を示す。信号解析(すなわち、故障の検出又は較正)は、各測定の後又は全ての測定が完了した後に実行できる(この特定の例に示されるように)。 A routine and reference sample built into the filter wheel of the calibration device will now be described along with an example of the resulting signal. FIG. 34 shows a procedure (2400) for examining a Raman endoscope prior to use with a patient using a calibration device. Signal analysis (ie, fault detection or calibration) can be performed after each measurement or after all measurements have been completed (as shown in this particular example).
第1の例では、CCDの検出器信号を測定し、温度を記録する(2402)。これは、レーザ励起がない場合の信号強度の複数のスペクトル(すなわち、0〜1秒の露光時間)を測定することを含むことができる。続いて、暗電流が工場出荷時設定ファイルにおいて以前に保存された最大値よりも小さいことを確認する。この実施形態は、一連のスペクトルにわたる変動の暗電流係数が、構成ファイルにおいて以前に保存された最大値よりも小さいことを確保することをさらに含む。 In the first example, the CCD detector signal is measured and the temperature is recorded (2402). This can include measuring multiple spectra of signal intensity in the absence of laser excitation (ie, an exposure time of 0 to 1 second). Subsequently, it is confirmed that the dark current is smaller than the maximum value previously stored in the factory setting file. This embodiment further includes ensuring that the dark current coefficient of variation across the series of spectra is less than the maximum value previously stored in the configuration file.
レーザ励起力メーターを使用して、光ファイバーラマンプローブの先端でのレーザ励起力も測定して(2402)、これがアメリカ規格協会(ANSI)の最大許容皮膚暴露限度(785nmレーザビームで設定される)以内であることを確実にする。この実施形態は、レーザ出力が構成ファイルにおいて初期に保存された最大値未満であることを確実にすることを含む。 Using a laser excitation power meter, the laser excitation power at the tip of the fiber optic Raman probe was also measured (2402), which was within the American National Standards Institute (ANSI) maximum allowable skin exposure limit (set by a 785 nm laser beam). Make sure that there is. This embodiment includes ensuring that the laser power is less than the maximum value initially stored in the configuration file.
フィルタホイールは、溶融シリカファイバープローブのバックグラウンド信号を測定できるように、暗い環境の空スロットを収容する(2404)。ファイバープローブバックグラウンドの複数のスペクトルは、レーザ励起及び異なる曝露時間(例えば、0.1〜1.0秒)で測定される。これらのスペクトルは、光ファイバープローブの状態に関する情報を含む。例えば、繊維が損傷している場合又はプローブ先端が汚染されている場合には、これはラマン又は蛍光強度の増加に反映される可能性がある。 The filter wheel accommodates an empty slot in a dark environment so that the background signal of the fused silica fiber probe can be measured (2404). Multiple spectra of the fiber probe background are measured with laser excitation and different exposure times (eg, 0.1-1.0 seconds). These spectra contain information about the state of the fiber optic probe. For example, if the fiber is damaged or if the probe tip is contaminated, this may be reflected in an increase in Raman or fluorescence intensity.
広帯域ラマン内視鏡プローブについてのバックグラウンドシグナルの例を、2つの異なる光ファイバープローブについて図35に示す。この実施形態は、一連のスペクトルにわたる変動係数が構成ファイルに先に保存された最大値未満であることを確保することをさらに含む。また、測定された光ファイバープローブバックグラウンドも、リアルタイム処理中に生体内組織ラマンスペクトルからのさらなる処理(すなわち減算)のためにメモリに保存される。 An example of background signal for a broadband Raman endoscope probe is shown in FIG. 35 for two different fiber optic probes. This embodiment further includes ensuring that the coefficient of variation across the series of spectra is less than the maximum value previously stored in the configuration file. The measured fiber optic probe background is also stored in memory for further processing (ie subtraction) from the in vivo tissue Raman spectrum during real-time processing.
ラマン内視鏡システム(2406)の応答及び収集効率を試験及び/又は較正するために、広く安定な蛍光スペクトルを示す蛍光ガラス(例えば、クロムをドープしたホウケイ酸ガラス、緑色ガラス、kopp2412など)も測定及び保存する。基準蛍光ガラスは、図36に詳述されている手順に従って、国立標準技術研究所(NIST)のタングステンランプを使用して予め工場で較正されている。システムの応答は、構成ファイルに先に保存された応答と比較できる。この実施形態は、一連のスペクトルにわたる変動係数が構成ファイルに先に保存された最大値未満であることを確保することをさらに含む。応答基準サンプルのスペクトルを使用して、システムを工場較正に再較正することができる。図37は、2つの異なる光ファイバープローブを使用する蛍光基準ガラス(すなわち、kopp2412)に由来する較正機能の例を示す。
Fluorescent glasses that exhibit a broad and stable fluorescence spectrum (eg, chromium-doped borosilicate glass, green glass,
また、明確に定義された狭いラマンピークを有する材料も測定する(2408)。一例は図38に示すポリスチレンである。波長基準を使用して、光学的なずれによる波長軸のドリフトがあったかどうかを評価する。このスペクトルと、構成ファイルに以前に保存されたスペクトルとを比較する(例えば、相関係数又はピーク識別などを使用して)。これには、分解能の試験(すなわち半値全幅(FWHM))及びピーク位置の検証が含まれる。明確に定義された狭いラマンピークを有する材料のスペクトルは、構成ファイルに保存された以前の工場アラインメントにシステムを再調整するためにも使用できる。再較正は、工場で較正された波長軸からの所定のピークと、ミスアライメントスペクトルからの対応するピークとの間の多項式マッピング(例えば、3〜5次)を含む。再較正後のピークの多項式マッピングを示す例を図39に示す。 Also measured is a material with a well-defined narrow Raman peak (2408). An example is polystyrene shown in FIG. A wavelength reference is used to evaluate whether there has been a drift in the wavelength axis due to optical misalignment. Compare this spectrum with the spectrum previously stored in the configuration file (eg, using correlation coefficient or peak identification, etc.). This includes resolution testing (ie, full width at half maximum (FWHM)) and verification of peak positions. The spectrum of a material with a well-defined narrow Raman peak can also be used to retune the system to the previous factory alignment stored in the configuration file. Recalibration involves polynomial mapping (eg, 3-5) between a predetermined peak from the factory calibrated wavelength axis and the corresponding peak from the misalignment spectrum. An example showing the polynomial mapping of the peaks after recalibration is shown in FIG.
フィルタホイールは層状組織ファントムも含む。組織ファントムは、測定される既知のラマンピークを示す拡散特性及び/又は層状組織ファントムを有する材料からなる(2410)。この実施形態は、一連のスペクトルにわたる変動係数が構成ファイルに先に保存された最大値未満であることを確保することを含む。異なるラマンプローブを使用してポリスチレンとポリエチレンとの2層ファントムサンドイッチから得られたラマンスペクトルの比較を示す例が図40A〜Bに示されている。層状組織ファントムのラマンスペクトルを使用して、光ファイバーラマンプローブの深さ選択性並びにスペクトル品質を検証する。所定の光ファイバー共焦点プローブの深さ選択性の定性的及び定量的指標として、上層から下層への信号(例えば、それぞれ1002cm-1及び1296cm-1)の比を使用する。この実施形態は、深さ選択性が構成ファイルの前に保存された最大値未満であることを確保することを含む。 The filter wheel also includes a layered tissue phantom. The tissue phantom is made of a material having a diffusion characteristic and / or a layered tissue phantom that exhibits a known Raman peak to be measured (2410). This embodiment includes ensuring that the coefficient of variation across the series of spectra is less than the maximum value previously stored in the configuration file. Examples showing a comparison of Raman spectra obtained from two-layer phantom sandwiches of polystyrene and polyethylene using different Raman probes are shown in FIGS. The Raman spectrum of the layered tissue phantom is used to verify the depth selectivity as well as the spectral quality of the fiber optic Raman probe. As qualitative and quantitative indicators of the depth selection of a given fiber optic confocal probe, the signal from the top to the lower (e.g., each 1002Cm -1 and 1296cm -1) using a ratio. This embodiment includes ensuring that the depth selectivity is less than the maximum value stored before the configuration file.
様々な測定を行った後に、信号の分析を実行する(2412)。これは、障害検出、較正問題などの問題を特定するためである。問題が検出された場合には、システムは合格ではないと定義される(2414)。あるいは、問題に遭遇しなければ、システムは合格する(2416)。 After making various measurements, signal analysis is performed (2412). This is to identify problems such as fault detection and calibration problems. If a problem is detected, the system is defined as not passing (2414). Alternatively, if no problem is encountered, the system passes (2416).
さらなる実施形態は、ラマン内視鏡診断が実行されるときのユーザの選択/入力に応答して、スペクトル及び病変ベースでラマンデータを表示及び保存することができるGUIと一体化された又はGUIとして組み込まれたプログラム命令セット又はソフトウェアフレームワークを含む。例えば、第1の選択を行う又は第1のボタンを押す場合に、第1の病変からのラマンデータが保存される。第2の選択を行い又は第2のボタンを押す場合に、第2の病変からのラマンデータが保存される。また、このようなシステムは、患者情報、積分時間、レーザ励起出力、時間、日付、診断、プローブバックグラウンド信号、システム較正機能、内視鏡ビデオ及び測定詳細を格納するロギングファイルを保存することを含む。臨床医によるデータのインターフェース接続及び保存するために、一体化されたフットペダル装置を設けることができる。フットスイッチを押すと、取得したデータが第1病変として保存される。2回目に押すと、データは第2病変などとして保存される。また、フットスイッチには、レーザ励起をオン/オフするためのセーフティペダルを含めることもできる。 Further embodiments are integrated with or as a GUI that can display and store Raman data on a spectrum and lesion basis in response to user selection / input when a Raman endoscopic diagnosis is performed. Includes an embedded program instruction set or software framework. For example, when making a first selection or pressing a first button, the Raman data from the first lesion is saved. When making a second selection or pressing the second button, the Raman data from the second lesion is saved. Also, such a system can save logging files that store patient information, integration time, laser excitation output, time, date, diagnosis, probe background signal, system calibration function, endoscope video and measurement details. Including. An integrated foot pedal device can be provided for interfacing and storing data by the clinician. When the foot switch is pressed, the acquired data is stored as the first lesion. When pressed for the second time, the data is saved as a second lesion or the like. The foot switch can also include a safety pedal for turning laser excitation on and off.
さらなる実施形態は、記録された広視野ビデオ撮像と共に臨床ラマン診断を表示するためのプログラム命令セット又はソフトウェアフレームワークを含む。内視鏡ビデオ撮像(すなわち、WLR/NBI/AFI)及びビデオ記録は、ラマン内視鏡ソフトウェアに統合されている。画像化された組織の広視野内視鏡ビデオ及び生体内ラマン診断の両方を、コンピュータスクリーンなどの表示装置に表示することができる。内視鏡ビデオは、測定された組織ラマンスペクトルと時間的に同期している。したがって、ラマンスペクトル診断をビデオ再生と同時に表示することができる。これにより、臨床医は、各患者について、ラマン内視鏡診断とサンプリングされた疑わしい組織部位との間の正確な相関を追跡することができる。この統合イメージング及びラマン内視鏡ソフトウェアは、臨床システムにおける実質的な改善であり、過去の臨床データの再検討を可能にする。 Further embodiments include a program instruction set or software framework for displaying clinical Raman diagnostics along with recorded wide-field video imaging. Endoscopic video imaging (ie, WLR / NBI / AFI) and video recording are integrated into the Raman endoscopic software. Both the wide field endoscopic video of the imaged tissue and the in vivo Raman diagnosis can be displayed on a display device such as a computer screen. The endoscopic video is temporally synchronized with the measured tissue Raman spectrum. Therefore, the Raman spectrum diagnosis can be displayed simultaneously with the video playback. This allows the clinician to track the exact correlation between the Raman endoscopic diagnosis and the sampled suspicious tissue site for each patient. This integrated imaging and Raman endoscope software is a substantial improvement in the clinical system and allows review of past clinical data.
生体内組織は様々な程度の自己蛍光を示すため、CCDの限られたダイナミックレンジ及び微弱な組織のラマン信号は、ラマン内視鏡用途では依然として挑戦的である。いくつかの組織(例えば、胃、肺、舌背部、肝臓)については、検出器飽和が0.1秒未満又はさらに0.05秒未満で生じる場合がある。これらの組織について、ラマン信号は、他の組織タイプ(例えば、食道、鼻咽頭、喉頭、子宮頸部など)と比較して顕著なノイズを有することがある。一般に、組織のラマン信号強度は、レーザ励起出力及び暴露時間と共に直線的に変化する。信号対ノイズ比(S/N)は、露光時間の平方根に比例する。今のところ、ユーザは、ラマン内視鏡技術を使用して取得された全てのスペクトルについて手作業で露光時間やレーザ励起出力を調節している。これはリアルタイムアプリケーションでは極めて非実用的である。したがって、自動化された方法を、CCD飽和を防ぎかつラマンスペクトルが臨床条件において許容可能な時間内に最適なS/N比で取得されることを確保するように定義することが重要である。真のリアルタイム診断の実現は、ラマン内視鏡技術が臨床医学において広く受け入れられるために必要である。高S/N比の臨床ラマン測定中に中断のないリアルタイム診断を実現するためにレーザ励起出力、曝露時間及びスペクトル蓄積を自動的に調節する新規な方法は、この探求において非常に重要である。代表的な例として、2つの自動化技術又は方法を記載する。 Because in vivo tissue exhibits varying degrees of autofluorescence, the limited dynamic range of CCDs and weak tissue Raman signals remain challenging for Raman endoscope applications. For some tissues (eg, stomach, lung, dorsal tongue, liver), detector saturation may occur in less than 0.1 seconds or even less than 0.05 seconds. For these tissues, the Raman signal may have significant noise compared to other tissue types (eg, esophagus, nasopharynx, larynx, cervix, etc.). In general, tissue Raman signal intensity varies linearly with laser excitation power and exposure time. The signal to noise ratio (S / N) is proportional to the square root of the exposure time. Currently, the user manually adjusts the exposure time and laser excitation power for all spectra acquired using Raman endoscope technology. This is extremely impractical for real-time applications. Therefore, it is important to define an automated method that prevents CCD saturation and ensures that the Raman spectrum is acquired with an optimal signal-to-noise ratio within an acceptable time in clinical conditions. Realization of true real-time diagnosis is necessary for Raman endoscope technology to be widely accepted in clinical medicine. A novel method that automatically adjusts laser excitation power, exposure time and spectral accumulation to achieve uninterrupted real-time diagnostics during high S / N ratio clinical Raman measurements is very important in this search. As representative examples, two automated techniques or methods are described.
図41を参照して示される第1技術又は方法では、露光時間は一定であり(例えば、0.1秒)(3102)、レーザ励起出力を可変として割り当て、必要に応じて調節する(3104)。ラマンスペクトルを測定され(3106)、信号対ノイズを決定する(3108)。スペクトルにおけるノイズ推定は、フーリエ変換、微分又はノイズレベルを定量化する他の方法に基づく。ラマンスペクトルが貧弱な信号対ノイズ比(S/N)比(3110)を有する場合には、その後の測定において、いくつかのラマンスペクトル(例えば、n=2...3)(3112)を読み出しの前に蓄積する。CCDが所定のスペクトル(3114)に対して飽和している場合には、後のラマン測定のレーザ励起出力を飽和度(3116)に応じた数だけ減少させる。スペクトルが飽和していない場合には、これを診断に使用する(3118)。飽和度を飽和ピクセルの%年齢として定義する。スペクトルが強度カウント(ダイナミックレンジの<70%又は>90%)で読み取られた場合(3120)には、後のラマン測定のレーザ励起出力を、信号強度が、ダイナミックレンジの70〜90%の範囲内になるようにスケールアップする(3122)。一実施形態は、レーザ励起出力(例えば、25mW)に上限を設ける。別の実施形態では、いくつかのスペクトルの蓄積(例えば、n=2)を一貫して実行する。背景減算、前処理、外れ値検出、疾患予測及び表示を全て実行してもよい(3124)。 In the first technique or method shown with reference to FIG. 41, the exposure time is constant (eg, 0.1 second) (3102), the laser excitation power is assigned as variable and adjusted as needed (3104). . The Raman spectrum is measured (3106) and signal to noise is determined (3108). Noise estimation in the spectrum is based on a Fourier transform, differentiation or other method of quantifying the noise level. If the Raman spectrum has a poor signal-to-noise ratio (S / N) ratio (3110), in subsequent measurements, some Raman spectra (eg, n = 2 ... 3) (3112) are read out Accumulate before. When the CCD is saturated with respect to a predetermined spectrum (3114), the laser excitation output of the later Raman measurement is decreased by a number corresponding to the degree of saturation (3116). If the spectrum is not saturated, it is used for diagnosis (3118). Saturation is defined as the% age of saturated pixels. If the spectrum is read with an intensity count (<70% or> 90% of the dynamic range) (3120), the laser excitation output of the later Raman measurement will be signaled with a signal intensity in the range of 70-90% of the dynamic range. Scale up to be inside (3122). One embodiment places an upper limit on laser excitation power (eg, 25 mW). In another embodiment, several spectral accumulations (eg, n = 2) are performed consistently. Background subtraction, preprocessing, outlier detection, disease prediction and display may all be performed (3124).
図42に関して示された第2技術又は方法では、レーザ励起出力は一定であり(例えば25mWで)(3202)、露光時間を変数として割り当てる(3204)。ラマンスペクトルを測定し(3206)、信号対ノイズを決定する(3208)。ノイズ推定は、フーリエ変換、微分又はノイズレベルを定量化する任意の方法に基づく。ラマンスペクトルが乏しいS/N比(3210)を示す場合に、その後の測定において、いくつかのラマンスペクトル(例えば、n=2...3)(3212)を読み出しの前に蓄積する。所定のスペクトルに対してCCDが飽和(3214)する場合には、後のラマン測定の露光時間を飽和度に応じた数で減少させる(3216)。スペクトルが飽和していない場合には、これを診断に使用する(3218)。飽和度は、飽和ピクセルの年齢%として定義される。スペクトルが低い数の強度カウント(例えば、ダイナミックレンジの<70%又は>90%)を有する場合(3220)には、後のラマン測定の露光時間をスケールアップして(3222)、信号強度がダイナミックレンジの70〜90%の範囲内になるようにする。一実施形態は、露光時間に上限を設ける(例えば、0.5秒)。別の実施形態では、積分時間が非常に短い(例えば、<0.1秒)場合にはいくつかのスペクトルの蓄積を一貫して実行する。背景減算、前処理、外れ値検出、疾患予測及び表示を全て実行してもよい(3224)。 In the second technique or method shown with respect to FIG. 42, the laser excitation power is constant (eg, at 25 mW) (3202) and the exposure time is assigned as a variable (3204). The Raman spectrum is measured (3206) and signal to noise is determined (3208). Noise estimation is based on any method of quantifying the Fourier transform, differentiation or noise level. If the Raman spectrum exhibits a poor signal-to-noise ratio (3210), in subsequent measurements, some Raman spectra (eg, n = 2 ... 3) (3212) are accumulated before readout. When the CCD is saturated (3214) with respect to a predetermined spectrum, the exposure time for subsequent Raman measurement is decreased by a number corresponding to the degree of saturation (3216). If the spectrum is not saturated, it is used for diagnosis (3218). Saturation is defined as the age% of saturated pixels. If the spectrum has a low number of intensity counts (eg, <70% or> 90% of the dynamic range) (3220), the exposure time for later Raman measurements is scaled up (3222) and the signal intensity is dynamic. Within 70 to 90% of the range. One embodiment places an upper limit on the exposure time (eg, 0.5 seconds). In another embodiment, several spectral accumulations are performed consistently when the integration time is very short (eg, <0.1 seconds). Background subtraction, preprocessing, outlier detection, disease prediction and display may all be performed (3224).
それぞれ図36及び図37に関して詳細に説明した上記2つの機能をオペレーティングソフトウェアに統合する。レーザ出力のみを調整することには、露光時間が一定に保たれ、かつ、非常に短くてもよい(例えば、0.1秒)という利点がある。上記の方法は、高いS/N比で中断のないリアルタイム診断を実現するための臨床ラマン内視鏡検査において重要な価値があるが、表面増強ラマン内視鏡(SERS)、反射率及び蛍光分光法などの他のモダリティにも一般化される。信号品質を改善し、CCDの飽和を防止し、リアルタイム診断を実現するための露出時間、レーザ励起出力及び蓄積の自動化調節の一般的概念は、本発明のこの実施形態の1つの重要な特徴である。別の実施形態は、レーザ励起と取得との同期化を含む。換言すれば、信号取得の前に、レーザ励起がオンにされ、取得後にレーザ励起がオフにされる。 The two functions described in detail with respect to FIGS. 36 and 37, respectively, are integrated into the operating software. Adjusting only the laser output has the advantage that the exposure time can be kept constant and can be very short (eg, 0.1 seconds). While the above method is of significant value in clinical Raman endoscopy to achieve uninterrupted real-time diagnosis with high S / N ratio, surface enhanced Raman endoscope (SERS), reflectance and fluorescence spectroscopy It is also generalized to other modalities such as law. The general concept of automatic adjustment of exposure time, laser excitation power and accumulation to improve signal quality, prevent CCD saturation and achieve real-time diagnostics is one important feature of this embodiment of the present invention. is there. Another embodiment includes synchronization of laser excitation and acquisition. In other words, laser excitation is turned on before signal acquisition and laser excitation is turned off after acquisition.
本発明に係るさらに別の実施形態は、異なる光ファイバープローブと異なる器官とを切り替える機能を含む。各タイプの光ファイバープローブ(例えば、共焦点又は体積型プローブ)について、各臓器(すなわち、喉頭、結腸、鼻咽頭、胃、食道、口腔、皮膚、子宮頸部、膀胱など)に特異的な診断モデルを有するデータベースが存在する。例えば、ユーザが器官として鼻咽頭を選択した場合には、鼻咽頭に属する1つ以上のモデルがシステムにロードされる。代表的なデータベース構造を図43に示す。このモデルは、多変量診断アルゴリズム及び/又は多変量外れ値検出モデルを含むことができる。 Yet another embodiment according to the invention includes the ability to switch between different fiber optic probes and different organs. A diagnostic model specific to each organ (ie larynx, colon, nasopharynx, stomach, esophagus, oral cavity, skin, cervix, bladder, etc.) for each type of fiber optic probe (eg, confocal or volumetric probe) There is a database with For example, if the user selects the nasopharynx as an organ, one or more models belonging to the nasopharynx are loaded into the system. A typical database structure is shown in FIG. The model can include a multivariate diagnostic algorithm and / or a multivariate outlier detection model.
上記様々な実施形態は、それらの解釈を限定するものではないことが分かるであろう。その代わりに、上記説明に示された特定の例からの1以上の実施形態と変形例との組み合わせが存在することができる。プロセスのいくつかは、ハードウェア、ソフトウェア又はそれらの任意の組み合わせで実施できる。 It will be appreciated that the various embodiments described above do not limit their interpretation. Instead, there may be a combination of one or more embodiments and variations from the specific examples shown in the above description. Some of the processes can be implemented in hardware, software, or any combination thereof.
100 光ファイバー共焦点ラマン分光器
102 近赤外(NIR)ダイオードレーザ
104 ハイスループット反射イメージング分光器
105 細長シャフト
106 NIR最適化電荷結合素子(CCD)カメラ
108 プローブ
110 光ファイバー
112 バンドパスフィルタ
114 ロングパスフィルタ
124 マイクロコントローラシステム
2100 システム
2102 プローブ
2104 組織
2106 NIRレーザ
2108 スペクトログラフ
2110 CCD
2112 エッジロングパスフィルタ
2114 バンドパスフィルタ
2116 PC
2118 イルミネーション源
2120 ホットミラーローパスフィルタ
2304 サンプル
100 optical fiber
2112 Edge
2118
Claims (19)
イルミネーションを組織に向けるように構成された第1のイルミネーション源と、
該組織によって散乱されたイルミネーションからフィンガープリント(FP)及び高波数(HW)ラマンスペクトルを同時に検出するように構成されたラマン分光器と、
FP及びHW波長範囲における検出ラマンスペクトルの離散スペクトルサブインターバルを分析して一方又は両方の波長範囲において1以上の基準マーカーとの一致を同定するための、少なくとも1個の処理ユニット及び該少なくとも1個の処理ユニットによって実行可能なプログラム命令を保存するメモリを含むコンピュータ化制御及び分析モジュールと
を備えるラマン分光装置。 A Raman spectrometer,
A first illumination source configured to direct illumination to the tissue;
A Raman spectrometer configured to simultaneously detect fingerprint (FP) and high wave number (HW) Raman spectra from illumination scattered by the tissue;
At least one processing unit and at least one for analyzing discrete spectral subintervals of the detected Raman spectrum in the FP and HW wavelength ranges to identify a match with one or more reference markers in one or both wavelength ranges A Raman spectroscopic apparatus comprising a computerized control and analysis module including a memory for storing program instructions executable by the processing unit.
前記第1イルミネーション源によるイルミネーション出力と追加のイルミネーション源による追加のイルミネーション出力との間のイルミネーション干渉を補うように構成されたホットミラーフィルタと
をさらに備える、請求項3に記載の装置。 An additional illumination source configured to output additional illumination to the tissue;
The apparatus of claim 3, further comprising a hot mirror filter configured to compensate for illumination interference between an illumination output by the first illumination source and an additional illumination output by an additional illumination source.
第1イルミネーション源によるイルミネーション出力を組織に向け;
該組織によって散乱されたイルミネーションからのプローブフィンガープリント(FP)及び高波数(HW)ラマンスペクトルを同時に検出し;及び
該検出されたラマンスペクトルにおける離散スペクトルサブインターバルをFP波長範囲及びHW波長範囲の両方において分析して、一方又は両方の波長範囲内において1以上の基準マーカーとの一致を同定すること
を含む方法。 A method performed by a Raman spectroscopy apparatus,
Directing the illumination output from the first illumination source to the tissue;
Simultaneously detecting probe fingerprints (FP) and high wavenumber (HW) Raman spectra from illumination scattered by the tissue; and discrete spectral subintervals in the detected Raman spectra in both FP and HW wavelength ranges And analyzing to identify a match with one or more reference markers within one or both wavelength ranges.
ホットミラーフィルタを使用して該第1イルミネーション源によるイルミネーション出力と該追加のイルミネーション源による該追加のイルミネーション出力との間のイルミネーション干渉を補うこと
をさらに含む、請求項12に記載の方法。 Directing additional illumination to the tissue using an additional illumination source while directing the illumination output from the first illumination source to the tissue;
The method of claim 12, further comprising compensating for illumination interference between an illumination output by the first illumination source and the additional illumination output by the additional illumination source using a hot mirror filter.
Applications Claiming Priority (7)
| Application Number | Priority Date | Filing Date | Title |
|---|---|---|---|
| GB201411803A GB201411803D0 (en) | 2014-07-02 | 2014-07-02 | The method and system for the use of Raman spectroscopy in the diagnosis of the nature of an abnormal growth |
| GB1411803.8 | 2014-07-02 | ||
| GB1411820.2 | 2014-07-02 | ||
| GB1411800.4 | 2014-07-02 | ||
| GB201411800A GB201411800D0 (en) | 2014-07-02 | 2014-07-02 | The method and system for the use of Raman spectroscopy in the diagnosis of an abnormal growth |
| GB201411820A GB201411820D0 (en) | 2014-07-02 | 2014-07-02 | The method and system for the use of raman spectroscopy in the diagnosis of the nature of an abnormal growth |
| PCT/SG2015/050195 WO2016003371A1 (en) | 2014-07-02 | 2015-07-02 | Raman spectroscopy system, apparatus, and method for analyzing, characterizing, and/or diagnosing a type or nature of a sample or a tissue such as an abnormal growth |
Publications (2)
| Publication Number | Publication Date |
|---|---|
| JP2017524924A true JP2017524924A (en) | 2017-08-31 |
| JP6768529B2 JP6768529B2 (en) | 2020-10-14 |
Family
ID=55019739
Family Applications (1)
| Application Number | Title | Priority Date | Filing Date |
|---|---|---|---|
| JP2016575728A Expired - Fee Related JP6768529B2 (en) | 2014-07-02 | 2015-07-02 | Raman spectroscopy systems, devices and methods for analyzing, characterizing, and / or diagnosing sample or tissue types or properties such as overgrowth. |
Country Status (9)
| Country | Link |
|---|---|
| US (1) | US20170138860A1 (en) |
| EP (1) | EP3164046B1 (en) |
| JP (1) | JP6768529B2 (en) |
| KR (1) | KR102409070B1 (en) |
| CN (1) | CN106793917B (en) |
| AU (1) | AU2015284810B2 (en) |
| ES (1) | ES2847230T3 (en) |
| SG (1) | SG11201702715UA (en) |
| WO (1) | WO2016003371A1 (en) |
Cited By (7)
| Publication number | Priority date | Publication date | Assignee | Title |
|---|---|---|---|---|
| WO2019073733A1 (en) * | 2017-10-12 | 2019-04-18 | 富士フイルム株式会社 | Image creation device, image creation method, and image creation program |
| KR20200134405A (en) * | 2019-05-22 | 2020-12-02 | 주식회사 나노바이오라이프 | Method for detecting multi-biomarkers of a rapid diagnostic kit and a multimodal scanner using the same |
| JP2021511108A (en) * | 2018-01-17 | 2021-05-06 | オーディーエス メディカル インコーポレイテッドODS Medical Inc. | Systems and methods for real-time Raman spectroscopy for cancer detection |
| JP2024502229A (en) * | 2020-12-10 | 2024-01-18 | クレオ・メディカル・リミテッド | Raman spectroscopy probe and Raman spectroscopy apparatus including Raman spectroscopy probe and elongated assembly |
| JP2024528161A (en) * | 2021-08-06 | 2024-07-26 | 華東師範大学 | Fiber-optic Raman spectrometer and its construction method and application |
| US20240426757A1 (en) * | 2023-06-26 | 2024-12-26 | Mariposa Technology, Inc. | Spectroscopic Methods and Systems for the Qualitative and Quantitative Analysis of Samples |
| WO2025005160A1 (en) * | 2023-06-30 | 2025-01-02 | ソニー・オリンパスメディカルソリューションズ株式会社 | Medical control device and medical observation system |
Families Citing this family (35)
| Publication number | Priority date | Publication date | Assignee | Title |
|---|---|---|---|---|
| CN104684398A (en) | 2012-08-31 | 2015-06-03 | 索隆-基特林癌症研究协会 | Particles, methods and uses thereof |
| EP2958481A4 (en) * | 2013-02-20 | 2017-03-08 | Sloan-Kettering Institute for Cancer Research | Wide field raman imaging apparatus and associated methods |
| US10912947B2 (en) | 2014-03-04 | 2021-02-09 | Memorial Sloan Kettering Cancer Center | Systems and methods for treatment of disease via application of mechanical force by controlled rotation of nanoparticles inside cells |
| WO2016018896A1 (en) | 2014-07-28 | 2016-02-04 | Memorial Sloan Kettering Cancer Center | Metal(loid) chalcogen nanoparticles as universal binders for medical isotopes |
| EP3317035A1 (en) | 2015-07-01 | 2018-05-09 | Memorial Sloan Kettering Cancer Center | Anisotropic particles, methods and uses thereof |
| CN105997000B (en) * | 2016-05-30 | 2023-04-14 | 福建师范大学 | A fiberscope-based Raman spectroscopy detection device and its implementation method |
| WO2018072807A1 (en) * | 2016-09-27 | 2018-04-26 | Siemens Aktiengesellschaft | Apparatus and method for ascertaining pathological implications |
| GB201621912D0 (en) * | 2016-12-21 | 2017-02-01 | Dublin Inst Of Tech And Trinity College Dublin | A method of using raman spectroscopy for identification of low grade cervical cytology cases likely to progress to high grade / cancer |
| CN107132208B (en) | 2017-04-10 | 2018-11-30 | 苏州贝康医疗器械有限公司 | A kind of cell culture fluid quality determining method based on raman spectroscopy measurement |
| FR3065285B1 (en) * | 2017-04-14 | 2019-07-05 | Commissariat A L'energie Atomique Et Aux Energies Alternatives | METHOD FOR ACQUIRING A SPECTRUM |
| CN109507166A (en) * | 2017-09-15 | 2019-03-22 | Ravr有限公司 | A dual-channel miniature Raman spectrometer |
| JP2021502574A (en) * | 2017-11-10 | 2021-01-28 | クリニカイ インコーポレイテッド | Systems, constructs and methods for detecting spectral biomarkers and patterns of disease from stool samples |
| FR3078620A1 (en) * | 2018-03-09 | 2019-09-13 | Institut Georges Lopez | DEVICE FOR QUANTIFYING THE RATE OF LIPIDS AND / OR PROTEINS IN THE HEPATIC TISSUE |
| CN108398418B (en) * | 2018-03-16 | 2020-12-04 | 华东理工大学 | An internal reference surface-enhanced Raman test paper, preparation method and application |
| EP3775759B1 (en) * | 2018-04-06 | 2024-12-11 | Braskem America, Inc. | Raman spectroscopy and machine learning for quality control |
| CN110208244B (en) * | 2019-06-18 | 2020-07-28 | 华南理工大学 | Method for testing cell level water content and distribution in fruit and vegetable tissues based on Raman spectrum |
| CA3142126A1 (en) * | 2019-06-20 | 2020-12-24 | National Research Council Of Canada | Broadband raman excitation spectroscopy with structured excitation profiles |
| JP6788298B1 (en) * | 2019-12-17 | 2020-11-25 | 日本分光株式会社 | Raman microscope with fluorescence observation function |
| CN111189817B (en) * | 2020-01-09 | 2021-09-03 | 中国原子能科学研究院 | Laser-induced breakdown spectroscopy true and false signal resolution data analysis method |
| WO2021154991A1 (en) * | 2020-01-29 | 2021-08-05 | King's College London | Raman spectroscopy method and system |
| CN111256819B (en) * | 2020-02-20 | 2022-09-09 | 苏州沓来软件科技有限公司 | Noise reduction method of spectrum instrument |
| GB202004010D0 (en) * | 2020-03-19 | 2020-05-06 | Res & Innovation Uk | Detection of water content in tissue |
| WO2022139465A1 (en) * | 2020-12-22 | 2022-06-30 | 두에이아이(주) | Method for early diagnosis of pancreatic cancer using artificial intelligence raman analysis technique |
| KR102298680B1 (en) | 2021-02-26 | 2021-09-07 | (주)메디띵스 | Method for quantifying water and lipid content in turbid media using narrow-band diffuse reflectance spectroscopy |
| WO2023249962A1 (en) * | 2022-06-20 | 2023-12-28 | Vanderbilt University | Non-contact clinical raman spectroscopy guided probe and applications of same |
| AU2022260547A1 (en) * | 2021-04-22 | 2023-11-02 | Artha Ag | Device and method for spectroscopic monitoring of liquids |
| EP4363831A1 (en) * | 2021-07-01 | 2024-05-08 | Boehringer Ingelheim Vetmedica GmbH | Method for calibrating an optical system |
| US20250003880A1 (en) * | 2021-09-25 | 2025-01-02 | Tornado Spectral Systems Inc. | Raman spectroscopy of chemical processes with spectral blocking filters |
| US20250120582A1 (en) * | 2022-01-21 | 2025-04-17 | Arizona Board Of Regents On Behalf Of The University Of Arizona | Cancer diagnosis method and systems using second harmonic generation measurements |
| EP4537088A1 (en) * | 2022-06-08 | 2025-04-16 | Icahn School of Medicine at Mount Sinai | Systems and methods for dynamic raman profiling of biological diseases and disorders and feature engineering methods thereof |
| CN115308189A (en) * | 2022-07-18 | 2022-11-08 | 上海理工大学 | Biological sample prediction method, biological sample prediction device and storage medium |
| CN116385344A (en) * | 2022-12-30 | 2023-07-04 | 山东大学 | A hand-held cervical cancer image detection method and system based on Raman spectroscopy |
| WO2026064201A1 (en) * | 2024-09-19 | 2026-03-26 | Gyrus Acmi, Inc. D/B/A Olympus Surgical Technologies America | Endoscopically- associated optical sensor verification |
| CN120086746B (en) * | 2025-04-30 | 2025-08-15 | 广东惠丰达电气设备有限公司 | GIS fault gas classification and identification system and method based on spectrum absorption principle |
| CN120778697B (en) * | 2025-09-10 | 2025-11-18 | 国检测试控股集团(安徽)拓维检测服务有限公司 | A method for rapid detection of pollutants in wastewater using atomic fluorescence spectrometry |
Citations (3)
| Publication number | Priority date | Publication date | Assignee | Title |
|---|---|---|---|---|
| JP2007090044A (en) * | 2005-08-31 | 2007-04-12 | Olympus Corp | Optical imaging device |
| US20110295062A1 (en) * | 2008-12-11 | 2011-12-01 | Fundacio Clinic Per A La Recerca Biomedica Fcrb | Equipment for infrared vision of anatomical structures and signal processing methods thereof |
| WO2014007759A1 (en) * | 2012-07-02 | 2014-01-09 | National University Of Singapore | Methods related to real-time cancer diagnostics at endoscopy utilizing fiber-optic raman spectroscopy |
Family Cites Families (5)
| Publication number | Priority date | Publication date | Assignee | Title |
|---|---|---|---|---|
| US7697576B2 (en) * | 2004-05-05 | 2010-04-13 | Chem Image Corporation | Cytological analysis by raman spectroscopic imaging |
| US20120057145A1 (en) * | 2008-08-18 | 2012-03-08 | Tunnell James W | Systems and methods for diagnosis of epithelial lesions |
| US8300220B2 (en) * | 2009-02-25 | 2012-10-30 | Vanderbilt University | Device and method for non-invasively evaluating a target of interest of a living subject |
| JP2013517485A (en) * | 2010-01-22 | 2013-05-16 | ブリティッシュ コロンビア キャンサー エージェンシー ブランチ | Apparatus and method for characterizing lung tissue by Raman spectroscopy |
| GB201302886D0 (en) * | 2013-02-19 | 2013-04-03 | Univ Singapore | Diagnostic instrument and method |
-
2015
- 2015-07-02 US US15/322,874 patent/US20170138860A1/en not_active Abandoned
- 2015-07-02 AU AU2015284810A patent/AU2015284810B2/en not_active Ceased
- 2015-07-02 CN CN201580046151.3A patent/CN106793917B/en not_active Expired - Fee Related
- 2015-07-02 SG SG11201702715UA patent/SG11201702715UA/en unknown
- 2015-07-02 WO PCT/SG2015/050195 patent/WO2016003371A1/en not_active Ceased
- 2015-07-02 ES ES15814823T patent/ES2847230T3/en active Active
- 2015-07-02 EP EP15814823.9A patent/EP3164046B1/en active Active
- 2015-07-02 JP JP2016575728A patent/JP6768529B2/en not_active Expired - Fee Related
- 2015-07-02 KR KR1020177002888A patent/KR102409070B1/en not_active Expired - Fee Related
Patent Citations (3)
| Publication number | Priority date | Publication date | Assignee | Title |
|---|---|---|---|---|
| JP2007090044A (en) * | 2005-08-31 | 2007-04-12 | Olympus Corp | Optical imaging device |
| US20110295062A1 (en) * | 2008-12-11 | 2011-12-01 | Fundacio Clinic Per A La Recerca Biomedica Fcrb | Equipment for infrared vision of anatomical structures and signal processing methods thereof |
| WO2014007759A1 (en) * | 2012-07-02 | 2014-01-09 | National University Of Singapore | Methods related to real-time cancer diagnostics at endoscopy utilizing fiber-optic raman spectroscopy |
Non-Patent Citations (2)
| Title |
|---|
| BERGHOLT, MS ET AL: ""DEVELOPMENT OF A MULTIPLEXING FINGERPRINT AND HIGH WAVENUMBER RAMAN SPECTROSCOPY TECHNIQUE FOR REAL", JOURNAL OF BIOMEDICAL OPTICS, vol. 18, no. 3, JPN6019021537, 28 February 2013 (2013-02-28), pages 030502, ISSN: 0004251953 * |
| DURAIPANDIAN, S ET AL: ""SIMULTANEOUS FINGERPRINT AND HIGH-WAVENUMBER CONFOCAL RAMAN SPECTROSCOPY ENHANCES EARLY DETECTION O", ANALYTICAL CHEMISTRY, vol. 84, no. 14, JPN6019021536, 20 July 2012 (2012-07-20), pages 5913 - 5919, ISSN: 0004251952 * |
Cited By (11)
| Publication number | Priority date | Publication date | Assignee | Title |
|---|---|---|---|---|
| WO2019073733A1 (en) * | 2017-10-12 | 2019-04-18 | 富士フイルム株式会社 | Image creation device, image creation method, and image creation program |
| JPWO2019073733A1 (en) * | 2017-10-12 | 2020-10-22 | 富士フイルム株式会社 | Image creation device, image creation method, image creation program |
| JP2021511108A (en) * | 2018-01-17 | 2021-05-06 | オーディーエス メディカル インコーポレイテッドODS Medical Inc. | Systems and methods for real-time Raman spectroscopy for cancer detection |
| JP7257009B2 (en) | 2018-01-17 | 2023-04-13 | オーディーエス メディカル インコーポレイテッド | Systems and methods for real-time Raman spectroscopy for cancer detection |
| KR20200134405A (en) * | 2019-05-22 | 2020-12-02 | 주식회사 나노바이오라이프 | Method for detecting multi-biomarkers of a rapid diagnostic kit and a multimodal scanner using the same |
| KR102251968B1 (en) * | 2019-05-22 | 2021-05-17 | 주식회사 나노바이오라이프 | Method for detecting multi-biomarkers of a rapid diagnostic kit and a multimodal scanner using the same |
| JP2024502229A (en) * | 2020-12-10 | 2024-01-18 | クレオ・メディカル・リミテッド | Raman spectroscopy probe and Raman spectroscopy apparatus including Raman spectroscopy probe and elongated assembly |
| JP2024528161A (en) * | 2021-08-06 | 2024-07-26 | 華東師範大学 | Fiber-optic Raman spectrometer and its construction method and application |
| JP7821521B2 (en) | 2021-08-06 | 2026-02-27 | 華東師範大学 | Fiber-optic Raman photometer, its construction method and applications |
| US20240426757A1 (en) * | 2023-06-26 | 2024-12-26 | Mariposa Technology, Inc. | Spectroscopic Methods and Systems for the Qualitative and Quantitative Analysis of Samples |
| WO2025005160A1 (en) * | 2023-06-30 | 2025-01-02 | ソニー・オリンパスメディカルソリューションズ株式会社 | Medical control device and medical observation system |
Also Published As
| Publication number | Publication date |
|---|---|
| WO2016003371A1 (en) | 2016-01-07 |
| KR20170039168A (en) | 2017-04-10 |
| EP3164046A1 (en) | 2017-05-10 |
| SG11201702715UA (en) | 2017-04-27 |
| AU2015284810A1 (en) | 2017-02-16 |
| EP3164046A4 (en) | 2018-04-25 |
| US20170138860A1 (en) | 2017-05-18 |
| AU2015284810B2 (en) | 2020-03-12 |
| CN106793917B (en) | 2019-04-30 |
| ES2847230T3 (en) | 2021-08-02 |
| EP3164046B1 (en) | 2020-10-28 |
| CN106793917A (en) | 2017-05-31 |
| KR102409070B1 (en) | 2022-06-16 |
| JP6768529B2 (en) | 2020-10-14 |
Similar Documents
| Publication | Publication Date | Title |
|---|---|---|
| JP6768529B2 (en) | Raman spectroscopy systems, devices and methods for analyzing, characterizing, and / or diagnosing sample or tissue types or properties such as overgrowth. | |
| Nogueira et al. | Evaluation of wavelength ranges and tissue depth probed by diffuse reflectance spectroscopy for colorectal cancer detection | |
| Yoon et al. | A clinically translatable hyperspectral endoscopy (HySE) system for imaging the gastrointestinal tract | |
| Duraipandian et al. | Real-time Raman spectroscopy for in vivo, online gastric cancer diagnosis during clinical endoscopic examination | |
| JP6230077B2 (en) | Methods related to real-time cancer diagnosis in endoscopy using fiber optic Raman spectroscopy | |
| Lu et al. | Detection of head and neck cancer in surgical specimens using quantitative hyperspectral imaging | |
| Bergholt et al. | Combining near-infrared-excited autofluorescence and Raman spectroscopy improves in vivo diagnosis of gastric cancer | |
| US8326404B2 (en) | Multimodal detection of tissue abnormalities based on raman and background fluorescence spectroscopy | |
| Wang et al. | Simultaneous fingerprint and high-wavenumber fiber-optic Raman spectroscopy improves in vivo diagnosis of esophageal squamous cell carcinoma at endoscopy | |
| Kiyotoki et al. | New method for detection of gastric cancer by hyperspectral imaging: a pilot study | |
| US8532750B2 (en) | Process and device for detection of precancer tissues with infrared spectroscopy | |
| US20170071509A1 (en) | Systems and methods for diagnosis of middle ear conditions and detection of analytes in the tympanic membrane | |
| US20060184040A1 (en) | Apparatus, system and method for optically analyzing a substrate | |
| CN102740762A (en) | Device and method for characterizing lung tissue by Raman spectroscopy | |
| WO1999037204A1 (en) | Fluorescence imaging endoscope | |
| CN1870929A (en) | Automated endoscopy device, diagnostic method, and uses | |
| WO2012039679A2 (en) | System for near-infrared autofluorescence measurement of a subject, and method thereof | |
| Lin et al. | Shifted-excitation Raman difference spectroscopy for improving in vivo detection of nasopharyngeal carcinoma | |
| Vališ et al. | Automated classification pipeline for real-time in vivo examination of colorectal tissue using Raman spectroscopy | |
| Park et al. | Artificial intelligence-based gastric cancer detection in the gastric submucosal dissection method via hyperspectral imaging | |
| Ralbovsky et al. | Raman Spectroscopy and Advanced Statistics for Cancer Diagnostics | |
| BERGHOLT | REAL-TIME FIBER OPTIC RAMAN SPECTROSCOPY FOR EARLY DIAGNOSIS OF PRECANCER AND CANCER IN VIVO IN THE UPPER GASTROINTESTINAL TRACT | |
| Almond et al. | The Prospects for Real‐Time Raman Spectroscopy for Oesophageal Neoplasia | |
| KAN | Multimodal optical spectroscopy and imaging for improving cancer detection in the head and neck at endoscopy | |
| DURAIPANDIAN | Near-Infrared Confocal Raman Spectroscopy for Real-Time Diagnosis of Cervical Precancer |
Legal Events
| Date | Code | Title | Description |
|---|---|---|---|
| A521 | Request for written amendment filed |
Free format text: JAPANESE INTERMEDIATE CODE: A523 Effective date: 20170123 |
|
| A621 | Written request for application examination |
Free format text: JAPANESE INTERMEDIATE CODE: A621 Effective date: 20180606 |
|
| A131 | Notification of reasons for refusal |
Free format text: JAPANESE INTERMEDIATE CODE: A131 Effective date: 20190611 |
|
| A601 | Written request for extension of time |
Free format text: JAPANESE INTERMEDIATE CODE: A601 Effective date: 20190911 |
|
| A521 | Request for written amendment filed |
Free format text: JAPANESE INTERMEDIATE CODE: A523 Effective date: 20191111 |
|
| A131 | Notification of reasons for refusal |
Free format text: JAPANESE INTERMEDIATE CODE: A131 Effective date: 20200414 |
|
| A521 | Request for written amendment filed |
Free format text: JAPANESE INTERMEDIATE CODE: A523 Effective date: 20200709 |
|
| TRDD | Decision of grant or rejection written | ||
| A01 | Written decision to grant a patent or to grant a registration (utility model) |
Free format text: JAPANESE INTERMEDIATE CODE: A01 Effective date: 20200825 |
|
| A61 | First payment of annual fees (during grant procedure) |
Free format text: JAPANESE INTERMEDIATE CODE: A61 Effective date: 20200923 |
|
| R150 | Certificate of patent or registration of utility model |
Ref document number: 6768529 Country of ref document: JP Free format text: JAPANESE INTERMEDIATE CODE: R150 |
|
| R250 | Receipt of annual fees |
Free format text: JAPANESE INTERMEDIATE CODE: R250 |
|
| R250 | Receipt of annual fees |
Free format text: JAPANESE INTERMEDIATE CODE: R250 |
|
| LAPS | Cancellation because of no payment of annual fees |