JP2016189664A - System stabilization controller and power system control system - Google Patents
System stabilization controller and power system control system Download PDFInfo
- Publication number
- JP2016189664A JP2016189664A JP2015068757A JP2015068757A JP2016189664A JP 2016189664 A JP2016189664 A JP 2016189664A JP 2015068757 A JP2015068757 A JP 2015068757A JP 2015068757 A JP2015068757 A JP 2015068757A JP 2016189664 A JP2016189664 A JP 2016189664A
- Authority
- JP
- Japan
- Prior art keywords
- control
- information
- control device
- measurement
- time
- Prior art date
- Legal status (The legal status is an assumption and is not a legal conclusion. Google has not performed a legal analysis and makes no representation as to the accuracy of the status listed.)
- Granted
Links
Images


Classifications
-
- H—ELECTRICITY
- H02—GENERATION; CONVERSION OR DISTRIBUTION OF ELECTRIC POWER
- H02J—CIRCUIT ARRANGEMENTS OR SYSTEMS FOR SUPPLYING OR DISTRIBUTING ELECTRIC POWER; SYSTEMS FOR STORING ELECTRIC ENERGY
- H02J3/00—Circuit arrangements for ac mains or ac distribution networks
- H02J3/24—Arrangements for preventing or reducing oscillations of power in networks
-
- G—PHYSICS
- G01—MEASURING; TESTING
- G01R—MEASURING ELECTRIC VARIABLES; MEASURING MAGNETIC VARIABLES
- G01R31/00—Arrangements for testing electric properties; Arrangements for locating electric faults; Arrangements for electrical testing characterised by what is being tested not provided for elsewhere
- G01R31/40—Testing power supplies
-
- G—PHYSICS
- G05—CONTROLLING; REGULATING
- G05B—CONTROL OR REGULATING SYSTEMS IN GENERAL; FUNCTIONAL ELEMENTS OF SUCH SYSTEMS; MONITORING OR TESTING ARRANGEMENTS FOR SUCH SYSTEMS OR ELEMENTS
- G05B9/00—Safety arrangements
- G05B9/02—Safety arrangements electric
-
- H—ELECTRICITY
- H02—GENERATION; CONVERSION OR DISTRIBUTION OF ELECTRIC POWER
- H02J—CIRCUIT ARRANGEMENTS OR SYSTEMS FOR SUPPLYING OR DISTRIBUTING ELECTRIC POWER; SYSTEMS FOR STORING ELECTRIC ENERGY
- H02J13/00—Circuit arrangements for providing remote indication of network conditions, e.g. an instantaneous record of the open or closed condition of each circuitbreaker in the network; Circuit arrangements for providing remote control of switching means in a power distribution network, e.g. switching in and out of current consumers by using a pulse code signal carried by the network
- H02J13/00002—Circuit arrangements for providing remote indication of network conditions, e.g. an instantaneous record of the open or closed condition of each circuitbreaker in the network; Circuit arrangements for providing remote control of switching means in a power distribution network, e.g. switching in and out of current consumers by using a pulse code signal carried by the network characterised by monitoring
-
- H—ELECTRICITY
- H02—GENERATION; CONVERSION OR DISTRIBUTION OF ELECTRIC POWER
- H02J—CIRCUIT ARRANGEMENTS OR SYSTEMS FOR SUPPLYING OR DISTRIBUTING ELECTRIC POWER; SYSTEMS FOR STORING ELECTRIC ENERGY
- H02J13/00—Circuit arrangements for providing remote indication of network conditions, e.g. an instantaneous record of the open or closed condition of each circuitbreaker in the network; Circuit arrangements for providing remote control of switching means in a power distribution network, e.g. switching in and out of current consumers by using a pulse code signal carried by the network
- H02J13/00032—Systems characterised by the controlled or operated power network elements or equipment, the power network elements or equipment not otherwise provided for
- H02J13/00034—Systems characterised by the controlled or operated power network elements or equipment, the power network elements or equipment not otherwise provided for the elements or equipment being or involving an electric power substation
-
- H—ELECTRICITY
- H02—GENERATION; CONVERSION OR DISTRIBUTION OF ELECTRIC POWER
- H02J—CIRCUIT ARRANGEMENTS OR SYSTEMS FOR SUPPLYING OR DISTRIBUTING ELECTRIC POWER; SYSTEMS FOR STORING ELECTRIC ENERGY
- H02J2300/00—Systems for supplying or distributing electric power characterised by decentralized, dispersed, or local generation
- H02J2300/20—The dispersed energy generation being of renewable origin
- H02J2300/22—The renewable source being solar energy
- H02J2300/24—The renewable source being solar energy of photovoltaic origin
-
- H—ELECTRICITY
- H02—GENERATION; CONVERSION OR DISTRIBUTION OF ELECTRIC POWER
- H02J—CIRCUIT ARRANGEMENTS OR SYSTEMS FOR SUPPLYING OR DISTRIBUTING ELECTRIC POWER; SYSTEMS FOR STORING ELECTRIC ENERGY
- H02J3/00—Circuit arrangements for ac mains or ac distribution networks
- H02J3/38—Arrangements for parallely feeding a single network by two or more generators, converters or transformers
- H02J3/381—Dispersed generators
-
- Y—GENERAL TAGGING OF NEW TECHNOLOGICAL DEVELOPMENTS; GENERAL TAGGING OF CROSS-SECTIONAL TECHNOLOGIES SPANNING OVER SEVERAL SECTIONS OF THE IPC; TECHNICAL SUBJECTS COVERED BY FORMER USPC CROSS-REFERENCE ART COLLECTIONS [XRACs] AND DIGESTS
- Y02—TECHNOLOGIES OR APPLICATIONS FOR MITIGATION OR ADAPTATION AGAINST CLIMATE CHANGE
- Y02E—REDUCTION OF GREENHOUSE GAS [GHG] EMISSIONS, RELATED TO ENERGY GENERATION, TRANSMISSION OR DISTRIBUTION
- Y02E10/00—Energy generation through renewable energy sources
- Y02E10/50—Photovoltaic [PV] energy
- Y02E10/56—Power conversion systems, e.g. maximum power point trackers
-
- Y—GENERAL TAGGING OF NEW TECHNOLOGICAL DEVELOPMENTS; GENERAL TAGGING OF CROSS-SECTIONAL TECHNOLOGIES SPANNING OVER SEVERAL SECTIONS OF THE IPC; TECHNICAL SUBJECTS COVERED BY FORMER USPC CROSS-REFERENCE ART COLLECTIONS [XRACs] AND DIGESTS
- Y02—TECHNOLOGIES OR APPLICATIONS FOR MITIGATION OR ADAPTATION AGAINST CLIMATE CHANGE
- Y02E—REDUCTION OF GREENHOUSE GAS [GHG] EMISSIONS, RELATED TO ENERGY GENERATION, TRANSMISSION OR DISTRIBUTION
- Y02E40/00—Technologies for an efficient electrical power generation, transmission or distribution
- Y02E40/70—Smart grids as climate change mitigation technology in the energy generation sector
-
- Y—GENERAL TAGGING OF NEW TECHNOLOGICAL DEVELOPMENTS; GENERAL TAGGING OF CROSS-SECTIONAL TECHNOLOGIES SPANNING OVER SEVERAL SECTIONS OF THE IPC; TECHNICAL SUBJECTS COVERED BY FORMER USPC CROSS-REFERENCE ART COLLECTIONS [XRACs] AND DIGESTS
- Y02—TECHNOLOGIES OR APPLICATIONS FOR MITIGATION OR ADAPTATION AGAINST CLIMATE CHANGE
- Y02E—REDUCTION OF GREENHOUSE GAS [GHG] EMISSIONS, RELATED TO ENERGY GENERATION, TRANSMISSION OR DISTRIBUTION
- Y02E60/00—Enabling technologies; Technologies with a potential or indirect contribution to GHG emissions mitigation
-
- Y—GENERAL TAGGING OF NEW TECHNOLOGICAL DEVELOPMENTS; GENERAL TAGGING OF CROSS-SECTIONAL TECHNOLOGIES SPANNING OVER SEVERAL SECTIONS OF THE IPC; TECHNICAL SUBJECTS COVERED BY FORMER USPC CROSS-REFERENCE ART COLLECTIONS [XRACs] AND DIGESTS
- Y04—INFORMATION OR COMMUNICATION TECHNOLOGIES HAVING AN IMPACT ON OTHER TECHNOLOGY AREAS
- Y04S—SYSTEMS INTEGRATING TECHNOLOGIES RELATED TO POWER NETWORK OPERATION, COMMUNICATION OR INFORMATION TECHNOLOGIES FOR IMPROVING THE ELECTRICAL POWER GENERATION, TRANSMISSION, DISTRIBUTION, MANAGEMENT OR USAGE, i.e. SMART GRIDS
- Y04S10/00—Systems supporting electrical power generation, transmission or distribution
- Y04S10/12—Monitoring or controlling equipment for energy generation units, e.g. distributed energy generation [DER] or load-side generation
- Y04S10/123—Monitoring or controlling equipment for energy generation units, e.g. distributed energy generation [DER] or load-side generation the energy generation units being or involving renewable energy sources
-
- Y—GENERAL TAGGING OF NEW TECHNOLOGICAL DEVELOPMENTS; GENERAL TAGGING OF CROSS-SECTIONAL TECHNOLOGIES SPANNING OVER SEVERAL SECTIONS OF THE IPC; TECHNICAL SUBJECTS COVERED BY FORMER USPC CROSS-REFERENCE ART COLLECTIONS [XRACs] AND DIGESTS
- Y04—INFORMATION OR COMMUNICATION TECHNOLOGIES HAVING AN IMPACT ON OTHER TECHNOLOGY AREAS
- Y04S—SYSTEMS INTEGRATING TECHNOLOGIES RELATED TO POWER NETWORK OPERATION, COMMUNICATION OR INFORMATION TECHNOLOGIES FOR IMPROVING THE ELECTRICAL POWER GENERATION, TRANSMISSION, DISTRIBUTION, MANAGEMENT OR USAGE, i.e. SMART GRIDS
- Y04S10/00—Systems supporting electrical power generation, transmission or distribution
- Y04S10/30—State monitoring, e.g. fault, temperature monitoring, insulator monitoring, corona discharge
Abstract
Description
本発明は、系統安定化制御装置および電力系統制御システムに関する。 The present invention relates to a system stabilization control device and a power system control system.
電力系統は、多くの発電機、負荷、送配電機器および制御装置から構成されている。定常状態においては、負荷変動および系統切替などによる微小な外乱が電力系統に加えられる。系統の地絡や短絡のような故障発生時には、大きな外乱が電力系統に加えられる。これらの外乱を原因として、複数の動揺モード成分を持つ電力動揺が発生する。 The power system is composed of many generators, loads, power transmission / distribution equipment, and control devices. In the steady state, minute disturbances due to load fluctuations and system switching are applied to the power system. When a fault such as a system ground fault or short circuit occurs, a large disturbance is applied to the power system. Due to these disturbances, power fluctuations having a plurality of fluctuation mode components occur.
この動揺モード成分が小さい場合、又は高速に減衰する場合には、外乱発生後に系統動揺は十分小さい範囲に保たれるため、電力系統は安定な状態にある。しかし動揺が大きくなったり、減衰が収束せず持続や発散する場合は、結果として発電機が停止したり、広域停電が発生したりして、安定運用が不可能となる可能性がある。 When this fluctuation mode component is small or decays at a high speed, the system fluctuation is kept in a sufficiently small range after the occurrence of the disturbance, so that the power system is in a stable state. However, if the sway becomes large or the attenuation does not converge and continues or diverges, the generator may stop as a result, or a wide-area power outage may occur, which may make stable operation impossible.
電力系統規模の拡大とともに、電源容量増大、遠隔地化、偏在化およびこれに伴う送電線の長距離化、重潮流化が進む傾向にある。これらの変化による影響は電力系統の安定度を低下させる方向に働くため、系統故障時の発電機脱調を発端とした大規模電源脱落および広域停電への連鎖的な影響の拡大が懸念される。 Along with the expansion of the scale of the power system, there is a tendency for power supply capacity to increase, remote areas, uneven distribution, and the transmission lines to be extended and heavy tides. Since the impact of these changes works to reduce the stability of the power system, there is concern that the power supply will be out of sequence at the time of a system failure and that the large-scale power supply will drop and the chain effect on wide-area power outages will increase. .
そのため系統の安定度を常時監視し、広域停電への波及を未然に予防、予測するオンラインによる系統安定化制御手法が必要となる。 For this reason, an on-line system stabilization control method that constantly monitors the stability of the system and prevents and predicts the spread to wide-area power outages is required.
近年、GPS(Global Positioning System)を用いた同期計測により、ほぼリアルタイムに電力系統の母線電圧位相角を測定する位相検出器PMU(Phasor Measurement Unit)が普及しつつある。位相検出器PMUにより計測した系統母線電圧などのオンライン計測値を用いて、電力動揺現象をリアルタイムに把握することが可能になりつつある。 In recent years, a phase detector PMU (phasor measurement unit) that measures a bus voltage phase angle of a power system almost in real time by synchronous measurement using GPS (global positioning system) is becoming widespread. It is becoming possible to grasp the power fluctuation phenomenon in real time using online measurement values such as the system bus voltage measured by the phase detector PMU.
上記の背景の元、電力系統を運用する事業者が系統の状態を監視し安定化するための系統安定化制御技術が提案されている。例えば、特許文献1には、「複数台の発電機群が接続された電力系統の系統故障により前記電力系統の多くの発電機が不安定となる現象を前記電力系統に接続された制御対象発電所の一部の発電機を高速に遮断することにより安定化する電力系統安定化装置において、前記系統故障発生前の定常状態時に前記電力系統を前記制御対象発電所内の発電機群とその他の主電力系統内の発電機群との2機系モデルで等価的に表現しその場合の発電機定数と初期状態量とを数分程度の定周期で算出する2機系モデル作成手段と、前記系統故障発生を起動条件に前記制御対象発電所の電圧と電流及び電力を検出する電気量検出手段と、前記電気量検出手段で検出された電気量を入力し前記系統故障除去後に前記制御対象発電所の母線から前記主電力系統を見た場合の外部リアクタンスを演算する外部リアクタンス推定手段と、前記2機系モデル作成手段で算出された発電機定数及び初期状態量と前記外部リアクタンス推定手段により算出された外部リアクタンスと前記電気量検出手段により検出された電気量に基づいて前記制御対象発電所内の発電機群とその他の前記主電力系統内の発電機群の動きを等価的に表す2台の等価発電機の動揺を演算しその演算結果と予め設定されている各発電機の電制優先順位により拡張等面積法により安定化に必要な電制発電機を決定する電制発電機決定手段と、前記電制発電機決定手段で選択された発電機を前記電力系統より解列する制御手段とを備えたことを特徴とする」という記載がある。
Based on the above background, a system stabilization control technique for a business operator operating the power system to monitor and stabilize the state of the system has been proposed. For example,
近年、太陽光発電や風力発電に代表される再生可能エネルギーが系統に大量導入されつつある。それらの再生可能エネルギーは急峻かつ事前想定困難な発電出力変動を伴い、この結果として、系統特性が大きく変化する可能性がある。例えば、風速がある閾値を超えた場合、機器の安全性を保つために自動的に風力発電を停止し、発電出力をゼロとするカットアウトという動作が発生する。このような事象は、従来の系統においても発生した短絡・地絡故障と比較して発生頻度が高く、発電機が近接した地域に密集して設置された場合には、複数の発電機において同時発生する可能性が高いと予想される。 In recent years, a large amount of renewable energy represented by solar power generation and wind power generation is being introduced into the system. These renewable energies are accompanied by steep and unpredictable power generation output fluctuations, and as a result, the system characteristics may change greatly. For example, when the wind speed exceeds a certain threshold value, a wind-out operation is automatically stopped to maintain the safety of the device, and an operation called cut-out is performed in which the power generation output is zero. Such events occur more frequently than conventional short-circuit / ground faults in conventional systems. When the generators are installed close together in a nearby area, they are This is expected to occur.
再生可能エネルギーの導入量が増大するにつれ、上記のような急峻な出力変動イベントによる系統へのインパクトが増大し、広域の動揺モードが不安定化する懸念がある。これに対処するため、出力変動イベント直後数秒から十数秒程度の中間領域における高速・高精度の安定判別に基づく安定化制御が必要となる。 As the amount of renewable energy introduced increases, there is a concern that the impact on the system due to such a steep output fluctuation event will increase, and the shaking mode in a wide area will become unstable. In order to cope with this, stabilization control based on high-speed and high-precision stability determination in an intermediate region of about several seconds to several tens of seconds immediately after the output fluctuation event is necessary.
さらに、高速な安定化制御のためには、発生する不安定な動揺モードごとに、安定化が可能となる制御手法をオンラインに選択する必要がある。この点に関し、特許文献1に記載の技術では、高速かつ高精度な安定化制御を実現することが困難である。
Furthermore, for high-speed stabilization control, it is necessary to select online a control method that enables stabilization for each unstable oscillation mode that occurs. In this regard, it is difficult for the technique described in
以上のことから本発明の目的は、高速かつ高精度な安定化制御を実現できる系統安定化制御装置および電力系統制御システムを提供することである。 In view of the above, an object of the present invention is to provide a system stabilization control device and a power system control system capable of realizing high-speed and highly accurate stabilization control.
上記課題を解決するために本発明においては、電力系統内の複数計測点における計測情報に基づき、電力系統内に設置された制御機器を制御する系統安定化制御装置であって、電力系統に連系される系統設備の情報を格納する設備情報データベースと、系統設備の情報に基づき制御機器の制御優先度を決定する制御優先度決定部と、複数計測地点における計測情報および制御優先度に基づき制御対象を決定する制御対象決定部と、複数計測地点における計測情報から電力系統の不安定化時間を算出する不安定化時間算出部と、不安定化時間および系統設備の情報に基づき制御機器の制御時間を決定する制御時間決定部と、を備えることを特徴とする。 In order to solve the above problems, the present invention provides a system stabilization control device that controls a control device installed in a power system based on measurement information at a plurality of measurement points in the power system. Equipment information database that stores information on the system equipment to be connected, a control priority determination unit that determines the control priority of the control device based on the information on the system equipment, and control based on measurement information and control priority at multiple measurement points Control target control unit based on information on destabilization time and system equipment, control target determination unit for determining target, destabilization time calculation unit for calculating power system destabilization time from measurement information at multiple measurement points And a control time determining unit that determines time.
また本発明においては、電力系統内の複数計測点における計測情報に基づき、電力系統内に設置された制御機器を制御する系統安定化制御装置であって、電力系統に連系される制御機器を含む系統設備の設備情報を格納する設備情報データベースと、設備情報に基づき制御機器の制御優先度を決定する制御優先度決定部と、計測情報から検知した電力系統動揺の動揺計測点と制御機器の距離と、優先度に応じて制御すべき制御機器を決定する制御対象決定部と、計測情報から検知した電力系統動揺の不安定化時間を算出する不安定化時間算出部と、不安定化時間および設備情報に基づき制御時間を決定する制御時間決定部を備え、決定した制御機器に対して決定した制御時間の制御を実行することを特徴とする。 Further, in the present invention, a system stabilization control device for controlling a control device installed in the power system based on measurement information at a plurality of measurement points in the power system, the control device linked to the power system is provided. The equipment information database that stores the equipment information of the system equipment, the control priority determination unit that determines the control priority of the control equipment based on the equipment information, the fluctuation measurement point of the power system fluctuation detected from the measurement information, and the control equipment Control target determination unit that determines a control device to be controlled according to distance and priority, destabilization time calculation unit that calculates the destabilization time of power system oscillation detected from measurement information, and destabilization time And a control time determining unit that determines the control time based on the facility information, and performing control of the determined control time on the determined control device.
また本発明は、電力系統内の複数計測点における計測情報を第1の通信手段を介して系統安定化制御装置に得、電力系統を構成する系統設備内の制御機器に対して第2の通信手段を介して系統安定化制御装置から制御指令を与える電力系統制御システムであって、系統安定化制御装置は、電力系統に連系される系統設備の情報を格納する設備情報データベースと、系統設備の情報に基づき制御機器の制御優先度を決定する制御優先度決定部と、複数計測地点における計測情報および制御優先度に基づき制御対象を決定する制御対象決定部と、複数計測地点における計測情報から電力系統の不安定化時間を算出する不安定化時間算出部と、不安定化時間および設備情報に基づき制御時間を決定する制御時間決定部と、決定した制御機器と決定した制御時間を含む制御指令を第2の通信手段を介して与える出力部を備えることを特徴とする。 In addition, the present invention obtains measurement information at a plurality of measurement points in the power system to the system stabilization control device via the first communication means, and performs the second communication with respect to the control equipment in the system equipment constituting the power system. A power system control system for giving a control command from the system stabilization control device via the means, the system stabilization control device comprising: a facility information database for storing information on system facilities linked to the power system; A control priority determination unit that determines the control priority of the control device based on the information of the control device, a control target determination unit that determines a control target based on the measurement information and the control priority at a plurality of measurement points, and measurement information at the plurality of measurement points. Determine the destabilization time calculation unit that calculates the power system destabilization time, the control time determination unit that determines the control time based on the destabilization time and facility information, and the determined control device. Characterized in that it comprises an output unit for providing a control command including control time through the second communication means.
本発明によれば、高速かつ高精度な安定化制御を実現できる系統安定化制御装置および電力系統制御システムとすることができる。 ADVANTAGE OF THE INVENTION According to this invention, it can be set as the system | strain stabilization control apparatus and electric power system control system which can implement | achieve high-speed and highly accurate stabilization control.
本発明の実施例について、図面を参照しながら以下詳細に説明する。尚、下記はあくまでも実施の例に過ぎず、下記具体的内容に発明自体が限定されることを意図する趣旨ではない。 Embodiments of the present invention will be described below in detail with reference to the drawings. It should be noted that the following is merely an example of implementation and is not intended to limit the invention itself to the following specific contents.
図1は、本発明の実施例に係る系統安定化制御装置の機能構成例を示す図である。 FIG. 1 is a diagram illustrating a functional configuration example of a system stabilization control apparatus according to an embodiment of the present invention.
本実施例に係る系統安定化制御装置200は、系統安定化制御決定部10と、情報記憶部30を含む。このうち系統安定化制御決定部10は、系統計測部20に接続されている。系統計測部20は、複数の地点の計測情報を計測する計測装置21(21a、21b、・・・21n)で構成されている。情報記憶部30は、設備情報データベースDBに設備情報を格納する。なお以下の説明において、符号のアルファベットによって要素を区別する必要がない場合、符号のアルファベットを省略することがある。
The system
系統安定化制御決定部10は、計測情報収集部11と、動揺検出部12と、制御優先度決定部13と、制御対象決定部14と、不安定化時間算出部15と、制御時間決定部16を含む。
The system stabilization
計測情報収集部11は、系統計測部20の計測装置21において計測された複数の地点の計測情報(系統状態量)を、情報通信ネットワークを介して受信し、収集する。
The measurement
動揺検出部12は、計測情報収集部11により収集された計測情報に基づいて、特定の種別の計測情報(計測種別)に対し、計測地点毎に、電力の動揺の周波数成分である動揺成分を示す検出動揺情報を算出する。
Based on the measurement information collected by the measurement
制御優先度決定部13は、設備情報データベースDBに記憶された設備情報に基づいて複数の設備の制御性能を算出し、その制御性能に基づき設備毎の制御優先度を決定する。
The control
制御対象決定部14は、制御優先度決定部13において決定された制御優先度及び動揺検出部12において算出された検出動揺情報に基づき制御対象を決定する。
The control
不安定化時間算出部15は、動揺検出部12において算出された検出動揺情報に基づき、系統が不安定化する限界時間である不安定化時間を算出する。
The destabilization
制御時間決定部16は、設備情報及び不安定化時間算出部において算出された不安定化時間算出部に基づき制御対象を決定する。
The control
なお系統安定化制御装置200には、モニタ202やキーボードなどの入力操作機器が備えられ、使用者が適宜内部処理内容を確認可能であり、かつ適宜必要な設定などの入力処理が行えるものとされている。
The system
系統計測部20は、系統内の計測地点における計測情報を計測し、計測情報収集部11に送信する。計測情報は、有効電力潮流、無効電力潮流、系統電圧、系統電流、電圧位相の中の少なくとも一つの種別を含む。系統計測部20は、複数の計測地点に夫々配置された計測装置21a、21b、・・・、21nを含む。計測装置21は、例えばPMU(Phasor Measurement Unit)等であり、電力に関する定期的な計測を行い、時系列の計測情報を送信する。
The
情報記憶部30内の設備情報データベースDBには、電力系統に連系している系統要素の接続情報を示す設備情報を格納する。設備情報には、計測地点の近傍に連系している発電機、負荷、調相機器など系統内の各ノードに接続される系統要素(電力機器)の特性を示す情報(ノード情報D1)と、各ノード間を接続する送電線のインピーダンス等を示す情報(送電線情報D2)と、複数の計測地点の緯度及び経度やトポロジー等の位置関係を示す情報(計測設備情報D3)との何れかが含まれる。これにより、計測地点間の電気的距離を算出することができ、計測地点を電気的距離で分類することができる。なお、ノード情報D1と、送電線情報D2と、計測設備情報D3について、図9、図10、図11に例示して別途詳細に説明を行う。
The facility information database DB in the
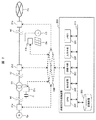
図2は、本発明の実施例に係る電力系統制御システムの構成例を示す図である。 FIG. 2 is a diagram illustrating a configuration example of the power system control system according to the embodiment of the present invention.
図2に示すように、本発明の実施例に係る電力系統制御システムは、発電機Gと、ノード(母線)N(N1、N2、N3)と、変電所SSと、調相機器Cと、電力負荷LDと、外部電力系統PSと、計測装置21(21a、21b、・・・21e)と、情報通信ネットワーク108と、系統安定化制御装置200と、を含む。以下、発電機Gと、変電所SSと、調相機器Cと、電力負荷LDと、計測装置21(21a、21b、・・・21e)を含む電力系統を自系統と呼ぶことがある。
As shown in FIG. 2, the power system control system according to the embodiment of the present invention includes a generator G, a node (bus) N (N1, N2, N3), a substation SS, a phase adjusting device C, The power load LD, the external power system PS, the measuring device 21 (21a, 21b,... 21e), the
発電機Gは、発電力を生じる発電機であり、火力発電、水力発電、原子力発電、太陽光発電、風力発電、バイオマス発電、潮流発電を含む何れかの発電手法により発電力を生じる発電機である。 The generator G is a generator that generates electric power, and is a generator that generates electric power by any of the power generation methods including thermal power generation, hydroelectric power generation, nuclear power generation, solar power generation, wind power generation, biomass power generation, and tidal current power generation. is there.
発電機Gaは、電力系統において変電所SSの高電圧側に設置される火力発電、水力発電、原子力発電などを含む大規模発電機であり、計測装置21aおよび情報通信ネットワーク108を通じて発電量を含む系統状態量を系統安定化制御装置200に送信する。また、発電機Gaは、計測装置21aおよび情報通信ネットワーク108を通じて系統安定化制御装置200より送信された制御指令情報を受信し、制御指令情報に応じて発電量を含む系統状態量を変化させる。
The generator Ga is a large-scale generator including thermal power generation, hydroelectric power generation, nuclear power generation and the like installed on the high voltage side of the substation SS in the power system, and includes the amount of power generation through the measuring
発電機Gbは、電力系統において変電所SSの低電圧側に設置される太陽光発電、風力発電、コジェネレーションなどを含む中小規模発電機であり、計測装置21bおよび情報通信ネットワーク108を通じて発電量を含む系統状態量を系統安定化制御装置200に送信する。
The generator Gb is a small-scale generator including solar power generation, wind power generation, cogeneration, and the like installed on the low voltage side of the substation SS in the power system. The power generation amount is generated through the measuring
変電所SSは、電力系統内の送電線間に設置され、大規模発電機である発電機Gaが設置される高電圧側より送電される電力の電圧値を変更し、電力負荷LDが設置されている低電圧側に送電する。変電所SSには、電力コンデンサ、分路リアクトルなどの調相機器Cが接続される。 The substation SS is installed between transmission lines in the power system, changes the voltage value of the power transmitted from the high voltage side where the generator Ga, which is a large-scale generator, is installed, and the power load LD is installed. Power is transmitted to the low voltage side. A phase adjusting device C such as a power capacitor or a shunt reactor is connected to the substation SS.
調相機器Cは、電力系統内における無効電力を変化させることにより、電力系統内の電圧分布を制御する機器であり、電力コンデンサ、分路リアクトル、STATCOM(Static Synchronous Compensator:自励式無効電力補償装置)、SVC(Static Var Compensator:静止型無効電力補償装置)、などを含む。一部の調相機器Cは、計測装置21cおよび情報通信ネットワーク108を通じて系統安定化制御装置200より送信された制御指令情報を受信し、制御指令情報に応じて発電量を含む系統状態量を変化させる。
The phase adjusting device C is a device that controls the voltage distribution in the power system by changing the reactive power in the power system, and includes a power capacitor, a shunt reactor, STATCOM (Static Synchronous Compensator: self-excited reactive power compensator). ), SVC (Static Var Compensator), and the like. Some phase adjusting devices C receive the control command information transmitted from the system
電力負荷LDは、電力を消費する電動機や照明器具などを含む施設であり、家庭、工場、ビルなどの施設を表す。 The power load LD is a facility that includes an electric motor or a lighting device that consumes electric power, and represents a facility such as a home, factory, or building.
外部電力系統PSは、系統安定化制御装置200からの制御が不可能である外部の電力系統であり、連系線により自系統と接続されている。
The external power system PS is an external power system that cannot be controlled by the system
計測装置21(21a、21b、・・・21e)は、発電機Gaにおける発電量、調相機器Cにおける調相量、送電線における潮流値、電圧値、などの系統状態量を計測するセンサを含み、計測した系統状態量を、情報通信ネットワーク108を通じて系統安定化制御装置200に送信する。
The measuring device 21 (21a, 21b,... 21e) is a sensor that measures a system state quantity such as a power generation amount in the generator Ga, a phase adjustment amount in the phase adjusting device C, a power flow value in the transmission line, and a voltage value. In addition, the measured system state quantity is transmitted to the system
情報通信ネットワーク108は、双方向にデータを伝送可能なネットワークである。情報通信ネットワーク108は、例えば、有線ネットワーク若しくは無線ネットワーク、又はそれらの組合せである。情報通信ネットワーク108は、いわゆるインターネットであっても良いし、専用線のネットワークであっても良い。
The
系統安定化制御装置200は、図1に示す系統安定化制御機能を実現するための装置である。系統安定化制御装置200は、計測装置21(21a、21b、・・・21e)において計測された系統状態量を、情報通信ネットワーク108を通じて受信する。また、系統安定化制御装置200は、送信された系統の系統状態量および内部に蓄積された情報を用いて算出した制御指令情報を、情報通信ネットワーク108を通じて計測装置21に送信する。
The system
系統安定化制御装置200は、その内部構成として、CPU(Central Processing Unit)201と、表示装置202と、通信手段203と、入力手段204と、メモリ205と、記憶装置206と、がバス線211に接続されている。CPU201は、記憶装置206に格納された計算プログラムを実行して、系統状態の算出や、制御信号の生成、画像データの生成などを行い、画像データを表示装置202に表示させる。メモリ205は、表示用の画像データ、系統状態の算出結果データなどを一旦格納するメモリであり、例えば、RAM(Random Access Memory)などである。通信手段203は、情報通信ネットワーク108を通じて計測装置21から潮流値、電圧値などの系統状態量を取得する。計測情報収集部11は、通信手段203を用いて、複数の計測装置21で計測された時系列の計測情報を受信する。
The system
系統安定化制御装置200のユーザ(管理者)は、入力手段204の所定のインタフェースを通じて各種閾値などのパラメータを設定又は変更し、自系統の系統安定化制御装置200の動作を適切に設定できる。また、ユーザは、入力手段204の所定のインタフェースを通じて確認したいデータの種類を選択し、表示装置202に表示させることができる。
The user (administrator) of the system
記憶装置206は、各種プログラムおよびデータを保持する。記憶装置206は、例えば、HDD(Hard Disk Drive)又はフラッシュメモリ等である。記憶装置206は、例えば、後述する各種機能を実現し得るプログラムおよびデータ等を保持する。記憶装置206に記憶されているプログラムおよびデータは、必要に応じてCPU201に読み出されて実行される。なお、記憶装置206は、情報記憶部30を実現し、各種のデータベース(DB)を格納する。
The
図3は、系統安定化制御決定処理を示すフロー図である。図3の各処理判断フローは、図1の系統安定化制御決定部10の各部に対応している。具体的には、図3の処理ステップS10が図1の動揺検出部12、処理ステップS20が制御優先度決定部、処理ステップS30が制御対象決定部14、処理ステップS40が不安定化時間算出部15、処理ステップS50が制御時間決定部16にそれぞれ対応している。図1と図3は上記の対応関係にあるので、以下の説明においてはこれらを対比して説明する。
FIG. 3 is a flowchart showing the system stabilization control determination process. Each process determination flow in FIG. 3 corresponds to each part of the system stabilization
まず、図1の動揺検出部12(図3の処理ステップS10)では、系統計測部20により計測された複数地点の計測情報を用いて、検出動揺情報を算出する。
First, in the
ここで、系統計測部20により計測された複数地点の計測情報は、有効電力潮流、無効電力潮流、系統電圧、系統電流、電圧位相のうち少なくとも一つの計測種別の情報を含む。系統安定化制御装置200は、特定の一つの計測種別に対して系統安定化制御決定処理を行ってもよいし、複数の計測種別に対して系統安定化制御決定処理を行ってもよい。本処理における検出動揺情報の算出には、周波数解析に用いるアルゴリズム、すなわち、フーリエ解析、ウェーブレット解析、プローニー法、Matrix Pencil法、HTLS(Hankel Total Least Squares)法を例とするアルゴリズムのうちの少なくとも一つを適用する。
Here, the measurement information of a plurality of points measured by the
以下、プローニー法による動揺情報算出アルゴリズムについて説明する。プローニー法による動揺情報算出アルゴリズムでは、以下の(1)式から(12)式を実行する。なおこれらの式を実行するにあたり、解析窓幅のデータ数N、モード次数nは、事前に設定されているものとする。 Hereinafter, a fluctuation information calculation algorithm based on the Plowney method will be described. In the shaking information calculation algorithm by the Pawnee method, the following equations (1) to (12) are executed. In executing these equations, it is assumed that the analysis window width data number N and mode order n are set in advance.
動揺検出部12では、最初に各地点の計測情報である入力データy(k)(k=0、1、:、N−1)を用いて、以下の(1)式〜(4)式を実行し、行列a=(a1、a2、:、an)Tを算出する。ただし、上付き文字の”T”は転置行列を、上付き文字の”−1”は逆行列を示す。
First, the
ここで、(1)式は自己回帰モデル係数ベクトルaを算出する数式であり、(2)式は(1)式の自己回帰モデル係数ベクトルaの定義式、(3)式は(1)式のXの定義式、(4)式は(1)式のYの定義式である。なお(3)式において、kは時刻、yは入力である計測値(計測装置21として例えばPMUからの値)、nは事前に設定されたモード次数、Nは事前に設定された解析窓幅(信号処理のために、計測値をバッフアリングするデータサイズの意味)である。 Here, Equation (1) is an equation for calculating the autoregressive model coefficient vector a, Equation (2) is a definition equation for the autoregressive model coefficient vector a in Equation (1), and Equation (3) is Equation (1). The definition formula of X in the formula (4) is the definition formula of Y in the formula (1). In equation (3), k is time, y is an input measurement value (value from the PMU, for example, as the measuring device 21), n is a preset mode order, and N is a preset analysis window width. (Meaning the data size for buffering measured values for signal processing).
![]()
![]()

次に動揺検出部12では、(5)式〜(7)式を実行して、固有値λを算出する。ここで(5)式は(1)式で算出した自己回帰モデル係数(a1、a2、・・、an)を用いて固有値を算出する特性方程式、(6)式は解Zと固有値λの関係式、(7)式は固有値λと減衰係数σ、同様化周波数ωの関係式である。
Next, the
具体的にはまず、上記(1)〜(4)式により算出した自己回帰モデル係数(a1、a2、・・、an)を、以下の(5)式に代入する。(5)式は、Ziを解とするn次の多項式(特性方程式)であり、n個のZi、σi、fiがそれぞれ解として求められる。 Specifically, first, the autoregressive model coefficients (a 1 , a 2 ,..., A n ) calculated by the above formulas (1) to (4) are substituted into the following formula (5). (5) is an n-order polynomial to a solution of Z i (characteristic equation), n pieces of Z i, σ i, f i are obtained as a solution, respectively.
その後、動揺検出部12では、(5)式の特性方程式の解Zに、(6)式及び(7)式の形式で表されるZiを代入し、固有値λi、減衰係数(減衰率)σi[1/sec]、動揺周波数fi[Hz]=ωi/2πを算出する。ここでΔtはサンプリング周期を表す。
Thereafter, the
![]()
![]()
![]()
![]()
![]()
![]()
次に動揺検出部12では、入力データy(k)(k=0、1、・・、N−1)、および算出したZi(i=1、2、・・、n)を用いて、以下の(8)式〜(11)式から、行列b=(B1、B2、・・、Bn)Tを算出する。ここで(8)式は複素振幅ベクトルbを算出する数式、(9)式は(8)式のベクトルbの定義式、(10)式は(8)式の解Zとの定義式、(11)式は(8)式のwの定義式である。なお(8)式において要素は各動揺モードの複素振幅Bであり、(11)式においてyは計測値である。
Next, the
![]()
![]()
最後に動揺検出部12では、(8)式〜(11)式から算出した複素振幅B(B1、B2、:、Bn)から、(12)式で表される絶対値Ri、偏角θiを求める。このとき、絶対値Riが振幅を、偏角θiが初期位相を意味する。なお(12)式は、複素振幅Bと振幅R、位相θの関係式である。
Finally, in the
![]()
![]()
以上の処理により、動揺周波数、減衰係数、振幅、初期位相を含む検出動揺情報が得られる。検出動揺情報が、動揺周波数、減衰係数、及び振幅の一つを含むことにより、各計測地点における動揺成分を表すことができる。また、このような検出動揺情報を用いることにより、将来の動揺成分を予測することができる。 Through the above processing, detected shaking information including a shaking frequency, an attenuation coefficient, an amplitude, and an initial phase is obtained. When the detected shaking information includes one of the shaking frequency, the attenuation coefficient, and the amplitude, the shaking component at each measurement point can be expressed. Further, by using such detected shaking information, a future shaking component can be predicted.
図4は、上記(1)式から(12)式の処理により求められた各計測地点における動揺成分を記憶する検出動揺情報テーブルTB1の記憶内容を示す図である。 FIG. 4 is a diagram showing the stored contents of the detected shaking information table TB1 that stores the shaking component at each measurement point obtained by the processing of the above equations (1) to (12).
図4の検出動揺情報テーブルTB1は、検出動揺情報毎のエントリを有する。一つの検出動揺情報に対応するエントリは、当該検出動揺情報を識別するための検出動揺識別情報(図中の動揺名称)100と、当該検出動揺情報により表される動揺の特性を示す動揺特性101とを含む。検出動揺識別情報100は、入力データに対応する計測地点の名称100aと、当該検出動揺情報のモードを示す検出動揺情報番号(No.)100bとを含む。
The detected shaking information table TB1 in FIG. 4 has an entry for each detected shaking information. An entry corresponding to one detected shake information includes detected shake identification information (swing name in the figure) 100 for identifying the detected shake information, and a shake characteristic 101 indicating a shake characteristic represented by the detected shake information. Including. The detected
上記のプローニー法を用いて検出動揺情報が算出される場合、1計測地点の1種別の計測情報につき、モード次数nと同数の検出動揺情報が算出される。従って、p個の地点(p≧1)の各地点において、q個の種別(q≧1)の計測情報を使用した場合、n×p×q個の検出動揺情報が算出される。動揺特性101は、算出された動揺周波数102、減衰係数103、振幅L、初期位相105を含む。
When the detected shaking information is calculated using the above-mentioned Plowney method, the same number of detected shaking information as the mode order n is calculated for one type of measurement information at one measurement point. Therefore, when q types of measurement information (q ≧ 1) are used at each of the p points (p ≧ 1), n × p × q pieces of detected motion information are calculated. The
このようにして動揺検出部12(図3の処理ステップS10)では、検出動揺情報を算出しているが、これはさらに以下のような加工情報として利用することが可能である。加工情報の一例は、動揺影響度であり、図3では動揺影響度を求める処理ステップをS10Aとして点線で示している。 In this way, the motion detection unit 12 (processing step S10 in FIG. 3) calculates detected motion information, which can be further used as the following processing information. An example of the processing information is the degree of shaking influence. In FIG. 3, the processing step for obtaining the degree of shaking influence is indicated by a dotted line as S10A.
動揺検出部12の処理ステップS10Aでは、処理ステップS10で求めた検出動揺情報と、情報記憶部30に格納された設備情報データベースDBのデータに基づき、同一と判別される動揺成分毎に関連する複数計測地点を抽出し、動揺成分の影響の大きさを表す動揺影響度を算出する。動揺影響度を用いて系統安定化制御を決定することにより、動揺が大きく影響範囲が広いため、不安定時の系統への影響が大きい動揺を優先的に安定化させる制御を選択することができる。
In the processing step S10A of the
動揺検出部12の処理ステップS10Aの一連の処理(複数計測地点抽出、並びに動揺影響度算出)について、図5から図13を用いて詳細に説明する。
A series of processes (extraction of multiple measurement points and calculation of the degree of influence of fluctuation) in the processing step S10A of the
まず図5は、処理ステップS10Aの一連の処理(複数計測地点抽出、並びに動揺影響度算出)を表す動揺影響推定処理を示すフローチャートである。図5のフローチャートは、図1の動揺検出部12において実行され、これは図3の処理ステップS10Aの処理を具体化したものである。図5の最初の処理ステップS11では、同一と判別される動揺成分毎に関連する複数計測地点を抽出する動揺影響地点抽出処理を行う。次の処理ステップS12では、動揺成分の影響の大きさを表す動揺影響度を算出する。なお、処理ステップS11の詳細な処理内容が図6の処理フローチャートに示されており、処理ステップS12の詳細な処理内容が図6の処理フローチャートに示されている。
First, FIG. 5 is a flowchart showing a fluctuation influence estimation process representing a series of processes (multiple measurement point extraction and fluctuation influence degree calculation) in the processing step S10A. The flowchart in FIG. 5 is executed by the
図6の処理フローチャートは、動揺影響地点抽出処理(処理ステップS11)の詳細内容を示している。ここでの最初の処理ステップS111では、動揺検出部12により算出された複数の検出動揺情報を動揺周波数で分類し、その結果を周波数動揺情報テーブルTB2として情報記憶部30に保存する。なお動揺検出部12により算出された複数の検出動揺情報については、上記した検出動揺情報テーブルTB1として既に情報記憶部30に保存されたものを利用する。
The process flowchart of FIG. 6 shows the detailed contents of the shaking influence point extraction process (processing step S11). In the first processing step S111 here, a plurality of detected shaking information calculated by the shaking
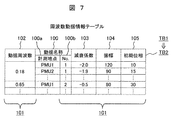
図7は、周波数動揺情報テーブルTB2の例を示す。図7のテーブルTB2を図4のテーブルTB1と比較すると明らかなように、このテーブルTB2は、図4のテーブルTB1を動揺周波数102の観点で記載順序を入れ替えたものである。 FIG. 7 shows an example of the frequency fluctuation information table TB2. As is clear from the comparison of the table TB2 in FIG. 7 with the table TB1 in FIG. 4, this table TB2 is obtained by changing the description order of the table TB1 in FIG.
図7の周波数動揺情報テーブルTB2についてより詳細に説明すると、これは周波数動揺情報毎のエントリを含む。一つの周波数動揺情報に対応するエントリは、当該周波数動揺情報に対応する動揺成分の動揺周波数102と、検出動揺識別情報100(図中の動揺名称)と、当該動揺周波数に近い動揺周波数を有する少なくとも一つの検出動揺情報の特性を示す動揺特性101とを含む。検出動揺識別情報100は、検出動揺情報の検出動揺識別情報100a、100bと同様である。動揺特性101は、減衰係数103と、振幅104と、初期位相105とを含む。
The frequency fluctuation information table TB2 in FIG. 7 will be described in more detail. This includes an entry for each frequency fluctuation information. The entry corresponding to one frequency fluctuation information includes at least a
この周波数動揺情報テーブルTB2の例において、0.18に近い動揺周波数を有する周波数動揺情報には、計測地点PMU1におけるNo.1の検出動揺情報と、計測地点PMU2におけるNo.1の検出動揺情報とが含まれている。同様に、0.65に近い動揺周波数を有する周波数動揺情報には、計測地点PMU1におけるNo.2の検出動揺情報が含まれている。以後、一つの周波数動揺情報に含まれる計測地点を計測地点群候補と呼ぶことがある。 In the example of the frequency fluctuation information table TB2, the frequency fluctuation information having a fluctuation frequency close to 0.18 includes No. at the measurement point PMU1. 1 detection fluctuation information and No. 1 at the measurement point PMU2. 1 detection wobble information. Similarly, in the frequency fluctuation information having a fluctuation frequency close to 0.65, No. at the measurement point PMU1 is displayed. 2 detection shaking information is included. Hereinafter, a measurement point included in one frequency fluctuation information may be referred to as a measurement point group candidate.
なおこの分類に際し、動揺検出部12では、事前に定められた動揺周波数の差を示す周波数幅を用い、動揺周波数の差が周波数幅以内である検出動揺情報を、同じ動作周波数の周波数動揺情報に分類しても良い。前述の検出動揺情報テーブルTB1の例において、計測地点PMU2のNo.1の検出動揺情報の動揺周波数は0.19であり、計測地点PMU1におけるNo.1の検出動揺情報の動揺周波数は0.18であるが、これらは同じ周波数動揺情報に分類されている。動揺周波数が周波数幅内にある検出動揺情報を同じ周波数動揺情報に分類することで、各検出動揺情報に、ノイズに起因する誤差が含まれる場合においても、各動揺の系統内の分布を正確に推定できる。
In this classification, the
ここで、同じ分類に含める動揺周波数の範囲を定める周波数幅は、入力データとして用いられる計測情報の数に基づいて定められても良い。例として、同じ周波数動揺情報に含める動揺周波数の周波数幅Δfを(13)式に示す。(13)式は、サンプリング定理に基づく周波数幅Δfの決定手法を表す式である。ここで、Nを検出動揺情報の算出に用いた計測情報の入力データ数とし、Δfsを計測情報のサンプリング周波数、αを事前に指定される定数とする。一般に、周波数解析における周波数分解能は入力データのサンプリング周波数が小さい場合に高く、データ数が大きい場合に高くなるため、(13)式により、同じ周波数動揺情報に含める動揺周波数の周波数幅Δfを適切に選択することができる。 Here, the frequency width that defines the range of the oscillation frequency included in the same classification may be determined based on the number of pieces of measurement information used as input data. As an example, the frequency width Δf of the oscillation frequency included in the same frequency oscillation information is shown in the equation (13). Expression (13) is an expression representing a method for determining the frequency width Δf based on the sampling theorem. Here, N is the number of input data of measurement information used for calculation of detected oscillation information, Δfs is a sampling frequency of measurement information, and α is a constant specified in advance. In general, the frequency resolution in the frequency analysis is high when the sampling frequency of the input data is small, and is high when the number of data is large. Therefore, the frequency width Δf of the oscillation frequency included in the same frequency oscillation information is appropriately determined by the equation (13). You can choose.
![]()
![]()
次に、動揺検出部12は、図6の処理ステップS112において情報記憶部30に格納された設備情報データベースDBのデータに基づいて計測地点間距離を算出する計測地点間距離算出処理を行う。
Next, the
図8は、処理ステップS112における計測地点間距離算出処理をさらに詳細に示すフローチャートである。図8の最初の処理ステップS114では、計測情報収集部11により取得された計測情報の計測地点から順に、2個の計測地点を選択する。
FIG. 8 is a flowchart showing in more detail the distance calculation process between measurement points in process step S112. In the first processing step S114 of FIG. 8, two measurement points are selected in order from the measurement point of the measurement information acquired by the measurement
次の処理ステップS115では、選択された2個の計測地点間の計測地点間距離を、情報記憶部30に格納された設備情報データベースDBに保管したデータに基づき算出する。ここで参照する設備情報データベースDBのデータとは、先に説明したようにノード情報D1と、送電線情報D2と、計測設備情報D3とを含む。
In the next process step S115, the distance between the two selected measurement points is calculated based on the data stored in the facility information database DB stored in the
図9は、設備情報データベースDBのデータのうち、ノード情報D1を格納するノード情報テーブルTB3の例を示す図である。 FIG. 9 is a diagram illustrating an example of the node information table TB3 that stores the node information D1 in the data of the facility information database DB.
ノード情報D1を格納するノード情報テーブルTB3は、電力系統におけるノード毎に、ノードを識別するためのノード名称200と、例えば経度と緯度で表した当該ノードの位置を示す位置情報201と、当該ノードに接続される発電機、電力負荷、調相機器の特性202とを含む。この図の例では、ノードAおよびノードBに発電機202aが連系している。ノードAにはG1という名称の定格容量が100である火力発電機が連系しており、ノードBにはG2という名称の定格容量が200である風力発電機が連系している。
The node information table TB3 that stores the node information D1 includes, for each node in the power system, a
また、この図の例では、ノードAAおよびBBに電力負荷202bが連系している。ノードAAにはL1という名称の定格容量が1000である住宅が連系しており、ノードBBにはL2という名称の定格容量が2000である工場が連系している。
In the example of this figure, the
また、この図の例では、ノードAAAおよびBBBのノードに調相機器202Cが連系している。ノードAAAにはD1という名称の定格容量が10であるSC(Static Condenser:電力用コンデンサ)が連系しており、ノードBBBにはD2という名称の定格容量が20であるShR(Shunt Reactor:分路リアクトル)が連系している。 Further, in the example of this figure, the phase adjusting device 202C is linked to the nodes AAA and BBB. The node AAA is connected to an SC (Static Condenser) having a rated capacity of 10 named D1, and the node BBB is a ShR (Shunt Reactor: minutes) having a rated capacity of 20 named D2. Road reactor).
図10は、設備情報データベースDBのデータのうち、送電線情報D2を格納する送電線情報テーブルTB4の例を示す図である。 FIG. 10 is a diagram illustrating an example of a power transmission line information table TB4 that stores power transmission line information D2 in the data of the facility information database DB.
送電線情報D2は、電力系統における送電線毎に、送電線を識別するための送電線名称300と、当該送電線の両端のノードを示す両端ノード301と、当該送電線の正相抵抗302a、正相リアクタンス302b、及び正相キャパシタンス302Cとを含む。この図の例では、送電線aが、ノードAとノードBの間に存在し、送電線aの正相抵抗が0.01、正相リアクタンスが0.2、正相キャパシタンスが0.1である。また送電線bが、ノードBとノードCの間に存在し、送電線bの正相抵抗が0.02、正相リアクタンスが0.5、正相キャパシタンスが0.2である。
The transmission line information D2 includes, for each transmission line in the power system, a
図11は、設備情報データベースDBのデータのうち、計測設備情報D3を格納する計測設備情報テーブルTB5の例を示す図である。 FIG. 11 is a diagram illustrating an example of a measurement facility information table TB5 that stores measurement facility information D3 in the data of the facility information database DB.
計測設備情報テーブルTB5は、計測設備情報、電力系統内の計測地点毎に、二つの計測地点400a、400bの識別情報と、それらの間の計測地点間距離403とを含む。ここで計測地点とは、計測装置21が接続される地点を示す。この図のテーブルTB5の例では、計測地点400a、400bの識別情報は、計測装置21を示す計測地点名称401a、401bと、ノード情報に含まれるノード名称402a、402bとを含む。PMU1という計測地点名称の計測地点はノードAに接続されており、PMU2という計測地点名称の計測地点はノードBに接続されている。
The measurement facility information table TB5 includes the measurement facility information, identification information of the two
また、計測地点間距離は、2つの計測地点の間の電気的距離と、2つの計測地点の近傍に連系された発電機、電力負荷、調相機器などの系統要素とに基づいて算出される値である。例えば、計測地点間距離Dは以下の(14)式により算出される。なお(14)式は計測地点間距離Dの定義式である。 The distance between the measurement points is calculated based on the electrical distance between the two measurement points and system elements such as a generator, a power load, and a phase adjusting device connected in the vicinity of the two measurement points. Value. For example, the distance D between measurement points is calculated by the following equation (14). Equation (14) is a defining equation for the distance D between measurement points.
ここで、Dは2つの計測地点の間のインピーダンスに比例する電気的距離を示す。nは2つの計測地点の何れかから、ある閾値で定める電気的距離の範囲内に連系される発電機、電力負荷、調相機器などの系統要素の数を示す。またCiは2つの計測地点の何れかから、ある閾値で定める電気的距離の範囲内に連系されるi番目の系統要素の定格容量を示す。α、βiは係数を示す。二つの計測地点の間の電気的距離を用いることにより、二つの計測地点の動揺成分が同一であるか否かを判定することができる。 Here, D represents an electrical distance proportional to the impedance between the two measurement points. n indicates the number of system elements such as a generator, a power load, and a phase adjusting device, which are linked within a range of an electrical distance determined by a certain threshold from either of two measurement points. C i indicates the rated capacity of the i-th system element interconnected within the range of the electrical distance determined by a certain threshold from either of the two measurement points. α and β i indicate coefficients. By using the electrical distance between the two measurement points, it can be determined whether or not the shaking components at the two measurement points are the same.
これらの設備情報データベースDBの図に示されたデータ構成は一例であり、情報記憶部30は、さらに詳細な設備情報を格納しても良い。例えば、ノード情報D1は、火力発電機が連系するノードの情報として、ガバナ定数などの発電機動特性を含んでも良い。また、ノード情報D1は、風力発電機などの自然エネルギーによる発電機が連系するノードの情報として、過去の履歴を用いた統計分析により算出した確率的な発電量変動特性を含んでも良い。
The data configuration shown in the drawings of these facility information databases DB is an example, and the
また、計測設備情報D3における計測地点間距離Dの算出において、動揺検出部12は、(1)式の係数βiを、上記の発電機動特性に基づき定めて良い。また、動揺検出部12は、インピーダンスや発電機、電力負荷、調相機器などの系統要素の情報を用いず、ノード情報に含まれる緯度経度情報を用いて、計測地点間の距離を算出して、その値を計測地点間距離Dとして良い。
Moreover, in the calculation of the distance D between the measurement points in the measurement facility information D3, the
図8における次の処理ステップS116において動揺検出部12は、計測情報収集部11により取得された計測情報の計測地点に関して、全ての2地点の組合せについて計測地点間距離を算出したかどうかを判断する。全ての2地点の組合せについて計測地点間距離を算出したと判定された場合(Yes)、動揺検出部12は、計測地点間距離算出処理を終了する。計測地点間距離を算出していない計測地点の組合せがある場合(No)、動揺検出部12は、別の2計測地点について処理ステップS114、処理ステップS115を繰り返す。以上の処理により、全ての2計測地点の組合せについて計測地点間距離を算出する。
In the next processing step S116 in FIG. 8, the
図6の動揺影響地点抽出処理に戻り、説明を再開する。図6の処理フローでは、計測地点間距離算出(処理ステップS112)の後、動揺検出部12は、処理ステップS111で得られた周波数動揺情報を計測地点間距離で分類し、その結果を領域動揺情報として情報記憶部30に保存する(処理ステップS113)。このとき、動揺検出部12は、周波数動揺情報(動揺周波数)毎に、計測地点間距離を用いて、ウォード法、k−means法に代表されるクラスタリング手法を用いて周波数動揺情報を分類しても良い。
Returning to the shaking influence point extraction process of FIG. 6, the description is resumed. In the processing flow of FIG. 6, after calculating the distance between measurement points (processing step S112), the
図12は、処理ステップS113の処理で得られた領域動揺情報テーブルTB6の一例を示す図である。図12の領域動揺情報テーブルTB6を見ると明らかなように、これは図7の周波数動揺情報テーブルTB2に、図11の計測設備情報テーブルTB5の計測地点名401を加味し、動揺番号500により纏めたものである。
FIG. 12 is a diagram illustrating an example of the region fluctuation information table TB6 obtained by the processing in the processing step S113. As apparent from the region fluctuation information table TB6 in FIG. 12, this is summarized by the
図12の領域動揺情報テーブルTB6について詳細に説明する。領域動揺情報テーブルTB6は、計測地点間距離により分類された領域動揺情報毎のエントリを含む。一つの領域動揺情報に対応するエントリは、当該領域動揺情報により表される動揺成分を示す動揺番号500(No.)と、当該領域動揺情報に対応する周波数動揺情報の動揺周波数102と、当該領域動揺情報に対応する周波数動揺情報の計測地点を示す計測地点名称102と、当該動揺成分の特性を示す動揺特性101とを含む。動揺特性101は、周波数動揺情報の動揺特性(図7)と同様に、減衰係数103と、振幅104と、初期位相105とを含む。
The region fluctuation information table TB6 in FIG. 12 will be described in detail. The region shaking information table TB6 includes an entry for each region shaking information classified by the distance between measurement points. The entry corresponding to one region shake information includes a shake number 500 (No.) indicating a shake component represented by the region shake information, a
この図の例において、計測地点PMU1において観測された動揺周波数0.18の検出動揺情報と、計測地点PMU3において観測された同じく動揺周波数0.18の検出動揺情報とは、互いに異なる領域動揺情報に分類されている。これは、計測地点PMU1と計測地点PMU3との計測地点間距離が、他の計測地点間距離に比べて、相対的に大きいためである。このように、周波数動揺情報は設備情報データベースDBの保管情報を用いて分類される。 In the example of this figure, the detected fluctuation information of the fluctuation frequency 0.18 observed at the measurement point PMU1 and the detected fluctuation information of the same fluctuation frequency 0.18 observed at the measurement point PMU3 are different from each other. It is classified. This is because the distance between the measurement points PMU1 and PMU3 is relatively larger than the distance between the other measurement points. Thus, the frequency fluctuation information is classified using the storage information in the facility information database DB.
複数の計測地点で検出された動揺成分の動揺周波数の差が予め定められた範囲内である場合、設備情報データベースDBの保管情報に基づいて、複数の計測地点の間の電気的距離により複数の計測地点を分類し、それぞれの分類に属する計測地点を計測地点群として抽出することにより、各動揺成分が存在する領域を特定することができる。 When the difference in the oscillation frequency of the oscillation component detected at a plurality of measurement points is within a predetermined range, a plurality of electrical distances between the plurality of measurement points is determined based on storage information in the facility information database DB. By classifying the measurement points and extracting the measurement points belonging to the respective classifications as the measurement point group, it is possible to specify a region where each shaking component exists.
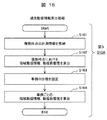
図5の動揺影響推定処理において、処理ステップS12では処理ステップS11の後、図12の領域動揺情報を用いて動揺影響度を算出する動揺影響度算出処理を行う。図13は、動揺影響度算出処理の具体的なフローチャートを示している。 In the shaking influence estimation process of FIG. 5, in the processing step S12, after the processing step S11, the shaking influence degree calculation process for calculating the shaking influence degree is performed using the region shaking information of FIG. FIG. 13 shows a specific flowchart of the shaking influence degree calculation process.
まず、動揺検出部12の処理ステップS121では、図12のように整理された領域動揺情報毎に、領域動揺情報に含まれる計測地点を抽出する。例えば図12の領域動揺情報テーブルTB6の例において説明すると、動揺検出部12は、最初に動揺番号500について「1」を参照し、動揺周波数102が「0.18」の動揺成分を検出した計測地点401として、「PMU1」、「PMU3」などを抽出する。同様に、動揺検出部12は、動揺番号500について「2」を参照し、動揺周波数102が「0.65」の動揺成分を検出した計測地点401として「PMU1」などを抽出する。また同様に動揺検出部12は、動揺番号500について「3」を参照し、動揺周波数102が「0.18」の動揺成分を検出した計測地点401として「PMU2」などを抽出する。
First, in processing step S121 of the
次に、動揺検出部12の処理ステップS122では、図8の処理ステップS114で抽出された計測地点に対応する動揺特性から、領域動揺情報毎の動揺影響度を算出する。動揺影響度を算出することにより、各動揺成分が電力系統の安定度へ与える影響の大きさを表すことができる。
Next, in the processing step S122 of the
図14を用いて、動揺影響度算出処理の概念を説明する。図14では、横軸に時間を取り、縦軸に計測情報xijk及び計測情報から得られた動揺影響度Jijkを示している。この例では、電力変動は時間経過とともに減衰振動した事例を示している。図14についてさらに詳細に説明する。 The concept of the fluctuation influence degree calculation process will be described with reference to FIG. In FIG. 14, time is taken on the horizontal axis, and the measurement information x ijk and the fluctuation influence degree J ijk obtained from the measurement information are shown on the vertical axis. In this example, the power fluctuation shows an example of damped oscillation with time. FIG. 14 will be described in further detail.
図14において、Jijkを計測地点iにおける領域動揺情報j及び計測種別kの動揺影響度とし、xijkを計測地点iにおける領域動揺情報jで計測種別kの計測情報とし、t1、t2(t1<t2)を事前に指定する時刻とし、Bijkを(12)式により算出された動揺の振幅(図12の104)とし、σijkを(7)式により算出された減衰係数(図12の103)とする。 In FIG. 14, J ijk is the region shaking information j at the measurement point i and the shaking influence degree of the measurement type k, x ijk is the region shaking information j at the measurement point i and the measurement type k measurement information, and t1, t2 (t1 <T2) is set as a time designated in advance, B ijk is set as the amplitude of shaking calculated by the formula (12) (104 in FIG. 12), and σ ijk is set as the damping coefficient calculated by the formula (7) (in FIG. 12). 103).
動揺検出部12では、領域動揺情報毎の動揺影響度Jijkを(15)式より算出する。なお(15)式は動揺影響度Jの定義式である。
The
ここで、解析の基準とする時刻を0と定義し、0>t2>t1と設定すると、解析基準時刻より過去の領域動揺情報の動揺影響度Jijkが算出される。同様に、t2>0>t1と設定すると、解析基準時刻を含む現在の領域動揺情報の動揺影響度Jijkが算出され、t2>t1>0と設定すると、解析基準時刻より将来の領域動揺情報の動揺影響度Jijkが算出される。 Here, when the time used as the analysis reference is defined as 0 and 0>t2> t1 is set, the fluctuation influence degree J ijk of the past region fluctuation information is calculated from the analysis reference time. Similarly, when t2>0> t1, the sway influence degree J ijk of the current region sway information including the analysis reference time is calculated, and when t2>t1> 0 is set, the future region sway information from the analysis reference time is calculated. The fluctuation influence degree J ijk of is calculated.
例えば、t2>t1>0と設定することにより、或る計測地点における将来の動揺成分の時間変化を予測し、予測された動揺成分に基づいて動揺影響度Jijkを算出し、その動揺影響度Jijkにより、その計測地点が将来、不安定になるか否かを判定することができる。動揺影響度Jijkに振幅Bijk及び減衰係数σijkを用いることにより、将来の動揺影響度Jijkを予測することができる。 For example, by setting t2>t1> 0, the temporal change of the future shaking component at a certain measurement point is predicted, the shaking influence degree Jijk is calculated based on the predicted shaking component, and the shaking influence degree is calculated. J ijk can determine whether the measurement point will become unstable in the future. By using the amplitude B ijk and the damping coefficient sigma ijk to upset influence J ijk, it is possible to predict future perturbations influence J ijk.
(15)式の定義により動揺影響度Jijkを算出することで、振幅Bijkが大きく、かつ減衰係数σijkが悪い(減衰係数σijkが大きい)領域動揺情報の動揺影響度が大きくなる。ここで、(15)式による動揺影響度の代わりに、振幅Bijkあるいは減衰係数σijk自体の値を動揺影響度として定義しても良い。 (15) By calculating the upset influence J ijk by the definition of formula, the amplitude B ijk is large and the attenuation coefficient sigma ijk is poor (attenuation coefficient sigma ijk is large) upset influence region motion information increases. Here, instead of the fluctuation influence degree according to the equation (15), the value of the amplitude B ijk or the attenuation coefficient σ ijk itself may be defined as the fluctuation influence degree.
また、動揺検出部12の処理においては、過去の領域動揺情報を参照し、過去の領域動揺情報の中から、現在の領域動揺情報の計測地点群の状況に対応する過去の領域動揺情報を選択し、選択された過去の領域動揺情報の動揺成分の継続時間を考慮して動揺影響度Jijkを算出しても良い。
Further, in the processing of the
例えば、動揺検出部12は、過去の領域動揺情報において、同じ動揺周波数を持つ動揺成分が継続して存在する期間が予め定められた期間閾値以上である場合、動揺影響度Jijkを大きく設定し、同じ動揺周波数を持つ動揺成分が継続して存在する期間が期間閾値以下である場合、動揺影響度Jijkを小さく設定しても良い。このように動揺影響度Jijkを定めることにより、瞬間的に系統動揺に含まれるノイズの影響による動揺を排除し、定常的に存在する動揺成分を優先的に監視することができる。
For example, the
図15は、過去動揺情報テーブルTB7の一例を示す図である。図15の過去動揺情報テーブルTB7を図12の領域動揺情報テーブルTB6と比較して明らかなように、過去動揺情報テーブルTB7は、さらに動揺影響度や事例詳細の情報を付与して整理されたものである。 FIG. 15 is a diagram illustrating an example of the past shaking information table TB7. As is clear by comparing the past shaking information table TB7 of FIG. 15 with the region shaking information table TB6 of FIG. 12, the past shaking information table TB7 is further organized by adding information on the degree of shaking influence and case details. It is.
過去動揺情報テーブルTB7について、さらに詳細に説明する。過去動揺情報テーブルTB7は、事例毎のエントリを有する。一つの事例のエントリは、事例を示す事例詳細600と、その事例に対応する少なくとも一つの領域動揺情報を含む。事例詳細600は、時刻601、日付又は曜日602、月又は季節603、イベント種別604等を含む。領域動揺情報は、動揺番号500、動揺周波数102、動揺影響度605、計測地点401、減衰係数103、振幅104、初期位相105を含む。
The past shaking information table TB7 will be described in more detail. The past shaking information table TB7 has an entry for each case. The entry of one case includes case details 600 indicating the case and at least one region fluctuation information corresponding to the case. The case details 600 include
動揺検出部12は、過去の領域動揺情報を事例毎に分類し、統計処理した情報を、過去動揺情報テーブルTB7として情報記憶部30に格納する。動揺検出部12は、検出動揺情報の算出に用いた計測情報の時刻、日付、曜日、月、季節、イベント種別の情報に基づいて、事例を設定する。
The
動揺検出部12は、時刻601を用いて事例を設定することにより、1日の中の系統内の潮流状況の変動影響を領域動揺情報の統計処理に反映することができる。この場合の潮流状況の変動は、朝夕の出勤退勤時刻で区切られる勤務時間帯を一例とする1日の中の生活行動を原因としている。この図15の例において、事例No.1では8:00−10:00が、事例No.2では12:00−14:00が設定されている。
The
動揺検出部12は、日付または曜日602を用いて事例を設定することにより、1週間の中の系統内の潮流状況の変動影響を領域動揺情報の統計処理に反映することができる。この場合の潮流状況の変動は、平日および休日を一例とする曜日毎の生活行動を原因としている。この図の例において、事例No.1では土日が、事例No.2では月−金が設定されている。
The
動揺検出部12は、月または季節603を用いて事例を設定することにより、1年間の中の系統内の潮流状況の変動影響を領域動揺情報の統計処理に反映することができる。この場合の潮流状況の変動は、夏季における冷房需要、冬季における暖房需要を一例とする月または季節毎の生活行動を原因としている。この図の例において、事例No.1では3月−5月が、事例No.2では7月−9月が設定されている。
The
動揺検出部12は、イベント種別604を用いて事例を設定することにより、系統故障、系統切替などのイベントによる系統内の潮流状況の変動影響を領域動揺情報の統計処理に反映することができる。この図の例において、事例No.1ではイベントなしが、事例No.2ではノードAAの1LGが設定されている。
The
図15には例示していないが、動揺検出部12は、上記の事例の設定方法に加えて、事前に監視対象として設定したノードまたは送電線の潮流量、発電機の発電量、晴れ・曇り・雨の区分または気温情報を含む気象情報、を分類項目とした事例を設定し、領域動揺情報の統計処理を実施しても良い。
Although not illustrated in FIG. 15, in addition to the above-described example setting method, the
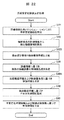
ここでは、動揺検出部12が図15の過去動揺情報テーブルTB7を算出する過去動揺情報算出処理について説明する。図16は、過去動揺情報算出処理を示すフローチャートの例である。なお図16の処理フローは、図5の動揺影響推定処理フローの後段に位置づけられて実行されることになる。
Here, the past shaking information calculation process in which the shaking
図16では、まず動揺検出部12は、処理ステップS161において複数時点の計測情報を格納する。
In FIG. 16, first, the
次に、動揺検出部12は、処理ステップS162において格納した計測情報を用いて、複数時点における領域動揺情報及びその動揺影響度を算出する。このとき、動揺検出部12は、前述の図5の処理ステップS11〜S12の工程に従って、領域動揺情報及びその動揺影響度を算出する。
Next, the
次に、動揺検出部12は、処理ステップS163において事例の分類を設定する。このとき、動揺検出部12は、分類項目として、過去動揺情報に示す時刻、日付、曜日、月、季節、イベント種別の情報のうち少なくとも一つを用いる。動揺検出部12は、使用する分類項目のそれぞれについて、期間の始端及び終端、イベント種別の分類名、あるいは数値情報の最小値・最大値を決定し、分類区分を設定する。
Next, the
次に、動揺検出部12の処理ステップS164においては、処理ステップS161で設定した事例の分類に基づき、事例毎の領域動揺情報、動揺影響度を算出する。このとき、動揺検出部12は、処理ステップS162で領域動揺情報、動揺影響度を算出した解析時刻を事例毎に分類し、同一事例に分類された複数時刻における領域動揺情報および動揺影響度の情報に統計処理を施して算出した代表値を、各事例の領域動揺情報、動揺影響度とする。動揺検出部12は、代表値として、領域動揺情報、動揺影響度毎の平均値、中間値を用いる。
Next, in the processing step S164 of the
以上が過去動揺情報算出処理である。なお動揺影響度算出処理において、動揺検出部12は、過去動揺情報算出処理により算出された過去動揺情報を参照して、解析時刻の状況に最も近い事例を抽出し、抽出した事例の動揺影響度を適用してもよい。動揺検出部12は、過去の領域動揺情報の統計処理結果を用いることにより、解析時刻において系統動揺に含まれる瞬間的なノイズの影響による動揺を排除し、優先的に監視する動揺成分を正確に選択することができる。
The above is the past shaking information calculation process. In the shaking influence calculation process, the shaking
なお図13の処理ステップS122の後、処理ステップS123において動揺検出部12は、(16)式に従って、計測地点iにおける領域動揺情報jの動揺影響度Jijを算出する。(16)式は、複数種別を考慮した動揺影響度Jの定義式である。ここで、(16)式のβkは計測情報種別kに対して設定される係数である。βkは各計測種別kの定格値の逆数としても良い。動揺検出部12は、各計測種別の定格値を用いることにより、複数の種別の計測情報における動揺影響度を、定格に対する比率で正規化して算出することができる。また、特定の計測種別の動揺影響度を抽出するために、当該計測種別kに対応する係数βkの値を他種別に対する係数に比して大きく設定しても良い。
Note After the processing step S122 in FIG. 13,
![]()
![]()
さらに、動揺検出部12は、計測地点iにおける全ての領域動揺情報を考慮した動揺影響度Jiを以下の(17)式により算出しても良い。(17)式は動揺が発生する領域を考慮した動揺影響度Jの定義式である。ここでγjは領域動揺情報jに対して設定される係数である。ある領域動揺情報jに対する係数γjを大きくすることで、特定の領域動揺情報を重視した動揺影響度を算出することができる。
Further, the
![]()
![]()
以上、図13の動揺影響度算出処理により、計測地点iにおける領域動揺情報jの動揺影響度Jij、または計測地点iの動揺影響度Jiが算出される。ここまでの説明が、図1の動揺検出部12、従って図3の処理ステップS10における処理内容を述べたものである。
As described above, the fluctuation influence degree J ij of the region fluctuation information j at the measurement point i or the fluctuation influence degree J i of the measurement point i is calculated by the fluctuation influence degree calculation process of FIG. The description so far has described the processing contents in the
次に図1の制御優先度決定部13、従って図3の処理ステップS20における処理内容を具体的に述べる。図3の処理ステップS20では、設備情報データベースDBに保管されたデータに基づき、制御機器ごとの優先度を決定する。
Next, the processing contents in the control
制御優先度を算出する数式の一例を(18)式に示す。(18)式は制御優先度Lの定義式である。なお、Lijは制御機器iによる制御手段jの制御優先度、pijは制御機器iの制御手段jによる制御可能量、qijは制御機器iの制御手段jによる制御効果の度合い、a1、a2は事前設定される係数を示す。 An example of a mathematical expression for calculating the control priority is shown in Expression (18). Expression (18) is a definition expression of the control priority L. Note that Lij is the control priority of the control means j by the control device i, pij is the controllable amount by the control means j of the control device i, qij is the degree of control effect by the control means j of the control device i, and a1 and a2 are advance Indicates the coefficient to be set.
![]()
![]()
ここで、制御対象機器(以後単に制御機器という)iは発電機、負荷、調相機器、変圧器、開閉装置、を含んでもよい。制御手段jは、電源制限、発電機無効電力制御、負荷制限、調相制御、タップ制御、系統切替、を含んでもよい。制御可能量pijは、発電機の現在出力、負荷の現在消費電力、調相機器容量、開閉装置を流れる現在潮流量、に基づき決定してよい。qijは、制御機器iの制御手段jの制御速度(動作時定数)に基づき、制御速度が速い(動作時定数が小さい)場合に大きく、制御速度が遅い(動作時定数が大きい)場合に小さく設定してよい。また、qijは、安定化対象とする不安定化現象と制御機器iの制御手段jの組合せにより設定しても良い。例えば、有効電力のアンバランスに起因する不安定化現象を安定化する場合、有効電力潮流への影響が大きい電源制限、負荷制限、系統切替といった制御手段のqijを大きく設定してよい。 Here, the control target device (hereinafter simply referred to as control device) i may include a generator, a load, a phase adjusting device, a transformer, and a switchgear. The control means j may include power supply limitation, generator reactive power control, load limitation, phase adjustment control, tap control, and system switching. The controllable amount pij may be determined based on the current output of the generator, the current power consumption of the load, the phase adjusting device capacity, and the current flow rate flowing through the switchgear. qij is large when the control speed is fast (the operation time constant is small) and small when the control speed is slow (the operation time constant is large) based on the control speed (operation time constant) of the control means j of the control device i. May be set. Further, qij may be set by a combination of the destabilization phenomenon to be stabilized and the control means j of the control device i. For example, when stabilizing the destabilization phenomenon caused by the imbalance of active power, the control means qij having a large influence on the active power flow, such as power supply limitation, load limitation, and system switching, may be set large.
このようにして制御優先度Lijを算出することにより、設備データベースDBに保管したデータを用いて各制御手段の制御性能に基づいた安定化制御が可能となる。 By calculating the control priority Lij in this way, stabilization control based on the control performance of each control means can be performed using data stored in the equipment database DB.
再度図1、図3に戻り、次に、制御対象決定部14の処理ステップS30では、検出動揺情報および制御優先度に基づき制御対象を決定する。図17に制御対象決定処理のフローを示す。
Returning to FIGS. 1 and 3 again, next, in the processing step S30 of the control
図17の制御対象決定処理では、最初の処理ステップS31においてまず、制御優先度を算出した制御機器を一つ選択する。 In the control target determination process of FIG. 17, in the first process step S31, first, one control device whose control priority is calculated is selected.
次に処理ステップS32では、選択した制御機器と不安定動揺が観測された全計測地点との距離を算出する。地点間距離は、制御機器の連系地点と計測地点との間の電気的距離と、制御機器の連系地点と計測地点との近傍に連系された発電機、電力負荷、調相機器などの系統要素とに基づいて算出される値である。例えば、(14)式により算出される地点間距離Dを用いることができる。 Next, in processing step S32, the distance between the selected control device and all measurement points where unstable fluctuations are observed is calculated. The distance between points is the electrical distance between the connection point of the control device and the measurement point, and the generator, power load, phase adjustment device, etc. connected in the vicinity of the connection point of the control device and the measurement point. It is a value calculated based on the system element. For example, the distance D between points calculated by Formula (14) can be used.
次に処理ステップS33では、、制御優先度および制御対象と計測地点との距離に基づき制御対象を決定する。例えば、以下の(19)式に示す制御効果L‘ijを制御手段ごとに算出し、L‘ijが最大となる制御手段を選択して良い。なお(19)式は制御効果L‘ijの定義式である。ここで、制御効果Lijは制御機器iによる制御手段jの制御優先度、Diは、処理ステップS32にて算出した、制御機器iと不安定動揺が観測された計測地点との距離、b1、b2は事前設定される係数を示す。 Next, in process step S33, a control object is determined based on the control priority and the distance between the control object and the measurement point. For example, the control effect L′ ij shown in the following equation (19) may be calculated for each control unit, and the control unit that maximizes L′ ij may be selected. Expression (19) is a definition expression of the control effect L′ ij. Here, the control effect Lij is the control priority of the control means j by the control device i, Di is the distance between the control device i and the measurement point where the unstable fluctuation is observed, b1, b2 calculated in processing step S32. Indicates a preset coefficient.
![]()
![]()
ここで、制御機器iは発電機、負荷、調相機器、変圧器、開閉装置、を含んでよい。制御手段jは、電源制限、発電機無効電力制御、負荷制限、調相制御、タップ制御、系統切替、を含んでよい。Diは、処理ステップS32にて算出した、制御機器iと不安定動揺が観測された計測地点との距離の中で最小の値として良い。 Here, the control device i may include a generator, a load, a phase adjusting device, a transformer, and a switchgear. The control means j may include power supply limitation, generator reactive power control, load limitation, phase adjustment control, tap control, and system switching. Di may be a minimum value calculated in the processing step S32 in the distance between the control device i and the measurement point where the unstable fluctuation is observed.
処理ステップS31から処理ステップS33に示す処理を全ての制御機器について繰り返すことで、全ての制御機器について制御効果L‘ijが算出され、その中でL‘ijが最大の制御手段を選択する。 By repeating the processing shown in processing step S31 to processing step S33 for all the control devices, the control effect L'ij is calculated for all the control devices, and the control means with the largest L'ij is selected.
このようにして、制御性能が高く、かつ動揺発生地点に近いため制御効果の高い制御対象を決定することにより、少ない制御量で系統を安定化することができる。 In this way, the system can be stabilized with a small amount of control by determining a control object with high control performance and high control effect because it is close to the fluctuation occurrence point.
このとき、複数の制御機器の組合せを一つの制御として、制御優先度を算出し、制御対象を決定して良い。ここで、制御量の上限を事前に設定し、複数制御機器の制御量の総和が制御量上限未満となる制御機器のみについて制御対象として良い。こうすることで、制御量を一定範囲内に制限することができるため、安定化に不必要な制御機器まで制御する過剰制御を抑制することができる。 At this time, a combination of a plurality of control devices may be regarded as one control, a control priority may be calculated, and a control target may be determined. Here, the upper limit of the control amount is set in advance, and only the control device in which the sum of the control amounts of the plurality of control devices is less than the upper limit of the control amount may be set as the control target. By doing so, the control amount can be limited within a certain range, so that it is possible to suppress over-control that controls even a control device unnecessary for stabilization.
再度図1、図3に戻り、次に、不安定化時間算出部15の処理ステップS40では、検出動揺情報に基づき不安定化時間を算出する。図18に不安定化時間算出処理のフローを示す。
Returning to FIGS. 1 and 3 again, in the process step S40 of the destabilization
図18に不安定時間算出処理のフローを示す。 FIG. 18 shows a flow of unstable time calculation processing.
図18の不安定時間算出処理のフローの最初の処理ステップS41では、不安定動揺の検出動揺情報を一つ選択する。次に処理ステップS42では、現在時刻以降の判定時刻を設定し、事前設定した検証限界時刻よりも前かどうかを判定する。判定時刻が検証限界時刻よりも後の場合(図中処理ステップS42のN)、「不安定時間なし」の結果を出力(処理ステップS43)し、不安定時間算出処理を終了する。判定時刻が検証限界時刻よりも前の場合(図中処理ステップS42のY)、検出動揺情報を用いて判定時刻の動揺推定値を算出する(処理ステップS44)。ここで、以下の(20)式に基づいて動揺推定値を算出しても良い。 In the first processing step S41 in the flow of the unstable time calculation process of FIG. 18, one piece of unstable fluctuation detection fluctuation information is selected. Next, in processing step S42, a determination time after the current time is set, and it is determined whether it is before the preset verification limit time. If the determination time is later than the verification limit time (N in process step S42 in the figure), the result of “no unstable time” is output (process step S43), and the unstable time calculation process is terminated. When the determination time is earlier than the verification limit time (Y in process step S42 in the figure), a shake estimated value at the determination time is calculated using the detected shake information (process step S44). Here, the estimated shake value may be calculated based on the following equation (20).
![]()
![]()
ここで、y(t)は推定値、tは判定時刻、iは動揺情報のインデックス、Riは動揺情報iの振幅、θiは動揺情報iの初期位相、σiは動揺情報iの減衰係数、fiは動揺情報iの動揺周波数、を表わす。 Here, y (t) is an estimated value, t is a determination time, i is an index of shaking information, Ri is an amplitude of shaking information i, θi is an initial phase of shaking information i, σi is an attenuation coefficient of shaking information i, fi Represents the oscillation frequency of the oscillation information i.
次に処理ステップS45において、算出した動揺推定値と事前設定した基準値の差分が、事前設定した不安定閾値より小さいかどうかを判定する。ここで、基準値として、ある一定期間の計測値の平均値あるいは定常値を用いて良い。上記差分が不安定閾値より小さい場合(図中処理ステップS45のY)、事前設定した時間間隔が経過した時刻を判定時刻に設定し(処理ステップS46)、処理ステップS42の処理に戻る。上記差分が不安定閾値より大きい場合(図中処理ステップS45のN)、現在の判定時刻を不安定時間として出力し(処理ステップS47)、不安定時間算出処理を終了する。 Next, in processing step S45, it is determined whether or not the difference between the calculated fluctuation estimated value and a preset reference value is smaller than a preset unstable threshold. Here, an average value or a steady value of measured values in a certain period may be used as the reference value. When the difference is smaller than the unstable threshold (Y in process step S45 in the figure), the time at which the preset time interval has passed is set as the determination time (process step S46), and the process returns to the process step S42. If the difference is larger than the unstable threshold (N in process step S45 in the figure), the current determination time is output as the unstable time (process step S47), and the unstable time calculation process is terminated.
このようにして、将来動揺推定値が不安定閾値を超える時刻を算出することができる。 In this way, it is possible to calculate the time at which the estimated future fluctuation value exceeds the instability threshold.
再度図1、図3に戻り、次に、制御時間決定部16の処理ステップS50では、不安定化時間情報および制御対象情報に基づき制御時間を決定する。図19に制御時間決定処理のフローを示す。
Returning to FIGS. 1 and 3 again, next, in the processing step S50 of the control
図19の制御時間決定処理の、最初の処理ステップS51では、制御効果が最大の制御機器を選択する。次に処理ステップS52では、選択した制御機器の動作時間が、算出した不安定化時間より小さいかどうかを判定する。動作時間が不安定化時間より大きい場合、(図中処理ステップS52のN)選択した制御機器を制御候補から削除(図中処理ステップS53)し、処理ステップS51に戻って残りの制御候補から制御効果が最大の制御機器を選択する。動作時間が不安定化時間より小さい場合、(図中(図中処理ステップS52のN)選択した制御候補を制御対象として決定し、制御機器の動作時間を制御時間とする(図中処理ステップS54))。 In the first process step S51 of the control time determination process of FIG. 19, the control device having the maximum control effect is selected. Next, in processing step S52, it is determined whether or not the operation time of the selected control device is smaller than the calculated destabilization time. When the operation time is larger than the destabilization time (N in process step S52 in the figure), the selected control device is deleted from the control candidates (process step S53 in the figure), and the process returns to process step S51 to control from the remaining control candidates. Select the control device with the greatest effect. When the operation time is smaller than the destabilization time (in the figure (N in process step S52 in the figure)), the selected control candidate is determined as a control target, and the operation time of the control device is set as the control time (process step S54 in the figure). )).
このようにして、不安定化時間よりも前に制御可能であり、制御効果の高い制御対象を選択することで、最小の制御量で安定化可能な制御対象を選択することができる。このとき、動作時間が不安定化時間よりも短くなる制御案を複数算出してもよい。 In this way, by selecting a control target that can be controlled before the destabilization time and has a high control effect, it is possible to select a control target that can be stabilized with a minimum control amount. At this time, a plurality of control plans whose operation time is shorter than the destabilization time may be calculated.
以上により図1及び図3の各部、各処理の内容を説明したが、これらの処理過程並びに処理結果は、適宜モニタ画面に表示されて、使用者の便に供されるのがよい。図20には、係る表示画面の一例を示す。表示画面は、複数のモニタを使用して行われてもよく、1つのモニタ画面を画面分割して複数の内容を表示するものであってもよい。ここでは画面分割事例を示している。 1 and FIG. 3 has been described above. However, it is preferable that these processing steps and processing results are appropriately displayed on a monitor screen for use by the user. FIG. 20 shows an example of such a display screen. The display screen may be displayed using a plurality of monitors, or may be one that displays a plurality of contents by dividing one monitor screen. Here, a screen division example is shown.
ここでのモニタ画面の利用場面としては、不安定時間検出の処理を例示する。例えば不安定時間検出部15は、特定の時刻において動揺影響度の高い領域動揺情報を選択する。不安定時間検出部15は、選択された領域動揺情報を示す表示画面を表示装置202に表示させる。表示画面は、選択された領域動揺情報に含まれる計測地点を区別して表示する、例えば、系統図上で領域動揺情報毎に色分けして表示する。
As the usage scene of the monitor screen here, an unstable time detection process is exemplified. For example, the unstable
例えば、表示画面は、画面の左側の欄410に系統図を表示する。系統図には発電機Gや送配電線などが図示され、さらにその系統図上に計測地点PMU1〜PMU5を表示する。表示画面はさらに、領域動揺情報に基づき、破線あるいは一点鎖線で囲んだ領域で、各領域動揺情報に含まれる計測地点を表す。この図の例では、一つの領域動揺情報にPMU1、PMU2、PMU4が含まれ、もう一つの領域動揺情報にPMU1、PMU3、PMU5が含まれる。
For example, the display screen displays a system diagram in the
また、表示画面は、右側上の欄420に領域動揺情報の詳細、および広域動揺現象に影響を及ぼす近隣地域にて発生した地絡・短絡故障情報や、発電機脱落情報等を表示する。領域動揺情報の詳細は、動揺影響度の高い領域動揺情報を優先的に表示する。さらに、表示画面は、右側下の欄430に、制御対象、制御手段、制御量、制御時間を優先度の高い順に表示する。オペレータ(管理者)は、表示画面により現在または将来の不安定地点および制御候補を認識した場合、安定化制御の指令を出すことができる。
Further, the display screen displays the details of the region fluctuation information in the upper
以上の実施形態によれば、系統切替、再生可能エネルギー出力変動により系統状態が急峻に変化し不安定化した場合であっても、高速かつ高精度な安定化制御を実現することが可能となる。 According to the above embodiment, it is possible to realize high-speed and high-accuracy stabilization control even when the system state suddenly changes and becomes unstable due to system switching and renewable energy output fluctuation. .
実施例1の系統安定化制御装置においては、電力系統の状態を監視して実動揺時に制御対象、制御時間を決定し安定化に向かわせる制御機能としての利用を主体に構成されていた。これに対し実施例2では、運転員訓練シミュレータとしての利用形態について説明する。 The system stabilization control device of the first embodiment is mainly configured to be used as a control function that monitors the state of the power system and determines a control target and a control time during actual sway and moves toward stabilization. On the other hand, Example 2 demonstrates the utilization form as an operator training simulator.
図21の系統安定化制御装置の構成は、基本的に図1と同じであるが、さらに想定動揺算出部17、動揺比較部18を備えている。また運転員訓練シミュレータとしての利用形態であるため、想定動揺算出部17に対して、適宜の設定内容を入力可能に構成され、モニタ202と入力操作機器を用いた利用が可能に構成されている。
The configuration of the system stabilization control device in FIG. 21 is basically the same as that in FIG. 1, but further includes an assumed
図22に示す系統安定化制御決定処理のフローは、基本的に図3と同じであるが、処理ステップS221、S223、S30Aの部分で相違している。 The flow of the system stabilization control determination process shown in FIG. 22 is basically the same as that in FIG. 3, but is different in the processing steps S221, S223, and S30A.
処理ステップS221(想定動揺算出部17)では、設備情報を用いたシミュレーションなどにより、事前想定動揺を算出する。この事前想定動揺では、電力系統の想定動揺の発生場所、動揺の大きさなどが予め算出、設定される。 In processing step S221 (assumed fluctuation calculation unit 17), a presumed fluctuation is calculated by simulation using facility information. In this presumed shake, the place where the assumed shake of the power system is generated, the magnitude of the shake, and the like are calculated and set in advance.
処理ステップS223では、事前想定動揺と検出動揺情報を比較する。ここでは、比較結果として例えば事前想定動揺の情報を次段以降の処理に送る。あるいは、比較結果の差分を各種データに反映させて、以後の処理に生かすといった処理を行う。通常このシステムは系統安定化制御装置として機能してリアルタイムに系統を監視しながら、適宜運転員訓練シミュレータとして利用することを想定すると、比較の意味は両機能の切り替え、あるいは必要なデータの受け渡しといった処理が実行されることになる。 In process step S223, the presumed shake and the detected shake information are compared. Here, for example, the information of the presumed fluctuation is sent to the subsequent processing as a comparison result. Alternatively, a process of reflecting the difference of the comparison result in various data and utilizing it in the subsequent processes is performed. Normally, this system functions as a system stabilization control device, monitoring the system in real time, and assuming that it is used as an operator training simulator as appropriate, the meaning of comparison is switching between both functions or passing required data Processing will be executed.
処理ステップS30Aは、図3の処理ステップS30と同じ処理を行うが、利用するデータが検出動揺情報の代わりに比較動揺情報を用いた点で相違する。 The processing step S30A performs the same processing as the processing step S30 of FIG. 3, but is different in that the data to be used uses comparative shaking information instead of the detected shaking information.
上記構成によれば、運転員訓練シミュレータの教官による想定動揺に対して訓練員の対応を入力させ、最終的に処理ステップS50から回答としての制御対象、制御時間などを提示することでの訓練を行う装置としての利用が可能になる。 According to the above configuration, the training of the trainer by inputting the response of the trainer to the assumed fluctuation by the instructor of the trainer training simulator, and finally presenting the control target, the control time, etc. as a response from the processing step S50. It can be used as a device to perform.
実施例1における系統安定化制御装置の構成では、系統安定化制御装置200は電力系統全体の一部領域からここに配置された計測装置の情報を入手していた。これに対し、より広範囲の電力系統領域を対象とする場合の装置構成として、全系統安定化制御装置300を付加したものが図23の構成である。
In the configuration of the system stabilization control device according to the first embodiment, the system
図23の構成例において、系統安定化制御装置200は電力会社Aの電力系統を監視領域としたものであり、全系統安定化制御装置300は複数の電力会社を跨いで監視対象とするものとすることができる。あるいは、系統安定化制御装置200は電力会社Aの地域電力系統を監視領域としたものであり、全系統安定化制御装置300は当該電力会社の広域電力系統を監視対象とするものと位置付けることができる。また系統安定化制御装置200は、その監視領域ごとに複数設けられ、全系統安定化制御装置300はその上位に位置づけられて全体を監視するものとされてもよい。
In the configuration example of FIG. 23, the grid
図23の構成では、系統安定化制御装置200内に送信部17、全系統安定化制御装置300内に受信部41を備えて、系統安定化制御決定部10の情報が全系統安定化制御装置300に送られる。
In the configuration of FIG. 23, the
全系統安定化制御装置300内の設備情報データベースDBには、全域の設備情報が保持され、系統安定化制御追加決定部60では、広域での判断を行った結果として追加制御対象決定部42においてさらに制御すべき制御対象を決定し、その場合の追加制御時間を追加制御時間決定部で決定する。追加決定された操作内容は適宜通信系統を介して系統安定化制御決定部10側に送られ、追加操作が実行される。
The facility information database DB in the entire system
図24は、図23を実現するときのシステム構成を示している。なお全系統安定化制御装置300内において、301はCPU、302は表示装置、303は通信手段、304は入力手段、305はメモリである。
FIG. 24 shows a system configuration for realizing FIG. In the all-system
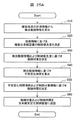
図25は、系統安定化制御装置200と全系統安定化制御装置300における処理フローを示している。図25Aが系統安定化制御装置200における処理フローであり、図25Bが全系統安定化制御装置300における処理フローである。
FIG. 25 shows a processing flow in the system
図25Aの処理フローは、基本的に図3の構成と同じであり、一連の処理後に処理ステップS60において制御対象及び制御時間を全系統安定化制御装置300に送るという点でのみ相違している。
The processing flow of FIG. 25A is basically the same as the configuration of FIG. 3, and is different only in that the control target and the control time are sent to the all-system
図25Bの処理フローは、基本的に図23の系統安定化制御追加決定部60の構成と同じであるが、その前提として処理ステップS70において制御対象及び制御時間を全系統安定化制御装置300から受信するという点で相違している。
The processing flow of FIG. 25B is basically the same as the configuration of the system stabilization control
最後に本発明の表現のための用語について説明する。系統安定化制御装置として、系統安定化制御装置200等が用いられてもよい。計測装置として、計測装置20等が用いられてもよい。記憶部として、記憶装置206等が用いられてもよい。受信部として、通信手段203等が用いられてもよい。演算部として、系統安定化制御決定部10等が用いられてもよい。設備情報として、設備情報DB等が用いられてもよい。通信線として、情報通信ネットワーク108等が用いられてもよい。動揺情報として、検出動揺情報等が用いられてもよい。監視装置として、系統安定化制御装置200等が用いられてもよい。
Finally, terms for expressing the present invention will be described. As the system stabilization control device, the system
10:系統安定化制御決定部
11:計測情報収集部
12:動揺検出部
13:制御優先度決定部
14:制御対象決定部
15:不安定化時間算出部
16:制御時間決定部
20:系統計測部
21:計測装置
30:情報記憶部
G:発電機
SS:変電所
C:調相機器
LD:電力負荷
PS:外部電力系統
108:情報通信ネットワーク
200:系統安定化制御装置
10: System stabilization control determination unit 11: Measurement information collection unit 12: Motion detection unit 13: Control priority determination unit 14: Control target determination unit 15: Destabilization time calculation unit 16: Control time determination unit 20: System measurement Unit 21: Measuring device 30: Information storage unit G: Generator SS: Substation C: Phase adjusting device LD: Power load PS: External power system 108: Information communication network 200: System stabilization control device
Claims (10)
前記電力系統に連系される系統設備の情報を格納する設備情報データベースと、前記系統設備の情報に基づき前記制御機器の制御優先度を決定する制御優先度決定部と、前記複数計測地点における計測情報および前記制御優先度に基づき制御対象を決定する制御対象決定部と、前記複数計測地点における計測情報から前記電力系統の不安定化時間を算出する不安定化時間算出部と、前記不安定化時間および前記系統設備の情報に基づき前記制御機器の制御時間を決定する制御時間決定部と、を備えることを特徴とする系統安定化制御装置。 A system stabilization control device that controls control equipment installed in the power system based on measurement information at a plurality of measurement points in the power system,
A facility information database that stores information on system facilities linked to the power system, a control priority determination unit that determines control priority of the control device based on the information on the system facilities, and measurement at the plurality of measurement points A control target determining unit that determines a control target based on information and the control priority, a destabilization time calculating unit that calculates a destabilization time of the power system from measurement information at the plurality of measurement points, and the destabilization A system stabilization control device, comprising: a control time determination unit that determines a control time of the control device based on time and information on the system facility.
前記不安定化時間算出部は、電力系統の動揺の周波数成分の動揺周波数、減衰係数、及び振幅の少なくとも何れか一つを用いて不安定化時間を算出することを特徴とする系統安定化制御装置。 The system stabilization control device according to claim 1,
The destabilization time calculation unit calculates the destabilization time using at least one of the oscillation frequency, the attenuation coefficient, and the amplitude of the frequency component of the oscillation of the power system. apparatus.
前記系統設備の情報は、前記制御機器を含む系統設備の制御手段、制御可能量、動作時間のうち少なくとも1つを含むことを特徴とする系統安定化制御装置。 The system stabilization control device according to claim 2,
The system stabilization control apparatus characterized in that the system facility information includes at least one of control means, controllable amount, and operation time of the system facility including the control device.
前記系統設備の情報は、前記複数の計測地点の夫々の緯度及び経度と、前記複数の計測地点の間のトポロジーと、前記複数の計測地点の間のインピーダンスと、前記複数の計測地点の夫々の近傍に連系している電力機器の特性との、少なくとも何れか一つを含む、ことを特徴とする系統安定化制御装置。 The system stabilization control device according to claim 3,
The information on the system facility includes the latitude and longitude of each of the plurality of measurement points, the topology between the plurality of measurement points, the impedance between the plurality of measurement points, and each of the plurality of measurement points. A system stabilization control device including at least one of the characteristics of a power device interconnected in the vicinity.
前記設備情報データベースは、過去の動揺情報を記憶し、前記動揺検出部は、前記計測地点群の状況に対応する前記過去の動揺情報を選択し、前記選択された過去の動揺情報における周波数成分の継続時間に基づいて、動揺影響度を算出することを特徴とすることを特徴とする系統安定化制御装置。 The system stabilization control device according to claim 4,
The facility information database stores past shaking information, and the shaking detecting unit selects the past shaking information corresponding to the situation of the measurement point group, and the frequency component of the selected past shaking information is selected. A system stabilization control device characterized in that the degree of fluctuation influence is calculated based on the duration.
前記制御対象決定部は、不安定動揺が観測される計測地点と前記制御機器連系地点との間の電気的距離または前記2地点間インピーダンスを用いて制御対象を決定することを特徴とする系統安定化制御装置。 The system stabilization control device according to claim 1,
The control target determining unit determines a control target using an electrical distance between the measurement point where unstable fluctuation is observed and the control device interconnection point or the impedance between the two points. Stabilization control device.
前記電力系統に連系される前記制御機器を含む系統設備の設備情報を格納する設備情報データベースと、前記設備情報に基づき前記制御機器の制御優先度を決定する制御優先度決定部と、前記計測情報から検知した電力系統動揺の動揺計測点と前記制御機器の距離と、前記優先度に応じて制御すべき前記制御機器を決定する制御対象決定部と、前記計測情報から検知した電力系統動揺の不安定化時間を算出する不安定化時間算出部と、前記不安定化時間および前記設備情報に基づき制御時間を決定する制御時間決定部を備え、決定した制御機器に対して決定した制御時間の制御を実行することを特徴とする系統安定化制御装置。
A system stabilization control device that controls control equipment installed in the power system based on measurement information at a plurality of measurement points in the power system,
A facility information database for storing facility information of a system facility including the control device linked to the power system, a control priority determining unit for determining a control priority of the control device based on the facility information, and the measurement The distance between the fluctuation measurement point of the electric power system detected from the information and the control device, the control target determining unit that determines the control device to be controlled according to the priority, and the electric power system fluctuation detected from the measurement information A destabilization time calculation unit for calculating the destabilization time, and a control time determination unit for determining a control time based on the destabilization time and the facility information, and the control time determined for the determined control device The system stabilization control apparatus characterized by performing control.
前記系統安定化制御装置は、前記電力系統に連系される系統設備の情報を格納する設備情報データベースと、前記系統設備の情報に基づき前記制御機器の制御優先度を決定する制御優先度決定部と、複数計測地点における計測情報および制御優先度に基づき制御対象を決定する制御対象決定部と、複数計測地点における計測情報から前記電力系統の不安定化時間を算出する不安定化時間算出部と、不安定化時間および前記設備情報に基づき制御時間を決定する制御時間決定部と、前記決定した制御機器と決定した制御時間を含む前記制御指令を前記第2の通信手段を介して与える出力部を備えることを特徴とする電力系統制御システム。 Measurement information at a plurality of measurement points in the power system is obtained in the system stabilization control device via the first communication means, and the control equipment in the system equipment constituting the power system is obtained via the second communication means. A power system control system that gives a control command from the system stabilization controller,
The system stabilization control device includes an equipment information database that stores information on system equipment linked to the power system, and a control priority determination unit that determines control priority of the control device based on the information on the system equipment A control target determining unit that determines a control target based on measurement information and control priority at a plurality of measurement points, and a destabilization time calculation unit that calculates a destabilization time of the power system from the measurement information at the plurality of measurement points. A control time determination unit that determines a control time based on the destabilization time and the facility information, and an output unit that provides the control command including the determined control device and the determined control time via the second communication unit A power system control system comprising:
前記系統安定化制御装置は、前記設備情報に基づき想定動揺を算出する想定動揺算出部と、前記計測情報および前記想定動揺を比較する動揺比較部とを備え、前記制御対象決定部は前記動揺比較結果および制御優先度に基づき制御対象を決定することを特徴とする電力系統制御システム。 The power system control system according to claim 8,
The system stabilization control device includes an assumed fluctuation calculation unit that calculates an assumed fluctuation based on the facility information, and a fluctuation comparison unit that compares the measurement information and the assumed fluctuation, and the control target determination unit includes the fluctuation comparison. A power system control system, wherein a control target is determined based on a result and a control priority.
前記系統安定化制御装置の前記出力部に接続されて、前記決定した制御機器と決定した制御時間を含む情報を得る全系統安定化制御装置を備え、
該全系統安定化制御装置は、受信した制御機器および制御時間に基づき追加制御機器および追加制御時間を決定する追加制御決定部と、該追加制御機器および追加制御時間を前記系統設備内の制御機器に対して送信する出力部を備えることを特徴とする電力系統制御システム。 The power system control system according to claim 8 or 9, wherein
Connected to the output unit of the system stabilization control device, comprising an entire system stabilization control device for obtaining information including the determined control device and the determined control time,
The all-system stabilization control device includes: an additional control determination unit that determines an additional control device and an additional control time based on the received control device and control time; and the additional control device and the additional control time that are included in the control equipment in the system facility. An electric power system control system comprising an output unit for transmitting to the power system.
Priority Applications (3)
| Application Number | Priority Date | Filing Date | Title |
|---|---|---|---|
| JP2015068757A JP6348862B2 (en) | 2015-03-30 | 2015-03-30 | System stabilization control device and power system control system |
| US15/555,571 US10461538B2 (en) | 2015-03-30 | 2016-03-04 | System stabilization control device and power system control system |
| PCT/JP2016/056699 WO2016158198A1 (en) | 2015-03-30 | 2016-03-04 | System stabilization control device and power system control system |
Applications Claiming Priority (1)
| Application Number | Priority Date | Filing Date | Title |
|---|---|---|---|
| JP2015068757A JP6348862B2 (en) | 2015-03-30 | 2015-03-30 | System stabilization control device and power system control system |
Publications (3)
| Publication Number | Publication Date |
|---|---|
| JP2016189664A true JP2016189664A (en) | 2016-11-04 |
| JP2016189664A5 JP2016189664A5 (en) | 2017-09-21 |
| JP6348862B2 JP6348862B2 (en) | 2018-06-27 |
Family
ID=57004516
Family Applications (1)
| Application Number | Title | Priority Date | Filing Date |
|---|---|---|---|
| JP2015068757A Active JP6348862B2 (en) | 2015-03-30 | 2015-03-30 | System stabilization control device and power system control system |
Country Status (3)
| Country | Link |
|---|---|
| US (1) | US10461538B2 (en) |
| JP (1) | JP6348862B2 (en) |
| WO (1) | WO2016158198A1 (en) |
Cited By (3)
| Publication number | Priority date | Publication date | Assignee | Title |
|---|---|---|---|---|
| WO2018154702A1 (en) * | 2017-02-24 | 2018-08-30 | 株式会社日立製作所 | Power grid decision-making support device and method, and system applying same |
| KR20180102903A (en) * | 2017-03-08 | 2018-09-18 | 엘에스산전 주식회사 | Reactive power compensation device |
| WO2018186001A1 (en) * | 2017-04-07 | 2018-10-11 | 株式会社日立製作所 | Power system stabilization device and power system stabilization method |
Families Citing this family (9)
| Publication number | Priority date | Publication date | Assignee | Title |
|---|---|---|---|---|
| JP6397760B2 (en) * | 2014-12-26 | 2018-09-26 | 株式会社日立製作所 | Power system stabilization apparatus and method |
| US10860000B2 (en) * | 2015-04-24 | 2020-12-08 | Hitachi, Ltd. | Power system stabilization system and method |
| US10983150B2 (en) | 2017-08-28 | 2021-04-20 | General Electric Technology Gmbh | Systems and methods for detecting and evaluating oscillations in an electrical power grid |
| JP7038011B2 (en) * | 2018-06-22 | 2022-03-17 | 株式会社日立製作所 | Power system operation support device and method, and vibration suppression system |
| CN109361264A (en) * | 2018-09-29 | 2019-02-19 | 广东电网有限责任公司 | A kind of double set mutual prosecution method and system of stability control device |
| CN109490622A (en) * | 2018-11-10 | 2019-03-19 | 王浩 | A kind of electricity data calibration technology based on tri-state information |
| CN109698512B (en) * | 2019-02-19 | 2022-08-30 | 武汉大学 | Method for analyzing migration characteristics of out-of-step oscillation center of photovoltaic centralized grid-connected system |
| CN110425092B (en) * | 2019-07-30 | 2020-06-16 | 华北电力大学 | Wind power grid-connected system oscillation source positioning system and method based on energy spectrum |
| CN112633583B (en) * | 2020-12-29 | 2023-07-11 | 南方电网调峰调频发电有限公司 | Method and device for predicting vibration of generator set, computer equipment and storage medium |
Citations (6)
| Publication number | Priority date | Publication date | Assignee | Title |
|---|---|---|---|---|
| JP2007288878A (en) * | 2006-04-14 | 2007-11-01 | Hitachi Ltd | Method and device for determining stability of power system |
| JP2011115003A (en) * | 2009-11-30 | 2011-06-09 | Toshiba Corp | System stabilization apparatus |
| JP2012170169A (en) * | 2011-02-09 | 2012-09-06 | Tohoku Electric Power Co Inc | Stabilization device for power system and control method thereof |
| JP2013198177A (en) * | 2012-03-15 | 2013-09-30 | Hitachi Ltd | Power system control device and power system method |
| JP2015192591A (en) * | 2014-03-31 | 2015-11-02 | 株式会社日立製作所 | system stability monitoring device and method |
| JP2016067098A (en) * | 2014-09-24 | 2016-04-28 | 株式会社日立製作所 | Power system monitoring device and power system monitoring system |
Family Cites Families (4)
| Publication number | Priority date | Publication date | Assignee | Title |
|---|---|---|---|---|
| JPH0946908A (en) | 1995-07-28 | 1997-02-14 | Toshiba Corp | Stabilizing equipment of power system |
| WO2006090538A1 (en) * | 2005-02-22 | 2006-08-31 | Kyushu Institute Of Technology | System stability control method and system for electric power system |
| JPWO2011118766A1 (en) * | 2010-03-25 | 2013-07-04 | 三洋電機株式会社 | Power supply system, centralized management device, system stabilization system, centralized management device control method, and centralized management device control program |
| US20120316696A1 (en) * | 2011-06-08 | 2012-12-13 | Alstom Grid | Multi-level topologytopography for electrical distribution grid control |
-
2015
- 2015-03-30 JP JP2015068757A patent/JP6348862B2/en active Active
-
2016
- 2016-03-04 WO PCT/JP2016/056699 patent/WO2016158198A1/en active Application Filing
- 2016-03-04 US US15/555,571 patent/US10461538B2/en active Active
Patent Citations (6)
| Publication number | Priority date | Publication date | Assignee | Title |
|---|---|---|---|---|
| JP2007288878A (en) * | 2006-04-14 | 2007-11-01 | Hitachi Ltd | Method and device for determining stability of power system |
| JP2011115003A (en) * | 2009-11-30 | 2011-06-09 | Toshiba Corp | System stabilization apparatus |
| JP2012170169A (en) * | 2011-02-09 | 2012-09-06 | Tohoku Electric Power Co Inc | Stabilization device for power system and control method thereof |
| JP2013198177A (en) * | 2012-03-15 | 2013-09-30 | Hitachi Ltd | Power system control device and power system method |
| JP2015192591A (en) * | 2014-03-31 | 2015-11-02 | 株式会社日立製作所 | system stability monitoring device and method |
| JP2016067098A (en) * | 2014-09-24 | 2016-04-28 | 株式会社日立製作所 | Power system monitoring device and power system monitoring system |
Cited By (6)
| Publication number | Priority date | Publication date | Assignee | Title |
|---|---|---|---|---|
| WO2018154702A1 (en) * | 2017-02-24 | 2018-08-30 | 株式会社日立製作所 | Power grid decision-making support device and method, and system applying same |
| JPWO2018154702A1 (en) * | 2017-02-24 | 2019-06-27 | 株式会社日立製作所 | Decision support apparatus and method in power system, and application system thereof |
| KR20180102903A (en) * | 2017-03-08 | 2018-09-18 | 엘에스산전 주식회사 | Reactive power compensation device |
| KR102371874B1 (en) * | 2017-03-08 | 2022-03-08 | 엘에스일렉트릭(주) | Reactive power compensation device |
| WO2018186001A1 (en) * | 2017-04-07 | 2018-10-11 | 株式会社日立製作所 | Power system stabilization device and power system stabilization method |
| JP2018182844A (en) * | 2017-04-07 | 2018-11-15 | 株式会社日立製作所 | Power system stabilization apparatus and power system stabilization method |
Also Published As
| Publication number | Publication date |
|---|---|
| US10461538B2 (en) | 2019-10-29 |
| US20180054059A1 (en) | 2018-02-22 |
| WO2016158198A1 (en) | 2016-10-06 |
| JP6348862B2 (en) | 2018-06-27 |
Similar Documents
| Publication | Publication Date | Title |
|---|---|---|
| JP6348862B2 (en) | System stabilization control device and power system control system | |
| JP6177208B2 (en) | Power system monitoring apparatus and power system monitoring system | |
| JP6205329B2 (en) | System stability monitoring device and system stability monitoring system | |
| Hayes et al. | A closed-loop state estimation tool for MV network monitoring and operation | |
| Jiang et al. | Projection pursuit: a general methodology of wide-area coherency detection in bulk power grid | |
| Wu et al. | Synchrophasor-based monitoring of critical generator buses for transient stability | |
| WO2019220706A1 (en) | Power grid supply and demand adjustment monitoring device and power grid supply and demand adjustment monitoring method | |
| JP5923454B2 (en) | Power system management apparatus and method | |
| Lashgari et al. | Fast online decision tree-based scheme for predicting transient and short-term voltage stability status and determining driving force of instability | |
| US20150084432A1 (en) | Power System Management Device and Method | |
| JP2016086461A (en) | Power system monitoring device and power system monitoring method | |
| JP2019216534A (en) | Electric power system monitoring system, electric power system monitoring method, and program | |
| JP6244247B2 (en) | System stability monitoring apparatus and method | |
| US11178610B2 (en) | Adaptive method for aggregation of distributed loads to provide emergency frequency support | |
| Loud et al. | Hydro-Québec's challenges and experiences in on-line DSA applications | |
| US20150253797A1 (en) | Methods for reducing solar inverter output volatility, and related nodes and solar inverters | |
| Zhong et al. | Wind power forecasting and integration to power grids | |
| Wang et al. | An investigation into WAMS-based Under-frequency load shedding | |
| Wu et al. | Monitoring power system transient stability using synchrophasor data | |
| JP6818658B2 (en) | Power system monitoring system, power system monitoring method, and program | |
| JP2019193387A (en) | Power system monitoring device and power system monitoring method | |
| Zhou | Online voltage stability prediction and control using computational intelligence technique | |
| BİLGEN | PMU BASED ONLINE GRID VOLTAGE STABILITY ASSESSMENT | |
| JP6996998B2 (en) | Power system monitoring device | |
| Zheng | Power system online stability assessment using synchrophasor data mining |
Legal Events
| Date | Code | Title | Description |
|---|---|---|---|
| A521 | Request for written amendment filed |
Free format text: JAPANESE INTERMEDIATE CODE: A523 Effective date: 20170809 |
|
| A621 | Written request for application examination |
Free format text: JAPANESE INTERMEDIATE CODE: A621 Effective date: 20170809 |
|
| TRDD | Decision of grant or rejection written | ||
| A01 | Written decision to grant a patent or to grant a registration (utility model) |
Free format text: JAPANESE INTERMEDIATE CODE: A01 Effective date: 20180515 |
|
| A61 | First payment of annual fees (during grant procedure) |
Free format text: JAPANESE INTERMEDIATE CODE: A61 Effective date: 20180601 |
|
| R150 | Certificate of patent or registration of utility model |
Ref document number: 6348862 Country of ref document: JP Free format text: JAPANESE INTERMEDIATE CODE: R150 |