JP2015517841A - Method and instrument for measuring information indicative of cardiac dysfunction and abnormality - Google Patents
Method and instrument for measuring information indicative of cardiac dysfunction and abnormality Download PDFInfo
- Publication number
- JP2015517841A JP2015517841A JP2015507565A JP2015507565A JP2015517841A JP 2015517841 A JP2015517841 A JP 2015517841A JP 2015507565 A JP2015507565 A JP 2015507565A JP 2015507565 A JP2015507565 A JP 2015507565A JP 2015517841 A JP2015517841 A JP 2015517841A
- Authority
- JP
- Japan
- Prior art keywords
- signal
- peak
- waveform
- time
- heart rate
- Prior art date
- Legal status (The legal status is an assumption and is not a legal conclusion. Google has not performed a legal analysis and makes no representation as to the accuracy of the status listed.)
- Granted
Links
Images

Classifications
-
- A—HUMAN NECESSITIES
- A61—MEDICAL OR VETERINARY SCIENCE; HYGIENE
- A61B—DIAGNOSIS; SURGERY; IDENTIFICATION
- A61B5/00—Measuring for diagnostic purposes; Identification of persons
- A61B5/24—Detecting, measuring or recording bioelectric or biomagnetic signals of the body or parts thereof
- A61B5/316—Modalities, i.e. specific diagnostic methods
- A61B5/318—Heart-related electrical modalities, e.g. electrocardiography [ECG]
- A61B5/346—Analysis of electrocardiograms
- A61B5/349—Detecting specific parameters of the electrocardiograph cycle
-
- A—HUMAN NECESSITIES
- A61—MEDICAL OR VETERINARY SCIENCE; HYGIENE
- A61B—DIAGNOSIS; SURGERY; IDENTIFICATION
- A61B5/00—Measuring for diagnostic purposes; Identification of persons
- A61B5/103—Measuring devices for testing the shape, pattern, colour, size or movement of the body or parts thereof, for diagnostic purposes
- A61B5/11—Measuring movement of the entire body or parts thereof, e.g. head or hand tremor or mobility of a limb
- A61B5/1102—Ballistocardiography
-
- A—HUMAN NECESSITIES
- A61—MEDICAL OR VETERINARY SCIENCE; HYGIENE
- A61B—DIAGNOSIS; SURGERY; IDENTIFICATION
- A61B5/00—Measuring for diagnostic purposes; Identification of persons
- A61B5/24—Detecting, measuring or recording bioelectric or biomagnetic signals of the body or parts thereof
- A61B5/316—Modalities, i.e. specific diagnostic methods
- A61B5/318—Heart-related electrical modalities, e.g. electrocardiography [ECG]
- A61B5/346—Analysis of electrocardiograms
- A61B5/349—Detecting specific parameters of the electrocardiograph cycle
- A61B5/35—Detecting specific parameters of the electrocardiograph cycle by template matching
-
- A—HUMAN NECESSITIES
- A61—MEDICAL OR VETERINARY SCIENCE; HYGIENE
- A61B—DIAGNOSIS; SURGERY; IDENTIFICATION
- A61B5/00—Measuring for diagnostic purposes; Identification of persons
- A61B5/24—Detecting, measuring or recording bioelectric or biomagnetic signals of the body or parts thereof
- A61B5/316—Modalities, i.e. specific diagnostic methods
- A61B5/318—Heart-related electrical modalities, e.g. electrocardiography [ECG]
- A61B5/346—Analysis of electrocardiograms
- A61B5/349—Detecting specific parameters of the electrocardiograph cycle
- A61B5/352—Detecting R peaks, e.g. for synchronising diagnostic apparatus; Estimating R-R interval
-
- A—HUMAN NECESSITIES
- A61—MEDICAL OR VETERINARY SCIENCE; HYGIENE
- A61B—DIAGNOSIS; SURGERY; IDENTIFICATION
- A61B5/00—Measuring for diagnostic purposes; Identification of persons
- A61B5/24—Detecting, measuring or recording bioelectric or biomagnetic signals of the body or parts thereof
- A61B5/316—Modalities, i.e. specific diagnostic methods
- A61B5/318—Heart-related electrical modalities, e.g. electrocardiography [ECG]
- A61B5/346—Analysis of electrocardiograms
- A61B5/349—Detecting specific parameters of the electrocardiograph cycle
- A61B5/361—Detecting fibrillation
-
- A—HUMAN NECESSITIES
- A61—MEDICAL OR VETERINARY SCIENCE; HYGIENE
- A61B—DIAGNOSIS; SURGERY; IDENTIFICATION
- A61B5/00—Measuring for diagnostic purposes; Identification of persons
- A61B5/72—Signal processing specially adapted for physiological signals or for diagnostic purposes
- A61B5/7235—Details of waveform analysis
- A61B5/7246—Details of waveform analysis using correlation, e.g. template matching or determination of similarity
-
- A—HUMAN NECESSITIES
- A61—MEDICAL OR VETERINARY SCIENCE; HYGIENE
- A61B—DIAGNOSIS; SURGERY; IDENTIFICATION
- A61B5/00—Measuring for diagnostic purposes; Identification of persons
- A61B5/72—Signal processing specially adapted for physiological signals or for diagnostic purposes
- A61B5/7271—Specific aspects of physiological measurement analysis
- A61B5/7275—Determining trends in physiological measurement data; Predicting development of a medical condition based on physiological measurements, e.g. determining a risk factor
-
- G—PHYSICS
- G16—INFORMATION AND COMMUNICATION TECHNOLOGY [ICT] SPECIALLY ADAPTED FOR SPECIFIC APPLICATION FIELDS
- G16H—HEALTHCARE INFORMATICS, i.e. INFORMATION AND COMMUNICATION TECHNOLOGY [ICT] SPECIALLY ADAPTED FOR THE HANDLING OR PROCESSING OF MEDICAL OR HEALTHCARE DATA
- G16H50/00—ICT specially adapted for medical diagnosis, medical simulation or medical data mining; ICT specially adapted for detecting, monitoring or modelling epidemics or pandemics
- G16H50/20—ICT specially adapted for medical diagnosis, medical simulation or medical data mining; ICT specially adapted for detecting, monitoring or modelling epidemics or pandemics for computer-aided diagnosis, e.g. based on medical expert systems
-
- G—PHYSICS
- G16—INFORMATION AND COMMUNICATION TECHNOLOGY [ICT] SPECIALLY ADAPTED FOR SPECIFIC APPLICATION FIELDS
- G16H—HEALTHCARE INFORMATICS, i.e. INFORMATION AND COMMUNICATION TECHNOLOGY [ICT] SPECIALLY ADAPTED FOR THE HANDLING OR PROCESSING OF MEDICAL OR HEALTHCARE DATA
- G16H50/00—ICT specially adapted for medical diagnosis, medical simulation or medical data mining; ICT specially adapted for detecting, monitoring or modelling epidemics or pandemics
- G16H50/30—ICT specially adapted for medical diagnosis, medical simulation or medical data mining; ICT specially adapted for detecting, monitoring or modelling epidemics or pandemics for calculating health indices; for individual health risk assessment
-
- Y—GENERAL TAGGING OF NEW TECHNOLOGICAL DEVELOPMENTS; GENERAL TAGGING OF CROSS-SECTIONAL TECHNOLOGIES SPANNING OVER SEVERAL SECTIONS OF THE IPC; TECHNICAL SUBJECTS COVERED BY FORMER USPC CROSS-REFERENCE ART COLLECTIONS [XRACs] AND DIGESTS
- Y10—TECHNICAL SUBJECTS COVERED BY FORMER USPC
- Y10S—TECHNICAL SUBJECTS COVERED BY FORMER USPC CROSS-REFERENCE ART COLLECTIONS [XRACs] AND DIGESTS
- Y10S128/00—Surgery
- Y10S128/901—Suppression of noise in electric signal
Landscapes
- Health & Medical Sciences (AREA)
- Life Sciences & Earth Sciences (AREA)
- Cardiology (AREA)
- Engineering & Computer Science (AREA)
- Public Health (AREA)
- Medical Informatics (AREA)
- Biomedical Technology (AREA)
- Pathology (AREA)
- General Health & Medical Sciences (AREA)
- Molecular Biology (AREA)
- Physics & Mathematics (AREA)
- Heart & Thoracic Surgery (AREA)
- Biophysics (AREA)
- Veterinary Medicine (AREA)
- Surgery (AREA)
- Animal Behavior & Ethology (AREA)
- Physiology (AREA)
- Artificial Intelligence (AREA)
- Computer Vision & Pattern Recognition (AREA)
- Psychiatry (AREA)
- Signal Processing (AREA)
- Dentistry (AREA)
- Oral & Maxillofacial Surgery (AREA)
- Databases & Information Systems (AREA)
- Data Mining & Analysis (AREA)
- Epidemiology (AREA)
- Primary Health Care (AREA)
- Measurement And Recording Of Electrical Phenomena And Electrical Characteristics Of The Living Body (AREA)
- Measuring Pulse, Heart Rate, Blood Pressure Or Blood Flow (AREA)
- Electrotherapy Devices (AREA)
- Measurement Of The Respiration, Hearing Ability, Form, And Blood Characteristics Of Living Organisms (AREA)
Abstract
心臓の機能不全と異常を表す情報を測定するための器械は心臓血管の動きを表す信号から振幅の変化を検出する、ように構成されている処理装置(402)を含み、処理装置は心臓活動に関連する電磁現象を表す信号から心拍数を繰り返す第1波形を抽出し、且つ、前記第2信号から前記心拍数を繰り返す第2波形を抽出するように構成されている。処理装置は各タイミング値がある1つの心拍周期に属する前記第1波形の基準点から同一の心拍周期に属する前記第2波形の基準点までの時間を表すタイミングデータを作成する。処理装置は、少なくとも部分的にタイミングデータに基づき、心臓の機能不全と異常を表す情報を測定する。
【選択図】図4An apparatus for measuring information indicative of cardiac dysfunction and abnormality includes a processing unit (402) configured to detect a change in amplitude from a signal representative of cardiovascular motion, wherein the processing unit is a cardiac activity. A first waveform that repeats the heart rate is extracted from a signal that represents an electromagnetic phenomenon related to, and a second waveform that repeats the heart rate is extracted from the second signal. The processing device creates timing data representing the time from the reference point of the first waveform belonging to one heartbeat period to the reference point of the second waveform belonging to the same heartbeat period. The processing device measures information representing cardiac dysfunction and abnormality based at least in part on the timing data.
[Selection] Figure 4
Description
本発明は概して心臓の機能不全と異常、例えば、心房細動などを表す情報を測定することに関する。
より具体的には、本発明は心臓の機能不全と異常を表す情報を測定するための器械と方法に関する。
さらに、本発明は心臓の機能不全と異常を表す情報を測定するためのコンピュータプログラムに関する。
The present invention relates generally to measuring information representing cardiac dysfunction and abnormalities, such as atrial fibrillation.
More specifically, the present invention relates to an instrument and method for measuring information indicative of cardiac dysfunction and abnormalities.
Furthermore, the present invention relates to a computer program for measuring information representing cardiac dysfunction and abnormality.
心臓血管系において生じ得る機能不全と異常は、診断されず、適切に治療又は改善されなかった場合、特に、個体がストレスに出会った時に冠動脈の酸素需要を満足させる充分な酸素を供給する心臓血管系の能力を漸進的に低下させ得る。
現在では、心臓活動に関連する電磁現象に基づく心拍記録法、心エコー検査法、及び心臓血管の動きに基づく心拍記録法などの方法が様々な心臓の機能不全と異常の特定と評価において用いられている。
心臓活動に関連する電磁現象に基づく心拍記録法のよく知られている例は心電図記録法「ECG」であり、心臓血管の動きに基づく心拍記録法の例はバリストカルジオグラフィー「BCG」及びサイスモカルジオグラフィー「SCG」である。
心エコー検査法は心臓の切片の画像を提供し、且つ、心臓の構造と機能についての包括的な情報を提供することができるが、高価な機器と特別な操作担当者を必要とする。
ECGは心臓の電気的評価をかなり速く与えるが、収縮力に関連するどのような情報も提供しない。
心臓血管の動きに基づく心拍記録法は心臓血管の動きを表す信号の測定を伴う。
以前はその信号は、動きを測定するための器械が用意されているベッドに個体が横たわっている間に、又は、脚の脛のいたる所に取り付けられた支援装置が存在する間に取得された。
現在では、その信号は、心臓の動きを表す微細な動きを測定するのに適切である小さなセンサ素子、例えば加速度センサを使用して取得され得る。
Dysfunctions and abnormalities that can occur in the cardiovascular system have not been diagnosed and have not been properly treated or ameliorated, especially when the individual encounters stress, providing cardiovascular with sufficient oxygen to satisfy coronary oxygen demand The capacity of the system can be gradually reduced.
Currently, methods such as heart rate recording based on electromagnetic phenomena related to cardiac activity, echocardiography, and heart rate recording based on cardiovascular movement are used to identify and evaluate various cardiac dysfunctions and abnormalities. ing.
A well-known example of a heart rate recording method based on electromagnetic phenomena related to cardiac activity is an electrocardiographic recording method “ECG”, and an example of a heart rate recording method based on cardiovascular movement is a ballist cardiography “BCG” Cardiography “SCG”.
Echocardiography provides an image of a heart section and can provide comprehensive information about the structure and function of the heart, but requires expensive equipment and specialized personnel.
ECG provides a heart electrical assessment fairly quickly, but does not provide any information related to contractile force.
Heart rate recording methods based on cardiovascular motion involve the measurement of signals representative of cardiovascular motion.
Previously, the signal was acquired while the individual was lying in a bed where instruments for measuring movement were prepared, or while there was a support device attached throughout the shin of the leg .
Currently, the signal can be obtained using a small sensor element, such as an acceleration sensor, that is suitable for measuring fine movements representing heart movement.
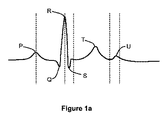
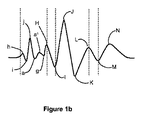
図1a、図1bは、律動的な電気的機能と関連の心臓血管の動きとの間の関係を示す。
図1aはECG波形の例を示し、図1bは、心臓血管の動きを表し、通常はy方向と呼ばれる「頭足」方向で加速度センサによって測定された例となる信号の波形を示す。
例示を目的として基本的な心臓機能の簡単な説明を下に提供する。
1a and 1b show the relationship between rhythmic electrical function and associated cardiovascular movement.
FIG. 1 a shows an example of an ECG waveform, and FIG. 1 b shows the waveform of an exemplary signal that represents cardiovascular motion and is measured by an acceleration sensor in a “head-and-foot” direction, commonly referred to as the y-direction.
For purposes of illustration, a brief description of basic cardiac function is provided below.
心臓は4つの小室を含む。
右心房は三尖弁によって右心室と相互接続されており、左心房は僧帽弁によって左心室によって相互接続されている。
血液は上大静脈を介して上半身から右心房に、下大静脈を介して下半身から右心房に送られる。
右心房の心筋と右心室の乳頭筋が同時に収縮して三尖弁が開き、それによって血液が右心房から右心室へ流れる。
その後、その乳頭筋が弛緩して三尖弁が閉じる。
右心室の心筋が収縮すると、血液が肺動脈弁を通って右心室から血液を肺に送る肺動脈へ押し出され、そこで血液は酸素負荷される。
次に酸素負荷された血液は肺静脈を介して左心房へ送られる。
酸素負荷された血液は、血液の左心房から左心室へ流れを可能にする左心房の心筋と左心室の乳頭筋の同時収縮により僧帽弁が開いたときに左心房から左心室へ流れる。
その後、その乳頭筋が弛緩して僧帽弁が閉じる。
次に酸素負荷された血液は大動脈弁を通って左心室から酸素負荷された血液を末梢血管系に送る大動脈へ押し出される。
The heart includes four chambers.
The right atrium is interconnected to the right ventricle by a tricuspid valve, and the left atrium is interconnected by the left ventricle by a mitral valve.
Blood is sent from the upper body to the right atrium via the superior vena cava and from the lower body to the right atrium via the inferior vena cava.
The right atrial myocardium and right ventricular papillary muscle contract simultaneously, opening the tricuspid valve, which causes blood to flow from the right atrium to the right ventricle.
Thereafter, the papillary muscles relax and the tricuspid valve closes.
As the right ventricular myocardium contracts, blood is forced through the pulmonary valve from the right ventricle into the pulmonary artery that delivers blood to the lungs, where it is oxygenated.
The oxygenated blood is then sent to the left atrium via the pulmonary vein.
Oxygenated blood flows from the left atrium to the left ventricle when the mitral valve is opened by simultaneous contraction of the left atrial myocardium and the left ventricular papillary muscle, which allows blood to flow from the left atrium to the left ventricle.
Thereafter, the papillary muscles relax and the mitral valve closes.
The oxygenated blood is then pushed through the aortic valve from the left ventricle to the aorta that delivers oxygenated blood to the peripheral vasculature.
各心拍周期は心房収縮期、心室収縮期及び心臓拡張期の主要な3つのステージを伴う。
心房収縮期は右心房と左心房を取り囲む心筋の収縮期である。
両方の心房が乳頭筋の収縮により同時に収縮してそれにより三尖弁と僧帽弁を開放させる。
心臓の小室の筋肉組織を刺激してそれらを収縮させる電気的活性、すなわち、電気的収縮は右心房に位置する洞房結節において始まる。
電気的脱分極の伝達が続いて、各心房筋細胞を次々と脱分極させる両方の心房を介して波として下方、左方、及び後方へ伝わる。
この電荷の伝播を図1aに示されるECG波形上のP波として見ることができる。
この直後に、図1bに示される波形のhピーク(peak)に対応するインパクトと図1bに示される波形のiバレー(valley)に対応する反動として検出される心房の機械的収縮が続く。
右心房と左心房が収縮し始めると、右心室と左心室への高速の血流が生じ、それは図1bに示される波形上のjピークにより表される。
三尖弁が閉じ始めると、続いている心房の収縮によってさらに右心室と左心室への低速の血流が生じる。
その追加的な血流は「心房キック」と呼ばれ、図1bに示される波形の「a−a1」波複合に対応する。
心房が空になった後に三尖弁と僧帽弁が閉じ、それにより図1bに示される波形上の下行g波が生じる。
心室収縮は左心室と右心室の筋肉の収縮であり、図1aに示されるECG波形の「Q−R−S」波複合を生じる心室心筋層の電気的脱分極によって引き起こされる。
下行Q波は、「ヒス束」と呼ばれる特別な細胞群に沿う中隔を通る脱分極の下降流によって引き起こされる。
Rピークは心室筋肉組織の脱分極によって生じ、S波は心房と心室の間の心臓組織の脱分極によって生じる。
脱分極が中隔を下り、心室心筋層中に伝わると、心房と洞房結節が分極し始める。
三尖弁と僧帽弁の閉鎖が心室収縮期の始まりであり、心臓が拍動するときに心臓によって生じるラブ・ダブ(lub−dub)音の1番目の部分を生じる。
この音は通常は「1音」として知られている。心室心筋層の電気的脱分極がピークに達すると、右心室と左心室を分ける房室「AV」中隔が収縮し、図1bに示される波形上のHピークに対応するインパクトと図1bに示される波形上のIバレーに対する反動を引き起こす。
心室の収縮により血液が肺動脈弁を介して右心室から肺動脈へ、及び大動脈弁を介して左心室から大動脈へ非常に高速で押し出され、それにより図1bに示される波形上のJピークが生じる。
左心室から大動脈への血流の減速により、図1bに示される波形上の下行K波が生じる。
左心室が空になるとその圧力は大動脈の圧力よりも下に落ち、大動脈弁が閉じる。
同様に、右心室の圧力が肺動脈の圧力よりも下に落ちると肺動脈弁が閉じる。
ラブ・ダブ音の2番目の部分は通常は「2音」として知られており、心室収縮期の終わりの肺動脈弁と大動脈弁の閉鎖によって生じ、それにより図1bに示される波形上の上行L波が生じる。
肺動脈弁と大動脈弁の閉鎖と同時に房室「AV」中隔が弛緩及び上昇し、心室心筋層が再分極して図1aに示されるECG波形上のT波が生じる。
心臓拡張期は心房拡張期と心室拡張期を含み、心臓が収縮後に弛緩し、且つ、循環血液で再補充される準備をしている期間である。
心房拡張期は右心房と左心房が弛緩している期間であり、心室拡張期は右心室と左心室が弛緩している期間である。
心房拡張期の間に右心房は脱酸素化された血液によって再補充され、左心房は酸素負荷された血液によって再補充される。
心房の再補充によって図1bに示される波形上の下行M波がヒス束細胞の再分極と同時に起こる拡張期の初期に生じ、その再分極はECG波形のU波として示される。
右心房と左心房がそれらの最大容量まで補充されると三尖弁と僧帽弁への血液の逆流により、図1bに示される波形上の上行N波が生じる。
Each heart cycle involves three main stages: atrial systole, ventricular systole and diastole.
The atrial systole is the systole of the myocardium that surrounds the right and left atria.
Both atria contract simultaneously with papillary muscle contraction, thereby opening the tricuspid and mitral valves.
Electrical activity that stimulates the musculature of the heart chambers to contract them, ie, electrical contraction, begins in the sinoatrial node located in the right atrium.
The transmission of electrical depolarization follows and propagates downward, leftward and posterior as waves through both atria, which in turn depolarize each atrial myocyte.
This charge propagation can be seen as a P wave on the ECG waveform shown in FIG.
This is immediately followed by an atrial mechanical contraction detected as an impact corresponding to the h peak of the waveform shown in FIG. 1b and a reaction corresponding to the i valley of the waveform shown in FIG. 1b.
As the right and left atria begin to contract, a fast blood flow to the right and left ventricles occurs, which is represented by the j peak on the waveform shown in FIG. 1b.
As the tricuspid valve begins to close, subsequent atrial contraction further creates a slow blood flow to the right and left ventricles.
That additional blood flow is called an “atrial kick” and corresponds to the “aa 1 ” wave complex of the waveform shown in FIG.
After the atrium is emptied, the tricuspid and mitral valves close, thereby producing a descending g wave on the waveform shown in FIG. 1b.
Ventricular contraction is the contraction of the left and right ventricular muscles and is caused by the electrical depolarization of the ventricular myocardium that produces the “QRS” wave complex of the ECG waveform shown in FIG. 1a.
The descending Q wave is caused by the downward flow of depolarization through the septum along a special group of cells called the “His bundle”.
The R peak is caused by depolarization of ventricular musculature and the S wave is caused by depolarization of heart tissue between the atria and ventricles.
As depolarization goes down the septum and propagates into the ventricular myocardium, the atrium and sinoatrial node begin to polarize.
Tricuspid and mitral valve closure is the beginning of the ventricular systole, producing the first part of the lub-dub sound produced by the heart as the heart beats.
This sound is usually known as “one sound”. When the electrical depolarization of the ventricular myocardium reaches a peak, the atrioventricular “AV” septum separating the right and left ventricles contracts, and the impact corresponding to the H peak on the waveform shown in FIG. Causes a recoil to the I valley on the waveform shown.
Ventricular contraction pushes blood through the pulmonary valve from the right ventricle to the pulmonary artery and from the left ventricle to the aorta through the aortic valve at a very high rate, thereby producing a J peak on the waveform shown in FIG. 1b.
The slowing of blood flow from the left ventricle to the aorta produces a descending K wave on the waveform shown in FIG. 1b.
When the left ventricle is emptied, its pressure drops below the aortic pressure and the aortic valve closes.
Similarly, the pulmonary valve closes when the right ventricular pressure drops below the pulmonary artery pressure.
The second part of the love dub is usually known as the “two-tone” and is caused by the closure of the pulmonary and aortic valves at the end of the ventricular systole, thereby causing the ascending L on the waveform shown in FIG. 1b. A wave is generated.
Simultaneously with the closure of the pulmonary and aortic valves, the atrioventricular “AV” septum relaxes and rises and the ventricular myocardium repolarizes, producing a T wave on the ECG waveform shown in FIG.
The diastole includes the atrial diastole and the ventricular diastole and is the period in which the heart relaxes after contraction and is ready to be refilled with circulating blood.
The atrial diastole is a period in which the right atrium and the left atrium are relaxed, and the ventricular diastole is a period in which the right ventricle and the left ventricle are relaxed.
During the atrial diastole, the right atrium is refilled with deoxygenated blood and the left atrium is refilled with oxygenated blood.
Due to atrial refilling, the descending M wave on the waveform shown in FIG. 1b occurs early in the diastole, coincident with the repolarization of the His bundle cells, which repolarization is shown as the U wave of the ECG waveform.
As the right and left atria are replenished to their maximum volume, the regurgitation of blood to the tricuspid and mitral valves produces an ascending N wave on the waveform shown in FIG. 1b.
特許文献1は、前胸部の加速血流シグナルを記録することにより対象の心収縮力を評価するための方法を記載する。
特許文献2は個体の生理的状態をモニターし、その異常を検出するための方法を記載する。
その方法は、ECG信号である第1信号と心臓血管の動きを表す第2信号を同時に受信することを含む。
U.S. Patent No. 6,057,031 describes a method for evaluating a subject's cardiac contractile force by recording an accelerated blood flow signal in the anterior chest.
Patent Document 2 describes a method for monitoring the physiological state of an individual and detecting the abnormality.
The method includes simultaneously receiving a first signal that is an ECG signal and a second signal representing cardiovascular motion.
心臓血管の動きを表す波形の分析は、異常な心臓血管機能を正常な事例と区別するために通常は有資格の診断医によって視覚的に実施される。
しかしながら、多くの場合では、例えば、心房細動などのある特定の心臓の機能不全と異常を視覚的分析により見つけ出すことは困難であり得る。
したがって、心臓の機能不全と異常を表す情報を測定するための方法と器械の必要性が存在する。
Analysis of the waveform representing cardiovascular movement is usually performed visually by a qualified diagnostician to distinguish abnormal cardiovascular function from normal cases.
However, in many cases, it can be difficult to find by visual analysis certain cardiac dysfunctions and abnormalities, such as, for example, atrial fibrillation.
Accordingly, there is a need for methods and instruments for measuring information indicative of cardiac dysfunction and abnormalities.
次に、発明の様々な実施形態のうちの幾つかの態様を基本的に理解してもらうために簡略化した概要を提示する。
本概要は本発明の広範囲にわたる概説ではない。
それは本発明の重要又は重大な要素を特定することを意図しても、本発明の範囲を詳しく説明することを意図してもいない。
次の概要は、本発明の好ましい実施形態のさらに詳しい説明の前置きとなる本発明の簡略化された幾つかの構想を提示するだけのものである。
The following presents a simplified summary in order to provide a basic understanding of some aspects of the various embodiments of the invention.
This summary is not an extensive overview of the invention.
It is not intended to identify key or critical elements of the invention or to delineate the scope of the invention.
The following summary merely presents some simplified concepts of the invention as a prelude to a more detailed description of the preferred embodiment of the invention.
本発明により、心臓の機能不全と異常、例えば、心房細動を表す情報を測定するための新しい方法が提供される。
本発明による方法は、
−心臓活動に関連する電磁現象を表す第1信号からある心拍数を繰り返す第1波形を抽出するステップと、
−心臓血管の動きを表す第2信号からその心拍数を繰り返す第2波形を抽出するステップと、
−各タイミング値がある1つの心拍周期に属する第1波形の基準点から同一の心拍周期に属する第2波形の基準点までの時間を表すタイミングデータを作成するステップと、
−前記タイミングデータと前記の心拍数を表すペーシングデータとの間の相関を決定するステップと、
を含み、
その相関が心臓の機能不全と異常を表す。
The present invention provides a new method for measuring information representative of cardiac dysfunction and abnormalities, such as atrial fibrillation.
The method according to the invention comprises:
Extracting a first waveform that repeats a heart rate from a first signal representative of an electromagnetic phenomenon associated with cardiac activity;
Extracting a second waveform that repeats the heart rate from a second signal representative of cardiovascular motion;
Creating timing data representing time from a reference point of a first waveform belonging to one heartbeat period to a reference point of a second waveform belonging to the same heartbeat period, each timing value;
-Determining a correlation between the timing data and the pacing data representing the heart rate;
Including
The correlation represents cardiac dysfunction and abnormality.
第2波形が第1信号上の第1波形に対する心臓の応答を表すものであるように第2波形が選択されることが好都合である。
第1信号は、例えば、心電計「ECG」波形又は誘導的に測定された波形を表し得る。
第1波形は、必ずというわけではないが、例えば、図1aに示されるECG波形上の「Q−R−S」波複合のRピークであり得、第2波形は、必ずというわけではないが、例えば、図1bに示される波形上のJピークであり得る。
この場合、Rピークの頂点は第1波形の基準点として使用され得、Jピークの頂点は第2波形の基準点として使用され得、各タイミング値はRピークの頂点の瞬間からJピークの頂点の瞬間までの時間を表し得る。
別の例では、第2波形は通常はz方向と呼ばれる「通胸」方向で測定された心臓血管の動きを表す波形上の大動脈弁開放「AO」ピークであり得る。
Conveniently, the second waveform is selected such that the second waveform represents the cardiac response to the first waveform on the first signal.
The first signal may represent, for example, an electrocardiograph “ECG” waveform or an inductively measured waveform.
The first waveform is not necessarily, but can be, for example, the R peak of the “QRS” wave composite on the ECG waveform shown in FIG. 1a, and the second waveform is not necessarily. For example, it can be the J peak on the waveform shown in FIG.
In this case, the vertex of the R peak can be used as the reference point of the first waveform, the vertex of the J peak can be used as the reference point of the second waveform, and each timing value is determined from the moment of the vertex of the R peak to the vertex of the J peak. May represent the time to the moment.
In another example, the second waveform may be an aortic valve opening “AO” peak on the waveform that represents cardiovascular motion measured in the “breasting” direction, commonly referred to as the z-direction.
本方法は、心臓活動に関連する電磁現象を表す第1信号及び/又は心臓血管の動きを表す第2信号から上述のペーシングデータを検出するステップをさらに含み得る。
そのペーシングデータの検出は、例えば、ECG波形の連続するRピーク間の時間を検出するステップを含み得る。
心拍数を表すペーシングデータは個体の身体から測定される第3信号に基づいて作成されることもあり得る。
The method may further include detecting the pacing data described above from a first signal representative of electromagnetic phenomena associated with cardiac activity and / or a second signal representative of cardiovascular motion.
The detection of the pacing data can include, for example, detecting the time between successive R peaks of the ECG waveform.
Pacing data representing the heart rate may be generated based on a third signal measured from the individual's body.
タイミングデータとペーシングデータとの間の上述の相関は心臓の機能不全と異常の指標として使用され得る。
例えば、実証的なデータに照らすと、ペーシングデータの各値が心拍数の瞬時値を、例えば、分当たりの心拍数で表すとき、正の相関は心房細動の可能性の上昇を意味する。
同様に、ペーシングデータの各値が1回の心拍周期の時間の長さを、例えば、秒で、すなわち1/心拍数で表すとき、負の相関は心房細動の可能性の上昇を意味する。
The above correlation between timing data and pacing data can be used as an indicator of cardiac dysfunction and abnormalities.
For example, in light of empirical data, a positive correlation means an increased likelihood of atrial fibrillation when each value of pacing data represents an instantaneous value of heart rate, eg, heart rate per minute.
Similarly, when each value of pacing data represents the length of time of one heart cycle, eg, in seconds,
タイミングデータとペーシングデータとの間の相関の程度は、必ずというわけではないが、例えば、次の式:
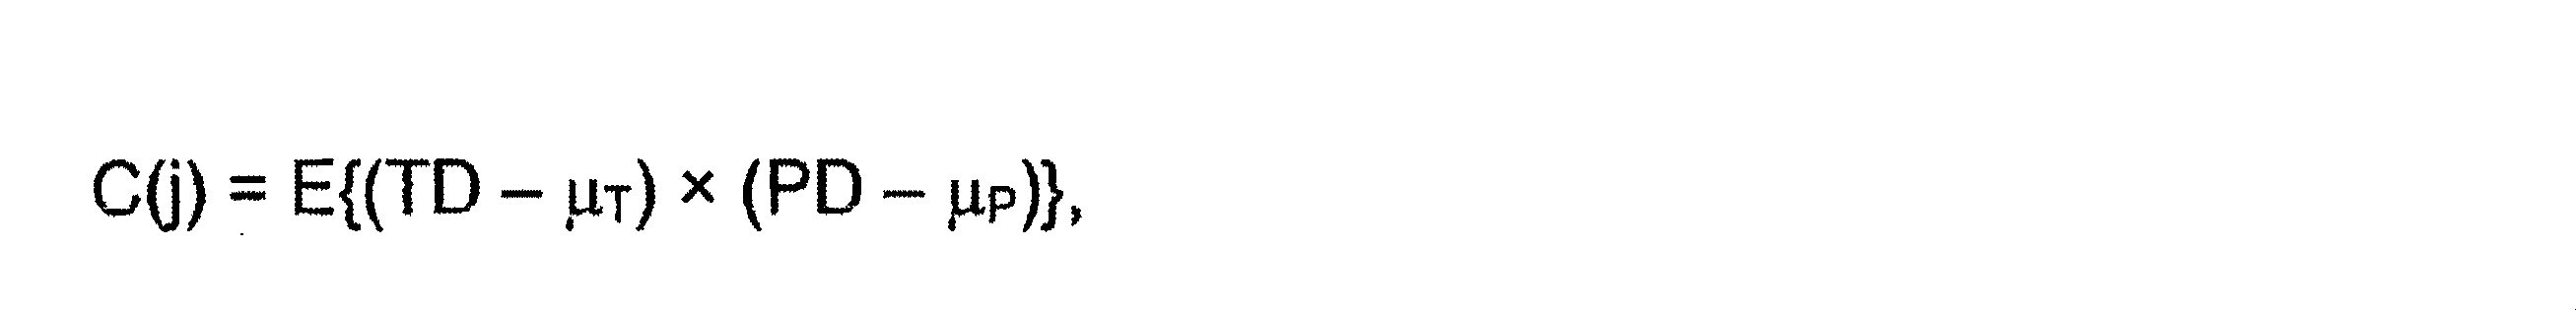
式中、
C(j)はその相関係数であり、
Eは期待値演算子であり、すなわちE{変数}は変数の期待値であり、
TDはタイミングデータであり、
μTはタイミングデータの平均であり、
PDはペーシングデータであり、
μPはペーシングデータの平均であり、
jは心拍周期内のタイミングデータに関してペーシングデータの時間差を表す整数である。
実証的な結果に照らすと、ペーシングデータPDがタイミングデータTDに関して1回の心拍周期の時間差、すなわちj=1を有することが有利である。
この場合、タイミングデータTDが所与の心拍周期に関連するとき、対応するペーシングデータPDは先の心拍周期に関連する。
相関係数は、フォルムρT,Pで表され得、それは、常に−1から+1までの範囲であり、
Where
C (j) is the correlation coefficient,
E is the expected value operator, ie E {variable} is the expected value of the variable,
TD is timing data,
μ T is the average of timing data,
PD is pacing data,
μ P is the average of pacing data,
j is an integer representing the time difference of the pacing data with respect to the timing data within the heartbeat cycle.
In light of the empirical results, it is advantageous that the pacing data PD has a time difference of one heart cycle with respect to the timing data TD, i.e. j = 1.
In this case, when the timing data TD is associated with a given heart cycle, the corresponding pacing data PD is associated with the previous heart cycle.
The correlation coefficient can be expressed in the form ρ T, P , which always ranges from −1 to +1,
タイミングデータとペーシングデータとの間の可能性がある相関を表現する多数の方法が存在し、本発明はその相関を表現するどの特定の方法にも限定されないことに留意すべきである。
さらに、その相関は必ずしも数学量ではないが、従属を含む広範な統計学的関係のいずれかに関連しており、その相関はその広い意味で因果関係を含むこと、又は必要とすることが無いことに留意すべきである。
It should be noted that there are a number of ways to represent the potential correlation between timing data and pacing data, and the present invention is not limited to any particular way of representing that correlation.
In addition, the correlation is not necessarily a mathematical quantity, but is related to any of a wide range of statistical relationships, including subordination, and the correlation does not include or require causality in its broader sense. It should be noted.
本発明の別の好ましい実施形態による方法では、心臓の機能不全と異常の指標の測定は実質的に一定の心拍数におけるタイミングデータの変化の測定を含む。
例えば、実証的なデータに照らすと、タイミングデータの標準偏差は心房細動の間では平均値の約10%であり得、正常状態の場合では平均値の約1〜2%であり得る。
In a method according to another preferred embodiment of the present invention, measuring an indication of cardiac dysfunction and abnormality comprises measuring changes in timing data at a substantially constant heart rate.
For example, in the light of empirical data, the standard deviation of timing data can be about 10% of the average value during atrial fibrillation and about 1-2% of the average value in the normal state.
本発明の好ましい実施形態による方法では、心臓血管の動きを表す信号をローパスフィルタにかけ、そのローパスフィルタにかけられた信号から上述のAOピークを検出するステップ、及び/又は、心臓血管の動きを表す前記信号をバンドパスフィルタにかけ、大動脈弁の閉鎖により生じるACピークをそのバンドパスフィルタにかけられた信号から検出するステップ、を含む。
ローパスフィルタリングの上限の周波数は、必ずというわけではないが、例えば、30Hzであり得、バンドパスフィルタリングの通過帯域は、必ずというわけではないが、例えば、40Hzから100Hzまでであり得る。ローパスフィルタリング及び/又はパスバンドフィルタリングはAOピーク及び/又はACピークの検出を容易にする。
特に心房細動の間にバンドパスフィルタリングを用いると、バンドパスフィルタリングが無いときよりもACピークの発見が容易である。
検出されたAOピーク及び/又はACピークは、例えば上述の第2波形を心臓血管の動きを表す信号から抽出するときに利用され得る。
検出されたAOピーク及び/又はACピークは他の多くの目的のためにも、例えば振幅の変化、時間変化、心拍数、収縮間隔、及び/又は拡張間隔を検出するために使用され得る。
In a method according to a preferred embodiment of the present invention, the step of applying a low-pass filter to a signal representative of cardiovascular motion and detecting the aforementioned AO peak from the signal subjected to the low-pass filter and / or Applying a signal to the bandpass filter and detecting an AC peak caused by the closure of the aortic valve from the signal applied to the bandpass filter.
The upper limit frequency of the low-pass filtering is not necessarily, but may be, for example, 30 Hz, and the pass band of the band-pass filtering is not necessarily, but may be, for example, 40 Hz to 100 Hz. Low pass filtering and / or passband filtering facilitates detection of AO peaks and / or AC peaks.
In particular, using bandpass filtering during atrial fibrillation makes it easier to find AC peaks than without bandpass filtering.
The detected AO peak and / or AC peak can be used, for example, when the second waveform described above is extracted from a signal representing cardiovascular motion.
The detected AO peak and / or AC peak can be used for many other purposes, for example, to detect amplitude changes, time changes, heart rate, systolic intervals, and / or dilation intervals.
本発明によって、心臓の機能不全と異常を表す情報を測定するための新しい器械が提供される。
本発明による器械は、
−心臓活動に関連する電磁現象を表す第1信号と心臓血管の動きを表す第2信号を受信するための信号インターフェースと、
−その信号インターフェースに接続されている処理装置であって、
a)前記第1信号からある心拍数を繰り返す第1波形を抽出し、且つ、前記第2信号から前記心拍数を繰り返す第2波形を抽出し、
b)各タイミング値がある1つの心拍周期に属する前記第1波形の基準点から同一の心拍周期に属する前記第2波形の基準点までの時間を表すタイミングデータを作成し、且つ、
c)前記タイミングデータと前記の心拍数を表すペーシングデータとの間の相関を決定する、
ように構成されている前記処理装置と、
を備えており、
その相関が心臓の機能不全と異常を表す。
The present invention provides a new instrument for measuring information representing cardiac dysfunction and abnormalities.
The instrument according to the invention is
A signal interface for receiving a first signal representative of electromagnetic phenomena related to cardiac activity and a second signal representative of cardiovascular movement;
A processing device connected to the signal interface,
a) extracting a first waveform repeating a certain heart rate from the first signal and extracting a second waveform repeating the heart rate from the second signal;
b) creating timing data representing the time from the reference point of the first waveform belonging to one cardiac cycle to the reference point of the second waveform belonging to the same cardiac cycle with each timing value;
c) determining a correlation between the timing data and the pacing data representing the heart rate;
The processing apparatus configured as follows:
With
The correlation represents cardiac dysfunction and abnormality.
その器械は心臓活動に関連する電磁現象を表す第1信号を測定するための第1センサ素子及び/又は心臓血管の動きを表す第2信号を測定するための第2センサ素子をさらに備え得る。
その第1センサ素子は個体の身体へ装着に適切な電極を備え得る。
その第2センサ素子は、例えば、加速度センサ、圧電センサ、傾斜センサ、圧力センサ、又は力、加速度、変位、若しくは心臓血管の動きに関連し、心臓血管の動きを表す他のあらゆる量の測定に適切な他のあらゆる素子を備え得る。
前記信号インターフェースは適切なセンサ素子を備える外部機器から前記第1信号及び/又は前記第2信号を受信することができるということもあり得、すなわち前記器械は前記第1信号及び/又は前記第2信号を測定するための手段を必ず備えるわけではないことが強調される。
The instrument may further comprise a first sensor element for measuring a first signal representative of an electromagnetic phenomenon associated with cardiac activity and / or a second sensor element for measuring a second signal representative of cardiovascular motion.
The first sensor element may comprise an electrode suitable for attachment to an individual's body.
The second sensor element can be, for example, an acceleration sensor, a piezoelectric sensor, a tilt sensor, a pressure sensor, or any other quantity related to force, acceleration, displacement, or cardiovascular motion and representing cardiovascular motion. Any other suitable element may be provided.
It may also be possible that the signal interface can receive the first signal and / or the second signal from an external device comprising suitable sensor elements, i.e. the instrument is capable of receiving the first signal and / or the second signal. It is emphasized that the means for measuring the signal are not necessarily provided.
本発明の好ましい実施形態による器械は、心臓血管の動きを表す信号をローパスフィルタにかけるためのローパスフィルタとそのローパスフィルタにかけられた信号からAOピークを検出するための手段、例えばプロセッサ、及び/又は心臓血管の動きを表す前記信号をバンドパスフィルタにかけるためのバンドパスフィルタとそのバンドパスフィルタにかけられた信号からACピークを検出するための手段を備える。 An instrument according to a preferred embodiment of the present invention comprises a low pass filter for applying a low pass filter to a signal representative of cardiovascular motion and means for detecting an AO peak from the low pass filtered signal, eg, a processor, and / or A bandpass filter for applying the signal representative of cardiovascular motion to a bandpass filter and means for detecting an AC peak from the signal applied to the bandpass filter.
本発明により、心臓の機能不全と異常を表す情報を測定するための新しいコンピュータプログラムが提供される。
そのコンピュータプログラムは、
−心臓活動に関連する電磁現象を表す第1信号からある心拍数を繰り返す第1波形を抽出し、
−心臓血管の動きを表す第2信号から前記心拍数を繰り返す第2波形を抽出し、
−各タイミング値がある1つの心拍周期に属する前記第1波形の基準点から同一の心拍周期に属する前記第2波形の基準点までの時間を表すタイミングデータを作成し、且つ、
−前記タイミングデータと前記の心拍数を表すペーシングデータとの間の相関を決定する、
プログラミング可能なプロセッサを制御するためのコンピュータが実行可能な命令を備え、
その相関が心臓の機能不全と異常を表す。
The present invention provides a new computer program for measuring information representing cardiac dysfunction and abnormalities.
The computer program is
-Extracting a first waveform that repeats a certain heart rate from a first signal representing an electromagnetic phenomenon associated with cardiac activity;
-Extracting a second waveform repeating the heart rate from a second signal representing cardiovascular movement;
Creating timing data representing the time from the reference point of the first waveform belonging to one heartbeat period to the reference point of the second waveform belonging to the same heartbeat period, with each timing value; and
-Determining a correlation between the timing data and the pacing data representing the heart rate;
Computer-executable instructions for controlling a programmable processor,
The correlation represents cardiac dysfunction and abnormality.
本発明の好ましい実施形態によるコンピュータプログラムは、
心臓血管の動きを表す信号をローパスフィルタにかけ、そのローパスフィルタにかけられた信号からAOピークを検出する、プログラミング可能なプロセッサを制御するためのコンピュータが実行可能な命令、及び/又は、
心臓血管の動きを表す信号をバンドパスフィルタにかけ、そのバンドパスフィルタにかけられた信号からACピークを検出する、プログラミング可能なプロセッサを制御するためのコンピュータが実行可能な命令を備える。
A computer program according to a preferred embodiment of the present invention comprises:
Computer-executable instructions for controlling a programmable processor that applies a low-pass filter to a signal representative of cardiovascular motion and detects an AO peak from the low-pass filtered signal, and / or
Computer-executable instructions for controlling a programmable processor for applying a signal representative of cardiovascular motion to a bandpass filter and detecting an AC peak from the applied signal.
本発明により、新しいコンピュータプログラム製品が提供される。そのコンピュータプログラム製品は、本発明によるコンピュータプログラムが符号化されている不揮発性のコンピュータ可読媒体、例えば、コンパクトディスク「CD」を備える。 In accordance with the present invention, a new computer program product is provided. The computer program product comprises a non-volatile computer-readable medium, for example a compact disc “CD”, on which the computer program according to the invention is encoded.
本発明の多数の好ましい実施形態は添付されている従属請求項に記載される。
構成と操作方法に関する本発明の様々な好ましい実施形態はそれらの追加的な目的及び利点と共に、添付されている図面と関連させて読まれると、具体的な好ましい実施形態の次の記載から最も良く理解される。
「備える(to comprise)」及び「含む(to include)」という動詞は、本書類において、列挙されていない特徴の存在を排除することも必要とすることもない開放的な制限語として使用される。従属請求項において列挙される特徴は、別途明らかに示されていない限り、自由に相互に組合せ可能である。
Numerous preferred embodiments of the invention are set out in the accompanying dependent claims.
Various preferred embodiments of the present invention with respect to construction and method of operation, together with their additional objects and advantages, best read from the following description of specific preferred embodiments, when read in conjunction with the accompanying drawings. Understood.
The verbs “to comprise” and “to include” are used in this document as open restrictions that do not eliminate or require the presence of unlisted features. . The features recited in the dependent claims can be freely combined with one another unless explicitly indicated otherwise.
本発明の好ましい実施形態とそれらの利点が、添付されている図面の参照により以下にさらに詳しく説明される。
図1a、図1bは本発明の背景技術を述べたときに既に説明されている。
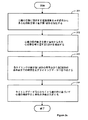
図2aは心臓の機能不全と異常、例えば心房細動を表す情報を測定するための本発明の好ましい実施形態による方法のフローチャートを示す。
その方法は心臓活動に関連する電磁現象を表す第1信号からある心拍数を繰り返す第1波形をステップ201において抽出することを含む。
その方法は心臓血管の動きを表す第2信号からその心拍数を繰り返す第2波形をステップ202において抽出することを含む。
その第1信号と第2信号は同一の個体から測定される/測定されたものである。
その方法はタイミングデータの各タイミング値がある1つの心拍周期に属する前記第1波形の基準点から同一の心拍周期に属する前記第2波形の基準点までの時間を表すように、そのタイミングデータTDをステップ203において作成することを含む。
その方法はそのタイミングデータTDに少なくとも部分的に基づいて心臓の機能不全と異常の指標をステップ204において測定することを含む。
1a and 1b have already been described when describing the background art of the present invention.
FIG. 2a shows a flowchart of a method according to a preferred embodiment of the present invention for measuring information representative of cardiac dysfunction and abnormalities, eg atrial fibrillation.
The method includes extracting in step 201 a first waveform that repeats a heart rate from a first signal that represents an electromagnetic phenomenon associated with cardiac activity.
The method includes extracting a second waveform at
The first signal and the second signal are measured / measured from the same individual.
The timing data TD represents the time from the reference point of the first waveform belonging to one heart cycle to the reference point of the second waveform belonging to the same heart cycle. Creating in
The method includes measuring in
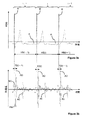
図3aは心臓活動に関連する電磁現象を表す例となる信号の波形を示し、図3bは心臓血管の動きを表す例となる信号の波形を示す。
図3a、図3bに示されている波形は互いに対応し、同一の個体から同時に測定されたものである。
図3aに示されている波形は個体の胸に装着された電極を用いて測定されたECG波形であり、図3bに示されている波形は通常はz方向と呼ばれる「通胸」方向で加速度センサにより測定されたものである。
図4に示されている座標系450がz方向を示す。
FIG. 3a shows an example signal waveform representing electromagnetic phenomena associated with cardiac activity, and FIG. 3b shows an example signal waveform representing cardiovascular motion.
The waveforms shown in FIGS. 3a and 3b correspond to each other and are measured simultaneously from the same individual.
The waveform shown in FIG. 3a is an ECG waveform measured using an electrode mounted on an individual's chest, and the waveform shown in FIG. 3b is an acceleration in a “breast” direction, commonly referred to as the z-direction. It is measured by a sensor.
A coordinate
図3a、図3bは共にタイミングデータTDを定義するための例となる方法を示す。
この例となる場合では、ECG波形に現れ、且つ、心室性筋肉組織の脱分極により生じるRピークは心拍数を繰り返す第1波形を表し、心臓血管の動きを表す波形の大動脈弁開放「AO」ピークは心拍数を繰り返す第2波形を表す。Rピークの頂点がその第1波形の基準点であり、AOピークの頂点がその第2波形の基準点である。
3a and 3b both illustrate an exemplary method for defining timing data TD.
In this example, the R peak that appears in the ECG waveform and that occurs due to the depolarization of the ventricular musculature represents the first waveform that repeats the heart rate, and the aortic valve opening “AO” of the waveform that represents cardiovascular movement. The peak represents a second waveform that repeats the heart rate. The apex of the R peak is the reference point of the first waveform, and the apex of the AO peak is the reference point of the second waveform.
本発明の別の好ましい実施形態による方法では、Rピークは前記第1波形を表し、頭足方向で測定された波形に現れ、且つ、大動脈弁を通る左心室から大動脈への血流によって生じるJピークは前記第2波形を表す。
Rピークの頂点はその第1波形の基準点として使用され得、Jピークの頂点はその第2波形の基準点として使用され得る。
In a method according to another preferred embodiment of the present invention, the R peak represents the first waveform, appears in the waveform measured in the cranio-foot direction, and is generated by blood flow from the left ventricle through the aortic valve to the aorta. The peak represents the second waveform.
The apex of the R peak can be used as the reference point for the first waveform, and the apex of the J peak can be used as the reference point for the second waveform.
本発明の1つの好ましい実施形態による方法では、Rピークは前記第1波形を表し、図3bに示されている波形上のMCピークとAOピークの間のバレー310は前記第2波形を表す。
MCピークは僧帽弁の閉鎖によって生じる。
Rピークの頂点は前記第1波形の前記基準点として使用され得、バレー310の最低点は前記第2波形の前記基準点として使用され得る。
In a method according to one preferred embodiment of the invention, the R peak represents the first waveform and the
The MC peak is caused by mitral valve closure.
The apex of the R peak can be used as the reference point of the first waveform, and the lowest point of the
図3a、図3bは3回の連続する心拍周期、すなわち、「i」が整数であり得る心拍周期「i−1」、心拍周期「i」、及び心拍周期「i+1」を示す。
例えば、心拍周期「i」に関連するタイミング値TD(i)は、図3a、図3bに示されるように、心拍周期「i」のRピークの頂点の瞬間から心拍周期「i」のJピークの頂点の瞬間までの時間である。
FIGS. 3a and 3b show three consecutive heartbeat cycles, ie, a heartbeat cycle “i−1”, a heartbeat cycle “i”, and a heartbeat cycle “i + 1” where “i” may be an integer.
For example, the timing value TD (i) associated with the heartbeat period “i” is calculated from the moment of the apex of the R peak of the heartbeat period “i” to the J peak of the heartbeat period “i” as shown in FIGS. 3a and 3b. It is the time to the moment of the top of
図2aに示されているステップ204は前記タイミングデータTDと前記の心拍数を表すペーシングデータPDとの間の相関を決定することを含む。
実証的な結果に照らすと、その相関は心臓の機能不全と異常の前記指標として使用され得る。
Step 204 shown in FIG. 2a includes determining a correlation between the timing data TD and the pacing data PD representing the heart rate.
In the light of empirical results, the correlation can be used as said indicator of cardiac dysfunction and abnormalities.
その方法は、前記の心拍数を表すペーシングデータPDを心臓活動に関連する電磁現象を表す波形及び/又は心臓血管の動きを表す波形から検出することをさらに含み得る。
そのペーシングデータの検出は、例えば、ECG波形上の連続するRピーク間の時間の検出を含み得る。
そのペーシングデータの検出は、例えば、心臓血管の動きを表す波形上の連続するAOピーク又はJピークの間の時間の検出を含むこともあり得る。
より信頼できるペーシングデータを得るために1つより多くの波形を活用することができる。
さらに、第3信号が個体の身体から測定され、この第3信号が単独で、又は心臓活動に関連する電磁現象を表す波形及び/又は心臓血管の動きを表す波形と共に前記の心拍数を表すペーシングデータの測定のために用いられることもあり得る。
図3aでは、連続するRピーク間の時間の長さはHB(i−1)、HB(i)、及びHB(i+1)で示されている。
心拍周期「i−1」、「i」、及び「i+1」のペーシングデータはそれぞれ例えばPD(i−1)=1/HB(i−1)、PD(i)=1/HB(i)、及びPD(i+1)=1/HB(i+1)として定義され得る。
The method may further include detecting the pacing data PD representative of the heart rate from a waveform representative of electromagnetic phenomena associated with cardiac activity and / or a waveform representative of cardiovascular motion.
The detection of the pacing data can include, for example, detection of time between successive R peaks on the ECG waveform.
The detection of the pacing data can include, for example, detection of time between successive AO peaks or J peaks on a waveform representing cardiovascular motion.
More than one waveform can be utilized to obtain more reliable pacing data.
In addition, a third signal is measured from the body of the individual, and the third signal alone or together with a waveform representing an electromagnetic phenomenon associated with cardiac activity and / or a waveform representing cardiovascular motion, the pacing representing said heart rate. It can also be used for the measurement of data.
In FIG. 3a, the length of time between successive R peaks is indicated by HB (i-1), HB (i), and HB (i + 1).
The pacing data of the cardiac cycles “i−1”, “i”, and “i + 1” are, for example, PD (i−1) = 1 / HB (i−1), PD (i) = 1 / HB (i), And PD (i + 1) = 1 / HB (i + 1).
タイミングデータTDとペーシングデータPDとの間の相関は、例えば、次の式:
式中、
Nは検討中の心拍周期の回数であり、
jは心拍周期内のタイミングデータTDに関してペーシングデータPDの時間差を表す整数であり、
Where
N is the number of heartbeat cycles under consideration,
j is an integer representing the time difference of the pacing data PD with respect to the timing data TD within the cardiac cycle,
上記の相関係数C(j)は心臓の機能不全と異常の前記指標として使用され得る。実証的なデータに照らして、相関係数C(j=1)の正の値は心房細動の可能性の上昇を意味し、その相関の負の値は正常状態を表す。 The above correlation coefficient C (j) can be used as the indicator of cardiac dysfunction and abnormality. In light of empirical data, a positive value of correlation coefficient C (j = 1) means an increased likelihood of atrial fibrillation, and a negative value of that correlation represents a normal state.
図2bは心臓血管の動きを表す信号からAOデータ及び/又はACデータを抽出するための本発明の好ましい実施形態による方法のフローチャートを示す。
前記の心臓血管の動きを表す信号が、通常はz方向と呼ばれる「通胸」方向で加速度センサにより測定されることが好都合である。
その方法は次のステップを含む:
−ステップ211:心臓血管の動きを表す信号をローパスフィルタにかけること、及び/又は心臓血管の動きを表す信号をバンドパスフィルタにかけること、及び
−ステップ212:そのローパスフィルタにかけられた信号からAOピークを検出すること、及び/又はそのバンドパスフィルタにかけられた信号からACピークを検出すること。
FIG. 2b shows a flowchart of a method according to a preferred embodiment of the present invention for extracting AO data and / or AC data from a signal representative of cardiovascular motion.
Conveniently, the signal representative of the cardiovascular movement is measured by an acceleration sensor in a “breasting” direction, commonly referred to as the z-direction.
The method includes the following steps:
Step 211: applying a low-pass filter to the signal representative of the cardiovascular movement and / or applying a bandpass filter to the signal representative of the cardiovascular movement; and Step 212: AO from the signal applied to the low-pass filter. Detecting a peak and / or detecting an AC peak from the bandpass filtered signal.
ローパスフィルタリングの上限の周波数は、必ずというわけではないが、例えば、30Hzであり得、バンドパスフィルタリングの通過帯域は、必ずというわけではないが、例えば、40Hzから最大で100Hzまでであり得る。
ローパスフィルタリング及び/又はパスバンドフィルタリングはAOピーク及び/又はACピークの検出を容易にする。
検出されたAOピーク及び/又はACピークは例えば上述の第2波形を心臓血管の動きを表す信号から抽出するときに利用され得る。
検出されたAOピーク及び/又はACピークは他の多くの目的のためにも、例えば振幅の変化、時間変化、心拍数、収縮間隔、及び/又は拡張間隔を検出するために使用され得る。
The upper limit frequency of the low-pass filtering is not necessarily, but may be, for example, 30 Hz, and the passband of the band-pass filtering is not necessarily, but may be, for example, 40 Hz to a maximum of 100 Hz.
Low pass filtering and / or passband filtering facilitates detection of AO peaks and / or AC peaks.
The detected AO peak and / or AC peak can be used, for example, when the second waveform described above is extracted from a signal representing cardiovascular motion.
The detected AO peak and / or AC peak can be used for many other purposes, for example, to detect amplitude changes, time changes, heart rate, systolic intervals, and / or dilation intervals.
本発明の好ましい実施形態による方法はAC〜AO間隔の時間の長さを検出すること、及び検出されたAC〜AO間隔の時間の長さの変化の強度を表す時間変化量を計算することを含み、前記のAC〜AO間隔のそれぞれがACピークのうちの1つからAOピークのうちの次の1つまでの時間間隔であり、その時間変化量が心臓の機能不全と異常を表す。
この時間変化量は可能性がある心臓の機能不全と異常の検出の信頼性を上昇させるためにタイミングデータとペーシングデータとの間の上述の相関と共に使用され得る。
しかしながら、この時間変化量は単独でも使用され得る。
The method according to a preferred embodiment of the present invention comprises detecting the length of time of the AC to AO interval and calculating a time variation representing the strength of the detected change in the length of time of the AC to AO interval. Each of the AC to AO intervals is a time interval from one of the AC peaks to the next one of the AO peaks, and the amount of time change represents cardiac dysfunction and abnormality.
This amount of time variation can be used in conjunction with the above correlation between timing data and pacing data to increase the reliability of detection of potential cardiac dysfunctions and abnormalities.
However, this amount of time change can be used alone.
本発明の好ましい実施形態による方法はAC〜AO間隔の時間の長さとAO〜AO間隔の時間の長さを検出すること、及び同一の心拍周期内のAC〜AO間隔の時間の長さとAO〜AO間隔の時間の長さの間の比率を表す第1比率量を計算することを含む。
前記のAC〜AO間隔のそれぞれはACピークのうちの1つからAOピークのうちの次の1つまでの時間間隔であり、前記のAO〜AO間隔のそれぞれはAOピークのうちの1つからAOピークのうちの次の1つまでの時間間隔であり、その第1比率量が心臓の機能不全と異常を表す。
この第1比率量は可能性がある心臓の機能不全と異常の検出の信頼性を上昇させるためにタイミングデータとペーシングデータとの間の上述の相関と共に使用され得る。
しかしながら、この第1比率量は単独でも使用され得る。
The method according to a preferred embodiment of the present invention detects the length of time of the AC to AO interval and the length of time of the AO to AO interval, and the length of time of the AC to AO interval within the same heart cycle and AO to Calculating a first ratio amount representing a ratio between the length of time of the AO interval.
Each of the AC to AO intervals is a time interval from one of the AC peaks to the next of the AO peaks, and each of the AO to AO intervals is from one of the AO peaks. The time interval to the next one of the AO peaks, the first ratio amount representing cardiac dysfunction and abnormality.
This first ratio amount may be used in conjunction with the above-described correlation between timing data and pacing data to increase the reliability of potential cardiac dysfunction and abnormality detection.
However, this first ratio amount can be used alone.
本発明の好ましい実施形態による方法はAC〜R間隔の時間の長さとR〜R間隔の時間の長さを検出すること、及び同一の心拍周期内の前記AC〜R間隔の時間の長さと前記R〜R間隔の時間の長さの間の比率を表す第2比率量を計算すことを含む。
前記のAC〜R間隔のそれぞれはACピークのうちの1つからRピークのうちの次の1つまでの時間間隔であり、前記のR〜R間隔のそれぞれはRピークのうちの1つからRピークのうちの次の1つまでの時間間隔であり、その第2比率量が心臓の機能不全と異常を表す。
この第2比率量は可能性がある心臓の機能不全と異常の検出の信頼性を上昇させるためにタイミングデータとペーシングデータとの間の上述の相関と共に使用され得る。しかしながら、この第2比率量は単独でも使用され得る。
A method according to a preferred embodiment of the present invention detects the length of time of the AC to R interval and the length of time of the R to R interval, and the length of time of the AC to R interval within the same heartbeat cycle. Calculating a second ratio quantity representing a ratio between the length of time of the R to R intervals.
Each of the AC to R intervals is a time interval from one of the AC peaks to the next one of the R peaks, and each of the R to R intervals is from one of the R peaks. Time interval to the next one of the R peaks, the second ratio amount representing cardiac dysfunction and abnormality.
This second ratio amount can be used in conjunction with the above-described correlation between timing data and pacing data to increase the reliability of potential cardiac dysfunction and abnormality detection. However, this second ratio amount can be used alone.
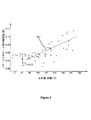
図5は例となる心房細動の場合の様々な心拍数において得られたタイミングデータの実証的な値を示す。
図5中の各黒点は
a)ある特定の心拍周期内のECG波形のRピークと心臓血管の動きを表す波形の大動脈弁開放「AO」ピークとの間の時間差と
b)先の心拍周期における心拍数と、を表す。
図5に示されている破線501の正の傾きはタイミングデータとペーシングデータとの間の正の相関を示す。
図5から理解することができるように、そのタイミングデータの傾きは心拍数が分当たり約85拍を越えると心拍数とともに上昇する。
正常状態の場合であれば、その傾きは実質的に一定であるか、又は減少する。
FIG. 5 shows empirical values of timing data obtained at various heart rates for example atrial fibrillation.
Each black dot in FIG. 5 is a) the time difference between the R peak of the ECG waveform within a particular heart cycle and the aortic valve opening “AO” peak of the waveform representing cardiovascular movement; and b) in the previous heart cycle. Represents the heart rate.
The positive slope of dashed
As can be seen from FIG. 5, the slope of the timing data increases with the heart rate when the heart rate exceeds about 85 beats per minute.
In the normal state, the slope is substantially constant or decreases.
本発明の好ましい実施形態による方法は、相関係数C(j=1)が閾値よりも大きい状況に応答して心房細動を表す信号を発信することを含む。
その閾値に適切な値は、一群の患者及び/又は他の人間から集められた実証的データに基づいて決定され得る。
その閾値は必ずしも一定というわけではなく、その閾値は検討中の個体に応じて、時間に応じて、及び/又は他の幾つかの因子に応じて変化し得る。
各閾値が心房細動の特定の可能性、又は他の幾つかの心臓の機能不全及び/又は異常の特定の可能性を表す一連の閾値を設定することも可能である。
幾つかの場合では、その閾値は0であり得る。
A method according to a preferred embodiment of the invention includes transmitting a signal representative of atrial fibrillation in response to a situation where the correlation coefficient C (j = 1) is greater than a threshold.
An appropriate value for the threshold may be determined based on empirical data collected from a group of patients and / or other humans.
The threshold is not necessarily constant, and the threshold may vary depending on the individual under consideration, as a function of time, and / or as a function of several other factors.
It is also possible to set a series of thresholds where each threshold represents a specific possibility of atrial fibrillation, or a specific possibility of some other cardiac dysfunction and / or abnormality.
In some cases, the threshold may be zero.
別の例では、心拍周期「i−1」、「i」、及び「i+1」のペーシングデータはそれぞれPD(i−1)=HB(i−1)、PD(i)=HB(i)、及びPD(i+1)=HB(i+1)と定義され得る。
この場合、相関係数C(j=1)の負の値は心房細動の可能性の上昇を意味し、その相関の正の値は正常状態を表す。
本発明の好ましい実施形態による方法は、相関係数C(j=1)が閾値未満であり、それが、幾つかの場合では、0でありうる状況に応答して心房細動を表す信号を発信することを含む。
In another example, the pacing data for heartbeat cycles “i−1”, “i”, and “i + 1” are PD (i−1) = HB (i−1), PD (i) = HB (i), And PD (i + 1) = HB (i + 1).
In this case, a negative value of the correlation coefficient C (j = 1) means an increased possibility of atrial fibrillation, and a positive value of the correlation represents a normal state.
A method according to a preferred embodiment of the present invention provides a signal representing atrial fibrillation in response to a situation where the correlation coefficient C (j = 1) is less than a threshold, which in some cases may be zero. Including making a call.
本発明の好ましい実施形態による方法では、図2aに示されているステップ204は心拍数が実質的に一定であるときのタイミングデータの変化を測定するステップを含む。
実証的なデータに照らして、その変化の程度は心臓の機能不全と異常を表す。
図5では、心拍数が80拍/分であるときのその変化の範囲が垂直の破線部分502によって示されている。
タイミングデータが図3a及び3bに示されるようにRピークとAOピークの間の時間間隔を示すとき、そのタイミングデータは前駆出期「PEP」を示す。
心房細動の期間において連続する心拍周期の間にPEPの確率的な変化があることが気付かれている。
In the method according to a preferred embodiment of the present invention, step 204 shown in FIG. 2a includes measuring the change in timing data when the heart rate is substantially constant.
In light of empirical data, the degree of change represents cardiac dysfunction and abnormalities.
In FIG. 5, the range of change when the heart rate is 80 beats / minute is indicated by a vertical dashed
When the timing data indicates the time interval between the R peak and the AO peak as shown in FIGS. 3a and 3b, the timing data indicates the precursor phase “PEP”.
It has been observed that there is a stochastic change in PEP between successive heartbeat cycles during the period of atrial fibrillation.
上述の変化の程度は、例えば、次の式:
式中、
Vはその変化量であり、
Mは検討中の心拍数における検討中のタイミングデータ値の数であり、
実証的なデータに照らして、変化量Vは心房細動の間に約10%であり得、正常状態の場合に約1〜2%であり得る。
The degree of change described above is, for example, the following formula:
Where
V is the amount of change,
M is the number of timing data values under consideration for the heart rate under consideration,
In light of empirical data, the variation V can be about 10% during atrial fibrillation and can be about 1-2% under normal conditions.
本発明の好ましい実施形態による方法は、変化量Vが閾値よりも大きい状況に応答して心房細動を表す信号を発信するステップを含む。
その閾値に適切な値は、一群の患者及び/又は他の人間から集められた実証的データに基づいて決定され得る。
その閾値は必ずしも一定というわけではなく、その閾値は検討中の個体に応じて、時間に応じて、及び/又は他の幾つかの因子に応じて変化し得る。
各閾値が心房細動の特定の可能性、又は他の幾つかの心臓の機能不全及び/又は異常の特定の可能性を表す一連の閾値を設定することも可能である。
The method according to a preferred embodiment of the present invention includes the step of transmitting a signal representative of atrial fibrillation in response to a situation where the amount of change V is greater than a threshold value.
An appropriate value for the threshold may be determined based on empirical data collected from a group of patients and / or other humans.
The threshold is not necessarily constant, and the threshold may vary depending on the individual under consideration, as a function of time, and / or as a function of several other factors.
It is also possible to set a series of thresholds where each threshold represents a specific possibility of atrial fibrillation, or a specific possibility of some other cardiac dysfunction and / or abnormality.
本発明の好ましい実施形態による方法は、1回よりも多くの心拍数におけるタイミングデータの変化を検出するステップ、及び心臓の機能不全と異常の前記指標を測定するために検出結果を使用するステップを含む。
例えば、式(3)及び(4)は数回の心拍数における変化量を得るために使用され得、最終的な変化量は、検討中の心拍数に関連する変化量から数学的論理的演算、例えば、算術平均により計算され得る。
A method according to a preferred embodiment of the present invention comprises the steps of detecting changes in timing data at more than one heart rate and using the detection results to measure said indication of cardiac dysfunction and abnormality. Including.
For example, equations (3) and (4) can be used to obtain changes in heart rate for a number of times, and the final change is a mathematical logical operation from the change associated with the heart rate under consideration. For example, it can be calculated by arithmetic mean.
各ピーク値、例えば1つのAOピークの高さは、極大を捜し求めることによる1つの点であると見なされ得る。
あるいは、そのピーク値は、最初に検討中のピークを含む時間ウィンドウから多数の試料を獲得し、次に、ノイズ効果を軽減するためにそれらの試料の数学的関数、例えば算術平均としてそのピーク値を計算するようにして取得され得る。
その時間ウィンドウは、例えば、100ミリ秒であり得、その時間ウィンドウ内の試料数は、例えば、10以上であり得る。
その時間ウィンドウに基づく方法はデジタルフィルタリングの一例である。
一般に、心臓血管の動きを表す信号及び心臓活動に関連する電磁現象を表す信号におけるノイズ効果を軽減するために用いられ得る多数のデジタル信号処理方法及びアナログ信号処理方法が存在する。
Each peak value, eg, the height of one AO peak, can be considered as one point by searching for a local maximum.
Alternatively, the peak value is obtained from a number of samples first from the time window containing the peak under consideration, and then the peak value as a mathematical function of those samples, e.g. an arithmetic average, to mitigate noise effects. Can be obtained by calculating.
The time window can be, for example, 100 milliseconds, and the number of samples in the time window can be, for example, 10 or more.
The time window based method is an example of digital filtering.
In general, there are a number of digital and analog signal processing methods that can be used to mitigate noise effects in signals representing cardiovascular motion and signals representing electromagnetic phenomena associated with cardiac activity.
本発明の好ましい実施形態による方法は、個体の身体よりセンサ素子を用いて心臓活動に関連する電磁現象を表す第1信号と心臓血管の動きを表す第2信号を測定するステップを所望により含む。
本発明の別の好ましい実施形態による方法は、メモリからこれらの信号を読むステップを含み、その場合、それらの信号は前に測定されており、そのメモリに記録されている。
本発明の好ましい実施形態による方法は、外部データ転送システムからそれらの信号を受信するステップを含む。
したがって、測定は、本発明の実施形態による方法の必須であり、必要なステップというわけではない。
The method according to a preferred embodiment of the present invention optionally includes the steps of measuring a first signal representative of electromagnetic phenomena associated with cardiac activity and a second signal representative of cardiovascular motion using sensor elements from the individual's body.
The method according to another preferred embodiment of the invention comprises the step of reading these signals from a memory, in which case they have been previously measured and recorded in that memory.
The method according to a preferred embodiment of the present invention includes receiving those signals from an external data transfer system.
Thus, measurement is an essential and not a necessary step of the method according to embodiments of the present invention.
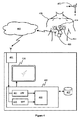
図4は心臓の機能不全と異常を表す情報を測定するための本発明の好ましい実施形態による器械の概略図を示す。
その器械は心臓活動に関連する電磁現象を表す第1信号と心臓血管の動きを表す第2信号を受信するための信号インターフェース401を備える。
その器械は前記信号インターフェースに接続されている処理装置402を備える。
その処理装置は、
−前記第1信号からある心拍数を繰り返す第1波形を抽出し、且つ、前記第2信号から前記心拍数を繰り返す第2波形を抽出し、
−各タイミング値がある1つの心拍周期に属する前記第1波形の基準点から同一の心拍周期に属する前記第2波形の基準点までの時間を表すタイミングデータを作成し、且つ、
−前記タイミングデータと前記の心拍数を表すペーシングデータとの間の相関を決定する、
ように構成されており、
その相関が心臓の機能不全と異常を表す。
FIG. 4 shows a schematic diagram of an instrument according to a preferred embodiment of the present invention for measuring information representing cardiac dysfunction and abnormalities.
The instrument comprises a
The instrument comprises a
The processing equipment is
-Extracting a first waveform repeating a heart rate from the first signal and extracting a second waveform repeating the heart rate from the second signal;
Creating timing data representing the time from the reference point of the first waveform belonging to one heartbeat period to the reference point of the second waveform belonging to the same heartbeat period, with each timing value; and
-Determining a correlation between the timing data and the pacing data representing the heart rate;
Is configured as
The correlation represents cardiac dysfunction and abnormality.
その第1信号は、例えば、心電計「ECG」波形又は誘導的に測定された波形を表し得る。 The first signal may represent, for example, an electrocardiograph “ECG” waveform or an inductively measured waveform.
本発明の好ましい実施形態による器械では、処理装置402は、RピークをECG波形から抽出し、且つ、AOピークを心臓血管の動きを表す波形から抽出する、ように構成されている。
この場合、Rピークは前記第1信号上で前記心拍数を繰り返す第1波形を表し、AOピークは前記第2信号上で前記心拍数を繰り返す第2波形を表す。
Rピークの頂点が前記第1波形の基準点であり得、AOピークの頂点が前記第2波形の基準点であり得る。
In an instrument according to a preferred embodiment of the present invention, the
In this case, the R peak represents a first waveform that repeats the heart rate on the first signal, and the AO peak represents a second waveform that repeats the heart rate on the second signal.
The apex of the R peak may be the reference point of the first waveform, and the apex of the AO peak may be the reference point of the second waveform.
本発明の別の好ましい実施形態による器械では、処理装置402は、RピークをECG波形から抽出し、Jピークを心臓血管の動きを表す波形から抽出する、ように構成されている。
この場合、Rピークは前記第1信号上で前記心拍数を繰り返す第1波形を表し、Jピークは前記第2信号上で前記心拍数を繰り返す第2波形を表す。
Rピークの頂点が前記第1波形の基準点であり得、Jピークの頂点が前記第2波形の基準点であり得る。
In an instrument according to another preferred embodiment of the present invention, the
In this case, the R peak represents a first waveform that repeats the heart rate on the first signal, and the J peak represents a second waveform that repeats the heart rate on the second signal.
The apex of the R peak may be the reference point of the first waveform, and the apex of the J peak may be the reference point of the second waveform.
本発明の好ましい実施形態による器械では、処理装置402は、RピークをECG波形から抽出し、MCピークとAOピークの間の谷を心臓血管の動きを表す波形から抽出する、ように構成されている。
この場合、Rピークは前記第1信号上で前記心拍数を繰り返す第1波形を表し、MCピークとAOピークの間の前記の谷は前記第2信号上で前記心拍数を繰り返す第2波形を表す。
Rピークの頂点が前記第1波形の基準点であり得、前記の谷の最低点が前記第2波形の基準点であり得る。
In an instrument according to a preferred embodiment of the present invention, the
In this case, the R peak represents a first waveform that repeats the heart rate on the first signal, and the valley between the MC peak and the AO peak represents a second waveform that repeats the heart rate on the second signal. Represent.
The peak of the R peak may be the reference point of the first waveform, and the lowest point of the valley may be the reference point of the second waveform.
本発明の好ましい実施形態による器械では、処理装置402は、前記タイミングデータと前記ペーシングデータとの間の前記相関の程度を表す相関係数:
式中、
C(j)はその相関係数であり、
Eは期待値演算子であり、
TDはタイミングデータであり、
μTはタイミングデータの平均であり、
PDはペーシングデータであり、
μPはペーシングデータの平均であり、
jは心拍周期内のタイミングデータに関してペーシングデータの時間差を表す整数である。
In an instrument according to a preferred embodiment of the present invention, the
Where
C (j) is the correlation coefficient,
E is the expectation operator,
TD is timing data,
μ T is the average of timing data,
PD is pacing data,
μ P is the average of pacing data,
j is an integer representing the time difference of the pacing data with respect to the timing data within the heartbeat cycle.
さらに、処理装置402は、計算された相関係数C(j)を1つ以上の閾値と比較し、且つ、その比較の結果が心臓の機能不全と異常の存在を示す状況に応答して心臓の機能不全と異常を表す信号を発信する、ように構成され得る。
その信号は、例えば、ディスプレー画面406上に示されるメッセージであり得る。
それらの1つ以上の閾値は、前記器械にそのユーザーインターフェースを介して提供され得る調節可能パラメーターであることが好ましい。
In addition, the
The signal can be, for example, a message shown on the
Those one or more thresholds are preferably adjustable parameters that can be provided to the instrument via its user interface.
本発明の好ましい実施形態による器械では、処理装置402は前記第1信号上の連続するRピーク間の時間を検出する、ように構成されている。
検出された時間は前記心拍数に反比例するものとしてその心拍数を表す。
したがって、それらの検出された時間をペーシングデータとして使用することができ、又はそれらの検出された時間を活用してペーシングデータを作成することができる。
In an instrument according to a preferred embodiment of the present invention, the
The detected time represents the heart rate as being inversely proportional to the heart rate.
Accordingly, those detected times can be used as pacing data, or pacing data can be created utilizing these detected times.
本発明の好ましい実施形態による器械では、処理装置402は、ペーシングデータの各値が前記心拍数の瞬時値を表すようにペーシングデータを作成し、且つ、相関係数が所定の閾値、例えば0よりも大きい状況に応答して心房細動を表す信号を発信する、ように構成されている。
In an instrument according to a preferred embodiment of the present invention, the
本発明の好ましい実施形態による器械では、処理装置402は、ペーシングデータの各値が1回の心拍周期の時間の長さを表すようにペーシングデータを作成し、且つ、相関係数が所定の閾値、例えば0未満である状況に応答して心房細動を表す信号を発信する、ように構成されている。
In an instrument according to a preferred embodiment of the present invention, the
本発明の好ましい実施形態による器械では、処理装置402は実質的に一定の心拍数に対応するタイミングデータの変化を測定する、ように構成されている。
その処理装置は、
その変化の程度を表す変化量:
式中、
Vはその変化量であり、
Eは期待値演算子であり、
TDはタイミングデータであり、
μTは検討中の前記心拍数におけるタイミングデータの平均である。
In an instrument according to a preferred embodiment of the present invention, the
The processing equipment is
The amount of change representing the degree of change:
Where
V is the amount of change,
E is the expectation operator,
TD is timing data,
The mu T is the average of timing data in the heart rate under consideration.
さらに、処理装置402は、計算された変化量Vを1つ以上の閾値と比較し、且つ、その比較の結果が心臓の機能不全と異常の存在を示す状況に応答して心臓の機能不全と異常を表す信号を発信する、ように構成され得る。
その信号は、例えば、ディスプレー画面406上に示されるメッセージであり得る。
それらの1つ以上の閾値は、前記器械にそのユーザーインターフェースを介して提供され得る調節可能パラメーターであることが好ましい。
In addition, the
The signal can be, for example, a message shown on the
Those one or more thresholds are preferably adjustable parameters that can be provided to the instrument via its user interface.
本発明の好ましい実施形態による器械では、処理装置402は、1回よりも多くの心拍数におけるタイミングデータの変化を検出し、且つ、それらの1回より多くの心拍数に関連する変化に基づいて心臓の機能不全と異常の指標を測定するように構成されている。
例えば、式(3)及び(4)は数回の心拍数における変化量を得るために使用され得る。
最終的な変化量は、検討中の心拍数に関連する変化量から数学的論理的演算、例えば、算術平均により計算され得る。
In an instrument according to a preferred embodiment of the present invention, the
For example, equations (3) and (4) can be used to obtain the amount of change in several heart rates.
The final change can be calculated from the change associated with the heart rate under consideration by a mathematical logic operation, such as an arithmetic average.
本発明の好ましい実施形態による器械は個体の身体409から前記第1信号を測定するための第1センサ素子403とその個体の身体から前記第2信号を測定するための第2センサ素子404をさらに備える。
その第1センサ素子と第2センサ素子は、それぞれが、例えば、無線リンク又は有線リンクであり得る1つ以上のデータ転送リンクを介して前記信号インターフェースに接続されている。
センサ素子403及び404から信号インターフェース401へのデータ転送は直接的に、又は例えば電気通信ネットワークなどのデータ転送ネットワーク405を介して起こり得る。
図4に示されている例となる事例では、センサ素子403とセンサ素子404の両方が無線送信機408に接続されている。
処理装置406を備える器械が前記のセンサ素子と一体化していることもあり得る。
この場合、前記信号インターフェースは実際にはセンサ素子403及び404から処理装置402までの単なる配線である。
The instrument according to a preferred embodiment of the present invention further comprises a
The first sensor element and the second sensor element are each connected to the signal interface via one or more data transfer links, which can be, for example, a wireless link or a wired link.
Data transfer from the
In the exemplary case shown in FIG. 4, both
It is possible that an instrument comprising a
In this case, the signal interface is actually simply a wiring from the
この例となる場合では、第1センサ素子403は個体の身体へ装着に適切な電極を備える。その第1センサ素子は、例えば、増幅器、信号フィルタ、及び/又はアナログデジタル「AD」変換器をさらに備え得る。
第2センサ素子404は、例えば、加速度センサ、圧電センサ、傾斜センサ、圧力センサ、又は力、加速度、変位、若しくは心臓血管の動きに関連し、心臓血管の動きを表す他のあらゆる物理量の測定に適切な他のあらゆる素子を備え得る。
その第2センサ素子は、例えば、増幅器、信号フィルタ、及び/又はアナログデジタル「AD」変換器をさらに備え得る。
加速度センサが、例えば図4に示されている座標系450の3つの互いに直交するx方向、y方向、及びz方向で独立的に動きを測定することができる3軸加速度センサであることが有利である。
この場合、心臓血管の動きを表す第2信号は3つの成分を含み、その第2信号、例えば、そのユークリッドノルム、すなわち、心臓血管の動きを表す3成分ベクトルの絶対値を作成することにより前処理され得る。
In this example, the
The
The second sensor element may further comprise, for example, an amplifier, a signal filter, and / or an analog to digital “AD” converter.
Advantageously, the acceleration sensor is, for example, a three-axis acceleration sensor capable of measuring movement independently in three mutually orthogonal x, y and z directions of the coordinate
In this case, the second signal representing the cardiovascular motion includes three components, and the second signal, eg, its Euclidean norm, ie, the absolute value of the three-component vector representing the cardiovascular motion, is generated in advance. Can be processed.
本発明の好ましい実施形態による器械は、固定された開始時点と固定された終止時点を有する時間ウィンドウ内、又は固定された時間の長さを有し、且つ、時間経過と共に移動するスライディング時間ウィンドウ内で第1信号と第2信号を記録する、ように構成されている。
その器械は、前記の信号を記録するための内部メモリ407を備えることができ、及び/又は、その器械は外部メモリへの接続のためのデータポートを備えることができる。
The instrument according to a preferred embodiment of the present invention is in a time window having a fixed start time and a fixed end time, or in a sliding time window having a fixed length of time and moving over time. The first signal and the second signal are recorded in the above.
The instrument can comprise an
本発明の好ましい実施形態による器械は心臓活動に関連する電磁現象を表す第1信号及び/又は心臓血管の動きを表す第2信号を前処理するための手段を備える。
その前処理は、例えば、呼吸、個体の非心臓血管の動き、外部的理由により引き起こされた振動等により生じた前記第2信号上のノイズの取り消しを含み得る。
その前処理のための手段を、例えば、処理装置402に装備することができ、又はその前処理のための1つ以上の別の処理装置が存在し得る。
An instrument according to a preferred embodiment of the invention comprises means for preprocessing a first signal representative of electromagnetic phenomena associated with cardiac activity and / or a second signal representative of cardiovascular motion.
The preprocessing may include cancellation of noise on the second signal caused by, for example, respiration, non-cardiovascular movement of the individual, vibrations caused by external reasons, and the like.
Means for the pre-treatment can be equipped, for example, in the
本発明の好ましい実施形態による器械では、処理装置402は、心臓血管の動きを表す第2信号をローパスフィルタにかけ、上述のAOピークをそのローパスフィルタにかけられた信号から検出する、ように構成されている。
図4に示されている機能ブロック420はそのローパスフィルタリングを表し、機能ブロック422はAOピークの検出を表す。
In an instrument according to a preferred embodiment of the present invention, the
The
本発明の好ましい実施形態による器械では、処理装置402は、心臓血管の動きを表す第2信号をバンドパスフィルタにかけ、大動脈弁の閉鎖によって生じるACピークをそのバンドパスフィルタにかけられた信号から検出する、ように構成されている。
図4に示されている機能ブロック421はそのバンドパスフィルタリングを表し、機能ブロック422はACピークの検出を表す。
図4に示されている例となる事例では、ローパスフィルタリングとバンドフィルタリングの両方が存在し、機能ブロック422がAOピークとACピークの両方の検出を表す。
ローパスフィルタリングの上限の周波数は、必ずというわけではないが、例えば、30Hzであり得、バンドパスフィルタリングの通過帯域は、必ずというわけではないが、例えば、40Hzから最大で100Hzまでであり得る。
ローパスフィルタリング及び/又はパスバンドフィルタリングはAOピーク及び/又はACピークの検出を容易にする。
検出されたAOピーク及び/又はACピークは利用され得る例えば上述の第2波形を心臓血管の動きを表す信号から抽出するときに.検出されたAOピーク及び/又はACピークは他の多くの目的のためにも、例えば振幅の変化、時間変化、心拍数、収縮間隔、及び/又は拡張間隔を検出するために使用され得る。
In an instrument according to a preferred embodiment of the present invention, the
The
In the example case shown in FIG. 4, both low-pass filtering and band filtering exist, and
The upper limit frequency of the low-pass filtering is not necessarily, but may be, for example, 30 Hz, and the passband of the band-pass filtering is not necessarily, but may be, for example, 40 Hz to a maximum of 100 Hz.
Low pass filtering and / or passband filtering facilitates detection of AO peaks and / or AC peaks.
The detected AO peak and / or AC peak can be utilized, for example, when extracting the second waveform described above from a signal representing cardiovascular motion. The detected AO peak and / or AC peak can be used for many other purposes, for example, to detect amplitude changes, time changes, heart rate, systolic intervals, and / or dilation intervals.
本発明の好ましい実施形態による器械では、処理装置502はAC〜AO間隔の時間の長さを検出し、且つ、検出されたAC〜AO間隔の時間の長さの変化の強度を表す時間変化量を計算する、ように構成されている。
前記のAC〜AO間隔のそれぞれはACピークのうちの1つからAOピークのうちの次の1つまでの時間間隔であり、前記の時間変化量は心臓の機能不全と異常を表す。
この時間変化量は可能性がある心臓の機能不全と異常の検出の信頼性を上昇させるためにタイミングデータとペーシングデータとの間の上述の相関と共に使用され得る。
しかしながら、この時間変化量は単独でも使用され得る。
In an instrument according to a preferred embodiment of the present invention, the
Each of the AC to AO intervals is a time interval from one of the AC peaks to the next one of the AO peaks, and the time variation represents cardiac dysfunction and abnormality.
This amount of time variation can be used in conjunction with the above correlation between timing data and pacing data to increase the reliability of detection of potential cardiac dysfunctions and abnormalities.
However, this amount of time change can be used alone.
本発明の好ましい実施形態による器械では、処理装置502はAC〜AO間隔の時間の長さとAO〜AO間隔の時間の長さを検出し、且つ、同一の心拍周期内のAC〜AO間隔の時間の長さとAO〜AO間隔の時間の長さの間の比率を表す第1比率量を計算するように構成されている。
前記のAC〜AO間隔のそれぞれはACピークのうちの1つからAOピークのうちの次の1つまでの時間間隔であり、前記のAO〜AO間隔のそれぞれはAOピークのうちの1つからAOピークのうちの次の1つまでの時間間隔であり、その第1比率量が心臓の機能不全と異常を表す。
この第1比率量は可能性がある心臓の機能不全と異常の検出の信頼性を上昇させるためにタイミングデータとペーシングデータとの間の上述の相関と共に使用され得る。しかしながら、この第1比率量は単独でも使用され得る。
In an instrument according to a preferred embodiment of the present invention, the
Each of the AC to AO intervals is a time interval from one of the AC peaks to the next of the AO peaks, and each of the AO to AO intervals is from one of the AO peaks. The time interval to the next one of the AO peaks, the first ratio amount representing cardiac dysfunction and abnormality.
This first ratio amount may be used in conjunction with the above-described correlation between timing data and pacing data to increase the reliability of potential cardiac dysfunction and abnormality detection. However, this first ratio amount can be used alone.
本発明の好ましい実施形態による器械では、処理装置502は、AC〜R間隔の時間の長さとR〜R間隔の時間の長さを検出し、且つ、同一の心拍周期内の前記のAC〜R間隔の時間の長さと前記のR〜R間隔の時間の長さの間の比率を表す第2比率量を計算するように構成されている。
前記のAC〜R間隔のそれぞれはACピークのうちの1つからRピークのうちの次の1つまでの時間間隔であり、前記のR〜R間隔のそれぞれはRピークのうちの1つからRピークのうちの次の1つまでの時間間隔であり、その第2比率量が心臓の機能不全と異常を表す。
この第2比率量は可能性がある心臓の機能不全と異常の検出の信頼性を上昇させるためにタイミングデータとペーシングデータとの間の上述の相関と共に使用され得る。
しかしながら、この第2比率量は単独でも使用され得る。
In an instrument according to a preferred embodiment of the present invention, the
Each of the AC to R intervals is a time interval from one of the AC peaks to the next one of the R peaks, and each of the R to R intervals is from one of the R peaks. Time interval to the next one of the R peaks, the second ratio amount representing cardiac dysfunction and abnormality.
This second ratio amount can be used in conjunction with the above-described correlation between timing data and pacing data to increase the reliability of potential cardiac dysfunction and abnormality detection.
However, this second ratio amount can be used alone.
処理装置402に、例えば、1つ以上のプロセッサ回路を装備することができ、それらの回路のそれぞれが適切なソフトウェア、例えば特定用途向け集積回路「ASIC」などの専用ハードウェアプロセッサ、又は、例えばフィールドプログラマブルゲートアレイ「FPGA」などの構成可能ハードウェアプロセッサと共に提供されるプログラミング可能なプロセッサ回路であり得る。
The
本発明の好ましい実施形態によるコンピュータプログラムは心臓の機能不全と異常を表す情報を測定するためのソフトウェアモジュールを備える。
それらのソフトウェアモジュールは、
−心臓活動に関連する電磁現象を表す第1信号からある心拍数を繰り返す第1波形を抽出し、
−心臓血管の動きを表す第2信号から前記心拍数を繰り返す第2波形を抽出し、
−各タイミング値がある1つの心拍周期に属する前記第1波形の基準点から同一の心拍周期に属する前記第2波形の基準点までの時間を表すタイミングデータを作成し、且つ、
−前記タイミングデータと前記の心拍数を表すペーシングデータとの間の相関を決定する、
プログラミング可能なプロセッサを制御するためのコンピュータが実行可能な命令を備え、
その相関が心臓の機能不全と異常を表す。
A computer program according to a preferred embodiment of the present invention comprises a software module for measuring information indicative of cardiac dysfunction and abnormalities.
Those software modules are
-Extracting a first waveform that repeats a certain heart rate from a first signal representing an electromagnetic phenomenon associated with cardiac activity;
-Extracting a second waveform repeating the heart rate from a second signal representing cardiovascular movement;
Creating timing data representing the time from the reference point of the first waveform belonging to one heartbeat period to the reference point of the second waveform belonging to the same heartbeat period, with each timing value; and
-Determining a correlation between the timing data and the pacing data representing the heart rate;
Computer-executable instructions for controlling a programmable processor,
The correlation represents cardiac dysfunction and abnormality.
本発明の好ましい実施形態によるコンピュータプログラムでは、前記のソフトウェアモジュールは次のもののうちの少なくとも1つを備える:
−心臓血管の動きを表す信号をローパスフィルタにかけ、そのローパスフィルタにかけられた信号からAOピークを検出する、プログラミング可能なプロセッサを制御するためのコンピュータが実行可能な命令、及び/又は
−心臓血管の動きを表す前記信号をバンドパスフィルタにかけ、そのバンドパスフィルタにかけられた信号からACピークを検出する、プログラミング可能なプロセッサを制御するためのコンピュータが実行可能な命令。
In a computer program according to a preferred embodiment of the present invention, said software module comprises at least one of the following:
A computer-executable instruction for controlling a programmable processor that applies a low-pass filter to a signal representative of cardiovascular motion and detects an AO peak from the low-pass filtered signal, and / or Computer-executable instructions for controlling a programmable processor that applies a band-pass filter to the signal representative of motion and detects an AC peak from the band-pass filtered signal.
前記のソフトウェアモジュールは、例えば、適切なプログラミング言語が実装されており、且つ、そのプログラミング言語と前記のプログラミング可能なプロセッサに適切なコンパイラーが実装されているサブルーチン又はファンクションであり得る。 The software module may be, for example, a subroutine or function in which a suitable programming language is implemented and a compiler suitable for the programming language and the programmable processor is implemented.
本発明の好ましい実施形態によるコンピュータプログラム製品は発明の実施形態によるコンピュータプログラムが符号化されているコンピュータ可読媒体、例えばコンパクトディスク「CD」を備える。 A computer program product according to a preferred embodiment of the invention comprises a computer readable medium, for example a compact disc “CD”, on which a computer program according to an embodiment of the invention is encoded.
本発明の好ましい実施形態による信号は発明の実施形態によるコンピュータプログラムを定義する情報を担持するために符号化される。 A signal according to a preferred embodiment of the invention is encoded to carry information defining a computer program according to an embodiment of the invention.
上記の説明において提供された特定の例は、添付されている特許請求の範囲及び/又は特許請求項の適用可能性を限定するものと解釈されるべきではない。さらに、多くの場合、本発明は心臓の機能不全と異常を検出するための他の技術と共に使用され得ることにも留意されたい。 The specific examples provided in the above description should not be construed as limiting the scope of the appended claims and / or the applicability of the claims. It should also be noted that in many cases the present invention can be used with other techniques for detecting cardiac dysfunction and abnormalities.
Claims (42)
前記信号インターフェースに接続されており、前記第1信号からある心拍数を繰り返す第1波形を抽出し、且つ、前記第2信号から前記心拍数を繰り返す第2波形を抽出するように構成されている処理装置(402)と、
を備える器械であって、
前記処理装置が、さらに、
−各タイミング値がある1つの心拍周期に属する前記第1波形の基準点から同一の心拍周期に属する前記第2波形の基準点までの時間を表すタイミングデータを作成し、且つ、
−前記タイミングデータと前記心拍数を表すペーシングデータとの間の相関を決定する、
ように構成されており、
前記相関が心臓の機能不全と異常を表す、
ことを特徴とする前記器械。 A signal interface (401) for receiving a first signal representing an electromagnetic phenomenon associated with cardiac activity and a second signal representing cardiovascular movement;
It is connected to the signal interface, and is configured to extract a first waveform that repeats a certain heart rate from the first signal and extract a second waveform that repeats the heart rate from the second signal. A processing device (402);
An instrument comprising:
The processing apparatus further comprises:
Creating timing data representing the time from the reference point of the first waveform belonging to one heartbeat period to the reference point of the second waveform belonging to the same heartbeat period, with each timing value; and
-Determining a correlation between the timing data and pacing data representing the heart rate;
Is configured as
The correlation represents cardiac dysfunction and abnormality,
The instrument characterized by the above-mentioned.
前記第1信号を測定するための第1センサ素子(403)と、
前記第2信号を測定するための第2センサ素子(404)と、
を備える、ことを特徴とする請求項1に記載の器械。 The instrument further comprises:
A first sensor element (403) for measuring the first signal;
A second sensor element (404) for measuring the second signal;
The instrument according to claim 1, comprising:
心室性筋肉組織の脱分極によって生じ、前記第1信号上で前記心拍数を繰り返す前記第1波形を表すRピークを前記第1信号から抽出し、且つ、
大動脈弁の開放によって生じ、前記第2信号上で前記心拍数を繰り返す前記第2波形を表すAOピークを前記第2信号から抽出する、
ように構成されている、
ことを特徴とする請求項1〜3のいずれか一項に記載の器械。 The processing device is
Extracting from the first signal an R peak that results from depolarization of ventricular musculature and representing the first waveform repeating the heart rate on the first signal; and
Extracting from the second signal an AO peak that results from the opening of the aortic valve and that represents the second waveform that repeats the heart rate on the second signal;
Configured as
The instrument according to any one of claims 1 to 3, wherein
心室性筋肉組織の脱分極によって生じ、前記第1信号上で前記心拍数を繰り返す前記第1波形を表すRピークを前記第1信号から抽出し、且つ、
大動脈弁を通る左心室から大動脈への血流によって生じ、前記第2信号上で前記心拍数を繰り返す前記第2波形を表すJピークを前記第2信号から抽出する、
ように構成されている、
ことを特徴とする請求項1〜3のいずれか一項に記載の器械。 The processing device is
Extracting from the first signal an R peak that results from depolarization of ventricular musculature and representing the first waveform repeating the heart rate on the first signal; and
Extracting from the second signal a J peak that is caused by blood flow from the left ventricle through the aortic valve to the aorta and that represents the second waveform that repeats the heart rate on the second signal;
Configured as
The instrument according to any one of claims 1 to 3, wherein
心室性筋肉組織の脱分極によって生じ、前記第1信号上で前記心拍数を繰り返す前記第1波形を表すRピークを前記第1信号から抽出し、且つ、
僧帽弁の閉鎖によって生じるMCピークと大動脈弁の開放によって生じるAOピークの間の谷であって、前記第2信号上で前記心拍数を繰り返す前記第2波形を表すMCピークとAOピークの間の前記の谷を前記第2信号から抽出する、
ように構成されている、
ことを特徴とする請求項1〜3のいずれか一項に記載の器械。 The processing device is
Extracting from the first signal an R peak that results from depolarization of ventricular musculature and representing the first waveform repeating the heart rate on the first signal; and
A valley between the MC peak caused by mitral valve closure and the AO peak caused by aortic valve opening, between the MC peak and AO peak representing the second waveform repeating the heart rate on the second signal. Extracting the trough of the second signal from the second signal;
Configured as
The instrument according to any one of claims 1 to 3, wherein
Rピークの頂点を前記第1波形の前記基準点として使用し、且つ、
AOピークの頂点、Jピークの頂点、又はMCピークとAOピークの間の前記の谷の最低点を前記第2波形の前記基準点として使用する、
ように構成されている、
ことを特徴とする請求項4〜6のいずれか一項に記載の器械。 The processing device is
Using the apex of the R peak as the reference point of the first waveform; and
Using the peak of the AO peak, the peak of the J peak, or the lowest point of the valley between the MC peak and the AO peak as the reference point of the second waveform;
Configured as
The instrument according to any one of claims 4 to 6, characterized by that.
前記タイミングデータと前記ペーシングデータとの間の前記相関の程度を表す相関係数:
式中、
C(j)が前記相関係数であり、
Eが期待値演算子であり、
TDが前記タイミングデータであり、
μTが前記タイミングデータの平均であり、
PDが前記ペーシングデータであり、
μPが前記ペーシングデータの平均であり、
jが心拍周期内の前記タイミングデータに関して前記ペーシングデータの時間差を表す整数である、
ことを特徴とする請求項1に記載の器械。 The processing device is
A correlation coefficient representing the degree of the correlation between the timing data and the pacing data:
Where
C (j) is the correlation coefficient,
E is the expectation operator,
TD is the timing data,
μ T is the average of the timing data,
PD is the pacing data,
μ P is the average of the pacing data,
j is an integer representing the time difference of the pacing data with respect to the timing data within a cardiac cycle;
The instrument according to claim 1.
実質的に一定の心拍数に対応する前記タイミングデータの変化を測定するように構成されており、
前記の変化の程度が心臓の機能不全と異常を表す、
ことを特徴とする請求項1〜8のいずれか一項に記載の器械。 The processing device is
Configured to measure a change in the timing data corresponding to a substantially constant heart rate;
The degree of change represents cardiac dysfunction and abnormalities,
The instrument according to any one of claims 1 to 8, characterized by that.
式中、
Vが前記変化量であり、
Eが期待値演算子であり、
TDが前記タイミングデータであり、
μTが検討中の前記心拍数における前記タイミングデータの平均である、
ことを特徴とする請求項9に記載の器械。 A change amount indicating the degree of the change of the timing data by the processing device:
Where
V is the amount of change,
E is the expectation operator,
TD is the timing data,
μ T is the average of the timing data at the heart rate under consideration,
The instrument according to claim 9.
前記の検出された時間が前記心拍数に反比例するものとして前記の心拍数を表す、
ことを特徴とする請求項1又は8に記載の器械。 The processor is configured to detect a time between successive R peaks on the first signal to obtain the pacing data;
The detected time represents the heart rate as inversely proportional to the heart rate,
The instrument according to claim 1 or 8, characterized in that.
前記ペーシングデータの各値が前記心拍数の瞬時値を表すように前記ペーシングデータを作成し、且つ、
前記相関係数が閾値よりも大きい状況に応答して心房細動を表す信号を発信する、
ように構成されている、
ことを特徴とする請求項8に記載の器械。 The processing device is
Creating the pacing data such that each value of the pacing data represents an instantaneous value of the heart rate; and
Transmitting a signal representative of atrial fibrillation in response to a situation where the correlation coefficient is greater than a threshold;
Configured as
The instrument according to claim 8.
前記ペーシングデータの各値が1回の心拍周期の時間の長さを表すように前記ペーシングデータを作成し、且つ、
前記相関係数が閾値未満である状況に応答して心房細動を表す信号を発信する、
ように構成されている、
ことを特徴とする請求項8に記載の器械。 The processing device is
Creating the pacing data such that each value of the pacing data represents the length of time of one heart cycle; and
Emitting a signal representative of atrial fibrillation in response to a situation where the correlation coefficient is less than a threshold;
Configured as
The instrument according to claim 8.
ように構成されている、ことを特徴とする請求項12又は13に記載の器械。 The processor uses 0 as the threshold;
14. The instrument according to claim 12, wherein the instrument is configured as follows.
前記の心臓血管の動きを表す前記第2信号をローパスフィルタにかけ、且つ、
前記のローパスフィルタにかけられた信号からAOピークを検出する、
ように構成されている、
ことを特徴とする請求項4〜14のいずれか一項に記載の器械。 The processing device is
Applying a low pass filter to the second signal representative of the cardiovascular movement; and
Detecting an AO peak from the signal applied to the low-pass filter,
Configured as
15. An instrument according to any one of claims 4 to 14, characterized in that
前記の心臓血管の動きを表す前記第2信号をバンドパスフィルタにかけ、且つ、
大動脈弁の閉鎖によって生じるACピークを前記のバンドパスフィルタにかけられた信号から検出する、
ように構成されている、請求項4〜16のいずれか一項に記載の器械。 The processing device is
Applying a bandpass filter to the second signal representative of the cardiovascular motion; and
Detecting the AC peak caused by the closure of the aortic valve from the bandpass filtered signal;
The instrument according to any one of claims 4 to 16, which is configured as follows.
AC〜AO間隔の時間の長さを検出し、且つ、
前記の検出された前記AC〜AO間隔の時間の長さの変化の強度を表す時間変化量を計算する、
ように構成されており、
前記AC〜AO間隔のそれぞれが前記ACピークのうちの1つから前記AOピークのうちの次の1つまでの時間間隔であり、
前記時間変化量が心臓の機能不全と異常を表す、
ことを特徴とする請求項17又は18に記載の器械。 The processing device is
Detecting the length of time between the AC and AO intervals; and
Calculating a time variation representing the intensity of a change in the length of time of the detected AC-AO interval;
Is configured as
Each of the AC-AO intervals is a time interval from one of the AC peaks to the next one of the AO peaks;
The time variation represents cardiac dysfunction and abnormality,
An instrument according to claim 17 or 18, characterized in that
AC〜AO間隔の時間の長さとAO〜AO間隔の時間の長さを検出し、且つ、
同一の心拍周期内の前記のAC〜AO間隔の時間の長さと前記のAO〜AO間隔の時間の長さの間の比率を表す第1比率量を計算する、
ように構成されており、
前記AC〜AO間隔のそれぞれが前記ACピークのうちの1つから前記AOピークのうちの次の1つまでの時間間隔であり、
前記AO〜AO間隔のそれぞれが前記AOピークのうちの1つから前記AOピークのうちの次の1つまでの時間間隔であり、
前記第1比率量が心臓の機能不全と異常を表す、
ことを特徴とする請求項17又は18に記載の器械。 The processing device is
Detecting the length of time between the AC and AO intervals and the length of time between the AO and AO intervals; and
Calculating a first ratio amount representing a ratio between the length of time of the AC-AO interval and the length of time of the AO-AO interval within the same heartbeat cycle;
Is configured as
Each of the AC-AO intervals is a time interval from one of the AC peaks to the next one of the AO peaks;
Each of the AO-AO intervals is a time interval from one of the AO peaks to the next one of the AO peaks;
The first ratio amount represents cardiac dysfunction and abnormality;
An instrument according to claim 17 or 18, characterized in that
AC〜R間隔の時間の長さとR〜R間隔の時間の長さを検出し、且つ、
同一の心拍周期内の前記のAC〜R間隔の時間の長さと前記のR〜R間隔の時間の長さの間の比率を表す第2比率量を計算する、
ように構成されており、
前記AC〜R間隔のそれぞれが前記ACピークのうちの1つから前記Rピークのうちの次の1つまでの時間間隔であり、
前記R〜R間隔のそれぞれが前記Rピークのうちの1つから前記Rピークのうちの次の1つまでの時間間隔であり、
前記第2比率量が心臓の機能不全と異常を表す、
ことを特徴とする請求項17又は18に記載の器械。 The processing device is
Detecting the length of time between AC and R intervals and the length of time between R and R intervals; and
Calculating a second ratio amount representing a ratio between the length of time of the AC to R intervals and the length of time of the R to R intervals within the same heartbeat cycle;
Is configured as
Each of the AC-R intervals is a time interval from one of the AC peaks to the next one of the R peaks;
Each of the R to R intervals is a time interval from one of the R peaks to the next one of the R peaks;
The second ratio amount represents cardiac dysfunction and abnormality;
An instrument according to claim 17 or 18, characterized in that
心臓血管の動きを表す第2信号から前記心拍数を繰り返す第2波形を抽出するステップ(202)と、
を含む方法であって、
前記方法が、
−各タイミング値がある1つの心拍周期に属する前記第1波形の基準点から同一の心拍周期に属する前記第2波形の基準点までの時間を表すタイミングデータを作成するステップ(203)と、
−前記タイミングデータと前記心拍数を表すペーシングデータとの間の相関を決定するステップ(204)と、
をさらに含み、
前記相関が心臓の機能不全と異常を表す、
ことを特徴とする方法。 Extracting a first waveform that repeats a heart rate from a first signal representative of an electromagnetic phenomenon associated with cardiac activity (201);
Extracting a second waveform that repeats the heart rate from a second signal representing cardiovascular motion (202);
A method comprising:
The method comprises
Creating timing data (203) representing time from a reference point of the first waveform belonging to one heartbeat period to a reference point of the second waveform belonging to the same heartbeat period, each timing value;
Determining a correlation (204) between the timing data and pacing data representing the heart rate;
Further including
The correlation represents cardiac dysfunction and abnormality,
A method characterized by that.
心室性筋肉組織の脱分極によって生じ、前記第1信号上で前記心拍数を繰り返す前記第1波形を表すRピークを前記第1信号から抽出するステップと、
及び大動脈弁の開放によって生じ、前記第2信号上で前記心拍数を繰り返す前記第2波形を表すAOピークを前記第2信号から抽出するステップと
を含む、請求項22に記載の方法。 The method comprises
Extracting from the first signal an R peak that is caused by depolarization of ventricular muscle tissue and that represents the first waveform that repeats the heart rate on the first signal;
And extracting from the second signal an AO peak that results from the opening of the aortic valve and that represents the second waveform that repeats the heart rate on the second signal.
心室性筋肉組織の脱分極によって生じ、前記第1信号上で前記心拍数を繰り返す前記第1波形を表すRピークを前記第1信号から抽出するステップと、
大動脈弁を通る左心室から大動脈への血流によって生じ、前記第2信号上で前記心拍数を繰り返す前記第2波形を表すJピークを前記第2信号から抽出するステップと、
を含む、
ことを特徴とする請求項22に記載の方法。 The method comprises
Extracting from the first signal an R peak that is caused by depolarization of ventricular muscle tissue and that represents the first waveform that repeats the heart rate on the first signal;
Extracting from the second signal a J peak that is caused by blood flow from the left ventricle through the aortic valve to the aorta and that represents the second waveform that repeats the heart rate on the second signal;
including,
23. The method of claim 22, wherein:
心室性筋肉組織の脱分極によって生じ、前記第1信号上で前記心拍数を繰り返す前記第1波形を表すRピークを前記第1信号から抽出するステップと、
僧帽弁の閉鎖によって生じるMCピークと大動脈弁の開放によって生じるAOピークの間の谷であって、前記第2信号上で前記心拍数を繰り返す前記第2波形を表すMCピークとAOピークの間の前記の谷を前記第2信号から抽出するステップと、
を含む、
ことを特徴とする請求項22に記載の方法。 The method comprises
Extracting from the first signal an R peak that is caused by depolarization of ventricular muscle tissue and that represents the first waveform that repeats the heart rate on the first signal;
A valley between the MC peak caused by mitral valve closure and the AO peak caused by aortic valve opening, between the MC peak and AO peak representing the second waveform repeating the heart rate on the second signal. Extracting the trough of the second signal from the second signal;
including,
23. The method of claim 22, wherein:
AOピークの頂点、Jピークの頂点、又はMCピークとAOピークの間の前記の谷の最低点が前記第2波形の前記基準点である、
ことを特徴とする請求項23〜25のいずれか一項に記載の方法。 The peak of the R peak is the reference point of the first waveform, and
The peak of the AO peak, the peak of the J peak, or the lowest point of the valley between the MC peak and the AO peak is the reference point of the second waveform.
26. A method as claimed in any one of claims 23 to 25.
式中、
C(j)が前記相関係数であり、
Eが期待値演算子であり、
TDが前記タイミングデータであり、
μTが前記タイミングデータの平均であり、
PDが前記ペーシングデータであり、
μPが前記ペーシングデータの平均であり、
jが心拍周期内の前記タイミングデータに関して前記ペーシングデータの時間差を表す整数である、
ことを特徴とする請求項22に記載の方法。 A correlation coefficient representing the degree of the correlation between the timing data and the pacing data:
Where
C (j) is the correlation coefficient,
E is the expectation operator,
TD is the timing data,
μ T is the average of the timing data,
PD is the pacing data,
μ P is the average of the pacing data,
j is an integer representing the time difference of the pacing data with respect to the timing data within a cardiac cycle;
23. The method of claim 22, wherein:
前記の変化の程度が心臓の機能不全と異常を表す、
ことを特徴とする請求項22〜26のいずれか一項に記載の方法。 Measuring an indication of cardiac dysfunction and abnormality (204) comprises measuring a change in the timing data corresponding to a substantially constant heart rate;
The degree of change represents cardiac dysfunction and abnormalities,
27. A method according to any one of claims 22 to 26.
式中、
Vが前記変化量であり、
Eが期待値演算子であり、
TDが前記タイミングデータであり、
μTが検討中の前記心拍数における前記タイミングデータの平均である、
ことを特徴とする請求項28に記載の方法。 A change amount indicating the degree of the change in the timing data:
Where
V is the amount of change,
E is the expectation operator,
TD is the timing data,
μ T is the average of the timing data at the heart rate under consideration,
29. The method of claim 28, wherein:
前記ペーシングデータを得るために前記第1信号上の連続するRピーク間の時間を検出するステップを含み、
前記の検出された時間が前記心拍数に反比例するものとして前記の心拍数を表す、
ことを特徴とする請求項22又は27に記載の方法。 The method comprises
Detecting the time between successive R peaks on the first signal to obtain the pacing data;
The detected time represents the heart rate as inversely proportional to the heart rate,
28. A method according to claim 22 or 27, wherein:
前記方法が、前記相関係数が閾値よりも大きい状況に応答して心房細動を表す信号を発信するステップを含む、
ことを特徴とする請求項27に記載の方法。 Each value of the pacing data represents an instantaneous value of the heart rate, and
The method includes transmitting a signal representative of atrial fibrillation in response to a situation where the correlation coefficient is greater than a threshold;
28. The method of claim 27.
前記方法が、前記相関係数が閾値未満である状況に応答して心房細動を表す信号を発信するステップを含む、
ことを特徴とする請求項27に記載の方法。 Each value of the pacing data represents the length of time of one cardiac cycle, and
The method includes transmitting a signal representative of atrial fibrillation in response to a situation where the correlation coefficient is less than a threshold;
28. The method of claim 27.
前記の心臓血管の動きを表す前記第2信号をローパスフィルタにかけるステップ(211)と、
前記のローパスフィルタにかけられた信号からAOピークを検出するステップ(212)と、
を含む、ことを特徴とする請求項23〜33のいずれか一項に記載の方法。 The method comprises
Applying a low pass filter to the second signal representative of the cardiovascular movement (211);
Detecting an AO peak from the low-pass filtered signal (212);
34. The method according to any one of claims 23 to 33, comprising:
前記の心臓血管の動きを表す前記第2信号をバンドパスフィルタにかけるステップ(211)と、
大動脈弁の閉鎖によって生じるACピークを前記のバンドパスフィルタにかけられた信号から検出するステップ(212)と、
を含む、ことを特徴とする請求項23〜35のいずれか一項に記載の方法。 The method comprises
Applying a second pass signal to the second signal representative of the cardiovascular motion (211);
Detecting (212) an AC peak resulting from the closure of the aortic valve from the bandpass filtered signal;
36. The method according to any one of claims 23 to 35, comprising:
AC〜AO間隔の時間の長さを検出するステップと、
前記の検出された前記AC〜AO間隔の時間の長さの変化の強度を表す時間変化量を計算するステップと、を含み、
前記AC〜AO間隔のそれぞれが前記ACピークのうちの1つから前記AOピークのうちの次の1つまでの時間間隔であり、
前記時間変化量が心臓の機能不全と異常を表す、
ことを特徴とする請求項36又は37に記載の方法。 The method comprises
Detecting the length of time of the AC to AO interval;
Calculating a time variation representing the intensity of the detected change in length of time of the AC-AO interval;
Each of the AC-AO intervals is a time interval from one of the AC peaks to the next one of the AO peaks;
The time variation represents cardiac dysfunction and abnormality,
38. A method according to claim 36 or 37.
AC〜AO間隔の時間の長さとAO〜AO間隔の時間の長さを検出するステップと、
同一の心拍周期内の前記のAC〜AO間隔の時間の長さと前記のAO〜AO間隔の時間の長さの間の比率を表す第1比率量を計算するステップと、を含み、
前記AC〜AO間隔のそれぞれが前記ACピークのうちの1つから前記AOピークのうちの次の1つまでの時間間隔であり、
前記AO〜AO間隔のそれぞれが前記AOピークのうちの1つから前記AOピークのうちの次の1つまでの時間間隔であり、
前記第1比率量が心臓の機能不全と異常を表す、
ことを特徴とする請求項36又は37に記載の方法。 The method comprises
Detecting the length of time of the AC to AO interval and the length of time of the AO to AO interval;
Calculating a first ratio amount representing a ratio between a length of time of the AC-AO interval and a length of time of the AO-AO interval within the same heartbeat cycle;
Each of the AC-AO intervals is a time interval from one of the AC peaks to the next one of the AO peaks;
Each of the AO-AO intervals is a time interval from one of the AO peaks to the next one of the AO peaks;
The first ratio amount represents cardiac dysfunction and abnormality;
38. A method according to claim 36 or 37.
AC〜R間隔の時間の長さとR〜R間隔の時間の長さを検出するステップと、
同一の心拍周期内の前記AC〜R間隔の時間の長さと前記R〜R間隔の時間の長さの間の比率を表す第2比率量を計算すステップと、を含み、
前記AC〜R間隔のそれぞれが前記ACピークのうちの1つから前記Rピークのうちの次の1つまでの時間間隔であり、
前記R〜R間隔のそれぞれが前記Rピークのうちの1つから前記Rピークのうちの次の1つまでの時間間隔であり、
前記第2比率量が心臓の機能不全と異常を表す、
ことを特徴とする請求項36又は37に記載の方法。 The method comprises
Detecting the length of time of the AC to R interval and the length of time of the R to R interval;
Calculating a second ratio amount representing a ratio between the length of time of the AC to R intervals and the length of time of the R to R intervals within the same heartbeat cycle;
Each of the AC-R intervals is a time interval from one of the AC peaks to the next one of the R peaks;
Each of the R to R intervals is a time interval from one of the R peaks to the next one of the R peaks;
The second ratio amount represents cardiac dysfunction and abnormality;
38. A method according to claim 36 or 37.
心臓活動に関連する電磁現象を表す第1信号からある心拍数を繰り返す第1波形を抽出し、且つ、心臓血管の動きを表す第2信号から前記心拍数を繰り返す第2波形を抽出する、プログラミング可能なプロセッサを制御するためのコンピュータが実行可能な命令を含み、
さらに、
−各タイミング値がある1つの心拍周期に属する前記第1波形の基準点から同一の心拍周期に属する前記第2波形の基準点までの時間を表すタイミングデータを作成し、且つ、
−前記タイミングデータと前記心拍数を表すペーシングデータとの間の相関を決定し、
前記相関が心臓の機能不全と異常を表す、プログラミング可能なプロセッサを制御するためのコンピュータが実行可能な命令を含む、
ことを特徴とするコンピュータプログラム。 A computer program,
A programming that extracts a first waveform that repeats a heart rate from a first signal that represents an electromagnetic phenomenon related to cardiac activity, and that extracts a second waveform that repeats the heart rate from a second signal that represents cardiovascular motion. Computer-executable instructions for controlling possible processors,
further,
Creating timing data representing the time from the reference point of the first waveform belonging to one heartbeat period to the reference point of the second waveform belonging to the same heartbeat period, with each timing value; and
-Determining a correlation between the timing data and pacing data representing the heart rate;
Computer-executable instructions for controlling a programmable processor, wherein the correlation represents cardiac dysfunction and abnormality,
A computer program characterized by the above.
Applications Claiming Priority (3)
| Application Number | Priority Date | Filing Date | Title |
|---|---|---|---|
| FI20125442 | 2012-04-23 | ||
| FI20125442 | 2012-04-23 | ||
| PCT/FI2013/050421 WO2013160537A1 (en) | 2012-04-23 | 2013-04-17 | Method and apparatus for determining information indicative of cardiac malfunctions and abnormalities |
Related Child Applications (1)
| Application Number | Title | Priority Date | Filing Date |
|---|---|---|---|
| JP2018006247A Division JP6571807B2 (en) | 2012-04-23 | 2018-01-18 | Method and instrument for measuring information indicative of cardiac dysfunction and abnormality |
Publications (2)
| Publication Number | Publication Date |
|---|---|
| JP2015517841A true JP2015517841A (en) | 2015-06-25 |
| JP6336963B2 JP6336963B2 (en) | 2018-06-06 |
Family
ID=48468344
Family Applications (2)
| Application Number | Title | Priority Date | Filing Date |
|---|---|---|---|
| JP2015507565A Active JP6336963B2 (en) | 2012-04-23 | 2013-04-17 | Method and instrument for measuring information indicative of cardiac dysfunction and abnormality |
| JP2018006247A Active JP6571807B2 (en) | 2012-04-23 | 2018-01-18 | Method and instrument for measuring information indicative of cardiac dysfunction and abnormality |
Family Applications After (1)
| Application Number | Title | Priority Date | Filing Date |
|---|---|---|---|
| JP2018006247A Active JP6571807B2 (en) | 2012-04-23 | 2018-01-18 | Method and instrument for measuring information indicative of cardiac dysfunction and abnormality |
Country Status (14)
| Country | Link |
|---|---|
| US (1) | US9585580B2 (en) |
| EP (1) | EP2840955B1 (en) |
| JP (2) | JP6336963B2 (en) |
| KR (1) | KR102147365B1 (en) |
| CN (1) | CN104349711B (en) |
| CA (1) | CA2871015C (en) |
| DK (1) | DK2840955T3 (en) |
| ES (1) | ES2971765T3 (en) |
| FI (1) | FI2840955T3 (en) |
| HU (1) | HUE066182T2 (en) |
| LT (1) | LT2840955T (en) |
| PL (1) | PL2840955T3 (en) |
| PT (1) | PT2840955T (en) |
| WO (1) | WO2013160537A1 (en) |
Cited By (1)
| Publication number | Priority date | Publication date | Assignee | Title |
|---|---|---|---|---|
| JP2021102072A (en) * | 2015-10-07 | 2021-07-15 | プレコルディール オサケユイチア | Method, apparatus, computer program and computer program product for producing information indicative of cardiac condition |
Families Citing this family (16)
| Publication number | Priority date | Publication date | Assignee | Title |
|---|---|---|---|---|
| FI126008B (en) * | 2013-09-13 | 2016-05-31 | Murata Manufacturing Co | Cardiac monitoring system |
| US10856742B2 (en) | 2014-02-06 | 2020-12-08 | Sotera Wireless, Inc. | Body-worn system for continuous, noninvasive measurement of vital signs |
| AU2015337767B2 (en) * | 2014-10-27 | 2019-11-28 | Vital Sines International Inc. | System and method for monitoring aortic pulse wave velocity and blood pressure |
| WO2016201367A1 (en) | 2015-06-11 | 2016-12-15 | Zoll Medical Corporation | Detection of myocardial contractions indicative of perfusion |
| US11504047B2 (en) | 2017-12-28 | 2022-11-22 | Heart Force Medical Inc. | Sensor apparatuses, methods of operating same, and systems including same, and methods and systems for sensing and analyzing electromechanical characteristics of a heart |
| CN111770722B (en) * | 2018-02-27 | 2024-01-02 | 罗伯特·博世有限公司 | Wearable health device system with automatic reference of cardiac vibrography signals |
| JP7180776B2 (en) * | 2018-07-27 | 2022-11-30 | 株式会社村田製作所 | Provision of temporal information of the subject |
| EP3840639A4 (en) * | 2018-08-20 | 2022-04-06 | MacDonald, Dettwiler and Associates Inc. | METHOD AND APPARATUS FOR DRIVING BIOMETRIC INFORMATION USING MULTI-AXIS SEISMOCARDIOGRAPHY |
| FI128489B (en) * | 2018-10-01 | 2020-06-15 | Precordior Oy | An apparatus for producing information indicative of cardiac abnormality |
| FR3099358A1 (en) * | 2019-08-01 | 2021-02-05 | Universite Grenoble Alpes | DEVICE FOR DETERMINING INFORMATION RELATING TO A STATE OF HEART DECOMPENSATION |
| JP7022957B1 (en) | 2020-08-17 | 2022-02-21 | 公立大学法人会津大学 | Atrial fibrillation detection program, atrial fibrillation detection device, atrial fibrillation detection method and atrial fibrillation detection system |
| JP7680533B2 (en) * | 2020-09-30 | 2025-05-20 | ボストン サイエンティフィック サイムド,インコーポレイテッド | Global histogram of local cycle lengths |
| US12201432B2 (en) * | 2020-10-27 | 2025-01-21 | LLA Technologies Inc. | Tri-axial seismocardiography devices and methods |
| WO2023193053A1 (en) * | 2022-04-08 | 2023-10-12 | 3 Aim Ip Pty Ltd | A device and method for the detection and monitoring of cardiovascular disease |
| CN115736945B (en) * | 2022-11-14 | 2026-02-06 | 西安交通大学 | Signal characteristic extraction and data compression method based on electrocardiogram and seismogram combined acquisition |
| CN117281494B (en) * | 2023-11-27 | 2024-03-12 | 安徽通灵仿生科技有限公司 | Method and device for identifying signal characteristic points of arterial blood pressure signals |
Citations (4)
| Publication number | Priority date | Publication date | Assignee | Title |
|---|---|---|---|---|
| JP2004538035A (en) * | 2000-12-01 | 2004-12-24 | メドトロニック・インコーポレーテッド | Method and apparatus for determining mean pulmonary artery pressure |
| US20100210921A1 (en) * | 2008-11-26 | 2010-08-19 | Snu R&Db Foundation | Scale-type nonconstrained health condition evaluating apparatus and method |
| WO2011068687A1 (en) * | 2009-11-18 | 2011-06-09 | Texas Instruments Incorporated | Methods and apparatus for sensing blood flow and hemodynamic parameters |
| EP2433565A1 (en) * | 2010-09-28 | 2012-03-28 | BIOTRONIK SE & Co. KG | Implantable medical device |
Family Cites Families (9)
| Publication number | Priority date | Publication date | Assignee | Title |
|---|---|---|---|---|
| AU1996092A (en) | 1991-05-10 | 1992-12-30 | Seismed Instruments, Inc. | Seismocardiographic analysis system |
| CN1045529C (en) | 1993-12-20 | 1999-10-13 | 林计平 | Cardiac potential comprehensive detecting method and detector thereof |
| FI20021145L (en) | 2002-06-13 | 2003-12-14 | Alpo Vaerri | Equipment for measuring vital signs |
| US6978184B1 (en) * | 2002-07-29 | 2005-12-20 | Marcus Frank I | Optimization method for cardiac resynchronization therapy |
| US7715909B2 (en) | 2005-06-03 | 2010-05-11 | Acceleron Medical Systems, Inc. | SCG point pick process device and method |
| US20070027489A1 (en) * | 2005-07-28 | 2007-02-01 | Jong Gill | Characterization of a patient's condition by evaluating electrical and mechanical properties of the heart |
| US7846104B2 (en) | 2007-02-08 | 2010-12-07 | Heart Force Medical Inc. | Monitoring physiological condition and detecting abnormalities |
| US8167807B2 (en) | 2007-12-20 | 2012-05-01 | Toshiba Medical Systems Corporation | Ultrasonic diagnosis device, ultrasonic image analysis device, and ultrasonic image analysis method |
| WO2012149652A1 (en) | 2011-05-03 | 2012-11-08 | Heart Force Medical Inc. | Method and apparatus for estimating myocardial contractility using precordial vibration signals |
-
2013
- 2013-04-17 CN CN201380021430.5A patent/CN104349711B/en active Active
- 2013-04-17 DK DK13723823.4T patent/DK2840955T3/en active
- 2013-04-17 KR KR1020147032991A patent/KR102147365B1/en active Active
- 2013-04-17 LT LTEPPCT/FI2013/050421T patent/LT2840955T/en unknown
- 2013-04-17 FI FIEP13723823.4T patent/FI2840955T3/en active
- 2013-04-17 WO PCT/FI2013/050421 patent/WO2013160537A1/en not_active Ceased
- 2013-04-17 ES ES13723823T patent/ES2971765T3/en active Active
- 2013-04-17 CA CA2871015A patent/CA2871015C/en active Active
- 2013-04-17 US US14/396,204 patent/US9585580B2/en active Active
- 2013-04-17 PL PL13723823.4T patent/PL2840955T3/en unknown
- 2013-04-17 PT PT137238234T patent/PT2840955T/en unknown
- 2013-04-17 JP JP2015507565A patent/JP6336963B2/en active Active
- 2013-04-17 HU HUE13723823A patent/HUE066182T2/en unknown
- 2013-04-17 EP EP13723823.4A patent/EP2840955B1/en active Active
-
2018
- 2018-01-18 JP JP2018006247A patent/JP6571807B2/en active Active
Patent Citations (4)
| Publication number | Priority date | Publication date | Assignee | Title |
|---|---|---|---|---|
| JP2004538035A (en) * | 2000-12-01 | 2004-12-24 | メドトロニック・インコーポレーテッド | Method and apparatus for determining mean pulmonary artery pressure |
| US20100210921A1 (en) * | 2008-11-26 | 2010-08-19 | Snu R&Db Foundation | Scale-type nonconstrained health condition evaluating apparatus and method |
| WO2011068687A1 (en) * | 2009-11-18 | 2011-06-09 | Texas Instruments Incorporated | Methods and apparatus for sensing blood flow and hemodynamic parameters |
| EP2433565A1 (en) * | 2010-09-28 | 2012-03-28 | BIOTRONIK SE & Co. KG | Implantable medical device |
Non-Patent Citations (1)
| Title |
|---|
| DAVID DA HE ET AL.: "A Continuous, Waerable, and Wireless Heart Monitor using Head Ballistocardiogram(BCG) and Head Elect", CONF PROC IEEE ENG MED BIOL SOC., JPN6016045632, 2011, pages 4729 - 4732, ISSN: 0003448267 * |
Cited By (4)
| Publication number | Priority date | Publication date | Assignee | Title |
|---|---|---|---|---|
| JP2021102072A (en) * | 2015-10-07 | 2021-07-15 | プレコルディール オサケユイチア | Method, apparatus, computer program and computer program product for producing information indicative of cardiac condition |
| JP2021102071A (en) * | 2015-10-07 | 2021-07-15 | プレコルディール オサケユイチア | Method, apparatus, computer program and computer program product for producing information indicative of cardiac condition |
| JP7218389B2 (en) | 2015-10-07 | 2023-02-06 | プレコルディール オサケユイチア | Apparatus for generating information representative of cardiac conditions, method of operating the apparatus, computer program and computer program product |
| JP7218390B2 (en) | 2015-10-07 | 2023-02-06 | プレコルディール オサケユイチア | Apparatus for generating information representative of cardiac conditions, method of operating the apparatus, computer program and computer program product |
Also Published As
| Publication number | Publication date |
|---|---|
| KR102147365B1 (en) | 2020-08-25 |
| EP2840955A1 (en) | 2015-03-04 |
| JP6571807B2 (en) | 2019-09-04 |
| US9585580B2 (en) | 2017-03-07 |
| CN104349711B (en) | 2017-06-09 |
| JP2018086278A (en) | 2018-06-07 |
| EP2840955B1 (en) | 2024-01-24 |
| PT2840955T (en) | 2024-03-05 |
| US20150133806A1 (en) | 2015-05-14 |
| FI2840955T3 (en) | 2024-02-23 |
| HK1204539A1 (en) | 2015-11-27 |
| CA2871015A1 (en) | 2013-10-31 |
| ES2971765T3 (en) | 2024-06-06 |
| CN104349711A (en) | 2015-02-11 |
| PL2840955T3 (en) | 2024-06-24 |
| HUE066182T2 (en) | 2024-07-28 |
| KR20150005659A (en) | 2015-01-14 |
| DK2840955T3 (en) | 2024-03-11 |
| JP6336963B2 (en) | 2018-06-06 |
| CA2871015C (en) | 2022-10-25 |
| WO2013160537A1 (en) | 2013-10-31 |
| LT2840955T (en) | 2024-02-26 |
Similar Documents
| Publication | Publication Date | Title |
|---|---|---|
| JP6571807B2 (en) | Method and instrument for measuring information indicative of cardiac dysfunction and abnormality | |
| JP6131404B2 (en) | Method and instrument for measuring information indicative of cardiac dysfunction and abnormality | |
| JP6441914B2 (en) | Method and apparatus for determining information representative of a cardiac disorder | |
| JP6898246B2 (en) | Methods and devices for generating information indicating heart failure | |
| HK1204539B (en) | Method and apparatus for determining information indicative of cardiac malfunctions and abnormalities | |
| HK1219637B (en) | Method and apparatus for determining information indicative of cardiac malfunctions | |
| HK1204538B (en) | Apparatus for determining information indicative of cardiac malfunctions and abnormalities |
Legal Events
| Date | Code | Title | Description |
|---|---|---|---|
| A621 | Written request for application examination |
Free format text: JAPANESE INTERMEDIATE CODE: A621 Effective date: 20160127 |
|
| A977 | Report on retrieval |
Free format text: JAPANESE INTERMEDIATE CODE: A971007 Effective date: 20161125 |
|
| A131 | Notification of reasons for refusal |
Free format text: JAPANESE INTERMEDIATE CODE: A131 Effective date: 20161129 |
|
| A601 | Written request for extension of time |
Free format text: JAPANESE INTERMEDIATE CODE: A601 Effective date: 20170228 |
|
| A711 | Notification of change in applicant |
Free format text: JAPANESE INTERMEDIATE CODE: A711 Effective date: 20170314 |
|
| A521 | Request for written amendment filed |
Free format text: JAPANESE INTERMEDIATE CODE: A523 Effective date: 20170426 |
|
| A02 | Decision of refusal |
Free format text: JAPANESE INTERMEDIATE CODE: A02 Effective date: 20170919 |
|
| A521 | Request for written amendment filed |
Free format text: JAPANESE INTERMEDIATE CODE: A523 Effective date: 20180118 |
|
| A911 | Transfer to examiner for re-examination before appeal (zenchi) |
Free format text: JAPANESE INTERMEDIATE CODE: A911 Effective date: 20180126 |
|
| TRDD | Decision of grant or rejection written | ||
| A01 | Written decision to grant a patent or to grant a registration (utility model) |
Free format text: JAPANESE INTERMEDIATE CODE: A01 Effective date: 20180403 |
|
| A61 | First payment of annual fees (during grant procedure) |
Free format text: JAPANESE INTERMEDIATE CODE: A61 Effective date: 20180507 |
|
| R150 | Certificate of patent or registration of utility model |
Ref document number: 6336963 Country of ref document: JP Free format text: JAPANESE INTERMEDIATE CODE: R150 |
|
| R250 | Receipt of annual fees |
Free format text: JAPANESE INTERMEDIATE CODE: R250 |
|
| R250 | Receipt of annual fees |
Free format text: JAPANESE INTERMEDIATE CODE: R250 |
|
| R250 | Receipt of annual fees |
Free format text: JAPANESE INTERMEDIATE CODE: R250 |
|
| R250 | Receipt of annual fees |
Free format text: JAPANESE INTERMEDIATE CODE: R250 |
|
| R250 | Receipt of annual fees |
Free format text: JAPANESE INTERMEDIATE CODE: R250 |