JP2012505381A - Method for detecting an analyte in a sample microarray and apparatus for carrying out such a method - Google Patents
Method for detecting an analyte in a sample microarray and apparatus for carrying out such a method Download PDFInfo
- Publication number
- JP2012505381A JP2012505381A JP2011530351A JP2011530351A JP2012505381A JP 2012505381 A JP2012505381 A JP 2012505381A JP 2011530351 A JP2011530351 A JP 2011530351A JP 2011530351 A JP2011530351 A JP 2011530351A JP 2012505381 A JP2012505381 A JP 2012505381A
- Authority
- JP
- Japan
- Prior art keywords
- target analyte
- sample
- monochromatic light
- detection method
- numerical
- Prior art date
- Legal status (The legal status is an assumption and is not a legal conclusion. Google has not performed a legal analysis and makes no representation as to the accuracy of the status listed.)
- Pending
Links
- 239000012491 analyte Substances 0.000 title claims abstract description 60
- 238000000034 method Methods 0.000 title claims abstract description 20
- 238000002493 microarray Methods 0.000 title description 30
- 239000000523 sample Substances 0.000 claims description 121
- 238000001514 detection method Methods 0.000 claims description 26
- 239000002245 particle Substances 0.000 claims description 21
- 239000013642 negative control Substances 0.000 claims description 17
- 239000013641 positive control Substances 0.000 claims description 17
- 239000002105 nanoparticle Substances 0.000 claims description 12
- 239000000126 substance Substances 0.000 claims description 11
- 239000010931 gold Substances 0.000 claims description 7
- 229910052737 gold Inorganic materials 0.000 claims description 7
- BQCADISMDOOEFD-UHFFFAOYSA-N Silver Chemical compound [Ag] BQCADISMDOOEFD-UHFFFAOYSA-N 0.000 claims description 6
- 230000002708 enhancing effect Effects 0.000 claims description 6
- PCHJSUWPFVWCPO-UHFFFAOYSA-N gold Chemical compound [Au] PCHJSUWPFVWCPO-UHFFFAOYSA-N 0.000 claims description 6
- 239000012472 biological sample Substances 0.000 claims description 5
- 238000004458 analytical method Methods 0.000 claims description 4
- 230000001678 irradiating effect Effects 0.000 claims description 3
- 239000002923 metal particle Substances 0.000 claims description 2
- 238000002474 experimental method Methods 0.000 description 20
- 241000700721 Hepatitis B virus Species 0.000 description 13
- 238000006243 chemical reaction Methods 0.000 description 6
- 230000035484 reaction time Effects 0.000 description 5
- 238000010521 absorption reaction Methods 0.000 description 3
- 238000001209 resonance light scattering Methods 0.000 description 3
- 229910052709 silver Inorganic materials 0.000 description 3
- 239000004332 silver Substances 0.000 description 3
- 238000007796 conventional method Methods 0.000 description 2
- 208000002672 hepatitis B Diseases 0.000 description 2
- 108020004707 nucleic acids Proteins 0.000 description 2
- 150000007523 nucleic acids Chemical class 0.000 description 2
- 102000039446 nucleic acids Human genes 0.000 description 2
- 108090000765 processed proteins & peptides Proteins 0.000 description 2
- 108091034117 Oligonucleotide Proteins 0.000 description 1
- JLCPHMBAVCMARE-UHFFFAOYSA-N [3-[[3-[[3-[[3-[[3-[[3-[[3-[[3-[[3-[[3-[[3-[[5-(2-amino-6-oxo-1H-purin-9-yl)-3-[[3-[[3-[[3-[[3-[[3-[[5-(2-amino-6-oxo-1H-purin-9-yl)-3-[[5-(2-amino-6-oxo-1H-purin-9-yl)-3-hydroxyoxolan-2-yl]methoxy-hydroxyphosphoryl]oxyoxolan-2-yl]methoxy-hydroxyphosphoryl]oxy-5-(5-methyl-2,4-dioxopyrimidin-1-yl)oxolan-2-yl]methoxy-hydroxyphosphoryl]oxy-5-(6-aminopurin-9-yl)oxolan-2-yl]methoxy-hydroxyphosphoryl]oxy-5-(6-aminopurin-9-yl)oxolan-2-yl]methoxy-hydroxyphosphoryl]oxy-5-(6-aminopurin-9-yl)oxolan-2-yl]methoxy-hydroxyphosphoryl]oxy-5-(6-aminopurin-9-yl)oxolan-2-yl]methoxy-hydroxyphosphoryl]oxyoxolan-2-yl]methoxy-hydroxyphosphoryl]oxy-5-(5-methyl-2,4-dioxopyrimidin-1-yl)oxolan-2-yl]methoxy-hydroxyphosphoryl]oxy-5-(4-amino-2-oxopyrimidin-1-yl)oxolan-2-yl]methoxy-hydroxyphosphoryl]oxy-5-(5-methyl-2,4-dioxopyrimidin-1-yl)oxolan-2-yl]methoxy-hydroxyphosphoryl]oxy-5-(5-methyl-2,4-dioxopyrimidin-1-yl)oxolan-2-yl]methoxy-hydroxyphosphoryl]oxy-5-(6-aminopurin-9-yl)oxolan-2-yl]methoxy-hydroxyphosphoryl]oxy-5-(6-aminopurin-9-yl)oxolan-2-yl]methoxy-hydroxyphosphoryl]oxy-5-(4-amino-2-oxopyrimidin-1-yl)oxolan-2-yl]methoxy-hydroxyphosphoryl]oxy-5-(4-amino-2-oxopyrimidin-1-yl)oxolan-2-yl]methoxy-hydroxyphosphoryl]oxy-5-(4-amino-2-oxopyrimidin-1-yl)oxolan-2-yl]methoxy-hydroxyphosphoryl]oxy-5-(6-aminopurin-9-yl)oxolan-2-yl]methoxy-hydroxyphosphoryl]oxy-5-(4-amino-2-oxopyrimidin-1-yl)oxolan-2-yl]methyl [5-(6-aminopurin-9-yl)-2-(hydroxymethyl)oxolan-3-yl] hydrogen phosphate Polymers Cc1cn(C2CC(OP(O)(=O)OCC3OC(CC3OP(O)(=O)OCC3OC(CC3O)n3cnc4c3nc(N)[nH]c4=O)n3cnc4c3nc(N)[nH]c4=O)C(COP(O)(=O)OC3CC(OC3COP(O)(=O)OC3CC(OC3COP(O)(=O)OC3CC(OC3COP(O)(=O)OC3CC(OC3COP(O)(=O)OC3CC(OC3COP(O)(=O)OC3CC(OC3COP(O)(=O)OC3CC(OC3COP(O)(=O)OC3CC(OC3COP(O)(=O)OC3CC(OC3COP(O)(=O)OC3CC(OC3COP(O)(=O)OC3CC(OC3COP(O)(=O)OC3CC(OC3COP(O)(=O)OC3CC(OC3COP(O)(=O)OC3CC(OC3COP(O)(=O)OC3CC(OC3COP(O)(=O)OC3CC(OC3COP(O)(=O)OC3CC(OC3CO)n3cnc4c(N)ncnc34)n3ccc(N)nc3=O)n3cnc4c(N)ncnc34)n3ccc(N)nc3=O)n3ccc(N)nc3=O)n3ccc(N)nc3=O)n3cnc4c(N)ncnc34)n3cnc4c(N)ncnc34)n3cc(C)c(=O)[nH]c3=O)n3cc(C)c(=O)[nH]c3=O)n3ccc(N)nc3=O)n3cc(C)c(=O)[nH]c3=O)n3cnc4c3nc(N)[nH]c4=O)n3cnc4c(N)ncnc34)n3cnc4c(N)ncnc34)n3cnc4c(N)ncnc34)n3cnc4c(N)ncnc34)O2)c(=O)[nH]c1=O JLCPHMBAVCMARE-UHFFFAOYSA-N 0.000 description 1
- 230000009286 beneficial effect Effects 0.000 description 1
- 230000001413 cellular effect Effects 0.000 description 1
- 239000003795 chemical substances by application Substances 0.000 description 1
- 239000003086 colorant Substances 0.000 description 1
- 238000010586 diagram Methods 0.000 description 1
- 238000009792 diffusion process Methods 0.000 description 1
- 239000003623 enhancer Substances 0.000 description 1
- 239000007850 fluorescent dye Substances 0.000 description 1
- 238000001215 fluorescent labelling Methods 0.000 description 1
- 239000012634 fragment Substances 0.000 description 1
- 230000003287 optical effect Effects 0.000 description 1
- 230000005855 radiation Effects 0.000 description 1
- 239000013589 supplement Substances 0.000 description 1
Images


Classifications
-
- G—PHYSICS
- G01—MEASURING; TESTING
- G01N—INVESTIGATING OR ANALYSING MATERIALS BY DETERMINING THEIR CHEMICAL OR PHYSICAL PROPERTIES
- G01N21/00—Investigating or analysing materials by the use of optical means, i.e. using sub-millimetre waves, infrared, visible or ultraviolet light
-
- G—PHYSICS
- G01—MEASURING; TESTING
- G01N—INVESTIGATING OR ANALYSING MATERIALS BY DETERMINING THEIR CHEMICAL OR PHYSICAL PROPERTIES
- G01N21/00—Investigating or analysing materials by the use of optical means, i.e. using sub-millimetre waves, infrared, visible or ultraviolet light
- G01N21/17—Systems in which incident light is modified in accordance with the properties of the material investigated
- G01N21/25—Colour; Spectral properties, i.e. comparison of effect of material on the light at two or more different wavelengths or wavelength bands
- G01N21/251—Colorimeters; Construction thereof
- G01N21/253—Colorimeters; Construction thereof for batch operation, i.e. multisample apparatus
-
- G—PHYSICS
- G01—MEASURING; TESTING
- G01N—INVESTIGATING OR ANALYSING MATERIALS BY DETERMINING THEIR CHEMICAL OR PHYSICAL PROPERTIES
- G01N33/00—Investigating or analysing materials by specific methods not covered by groups G01N1/00 - G01N31/00
- G01N33/48—Biological material, e.g. blood, urine; Haemocytometers
- G01N33/50—Chemical analysis of biological material, e.g. blood, urine; Testing involving biospecific ligand binding methods; Immunological testing
- G01N33/52—Use of compounds or compositions for colorimetric, spectrophotometric or fluorometric investigation, e.g. use of reagent paper and including single- and multilayer analytical elements
-
- G—PHYSICS
- G01—MEASURING; TESTING
- G01N—INVESTIGATING OR ANALYSING MATERIALS BY DETERMINING THEIR CHEMICAL OR PHYSICAL PROPERTIES
- G01N21/00—Investigating or analysing materials by the use of optical means, i.e. using sub-millimetre waves, infrared, visible or ultraviolet light
- G01N21/17—Systems in which incident light is modified in accordance with the properties of the material investigated
- G01N21/25—Colour; Spectral properties, i.e. comparison of effect of material on the light at two or more different wavelengths or wavelength bands
- G01N21/31—Investigating relative effect of material at wavelengths characteristic of specific elements or molecules, e.g. atomic absorption spectrometry
-
- G—PHYSICS
- G01—MEASURING; TESTING
- G01N—INVESTIGATING OR ANALYSING MATERIALS BY DETERMINING THEIR CHEMICAL OR PHYSICAL PROPERTIES
- G01N21/00—Investigating or analysing materials by the use of optical means, i.e. using sub-millimetre waves, infrared, visible or ultraviolet light
- G01N21/17—Systems in which incident light is modified in accordance with the properties of the material investigated
- G01N21/47—Scattering, i.e. diffuse reflection
-
- G—PHYSICS
- G01—MEASURING; TESTING
- G01N—INVESTIGATING OR ANALYSING MATERIALS BY DETERMINING THEIR CHEMICAL OR PHYSICAL PROPERTIES
- G01N21/00—Investigating or analysing materials by the use of optical means, i.e. using sub-millimetre waves, infrared, visible or ultraviolet light
- G01N21/17—Systems in which incident light is modified in accordance with the properties of the material investigated
- G01N21/55—Specular reflectivity
- G01N21/552—Attenuated total reflection
- G01N21/553—Attenuated total reflection and using surface plasmons
- G01N21/554—Attenuated total reflection and using surface plasmons detecting the surface plasmon resonance of nanostructured metals, e.g. localised surface plasmon resonance
-
- G—PHYSICS
- G01—MEASURING; TESTING
- G01N—INVESTIGATING OR ANALYSING MATERIALS BY DETERMINING THEIR CHEMICAL OR PHYSICAL PROPERTIES
- G01N27/00—Investigating or analysing materials by the use of electric, electrochemical, or magnetic means
- G01N27/26—Investigating or analysing materials by the use of electric, electrochemical, or magnetic means by investigating electrochemical variables; by using electrolysis or electrophoresis
-
- G—PHYSICS
- G01—MEASURING; TESTING
- G01N—INVESTIGATING OR ANALYSING MATERIALS BY DETERMINING THEIR CHEMICAL OR PHYSICAL PROPERTIES
- G01N27/00—Investigating or analysing materials by the use of electric, electrochemical, or magnetic means
- G01N27/72—Investigating or analysing materials by the use of electric, electrochemical, or magnetic means by investigating magnetic variables
-
- G—PHYSICS
- G01—MEASURING; TESTING
- G01N—INVESTIGATING OR ANALYSING MATERIALS BY DETERMINING THEIR CHEMICAL OR PHYSICAL PROPERTIES
- G01N33/00—Investigating or analysing materials by specific methods not covered by groups G01N1/00 - G01N31/00
- G01N33/48—Biological material, e.g. blood, urine; Haemocytometers
- G01N33/50—Chemical analysis of biological material, e.g. blood, urine; Testing involving biospecific ligand binding methods; Immunological testing
- G01N33/58—Chemical analysis of biological material, e.g. blood, urine; Testing involving biospecific ligand binding methods; Immunological testing involving labelled substances
- G01N33/585—Chemical analysis of biological material, e.g. blood, urine; Testing involving biospecific ligand binding methods; Immunological testing involving labelled substances with a particulate label, e.g. coloured latex
- G01N33/587—Nanoparticles
-
- G—PHYSICS
- G01—MEASURING; TESTING
- G01N—INVESTIGATING OR ANALYSING MATERIALS BY DETERMINING THEIR CHEMICAL OR PHYSICAL PROPERTIES
- G01N21/00—Investigating or analysing materials by the use of optical means, i.e. using sub-millimetre waves, infrared, visible or ultraviolet light
- G01N21/17—Systems in which incident light is modified in accordance with the properties of the material investigated
- G01N21/25—Colour; Spectral properties, i.e. comparison of effect of material on the light at two or more different wavelengths or wavelength bands
- G01N2021/258—Surface plasmon spectroscopy, e.g. micro- or nanoparticles in suspension
-
- G—PHYSICS
- G01—MEASURING; TESTING
- G01N—INVESTIGATING OR ANALYSING MATERIALS BY DETERMINING THEIR CHEMICAL OR PHYSICAL PROPERTIES
- G01N21/00—Investigating or analysing materials by the use of optical means, i.e. using sub-millimetre waves, infrared, visible or ultraviolet light
- G01N21/17—Systems in which incident light is modified in accordance with the properties of the material investigated
- G01N21/25—Colour; Spectral properties, i.e. comparison of effect of material on the light at two or more different wavelengths or wavelength bands
- G01N21/31—Investigating relative effect of material at wavelengths characteristic of specific elements or molecules, e.g. atomic absorption spectrometry
- G01N2021/3185—Investigating relative effect of material at wavelengths characteristic of specific elements or molecules, e.g. atomic absorption spectrometry typically monochromatic or band-limited
-
- G—PHYSICS
- G01—MEASURING; TESTING
- G01N—INVESTIGATING OR ANALYSING MATERIALS BY DETERMINING THEIR CHEMICAL OR PHYSICAL PROPERTIES
- G01N2201/00—Features of devices classified in G01N21/00
- G01N2201/06—Illumination; Optics
- G01N2201/061—Sources
- G01N2201/06146—Multisources for homogeneisation, as well sequential as simultaneous operation
Landscapes
- Health & Medical Sciences (AREA)
- Life Sciences & Earth Sciences (AREA)
- Chemical & Material Sciences (AREA)
- Immunology (AREA)
- Engineering & Computer Science (AREA)
- Physics & Mathematics (AREA)
- Pathology (AREA)
- General Physics & Mathematics (AREA)
- General Health & Medical Sciences (AREA)
- Biochemistry (AREA)
- Analytical Chemistry (AREA)
- Hematology (AREA)
- Molecular Biology (AREA)
- Urology & Nephrology (AREA)
- Biomedical Technology (AREA)
- Medicinal Chemistry (AREA)
- Food Science & Technology (AREA)
- Microbiology (AREA)
- Cell Biology (AREA)
- Biotechnology (AREA)
- Nanotechnology (AREA)
- Spectroscopy & Molecular Physics (AREA)
- Chemical Kinetics & Catalysis (AREA)
- Electrochemistry (AREA)
- Investigating Or Analysing Materials By Optical Means (AREA)
- Investigating Or Analysing Materials By The Use Of Chemical Reactions (AREA)
Abstract
本発明は電磁波又は単色光を使用しあるサンプルのターゲット検体検出方法であって少なくとも1つの電磁波又は単色光をターゲット検体を潜在的に含む多数のサンプルを含むサンプルグループに照射し電磁波若しくは各電磁波又は単色光もしくは各単色光により照射された時サンプルグループから反射等される電磁波強度が検出されサンプルグループから反射、吸収、放出された電磁波又は単色光強度に関係する1つ又は複数の数値グループがサンプルグループから反射等された各電磁波又は単色光と関係する1つ又は複数の数値グループ又は複数の数値グループの1つと一緒に記録され電磁波若しくは各電磁波又は単色光もしくは各単色光に関係する前記1つ又は複数の数値グループと比較し大きいシグナルを持つ複数の数値グループの1つを選択しステップ(v)から選択された数値グループに基づきターゲット検体の存在欠如を決定することを含む。The present invention is a method for detecting a target analyte of a sample using electromagnetic waves or monochromatic light, and irradiates at least one electromagnetic wave or monochromatic light on a sample group including a number of samples potentially containing the target analyte, One or a plurality of numerical values related to the electromagnetic wave reflected or absorbed or emitted from the sample group or the intensity of the monochromatic light are detected by detecting the electromagnetic wave intensity reflected from the sample group when irradiated with monochromatic light or each monochromatic light. The one or more numerical groups related to each electromagnetic wave or monochromatic light reflected from the group or the like, and the one related to the electromagnetic wave or each electromagnetic wave or monochromatic light or each monochromatic light recorded together with one of the plural numerical groups Or multiple numerical groups with large signals compared to multiple numerical groups One select based on numeric group selected from step (v) comprises determining the presence absence of the target analyte.
Description
本発明はB型肝炎ウイルス(HBV)等の生体学的検体を検出するためのマイクロアレイにおける検体検出方法に関する。 The present invention relates to a specimen detection method in a microarray for detecting a biological specimen such as hepatitis B virus (HBV).
サンプルの生物学的分析方法を提供する多くの技術がある。例えば、特許文献1,2,3,4にはオリゴヌクレオチドが拡散へ混成されたとき色が変化するのを観察することにより核酸を検出する方法が開示されている。非特許文献1には検体検出のための標識として共鳴光散乱(RLS)粒子を使用することが開示されている。非特許文献2にはサンプルのターゲット検体の有無を目視で検出できる蛍光標識技術が開示されている。
There are a number of techniques that provide biological analysis methods for samples. For example,
従来の多種にわたるサンプルの生物学的分析方法の利便性にもかかわらず光学的な手段による生物学的検体の検出はあまり満足を得られるものではなかった。 Despite the convenience of conventional biological analysis methods for a wide variety of samples, detection of biological analytes by optical means has not been very satisfactory.
本発明の目的は、この課題を解決する改良方法、少なくとも従来と取って代わる方法を世の中に提供しようとするものである。 It is an object of the present invention to provide the world with an improved method for solving this problem, at least a method for replacing the conventional method.
本発明の第1の態様によれば、電磁波又は単色光の使用によりサンプルにおけるターゲット検体検出方法が次のステップを含む。(a)少なくとも1つの電磁波又は単色光をターゲット検体を潜在的に含む多数のサンプルを含むサンプルグループに照射し、(b)電磁波若しくは各電磁波又は単色光もしくは各単色光により照射された時サンプルグループから反射、吸収又は放出される電磁波強度が検出され、(c)サンプルグループから反射、吸収、放出された1つ又は複数の電磁波又は1つ又は複数の単色光の各々に関係する数値グループ又は各数値グループがサンプルグループから反射、吸収又は放出される光強度に関係する1つ又は複数の数値グループと一緒に記録され、(d)電磁波若しくは各電磁波又は単色光もしくは各単色光に関係する1つ又は複数の数値グループと比較し、(e)より大きなシグナルを有する1つ又は複数の数値グループ又は複数の数値グループの1つを選択し、そして、(f)ステップ(d)から選択された数値グループに基づきターゲット検体の存在又は欠如を決定する。 According to the first aspect of the present invention, the method for detecting a target analyte in a sample by using electromagnetic waves or monochromatic light includes the following steps. (A) irradiating at least one electromagnetic wave or monochromatic light to a sample group including a large number of samples potentially containing a target analyte, and (b) a sample group when irradiated with an electromagnetic wave or electromagnetic waves or monochromatic light or monochromatic lights Electromagnetic wave intensity reflected, absorbed or emitted from the light source is detected, and (c) one or more electromagnetic waves reflected, absorbed or emitted from the sample group, or a numerical group or each relating to each of the one or more monochromatic lights A numerical group is recorded together with one or more numerical groups related to the light intensity reflected, absorbed or emitted from the sample group, and (d) one related to electromagnetic waves or electromagnetic waves or monochromatic light or monochromatic lights. Or (e) one or more numerical groups or a plurality of numbers having a greater signal compared to a plurality of numerical groups Select one of the groups, and to determine the presence or absence of the target analyte based on the numeric group selected from (f) step (d).
このターゲット分析検出方法によれば、ターゲット検体が電磁波又は単色光により照射時に検出可能なシグナルを生成することができる。 According to this target analysis detection method, a signal that can be detected when the target specimen is irradiated with electromagnetic waves or monochromatic light can be generated.
サンプルは標識を含むシグナル増強物質により前処理される。これにより、反射、吸収又は放出された電磁波強度を増幅することができる。また、1つ又は複数の数値グループの比較によりターゲット検体の存在又は欠如を最適に示す数値グループが利用される。 The sample is pretreated with a signal enhancing substance containing a label. Thereby, the electromagnetic wave intensity reflected, absorbed or emitted can be amplified. In addition, a numerical group that optimally indicates the presence or absence of the target analyte by comparing one or more numerical groups is used.
ある実施態様において、上述したステップ(a)において、サンプルグループは少なくとも2つの電磁波又は単色光で連続的に照射される。 In one embodiment, in step (a) described above, the sample group is irradiated continuously with at least two electromagnetic waves or monochromatic light.
好ましくは、シグナル増強物質はナノサイズ粒子である。さらに詳細には、ナノサイズ粒子は金属粒子、ナノ金粒子又はナノ銀粒子である。ナノサイズ粒子は分子結合によりターゲット検体と結合する。 Preferably, the signal enhancing substance is a nano-sized particle. More specifically, the nano-sized particles are metal particles, nano gold particles or nano silver particles. Nano-sized particles bind to the target analyte by molecular bonding.
その方法はDNA又はペプチド分子などの生物学的サンプルに存在するターゲット検体を検出する際に利用される。 The method is utilized in detecting a target analyte present in a biological sample such as a DNA or peptide molecule.
好ましくは、単色光の波長は380nmから750nmである。 Preferably, the wavelength of monochromatic light is 380 nm to 750 nm.
ある実施態様においては、複数の単色光の1つが青単色光、又は、1つ又は複数の電磁波もしくは複数の電磁波の1つ又は1つ又は複数の単色光もしくは複数の単色光の1つは10nmから1000nmの範囲の波長を有する。他の実施態様において、単色光は青紫、青、緑、黄、橙又は赤である。さらに、他の実施態様においては、単色光は紫外線や赤外線、すなわち、10nmから380nm(紫外線)、380nmから450nm(紫)、450nmから495nm(青)、495nmから570nm(緑)、570nmから590nm(黄)、590nmから620nm(橙)620nmから750nm(赤)750nmから1000nm(赤外線)の波長を有する。選択された単色光はこれら2つの範囲をまたぐ波長を有する。 In some embodiments, one of the plurality of monochromatic lights is blue monochromatic light, or one or more of the one or more electromagnetic waves or electromagnetic waves or one or more of the monochromatic lights or one of the plurality of monochromatic lights is 10 nm. To a wavelength in the range of 1000 nm. In other embodiments, the monochromatic light is bluish violet, blue, green, yellow, orange or red. Furthermore, in other embodiments, the monochromatic light is ultraviolet or infrared, ie, 10 nm to 380 nm (ultraviolet), 380 nm to 450 nm (purple), 450 nm to 495 nm (blue), 495 nm to 570 nm (green), 570 nm to 590 nm ( Yellow), 590 nm to 620 nm (orange), 620 nm to 750 nm (red), 750 nm to 1000 nm (infrared). The selected monochromatic light has a wavelength that spans these two ranges.
ある実施態様においては、ターゲット検体の存在又は欠如を決定する前に複数の数値グループが相互に比較される。しかしながら、複数の数値グループはもし複数の数値グループの1つ又は1以上が基準値と比較して高い場合はターゲット検体が存在(又は、基準値と比較して低い場合はターゲット検体は欠如)するという決定へと導くという手法における規定基準値と比較される。別の実施態様においては、複数の数値グループはポシティブコントロールとして使用するサンプルグループへの照射から得られた数値グループと比較する。もし、1つの数値グループ又は複数の数値グループがポシティブコントロールからの数値グループに相当するならばターゲット検体の存在の決定へと導く。又は、1つの数値グループや複数の数値グループがネガティブコントロールからの数値グループに相当するならばターゲット検体の欠如の決定へと導く。 In some embodiments, multiple numerical groups are compared to each other prior to determining the presence or absence of a target analyte. However, a plurality of numerical groups have a target analyte if one or more of the numerical groups is higher than the reference value (or a target analyte is absent if lower than the reference value). It is compared with the prescribed standard value in the method of leading to the determination. In another embodiment, the plurality of numerical groups are compared to a numerical group obtained from exposure to a sample group used as a positive control. If one numerical group or multiple numerical groups correspond to the numerical group from the positive control, it leads to the determination of the presence of the target analyte. Alternatively, if one numerical group or a plurality of numerical groups correspond to the numerical group from the negative control, it leads to the determination of the absence of the target specimen.
本発明の第2の態様によれば、サンプルマイクロアレイにおける標識検出を含むナノサイズ金および/又はナノサイズ銀を検出するための方法を提供する。この標識はサンプルにおけるターゲット検体の存在又は欠如を示すものである。この方法は、以下の構成を含む。(a)少なくとも10nmから10000nmの波長を有する2つの異なった電磁波又は単色光で少なくとも2つのサンプルグループを連続的に照射する。このサンプルグループはターゲット検体を潜在的に含んでいる少なくとも1つのサンプルを含む第1のサンプルグループとポシティブコントロール又はネガティブコントロールとして利用する第2のサンプルグループを含む。(b)電磁波又は単色光による照射時に各サンプルグループから反射、吸収、放出された光強度を検出する。(c)サンプルグループから反射、吸収、放出された各々の光強度と関係する複数の数値グループが各サンプルグループに対する各単色光に関係する各数値グループと一緒に記録され、(d)電磁波又は単色光に関係する複数の数値グループと比較し、(e)ステップ(d)における比較に基づきターゲット検体の存在又は欠如を決定する。単色光は少なくとも10nmから1000nmの範囲の波長を有する電磁波又は反射光を含む。比較することによりターゲット検体の存在又は欠如を最適に示す数値グループが使用される。 According to a second aspect of the present invention, a method for detecting nanosized gold and / or nanosized silver comprising label detection in a sample microarray is provided. This label indicates the presence or absence of the target analyte in the sample. This method includes the following configurations. (A) sequentially illuminating at least two sample groups with two different electromagnetic or monochromatic lights having a wavelength of at least 10 nm to 10,000 nm; This sample group includes a first sample group containing at least one sample potentially containing the target analyte and a second sample group utilized as a positive or negative control. (B) The intensity of light reflected, absorbed, and emitted from each sample group upon irradiation with electromagnetic waves or monochromatic light is detected. (C) A plurality of numerical groups related to each light intensity reflected, absorbed and emitted from the sample group are recorded together with each numerical group related to each monochromatic light for each sample group, and (d) an electromagnetic wave or a single color Compare with multiple numerical groups related to light and (e) determine the presence or absence of the target analyte based on the comparison in step (d). Monochromatic light includes electromagnetic waves or reflected light having a wavelength in the range of at least 10 nm to 1000 nm. A numerical group is used that optimally indicates the presence or absence of the target analyte by comparison.
ある実施態様においては、少なくとも2つのサンプルグループが単色光の1つに同時に照射される。 In some embodiments, at least two sample groups are simultaneously irradiated with one of the monochromatic lights.
好ましくは、サンプルグループはターゲット検体を潜在的に含む少なくとも1つのサンプルを含む第1のサンプルグループとポシティブコントロールとして利用する第2のサンプルグループとネガティブコントロールとして第3のサンプルグループを含む。2つの比較によりターゲット検体の存在又は欠如の決定の確率が高くなる。 Preferably, the sample group includes a first sample group containing at least one sample potentially containing the target analyte, a second sample group utilized as a positive control, and a third sample group as a negative control. The two comparisons increase the probability of determining the presence or absence of the target analyte.
より詳細な実施態様において、より適切な画像取り込み手段が利用できるかもしれないけれど、サンプルグループからの反射、吸収、放出された光はCDCカメラにより検出される。 In a more detailed embodiment, reflected, absorbed, emitted light from the sample group is detected by a CDC camera, although more appropriate image capture means may be available.
ある実施態様においては、ステップ(c)の後、各サンプルグループにおけるサンプルの光強度の平均値をとり、そして、各単色光と関係する少なくとも2つの平均値を算出するステップを提供する。この2つとは、検体を潜在的に含むサンプルと関係する1つの平均値とポシティブコントロール又はネガティブコントロールとして利用するサンプルグループに関係する1つ又は複数の他の平均値又は他の複数の平均値の1つである。平均値を使用すると比較目的のためより代表的な数字を提供することで利点があり、また、比較がより便利になる。より詳細には、検体を潜在的に含むサンプルグループとポシティブコントロール又はネガティブコントロールとして利用するサンプルグループに関係する平均値の絶対値差をとるステップを提供する。従って、各単色光に関係する少なくとも2つの差を生成する。少なくとも2つの差を生成した後、その差を既定差と比較するステップを提供する。 In one embodiment, after step (c), the step of taking an average value of the light intensity of the samples in each sample group and calculating at least two average values associated with each monochromatic light is provided. The two are: one average associated with a sample potentially containing an analyte and one or more other averages or other averages associated with a sample group used as a positive or negative control. One. Using an average value has the advantage of providing a more representative number for comparison purposes, and makes comparison more convenient. More specifically, a step is provided for taking an absolute difference between an average value relating to a sample group potentially containing an analyte and a sample group used as a positive or negative control. Therefore, at least two differences related to each monochromatic light are generated. After generating at least two differences, a step of comparing the difference with a predetermined difference is provided.
他の実施態様においては、絶対値における少なくとも2つの差を生成するステップを提供する。1つは検体を潜在的に含むサンプルグループとポシティブコントロールとして利用するサンプルグループに関係する平均値の比較に関係する。そして1つ又は複数の他の平均値又は他の複数の平均値の1つは検体を潜在的に含むサンプルグループとネガティブコントロールとして利用するサンプルグループに関係する複数の平均値の比較と関係する。このステップによると、絶対値において少なくとも4つの差を生成するステップを提供する。そのうち2つは単色光の1つでサンプルグループへの照射に関係する数値グループに関係し他の2つは他の単色光のうちの1つでサンプルグループへの照射と関係する数値と関係する。それからサンプルにおけるターゲット検体の存在又は欠如の決定時に利用すべき2つ又は少なくとも4つの差のうち少なくとも2つを決定するステップを提供する。 In another embodiment, providing at least two differences in absolute values is provided. One relates to the comparison of mean values relating to sample groups potentially containing analytes and sample groups used as positive controls. And one or more other average values or one of the other plurality of average values is related to a comparison of a plurality of average values related to a sample group potentially containing an analyte and a sample group used as a negative control. This step provides for generating at least four differences in absolute values. Two of them are related to the numerical group related to the irradiation of the sample group with one of the monochromatic lights, and the other two are related to the numerical values related to the irradiation of the sample group with one of the other monochromatic lights. . A step is then provided for determining at least two of the two or at least four differences to be utilized in determining the presence or absence of the target analyte in the sample.
本発明の第3の態様によれば、サンプルのマイクロアレイのナノサイズ金および/又は銀サイズ含有検出標識を検出するための方法を提供する。ここでの標識はサンプルにおけるサンプルのターゲット検体の存在又は欠如を示すものである。この方法は次のステップを含む。(a)少なくとも2つの異なった周波数を有する既定の単色光で少なくとも2つのサンプルグループを連続照射する。このサンプルグループはターゲット検体を潜在的に含んでいる少なくとも1つのサンプルを含んだ第1のサンプルグループとポシティブコントロール又はネガティブコントロールとして利用する第2のサンプルグループを含んでいる。(b)電磁波又は単色光による照射時に各々のサンプルグループから反射、吸収、放出された光強度を検出する。(c)サンプルグループから反射、吸収、放出された各々の光強度と関係する複数の数値グループが各サンプルグループに対する各単色光に関係する各数値グループと一緒に記録され、(d)前記サンプルグループ前記各単色光に関係する複数の数値グループと比較し、(e)ステップ(d)の後、差データを算出し、(f)その中で最も高い値を有する差データを選択し、そして、(g)ステップ(e)から最も高い値を持つ差データに基づきターゲット検体の存在又は欠如を決定する。 According to a third aspect of the invention, a method is provided for detecting a nanosized gold and / or silver size containing detection label of a sample microarray. The label here indicates the presence or absence of the target analyte of the sample in the sample. The method includes the following steps. (A) Continuously illuminate at least two sample groups with a predetermined monochromatic light having at least two different frequencies. This sample group includes a first sample group containing at least one sample potentially containing the target analyte and a second sample group used as a positive or negative control. (B) The intensity of light reflected, absorbed and emitted from each sample group upon irradiation with electromagnetic waves or monochromatic light is detected. (C) a plurality of numerical groups relating to each light intensity reflected, absorbed and emitted from the sample group are recorded together with each numerical group relating to each monochromatic light for each sample group, and (d) the sample group Comparing with a plurality of numerical groups related to each monochromatic light, (e) after step (d), calculating difference data, (f) selecting difference data having the highest value among them, and (G) Determine the presence or absence of the target analyte based on the difference data having the highest value from step (e).
ある実施態様によると、少なくとも2つのサンプルグループが波長10nmから1000nmを有する電磁波又は単色光の1つを同時に照射してもよい。 According to an embodiment, at least two sample groups may simultaneously irradiate one of electromagnetic waves or monochromatic light having a wavelength of 10 nm to 1000 nm.
他の実施態様によると、サンプルグループは(a)ターゲット検体を潜在的に含む少なくとも1つのサンプルを含む第1のサンプルグループ、(b)ポシティブコントロールとして利用する第2のサンプルグループ、そして、(c)ネガティブコントロールとして利用する第3のサンプルグループを含んでもよい。 According to another embodiment, the sample group comprises (a) a first sample group comprising at least one sample potentially containing the target analyte, (b) a second sample group utilized as a positive control, and (c ) A third sample group used as a negative control may be included.
反射、吸収、放出された光はCDCカメラや他の適切な画像取り込み手段により検出してもよい。 Reflected, absorbed, or emitted light may be detected by a CDC camera or other suitable image capture means.
他の実施態様によると、ステップ(c)の後、各サンプルグループにおけるサンプルの光強度の平均値をとり、そして、各電磁波又は単色光と関係する少なくとも2つの平均値を生成するステップを提供する。1つは潜在的に検体を含むサンプルグループと関係する平均値であり、ポシティブコントロール又はネガティブコントロールとして利用するサンプルグループに関係するその他又はその他の1つである。 According to another embodiment, after step (c), the step of taking the average value of the light intensity of the samples in each sample group and generating at least two average values associated with each electromagnetic wave or monochromatic light is provided. . One is an average value associated with a sample group potentially containing an analyte, and the other is or other one associated with a sample group used as a positive or negative control.
検体を潜在的に含むサンプルグループとポシティブコントロール又はネガティブコントロールとして利用するサンプルグループに関係する平均値の絶対値差をとるステップを提供する。従って、各単色光に関係する少なくとも2つの差を生成する。さらに差を既定差と比較するステップをも提供する。 A step is provided for taking an absolute difference between an average value relating to a sample group potentially containing an analyte and a sample group used as a positive or negative control. Therefore, at least two differences related to each monochromatic light are generated. Also provided is a step of comparing the difference with a predetermined difference.
他の実施態様によると、絶対値における少なくとも2つの差を生成するステップを提供する。1つは検体を潜在的に含むサンプルグループとポシティブコントロールとして利用するサンプルグループに関係する平均値の比較に関係する。そしてその他又はその他の1つは検体を潜在的に含むサンプルグループとネガティブコントロールとして利用するサンプルグループに関係する平均値の比較に関係する。このステップによると、絶対値において少なくとも4つの差を生成するステップを提供する。そのうち2つは単色光の1つでサンプルグループを照射に関係する数値に関係し他の2つは他の単色光のうちの1つでサンプルグループへの照射と関係する数値と関係する。それからサンプルにおけるターゲット検体の存在又は欠如の決定時に利用すべき2つ又は少なくとも4つの差のうち少なくとも2つを決定するステップをさらに提供する。 According to another embodiment, providing at least two differences in absolute values is provided. One relates to the comparison of mean values relating to sample groups potentially containing analytes and sample groups used as positive controls. And the other or the other relates to the comparison of the mean values related to the sample group potentially containing the specimen and the sample group used as a negative control. This step provides for generating at least four differences in absolute values. Two of them are related to numerical values related to irradiation of the sample group with one of the monochromatic lights, and the other two are related to numerical values related to irradiation of the sample group with one of the other monochromatic lights. There is further provided a step of determining at least two of the two or at least four differences to be utilized in determining the presence or absence of the target analyte in the sample.
より好ましい実施態様では、サンプルグループはマイクロアレイのフォーマットにおいて整理された多数のサンプルを含む。 In a more preferred embodiment, the sample group comprises a large number of samples arranged in a microarray format.
以下の添付図面を参照して、一例として、本発明について以下説明する。 The present invention will now be described by way of example with reference to the accompanying drawings in which:
ある条件下におけるいくつかの生物学的なサンプルの検出は困難であることが知られている。例えば、ターゲット生物学的サンプルの濃度が非常に低いときはターゲットサンプルを精確に検出することが非常に難しいことが広く知られている。非特許文献1では生物学的物質の検出のために超高感度分類として共鳴光散乱粒子を使用することが提案されている。特許文献4では核酸検出のための方法が提案されている。非特許文献2ではナノ粒子や銀強化を使用するDNAを検出する異なった方法が比較されている。これらの文献はこの出願における従来技術である。これらの異なった方法の利便性にも係らず精度良く効率的に広く多種にわたる生物学的サンプルを一般的に用いられる検出方法はなかった。本発明の目的は、新しくて非常に使いやすい生物学的物質を検出する方法を提供することである。本発明を以下に実施態様や実験例を用いて説明する。
Detection of some biological samples under certain conditions is known to be difficult. For example, it is widely known that it is very difficult to accurately detect a target sample when the concentration of the target biological sample is very low.
発明の概略を説明すると、本発明の本質は検出されるサンプルの型について言及されているのではなくてむしろ検出方法についてである。本発明に従って検出すると従前困難とされてきたサンプルがシグナル強調物質によって識別され、又は識別できるというのが本発明の趣旨である。続いてターゲットサンプルがシグナル強調物質により識別されるDNA分子やペプチド分子又は有機分子や無機分子、例えば、ナノサイズ粒子、ナノ金粒子、ナノ銀粒子などについて言及する。シグナル強調は好ましくはナノサイズ粒子である。ナノサイズ粒子によると、粒子は10−9nmオーダの大きさを持っていることを意味する。 Describing the summary of the invention, the essence of the present invention is not about the type of sample to be detected, but rather about the detection method. It is the intent of the present invention that samples that have been previously difficult to detect when detected according to the present invention are identified or can be identified by a signal enhancing substance. Subsequently, mention will be made of DNA molecules, peptide molecules, organic molecules, inorganic molecules such as nano-sized particles, nano-gold particles, nano-silver particles, etc. whose target sample is identified by a signal enhancement substance. Signal enhancement is preferably nano-sized particles. According to nano-sized particles, it means that the particles have a size on the order of 10 −9 nm.
実験1.
この実験では、ターゲット検体はB型肝炎でシグナル強調物質はナノサイズの金粒子である。ナノサイズの金粒子で識別されたB型肝炎プローブはポシティブコントロールとして使用される。特に、図1にはチップウェーハ上のサンプルのマイクロアレイの概略図が示されている。チップウェーハは図1に示されるパターンに従ってスポットされている。特に、チップウェーハは6つのセクション、すなわちAからFのセクションに分割されている。セクションA、DとEは暗領域でこれらの領域はシグナル強調物質に付いているB型肝炎ウイルスプローブを持つポシティブコントロール領域を表している。ライトグレー領域、即ちセクションFはネガティブコントロールとして利用される非特異的ターゲットが投入される。白領域、即ちB,Cはスポットされたサンプルは全く含まれておらずこれらの領域はネガティブコントロールとして利用される。この配列に対しては、ポシティブ結果、即ちより暗い色がHBVプローブでスポットされた領域が観察される。一方、ネガティブ結果、即ちあまり色が付いていない他の領域で観察される。
In this experiment, the target specimen is hepatitis B and the signal enhancement substance is nano-sized gold particles. A hepatitis B probe identified with nano-sized gold particles is used as a positive control. In particular, FIG. 1 shows a schematic diagram of a microarray of samples on a chip wafer. The chip wafer is spotted according to the pattern shown in FIG. In particular, the chip wafer is divided into six sections, namely A to F sections. Sections A, D and E are dark regions, and these regions represent the positive control region with the hepatitis B virus probe attached to the signal enhancer. In the light gray area, ie, section F, a non-specific target used as a negative control is input. White areas, ie, B and C, do not contain any spotted samples and these areas are used as negative controls. For this arrangement, a positive result, i.e. a region where a darker color is spotted with the HBV probe, is observed. On the other hand, negative results are observed, i.e. in other areas that are not very colored.
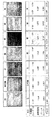
第1の実験における次のステップは効率的且つ高精度の観点からHBVプローブの存在を調査するいかなる手段も有効であるかどうか確認することにある。図2a,図2bはそれぞれCDCカメラとB/W CDCカメラにより撮影された画像である。これらの画像は上述したものと同じサンプルマイクロアレイを450nmから495nmの波長を有する青色光源により照射されたときのものである。図3aと図3b、図4aと図4b,図5aと図5bの画像はチップウェーハ上のサンプルマイクロアレイを上記のかわりに495nmから570nmの波長を有する白色、緑色や620nmから750nmの波長を有する赤色の光源により各々照射されたときに撮影されたものであるが図2a及び図2bと類似している。 The next step in the first experiment is to see if any means of investigating the presence of the HBV probe is effective from an efficient and accurate point of view. 2a and 2b are images taken by a CDC camera and a B / W CDC camera, respectively. These images are those when the same sample microarray as described above is illuminated by a blue light source having a wavelength of 450 nm to 495 nm. The images in FIGS. 3a and 3b, FIGS. 4a and 4b, and FIGS. 5a and 5b show the sample microarray on the chip wafer in white with a wavelength of 495 nm to 570 nm instead of the above, green and red with a wavelength of 620 nm to 750 nm. 2a and 2b, which are taken when each of the light sources is irradiated.
先ず最初に図4a及び図4bを参照すれば、セクションA,DとEはHBVプローブは含まれていないのだけれど明らかにポシティブ結果を生じていると考えられる。図面からわかるように画像は明白ではない。もっとはっきり言えば、セクションA,D,EとセクションB,C,F間のコントラストは高くない。すなわち、これは次のことを意味する。サンプルマイクロアレイが緑光により照射されたとき、HBVプローブ(又はHBVがおそらく含まれているであろう実際のサンプル、又はターゲット検体や生物製剤が含まれているかもしれない他のサンプル)の実在にもかかわらず、実際にそのようなターゲットサンプルが存在するか否かについて信用性の高い結論を得ることは困難である。言い換えると、この特別なサンプルマイクロアレイに対して緑色の使用は特に信用できない。 Referring first to FIGS. 4a and 4b, sections A, D, and E do not contain HBV probes, but are apparently producing positive results. As can be seen from the drawing, the image is not clear. More specifically, the contrast between sections A, D, E and sections B, C, F is not high. In other words, this means the following. When the sample microarray is illuminated by green light, the HBV probe (or the actual sample that probably contains HBV, or any other sample that may contain the target analyte or biologic) Regardless, it is difficult to get a reliable conclusion as to whether such a target sample actually exists. In other words, the use of green for this special sample microarray is not particularly reliable.
図5a及び図5bを参照すれば、同様にセクションA,D,EはHBVプローブが含まれ、そして明らかにポシティブ結果が生じていると考えられる。セクションA,D,EにはセクションB,C,Fよりも比較的高いコントラストを持つ紫性色のドットが実際に示されていることが示されている(図4a,図4bおよび図5a,図5bにおけるセクションB,C,Fのコントラストとを比較すると)。それは、HBVプローブの存在を検出するための白光の使用は赤光の使用と比較するのと同じく効果的であるが緑光の使用が勝りより効果的で有益であることを意味している。 Referring to FIGS. 5a and 5b, similarly, sections A, D, and E contain HBV probes, and apparently positive results are expected. Sections A, D, and E show that purple dots having a relatively higher contrast than sections B, C, and F are actually shown (FIGS. 4a, 4b and 5a, Compare the contrast of sections B, C, F in FIG. 5b). That means that the use of white light to detect the presence of an HBV probe is just as effective as the use of red light, but the use of green light is much more effective and beneficial.
図2a及び図2bを参照すれば、同じくセクションA,D,EはHBVプローブが含まれており明らかにポシティブ結果を生じていると考えられる。このことは次のことを示している。セクションA,D,EはセクションB,C,Fとよりも最も高いコントラストを持つ青色のクリアなドットを示している(図3a,図3bと図4a,図4bと図5a,図5bそれぞれのセクションA,D,EとセクションB,C,Fの間の対応するコントラストとの比較のように)。このことは増強作用物質断片HBVサンプルを青光、白光、緑光と赤光に照射した中ではHBVプローブの存在を検出するための青光の使用がもっとも効果的であることが示されている。 Referring to FIGS. 2a and 2b, sections A, D, and E also contain the HBV probe and are apparently producing positive results. This indicates the following. Sections A, D, and E show blue clear dots having the highest contrast than sections B, C, and F (FIGS. 3a, 3b and 4a, 4b, 5a, and 5b, respectively). (As in comparison with the corresponding contrast between sections A, D, E and sections B, C, F). This indicates that the use of blue light to detect the presence of the HBV probe is most effective when the enhancing agent fragment HBV sample is irradiated with blue light, white light, green light and red light.
実験2.
図6A−aから図11は図1から図5bおよび上述したものと類似するデータと実験結果が示されている。特に、チップウェーハが使用され、そして同じように6つのセクション、即ち、セクションAからFに分割されている。そこにはターゲット検体が含まれるサンプルやポシティブコントロールおよび/又はネガティブコントロールが充填されている。セクションA,Dには特異的プローブが充填されている。セクションE,Fには特異的プローブが充填されているが各々100倍、10倍に希釈されている。セクションCには非特異的プローブが充填されセクションBはバッファである。図6Bを参照ください。特異的プローブはHBVプローブと似ている。この実験によると、図1から図5bに示す実験と比較すると、しかしながら、多数の差異が存在する。1つに先ず反応はチップウェーハ上で起こることが許される。そして、チップウェーハの画像が次のときに撮影されている。反応時間が6分未満(図6A−a参照)、約6分(図6A−b参照)、約10分(図6A−c参照)、約14分(図6A−d参照)、そして14分以上(図6A−e参照)のときの画像が表示されている。原則として、反応が進行するにつれて検体の存在の検出と示唆が特に明確になる時間幅が存在する。この特殊な実験においては、チップウェーハは異なった時間で白光で照射され、それに対応した画像が画像取り込み手段により取り込まれる。白単色光は目に見える範囲の波長を有する単色光である。
Experiment 2.
FIGS. 6A-a show data and experimental results similar to FIGS. 1-5b and those described above. In particular, a chip wafer is used and is similarly divided into six sections, namely sections A to F. There are filled with a sample containing a target specimen, a positive control and / or a negative control. Sections A and D are filled with specific probes. Sections E and F are filled with specific probes but diluted 100-fold and 10-fold, respectively. Section C is filled with non-specific probes and section B is a buffer. Refer to Figure 6B. Specific probes are similar to HBV probes. According to this experiment, however, there are a number of differences compared to the experiment shown in FIGS. 1 to 5b. First, the reaction is allowed to occur on the chip wafer. Then, an image of the chip wafer is taken at the following time. Reaction time is less than 6 minutes (see FIG. 6A-a), about 6 minutes (see FIG. 6A-b), about 10 minutes (see FIG. 6A-c), about 14 minutes (see FIG. 6A-d), and 14 minutes The image at the time described above (see FIGS. 6A to 6E) is displayed. As a rule, there is a time span in which the detection and suggestion of the presence of the analyte becomes particularly clear as the reaction proceeds. In this special experiment, the chip wafer is irradiated with white light at different times, and the corresponding image is captured by the image capturing means. White monochromatic light is monochromatic light having a visible wavelength range.
特定の光又は単色光(たとえば、図6A−aから図A−eに示される白単色光など)を特定の時間(たとえば、図6A−aから図6A−eに示される6分未満)でウェーハチップに照射することに加えて、他の単色光をも連続照射されこれらに対応するチップウェーハの画像が取り込まれる。図7は他の単色光が赤外線単色光や赤色単色光、橙色単色光、黄色単色光、緑色単色光や青色単色光が含まれることを示しており、これらの波長は上述したとおりである。図7はまたチップウェーハ上のサンプルから反射又は放出された電磁波又は光の強度を反映する数的データがまとめられている。実際、電磁波又は光の吸収レベルもまた検出することができる。実際、電磁波又は光が検出されないとき関連サンプルがチップウェーハ上に照射された電磁波又は光を全て吸収することを意味すると理解できる。又は、しばしばあるのだが電磁波又は光が部分的に吸収される時、吸収される範囲は従来の方法で測定することが可能である。従って、電磁波又は光が最小限に吸収される場合には、吸収レベルはわずかであるということになる。まとめると、本発明のステップの1つは各々のサンプルからの電磁波又は光の放出、吸収、又は反射を検出することにある。チップウェーハ上に充填されたバッファだけのセクションはネガティブコントロールとしての役割をするので、ターゲット検体とバッファの数的データとを比較すると、その比較から生じるデルタ値はターゲット検体の存在又は欠如を示す。図7は青単色光を使用することに関係するデルタ値は最適な結果を提供するであろうことを示している。このことはこの特別な実験における青単色光の使用は検体を検出するもっとも効果的であることを示している。 Specific light or monochromatic light (eg, white monochromatic light shown in FIGS. 6A-a to Ae) at a specific time (eg, less than 6 minutes shown in FIGS. 6A-a to 6A-e) In addition to irradiating the wafer chip, other monochromatic light is also continuously irradiated, and the corresponding image of the chip wafer is captured. FIG. 7 shows that other monochromatic lights include infrared monochromatic light, red monochromatic light, orange monochromatic light, yellow monochromatic light, green monochromatic light, and blue monochromatic light, and these wavelengths are as described above. FIG. 7 also summarizes numerical data reflecting the intensity of electromagnetic waves or light reflected or emitted from the sample on the chip wafer. Indeed, the absorption level of electromagnetic waves or light can also be detected. In fact, it can be understood that when no electromagnetic wave or light is detected, the relevant sample absorbs all the electromagnetic wave or light irradiated on the chip wafer. Or, as is often the case, when electromagnetic waves or light are partially absorbed, the absorbed range can be measured by conventional methods. Therefore, when electromagnetic waves or light is absorbed to a minimum, the absorption level is small. In summary, one of the steps of the present invention is to detect the emission, absorption, or reflection of electromagnetic waves or light from each sample. Since the buffer-only section filled on the chip wafer serves as a negative control, when comparing the target analyte with the buffer numerical data, the delta value resulting from the comparison indicates the presence or absence of the target analyte. FIG. 7 shows that the delta values associated with using blue monochromatic light will provide optimal results. This indicates that the use of blue monochromatic light in this particular experiment is most effective for detecting the analyte.
図8はチップウェーハ上で約6分の間に起こった一連の反応の画像を示すのだが、図8は図7に類似する。デルタ値は黄単色光に関係するデルタ値が最も高いことが示されている。これは、この特別な実験において、黄単色光の使用がこの反応時間において検体を検出する際に最も効率的であることを示している。 FIG. 8 shows an image of a series of reactions that took place on a chip wafer in about 6 minutes, but FIG. 8 is similar to FIG. The delta value is shown to be the highest delta value related to yellow monochromatic light. This shows that in this particular experiment, the use of yellow monochromatic light is most efficient in detecting the analyte at this reaction time.
図9はチップウェーハ上で約10分の間に起こった一連の反応の画像を示しているのだけれど、図9は図7に類似する。デルタ値は橙と黄の単色光に関係するデルタ値が最も高いことが示されている(黄単色光のデルタ値よりも橙単色光のデルタ値が高い)。これはこの特別な実験において橙単色光の使用が反応時間において検体を検出する際に最も効果的であることを示している。 Although FIG. 9 shows an image of a series of reactions that occurred on a chip wafer in about 10 minutes, FIG. 9 is similar to FIG. It has been shown that the delta value associated with orange and yellow monochromatic light is the highest (the delta value of orange monochromatic light is higher than that of yellow monochromatic light). This indicates that the use of orange monochromatic light is most effective in detecting the analyte during the reaction time in this particular experiment.
図10はチップウェーハ上で約14分の間に起こった一連の反応の画像を示しているのだけれど、図10は図7に類似する。デルタ値は赤単色光に関係するデルタ値が最も高いことが示されている。これはこの特別な実験において、赤単色光の使用がこの反応時間において検体を検出する際に最も効率的であることを示している。 FIG. 10 shows an image of a series of reactions that took place on a chip wafer in about 14 minutes, but FIG. 10 is similar to FIG. The delta value is shown to be the highest delta value associated with red monochromatic light. This shows that in this particular experiment, the use of red monochromatic light is most efficient in detecting the analyte at this reaction time.
図11はチップウェーハ上で14分以上に起こった一連の反応の画像を示しているのだけれど、図11は図7に類似する。デルタ値は赤外線に関係するデルタ値が最も高いことが示されている。これはこの特別な実験において、赤外線の使用がこの反応時間において検体を検出する際に最も効率的であることを示している。 FIG. 11 shows an image of a series of reactions that occurred over 14 minutes on a chip wafer, but FIG. 11 is similar to FIG. It is shown that the delta value has the highest delta value related to infrared rays. This shows that in this particular experiment, the use of infrared radiation is most efficient at detecting analytes at this reaction time.
上述した実験から、ある環境下におけるある単色光の使用が最も効果的であろうことが結論付けることができる。しかしながら、特定の時間で使用すべき特定の単色光を予言することは非常に難しい。従って、本発明の一態様に従った好ましい実施態様においては、異なった事前に選択された単色光の範囲でサンプルに連続照射することができる。最適なデルタ値を生成するデータがターゲット検体の欠如の存在の決定に使用される。 From the experiments described above, it can be concluded that the use of certain monochromatic light in certain circumstances would be most effective. However, it is very difficult to predict a specific monochromatic light to be used at a specific time. Thus, in a preferred embodiment according to one aspect of the present invention, the sample can be irradiated continuously with a range of different preselected monochromatic lights. Data that produces an optimal delta value is used to determine the presence of a lack of target analyte.
上述した実験において、チップウェーハにはポシティブコントロールやネガティブコントロールに役に立つサンプルが充填される。しかしながら、別の実施態様において、ポシティブおよび/又はコントロールの値に相当するあらかじめ決められた値が比較目的のために使用されるかもしれません。そして、適切なコンピュータソフトウエアが比較実行するために提供されるかもしれません。 In the experiment described above, the chip wafer is filled with a sample useful for positive control and negative control. However, in other embodiments, predetermined values corresponding to positive and / or control values may be used for comparison purposes. And appropriate computer software may be provided to perform the comparison.
実験1に示されているように、チップウェーハ上の異なった領域のコントラストが目視で決定される。しかしながら、実験2においては、サンプルからの反射、吸収、又は放出された光強度が検出されそれからデジタル的に数的データに変換される。
As shown in
上述した実験を用いて説明することにより、本発明のある特徴が1つの実施態様のコンビネーションで提供できることが理解されるであろう。逆に、上述した実験方法で説明したように、発明の色々な特徴が、簡潔な理由で上記実験から説明できる。しかし、実験を分離したり適切なサブコンビネーションで実験しても発明の特徴を説明することは出来ない。 It will be understood from the experiments described above that certain features of the present invention can be provided in one embodiment combination. Conversely, as explained in the experimental method described above, the various features of the invention can be explained from the above experiment for concise reasons. However, the features of the invention cannot be explained by separating experiments or experimenting with appropriate sub-combinations.
Claims (14)
(i)少なくとも1つの前記電磁波又は前記単色光を前記ターゲット検体を潜在的に含む多数の前記サンプルを含むサンプルグループに照射し、
(ii)前記電磁波若しくは前記各電磁波又は前記単色光もしくは前記各単色光により照射された時前記サンプルグループから反射、吸収又は放出される電磁波強度が検出され、
(iii)前記サンプルグループから反射、吸収、放出された前記電磁波又は前記単色光の強度に関係する1つ又は複数の数値グループが前記サンプルグループから反射、吸収又は放出された前記各電磁波又は前記単色光と関係する前記1つ又は複数の数値グループ又は前記複数の数値グループの1つと一緒に記録され、
(iv)前記電磁波若しくは前記各電磁波、又は前記単色光もしくは前記各単色光に関係する前記1つ又は複数の数値グループと比較し、
(v)より大きなシグナルを有する前記複数の数値グループの1つを選択し、そして、
(vi)ステップ(v)から選択された前記数値グループに基づいて前記ターゲット検体の存在又は欠如を決定する、ことを含む、ターゲット検体検出方法。 A method for detecting a target analyte in a sample using electromagnetic waves or monochromatic light,
(I) irradiating a sample group comprising a number of said samples potentially containing said target analyte with at least one said electromagnetic wave or said monochromatic light;
(Ii) The electromagnetic wave intensity reflected, absorbed or emitted from the sample group when it is irradiated with the electromagnetic wave or the electromagnetic waves or the monochromatic light or the monochromatic light is detected;
(Iii) Each electromagnetic wave or single color reflected or absorbed or emitted from one or more numerical groups related to the intensity of the electromagnetic wave or monochromatic light reflected, absorbed or emitted from the sample group Recorded together with the one or more numerical groups or one of the plurality of numerical groups relating to light;
(Iv) Compare with the electromagnetic wave or each electromagnetic wave, or the one or more numerical groups related to the monochromatic light or the monochromatic light,
(V) selecting one of the plurality of numerical groups having a greater signal; and
(Vi) A target analyte detection method comprising determining the presence or absence of the target analyte based on the numerical group selected from step (v).
Applications Claiming Priority (3)
| Application Number | Priority Date | Filing Date | Title |
|---|---|---|---|
| US19576408P | 2008-10-10 | 2008-10-10 | |
| US61/195,764 | 2008-10-10 | ||
| PCT/CN2009/001118 WO2010040278A1 (en) | 2008-10-10 | 2009-10-09 | Method for detection of analyte in microarray of samples and apparatus for performing such method |
Publications (1)
| Publication Number | Publication Date |
|---|---|
| JP2012505381A true JP2012505381A (en) | 2012-03-01 |
Family
ID=42100198
Family Applications (1)
| Application Number | Title | Priority Date | Filing Date |
|---|---|---|---|
| JP2011530351A Pending JP2012505381A (en) | 2008-10-10 | 2009-10-09 | Method for detecting an analyte in a sample microarray and apparatus for carrying out such a method |
Country Status (14)
| Country | Link |
|---|---|
| US (1) | US8547552B2 (en) |
| EP (1) | EP2331959A4 (en) |
| JP (1) | JP2012505381A (en) |
| KR (1) | KR20110082135A (en) |
| CN (1) | CN102171568A (en) |
| AU (1) | AU2009301560A1 (en) |
| BR (1) | BRPI0920456A2 (en) |
| CA (1) | CA2738067A1 (en) |
| GB (1) | GB2464747B (en) |
| HK (1) | HK1143206A1 (en) |
| MX (1) | MX2011003887A (en) |
| RU (1) | RU2011110344A (en) |
| TW (1) | TW201015060A (en) |
| WO (1) | WO2010040278A1 (en) |
Families Citing this family (2)
| Publication number | Priority date | Publication date | Assignee | Title |
|---|---|---|---|---|
| US8416418B2 (en) * | 2011-07-14 | 2013-04-09 | Kendall Technology Inc. | Method and apparatus for gold detection |
| US9188531B2 (en) | 2011-07-14 | 2015-11-17 | Kendall Technology Inc. | Method and apparatus for gold detection |
Citations (5)
| Publication number | Priority date | Publication date | Assignee | Title |
|---|---|---|---|---|
| JP2003519796A (en) * | 2000-01-12 | 2003-06-24 | ヴェンタナ メディカル システムズ インコーポレイテッド | Quantification of proteins by image analysis |
| JP2005030919A (en) * | 2003-07-14 | 2005-02-03 | Olympus Corp | Light detector |
| JP2005514589A (en) * | 2001-12-05 | 2005-05-19 | ザ・レジェンツ・オブ・ザ・ユニバーシティ・オブ・カリフォルニア | Robot microscope inspection system |
| WO2006118888A1 (en) * | 2005-05-02 | 2006-11-09 | Cytyc Corporation | Automated image analysis |
| JP2008145405A (en) * | 2006-12-13 | 2008-06-26 | Hisami Kenmotsu | Detection device for biological sample |
Family Cites Families (19)
| Publication number | Priority date | Publication date | Assignee | Title |
|---|---|---|---|---|
| US5427955A (en) * | 1993-06-01 | 1995-06-27 | Utah State University Foundation | Photochemical determination of organic compounds |
| US6506564B1 (en) | 1996-07-29 | 2003-01-14 | Nanosphere, Inc. | Nanoparticles having oligonucleotides attached thereto and uses therefor |
| US6750016B2 (en) | 1996-07-29 | 2004-06-15 | Nanosphere, Inc. | Nanoparticles having oligonucleotides attached thereto and uses therefor |
| US6361944B1 (en) | 1996-07-29 | 2002-03-26 | Nanosphere, Inc. | Nanoparticles having oligonucleotides attached thereto and uses therefor |
| US6458547B1 (en) * | 1996-12-12 | 2002-10-01 | Prolume, Ltd. | Apparatus and method for detecting and identifying infectious agents |
| CA2280794A1 (en) * | 1997-02-20 | 1998-08-27 | The Regents Of The University Of California | Plasmon resonant particles, methods and apparatus |
| US6992761B2 (en) * | 1997-09-20 | 2006-01-31 | Molecular Devices Corporation | Broad range light detection system |
| US7267948B2 (en) * | 1997-11-26 | 2007-09-11 | Ut-Battelle, Llc | SERS diagnostic platforms, methods and systems microarrays, biosensors and biochips |
| JP2002532728A (en) * | 1998-12-17 | 2002-10-02 | ライカ ミクロジュステムス ハイデルベルク ゲーエムベーハー | Method for advantageously discriminating various structures in a biological sample |
| AU774593C (en) | 2000-01-13 | 2005-06-23 | Nanosphere, Inc. | Nanoparticles having oligonucleotides attached thereto and uses therefor |
| US6833920B2 (en) * | 2000-07-11 | 2004-12-21 | Maven Technologies Llc | Apparatus and method for imaging |
| US6545758B1 (en) * | 2000-08-17 | 2003-04-08 | Perry Sandstrom | Microarray detector and synthesizer |
| JP4347053B2 (en) * | 2001-08-03 | 2009-10-21 | ナノスフェアー インコーポレイテッド | Nanoparticle imaging system and method |
| US20030139886A1 (en) * | 2001-09-05 | 2003-07-24 | Bodzin Leon J. | Method and apparatus for normalization and deconvolution of assay data |
| TWI284743B (en) | 2002-07-13 | 2007-08-01 | Advantest Corp | Event pipeline and summing method and apparatus for event based test system |
| CN100347545C (en) | 2003-04-08 | 2007-11-07 | 成都夸常科技有限公司 | Method of preoceeding qualitative and/or quantitative analysis against target substance in sample and its detecting device |
| WO2004081571A1 (en) * | 2003-03-13 | 2004-09-23 | Chengdu Kuachang Medical Industrial Limited | The detecting method and device of polypeptide, and the ligand compound comprising nanoparticles |
| US20080064120A1 (en) | 2006-02-06 | 2008-03-13 | Clarke Richard H | Raman spectroscopic lateral flow test strip assays |
| CN101201346B (en) | 2007-12-06 | 2011-06-29 | 中国科学院长春应用化学研究所 | Method for making and detecting biological chip |
-
2008
- 2008-11-19 GB GB0821126.0A patent/GB2464747B/en not_active Expired - Fee Related
-
2009
- 2009-08-25 TW TW098128515A patent/TW201015060A/en unknown
- 2009-10-09 US US13/121,712 patent/US8547552B2/en active Active
- 2009-10-09 JP JP2011530351A patent/JP2012505381A/en active Pending
- 2009-10-09 WO PCT/CN2009/001118 patent/WO2010040278A1/en active Application Filing
- 2009-10-09 AU AU2009301560A patent/AU2009301560A1/en not_active Abandoned
- 2009-10-09 EP EP09818742.0A patent/EP2331959A4/en not_active Withdrawn
- 2009-10-09 BR BRPI0920456A patent/BRPI0920456A2/en not_active IP Right Cessation
- 2009-10-09 KR KR1020117008230A patent/KR20110082135A/en not_active Application Discontinuation
- 2009-10-09 RU RU2011110344/15A patent/RU2011110344A/en not_active Application Discontinuation
- 2009-10-09 CN CN2009801392479A patent/CN102171568A/en active Pending
- 2009-10-09 MX MX2011003887A patent/MX2011003887A/en not_active Application Discontinuation
- 2009-10-09 CA CA2738067A patent/CA2738067A1/en not_active Abandoned
-
2010
- 2010-10-13 HK HK10109705.5A patent/HK1143206A1/en unknown
Patent Citations (5)
| Publication number | Priority date | Publication date | Assignee | Title |
|---|---|---|---|---|
| JP2003519796A (en) * | 2000-01-12 | 2003-06-24 | ヴェンタナ メディカル システムズ インコーポレイテッド | Quantification of proteins by image analysis |
| JP2005514589A (en) * | 2001-12-05 | 2005-05-19 | ザ・レジェンツ・オブ・ザ・ユニバーシティ・オブ・カリフォルニア | Robot microscope inspection system |
| JP2005030919A (en) * | 2003-07-14 | 2005-02-03 | Olympus Corp | Light detector |
| WO2006118888A1 (en) * | 2005-05-02 | 2006-11-09 | Cytyc Corporation | Automated image analysis |
| JP2008145405A (en) * | 2006-12-13 | 2008-06-26 | Hisami Kenmotsu | Detection device for biological sample |
Also Published As
| Publication number | Publication date |
|---|---|
| RU2011110344A (en) | 2012-11-20 |
| CA2738067A1 (en) | 2010-04-15 |
| GB0821126D0 (en) | 2008-12-24 |
| CN102171568A (en) | 2011-08-31 |
| TW201015060A (en) | 2010-04-16 |
| KR20110082135A (en) | 2011-07-18 |
| US20110176135A1 (en) | 2011-07-21 |
| GB2464747B (en) | 2013-05-15 |
| WO2010040278A1 (en) | 2010-04-15 |
| US8547552B2 (en) | 2013-10-01 |
| HK1143206A1 (en) | 2010-12-24 |
| BRPI0920456A2 (en) | 2015-12-22 |
| MX2011003887A (en) | 2011-05-03 |
| AU2009301560A1 (en) | 2010-04-15 |
| EP2331959A4 (en) | 2013-07-10 |
| GB2464747A (en) | 2010-04-28 |
| EP2331959A1 (en) | 2011-06-15 |
Similar Documents
| Publication | Publication Date | Title |
|---|---|---|
| US7186990B2 (en) | Method and apparatus for detecting and imaging the presence of biological materials | |
| EP2343532A2 (en) | Grating-based sensor combining label-free binding detection and fluorescence amplification and readout system for sensor | |
| JP2007524087A (en) | Methods and apparatus for using Raman-active probe constructs to assay biological samples | |
| US20100068714A1 (en) | Multivariate detection of molecules in biossay | |
| JP4979516B2 (en) | Image reading method and apparatus | |
| US8428398B2 (en) | Hand-held portable microarray reader for biodetection | |
| KR20030037314A (en) | Apparatus for analyzing fluorescence image of biochip | |
| US7764361B2 (en) | Systems and methods to analyze multiplexed bead-based assays using backscattered light | |
| JP2012505381A (en) | Method for detecting an analyte in a sample microarray and apparatus for carrying out such a method | |
| WO2023138162A1 (en) | Sample detection method, apparatus and system, and electronic device and computer-readable medium | |
| JP2004531743A (en) | Flat field correction of two-dimensional biochemical analysis images | |
| US20130157264A1 (en) | Nucleic acid analysis device, nucleic acid analysis apparatus, and nucleic acid analysis method | |
| JP2009270931A (en) | Observation device of single nucleic acid molecule | |
| CN115015211A (en) | Method, device, training method, analysis system, and analysis program for analyzing test substance | |
| US6775621B1 (en) | Degree of hybridization detection method | |
| JP2024521682A (en) | Method for analyzing biological samples or compounds or chemical elements | |
| JP4321716B2 (en) | Fluorescence image correction method, apparatus, and program | |
| US20230314419A1 (en) | Target measurement method, target measurement device, target measurement apparatus, and target measurement kit | |
| JP2006177916A (en) | Two-dimensional inspecting method of polished rice | |
| TWI325443B (en) | ||
| WO2018168137A1 (en) | Biological substance analysis method, biological substance analysis device, biological substance analysis program, and biological substance analysis system | |
| JP2005134267A (en) | Analyzing device and analyzing method | |
| JP2000346847A (en) | Method and device for detecting organism-derived material | |
| JP2000346804A (en) | Image displaying method and its device | |
| JP2004029009A (en) | Biochip |
Legal Events
| Date | Code | Title | Description |
|---|---|---|---|
| A621 | Written request for application examination |
Free format text: JAPANESE INTERMEDIATE CODE: A621 Effective date: 20121009 |
|
| A977 | Report on retrieval |
Free format text: JAPANESE INTERMEDIATE CODE: A971007 Effective date: 20130930 |
|
| A131 | Notification of reasons for refusal |
Free format text: JAPANESE INTERMEDIATE CODE: A131 Effective date: 20131008 |
|
| A601 | Written request for extension of time |
Free format text: JAPANESE INTERMEDIATE CODE: A601 Effective date: 20140107 |
|
| A602 | Written permission of extension of time |
Free format text: JAPANESE INTERMEDIATE CODE: A602 Effective date: 20140115 |
|
| A601 | Written request for extension of time |
Free format text: JAPANESE INTERMEDIATE CODE: A601 Effective date: 20140210 |
|
| A602 | Written permission of extension of time |
Free format text: JAPANESE INTERMEDIATE CODE: A602 Effective date: 20140220 |
|
| A601 | Written request for extension of time |
Free format text: JAPANESE INTERMEDIATE CODE: A601 Effective date: 20140307 |
|
| A602 | Written permission of extension of time |
Free format text: JAPANESE INTERMEDIATE CODE: A602 Effective date: 20140314 |
|
| A02 | Decision of refusal |
Free format text: JAPANESE INTERMEDIATE CODE: A02 Effective date: 20150303 |