JP2012123749A - Sensibility estimation device, sensibility estimation method, and sensibility estimation program - Google Patents
Sensibility estimation device, sensibility estimation method, and sensibility estimation program Download PDFInfo
- Publication number
- JP2012123749A JP2012123749A JP2010276261A JP2010276261A JP2012123749A JP 2012123749 A JP2012123749 A JP 2012123749A JP 2010276261 A JP2010276261 A JP 2010276261A JP 2010276261 A JP2010276261 A JP 2010276261A JP 2012123749 A JP2012123749 A JP 2012123749A
- Authority
- JP
- Japan
- Prior art keywords
- sensitivity
- estimation
- evaluation
- sensibility
- hierarchical structure
- Prior art date
- Legal status (The legal status is an assumption and is not a legal conclusion. Google has not performed a legal analysis and makes no representation as to the accuracy of the status listed.)
- Withdrawn
Links
Images


Landscapes
- Management, Administration, Business Operations System, And Electronic Commerce (AREA)
Abstract
Description
本発明は、感性推測装置、感性推測方法、及び感性推測プログラムに係り、特にユーザの感性を高精度且つ効率的に推測するための感性推測装置、感性推測方法、及び感性推測プログラムに関する。 The present invention relates to a sensitivity estimation device, a sensitivity estimation method, and a sensitivity estimation program, and more particularly, to a sensitivity estimation device, a sensitivity estimation method, and a sensitivity estimation program for accurately and efficiently estimating a user's sensitivity.
従来、皮膚に塗布する化粧品や医薬品(皮膚外用剤)等における使用性等の感性評価では、例えば化粧品等を皮膚等に塗布する前段階での評価については、例えば基剤の粘度や転がり摩擦等による基剤評価を行っていた。また、化粧品等を皮膚等に塗布中及び塗布後の評価については、例えば予め設定された感性ワード(例えば、さっぱり、しっとり、べたつき、浸透感等)を用いて、専門パネラー等による評価やアンケートによって消費者テスト等を行い、その結果から感性評価等を行っていた。 Conventionally, in the sensitivity evaluation such as usability in cosmetics and pharmaceuticals (skin external preparations) applied to the skin, for example, the evaluation at the previous stage of applying cosmetics etc. to the skin etc., for example, viscosity of the base, rolling friction, etc. The base was evaluated. In addition, for the evaluation during and after application of cosmetics on the skin, etc., for example, using a preset sensitivity word (for example, refreshing, moist, sticky, penetration feeling, etc.) A consumer test, etc. was conducted, and the sensitivity was evaluated based on the results.
なお、上述したようにアンケートにより収集された回答項目から作成された評価データに基づいて学習型のニューラルネットにより評価データに基づいて感性評価分析を行う手法が開示されている(例えば、特許文献1参照。)。 Note that, as described above, a technique is disclosed in which sensitivity evaluation analysis is performed based on evaluation data by a learning type neural network based on evaluation data created from answer items collected by a questionnaire (for example, Patent Document 1). reference.).
ところで、感性に対する嗜好や感度には個人差があり、例えば一般消費者においては、使用感の微差までわかるユーザや使用感の微差を感じないユーザ等が存在する。しかしながら、上述した従来技術における個人差等については、通常、属性(年代等)で分類するのみであるため、感性の個人差に対する関連性が少なく、適切な調整が行われていなかった。そのため、感性評価の精度向上のためには、何らかの対策が必要となる。 By the way, there are individual differences in preference and sensitivity for sensibility. For example, in general consumers, there are users who can understand even a slight difference in feeling of use, users who do not feel a slight difference in feeling of use, and the like. However, the individual differences and the like in the prior art described above are usually classified only by attributes (such as age), and therefore, the sensitivity is not related to the individual differences, and appropriate adjustment has not been performed. Therefore, some measures are required to improve the accuracy of sensitivity evaluation.
また、感性にも複数の階層があると考えられ、例えば「浅い感性」又は「深い感性」等の各階層のうち、例えば1つの深い感性に対する感じ方にも個人差があるため、「浅い感性」と「深い感性」の解明が必要である。なお、「浅い感性」とは、例えば皮膚の感覚器で直接感じる感性(例えば、しっとり、つるつる等)等を示し、「深い感性」とは、例えば複合的に判断される感性(例えば、浸透感、はり感等)等を示している。しかしながら、従来では、多数のアンケート項目が横並びで解析されるだけであり、これも解析精度の向上のために何らかの対策が必要である。 In addition, it is considered that there are multiple levels of sensibility. For example, among the levels such as “shallow sensibility” or “deep sensibility”, for example, there is an individual difference in how to feel one deep sensibility. ”And“ deep sensitivity ”need to be elucidated. Note that “shallow sensibility” refers to, for example, sensibility (eg, moist, smooth) that is directly felt by the skin's sensilla, and “deep sensibility” refers to, for example, complex judgment (eg, penetrating sensation) , And the like). However, conventionally, a large number of questionnaire items are only analyzed side by side, and this also requires some measures to improve analysis accuracy.
また、精度よく感性評価を数値化するために必要な検討項目としては、例えば感性評価の個人差を抽出し、感性の階層構造を反映し、基剤物性に変換できる感性項目を抽出すること等があるが、従来のアンケート評価手法では、上述した内容を適切に収集できるアンケート手法が存在していない。なお、上述した感性の階層構造とは、例えば「浅い感性」と「深い感性」等の複数の感性が関連性を持って階層的に構造されている形態を示す。 In addition, as an examination item necessary for accurately quantifying Kansei evaluation, for example, extracting individual differences in Kansei evaluation, reflecting Kansei hierarchical structure, extracting Kansei items that can be converted into base physical properties, etc. However, in the conventional questionnaire evaluation method, there is no questionnaire method that can appropriately collect the above-described contents. The above-described hierarchical structure of sensibilities indicates a form in which a plurality of sensibilities such as “shallow sensibility” and “deep sensibility” are hierarchically structured.
つまり、従来では、多数のアンケート項目が横並びで解析されていたため、「浅い感性」及び「深い感性」等のような階層的な構造に伴う評価が反映できなかった。 That is, in the past, since many questionnaire items were analyzed side by side, evaluations associated with a hierarchical structure such as “shallow sensitivity” and “deep sensitivity” could not be reflected.
また、従来では、基剤物性と感性の相関関係を体型的に見出せていないため、処方開発時等は、担当者の経験や勘に頼るしかなく、ユーザの感性を高精度且つ効率的に推測するための手法は存在していなかった。 In addition, since the correlation between the physical properties of the base and the sensibility has not been found in the past, the precept development has to rely on the experience and intuition of the person in charge, and the user's sensibility can be estimated with high accuracy and efficiency. There was no way to do this.
本発明は、上述した課題に鑑みてなされたものであって、ユーザ(顧客)の感性を高精度且つ効率的に推測するための感性推測装置、感性推測方法、及び感性推測プログラムを提供することを目的とする。 The present invention has been made in view of the above-described problems, and provides a sensitivity estimation device, a sensitivity estimation method, and a sensitivity estimation program for estimating the sensitivity of a user (customer) with high accuracy and efficiency. With the goal.
上述した課題を解決するために、本件発明は、以下の特徴を有する課題を解決するための手段を採用している。 In order to solve the above-described problems, the present invention employs means for solving the problems having the following characteristics.
請求項1に記載された発明は、ユーザが使用する感性評価対象物の使用中及び使用後の感性を推測する感性推測装置において、予め設定された階層型ニューラルネットワークのスケルトン学習法を用いて、複数の感性項目に対する所定の総合評価を得る嗜好特性パターン毎に分類を行う嗜好特性パターン抽出手段を有することを特徴とする。
The invention described in
請求項1記載の発明によれば、非線形型であるニューラルネットワークを用いることにより、物理モデルがない感性に対する推測を有効に行うことができる。また、総合評価に影響を与える入力の感性評価のユーザ毎の個人差を反映して高精度に感性推測を行うことができる。 According to the first aspect of the present invention, by using a neural network that is a non-linear type, it is possible to effectively make an inference on sensitivity without a physical model. In addition, it is possible to estimate the sensitivity with high accuracy by reflecting the individual difference for each user in the input sensitivity evaluation that affects the comprehensive evaluation.
請求項2に記載された発明は、前記感性評価対象物に対する基剤物性情報を入力する入力手段と、前記複数の感性項目を用いて前記ユーザの前記感性評価対象物に対する感性を階層化する階層構造推定手段と、前記入力手段により得られる基剤物性情報と、前記階層構造推定手段により得られる階層構造とに基づいて、前記嗜好特性パターン抽出手段により得られた分類に対する前記感性評価対象物への感性を推測する感性推測手段とを有することを特徴とする。
The invention described in
請求項2記載の発明によれば、基剤物性情報から一般消費者であるユーザの感性を高精度且つ効率的に推測することができる。 According to the second aspect of the present invention, the sensitivity of the user who is a general consumer can be estimated with high accuracy and efficiency from the base material property information.
請求項3に記載された発明は、前記感性推測手段により得られる感性推測結果を、予め設定された評価指標に対応させて感性を評価する感性評価手段を有することを特徴とする。 According to a third aspect of the present invention, there is provided a sensibility evaluation unit that evaluates a sensibility by associating a sensitivity estimation result obtained by the sensitivity estimation unit with a preset evaluation index.
請求項3記載の発明によれば、ユーザの感性を数値化や所定の文字等の指標により評価することにより、評価結果を容易に把握することができる。 According to the third aspect of the present invention, the evaluation result can be easily grasped by evaluating the user's sensibility by using numerical values or indexes such as predetermined characters.
請求項4に記載された発明は、前記嗜好特性パターン抽出手段により抽出された内容、前記階層構造推定手段により得られる推定結果、及び感性推測手段により得られる感性推測結果のうち、少なくとも1つを表示手段に表示するための画面を生成する画面生成手段を有することを特徴とする。 According to a fourth aspect of the present invention, at least one of the content extracted by the preference characteristic pattern extraction unit, the estimation result obtained by the hierarchical structure estimation unit, and the sensitivity estimation result obtained by the sensitivity estimation unit is provided. It has the screen generation means which produces | generates the screen for displaying on a display means, It is characterized by the above-mentioned.
請求項4記載の発明によれば、各種実行内容を容易に把握することができる。
According to the invention of
請求項5に記載された発明は、ユーザが使用する感性評価対象物の使用中及び使用後の感性を推測するための感性推測方法において、予め設定された階層型ニューラルネットワークのスケルトン学習法を用いて、複数の感性項目に対する所定の総合評価を得る嗜好特性パターン毎に分類を行う嗜好特性パターン抽出ステップを有することを特徴とする。
The invention described in
請求項5記載の発明によれば、非線形型であるニューラルネットワークを用いることにより、物理モデルがない感性に対する推測を有効に行うことができる。また、総合評価に影響を与える入力の感性評価のユーザ毎の個人差を反映して高精度に感性推測を行うことができる。 According to the fifth aspect of the invention, by using a neural network that is a non-linear type, it is possible to effectively make an inference on sensitivity without a physical model. In addition, it is possible to estimate the sensitivity with high accuracy by reflecting the individual difference for each user in the input sensitivity evaluation that affects the comprehensive evaluation.
請求項6に記載された発明は、前記感性評価対象物に対する基剤物性情報を入力する入力ステップと、前記複数の感性項目を用いて前記ユーザの前記感性評価対象物に対する感性を階層化する階層構造推定ステップと、前記入力手段により得られる基剤物性情報と、前記階層構造推定ステップにより得られる階層構造とに基づいて、前記嗜好特性パターン抽出ステップにより得られた分類に対する前記感性評価対象物への感性を推測する感性推測ステップとを有することを特徴とする。 The invention described in claim 6 includes an input step of inputting base material property information for the sensitivity evaluation object, and a hierarchy for hierarchizing the sensitivity of the user to the sensitivity evaluation object using the plurality of sensitivity items. Based on the structure estimation step, the base physical property information obtained by the input means, and the hierarchical structure obtained by the hierarchical structure estimation step, to the sensitivity evaluation object for the classification obtained by the preference characteristic pattern extraction step A susceptibility estimation step for estimating the sensibility.
請求項6記載の発明によれば、基剤物性情報から一般消費者であるユーザの感性を高精度且つ効率的に推測することができる。 According to the sixth aspect of the present invention, the sensitivity of the user who is a general consumer can be estimated with high accuracy and efficiency from the base material property information.
請求項7に記載された発明は、前記感性推測ステップにより得られる感性推測結果を、予め設定された評価指標に対応させて感性を評価する感性評価ステップを有することを特徴とする。
The invention described in
請求項7記載の発明によれば、ユーザの感性を数値化や所定の文字等の指標により評価することにより、評価結果を容易に把握することができる。 According to the seventh aspect of the present invention, the evaluation result can be easily grasped by evaluating the user's sensibility by using numerical values or indexes such as predetermined characters.
請求項8に記載された発明は、前記嗜好特性パターン抽出ステップにより抽出された内容、前記階層構造推定ステップにより得られる推定結果、及び感性推測ステップにより得られる感性推測結果のうち、少なくとも1つを表示手段に表示するための画面を生成する画面生成ステップを有することを特徴とする。
In the invention described in
請求項8記載の発明によれば、各種実行内容を容易に把握することができる。 According to the eighth aspect of the invention, various execution contents can be easily grasped.
請求項9に記載された発明は、コンピュータを、請求項1乃至4の何れか1項に記載の感性推測装置として機能させることを特徴とする感性推測プログラムである。
The invention described in
請求項9記載の発明によれば、非線形型であるニューラルネットワークを用いることにより、物理モデルがない感性に対する推測を有効に行うことができる。また、総合評価に影響を与える入力の感性評価のユーザ毎の個人差を反映して高精度に感性推測を行うことができる。また、プログラムをインストールすることにより、汎用のパーソナルコンピュータ等で本発明における感性推測処理を容易に実現することができる。 According to the ninth aspect of the invention, by using a neural network that is a non-linear type, it is possible to effectively make an inference on sensitivity without a physical model. In addition, it is possible to estimate the sensitivity with high accuracy by reflecting the individual difference for each user in the input sensitivity evaluation that affects the comprehensive evaluation. Also, by installing the program, the sensitivity estimation process according to the present invention can be easily realized by a general-purpose personal computer or the like.
本発明によれば、ユーザ(顧客)の感性を高精度且つ効率的に推測することができる。 According to the present invention, the sensitivity of a user (customer) can be estimated with high accuracy and efficiency.
<本発明について>
本発明は、皮膚に塗布する化粧品や医薬品(皮膚外用剤)等の感性評価対象物における使用性等の感性評価において、処方や製品の物性やユーザ(一般消費者)に対するアンケート結果を予め解析することにより、ユーザが感性評価対象物を使用した時の感性を推測するシステムを提供する。
<About the present invention>
The present invention pre-analyzes prescriptions, physical properties of products, and questionnaire results for users (general consumers) in sensitivity evaluation such as usability in sensitivity evaluation objects such as cosmetics and pharmaceuticals (skin external preparations) applied to the skin. By this, the system which estimates the sensitivity when a user uses the sensitivity evaluation object is provided.
このとき、本発明では、例えば非線形処理を用いて物性値と感性との関連性を推定するため、ニューラルネットワーク等を用いて処方・感性評価対象製品等に対する物性からユーザが実感する使用性(感性)を予測する。 At this time, in the present invention, for example, in order to estimate the relationship between the physical property value and the sensibility using nonlinear processing, the usability (sensitivity) that the user feels from the physical properties of the prescription / sensitivity evaluation target product using a neural network or the like. ).
なお、通常、触感を対象とした感性評価には、個人差が大きい。そのため、本発明では、ユーザを、例えばスケルトン学習法を用いたグループ分類法により嗜好特性別に分類し、感性の階層構造と関連付けて感性推測に利用する。 Note that there are usually large individual differences in sensitivity evaluation for tactile sensation. Therefore, in the present invention, users are classified according to preference characteristics by, for example, a group classification method using a skeleton learning method, and are used for sensitivity estimation in association with a hierarchical structure of emotions.
なお、上述した嗜好特性とは、例えばユーザにおいては、使用感の微差がわかる人や使用感の微差を感じない人等が存在するため、感性に対する嗜好や感度の個人差(嗜好特性)に応じたグループ分類を行う。これにより、個人差を反映して感性推測精度を向上させることができる。 Note that the above-described preference characteristics include, for example, users who have a slight difference in feeling of use and those who do not feel a difference in feeling of use. Perform group classification according to Thereby, sensitivity estimation accuracy can be improved reflecting individual differences.
また、本発明では、上述した感性の階層構造を評価に反映させる。具体的には、感性の階層構造として複数の異なる感性項目(例えば、「浅い感性」、「深い感性」等)を階層的に関連付ける。また、1つの「深い感性」に対する感じ方にも個人差があるため、上述したように、嗜好特性別に感性の階層構造を解明し、「浅い感性」と「深い感性」を明確化する。更に、本発明では、基剤物性情報等からユーザが感性評価対象物を使用した時の感性を推測できるようにする。なお、本発明における感性項目は、例えばユーザが使用する感性評価対象物等に応じて予め複数設定しておくことができる。また、感性項目は、「浅い感性」、「深い感性」等の名称に限定されるものではなく、所定の数値やパラメータ等を用いて任意に設定することができる。 In the present invention, the above-described hierarchical structure of sensitivity is reflected in the evaluation. Specifically, a plurality of different sensitivity items (for example, “shallow sensitivity”, “deep sensitivity”, etc.) are hierarchically related as the hierarchical structure of sensitivity. In addition, since there is individual difference in how to feel one “deep sensibility”, as described above, the hierarchical structure of sensibilities is clarified for each preference characteristic, and “shallow sensibility” and “deep sensibility” are clarified. Further, according to the present invention, the sensitivity when the user uses the sensitivity evaluation object can be estimated from the physical property information of the base. Note that a plurality of sensitivity items in the present invention can be set in advance according to, for example, a sensitivity evaluation object used by the user. The sensitivity items are not limited to names such as “shallow sensitivity” and “deep sensitivity”, and can be arbitrarily set using predetermined numerical values, parameters, and the like.
以下に、本発明における感性推測装置、感性推測方法、及び感性推測プログラムを好適に実施した形態について、図面を用いて説明する。なお、以下に示す実施形態では、感性評価対象物の一例として皮膚に塗布する化粧品を用いるが、本発明においてはこれに限定されるものではない。 DESCRIPTION OF EMBODIMENTS Embodiments of a sensitivity estimation device, a sensitivity estimation method, and a sensitivity estimation program according to the present invention will be described below with reference to the drawings. In the embodiment described below, cosmetics applied to the skin are used as an example of the sensitivity evaluation target, but the present invention is not limited to this.
<感性推測装置:機能構成例>
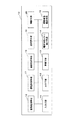
本実施形態における感性推測装置の機能構成例について図を用いて説明する。図1は、本実施形態における感性推測装置の機能構成の一例を示す図である。図1に示す感性推測装置10は、入力手段11と、出力手段12と、蓄積手段13と、嗜好特性パターン抽出手段14と、階層構造推定手段15と、感性推測手段16と、感性評価手段17と、画面生成手段18と、送受信手段19と、制御手段20とを有するよう構成されている。
<Sensitivity estimation device: functional configuration example>
A functional configuration example of the sensitivity estimation apparatus according to the present embodiment will be described with reference to the drawings. FIG. 1 is a diagram illustrating an example of a functional configuration of the sensitivity estimation apparatus according to the present embodiment. The
入力手段11は、予め設定された基剤物性情報を入力したり、化粧品等を使用するユーザ等を所定の条件等に基づいて嗜好特性パターンを抽出する嗜好特性パターン抽出指示や、階層構造を推定する階層構造推定指示、感性を推測する感性推測指示、最終的に感性を評価する感性評価指示、画面生成指示、送受信指示等の各種指示の入力を受け付ける。なお、入力手段11は、例えばキーボードや、マウス等のポインティングデバイス等からなる。
The input means 11 inputs preset physical property information, or a preference characteristic pattern extraction instruction for extracting a preference characteristic pattern based on a predetermined condition or the like for a user who uses cosmetics or the like, or estimates a hierarchical structure Input of various instructions such as a hierarchical structure estimation instruction, a sensitivity estimation instruction for estimating sensitivity, a sensitivity evaluation instruction for finally evaluating sensitivity, a screen generation instruction, and a transmission / reception instruction is accepted. Note that the
なお、本実施形態における基剤物性情報とは、例えば静的特性であれば、粘度や接触角等であり、動的特性であれば、転がり摩擦や表面摩擦等である。 The base physical property information in the present embodiment is, for example, a viscosity or a contact angle if it is a static characteristic, and is a rolling friction or a surface friction if it is a dynamic characteristic.
更に、転がり摩擦であれば、仕上がり後の平均値や乾き際のピーク値等の所定の条件に対してそれぞれの物性値を入力することができ、摩擦係数についても仕上がり後の平均値や乾き際のピーク値、塗布直後の平均値等の所定の条件に対してそれぞれの物性値を入力することができる。なお、入力手段11により入力される基剤物性情報値は、既存の測定装置等から得られる値を入力してもよく、感性推測処理の実行者等により手入力してもよい。
In addition, for rolling friction, it is possible to input the respective physical property values with respect to predetermined conditions such as the average value after finishing and the peak value when drying, and the friction coefficient is also the average value after finishing and when drying Each physical property value can be input with respect to a predetermined condition such as a peak value of 1 and an average value immediately after coating. In addition, the base physical property information value input by the
また、入力手段11は、外部装置等により基剤物性値の各種データを入力したり、設定された後述するニューラルネットワークの学習データ等を入力することもできる。 The input means 11 can also input various data of the physical property values of the base material by an external device or the like, or input learning data of a set neural network to be described later.
出力手段12は、入力手段11により入力された内容や、入力内容に基づいて実行された内容等の表示・出力等を行う。なお、出力手段12は、ディスプレイやスピーカ等からなる。更に、出力手段12は、プリンタ等の機能を有していてもよく、その場合には画面生成手段18により生成される画面の内容等を、紙等の印刷媒体に印刷してユーザ等に提示することもできる。
The
蓄積手段13は、予め設定された各種の基剤物性情報や、本実施形態にて使用されるニューラルネットワークの各種データ、嗜好特性パターン抽出結果、階層構造推定結果、感性推測結果、感性評価結果、生成された画面等の各種データを蓄積する。 The storage means 13 is a variety of preset physical property information, various neural network data used in the present embodiment, preference characteristic pattern extraction results, hierarchical structure estimation results, sensitivity estimation results, sensitivity evaluation results, Accumulate various data such as generated screens.
また、蓄積手段13は、送受信手段19により取得される上述した各種情報等も蓄積する。更に、蓄積手段13は、必要に応じて蓄積されている各種データを読み出すことができる。
The
嗜好特性パターン抽出手段14は、予め設定される感性の個人差(嗜好特性)に応じて、複数ユーザのグループ分類を行う。具体的には、嗜好特性パターン抽出手段14は、ユーザの嗜好特性パターン別に分類し、例えば「浅い感性」と「深い感性」の階層構造別、又は感性評価と総合評価の関連性別等にユーザを分類する。なお、嗜好特性パターン抽出手段14における分類手法の詳細については、後述する。
The preference characteristic
階層構造推定手段15は、例えば化粧品等をユーザに塗布した場合に得られる予め設定された感性項目と総合評価結果との関係を複数の階層により階層化する。具体的には、階層構造推定手段15は、例えば階層型ニューラルネットワーク等を用いて、予め設定された塗布直後における複数の感性項目を入力ノードとし、総合評価点を出力ノードとしたニューラルネットワークを構築する。 The hierarchical structure estimation means 15 stratifies the relationship between preset sensitivity items obtained when, for example, cosmetics or the like are applied to the user, and the comprehensive evaluation result by a plurality of layers. Specifically, the hierarchical structure estimation means 15 uses, for example, a hierarchical neural network or the like to construct a neural network having a plurality of sensitivity items immediately after application as input nodes and an overall evaluation point as an output node. To do.
このように、嗜好特性パターン別に感性の階層構造の解明を実施することで、例えば、「浅い感性」及び「深い感性」のような複数の階層の構造を明確化することができ、1つの「深い感性」に対する感じ方の個人差を明確にし、感性評価精度を向上させることができる。なお、本実施形態では、例えば上述した「浅い感性」及び「深い感性」のような2階層のみの表現にすることにより、人の感性評価の過程をシンプルに表現することができるが、本発明における階層数については、これに限定されるものではない。階層構造推定手段15における階層構造推定手法の詳細については、後述する。 Thus, by elucidating the hierarchical structure of sensibilities for each preference characteristic pattern, for example, the structure of multiple hierarchies such as “shallow sensibility” and “deep sensibility” can be clarified. It is possible to clarify individual differences in how to feel “deep sensitivity” and improve sensitivity evaluation accuracy. In this embodiment, for example, the process of human sensitivity evaluation can be simply expressed by using only two layers such as “shallow sensitivity” and “deep sensitivity” described above. The number of hierarchies in is not limited to this. Details of the hierarchical structure estimation method in the hierarchical structure estimation means 15 will be described later.
感性推測手段16は、物性値から感性を推定する。例えば、通常「浅い感性」は、例えばしっとり、つるつる等、皮膚の感覚器で直接感じるものであるため、基剤物性値に変換しやすい。そこで、感性推測手段16は、階層構造推定手段15により得られる結果等の予め設定される条件に基づいて、「浅い感性」と基剤物性情報である物性値との相関関係を推定する。このように、感性の階層構造を推定することにより、「浅い感性」を決定することができる。 The sensitivity estimation means 16 estimates sensitivity from physical property values. For example, “shallow sensibility” is usually directly felt by a sensory organ of the skin, such as moist and smooth, and thus can be easily converted into a base material property value. Therefore, the sensitivity estimation means 16 estimates the correlation between the “shallow sensitivity” and the physical property value as the base physical property information based on preset conditions such as the result obtained by the hierarchical structure estimation means 15. Thus, “shallow sensibility” can be determined by estimating the sensibility hierarchical structure.
これにより、「浅い感性」と「基剤物性値」とを関係付けることが可能となるため、処方開発に活用するし易くなり、例えばアンケートを行う際にもアンケート項目を削減することができ、感度の良いアンケートを提案することができる。なお、感性推測手段16における感性推測手法については、後述する。 This makes it possible to relate “shallow sensibility” and “base physical property value”, so that it is easy to utilize for prescription development, for example, when conducting a questionnaire, it is possible to reduce questionnaire items, A highly sensitive questionnaire can be proposed. The sensitivity estimation method in the sensitivity estimation means 16 will be described later.
感性評価手段17は、感性推測手段16により得られる感性推測結果を予め設定された評価指標に対応させて感性を総合的に評価する。なお、感性評価手段17は、評価結果として、例えば「この化粧品が好き/嫌い」、「使用性が良好/不良」等のように、予め設定された複数の総合評価項目の指標の中から何れかを選択させる場合であってもよく、また「好感度95%」、「好感度レベル8(10段階評価)」等のように予め設定された指標に基づき数値化した結果であってもよい。 The sensitivity evaluation means 17 comprehensively evaluates the sensitivity by matching the sensitivity estimation result obtained by the sensitivity estimation means 16 with a preset evaluation index. It should be noted that the sensibility evaluation means 17 gives an evaluation result as one of a plurality of preset comprehensive evaluation item indexes such as “I like / dislike this cosmetic”, “Good / bad usability”, etc. May be selected, or may be the result of quantification based on a preset index such as “favorability 95%”, “favorability level 8 (10-step evaluation)”, etc. .
画面生成手段18は、本実施形態における感性推測装置10の各機能構成で実行するために必要なデータの入力や、実行結果の出力、エラー時の通知等の各種画面を生成し、生成した画面をディスプレイ等の出力手段12に出力する。具体的には、画面生成手段18は、嗜好特性パターン抽出手段14により得られる嗜好特性パターンの内容、階層構造推定手段15により得られる推定結果、感性推測手段16により得られる感性推測結果、及び感性評価手段17により得られる感性評価結果等のうち、少なくとも1つを出力手段12に表示するための画面を生成する。
The screen generation means 18 generates various screens such as data input necessary for execution by each functional configuration of the
送受信手段19は、通信ネットワーク等により接続された外部装置等から本実施形態における完成推測処理に必要な各種データを入力したり、感性推測装置10により実行された各種実行結果を外部装置に出力することができる。
The transmission / reception means 19 inputs various data necessary for completion estimation processing in the present embodiment from an external device connected by a communication network or the like, and outputs various execution results executed by the
制御手段18は、感性推測装置10の各構成部全体の制御を行う。具体的には、制御手段18は、例えばユーザ等による入力手段11からの各種指示情報等に基づいて、嗜好特性パターン抽出処理や階層構造推定処理、感性推測処理、感性評価処理、画面生成処理、送受信処理等の各制御を行う。
The control means 18 controls the entire components of the
<感性推測装置10:ハードウェア構成>
ここで、上述した感性推測装置10においては、各機能をコンピュータに実行させることができる実行プログラム(感性推測プログラム)を生成し、例えば汎用のパーソナルコンピュータ、サーバ等にその実行プログラムをインストールすることにより、本発明における感性推測処理等を実現することができる。ここで、本実施形態における感性推測処理が実現可能なコンピュータのハードウェア構成例について図を用いて説明する。
<Sensitivity estimation device 10: hardware configuration>
Here, in the
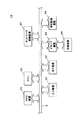
図2は、本実施形態における感性推測処理が実現可能なハードウェア構成の一例を示す図である。図2におけるコンピュータ本体には、入力装置31と、出力装置32と、ドライブ装置33と、補助記憶装置34と、メモリ装置35と、各種制御を行うCPU(Central Processing Unit)36と、ネットワーク接続装置37とを有するよう構成されており、これらはシステムバスBで相互に接続されている。
FIG. 2 is a diagram illustrating an example of a hardware configuration capable of realizing the sensitivity estimation process according to the present embodiment. 2 includes an
入力装置31は、ユーザ等が操作するキーボード及びマウス等のポインティングデバイスを有しており、ユーザ等からのプログラムの実行等、各種操作信号を入力する。また、入力装置31は、ネットワーク接続装置37等に接続された外部装置から通信ネットワークを介して得られる、外部装置等で既に測定された基剤物性情報やニューラルネットワークで使用する学習データ等の各種データを入力することもできる。
The
出力装置32は、本発明における処理を行うためのコンピュータ本体を操作するのに必要な各種ウィンドウやデータ等を表示するディスプレイを有し、CPU36が有する制御プログラムによりプログラムの実行経過や結果等を表示することができる。また、出力装置32は、上述の処理結果等を紙等の印刷媒体に印刷して、ユーザ等に提示することができる。
The
ここで、本発明においてコンピュータ本体にインストールされる実行プログラムは、例えば、USB(Universal Serial Bus)メモリやCD−ROM、DVD等の可搬型の記録媒体38等により提供される。プログラムを記録した記録媒体38は、ドライブ装置33にセット可能であり、記録媒体38に含まれる実行プログラムが、記録媒体38からドライブ装置33を介して補助記憶装置34にインストールされる。
Here, the execution program installed in the computer main body in the present invention is provided by, for example, a
補助記憶装置34は、ハードディスク等のストレージ手段であり、本発明における実行プログラムや、コンピュータに設けられた制御プログラム等を蓄積し必要に応じて入出力を行うことができる。
The
メモリ装置35は、CPU36により補助記憶装置34から読み出された実行プログラム等を格納する。なお、メモリ装置35は、ROM(Read Only Memory)やRAM(Random Access Memory)等からなる。
The
CPU36は、OS(Operating System)等の制御プログラム、及びメモリ装置35に格納されている実行プログラムに基づいて、各種演算や各ハードウェア構成部とのデータの入出力等、コンピュータ全体の処理を制御して各処理を実現することができる。なお、プログラムの実行中に必要な各種情報等は、補助記憶装置34から取得することができ、また実行結果等を格納することもできる。
The
ネットワーク接続装置37は、通信ネットワーク等と接続することにより、実行プログラムを通信ネットワークに接続されている他の端末等から取得したり、プログラムを実行することで得られた実行結果又は本発明における実行プログラム自体を他の端末等に提供することができる。
The
また、ネットワーク接続装置37は、通信ネットワークに接続された外部装置により既に測定された基剤物性値や学習されたニューラルネットワーク等で用いられる各種データを取得することもできる。
The
上述したようなハードウェア構成により、本発明における感性推測処理を実行することができる。また、プログラムをインストールすることにより、汎用のパーソナルコンピュータ等で本発明における感性推測処理を容易に実現することができる。 With the hardware configuration as described above, the sensitivity estimation process according to the present invention can be executed. Also, by installing the program, the sensitivity estimation process according to the present invention can be easily realized by a general-purpose personal computer or the like.
<感性推測処理手順>
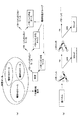
次に、本実施形態における感性推測処理手順について説明する。図3は、本実施形態における感性評価対象物塗布後の感性推測処理手順の一例を示すフローチャートである。なお、以下の説明では、感性評価対象物の一例として化粧品を用いることとするが、本発明においてはこれに限定されるものではない。
<Sensibility estimation processing procedure>
Next, the sensitivity estimation processing procedure in this embodiment will be described. FIG. 3 is a flowchart showing an example of a sensitivity estimation processing procedure after application of the sensitivity evaluation object in the present embodiment. In the following description, cosmetics are used as an example of the sensitivity evaluation target, but the present invention is not limited to this.
図3に示す感性推測処理手順は、まず感性を推定する化粧品に対する複数のユーザの感性評価情報を入力し(S01)、入力された感性評価情報から嗜好特性パターンを抽出する(S02)。また、化粧品をユーザに塗布した場合に得られる予め設定された感性項目と、総合的な評価結果との関係を複数の階層により階層化し、感性に対して階層構造を推定する(S03)。 In the sensitivity estimation processing procedure shown in FIG. 3, first, sensitivity evaluation information of a plurality of users for cosmetics whose sensitivity is estimated is input (S01), and a preference characteristic pattern is extracted from the input sensitivity evaluation information (S02). Further, the relationship between preset sensitivity items obtained when cosmetics are applied to the user and the overall evaluation result is hierarchized by a plurality of hierarchies, and a hierarchical structure is estimated for the sensitivity (S03).
また、基剤物性情報を入力する(S04)。なお、基剤物性情報は、蓄積手段13等に既に蓄積されている基剤物性情報から感性推測に必要な情報のみを読み出して用いてもよい。
In addition, base physical property information is input (S04). Note that the base material property information may be used by reading out only information necessary for sensitivity estimation from the base material property information already stored in the
次に、S03の処理において推定された階層構造を用いて、S04の処理により得られる基剤物性情報に対する感性を推測し(S05)、推測された結果に基づいて感性を評価する(S06)。 Next, using the hierarchical structure estimated in the process of S03, the sensitivity to the base physical property information obtained by the process of S04 is estimated (S05), and the sensitivity is evaluated based on the estimated result (S06).
次に、上述までの各処理により得られる結果(推定・評価結果)をディスプレイ等の出力手段12等に表示するための画面を生成し(S07)、生成した画面を出力する(S08)。 Next, a screen for displaying the results (estimation / evaluation results) obtained by the above-described processes on the output means 12 such as a display is generated (S07), and the generated screen is output (S08).
ここで、感性推測処理を終了するか否かを判断し(S09)、終了しない場合(S09において、NO)、S01に戻り、他の感性評価情報や基剤物性情報等を入力して後続の処理を行う。また、S09の処理において、ユーザ等からの終了指示等に基づき、処理を終了する場合(S09において、YES)、感性推測処理を終了する。なお、上述の処理においては、S01〜S03の処理とS04の処理の順序を入れ替えてもよい。 Here, it is determined whether or not to end the sensitivity estimation process (S09), and when it does not end (NO in S09), the process returns to S01 to input other sensitivity evaluation information, base physical property information, etc. Process. In the process of S09, when the process is terminated based on an end instruction from the user or the like (YES in S09), the sensitivity estimation process is terminated. In the above process, the order of the processes of S01 to S03 and the process of S04 may be switched.
上述した処理手順により、ユーザの感性を高精度且つ効率的に推測することができる。したがって、製品開発時に研究者の経験や勘に頼っていたユーザ等に期待する感性が推測可能となる。また、消費者アンケートを行わずに使用性が推測することが可能となるため効率的に感性推測を行うことができ、その結果を用いることで最終的な商品開発の時間を短縮させることができる。また、嗜好特性別にユーザを分類でき、ターゲット層の嗜好特性がわかる。更に、設計が難しかった「深い感性」を満足する化粧品の使用性が、基剤物性を指標として設計可能となる。 By the processing procedure described above, the user's sensitivity can be estimated with high accuracy and efficiency. Therefore, the sensibility expected from users who have relied on the experience and intuition of researchers at the time of product development can be estimated. In addition, usability can be estimated without conducting a consumer questionnaire, so it is possible to efficiently estimate sensitivity, and using the result can shorten the time for final product development. . In addition, users can be classified according to taste characteristics, and the taste characteristics of the target layer can be known. Furthermore, the usability of cosmetics that satisfy “deep sensibility” that has been difficult to design can be designed using the physical properties of the base as an index.
<本実施形態を用いた感性推測の具体例>
次に、上述した本実施形態を用いた感性推測の具体例について図を用いて説明する。図4は、本実施形態における感性推測処理の概要を説明するための図である。本実施形態では、例えばユーザを嗜好特性パターン別に分類したグループ毎に図4に示すような基剤物性と感性との関係性を体系化する。
<Specific example of sensitivity estimation using this embodiment>
Next, a specific example of sensitivity estimation using the above-described embodiment will be described with reference to the drawings. FIG. 4 is a diagram for explaining the outline of the sensitivity estimation process in the present embodiment. In the present embodiment, for example, the relationship between base physical properties and sensibilities as shown in FIG. 4 is systematized for each group in which users are classified according to preference characteristic patterns.
例えば、図4では、一例として「基剤物性」、「浅い感性」、「深い感性」、及び「総合評価」の4つの項目における関係性を示している。つまり、本実施形態では、1つの階層からなる基剤物性に対して複数の階層からなる感性項目(図4の例では、「浅い感性」及び「深い感性」)を用いてそれぞれの関係性を推定し、最終的に総合評価を行う。 For example, FIG. 4 shows the relationship in four items of “base physical properties”, “shallow sensitivity”, “deep sensitivity”, and “overall evaluation” as an example. That is, in the present embodiment, the relationship between each of the base physical properties consisting of one level is expressed using sensitivity items consisting of a plurality of levels (in the example of FIG. 4, “shallow sensitivity” and “deep sensitivity”). Estimate and finally make a comprehensive evaluation.
なお、「基剤物性」としては、例えば「粘度」、「接触角」等の静的特性や、「転がり摩擦」、「表面摩擦」等の動的特性等であり、「浅い感性」としては、「さっぱり感」、「しっとり感」、「べたつき感」、「つるつる感」等であり、「深い感性」としては、「浸透感」、「はり感」等であり、「総合評価」としては、「この化粧品が好き!」等である。また、図4における丸印(「〇」)は、各項目間における中間ノードを示している。 The “base physical properties” include, for example, static properties such as “viscosity” and “contact angle”, and dynamic properties such as “rolling friction” and “surface friction”, and “shallow sensitivity” includes , “Feel fresh”, “moist”, “sticky”, “smooth”, etc. “deep sensibility” includes “penetration”, “feel”, etc. , "I like this cosmetic!" In addition, a circle (“◯”) in FIG. 4 indicates an intermediate node between items.
このように、上述した各項目間を関連付けることで、処方開発者の経験や勘に頼っていたユーザに期待する使用性、効果実感等の感性を高精度且つ効率的に推測することが可能となる。 In this way, by associating the above-mentioned items, it is possible to accurately and efficiently estimate the sensibility such as usability and effect feeling expected from the user who relied on the experience and intuition of the prescription developer. Become.
なお、それぞれの各項目における具体的な内容については、上述した内容に限定されるものではない。また、上述したような複数の要素が複雑化した感性に対する関連性を用いた推測手法としては、例えばニューラルネットワーク解析手法等を用いることができる。 In addition, about the specific content in each item, it is not limited to the content mentioned above. Further, as the estimation method using the relevance to the sensibility in which a plurality of elements are complicated as described above, for example, a neural network analysis method or the like can be used.
<本実施形態に用いられるニューラルネットワーク>
ここで、本実施形態に用いられるニューラルネットワークについて説明する。ニューラルネットワークは、複雑な関係性を有する入力と出力の相関関係を解明することができるツールである。また、本実施形態において適用可能なニューラルネットワークの種類としては、例えば各素子の結合として階層型ニューラルネットワーク等があり、学習方法としては、バックプロバケーション等がある。
<Neural network used in this embodiment>
Here, the neural network used in this embodiment will be described. A neural network is a tool that can elucidate the correlation between input and output having a complicated relationship. In addition, as a type of neural network applicable in the present embodiment, for example, there is a hierarchical neural network or the like as a combination of elements, and a learning method includes back pro vacation or the like.
また、ニューラルネットワークは、「学習能力」及び「非線形性」という2つの大きな特徴を有している。「学習能力」としては、入力と出力の相関関係を表すネットワークパターンを自動形成することができる。例えば、相関関係が分かっている入力と出力を予め用意し、入力から出力が算出されるように重みを自動的に修正しネットワークパターンを形成する。また、このネットワークパターンに対して、本実施形態における1又は複数の基剤物性値を入力データとして入力することで、感性評価を推測する。 In addition, the neural network has two major characteristics of “learning ability” and “nonlinearity”. As “learning ability”, a network pattern representing the correlation between input and output can be automatically formed. For example, an input and an output whose correlation is known are prepared in advance, and the weight is automatically corrected so that the output is calculated from the input to form a network pattern. In addition, the sensitivity evaluation is estimated by inputting one or more base material property values in this embodiment as input data for the network pattern.
また、ニューラルネットワークは、「非線形性」であるため、データ分布等における前提条件が必要なく(線形の場合では、ガウス分布等のデータ分布が必要)、学習により定式化が困難な関係でも対応可能(線形の場合では、物理式で表現されなければならない)である。したがって、物理モデルがない感性の解析には、ニューラルネットワークの手法が有効である。 In addition, since neural networks are “non-linear”, no preconditions are necessary for data distribution, etc. (in the case of linear, data distribution such as Gaussian distribution is required), and it is possible to deal with relationships that are difficult to formulate by learning. (In the linear case, it must be expressed as a physical formula). Therefore, the neural network method is effective for sensitivity analysis without a physical model.
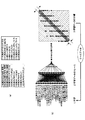
ここで、図5は、本実施形態における感性評価に必要な観点を説明するための図である。本実施形態では、図5(a)に示すように処方の物性値(粘度・摩擦等)に基づいて、嗜好特性別にユーザ分類を行って嗜好特性パターンを抽出し(図5(a)−(1))、感性の階層構造を推定し(図5(a)−(2))、それらの結果を踏まえて感性の推測(評価)を行う(図5(a)−(3))。 Here, FIG. 5 is a figure for demonstrating a viewpoint required for the sensitivity evaluation in this embodiment. In the present embodiment, as shown in FIG. 5A, based on the physical property values (viscosity, friction, etc.) of the prescription, a user characteristic is classified for each preference characteristic to extract a preference characteristic pattern (FIG. 5A- ( 1)), the hierarchical structure of sensitivity is estimated (FIGS. 5A to 5), and the sensitivity is estimated (evaluated) based on the results (FIGS. 5A to 3).
具体的には、図5(b)に示すように、所定の基剤物性値を含む化粧品をユーザの肌等の皮膚表面に塗布し、その結果を複数の分類分けされたユーザ毎に(図5(b)−(1))、浅い感性及び深い感性を階層的に推定し(図5(b)−(2))、その結果から感性推測を行う。 Specifically, as shown in FIG. 5 (b), a cosmetic containing a predetermined base property value is applied to the skin surface of the user's skin or the like, and the result is divided into a plurality of classified users (FIG. 5 (b)-(1)), shallow sensibility and deep sensibility are hierarchically estimated (FIG. 5 (b)-(2)), and sensitivity estimation is performed from the result.
なお、本実施形態では、上述した図5(a),(b)において、(1)では嗜好特性別のユーザ分類(嗜好特性パターン抽出)手法、(2)では感性の階層構造化手法、(3)では物性値から感性を推測する手法に対してそれぞれ上述したニューラルネットワークを用いて、上述した図4に示すような関連付けを行う。 In this embodiment, in FIGS. 5A and 5B described above, (1) is a user classification (preference characteristic pattern extraction) method by preference characteristic, (2) is a Kansei hierarchical structuring method, ( In 3), as shown in FIG. 4 described above, the above-described neural network is used for the method of estimating the sensitivity from the physical property value.
<嗜好特性パターン抽出手段14における嗜好特性パターン抽出手法>
次に、上述した嗜好特性パターン抽出手段14における嗜好特性パターン抽出手法について説明する。本実施形態では、一般消費者であるユーザが使用感の微差がわかる人や使用感の微差が感じない人、使用感に対してしっとりを好む人やさっぱりを好む人、浸透感に対してうるおいが必要である人やさっぱり感が必要である人等、感性に対する嗜好や感度に個人差があり、解析精度の向上のため、感性の個人差(嗜好特性)に応じたグループ分類を実施する。
<Preference Character Pattern Extraction Method in Preference Character
Next, a preference characteristic pattern extraction method in the above-described preference characteristic
具体的には、嗜好特性パターン抽出手段14により予め設定される嗜好特性パターン別にグループ分類が行われる。例えば、予め設定された感性の階層構造別に分類分けする場合には、「浅い感性」として「しっとり」及び「とろみ」と感じ、「深い感性」として「浸透感」と感じたユーザを1つのグループとして分類分けを行う。また、例えば、総合嗜好に寄与する感性パターン別で分類分けする場合には、「浅い感性」として「しっとり」及び「とろみ」と感じ、総合嗜好として「好きかどうか?」と感じたユーザを1つのグループとして分類分けを行う。
Specifically, group classification is performed for each preference characteristic pattern preset by the preference characteristic
このように、本実施形態では、例えば「浅い感性」と「深い感性」の階層構造別にユーザを分類したり、感性評価と総合評価の関連性別にユーザを分類することで、嗜好特性パターンを抽出する。なお、感性は非線形であるため、本実施形態では例えば階層型ニューラルネットワーク等を用いた手法を用いる。 As described above, in this embodiment, for example, users are classified according to the hierarchical structure of “shallow sensibility” and “deep sensibility”, or users are classified according to the relevance between the sensitivity evaluation and the comprehensive evaluation, thereby extracting the preference characteristic pattern. To do. Since the sensitivity is non-linear, this embodiment uses a technique using a hierarchical neural network, for example.
<嗜好特性パターン抽出に用いるニューラルネットワークの学習法>
ここで、本実施形態の嗜好特性パターン抽出に用いるニューラルネットワークの学習法について、具体的に説明する。
<Neural Network Learning Method for Preference Character Pattern Extraction>
Here, the learning method of the neural network used for the preference characteristic pattern extraction of the present embodiment will be specifically described.
通常、ニューラルネットワークの学習時には(学習誤差の2乗和)が最小となるように重みパラメータを調整する。なお、学習誤差とは、例えばニューラルネットワークによる推定値と教師値(教師データ)との差を意味する。 Normally, the weight parameter is adjusted so that (the square sum of learning errors) is minimized during learning of the neural network. Note that the learning error means, for example, a difference between an estimated value by a neural network and a teacher value (teacher data).
上述した従来法では、本来、出力ノードに対して影響を与えない入力ノードさえも利用して学習誤差の2乗和を最小するように重みパラメータを調整してしまう可能性がある。その結果、例えば、重みパラメータをグラフィカルなネットワーク構造で表現すると、値の大小が線の太さで表現された場合にネットワーク構造が複雑となり、各入力ノードが出力ノードに与える影響の解釈が困難となる。つまり、入力ノードと出力ノード間の相関関係を見出すことを目的とする場合には、従来法は適さない場合がある。 In the conventional method described above, there is a possibility that the weight parameter is adjusted so as to minimize the sum of squares of the learning error by using even the input node that does not affect the output node. As a result, for example, if the weight parameter is expressed by a graphical network structure, the network structure becomes complicated when the magnitude of the value is expressed by the line thickness, and it is difficult to interpret the influence of each input node on the output node. Become. That is, the conventional method may not be suitable for the purpose of finding the correlation between the input node and the output node.
一方、本実施形態におけるスケルトン学習法を用いることにより、学習時に、「(学習誤差の2乗和)+(ネットワーク構造の複雑さ)」が最小となるように重みパラメータを調整することで、ネットワーク構造をシンプルにすることができる。 On the other hand, by using the skeleton learning method in the present embodiment, the network can be adjusted by adjusting the weight parameter so that “(the sum of squares of learning error) + (complexity of network structure)” is minimized during learning. The structure can be simplified.
スケルトン学習法を用いることで、シンプルなネットワーク構造で表現することができ、各入力ノードが出力ノードに与える影響の方向や出力ノードに与える影響度の大きい入力ノードを理解しやすくなる。これは、シンプルなネットワーク構造の場合でも、その相関関係パターンにマッチする学習データの学習精度は高い結果となる。ここで、学習精度が低いデータは、当該相関関係パターン以外のパターンで表現されるべきデータと捉え、設定した学習閾値を境に、学習データを、パターンにマッチするデータ群(データグループ)、マッチしないデータ群に分けることができる。 By using the skeleton learning method, it is possible to express with a simple network structure, and it becomes easy to understand the direction of the influence of each input node on the output node and the input node having a large influence on the output node. This results in high learning accuracy of learning data that matches the correlation pattern even in the case of a simple network structure. Here, the data with low learning accuracy is regarded as data that should be expressed in a pattern other than the correlation pattern, and the learning data is matched with the pattern with the set learning threshold as a boundary (data group). Can be divided into data groups.
<スケルトン学習法を用いた複数のデータ群への分類手法>
ここで、スケルトン学習法を用いた複数のデータ群への分類手法の一例について説明する。上記分類手法としては、例えば、ニューラルネットワークにおける偏差総和の評価関数(Σ(Xi−Xi*)2、Xiは教師値、Xi*はニューラルネットワークの推測値)に、結合分散度(C・ΣWjk、Cは結合分散度重み係数、Wjkはノードjからノードkへの重みパラメータ値)を加えたスケルトン学習の評価関数E=Σ(Xi−Xi*)Σ+C・ΣWjkを用い、互いに共通の複数の入力ノードとなる因子及び当該因子から導出されて教師値となる結果を有する多数のデータに対して、上記評価関数Eにおける結合分散度重み係数Cに、「0<C<1」の範囲の値を設定して、上記スケルトン学習を行う。
<Classification method into multiple data groups using skeleton learning method>
Here, an example of a classification method into a plurality of data groups using the skeleton learning method will be described. As the classification method, for example, an evaluation function (Σ (Xi−Xi * ) 2 , Xi is a teacher value, Xi * is an estimated value of the neural network) of the sum of deviations in the neural network, and a joint dispersion degree (C · ΣW jk , C is a joint distribution weighting factor, W jk is a skeleton learning evaluation function E = Σ (Xi−Xi * ) Σ + C · ΣW jk with the addition of a weight parameter value from node j to node k) For a plurality of input nodes and a large number of data derived from the factors and having a result of being a teacher value, the coupling variance weighting coefficient C in the evaluation function E is “0 <C <1”. The range value is set and the skeleton learning is performed.
次に、上述した学習工程で得られた上記推測値に対して設定誤差範囲内に納まる上記教師値を有するデータ群と、上記設定誤差範囲から外れる上記教師値のデータ群とに仕分けする。次に、この仕分け工程において仕分けされた上記設定誤差範囲から外れる上記教師値のデータ群に対して、再度上記評価関数Eにおける結合分散度重み係数Cに「0<C<1」の範囲の値を設定して、上記スケルトン学習を行う工程を繰り返すことにより、上記因子の結果との間に共通のパターンを有する複数のデータ群に分類する。 Next, it sorts into the data group which has the said teacher value which falls within a setting error range with respect to the said estimated value obtained in the learning process mentioned above, and the data group of the said teacher value which remove | deviates from the said setting error range. Next, with respect to the teacher value data group that is out of the set error range sorted in this sorting step, the value of the range of “0 <C <1” is again set as the joint dispersion weight coefficient C in the evaluation function E. And repeating the process of performing the skeleton learning, the data is classified into a plurality of data groups having a common pattern with the result of the factor.
なお、上述した仕分け工程において分類された上記設定誤差範囲外の上記教師値を有するデータ群に対して、再度上記評価関数Eにおける結合分散度重み係数Cに「0<C<1」の範囲の値を設定して、上記スケルトン学習を行う学習工程を、全ての上記教師値が当該学習工程における設定誤差範囲内に納まるまで繰り返してもよい。 For the data group having the teacher value outside the setting error range classified in the sorting step described above, the coupling dispersion weight coefficient C in the evaluation function E is again in the range of “0 <C <1”. The learning step of setting the value and performing the skeleton learning may be repeated until all the teacher values are within the set error range in the learning step.
つまり、上述した手法では、従来のニューラルネットワークにおける偏差総和の評価関数に対し、更に結合分散度を加えた評価関数E=Σ(Xi−Xi*)2+C・ΣWjkを用い、まず全てのデータに対して、「0<C<1」の範囲の値を設定してスケルトン学習を行っている。これを換言すれば、上記スケルトン学習においては、上記偏差総和よりも結合分散度を小さくすることを重視した最適化処理を行っている。この結果、ニューラルネットにおけるノード間の弱い結合を消失させ、より強い結合のみを残すことができる。 In other words, the above-described method uses an evaluation function E = Σ (Xi−Xi * ) 2 + C · ΣW jk, which is obtained by adding a degree of joint dispersion to the evaluation function of the sum of deviations in the conventional neural network, On the other hand, skeleton learning is performed by setting a value in a range of “0 <C <1”. In other words, in the skeleton learning, an optimization process is performed with an emphasis on making the joint dispersion degree smaller than the sum of deviations. As a result, the weak connection between the nodes in the neural network can be eliminated and only a stronger connection can be left.
他方で、上記スケルトン学習によれば、結合分散度を小さくしてニューラルネット構造をシンプルにすることを重視することから、逆に偏差総和は大きな値となる。このため、教師値との差が大きい(すなわち、精度の悪い)推測値となるデータが多く存在することになる。 On the other hand, according to the skeleton learning described above, since it is important to make the neural network structure simple by reducing the degree of joint dispersion, the deviation sum becomes a large value. For this reason, there are many data that are estimated values having a large difference from the teacher value (that is, low accuracy).
そこで、各学習において、得られた推測値に対して設定誤差範囲内に納まる教師値を有するデータ群と、上記設定誤差範囲から外れる教師値のデータ群とに仕分けし、更に上記設定誤差範囲から外れる教師値にデータ群に対して、再度上記スケルトン学習を繰り返して、上記データ群を複数に分類することにより、各々の分類されたデータ群において消失したノード間の結合状態に基づいて、各々のデータ群が有する特異な入力ノード(因子)と教師値(結果)との関係パターンを取得することができ、共通のパターンを有する複数のグループに分類して評価を行うことができる。 Therefore, in each learning, a data group having a teacher value that falls within the setting error range with respect to the obtained estimated value is classified into a data group having a teacher value that falls outside the setting error range, and further from the setting error range. By repeating the skeleton learning again for the data group with the teacher value deviating and classifying the data group into a plurality of data, each of the classified data groups is based on the connection state between the lost nodes. Relationship patterns between specific input nodes (factors) and teacher values (results) included in the data group can be acquired, and evaluation can be performed by classifying into a plurality of groups having a common pattern.
ここで、アンケートに回答したモニターについても全員が同一嗜好パターンを有するとは限らないため、上述した手法をアンケート解析に適用することで、複数の嗜好パターンを抽出し、嗜好パターン毎に消費者の感性分析を行うことが可能となる。これにより、例えば、商品開発過程において、これまで消費者の嗜好は1つとして扱っていた従来方法と比較すると、分析が精密となり、推測精度を向上することができる。 Here, not all of the monitors that responded to the questionnaire have the same preference pattern. Therefore, by applying the above-described method to the questionnaire analysis, a plurality of preference patterns are extracted, and the consumer's Kansei analysis can be performed. Thereby, for example, in the product development process, the analysis becomes more precise and the estimation accuracy can be improved as compared with the conventional method which has been treated as one consumer preference so far.
ここで、図6は、本実施形態における階層型ニューラルネットワークを用いた関連付け手法を説明するための図である。また、図7は、本実施形態における分類分けについて具体的に説明するための図である。 Here, FIG. 6 is a diagram for explaining an association method using the hierarchical neural network in the present embodiment. FIG. 7 is a diagram for specifically explaining classification according to the present embodiment.
なお、図6(a)は、入力ノードとして塗布直後の18項目(感性項目)を示し、図6(b)は、図6(a)に示す入力ノードを用いたニューラルネットワークにより総合評価が得られるまでを示している。つまり、図6(b)は、塗布時の感性項目と総合評価結果との関係を示すものである。 6A shows 18 items (sensitivity items) immediately after application as input nodes, and FIG. 6B shows a comprehensive evaluation by a neural network using the input nodes shown in FIG. 6A. It shows until it is done. That is, FIG. 6B shows the relationship between the sensitivity items at the time of application and the comprehensive evaluation results.
図6(a)に示すように、塗布時の感性項目として、例えば、「(1)化粧水の色が好き:視覚」、「(2)化粧水の香りが好き:嗅覚」、「(3)化粧水の香りが強い:嗅覚」、「(4)化粧水がひんやりしている」、「(5)化粧水にとろみがある」、「(6)化粧水がまろやか」、「(7)化粧水にコクがある」、「(8)化粧水がぬめる」、「(9)化粧水がみずみずしい」、「(9)化粧水がなめらか」、「(10)化粧水がみずみずしい」、「(11)化粧水がやわらかくなる」、「(12)化粧水が肌によく広がる」、「(13)肌によく浸透する」、「(14)肌によくなじむ」、「(15)肌によくしみこむ」、「(16)化粧水がさっぱりしている」、「(17)化粧水がしっとりしている」、「(18)化粧水がべたつく」等である。なお、本発明については、上述した18項目の内容についてはこれに限定されるものではなく、項目数もこれに限定されるものではない。 As shown in FIG. 6A, as the sensitivity items at the time of application, for example, “(1) I like the color of lotion: visual”, “(2) I like the smell of lotion: smell”, “(3 ) Strong scent of lotion: olfaction "," (4) Lotion is cool "," (5) Lotion is thick "," (6) Lotion is mellow "," (7) “There is a lot of lotion”, “(8) Moisture lotion”, “(9) Moisture lotion”, “(9) Moisture lotion”, “(10) Moisture lotion”, “(11) Lotion softens”, “(12) Lotion spreads well on skin”, “(13) Skin penetrates well”, “(14) Skin blends well”, “(15) Skin "(16) Lotion is refreshing", "(17) Lotion is moist", "(18) Lotion is sticky" It is a V "and the like. In the present invention, the contents of the 18 items described above are not limited to this, and the number of items is not limited to this.
また、図6(b)に示すように、本実施形態におけるニューラルネットワークを用いた学習作業としては、まずニューラルネットワークでテスト結果を学習し(図6(b)−(1))、次に、学習データをトレースする(図6(b)−(2))。ここで、例えば推定誤差が所定の値(例えば、±5%等)を境に、ケースデータを分離する(図6(b)−(3))。次に、分離後のそれぞれのケースデータを用いて、上述した図6(b)−(1)の処理を行うことで学習を行う。 Further, as shown in FIG. 6B, as a learning operation using the neural network in the present embodiment, first, the test result is learned by the neural network (FIG. 6B- (1)), and then The learning data is traced (FIG. 6 (b)-(2)). Here, for example, the case data is separated when the estimation error is a predetermined value (for example, ± 5%) (FIG. 6 (b)-(3)). Next, learning is performed by performing the processing of FIGS. 6B to 6A described above using each case data after separation.
また、例えば図7(a)に示すように、上述したような処理により得られる学習データの各データケースのうち、嗜好A〜Cの3つの学習データケースがある場合には、最も大きい嗜好Aのケースを抽出する。また、学習データのうち、予め設定される「パターンにのるケース」であるか、又は「パターンにのらないケース」であるかによりグループ分けを行う。 Further, for example, as shown in FIG. 7A, among the data cases of the learning data obtained by the processing as described above, when there are three learning data cases of preferences A to C, the largest preference A Extract cases. Further, grouping is performed depending on whether the learning data is a “pattern case” or “pattern case” that is set in advance.
なお、上述したパターンとは、例えばXnを計測値として、「Y=a1*X1+a2*X2+a3*X3+・・・an*Xn」(係数:anが同じ値で表せること)の関係が成立することを示している。具体的に説明すると、上述した関数「Y=a1*X1+a2*X2+a3*X3+・・・an*Xn(Xiが入力値、Yが出力値)」において、関数の形は同じ(ニューラルネットワークの構造は同じ)であっても、係数aiの組合せが異なれば、同じXiのセットを与えても出力値Yは異なる値となる。つまり、係数aiの組合せが同じものを同一パターンとし、組合せが異なるものを異なるパターンとして扱う。
Note that the above-mentioned pattern, for example, the X n as a measurement value, "Y = a 1 * X 1 + a 2 *
上述したような分類分けを、図7(b)に示すように全パネルに対してそれぞれのパターン(例えば、パターンA,パターンB,パターンC等)で行うことにより、分類分けを行う(例えばGroup1,Group2等)。このように、ユーザの分類分けを行うことにより、総合評価に影響を与える入力の感性評価の個人差を抽出することができる。なお、図6等に示されるような本実施形態における内容は、画面生成手段18等により画面が生成され、出力手段12等により表示される。
As shown in FIG. 7B, the above-described classification is performed with respect to all panels with respective patterns (for example, pattern A, pattern B, pattern C, etc.), thereby performing classification (for example, Group1). ,
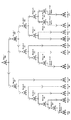
ここで、図8は、分類分けされた結果の一例を示す図である。また、図9は、図8に示す分類結果を表にしたものである。図8に示す例では、複数のユーザを12グループに分類分けされた結果(Group_1〜12)を示している。なお、図8には、先頭及び各経路で分岐された地点(Branch_1〜15)における学習データのケース数(アンケート数)と、最終的にグループ化された地点(Group_1〜12)における各グループに該当するデータのケース数(アンケート数)とを示している(合計1850)。 Here, FIG. 8 is a diagram illustrating an example of the classified result. FIG. 9 is a table showing the classification results shown in FIG. In the example shown in FIG. 8, the result (Group_1 to 12) obtained by classifying a plurality of users into 12 groups is shown. FIG. 8 shows the number of cases (number of questionnaires) of the learning data at the head and the branch points (Branch_1 to 15) on each route, and the groups at the finally grouped points (Group_1 to 12). The number of cases of the corresponding data (number of questionnaires) is shown (total 1850).
また、図9では、図8に対応させてグループ化されたグループ番号に対するケースデータ数とその割合が示されている。なお、図8,9等に示されるような本実施形態における分類分けされた結果は、画面生成手段18等により画面が生成され、出力手段12等により表示される。
In addition, FIG. 9 shows the number of case data and the ratio thereof with respect to the group numbers grouped in correspondence with FIG. Note that the classified results in the present embodiment as shown in FIGS. 8 and 9 are generated as a screen by the
本実施形態では、上述した処理を行うことで、例えば図9に示すように、合計1842の学習ケースを嗜好特性別に12グループに分類することができる。なお、図9の「out of Group」の8とは、何れのグループにも属さないケースが8個あったことを意味している。 In the present embodiment, by performing the above-described processing, for example, as shown in FIG. 9, a total of 1842 learning cases can be classified into 12 groups according to preference characteristics. Note that “out of group” 8 in FIG. 9 means that there are 8 cases that do not belong to any group.
本実施形態では、図9に示すように、グループ番号1,6,9,11,12の5つのグループで全ケースの約8割を占めるグルーピングを行うことができ、その他、予め設定された割合未満(図9の例では、2%未満)のグループを除いて、合計8個のグループ化を行うことができる。
In the present embodiment, as shown in FIG. 9, grouping that occupies approximately 80% of all cases with five groups of
<階層構造推定手段15における階層構造推定手法>
次に、上述した階層構造推定手段15における階層構造推定手法について具体的に説明する。図10は、本実施形態における階層構造推定手法を説明するための図である。
<Hierarchical structure estimation method in the hierarchical structure estimation means 15>
Next, the hierarchical structure estimation method in the hierarchical structure estimation means 15 described above will be specifically described. FIG. 10 is a diagram for explaining the hierarchical structure estimation method in the present embodiment.
本実施形態では、1つの「深い感性」に対する感じ方に個人差があり「浅い感性」と「深い感性」との解明が必要であったため、上述したようにユーザの嗜好特性別に感性の階層構造を推定し、「浅い感性」と「深い感性」との関連性を明確化する。 In the present embodiment, there is an individual difference in how to feel one “deep sensibility”, and it is necessary to clarify “shallow sensibility” and “deep sensibility”. Therefore, as described above, the hierarchical structure of sensibilities according to user preference characteristics And clarify the relationship between “shallow sensibility” and “deep sensibility”.
具体的には、感性の階層構造を解明するため、一例として上述した「浅い感性」から「浸透感」を予測するモデルの検討を行う。その一例として、本実施形態では「浸透感」に影響の高い感性評価を抽出する。具体的には、例えば階層構造の例では、「浅い感性」の「しっとり」及び「とろみ」から深い感性である「浸透感」を抽出する場合や、「浅い感性」である「さっぱり」及び「ひんやり」の深い感性である「浸透感」を抽出する場合に感性評価を高くする。 Specifically, in order to elucidate the hierarchical structure of sensibilities, a model that predicts “penetration sensation” from “shallow sensibility” described above as an example is examined. As an example, in this embodiment, a sensitivity evaluation having a high influence on “penetration feeling” is extracted. Specifically, for example, in the case of a hierarchical structure, when extracting “penetration” that is deep sensitivity from “moist” and “thoroughness” of “shallow sensibility”, “freshness” and “ Sensitivity evaluation is increased when extracting “penetration”, which is a deep sensibility.
つまり、図10に示すようにニューラルネットワークにより、浸透感以外の感性評価点を獲ている情報を入力して浸透感に関する感性評価点を抽出する。すなわち、「浸透感」に影響の高い感性評価を抽出する。なお、感性評価における影響度の解析手法としては、例えばウエイトパラメータ解析手法や感度解析手法等を用いることができる。 That is, as shown in FIG. 10, the neural network is used to input sensitivity evaluation points other than the penetrating sensation and extract the Kansei evaluation points related to the penetrating sensation. That is, a sensitivity evaluation having a high influence on “penetration” is extracted. For example, a weight parameter analysis method or a sensitivity analysis method can be used as an influence analysis method in sensitivity evaluation.
ここで、ウエイトパラメータ解析手法とは、例えば個々の入力ノードを出発点として出力ノードに到達するためのルート(ノード間のアローの組合せ)は、通常、複数存在するが、その各ノード間の経路(アロー)上にウエイトパラメータ値(Pij)を設定し、学習の結果、得られたウエイトパラメータ値を用いて、入力ノードから出力ノードに至る全てのアロー上のウエイトパラメータ値を乗じ、その値の大小により各入力ノードの出力ノードに対する影響度の大小を比較する解析手法である。 Here, the weight parameter analysis method, for example, usually has a plurality of routes (combinations of arrows between nodes) to reach the output node starting from each input node, but the route between the nodes. The weight parameter value (P ij ) is set on (arrow), the weight parameter value obtained as a result of learning is multiplied by the weight parameter value on all arrows from the input node to the output node, and the value This is an analysis method for comparing the magnitude of the influence of each input node on the output node according to the size of.
また、感度解析手法とは、複数ある入力ノードの中の特定の入力ノードの値を最小値から最大値まで変化(他の入力ノードの値は固定)させ、出力ノードの値がどの程度変わるか、及び、どのように変わるかを調べることで、その入力ノード値の出力ノードに対する感度を解析する手法である。 The sensitivity analysis method is a method that changes the value of a specific input node among multiple input nodes from the minimum value to the maximum value (the values of other input nodes are fixed), and how much the value of the output node changes. , And by examining how it changes, the sensitivity of the input node value to the output node is analyzed.
ここで、図11は、解析結果の一例を示す図である。なお、図11の例では、上述したGroup1に対して、スケルトン学習法で得られたニューラルネットワークから、出力ノードに対する入力ノードの影響度をウエイトパラメータ解析及び感度解析で解析した結果を示している。
Here, FIG. 11 is a diagram illustrating an example of the analysis result. In the example of FIG. 11, the influence of the input node on the output node is analyzed by weight parameter analysis and sensitivity analysis from the neural network obtained by the skeleton learning method for
図11では、上述した各手法における上位5位の評価結果を示しており、ウエイトパラメータ解析では、1位が「とろみがある」、2位が「ひんやりしている」、3位が「色が好き」、4位が「まろやか」、5位が「しっとりしている」となっており、感度解析では、1位が「香りが好き」、2位が「みずみずしい」、3位が「べたつく」、4位が「しっとりしている」、5位が「ひんやりしている」となっている。 FIG. 11 shows the top five evaluation results in each of the above-described methods. In the weight parameter analysis, the first place is “Thorough”, the second place is “Chilly”, and the third place is “Color”. Like, “No. 4” is “mellow”, No. 5 is “moist”, and in sensitivity analysis, No. 1 is “I like fragrance”, No. 2 is “fresh”, No. 3 is “sticky” The fourth place is “moist” and the fifth place is “cool”.
また、図11に示す各手法における上位5位の評価結果のうち、太文字で示されている部分は、感性評価点が上がると総合評価が下がる。 In addition, among the top five evaluation results in each method shown in FIG. 11, the overall evaluation of the portion indicated by bold letters decreases as the sensitivity evaluation score increases.
なお、この場合、例えば、上述の図9に示される分類分けされた12グループのうち、総合評価に対する嗜好特性により分類した人数の多い上位2グループで解析を行う。図12は、上位2グループにおける浸透感に影響する感性項目の一例を示している。なお、図12では、ウエイトパラメータ解析を用いたGroup1とGroup6の2つグループについて、予め設定された各感性評価項目に対する度数が示されている。なお、図12に示す各感性評価項目に対する度数において、プラスは好ましい数値を示し、マイナスは好ましくない数値を示し、0は影響しないことを示している。
In this case, for example, the analysis is performed in the top two groups having a large number of people classified according to the preference characteristic for the comprehensive evaluation among the 12 groups classified as shown in FIG. FIG. 12 shows an example of a sensitivity item that affects the penetration feeling in the top two groups. In FIG. 12, the frequency for each sensitivity evaluation item set in advance for the two groups of
図12に示すように、グループにより浸透感に影響する感性評価項目が異なっている。具体的に説明すると、例えば、Group1では、「肌によくしみこむ」かどうかや、「化粧水がさっぱりしてない」かどうか等により浸透感を判断している。一方、Group6では、「化粧水にコクがない」かどうかや「化粧水がひんやりしていない」かどうか、「肌によくなじむ」かどうか、等により浸透感を判断していることがわかる。
As shown in FIG. 12, the sensitivity evaluation items that affect the penetrating sensation are different depending on the group. More specifically, for example, in
つまり、本実施形態では、上述したウエイトパラメータ解析等により得られた結果から、各グループの特徴差を示すことができる。したがって、図12に示すように、分類された各グループに対して影響度の解析をすることにより、各グループの嗜好特性を把握することができる。また、本実施形態では、この嗜好特性の違いをグループ分類に適用することができる。 That is, in the present embodiment, the feature difference of each group can be shown from the result obtained by the above-described weight parameter analysis or the like. Therefore, as shown in FIG. 12, it is possible to grasp the preference characteristics of each group by analyzing the influence degree for each classified group. In the present embodiment, this difference in preference characteristics can be applied to group classification.
<感性推測手段16における感性推測手法>
次に、本実施形態における感性推測手段16における感性推測手法について、具体的に説明する。感性推測手段16では、例えば「基剤物性値」と「浅い感性」との関連性(相関関係)を見つけるべく、感性は非線形であるため、本実施形態ではニューラルネットワークを用いて感性推測を行う。
<Sensitivity estimation method in sensitivity estimation means 16>
Next, the sensitivity estimation method in the sensitivity estimation means 16 in this embodiment will be specifically described. In the sensitivity estimation means 16, the sensitivity is non-linear in order to find the relationship (correlation) between the “base property value” and the “shallow sensitivity”, for example, and in this embodiment, the sensitivity estimation is performed using a neural network. .
図13は、基剤物性と浅い感性との相関関係を説明するための図である。図13に示すように、本実施形態では、分類分けされたグループ毎(例えば、図13ではGroup1)に対して「(仕上がり後の平均値)転がり摩擦」、「(乾き際のピーク値)転がり摩擦」、「(仕上がり後の平均値)摩擦係数」、「(乾き際のピーク値)摩擦係数」、「(塗布直後の平均値)摩擦係数」、・・・、「粘度」等の基剤物性値からニューラルネットワークを用いて浅い感性である「さっぱり」の関係性を抽出する。
FIG. 13 is a diagram for explaining the correlation between the physical properties of the base and the shallow sensitivity. As shown in FIG. 13, in this embodiment, “(average value after finishing) rolling friction” and “(peak value at the time of drying) rolling for each classified group (for example,
ここで、図14は、基剤物性値と感性評価値との関係の一例を示す図である。なお、図14の例では、入力ノードを基剤物性値とし、出力ノードを感性評価値として、基剤物性値と感性評価値の関係を学習させた例を示している。また、図14(a)の構造は嗜好特性Group1の例を示し、図14(b)の構造は、嗜好特性Group6の例を示している。 Here, FIG. 14 is a diagram illustrating an example of the relationship between the base property value and the sensitivity evaluation value. The example of FIG. 14 shows an example in which the relationship between the base material property value and the sensitivity evaluation value is learned by using the input node as the base material property value and the output node as the sensitivity evaluation value. Further, the structure of FIG. 14A shows an example of the preference characteristic Group1, and the structure of FIG. 14B shows an example of the preference characteristic Group6.
また、図14(a),(b)の出力ノードにおいて、Aは粘度(mPa・s)、Bは表面張力(mN/m)、Cは摩擦係数(C1:塗布直後の平均値,C2:乾き際のピーク値,C3:仕上がり後の平均値)、Dは転がり摩擦(D1:乾き際のピーク値,D2:仕上がり後の平均値)を示している。 14A and 14B, A is the viscosity (mPa · s), B is the surface tension (mN / m), C is the coefficient of friction (C1: average value immediately after application, C2: Peak value upon drying, C3: average value after finishing), D indicates rolling friction (D1: peak value upon drying, D2: average value after finishing).
図14(a),(b)において、各ノード間の経路(アロー)の太さが重みパラメータの数値の大小を示している。また、実線が正の重みパラメータ値、点線が負の重みパラメータ値であることを示している。図14に示すようなグラフィック表示により、どの入力ノード項目が出力ノード項目に、どのように(プラス側/マイナス側に作用)影響を与えているかを視覚的に把握することができる。なお、このような画面は、上述した画面生成手段18により生成され、出力手段12により出力される。 14A and 14B, the thickness of the route (arrow) between the nodes indicates the magnitude of the weight parameter. Further, the solid line indicates a positive weight parameter value, and the dotted line indicates a negative weight parameter value. With the graphic display as shown in FIG. 14, it is possible to visually grasp which input node item has an influence on the output node item (how it acts on the plus side / minus side). Note that such a screen is generated by the screen generation means 18 described above and output by the output means 12.
これにより、基剤物性と浅い感性との関係を推測することができ、これらの推測結果を用いて基剤物性情報からユーザの感性を高精度且つ効率的に推測することができる。 Thereby, the relationship between a base physical property and shallow sensitivity can be estimated, and a user's sensitivity can be estimated with high precision and efficiency from base property information using these estimation results.
<画面例>
ここで、本実施形態における画面生成手段18により生成される画面例について、図を用いて説明する。図15は、本実施形態における生成画面の一例を示す図である。本実施形態における画面生成手段18では、例えば、嗜好特性パターン抽出手段14により抽出された内容、階層構造推定手段15により得られる推定結果、及び感性推測手段16により得られる感性推測結果のうち、少なくとも1つを表示手段に表示するための画面を生成する。
<Screen example>
Here, an example of a screen generated by the
図15に示す画面40では、成分A〜Xを入力する第1の入力領域41−1と、物性A〜Xの物性予測値を入力する第2の入力領域41−2とを有しており、各入力領域に感性推測を行う感性評価対象物に対する所定の数値等のデータを入力し、上述した感性推測処理を実行することで、例えば画面40に感性A〜Nの感性推測結果や、総合評価予測結果等を数値や文字等で表示することができる。なお、図15に示す画面40は、一例であり、レイアウトや画面生成される項目については、本発明においてはこれに限定されるものではない。
The
また、画面生成手段18により生成される画面についても、本発明においてはこれに限定されるものではなく、例えば上述した図6,8,9,12,14等の画面も生成して出力手段12等により出力することができる。 Further, the screen generated by the screen generation means 18 is not limited to this in the present invention. For example, the above-described screens of FIGS. Or the like.
上述したように、本実施形態によれば、基剤物性情報からユーザの感性を高精度且つ効率的に推測することができる。これにより、製品開発時に研究者の経験や勘に頼っていたユーザ等に期待する感性が推測可能となる。また、消費者アンケートを行う必要がなく感性を推測することが可能となるため、商品開発の時間を短縮させることができる。また、嗜好特性別にユーザを分類できるため、目的とするターゲット層の嗜好特性を高精度に把握することができる。更に、設計が難しかった「深い感性」を満足する化粧品の使用性を、基剤物性を指標として設計することが可能となる。 As described above, according to the present embodiment, the user's sensitivity can be estimated with high accuracy and efficiency from the base material property information. This makes it possible to estimate the sensibility expected of users who have relied on the experience and intuition of researchers at the time of product development. Moreover, since it is possible to estimate the sensibility without having to conduct a consumer questionnaire, the time for product development can be shortened. Further, since the users can be classified according to the preference characteristics, the target target taste characteristics can be grasped with high accuracy. Furthermore, it is possible to design the usability of a cosmetic that satisfies “deep sensibility” that has been difficult to design, using the physical properties of the base as an index.
なお、本願発明に適用可能な感性評価対象物とは、上述した化粧品や医薬品に限定されず、例えば飲食物や日用品、衣料品等、人間の5感(触覚、嗅覚、味覚、視覚、聴覚)で取得可能な感性に対して評価可能な製品まで広く含む。なお、その場合には、上述したニューラルネットワークは、各感性評価対象物に応じて学習データを選択して感性推測を行う。 The sensitivity evaluation target applicable to the invention of the present application is not limited to the above-described cosmetics and pharmaceuticals, but includes, for example, five human senses (tactile sense, smell sense, taste sense, visual sense, hearing sense) such as food and drink, daily necessities, and clothing items. This includes a wide range of products that can be evaluated for sensibilities that can be obtained through In this case, the neural network described above selects the learning data according to each sensitivity evaluation object and performs sensitivity estimation.
上述したように本発明によれば、基剤物性情報からユーザの感性を高精度且つ効率的に推測することができる。これにより、例えば、製品開発時に研究者の経験や勘に頼っていたユーザ等に期待する感性を本発明に基づいて高精度且つ効率的に推測することが可能となる。また、例えば消費者アンケートを行わずに使用性を推測することが可能となるため商品開発の時間を短縮することができる。また、嗜好特性別にユーザを分類することで、目的とするターゲット層の嗜好特性を高精度且つ効率的に把握することができる。更に、設計が難しかった「深い感性」を満足する感性評価対象物の使用性が基剤物性を指標に設計可能となる。 As described above, according to the present invention, the sensitivity of the user can be estimated with high accuracy and efficiency from the base material property information. Thereby, for example, it is possible to accurately and efficiently estimate the sensibility expected of a user who has relied on the experience and intuition of a researcher at the time of product development based on the present invention. In addition, for example, usability can be estimated without conducting a consumer questionnaire, so that product development time can be reduced. Further, by classifying users according to preference characteristics, it is possible to grasp the preference characteristics of the target layer to be obtained with high accuracy and efficiency. Furthermore, the usability of the sensitivity evaluation object that satisfies the “deep sensitivity” that has been difficult to design can be designed using the base physical properties as an index.
以上本発明の好ましい実施例について詳述したが、本発明は係る特定の実施形態に限定されるものではなく、特許請求の範囲に記載された本発明の要旨の範囲内において、種々の変形、変更が可能である。 The preferred embodiments of the present invention have been described in detail above, but the present invention is not limited to such specific embodiments, and various modifications, within the scope of the gist of the present invention described in the claims, It can be changed.
10 感性推測装置
11 入力手段
12 出力手段
13 蓄積手段
14 嗜好特性パターン抽出手段
15 階層構造推定手段
16 感性推測手段
17 感性評価手段
18 画面生成手段
19 送受信手段
20 制御手段
31 入力装置
32 出力装置
33 ドライブ装置
34 補助記憶装置
35 メモリ装置
36 CPU
37 ネットワーク接続装置
38 記録媒体
40 画面
41 入力領域
DESCRIPTION OF
37
Claims (9)
予め設定された階層型ニューラルネットワークのスケルトン学習法を用いて、複数の感性項目に対する所定の総合評価を得る嗜好特性パターン毎に分類を行う嗜好特性パターン抽出手段を有することを特徴とする感性推測装置。 In the sensitivity estimation device that estimates the sensitivity during and after use of the sensitivity evaluation object used by the user,
Kansei estimation apparatus comprising preference characteristic pattern extraction means for classifying each preference characteristic pattern for obtaining a predetermined comprehensive evaluation for a plurality of sensitivity items using a skeleton learning method of a preset hierarchical neural network .
前記複数の感性項目を用いて前記ユーザの前記感性評価対象物に対する感性を階層化する階層構造推定手段と、
前記入力手段により得られる基剤物性情報と、前記階層構造推定手段により得られる階層構造とに基づいて、前記嗜好特性パターン抽出手段により得られた分類に対する前記感性評価対象物への感性を推測する感性推測手段とを有することを特徴とする請求項1に記載の感性推測装置。 Input means for inputting base material property information for the sensitivity evaluation object;
Hierarchical structure estimating means for hierarchizing the sensitivity of the user to the sensitivity evaluation object using the plurality of sensitivity items;
Based on the base physical property information obtained by the input means and the hierarchical structure obtained by the hierarchical structure estimating means, the sensitivity to the sensitivity evaluation object for the classification obtained by the preference characteristic pattern extracting means is estimated. The sensitivity estimation device according to claim 1, further comprising sensitivity estimation means.
予め設定された階層型ニューラルネットワークのスケルトン学習法を用いて、複数の感性項目に対する所定の総合評価を得る嗜好特性パターン毎に分類を行う嗜好特性パターン抽出ステップを有することを特徴とする感性推測方法。 In the sensitivity estimation method for estimating the sensitivity during and after use of the sensitivity evaluation object used by the user,
A sensitivity estimation method comprising a preference characteristic pattern extraction step for performing classification for each preference characteristic pattern to obtain a predetermined comprehensive evaluation for a plurality of sensitivity items using a skeleton learning method of a preset hierarchical neural network .
前記複数の感性項目を用いて前記ユーザの前記感性評価対象物に対する感性を階層化する階層構造推定ステップと、
前記入力手段により得られる基剤物性情報と、前記階層構造推定ステップにより得られる階層構造とに基づいて、前記嗜好特性パターン抽出ステップにより得られた分類に対する前記感性評価対象物への感性を推測する感性推測ステップとを有することを特徴とする請求項5に記載の感性推測方法。 An input step of inputting base material property information for the sensitivity evaluation object;
A hierarchical structure estimation step of hierarchizing the sensitivity of the user to the sensitivity evaluation object using the plurality of sensitivity items;
Based on the base physical property information obtained by the input means and the hierarchical structure obtained by the hierarchical structure estimation step, the sensitivity to the sensitivity evaluation object for the classification obtained by the preference characteristic pattern extraction step is estimated. The sensitivity estimation method according to claim 5, further comprising a sensitivity estimation step.
Priority Applications (1)
| Application Number | Priority Date | Filing Date | Title |
|---|---|---|---|
| JP2010276261A JP2012123749A (en) | 2010-12-10 | 2010-12-10 | Sensibility estimation device, sensibility estimation method, and sensibility estimation program |
Applications Claiming Priority (1)
| Application Number | Priority Date | Filing Date | Title |
|---|---|---|---|
| JP2010276261A JP2012123749A (en) | 2010-12-10 | 2010-12-10 | Sensibility estimation device, sensibility estimation method, and sensibility estimation program |
Publications (1)
| Publication Number | Publication Date |
|---|---|
| JP2012123749A true JP2012123749A (en) | 2012-06-28 |
Family
ID=46505095
Family Applications (1)
| Application Number | Title | Priority Date | Filing Date |
|---|---|---|---|
| JP2010276261A Withdrawn JP2012123749A (en) | 2010-12-10 | 2010-12-10 | Sensibility estimation device, sensibility estimation method, and sensibility estimation program |
Country Status (1)
| Country | Link |
|---|---|
| JP (1) | JP2012123749A (en) |
Cited By (10)
| Publication number | Priority date | Publication date | Assignee | Title |
|---|---|---|---|---|
| KR101563977B1 (en) | 2014-07-09 | 2015-10-28 | 공주대학교 산학협력단 | Emotion inference system based on fuzzy integral in accordance with personalized emotional information |
| JP2018040597A (en) * | 2016-09-05 | 2018-03-15 | 株式会社ナリス化粧品 | Method for evaluating the value of cosmetics |
| JP2019095825A (en) * | 2017-11-17 | 2019-06-20 | 株式会社Nttドコモ | User's characteristic estimation device and user's characteristic estimation method |
| JP2020155037A (en) * | 2019-03-22 | 2020-09-24 | トヨタ紡織株式会社 | Information processing device and control method of information processing device |
| JP2020155038A (en) * | 2019-03-22 | 2020-09-24 | トヨタ紡織株式会社 | Information processing device and control method of information processing device |
| JP2020155039A (en) * | 2019-03-22 | 2020-09-24 | トヨタ紡織株式会社 | Information processing device and control method of information processing device |
| JP2020177645A (en) * | 2019-04-18 | 2020-10-29 | ベイジン バイドゥ ネットコム サイエンス アンド テクノロジー カンパニー リミテッド | Trajectory classification model training method and equipment, electronic equipment |
| JP2020184158A (en) * | 2019-05-07 | 2020-11-12 | トヨタ紡織株式会社 | Information processing device, and method for controlling information processing device |
| JP2021051438A (en) * | 2019-09-24 | 2021-04-01 | 株式会社富士通エフサス | Information processing device, information processing method and information processing program |
| JPWO2022239750A1 (en) * | 2021-05-12 | 2022-11-17 |
-
2010
- 2010-12-10 JP JP2010276261A patent/JP2012123749A/en not_active Withdrawn
Cited By (20)
| Publication number | Priority date | Publication date | Assignee | Title |
|---|---|---|---|---|
| KR101563977B1 (en) | 2014-07-09 | 2015-10-28 | 공주대학교 산학협력단 | Emotion inference system based on fuzzy integral in accordance with personalized emotional information |
| JP2018040597A (en) * | 2016-09-05 | 2018-03-15 | 株式会社ナリス化粧品 | Method for evaluating the value of cosmetics |
| JP7016243B2 (en) | 2017-11-17 | 2022-02-21 | 株式会社Nttドコモ | User characteristic estimation device and user characteristic estimation method |
| JP2019095825A (en) * | 2017-11-17 | 2019-06-20 | 株式会社Nttドコモ | User's characteristic estimation device and user's characteristic estimation method |
| JP7220108B2 (en) | 2019-03-22 | 2023-02-09 | トヨタ紡織株式会社 | Information processing device and control method for information processing device |
| JP2020155039A (en) * | 2019-03-22 | 2020-09-24 | トヨタ紡織株式会社 | Information processing device and control method of information processing device |
| JP7220107B2 (en) | 2019-03-22 | 2023-02-09 | トヨタ紡織株式会社 | Information processing device and control method for information processing device |
| JP2020155038A (en) * | 2019-03-22 | 2020-09-24 | トヨタ紡織株式会社 | Information processing device and control method of information processing device |
| JP7138067B2 (en) | 2019-03-22 | 2022-09-15 | トヨタ紡織株式会社 | Information processing device and control method for information processing device |
| JP2020155037A (en) * | 2019-03-22 | 2020-09-24 | トヨタ紡織株式会社 | Information processing device and control method of information processing device |
| JP2020177645A (en) * | 2019-04-18 | 2020-10-29 | ベイジン バイドゥ ネットコム サイエンス アンド テクノロジー カンパニー リミテッド | Trajectory classification model training method and equipment, electronic equipment |
| US11599825B2 (en) | 2019-04-18 | 2023-03-07 | Beijing Baidu Netcom Science And Technology Co., Ltd. | Method and apparatus for training trajectory classification model, and electronic device |
| JP7038151B2 (en) | 2019-04-18 | 2022-03-17 | ベイジン バイドゥ ネットコム サイエンス テクノロジー カンパニー リミテッド | Trajectory classification model training method and equipment, electronic equipment |
| JP7188268B2 (en) | 2019-05-07 | 2022-12-13 | トヨタ紡織株式会社 | Information processing device and control method for information processing device |
| JP2020184158A (en) * | 2019-05-07 | 2020-11-12 | トヨタ紡織株式会社 | Information processing device, and method for controlling information processing device |
| JP2021051438A (en) * | 2019-09-24 | 2021-04-01 | 株式会社富士通エフサス | Information processing device, information processing method and information processing program |
| JP7324670B2 (en) | 2019-09-24 | 2023-08-10 | 株式会社富士通エフサス | Information processing device, information processing method and information processing program |
| WO2022239750A1 (en) * | 2021-05-12 | 2022-11-17 | 株式会社味香り戦略研究所 | Preferred product information presentation device and preferred beverage/food information presentation device |
| JPWO2022239750A1 (en) * | 2021-05-12 | 2022-11-17 | ||
| JP7448274B2 (en) | 2021-05-12 | 2024-03-12 | 株式会社味香り戦略研究所 | Preference product information presentation device and preference beverage/food information presentation device |
Similar Documents
| Publication | Publication Date | Title |
|---|---|---|
| JP2012123749A (en) | Sensibility estimation device, sensibility estimation method, and sensibility estimation program | |
| Williams et al. | Is UTAUT really used or just cited for the sake of it? A systematic review of citations of UTAUT’s originating article | |
| Jiao et al. | A Kansei mining system for affective design | |
| Chien et al. | Data-driven innovation to capture user-experience product design: An empirical study for notebook visual aesthetics design | |
| Pensé‐Lhéritier | Recent developments in the sensorial assessment of cosmetic products: a review | |
| Huang et al. | A product configuration analysis method for emotional design using a personal construct theory | |
| Kujala et al. | Lost in time: the meaning of temporal aspects in user experience | |
| Shieh et al. | Eliciting design knowledge from affective responses using rough sets and Kansei engineering system | |
| Arenas-Gaitán et al. | A posteriori segmentation of elderly internet users: applying PLS-POS | |
| Zhu et al. | Research on logo design and evaluation of youth education brands based on visual representation | |
| Alonso-Virgós et al. | Test usability guidelines and follow conventions. Useful recommendations from web developers | |
| Shieh et al. | Classification model for product form design using fuzzy support vector machines | |
| Sulikowski et al. | Human-website interaction monitoring in recommender systems | |
| Lokman | KE as affective design methodology | |
| Gerogiannis et al. | Identifying factors of customer satisfaction from Smartphones: A fuzzy cognitive map approach | |
| Petiot et al. | Product design: a vectors field-based approach for preference modelling | |
| Wu et al. | Multimodal web aesthetics assessment based on structural SVM and multitask fusion learning | |
| Halkiopoulos et al. | Behavioral data analysis in emotional intelligence of social network consumers | |
| Meyer et al. | EXPLORING CUSTOMERS’ACCEPTANCE OF AND RESISTANCE TO SERVICE ROBOTS IN STATIONARY RETAIL–A MIXED METHOD APPROACH | |
| Wu et al. | A computer-aided coloring method for virtual agents based on personality impression, color harmony, and designer preference | |
| Amiruddin et al. | The influence of e-WOM, fashion trends, and income on the consumption style of the Muslim community in Palopo City: A quantitative analysis | |
| Perrig et al. | Independent validation of the player experience inventory: Findings from a large set of video game players | |
| JP7349125B2 (en) | Beauty evaluation method, sensory evaluation method, and system | |
| Shin et al. | Development of a scale to measure decision-making tendency in human-product interactions | |
| JP7249222B2 (en) | Information processing device, information processing method and information processing program |
Legal Events
| Date | Code | Title | Description |
|---|---|---|---|
| A300 | Application deemed to be withdrawn because no request for examination was validly filed |
Free format text: JAPANESE INTERMEDIATE CODE: A300 Effective date: 20140304 |