JP2011516838A - Screening method and apparatus - Google Patents
Screening method and apparatus Download PDFInfo
- Publication number
- JP2011516838A JP2011516838A JP2011502191A JP2011502191A JP2011516838A JP 2011516838 A JP2011516838 A JP 2011516838A JP 2011502191 A JP2011502191 A JP 2011502191A JP 2011502191 A JP2011502191 A JP 2011502191A JP 2011516838 A JP2011516838 A JP 2011516838A
- Authority
- JP
- Japan
- Prior art keywords
- signal
- detector
- data
- radiation
- determining
- Prior art date
- Legal status (The legal status is an assumption and is not a legal conclusion. Google has not performed a legal analysis and makes no representation as to the accuracy of the status listed.)
- Pending
Links
- 238000000034 method Methods 0.000 title claims abstract description 88
- 238000012216 screening Methods 0.000 title claims abstract description 84
- 230000005855 radiation Effects 0.000 claims abstract description 102
- 238000001514 detection method Methods 0.000 claims abstract description 36
- 230000005284 excitation Effects 0.000 claims abstract description 5
- 238000000354 decomposition reaction Methods 0.000 claims description 16
- 238000013178 mathematical model Methods 0.000 claims description 15
- 239000002360 explosive Substances 0.000 claims description 13
- 229910052729 chemical element Inorganic materials 0.000 claims description 12
- 230000009466 transformation Effects 0.000 claims description 12
- 230000001131 transforming effect Effects 0.000 claims description 12
- 230000004907 flux Effects 0.000 claims description 11
- 230000004044 response Effects 0.000 abstract description 16
- 238000013480 data collection Methods 0.000 abstract description 6
- 230000015556 catabolic process Effects 0.000 abstract description 3
- 238000006731 degradation reaction Methods 0.000 abstract description 3
- 230000006872 improvement Effects 0.000 abstract description 2
- 230000001678 irradiating effect Effects 0.000 abstract description 2
- 238000012545 processing Methods 0.000 description 47
- 238000003672 processing method Methods 0.000 description 41
- 230000006870 function Effects 0.000 description 37
- FVAUCKIRQBBSSJ-UHFFFAOYSA-M sodium iodide Chemical compound [Na+].[I-] FVAUCKIRQBBSSJ-UHFFFAOYSA-M 0.000 description 35
- 230000005251 gamma ray Effects 0.000 description 34
- 238000001228 spectrum Methods 0.000 description 30
- 230000035508 accumulation Effects 0.000 description 28
- 238000009825 accumulation Methods 0.000 description 28
- 230000008569 process Effects 0.000 description 15
- 238000010586 diagram Methods 0.000 description 14
- 238000012795 verification Methods 0.000 description 14
- 230000004043 responsiveness Effects 0.000 description 11
- 235000009518 sodium iodide Nutrition 0.000 description 11
- 238000007493 shaping process Methods 0.000 description 10
- 239000013078 crystal Substances 0.000 description 8
- 238000002474 experimental method Methods 0.000 description 8
- 239000011159 matrix material Substances 0.000 description 8
- 239000002131 composite material Substances 0.000 description 7
- 238000007689 inspection Methods 0.000 description 7
- 229910052724 xenon Inorganic materials 0.000 description 7
- 238000004458 analytical method Methods 0.000 description 6
- 238000013459 approach Methods 0.000 description 6
- 238000006243 chemical reaction Methods 0.000 description 6
- 238000000084 gamma-ray spectrum Methods 0.000 description 6
- 238000005259 measurement Methods 0.000 description 6
- FHNFHKCVQCLJFQ-UHFFFAOYSA-N xenon atom Chemical compound [Xe] FHNFHKCVQCLJFQ-UHFFFAOYSA-N 0.000 description 6
- 239000013598 vector Substances 0.000 description 5
- 238000003491 array Methods 0.000 description 4
- 229910052732 germanium Inorganic materials 0.000 description 4
- GNPVGFCGXDBREM-UHFFFAOYSA-N germanium atom Chemical compound [Ge] GNPVGFCGXDBREM-UHFFFAOYSA-N 0.000 description 4
- 230000003993 interaction Effects 0.000 description 4
- 230000004048 modification Effects 0.000 description 4
- 238000012986 modification Methods 0.000 description 4
- 238000007670 refining Methods 0.000 description 4
- 230000008859 change Effects 0.000 description 3
- 238000012512 characterization method Methods 0.000 description 3
- 230000001186 cumulative effect Effects 0.000 description 3
- 238000013499 data model Methods 0.000 description 3
- 229910052805 deuterium Inorganic materials 0.000 description 3
- 238000005516 engineering process Methods 0.000 description 3
- 239000007788 liquid Substances 0.000 description 3
- 239000000203 mixture Substances 0.000 description 3
- 238000005070 sampling Methods 0.000 description 3
- 239000004065 semiconductor Substances 0.000 description 3
- 238000004611 spectroscopical analysis Methods 0.000 description 3
- 239000000126 substance Substances 0.000 description 3
- 238000010200 validation analysis Methods 0.000 description 3
- MARUHZGHZWCEQU-UHFFFAOYSA-N 5-phenyl-2h-tetrazole Chemical compound C1=CC=CC=C1C1=NNN=N1 MARUHZGHZWCEQU-UHFFFAOYSA-N 0.000 description 2
- GUTLYIVDDKVIGB-OUBTZVSYSA-N Cobalt-60 Chemical compound [60Co] GUTLYIVDDKVIGB-OUBTZVSYSA-N 0.000 description 2
- YZCKVEUIGOORGS-OUBTZVSYSA-N Deuterium Chemical compound [2H] YZCKVEUIGOORGS-OUBTZVSYSA-N 0.000 description 2
- XUIMIQQOPSSXEZ-UHFFFAOYSA-N Silicon Chemical compound [Si] XUIMIQQOPSSXEZ-UHFFFAOYSA-N 0.000 description 2
- 230000003044 adaptive effect Effects 0.000 description 2
- 230000005540 biological transmission Effects 0.000 description 2
- TVFDJXOCXUVLDH-RNFDNDRNSA-N cesium-137 Chemical compound [137Cs] TVFDJXOCXUVLDH-RNFDNDRNSA-N 0.000 description 2
- 238000005094 computer simulation Methods 0.000 description 2
- 238000010276 construction Methods 0.000 description 2
- 230000005684 electric field Effects 0.000 description 2
- 238000000921 elemental analysis Methods 0.000 description 2
- 238000011156 evaluation Methods 0.000 description 2
- 230000010354 integration Effects 0.000 description 2
- 239000000463 material Substances 0.000 description 2
- 229910052710 silicon Inorganic materials 0.000 description 2
- 239000010703 silicon Substances 0.000 description 2
- 238000004088 simulation Methods 0.000 description 2
- 239000007787 solid Substances 0.000 description 2
- 238000010183 spectrum analysis Methods 0.000 description 2
- CWCCJSTUDNHIKB-UHFFFAOYSA-N $l^{2}-bismuthanylidenegermanium Chemical compound [Bi]=[Ge] CWCCJSTUDNHIKB-UHFFFAOYSA-N 0.000 description 1
- 230000004913 activation Effects 0.000 description 1
- 230000006978 adaptation Effects 0.000 description 1
- 230000032683 aging Effects 0.000 description 1
- 229910052782 aluminium Inorganic materials 0.000 description 1
- XAGFODPZIPBFFR-UHFFFAOYSA-N aluminium Chemical compound [Al] XAGFODPZIPBFFR-UHFFFAOYSA-N 0.000 description 1
- 230000008901 benefit Effects 0.000 description 1
- 238000004364 calculation method Methods 0.000 description 1
- 238000007727 cost benefit analysis Methods 0.000 description 1
- 238000013481 data capture Methods 0.000 description 1
- 238000013500 data storage Methods 0.000 description 1
- 230000003247 decreasing effect Effects 0.000 description 1
- -1 deuterium ions Chemical class 0.000 description 1
- 239000003814 drug Substances 0.000 description 1
- 229940079593 drug Drugs 0.000 description 1
- 230000000694 effects Effects 0.000 description 1
- 230000005611 electricity Effects 0.000 description 1
- 230000005281 excited state Effects 0.000 description 1
- 238000004880 explosion Methods 0.000 description 1
- 230000007246 mechanism Effects 0.000 description 1
- 238000012544 monitoring process Methods 0.000 description 1
- 229910000595 mu-metal Inorganic materials 0.000 description 1
- 230000007935 neutral effect Effects 0.000 description 1
- 230000003287 optical effect Effects 0.000 description 1
- 230000000149 penetrating effect Effects 0.000 description 1
- 238000012805 post-processing Methods 0.000 description 1
- 238000011084 recovery Methods 0.000 description 1
- 230000003595 spectral effect Effects 0.000 description 1
- 230000000087 stabilizing effect Effects 0.000 description 1
- 230000002123 temporal effect Effects 0.000 description 1
- XLYOFNOQVPJJNP-UHFFFAOYSA-N water Substances O XLYOFNOQVPJJNP-UHFFFAOYSA-N 0.000 description 1
- 150000003736 xenon Chemical class 0.000 description 1
Images


Classifications
-
- G01V5/22—
-
- G—PHYSICS
- G01—MEASURING; TESTING
- G01T—MEASUREMENT OF NUCLEAR OR X-RADIATION
- G01T1/00—Measuring X-radiation, gamma radiation, corpuscular radiation, or cosmic radiation
- G01T1/16—Measuring radiation intensity
- G01T1/17—Circuit arrangements not adapted to a particular type of detector
- G01T1/171—Compensation of dead-time counting losses
Abstract
スクリーング方法および装置であって、該方法は、励起放射により対象物をスクリーニングするよう照射するステップと、対象物の近傍に配置した放射検出器からの出力データ検出を収集するステップと、出力データ検出において個別信号を分解する分解ステップであって、(i)前記データ内に存在する信号の信号形状(またはインパルス応答)を決定するステップ、(ii)前記信号の一つ以上のパラメータを推定するパラメータ推定を行い、前記一つ以上のパラメータは少なくとも信号の瞬間的位置を含むものとしたステップ、(iii)前記信号形状および前記パラメータ推定から各前記信号のエネルギーを決定するステップ、によって前記分解を行う、該分解ステップと、を備え、これによりスクリーニング時間を短縮し、ドウェル時間(すなわち放射および/またはデータ収集時間)を短縮し、分解能は改善するおよび/またはスループットを増加する。A screening method and apparatus, the method comprising irradiating to screen an object with excitation radiation, collecting output data detection from a radiation detector disposed proximate to the object, and output data A decomposing step of decomposing an individual signal in detection, (i) determining a signal shape (or impulse response) of a signal present in the data, (ii) estimating one or more parameters of the signal Performing the parameter estimation, wherein the one or more parameters include at least an instantaneous position of the signal; (iii) determining the energy of each signal from the signal shape and the parameter estimation; Performing the degradation step, thereby reducing screening time and dwell time (ie, Shortened morphism and / or data collection time), resolution increases the improvement to and / or throughput.
Description
本件出願は、2008年3月31日出願の米国特許出願第61/041163号および2008年12月18日出願の第61/138879号に基づき、その出願日の優先権を主張して、その内容を全体的に参照することにより本明細書に組み込まれるものとする。 This application is based on U.S. Patent Application No. 61/041163 filed on March 31, 2008 and 61/138879 filed on December 18, 2008, and claims the priority of the filing date of the application. Are hereby incorporated by reference in their entirety.
本発明は概して、スクリーニング方法および装置に関して、特に(排他的な適用例ではないが)、貨物および他の物品、車両および船舶、爆発物および不審物を監視するために用いる。 The present invention generally relates to screening methods and apparatus, particularly (but not exclusively), for monitoring cargo and other articles, vehicles and ships, explosives and suspicious objects.
主にセキュリティ上の理由で貨物および荷物を検閲するためのスクリーニング技術の数は、近年増加している。一つの最近提案された技術が、例えば特許文献1(欧州特許第1579202号)に開示されており、この技術は、D−TまたはD−D反応によって生ずるほぼ単一エネルギーの高速中性子を生成する密封管または同様の発生器と、対象物を貫通するX線またはガンマ線源と、ファン形状の放射ビームを放出するスロットから離れた中性子およびガンマ線源を囲む平行化(コリメート)ブロックと、検出器アレイとを備える。 The number of screening techniques for censoring cargo and packages, mainly for security reasons, has increased in recent years. One recently proposed technique is disclosed, for example, in US Pat. No. 5,791,202 (European Patent No. 1579202), which produces nearly monoenergetic fast neutrons produced by DT or DD reactions. A sealed tube or similar generator, an x-ray or gamma ray source penetrating the object, a collimating block surrounding the neutron and gamma ray source away from the slot emitting the fan-shaped radiation beam, and a detector array With.
一つの既存システムは、パルス状中性子の要素解析検出器を使用し、10分程度のデータ収集時間の後に、試料または対象物が、例えば爆発物を備えているまたは含んでいるか否かなどのスクリーニングを可能とする。少数の物品をスクリーニングすることには容認できるが、大量の貨物に対しては高額となる。 One existing system uses a pulsed neutron elemental analysis detector, and after a data collection time of around 10 minutes, screens whether the sample or object is equipped with or contains explosives, for example. Is possible. It is acceptable to screen a small number of items, but it is expensive for large quantities of cargo.
このような技術はトラックを検査するために使用することができ、そのような場合、トラックを駐車させるスクリーニング橋門の形式とする。Port Technology International(Maritime Information Services Ltdにより出版)は、2006年9月に貨物スクリーニング費用便益分析について発表しており、固定場所のスクリーニングステーションが1時間当たり20コンテナで運用すると仮定すれ場合、スクリーニングコストに関連する設備は、1コンテナあたりに23.49USドルであった。 Such a technique can be used to inspect the truck, in which case it is in the form of a screening bridge that parks the truck. Port Technology International (published by Maritime Information Services Ltd) announced a freight screening cost-benefit analysis in September 2006, and it was estimated that the fixed-site screening station would operate at 20 containers per hour. The related equipment was $ 23.49 per container.
したがって、本発明の第1の態様によれば、スクリーニング方法を提供し、この方法は、
励起放射によりスクリーニング対象物を照射するステップと、
対象物近傍に配置した放射検出器からの出力データ検出を収集するステップと、
出力データ検出において個別信号を分解する分解ステップであって、(i)前記データ内に存在する信号の信号形状(またはインパルス応答性)を決定するステップ、(ii)前記信号の少なくとも信号位置を含む一つ以上のパラメータの推定を行うステップ、および(iii)少なくとも前記信号形状および前記パラメータ推定から各前記信号のエネルギーを決定するステップにより分解する、該分解ステップと、
を備え、
これによりスクリーニング時間を短縮し、ドウェル時間(すなわち放射および/またはデータ収集時間)を短縮し、分解能は改善するおよび/またはスループットは増加する。
Thus, according to the first aspect of the present invention, there is provided a screening method comprising:
Irradiating the screening object with excitation radiation;
Collecting output data detection from radiation detectors located near the object;
A decomposition step of decomposing an individual signal in output data detection, comprising: (i) determining a signal shape (or impulse response) of a signal present in the data; and (ii) including at least a signal position of the signal. Decomposing by one or more parameters, and (iii) decomposing by at least determining the energy of each signal from the signal shape and the parameter estimates; and
With
This reduces screening time, reduces dwell time (ie, emission and / or data collection time), improves resolution and / or increases throughput.
したがって、本発明方法は、できるだけ多くのデータを特徴付けしようとするが、しかしいくつかのデータ(以下、本明細書で「破損データ」と称する)は十分に特徴付けできないことを理解すべきであり、以下に記載する。用語「信号」は本明細書中「パルス」と置き換え可能であり、個々の信号の集合を含む出力信号全体よりもむしろ個別の検出事象に対する出力を意味すると理解されたい。信号の瞬間的位置(またはタイミング)は、様々な方法で測定または表現することができ、例えば信号の最大値または信号の先導端縁(前エッジ)の時刻(または時間軸上の位置)による。一般的に、これを到着時間または検出時間として記述する。 Thus, it should be understood that the method of the present invention attempts to characterize as much data as possible, but some data (hereinafter referred to as “corrupted data”) cannot be fully characterized. Yes, described below. The term “signal” is interchangeable herein with “pulse” and is understood to mean the output for an individual detection event rather than the entire output signal including a collection of individual signals. The instantaneous position (or timing) of the signal can be measured or expressed in various ways, for example depending on the maximum value of the signal or the time (or position on the time axis) of the leading edge (front edge) of the signal. This is generally described as arrival time or detection time.
用語「検出データ」は検出器から発生したデータであり、検出器内部または外部の関連するまたは他の電子機器により連続的に処理されるデータでもあると理解されたい。
本発明方法は、推定パラメータからデータモデルを構築するステップと、検出出力データとモデルとの間における比較に基づく推定パラメータの正確性を決定するステップとを有する。
It should be understood that the term “detection data” is data generated from the detector and also data that is continuously processed by associated or other electronics inside or outside the detector.
The method comprises building a data model from the estimated parameters and determining the accuracy of the estimated parameters based on a comparison between the detected output data and the model.
特定実施形態において、個別信号を分解するステップは、
デジタル時系列形式の検出器出力データとして検出出力データを得るステップと、
デジタル時系列に基づき、少なくとも信号形状、信号の瞬間的位置(時刻)、信号振幅の関数としての数学モデルを形成するステップと
を備え、
各信号のエネルギーを決定するステップは、前記数学モデルに基づく信号の放射事象を示す振幅を決定するステップを備える。
In certain embodiments, decomposing the individual signal comprises:
Obtaining detection output data as detector output data in digital time series format;
Forming a mathematical model based on a digital time series as a function of at least the signal shape, the instantaneous position (time) of the signal, and the signal amplitude
Determining the energy of each signal comprises determining an amplitude indicative of a radiation event of the signal based on the mathematical model.
信号形状(またはインパルス応答性)を、信号形状のデータまたはインパルス応答から得るために一つ以上の信号事象検出に対する検出器のタイムドメイン応答を測定するステップを含むキャリブレーション処理により決定する。この信号形状の関数形式は、適切な関数、例えば多項関数、指数関数またはスプライン関数をデータに内挿する(またはデータにフィットさせる)ことにより得ることができる。つぎに、フィルタ(例えば、逆フィルタ)を、この検出器信号形状から構築する。信号パラメータの初期推定は、フィルタを有する検出器から出力データの畳み込み(コンボリューション)により行う。特定の関心のある(注目する)信号パラメータは、信号の個数および各信号の瞬間的位置(または到着時間)を含む。 The signal shape (or impulse responsiveness) is determined by a calibration process that includes measuring a detector time domain response to one or more signal event detections to obtain from the signal shape data or impulse response. This functional form of the signal shape can be obtained by interpolating (or fitting to) the data with an appropriate function, such as a polynomial function, an exponential function or a spline function. Next, a filter (e.g., an inverse filter) is constructed from this detector signal shape. Initial estimation of signal parameters is performed by convolution of output data from a detector having a filter. Specific signal parameters of interest include the number of signals and the instantaneous position (or arrival time) of each signal.
つぎに、特定の関心のある(注目する)信号パラメータをさらに洗練する。第1に、信号の個数および到着時間の推定を、ピーク検出器および閾値を使用して洗練する。第2に、信号の個数および到着時間の知識を、検出インパルス応答性(およびその後の信号形状)は、信号のエネルギーパラメータの解を得ることを可能にする。 Next, further refine the signal parameters of particular interest. First, refine the signal count and arrival time estimates using peak detectors and thresholds. Secondly, the knowledge of the number of signals and the arrival time, the detected impulse response (and subsequent signal shape) make it possible to obtain a solution of the energy parameters of the signal.
パラメータ推定の精度は、検出器データストリーム(信号パラメータおよび検出器のインパルス応答性の知識から構築した)のモデル(実質的に推定)と実際の検出器出力とを比較することにより決定または「検証」することができる。この検証プロセスは、いくつかのパラメータは不十分な精度であることを決定し、これらパラメータを廃棄する。この方法を用いる分光分析において、十分に正確とみなせるエネルギーパラメータを、ヒストグラムとして表示することができる。 The accuracy of the parameter estimation is determined by comparing the model (substantially estimated) of the detector data stream (constructed from knowledge of signal parameters and detector impulse responsiveness) with the actual detector output or “validation” "can do. This verification process determines that some parameters are insufficiently accurate and discards these parameters. In spectroscopic analysis using this method, energy parameters that can be considered sufficiently accurate can be displayed as a histogram.
本発明方法は、信号形状(すなわち信号を発生するために用いる検出器のインパルス応答性)に基づいて信号パラメータの推定を実施するステップを有する。本発明方法は、信号形状のデータに基づくモデルを得るための一つ以上の信号検出に対する、検出器の応答測定を有するキャリブレーション処理により、信号形状を決定するステップを有する。特に、本発明方法は、予期した信号形状を発生する関数を有するデータを内挿することにより、モデルの関数形状を得るステップを有する。関数は、多項関数、指数関数またはスプライン関数とする。 The method of the present invention includes the step of performing signal parameter estimation based on the signal shape (ie, the impulse responsiveness of the detector used to generate the signal). The method includes determining a signal shape by a calibration process having a detector response measurement for one or more signal detections to obtain a model based on signal shape data. In particular, the method of the present invention comprises the step of obtaining a function shape of a model by interpolating data having a function that generates an expected signal shape. The function is a polynomial function, exponential function or spline function.
本発明方法は、放射検出器により生成する個別信号の所定形状に基づくフィルタを設計するステップを有する。フィルタは、例えば、照合フィルタまたは逆フィルタ形式とする。 The method of the invention comprises designing a filter based on a predetermined shape of the individual signal generated by the radiation detector. The filter is, for example, a collation filter or an inverse filter type.
ある実施形態では、本発明方法は、検出器出力の畳み込み(コンボリューション)、および信号パラメータの初期推定を行うフィルタを用いるステップを有する。本発明方法は、信号パラメータの推定を洗練するステップを有する。本発明方法は、ピーク検出処理を有する信号個数の推定を洗練するステップを有する。本発明方法は、ピーク検出処理の用途により信号時間の推定を行うステップまたは洗練するステップを有する。本発明方法は、線形方程式系の解を得る、反転行列式または反復技術により信号エネルギーの推定を洗練するステップを有する。 In one embodiment, the method comprises using a filter that performs a convolution of the detector output and an initial estimation of the signal parameters. The method comprises the step of refining the estimation of signal parameters. The method of the present invention comprises the step of refining the estimation of the number of signals having a peak detection process. The method of the present invention comprises the step of performing or refining signal time depending on the application of peak detection processing. The method of the present invention comprises the step of refining the estimation of signal energy by an inverse determinant or iterative technique to obtain a solution of the system of linear equations.
本発明の実施形態において、本発明方法は、検出器のインパルス応答性と組み合わせて信号パラメータを用いて検出器出力モデルを生成するステップを有する。本発明方法は、例えば、実際の検出器出力データを検出器出力モデルと比較することにより、データとモデルとの差に関する最小2乗法またはいくつかの他の手法を使用して、エラー検出を実行するステップを有する。 In an embodiment of the present invention, the inventive method comprises generating a detector output model using signal parameters in combination with the impulse responsiveness of the detector. The method of the present invention performs error detection using a least squares method or some other technique for the difference between the data and the model, for example by comparing the actual detector output data with the detector output model. There is a step to do.
本発明方法は、十分に正確でない推定とみなせるパラメータを廃棄するステップを有する。 The method comprises the step of discarding parameters that can be considered as estimates that are not sufficiently accurate.
ある実施形態において、本発明方法は、ヒストグラムにおける全ての十分に正確なエネルギーパラメータを表示するステップを有する。 In one embodiment, the method of the present invention comprises displaying all sufficiently accurate energy parameters in the histogram.
データは異なる形状の信号を有する。この場合、本発明方法は、各信号のあり得る信号形状を決定するステップを有する。 The data has different shaped signals. In this case, the method of the invention comprises the step of determining the possible signal shape of each signal.
ある実施形態において、本発明方法は、複数の信号形状における順次の信号形状に容認可能に一致する信号データから徐々に減算するステップと、任意な複数の信号形状を容認可能に一致しない信号を拒否するステップとを有する。 In one embodiment, the method of the present invention includes the step of gradually subtracting from signal data that acceptably matches a sequential signal shape in a plurality of signal shapes and rejecting signals that do not acceptably match any plurality of signal shapes. A step of performing.
本発明方法は、ガンマ線の前記放射能検出器上における入射流束が、75kHz以上であることを特徴とする。 The method of the present invention is characterized in that the incident flux of gamma rays on the radioactivity detector is 75 kHz or more.
本発明方法は、ガンマ線の前記放射能検出器上における入射流束が、80kHz以上であることを特徴とする。 The method of the present invention is characterized in that an incident flux of gamma rays on the radioactivity detector is 80 kHz or more.
本発明方法は、データスループットが、50kHzの入力計数率で90%以上であることを特徴とする。 The method of the present invention is characterized in that the data throughput is 90% or more at an input count rate of 50 kHz.
本発明方法は、データスループットが、25〜250kHzの範囲の入力計数率で90%以上であることを特徴とする。 The method of the present invention is characterized in that the data throughput is 90% or more at an input count rate in the range of 25 to 250 kHz.
本発明方法は、データスループットが、25kHzの入力計数率で95%以上であることを特徴とする。 The method of the present invention is characterized in that the data throughput is 95% or more at an input count rate of 25 kHz.
本発明方法は、データスループットが、25〜100kHzの入力計数率で95%以上であることを特徴とする。 The method of the present invention is characterized in that the data throughput is 95% or more at an input count rate of 25 to 100 kHz.
本発明方法は、データスループットが、250kHzの入力計数率で80%以上であることを特徴とする。 The method of the present invention is characterized in that the data throughput is 80% or more at an input count rate of 250 kHz.
本発明方法は、データスループットが、250kHz〜2500kHzの入力計数率で50%以上であることを特徴とする。 The method of the present invention is characterized in that the data throughput is 50% or more at an input count rate of 250 kHz to 2500 kHz.
本発明の第2の態様において、本発明はスクリーニング装置を提供し、該装置は、
スクリーンすべき対象物に対して照射する放射源と、
対象物が発生する放射を検出し、また放射に応答する検出器データを出力する放射検出器と、
デジタル形式の検出器データを受信するプロセッサであって、データ内に存在する各信号の信号形状を決定するステップ、信号の一つ以上のパラメータに関するパラメータ推定を行い、少なくとも信号形状およびパラメータ推定から各信号形状のエネルギーを決定し、前記一つ以上のパラメータは少なくとも信号の瞬間的位置を含むものとしたエネルギー決定ステップを行うようプログラムした、該プロセッサと
を備え、
これによりスクリーニング時間を短縮し、ドウェル時間を短縮し、分解能は改善するおよび/またはスループットを増加する。
In a second aspect of the present invention, the present invention provides a screening device, the device comprising:
A radiation source for illuminating the object to be screened;
A radiation detector that detects radiation generated by the object and outputs detector data responsive to the radiation;
A processor for receiving detector data in digital form, determining a signal shape of each signal present in the data, performing parameter estimation on one or more parameters of the signal, and at least determining each signal from the signal shape and parameter estimation A processor programmed to perform an energy determining step that determines energy of a signal shape, wherein the one or more parameters include at least an instantaneous position of the signal;
This shortens screening time, shortens dwell time, improves resolution and / or increases throughput.
プロセッサは、デジタル時系列形式の検出器出力データを得るステップと、デジタル時系列に基づき、信号の瞬間的位置、および信号振幅の関数としての数学モデルを形成するステップとを行うようプログラムし、各信号のエネルギーを決定するステップは、数学モデルに基づいて信号の放射事象を示す振幅を決定するステップを備える。 The processor is programmed to obtain the detector output data in digital time series format and form a mathematical model as a function of the instantaneous position of the signal and the signal amplitude based on the digital time series, Determining the energy of the signal comprises determining an amplitude indicative of the radiation event of the signal based on a mathematical model.
放射源および放射検出器を互いに隣接配置し、これにより放射能検出器は、対象物からの反射または後方散乱放射を検出するようにする。 The radiation source and the radiation detector are placed adjacent to each other so that the radioactivity detector detects reflected or backscattered radiation from the object.
ある実施形態では、放射源および放射検出器を離して配置する、または分離可能に構成し、これにより、放射検出器は、対象物からの透過または前方散乱放射を検出するようにする。 In certain embodiments, the radiation source and radiation detector are spaced apart or configured to be separable, so that the radiation detector detects transmitted or forward scattered radiation from the object.
ある実施形態において、装置は貨物スクリーング装置として構成する。別の実施形態において、装置は爆発物検出装置として構成する。別の実施形態において、装置は、貨物スクリーニング装置またはスクリーニング橋門(ポータル)として構成する。 In certain embodiments, the device is configured as a cargo screening device. In another embodiment, the device is configured as an explosive detection device. In another embodiment, the device is configured as a cargo screening device or screening portal.
本発明装置は、ガンマ線の前記放射能検出器上の入射流束は、75kHz以上であることを特徴とする。 The apparatus according to the present invention is characterized in that an incident flux of the gamma ray on the radioactivity detector is 75 kHz or more.
本発明装置は、データスループットが、50kHzの入力計数率で90%以上であることを特徴とする。 The device of the present invention is characterized in that the data throughput is 90% or more at an input count rate of 50 kHz.
本発明装置は、データスループットが、25〜250kHzの範囲の入力計数率で90%以上であることを特徴とする。 The device according to the present invention is characterized in that the data throughput is 90% or more at an input count rate in the range of 25 to 250 kHz.
本発明装置は、データスループットが、25kHzの入力計数率で95%以上であることを特徴とする。 The device of the present invention is characterized in that the data throughput is 95% or more at an input count rate of 25 kHz.
本発明装置は、データスループットが、25〜100kHzの入力計数率で95%以上であることを特徴とする。 The device of the present invention is characterized in that the data throughput is 95% or more at an input count rate of 25 to 100 kHz.
本発明装置は、データスループットが、250kHzの入力計数率で80%以上であることを特徴とする。 The device of the present invention is characterized in that the data throughput is 80% or more at an input count rate of 250 kHz.
本発明装置は、データスループットが、250kHz〜2500kHzの入力計数率で50%以上であることを特徴とする。 The device of the present invention is characterized in that the data throughput is 50% or more at an input count rate of 250 kHz to 2500 kHz.
第3の態様において、本発明は対象物内の化学的要素をスクリーニングする方法を提供し、該方法は、
スクリーニング装置の放射検出器から検出器出力データを収集するステップと、
検出器出力データにおける個別信号を分解する分解ステップであって、(i)前記データに存在する信号の信号形状を決定するステップ、(ii)前記信号の一つ以上のパラメータを推定し、前記一つ以上のパラメータは少なくとも信号の瞬間的位置を含むものとした、パラメータ推定ステップ、(iii)少なくとも前記信号形状および前記パラメータ推定から各前記信号のエネルギーを決定するステップによって前記分解を行う、該分解ステップと、
対象物または複数対象物における前記化学的要素の存在から生ずる少なくとも信号の形状、パラメータ、信号形状のエネルギーから前記化学的要素の量を決定するステップと、
を備え、
これにより、スクリーニング時間を短縮し、ドウェル時間を短縮し、分解能を改善するおよび/またはスループットを増加する。
In a third aspect, the present invention provides a method of screening for chemical elements in an object, the method comprising:
Collecting detector output data from the radiation detector of the screening device;
A decomposition step of decomposing an individual signal in the detector output data, (i) determining a signal shape of a signal present in the data; (ii) estimating one or more parameters of the signal; One or more parameters including at least an instantaneous position of the signal, and (iii) performing the decomposition by at least determining the energy of each of the signals from the signal shape and the parameter estimation. Steps,
Determining the amount of the chemical element from at least the signal shape, parameters, signal shape energy resulting from the presence of the chemical element in the object or objects;
With
This reduces screening time, shortens dwell time, improves resolution and / or increases throughput.
個別信号を分解するステップは、
デジタル時系列形式のデジタル化検出器出力データとして前記検出器出力データを得るステップと、
デジタル時系列に基づき、少なくとも信号形状、信号の瞬間的位置(時刻)、および信号振幅の関数として数学モデルを形成するステップと、
を備え、
前記各信号のエネルギーを決定するステップは、前記数学モデルに基づいて前記信号の放射事象を示す振幅を決定するステップを備える。
The step of decomposing the individual signals is
Obtaining the detector output data as digitized detector output data in digital time series format;
Forming a mathematical model based on a digital time series as a function of at least the signal shape, the instantaneous position of the signal (time), and the signal amplitude;
With
Determining the energy of each signal comprises determining an amplitude indicative of a radiation event of the signal based on the mathematical model.
本発明の第4の態様において、本発明はスクリーニング方法を提供し、該方法は、
励起放射によりスクリーニングするよう対象物を照射するステップと、
対象物近傍に配置した放射検出器から検出器出力データを収集するステップと、
検出器出力データ内の個別信号を分解する分解ステップであって、(i)デジタル列として検出器出力データを得るまたは表現するステップ、(ii)データ内に存在する信号の信号形状を得るまたは決定するステップ、(iii)数学的変換により信号形状を変換することによって変換した信号形状を形成するステップ、(iv)数学的変換によりデジタル列を変換することによって、変換した信号を有する変換したデジタル系列を形成するステップ、(v)少なくとも変換した列および変換した信号形状の関数を評価し、これにより、関数出力を得るステップ、(vi)モデルにより関数出力をモデル化するステップ、(vii)モデルに基づく関数出力の少なくとも一つのパラメータを決定するステップ、(viii)関数出力の少なくとも一つの決定したパラメータから信号のパラメータを決定するステップにより、前記分解を行う、該分解ステップと、
を備え、これにより、スクリーニング時間を短縮し、ドウェル時間を短縮し、分解能を改善するおよび/またはスループットは増加する。
In a fourth aspect of the present invention, the present invention provides a screening method comprising:
Illuminating the object for screening with excitation radiation;
Collecting detector output data from a radiation detector located near the object;
A decomposition step of decomposing individual signals in the detector output data, comprising: (i) obtaining or representing the detector output data as a digital sequence; (ii) obtaining or determining a signal shape of a signal present in the data. (Iii) a step of forming a transformed signal shape by transforming the signal shape by mathematical transformation; (iv) a transformed digital sequence having a transformed signal by transforming a digital string by mathematical transformation (V) evaluating a function of at least the transformed sequence and transformed signal shape, thereby obtaining a function output, (vi) modeling the function output with a model, (vii) Determining at least one parameter of the function output based on, (viii) a parameter of the signal from the at least one determined parameter of the function output. Performing the decomposition by the step of determining data, the decomposition step;
Thereby reducing screening time, reducing dwell time, improving resolution and / or increasing throughput.
本発明の第5の態様において、本発明はスクリーニング装置を提供し、該スクリーニング装置は、
スクリーンすべき対象物を照射する放射源と、
対象物が発生する放射を検出し、放射に応答する検出器データを出力する放射検出器と、
デジタル系列として検出器データを受信するプロセッサであって、(i)デジタル系列として検出器出力データを得るまたは表現するステップ、(ii)データ内に存在する信号の信号形状を得るまたは決定するステップ、(iii)数学的変換による信号形状を変換することによって変換した信号形状を形成するステップ、(iv)数学的変換によりデジタル系列を変換することによって、変換した信号を有する変換した系列を形成するステップ、(v)少なくとも変換した系列および変換した信号形状の関数を評価することにより関数出力を得るステップ、(vi)モデルにより関数出力をモデル化するステップ、(vii)モデルに基づく関数出力の少なくとも一つのパラメータを決定するステップ、(viii)関数出力の少なくとも一つの決定したパラメータから信号のパラメータを決定するステップを行うようにプログラムした、該プロセッサと、
を備え、
これにより、スクリーニング時間を短縮し、ドウェル時間を短縮し、分解能を改善するおよび/またはスループットは増加する。
In a fifth aspect of the present invention, the present invention provides a screening apparatus, which comprises:
A radiation source for illuminating the object to be screened;
A radiation detector that detects radiation generated by the object and outputs detector data responsive to the radiation;
A processor for receiving detector data as a digital sequence, comprising: (i) obtaining or representing detector output data as a digital sequence; (ii) obtaining or determining a signal shape of a signal present in the data; (iii) forming a transformed signal shape by transforming the signal shape by mathematical transformation, (iv) forming a transformed sequence having the transformed signal by transforming the digital sequence by mathematical transformation (V) obtaining a function output by evaluating at least a function of the transformed sequence and the transformed signal shape; (vi) modeling a function output by a model; and (vii) at least one of function outputs based on the model. Determining one parameter, (viii) a signal parameter from at least one determined parameter of the function output The processor programmed to perform the step of determining
With
This reduces screening time, reduces dwell time, improves resolution and / or increases throughput.
本発明の第6の態様において、本発明は対象物または複数の対象物内の化学的要素をスクリーニングする方法を提供し、該方法は、
スクリーニング装置の放射検出器から検出器出力データを収集するステップと、
検出器出力データにおける個別信号を分解する分解ステップであって、(i)デジタル系列として検出器出力データを得るまたは表現するステップ、(ii)データ内に存在する信号の信号形状を得るまたは決定するステップ、(iii)数学的変換による信号形状を変換することによって変換した信号形状を形成するステップ、(iv)数学的変換によりデジタル系列を変換することによって、変換した信号を有する変換した系列を形成するステップ、(v)少なくとも変換した系列および変換した信号形状の関数を評価し、これにより関数出力を得るステップ、(vi)モデルにより関数出力をモデル化するステップ、(vii)モデルに基づく関数出力の少なくとも一つのパラメータを決定するステップ、(viii)関数出力の少なくとも一つの決定したパラメータから信号のパラメータを決定するステップにより、前記分解を行う、該分解ステップと、
対象物または複数の対象における前記化学的要素の存在から生ずる、少なくとも信号形状、パラメータ、信号形状のエネルギーから化学的要素の量を決定するステップと、
を備えて、
これにより、スクリーニング時間を短縮し、ドウェル時間を短縮し、分解能を改善するおよび/またはスループットを増加する。
In a sixth aspect of the invention, the invention provides a method of screening for chemical elements in an object or objects, the method comprising:
Collecting detector output data from the radiation detector of the screening device;
A decomposition step of decomposing an individual signal in the detector output data, (i) obtaining or representing the detector output data as a digital sequence, (ii) obtaining or determining a signal shape of a signal present in the data Step, (iii) forming a transformed signal shape by transforming the signal shape by mathematical transformation, (iv) forming a transformed sequence having the transformed signal by transforming the digital sequence by mathematical transformation (V) evaluating a function of at least the transformed series and transformed signal shape, thereby obtaining a function output, (vi) modeling the function output by a model, (vii) a function output based on the model (Viii) determining at least one parameter of the signal from the at least one determined parameter of the function output. Performing the decomposition by the step of determining data, the decomposition step;
Determining the amount of the chemical element from at least the signal shape, parameters, energy of the signal shape resulting from the presence of the chemical element in the object or objects;
With
This reduces screening time, shortens dwell time, improves resolution and / or increases throughput.
本発明の各態様の様々な随意的な特徴は、本発明の任意な他の態様に適切かつ望ましい部分に使用できることに留意されたい。 It should be noted that various optional features of each aspect of the invention can be used where appropriate and desirable for any other aspect of the invention.
本発明をより明確に理解するため、好適な実施形態を、単なる例示として添付図面につき以下に説明する。 In order that the invention may be more clearly understood, preferred embodiments will now be described, by way of example only, with reference to the accompanying drawings, in which:
図1は本発明の第1実施形態による爆発物検出装置10を、スクリーニングすべき物品とともに示す概略図である。装置10は、パルス中性子要素解析検出器14を有し、当該検出器は、熱およびパルス中性子の両方を放出することができる中性子発生器と、ガンマ線エネルギースペクトル(このスペクトルから物品12の化学的組成を決定することができる)を発生するBGOシンチレーション検出器を備える。
FIG. 1 is a schematic view showing an
装置10は、さらに、パルス整形増幅器16と、パルス処理モジュール18と、データ記憶ラップトップコンピュータ20、ならびにパルス中性子要素解析検出器14の出力をパルス整形増幅器16に接続する同軸ケーブル22aと、パルス整形増幅器16の出力とパルス処理モジュール18のアナログ・フロント・エンドを接続するデータケーブル22bと、パルス処理モジュール18をコンピュータ20に接続するデータケーブル22cとを備える。
The
パルス処理モジュール18は信号処理ユニットを有し、当該ユニットは、2個の部分、すなわち1)検出器ユニットのアナログ出力に対応するデジタル出力を生成するアナログデジタルコンバータ、2)以下に説明する本発明によるデジタル信号処理(DSP)ルーチンを実装する処理ユニットを備える。
The
装置10は一般的に、装置10で収集するガンマ線スペクトルによる物品12の化学的組成を決定することにより、爆発物を検出するために使用する。装置10の検査(以下に説明する)は、同程度のシステムで現在容認可能な計数率の2倍の未処理計数率を過大に高パルス累積することなく使用できることを示唆している。したがって、装置10(または本発明による同程度の装置)をスクリーニング橋門(ポータル)に配備する場合、コンテナスクリーニングの処理量(スループット)は、次世代貨物スキャナの目標スキャン率と等しい、少なくとも40コンテナ/時間に増加することが期待される。(上述の)ポート・テクノロジー・インターナショナル(Port Technology International)の分析は、コンテナスクリーニングのスループットを50コンテナ/時間に増加することは、コンテナ当たりのコストを9.40USドル減少させると推定できると結論付けており、すなわち現在の検出器、線源および他の装置と同等のもので、装置10はかなりのコストを節減できると想定される。
The
もし次世代コンテナスクリーニングが、本発明なしで容易に40コンテナ/時間を達成する場合、本発明によれば、そのような設備はコンテナスクリーニングのスループットを80コンテナ/時間まで増加し、コンテナ当たりのコストをさらに削減可能であることが想定される。 If next generation container screening easily achieves 40 containers / hour without the present invention, according to the present invention, such equipment increases the container screening throughput to 80 containers / hour and costs per container. It is assumed that it can be further reduced.
図2は、検出器14のBGOシンチレーション検出器24の概略図である。中性子源14からの中性子により励起した物品12の原子によってガンマ線を発生するとき、ガンマ線はBGOシンチレーション検出器内を通過することができ、通過する場合、そのエネルギーは、ガンマ線からシンチレータ結晶内の電に転移する。紫外光子が発生する際に、電子はエネルギーを失い、結晶内部の電子を励起状態にする。紫外光子を発生する際に、電子は低エネルギー状態に減衰する。上述の紫外光子が、光電子増倍管32の光子カソードへと光学的な窓を通過し、光電子増倍管32のアノード40に到達する前に光電子増倍管38により光電子に変換され、順次増倍化される。さらなる増倍段階は、搭載の予増幅器42により行う。このようにして、電気信号(その振幅は入射ガンマ線のエネルギーに比例する)が、検出器24の検出器出力端子44に生ずる。検出器24は、さらに、光電子増倍管32の側面48に配置したミューメタル磁力シールド46であって、結晶28の一部の周りまで十分包囲して、光電子増倍管32の前方に延在するシールドを有するものと理解されたい。
FIG. 2 is a schematic diagram of the BGO scintillation detector 24 of the
この種のシンチレーション検出器は高効率を有する、すなわち、入射ガンマ線を検出する確率が高い。しかし、それらは検出器応答時間も比較的長くなる。検出器応答時間は、検出器が入射ガンマ線を検出してから次の入射ガンマ線を正確に検出できる状態に戻るまでに必要な時間である。長い検出器応答時間を有する放射能検出器は、したがって、パルスが累積し易い傾向を持つ。すなわち、それぞれがガンマ線の入射に対応する完全に離散した個別パルスより構成されるのが理想的な出力は、個別のパルスがオーバーラップしてしまい、特徴付けが困難な波形となる。 This type of scintillation detector has high efficiency, i.e. a high probability of detecting incident gamma rays. However, they also have a relatively long detector response time. The detector response time is a time required for the detector to detect an incident gamma ray and return to a state where it can accurately detect the next incident gamma ray. Radioactivity detectors with long detector response times therefore tend to accumulate pulses. That is, an output ideally composed of completely discrete individual pulses each corresponding to the incidence of gamma rays results in waveforms that are difficult to characterize because the individual pulses overlap.
図3a,3bおよび3cは、パルス累積の作用を示し、時間tに対するエネルギーE(ともに任意の単位)をプロットした信号またはパルスの例を示す。図3aは。いわゆる‘尾端累積’を示し、使用したパルス条件の種類に基づいて、1個のパルス51の尾端50に、大きな正または負のバイアスを付与し、図示の例においては後続パルス52の正の振幅を生ずる。2個のパルス間に時間差はあるが、Δtはパルスが有効である全体時間インターバルと比較すると相当大きく、信号エンベロープまたは合成波形54は第2パルス52の到着時にゼロを大幅に上回る。
FIGS. 3a, 3b and 3c show the effect of pulse accumulation and show examples of signals or pulses plotting energy E (both in arbitrary units) against time t. FIG. A so-called 'tail end accumulation' is shown, and a large positive or negative bias is applied to the
2個のパルス間に真の信号ゼロ状態が存在しないことは、パルス特性を損ね、第2パルスの振幅は第1パルスの尾端により誤って増幅されることになる。図3bは異なる形態のパルス累積を示し、‘ピーク累積’と称される。ここで2個のパルス56,58はほとんど時間差がなく到着し、すなわちパルス間の時間差Δtは、パルスが有効な全時間と比較して小さい。結果の出力波形60は、要素パルスのどちらかより振幅が大きい一つのパルスとして、より大きくまたは小さくなって表れる。検出器を通過するガンマ線束が激しい場合、検出器の応答時間内に複数のイベントが到着して複数の累積イベントにつながることがよく起こる。そのような場合を図3cに示す。複数信号またはパルス(62として図示する)が、ランダムな時間差Δtで到着するとき、合成波形64を生成するよう累積され、要素信号のパラメータを抽出することは難しい。
The absence of a true signal zero state between the two pulses impairs the pulse characteristics and the amplitude of the second pulse is erroneously amplified by the tail of the first pulse. FIG. 3b shows a different form of pulse accumulation, referred to as 'peak accumulation'. Here, the two
この実施形態により累積するパルスに対処する方法の一要素は、信号またはパルスの所定パラメータの推定であり、これらパラメータは検出器データストリームにおけるすべてのガンマ線の個数、到着時間およびエネルギーである。これらパラメータを、この実施形態によれば、データストリームにおける信号を数学的にモデリングすることにより推定する。この実施形態で使用するモデルは、以下に記載するようにデータおよび装置に対する所定の仮定を含む。 One element of the method for dealing with accumulated pulses according to this embodiment is the estimation of predetermined parameters of the signal or pulse, which are the number, arrival time and energy of all gamma rays in the detector data stream. These parameters are estimated according to this embodiment by mathematically modeling the signal in the data stream. The model used in this embodiment includes certain assumptions about data and devices as described below.
図4は、放射検出プロセスのモデル化を示すブロック図である。放射g(t)70は、測定プロセスm(t)により表される検出器72に入射し、結果として検出器から出力データy(t)を得る。サンプリング処理部76を追加することにより、デジタル検出データまたは「時系列データ」x[n]78を生成する。
FIG. 4 is a block diagram illustrating modeling of the radiation detection process. Radiation g (t) 70 is incident on
上記のモデルに、放射検出の物理的プロセスについてのいくつかの知識を加えることが可能である。図5は図4に示す検出プロセスのより詳細な数学モデルを示す。検出器への入力g(f)は、等式1により特徴付けることができ、式1において入力g(t)はΔ関数のようなランダム振幅(α)のインパルスの未知数(N)および到着時間(τ)で仮定される。このような入力の例を参照符号80で示す。

放射能検出器は、検出器インパルス応答性d(t)(またはデータ内の信号の信号形状と等価である)と称される、入射放射に対する特別な応答性を有し、参照符号82で示す。検出器インパルス応答性(すなわち信号形状)のデジタル化バージョンをd[n]で示す。
The radioactivity detector has a special responsiveness to incident radiation, referred to as detector impulse response d (t) (or equivalent to the signal shape of the signal in the data) and is indicated by
検出器からの出力を参照符号86示し、等式2により特徴付けられ、式2において、検出器出力y(t)は、所定信号形状d(t)である信号における未知の個数の合計であり、この信号形状は未知エネルギー(α)および未知到着時間(τ)を有する。ランダムノイズ源ω(t)もまた考慮する。デジタル検出器データx[n]88を、アナログデジタル変換器76により生成する。
アナログ―デジタル変換機76の出力におけるデジタル化信号x[n](データの時系列の構成要素である)を、参照符号88で示し、次式により与えることができ、すなわち、
ここでAはM×N行列であり、その入力(エントリー)は以下のように与える。
Here, A is an M × N matrix, and its input (entry) is given as follows.
さらに、Tはサンプルにおけるd[n]の長さであり、Mはデジタル化信号x[n]におけるサンプルの全個数であり、αはN信号エネルギーのベクトルであり、ωは長さMのノイズベクトルである。行列Aは、さらに以下のように記述することもできる。
したがって、行列Aの各列は信号形状の複数のバージョンを含む。個別列のそれぞれに対し、信号形状の開始点を信号の瞬間的位置により定義する。例えば、もしデータにおける信号が位置2,40,78,125で到着する場合、行列Aの列1は第1行において「0」、第2行に信号形状の第1データポイント、第3行に信号形状の第2データポイント等を有する。第2番目の列は、信号形状が続く行39まで「0」を有する。第3番目の列は行77まで「0」を有し、第4番目の列は行124まで「0」を有し、次に信号形状を有する。したがって、行列Aの大きさは、識別される信号の個数(これは列の個数である)により決定され、同時に行の個数は時系列におけるサンプル個数に対応する。
Thus, each column of matrix A includes multiple versions of the signal shape. For each individual column, the starting point of the signal shape is defined by the instantaneous position of the signal. For example, if the signal in the data arrives at
この実施形態の信号処理方法は、したがって、検出器出力における要素信号の個数(N)だけでなく各要素信号のエネルギー(α)および到着時間(τ)も含む検出器データにおける何らかの未知パラメータの正確な推定を得るよう尽力する。 The signal processing method of this embodiment thus accurately corrects any unknown parameters in the detector data including not only the number of element signals (N) at the detector output but also the energy (α) and arrival time (τ) of each element signal. I will try to get a good estimate.
信号処理方法
図6は、BGOシンチレーション検出器24を有する図1に示すパルス処理モジュール18の機能要素の概略的ブロック図であり、図1の装置が使用するパルス累積を復元する信号処理方法をより詳細に説明する。図6につき説明すると、BGOシンチレーション検出器24を、アナログ・フロント・エンド(AFE94)を介して(パルス処理モジュール18)のパルス処理ボード92に接続する。AFE94の目的は、この実施形態において、12ビット変換精度を有する125MHzでアナログデジタル変換を行うことにより、検出器16が生成した信号をデジタル化することである。
Signal Processing Method FIG. 6 is a schematic block diagram of the functional elements of the
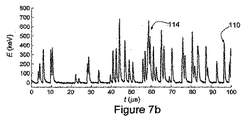
図7a,7bおよび7cは、1000μ秒、100μ秒および10μ秒のそれぞれの時間範囲にわたり、このようなデジタル化を行って得られた波形を示す。これら図面における様々なピークは、個々のガンマ線の検出に対応する。いくつかのピークは、1個のガンマ線のみの存在を示す離散したデジタル信号またはパルス110,112として表れる。他のピークは、2個のピーク116、または3もしくは4個のピーク114のいずれかの累積である。
Figures 7a, 7b and 7c show the waveforms obtained by performing such digitization over respective time ranges of 1000 μs, 100 μs and 10 μs. The various peaks in these figures correspond to the detection of individual gamma rays. Some peaks appear as discrete digital signals or
AFE94により検出器16の出力をデジタル化した後に、パルス累積を復元する信号処理方法を実装する。再度図6につき説明すると、AFE94が生成したデジタル信号を、パルス処理をする現場書き換え可能ゲートアレイ(FPGA)96内に通過する。パルス処理FPGA(96)は、この実施形態のパルス処理方法を実装し、デジタル信号処理コプロセッサ98を、随意的にパルス処理方法を使用して、パルス処理FPGA96を支援する。パルス処理FPGA96が必要とする変数、およびパルス処理方法の一時的ステップにおいて生成するデータを、随意的にメモリ100に記憶する。信号処理を、制御プロセッサ104に関連して、信号処理の実装を変更するのに使用できるデータ/制御インタフェース102により制御する。信号処理方法からの出力データを、データ/制御インタフェース102を介してディスプレイ106に表示する。ディスプレイ106を、所要に応じて後処理およびシステム制御を行うのに使用できるコンピュータ内に設ける。
After the output of the
図8は、この実施形態の検出器時系列における放射信号の累積を復元する信号処理方法の概略的ブロック図である。デジタル化検出器信号(AFE94からの)は、本発明信号処理方法用の入力段120を形成する。オフラインシステムの特性評価段122を使用して、特定のデジタル化検出器信号に固有の検出器インパルス応答性を決定する。システム特性評価段122における特性データは、パルス位置特定段124で使用する。パルス位置特定段124は、リアルタイムで、デジタル化検出器信号における放射パルスの個数および瞬間的位置(または到着時間)を推定する。パルス識別段126において、デジタル化検出器信号と、検出器インパルス応答性と、パルス位置特定段124からの出力を用いて、信号またはパルスのエネルギーを決定する。検証段128は、デジタル化検出器信号120とパルス識別段126の出力とを比較する。この比較結果が、いずれのパルスパラメータも不正確に推定されていることを示す場合、それらパラメータを廃棄して、有効なデータのみを出力130とする。検証段128において発生するエラー信号もシステム特性評価段122で使用する。検出器インパルス応答性が経時的に変動するような環境において、例えばコンポーネントの経年劣化、温度変化または放射線束の増加などがある場合、システム特性評価段122は、オンラインで、エラー信号を使用して適応的に検出器インパルス応答性を更新する。検出器インパルス応答性のこのような更新は、任意の適切な適応的方法、例えばS.ハイキン氏(S.Haykin)による「適応的フィルタ理論(2002年プレンティスホール社出版第4版)」に記載された最小2乗平均適応、正規化最小2乗平均適用、または帰納的最小2乗適用を用いて実行することができる。
FIG. 8 is a schematic block diagram of a signal processing method for restoring the accumulation of radiation signals in the detector time series of this embodiment. The digitized detector signal (from AFE 94) forms the
図9は、この実施形態による信号処理方法のフローチャートである。ステップ140において、キャリブレーションを実行する。このステップは、データ正則化または調節ステップ142と、データ選択およびフィッティングステップ144と、最適フィルタ構築ステップ146とを含む。データ正則化ステップ142において、入射する低い放射線束で記録されたキャリブレーションデータ信号を、データファイルからロードし、これらキャリブレーションデータの完全(整合)性をチェックし、基本データにおけるいかなるバイアスをも除去する。データ選択およびフィッティングステップ144は、一つの放射事象の検出に対応するデータのみを選択するステップと、検出器インパルス応答性のデータ基本モデルを構築するステップとを含む。つぎに、このモデルの関数形式を、適切な関数、例えば多項関数、指数関数またはスプライン関数をデータにフィッティングさせることにより取得する。この結果として、検出器の特定インパルス応答性d[n]を得る。最適フィルタ構築ステップ146はこの検出器インパルス応答性を用いて、逆フィルタまたは照合フィルタなどの適切なフィルタを検出器に対して構築する。
FIG. 9 is a flowchart of the signal processing method according to this embodiment. In
ステップ150においてデータを取得するが、このデータは著しくパルス累積によって影響を受けている可能性がある。データは、ファイルあるいは検出器要素16から直接の入力152とすることができる。
Data is acquired in
ステップ160において、信号処理ルーチンを適用して、時系列における信号の振幅およびタイミングパラメータを決定する。第1に、データに対して、基本データにおけるいかなるバイアスをも除去するために、正則化ステップ162を行う。次に、検出器データに、到着時間パラメータ(τ)およびパルス個数(N)の初期推定を得るために、ステップ146に由来するフィルタをコンボリュートする(畳み込む)。つぎに、時間パラメータおよびパルス個数の推定を、適切なピーク検出処理を用いて洗練化ステップ166を実行して、エネルギーパラメータ(α)を、τ、Nおよび検出器インパルス応答性d[n](線形プログラミング、行列反転または畳み込み(コンボリューション)技術によって)決定する。最終的に、個数(N)、エネルギー(α)、時間(Δt)および検出器インパルス応答性d[n]から、検出器データストリーム(x[n])の推定を作成するステップ168を実行する。
In
パラメータベクトル(α)を、線形プログラミング、または式4で定義される線型方程式のシステムにそのような等式のシステムを解くために用いる適切な方法を用いて解くことにより決定し、そのような方法の一つとしては、例えばG.H.ゴルブおよびC.F.ファン・ローン共著の[Matrix Computation, 2nd Ed Johns Hopkins University Press, 1989]に記載されているものがある。 The parameter vector (α) is determined by solving using linear programming or a system of linear equations defined by Equation 4 using an appropriate method used to solve such a system of equations, such a method For example, G.K. H. Golub and C.I. F. There are those described in [Matrix Computation, 2 nd Ed Johns Hopkins University Press, 1989] Fan loan co.
ステップ(170)において、上述した検証段(エラーチェックと称される)を実行し、この実施形態においては、検証は、1<i<Nの各信号i(Nはデータストリームにおける全信号個数である)に対応する1組のサンプルセットに対して順次に計算してエラー信号e[n]を決定するステップを含む。このエラー信号を、時系列データx[n]とモデルベースのデータストリーム(ステップ168のx^[n])との間における差の平方を決定するステップ172により計算する。e[n]は、したがって、x[n]とx^[n]との差の平方であり、式6として与えられる。
もしe[n]が所定閾値を越える場合、これらパラメータを拒否するステップ174を実行し、この状況は、信号パラメータが信号と容認可能に一致する(すなわち十分に正確である)対応信号モデルを生成しないことを示すからであり、関連する信号は、破損データを構築するとみなされ、さらなるスペクトル解析から除外する。閾値はデータに応じて変化することができ、モデル化するデータに対してどのくらい近似させるのが望ましいか、一般的にはしたがって、任意の特定用途において、閾値の検証および定義方法を選択して、用途要件を反映する。
If e [n] exceeds a predetermined threshold, execute
このような閾値の一例としては、適切な係数、例えば0.05で積算した信号エネルギーαiがある。検証は、この例において、式7に従えばモデルがデータ構成信号iに容認可能に一致するとみなす。
e[n]<0.05αi (7)
An example of such a threshold is signal energy αi integrated by an appropriate coefficient, for example 0.05. Verification assumes in this example that the model acceptably matches the data composition signal i according to Equation 7.
e [n] <0.05αi (7)
検証は、任意の他の適切な方法でエラー信号および閾値を定義することにより実行する。例えば、エラー信号を、エラーの絶対値に設定する。閾値は、信号振幅の0.05倍以外の倍数と定義することもできる。別の閾値は、多数のノイズおよび標準偏差を備える。 Verification is performed by defining error signals and thresholds in any other suitable manner. For example, the error signal is set to the absolute value of the error. The threshold can also be defined as a multiple other than 0.05 times the signal amplitude. Another threshold comprises a large number of noises and standard deviations.
閾値を減少すること(例えば式7におけるαiの係数を減少することによる)は、低いスループットでエネルギー分解を改善することができ、同時に、閾値を増加することは、減少したエネルギー分解でスループットを改善できる。 Decreasing the threshold (eg, by reducing the coefficient of αi in Equation 7) can improve energy resolution at low throughput, while increasing the threshold improves throughput with reduced energy resolution. it can.
ステップ180において、十分なデータが存在するか否かを決定する。存在しないなら、ステップ150で処理を継続する。存在する場合、この方法はステップ190に進む。ステップ190において、ガンマ線エネルギースペクトルを生成する。ステップ166で決定したガンマ線エネルギーパラメータであって、ステップ174で十分に正確であるとみなされたパラメータを、ヒストグラム形式で表示するステップ192を実行する。これが、スペクトル解析を実行したガンマ線エネルギースペクトルである。
In
信号処理方法の実施結果
図10a,10bおよび10cは、図8および9につき説明した、デジタル信号処理方法のいくつかの処理段階における結果をプロットしており、シンチレーションガンマ線検出器で収集したデジタル化データである。検出器データストリームを、125MHzおよび12bit精度でアナログデジタル変換器によりデジタル化し、使用するガンマ線源は、661.7keVで初期ガンマ線放射する137Cs源とした。
Results of Implementation of the Signal Processing Method FIGS. 10a, 10b and 10c plot the results at several processing stages of the digital signal processing method described with reference to FIGS. 8 and 9, and digitized data collected with a scintillation gamma detector. It is. The detector data stream was digitized by an analog-to-digital converter with 125 MHz and 12-bit accuracy, and the gamma ray source used was a 137Cs source emitting initial gamma rays at 661.7 keV.
シンチレーション検出器は、検出器/放射相互干渉により発生した光を使用し、その入射した放射を検出および測定する。シンチレーション検出器は、有機シンチレータまたは無機シンチレータを有する構成とすることができる。有機シンチレータは、有機結晶シンチレータおよび液状有機体溶液の両方を有し、この場合、シンチレーション材料を溶解して液体シンチレータを形成し、次にこの液体シンチレータをプラスチック化してプラスチックシンチレータを形成する。無機シンチレータは、NaI(TI)、BGO,CsI(TI)およびその他の結晶シンチレータ、および光子スイッチ検出器を有する構成とする(2個以上の異種シンチレータの組み合わせを共通PMTに光学的に結合し、シンチレータにおける減衰時間の差を用いて放射/検出相互干渉が起こった場所を決定する。)。 The scintillation detector uses light generated by detector / radiation mutual interference to detect and measure the incident radiation. The scintillation detector can be configured to have an organic scintillator or an inorganic scintillator. The organic scintillator has both an organic crystal scintillator and a liquid organic solution. In this case, the scintillation material is dissolved to form a liquid scintillator, and then the liquid scintillator is plasticized to form a plastic scintillator. The inorganic scintillator is configured to have NaI (TI), BGO, CsI (TI) and other crystal scintillators, and a photon switch detector (a combination of two or more different scintillators is optically coupled to a common PMT, The difference in decay time in the scintillator is used to determine where radiation / detection mutual interference has occurred.)
この例において、検出器は、76mm×76mmのNaI(TI)ガンマ線シンチレーション検出器とした。図10aは、信号処理方法により処理する前におけるデジタル化検出器データ200を、時間t(μs)対エネルギーE(keV)としてプロットし、要素信号の瞬間的位置およびエネルギーに関してプロットした信号処理方法の結果(例えば参照符号210で示す)とともに示す。例えば、元のデジタル化検出器データ200において1個のピーク220が約75.8μsの時点で現れるものは、それぞれ75.3および75.7μsにおける2個の異なる信号222,224に分解された。
In this example, the detector was a 76 mm × 76 mm NaI (TI) gamma ray scintillation detector. FIG. 10a shows the digitized
信号の決定された瞬間的位置、エネルギーおよび形状から、検出器データのモデルを生成できる。図10bは合成データモデル230を、時間t(μs)対エネルギーE(keV)としてプロットし、図10aに示したデジタル化検出器データストリーム200の一部である。反転したエラープロット240は、検出器データ200とデータモデル230の差の平方をプロットしており、モデル230におけるエラーを示す。エラー信号は、モデル230が検出器出力を正確に追従しているならば小さくなるが、検出器データのモデル230と検出器データ200自体との間に不一致があれば大きくなる。このエラー信号240に基づいて、信号処理方法により推定した信号パラメータを容認するか拒否するか否かの決定を行う。
From the determined instantaneous position, energy and shape of the signal, a model of detector data can be generated. FIG. 10 b plots the
図10cは、信号処理方法により生成したガンマ線エネルギースペクトル250を対数線形形式でプロットしている。容認されたエネルギーパラメータをヒストグラムとしてプロットし、ここで横軸は各ビンにおける各信号のエネルギーE(keV)であり、縦軸は、収集期間(本例において1s)に検出して決定したエネルギーの個数Nを表す。
FIG. 10c plots the gamma
図11は、ヨウ化ナトリウムNaI(TI)ガンマ線検出器を用いて収集したガンマ線エネルギースペクトルの一例をプロットしたものである。図11に示すガンマ線エネルギースペクトルは、ある計数率の範囲におけるパルス累積を復元する信号処理方法の性能を示す。実験データを、検出器のベース(モデル番号2007)に接続した、76mm×76mmのキャンベラ製のNaI(TI)ガンマ線検出器(モデル番号802)を使用して収集し、予増幅器は使用しなかった。信号処理ハードウェアを、65MHzおよび14ビットのアナログデジタル変換器により検出器のベースにおけるダイノード出力に接続した。 FIG. 11 is a plot of an example of a gamma ray energy spectrum collected using a sodium iodide NaI (TI) gamma ray detector. The gamma ray energy spectrum shown in FIG. 11 shows the performance of the signal processing method for restoring the pulse accumulation in a certain count rate range. Experimental data was collected using a 76 mm x 76 mm Canberra NaI (TI) gamma ray detector (model number 802) connected to the base of the detector (model number 2007) and no preamplifier was used. . Signal processing hardware was connected to the dynode output at the base of the detector by a 65 MHz and 14 bit analog to digital converter.
NaI(TI)結晶を、平行化(コリメート)したガンマ線ビームにより照射して、検出器の中央部がガンマ線のほぼ平行なビームにより十分に照射されることを確実にし、ビーム直径は50mmとした。 The NaI (TI) crystal was irradiated with a collimated gamma ray beam to ensure that the center of the detector was sufficiently irradiated with a substantially parallel beam of gamma rays, and the beam diameter was 50 mm.
0.37GBqおよび3.7GBqの2個の137Csガンマ線源を、3個の較正したアルミニウム透過フィルタと組み合わせて使用し、検出器面におけるガンマ線束の範囲を確保した。検出器の線源に対する距離は、データ収集中、一定に維持した。 Two 137Cs gamma radiation sources, 0.37 GBq and 3.7 GBq, were used in combination with three calibrated aluminum transmission filters to ensure a range of gamma flux at the detector plane. The distance of the detector to the source was kept constant during data collection.
図11につき説明すると、スペクトル260,262,264,266,268および270を、それぞれ529kHz,230kHz,167kHz,124kHz,67kHz,9kHzの計数率で収集した。予想通りに、装置で収集して本実施形態の方法により処理したデータは、計数率が増加するにつれて悪化した。ピークエネルギー(すなわち661.7keV)に対するパーセント表示をすると、ピークの最大値半分における全幅(FWMH)はそれぞれ、9.6%,7.3%、7.1%、6.9%、6.7%、6.7%であるとわかる。9kHzから230kHzまでの計数率に対して、661.7keVにおける137Csガンマ線エネルギーピークの分解能は7.5%以下で維持される、すなわち、NaI(TI)検出器から25倍以上の計数率の増加にもかかわらず、661.7keVにおけるエネルギー分解能は0.5%未満だけしか減少しない。
Referring to FIG. 11,
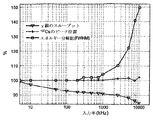
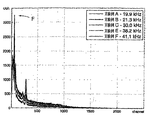
本実施形態の信号処理方法の性能を、さらに図12および13に示す。これら二つの図面はコンピュータシミュレーションの結果として生成し、入力計数率を正確に制御し、したがって、入力計数率を極めて広範囲で考慮できる。図12は、0.1〜2.5MHzの入力計数率に対する信号処理方法(すなわち正確に検出した入力計数率の部分における)スループットを対数−対数形式でプロットしている。理論上の限界(すなわちスループットと入力が等しい)を破線で示す。この図面により、広範囲の入力計数率にわたり、信号処理方法のスループットは、90%以上を維持することを示す。 The performance of the signal processing method of this embodiment is further shown in FIGS. These two figures are generated as a result of computer simulation and accurately control the input count rate, so that the input count rate can be considered in a very wide range. FIG. 12 plots the signal processing method (ie, in the accurately detected portion of the input count rate) throughput in log-log format for input count rates of 0.1-2.5 MHz. The theoretical limit (ie, throughput equals input) is shown with a dashed line. This figure shows that the throughput of the signal processing method remains over 90% over a wide range of input count rates.
図13は、図12と比較可能であり対数−線形形式でプロットしているが、で0.0005〜10MHzの入力係数率についてのスループットのパーセント表示である。さらに、図13は本実施形態の信号処理方法のエネルギー分解能およびピーク位置性能をプロットしている。137Csピークのエネンルギー分解能は、0〜2.5MHzにわたり10%未満で降下し、ピーク位置はその範囲でほとんど変化しないことを示す。 FIG. 13 is comparable to FIG. 12 and is plotted in log-linear format, but is a percentage display of throughput for an input coefficient rate of 0.0005 to 10 MHz. Further, FIG. 13 plots the energy resolution and peak position performance of the signal processing method of this embodiment. The energy resolution of the 137Cs peak falls below 10% over 0-2.5 MHz, indicating that the peak position hardly changes in that range.
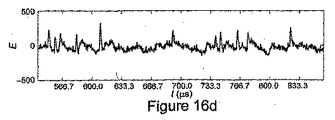
図14a,14b,14c,14dは、さらに、76mm×76mmのNaI(TI)ガンマ線検出器の出力に対する本実施形態のパルス累積復元に、信号処理方法を適応した結果を示す。データの約14μsを使用して、これら図にプロットしたデータを生成する。図面は時間t(μs)に対して任意の単位でエネルギーEをプロットしている。 14a, 14b, 14c, and 14d further show the results of applying the signal processing method to the pulse accumulation restoration of the present embodiment for the output of the 76 mm × 76 mm NaI (TI) gamma ray detector. Approximately 14 μs of data is used to generate the data plotted in these figures. The figure plots energy E in arbitrary units against time t (μs).
図14aはAFE94をプロットしており、65MHzのアナログデジタル変換率および14ビットの分解能を用いて、検出器の経時的に変動する電圧出力をデジタルデータに変換する。図14bは本発明方法を適用した結果をプロットしている。信号の瞬間的位置(垂線で示す)を、要素信号のエネルギー(×印で図示する)を有するように分解する。要素信号の瞬間的位置およびエネルギーを上記のように、信号形状と組み合わせて、ガンマ線検出器出力のモデルを決定するために用いて、結果として得られたモデルを図14cにプロットする。
FIG. 14a plots
ガンマ線検出器のデジタル化出力をガンマ線検出器のモデルと比較して、ガンマ線検出器の特性決定するステップにおいて作成したエラー推定を導き出す。このエラー信号を図14dにプロットする。次にこのエラー信号に基づいて、信号パラメータ推定を排除する閾値を決定することが可能であり、信号エネルギーの推定を容認または拒否するための決定を、振幅または信号ピークの近傍におけるエラーにより決定する。 The digitized output of the gamma ray detector is compared with a model of the gamma ray detector to derive an error estimate created in the step of characterizing the gamma ray detector. This error signal is plotted in FIG. 14d. Based on this error signal, it is then possible to determine a threshold that eliminates the signal parameter estimate, and the decision to accept or reject the signal energy estimate is determined by the error in the vicinity of the amplitude or signal peak. .
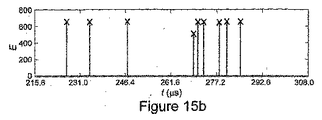
図15a,15b,15c,15dは、半導体(または固体)検出器で収集したデータに対して、本実施形態のパルス累積を復元する信号処理方法を適用した結果を示す。このような検出器は、電子孔対を形成する半導体の結晶格子内における電子に対して入射する放射の相互作用を使用する。これら検出器の例としては、高純度ゲルマニウム(HPGe)検出器、シリコンダイオード検出器、半導体ドリフト検出器(例えば、シリコンドリフト検出器)、カドミウムテルライド(CdTe)検出器およびCZT検出器がある。 15a, 15b, 15c, and 15d show the results of applying the signal processing method for restoring the pulse accumulation of this embodiment to data collected by a semiconductor (or solid-state) detector. Such detectors use the interaction of incident radiation with respect to electrons in the semiconductor crystal lattice forming electron hole pairs. Examples of these detectors include high purity germanium (HPGe) detectors, silicon diode detectors, semiconductor drift detectors (eg, silicon drift detectors), cadmium telluride (CdTe) detectors, and CZT detectors.
したがって、図1の装置を使用し、検出器16の代用としてキャンベラ・インダストリー(Canberra Industry)社製の高純度ゲルマニウム(HPGe)検出器の形式とした検出器ユニットと、中性子源および試料の代わりに57Coガンマ線源(その2個の主要ガンマ線は122.1keVおよび136.5keVのエネルギーを有する)を使用する。HPGe検出器の出力を、予増幅器に、次にオーテック(Ortec)社製のパルス整形増幅器に供給する。データの約92μsの範囲を収集し、時間t(μs)対任意単位のエネルギーEをデータから生成して、図15a,15b,15c,15dにプロットする。図15aは、AFE94の出力をプロットする。検出器の経時的に変動する電圧出力を,65MHzのアナログデジタル変換率の14ビット分解能で、デジタルデータに変換する。図15bは、本発明方法を適用した結果をプロットする。信号の瞬間的位置(垂線で示す)を分解して、要素信号のエネルギー(×印で図示する)を得る。瞬間的位置、要素信号のエネルギーおよび信号形状を使用して、処理したHPGe検出器出力のモデルを決定し、このモデルを図15cにプロットする。
Therefore, using the apparatus of FIG. 1, a detector unit in the form of a high-purity germanium (HPGe) detector manufactured by Canberra Industry as an alternative to
図15dはデジタル化したHPGe検出器の処理出力と出力モデルの比較から得たエラー信号をプロットする。エラー信号を使用して、信号パラメータ推定を排除する閾値を決定することができる。 FIG. 15d plots the error signal obtained from a comparison of the digitized HPGe detector processing output and output model. The error signal can be used to determine a threshold that eliminates signal parameter estimation.
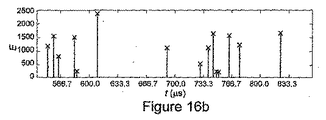
図16a,16b,16c,16dは、本発明実施形態のパルス累積復元信号処理方法を、X線を検出するのに用いるガス比例検出器の出力に、適用した結果を示す。ガス比例検出器は、固体検出器と同様の挙動を有する検出器である。ガス比例検出器は、チャンバ内のガスに対する放射の相互作用に基づく。電場を、チャンバ内で軸方向ワイヤとチャンバ壁との間に生成する。ガスを通過する放射はガスをイオン化して電子を発生し、この電子を電場によってワイヤに収集し、検出器データとして出力する。 FIGS. 16a, 16b, 16c, and 16d show the results of applying the pulse accumulation / restoration signal processing method of the embodiment of the present invention to the output of a gas proportional detector used for detecting X-rays. The gas proportional detector is a detector having a behavior similar to that of a solid state detector. The gas proportional detector is based on the interaction of radiation with the gas in the chamber. An electric field is generated in the chamber between the axial wire and the chamber wall. Radiation passing through the gas ionizes the gas to generate electrons, which are collected on a wire by an electric field and output as detector data.
したがって、図1の装置10を使用して、検出器16の代用としてキセノンガス比例検出器の形式とした検出器、およびスクリーニングすべき物品以外にX線回折装置からのX線発生器を有する。約300μsにわたるデータを収集し、時間t(μs)対任意単位のエネルギーEをデータから生成し、図16a,16b,16cおよび16dにプロットする。前の例に比べて、著しく大きいデータ収集期間を用いており、これはキセノンガス比例検出器の減衰時間が比較的長い(50μs以上)からである。この理由のためにAFE94のサンプリング率に減少した。
Accordingly, the
図16aはAFE94の出力をプロットしたものであり、この例において、15MHzのアナログデジタル変換率、および14ビットの分解能を使用して、検出器の経時的に変動する電圧出力をデジタルデータに変換する。X線信号の瞬間的位置(垂線で図示する)を分解し、要素信号のエネルギー(×印で示す)を得る。要素信号の瞬間的位置およびエネルギーを上記のように用いて、信号形状とあわせて、キセノンガス比例検出器出力のモデルを決定し、;結果のモデルを図16cにプロットする。
FIG. 16a is a plot of the output of
キセノンガス比例検出器のデジタル化出力を、キセノンガス比例検出器の特徴付けにより作成したエラーの推定を得るために、キセノンガス比例検出器出力のモデルと比較する。エラー信号を図16dにプロットする。このエラー信号を、信号パラメータ推定を使用して排除する閾値を決定し、例えば、信号処理方法により推定した信号パラメータを容認または拒否する決定を行う。 The digitized output of the xenon gas proportional detector is compared with a model of the xenon gas proportional detector output to obtain an error estimate generated by the characterization of the xenon gas proportional detector. The error signal is plotted in FIG. 16d. A threshold for eliminating this error signal using signal parameter estimation is determined, for example, a determination is made to accept or reject the signal parameter estimated by the signal processing method.
複数信号形状
大容量の固体検出器等、いくつかの検出器タイプに対して、所定信号形状は、可能性のある複数の信号形状の一つとすることができる。これは検出器タイプに固有のもの、または温度もしくは他の測定固有要因に依存するものとすることができる。
Multiple signal shapes For some detector types, such as large capacity solid state detectors, the predetermined signal shape can be one of a plurality of possible signal shapes. This may be specific to the detector type or may depend on temperature or other measurement specific factors.
例えば、CsI(TI)検出器はシンチレーション検出器であり、中性子またはガンマ線のどちらを検出するかに基づいて、2種類の異なる信号形状が存在する。固体放射検出器は、放射の一形式のみを検出するときでも経時的に変動する信号形状を示し、大容量の高純度ゲルマニウム(HPGe)検出器は、例えば、形状が放射と検出器との間における相互作用の特定部位に基づく出力信号を生成する。HPGe検出器のゲルマニウム結晶に対する放射の相互干渉は、多数の電子−孔対を生成し、放射で誘発される電荷は、電子および孔の両方が帯電する。しかし、電子および孔は異なる速度でHPGe検出器を通過し、したがって電子が生成した電荷パルスは、孔が生成した電荷と異なる形状となる。したがって、検出器が生成するパルス(電子および孔の双方が帯電する電荷の合計)は、相互作用位置に基づく形状となる。 For example, the CsI (TI) detector is a scintillation detector, and there are two different signal shapes based on whether neutrons or gamma rays are detected. Solid-state radiation detectors exhibit a signal shape that varies over time even when detecting only one type of radiation, and high-capacity, high-purity germanium (HPGe) detectors, for example, between the radiation and the detector Generate an output signal based on the specific site of interaction at. The mutual interference of radiation on the germanium crystal of the HPGe detector creates a large number of electron-hole pairs, and the charge induced by radiation charges both the electrons and the holes. However, the electrons and holes pass through the HPGe detector at different rates, so the charge pulses generated by the electrons will have a different shape than the charges generated by the holes. Therefore, the pulse generated by the detector (the sum of charges charged by both electrons and holes) has a shape based on the interaction position.
したがって、複数の信号形状は、これら変化する物理的メカニズムの結果である。各信号形状は、d1[n],d2[n]…dQ[n]で示し、この場合、Qは特定検出器タイプにより発生する、異なる信号形状の総数である。可能性のある信号形状のそれぞれを、一つの形状を有するデータ信号形状を特徴付けする方法と同様の方法で特徴付けする。しかし、複数の信号形状で、キャリブレーション(較正)処理を、適切な長さの時間にわたり拡張して実施し、全ての可能性のある信号形状を識別して特徴付けすることを確実にし、瞬間的位置および信号エネルギーを含む信号パラメータの推定は、識別したデータストリーム内における各信号の形状を識別した後に実行することができる。 Thus, multiple signal shapes are the result of these changing physical mechanisms. Each signal shape is denoted by d1 [n], d2 [n]... DQ [n], where Q is the total number of different signal shapes generated by a particular detector type. Characterize each possible signal shape in a manner similar to that of characterizing a data signal shape having one shape. However, with multiple signal shapes, the calibration process can be extended over an appropriate length of time to ensure that all possible signal shapes are identified and characterized Estimation of signal parameters including target position and signal energy can be performed after identifying the shape of each signal in the identified data stream.
これら信号パラメータを正確に推定するためには、上述の方法(単独の信号形状を有するデータに対して)のあり得る多数の拡張したアプローチ(手法)を使用することができる。 To accurately estimate these signal parameters, a number of possible extended approaches of the above method (for data with a single signal shape) can be used.
1.信号の瞬間的位置および信号のエネルギーを含む信号パラメータを、第1信号d1[n]のような同一形状を有するデータストリームにおける全ての信号を取り扱うことにより、データストリームにおける各信号を推定する。信号形状d1[n]と容認可能に一致しない信号のパラメータは検証段階で拒否し、パラメータがうまく推定され、したがって信号形状d1[n]と容認可能に一致する信号を、データストリームから取得する。この処理を順次d2[n]からdQ[n]まで繰り返し、各段階において信号パラメータを、その段階で使用する信号形状を持つ信号に対して推定する。各段階において、行列式4を、p回繰り返して信号形状dp[n]を用いて構築した行列Aにより解く。この処理が完了する際に、あらゆる複数の信号形状に対する検証段階でパスしなかった信号は、いかなる複数の信号形状とも容認可能に一致しないものとして拒否する。 1. Each signal in the data stream is estimated by handling all signals in the data stream having the same shape, such as the first signal d1 [n], with signal parameters including the instantaneous position of the signal and the energy of the signal. The parameters of the signal that do not acceptably match the signal shape d1 [n] are rejected in the validation phase, and a signal is obtained from the data stream whose parameters are well estimated, and therefore acceptably match the signal shape d1 [n]. This process is sequentially repeated from d2 [n] to dQ [n], and signal parameters at each stage are estimated for a signal having a signal shape used at that stage. At each stage, the determinant 4 is solved by a matrix A constructed using the signal shape dp [n] by repeating p times. Upon completion of this process, signals that did not pass in the verification stage for any of the plurality of signal shapes are rejected as not acceptably matching any of the plurality of signal shapes.
2.アプローチ1の変更例として、信号パラメータを信号形状のそれぞれに対して順番に推定するが、この信号は各段階において取得しない。代わりに、推定した信号を最終信号検証段階で用いて、データストリームの最適な総合推定を与える信号形状および信号パラメータを決定する。このことにより、信号パラメータを推定するのに使用されなかった信号形状であるとき、信号は一信号形状であると不正確に推定される可能性を許容する。 2. As a modification of approach 1, signal parameters are estimated sequentially for each of the signal shapes, but this signal is not acquired at each stage. Instead, the estimated signal is used in the final signal verification stage to determine the signal shape and signal parameters that give the optimal overall estimate of the data stream. This allows the possibility that the signal is incorrectly estimated to be a single signal shape when the signal shape is not used to estimate the signal parameters.
3.アプローチ1の他の変更例として、2個の信号形状、例えば便宜上d1[n],d2[n]の線形的結合としてdp[n]の各信号形状をモデル化することができる。したがって、p番目の信号形状dp[n]は、次式のようにモデル化できる。
したがって、このアプローチ3は、実際上、無制限な数の信号形状を表現できる。
Therefore, this
4.アプローチ3の他の変更例として、2個の信号形状の線形結合に対する複数信号形状それぞれの分解手段を、一般的な場合に拡張して、複数の信号形状を、任意な個数の信号形状の線形結合として分解できる。
4). As another modification of
実験例
装置10を、検査物品12とともに検出器14を遮蔽室内に配置することにより検査した。検出器14は、SALC(商標)PELAN検出器とした。
Experimental Example The
オシロスコープを用いて、パルス整形増幅器16からの出力パルスをパルス処理モジュール18におけるADCsの入力段の±1ボルト範囲内に維持することを決定する。図17には、パルス処理モジュール18を用いて収集した、検出器14からのデジタル化出力の表示区域を示す。パルス整形増幅器における設定は全ての実験例に対して一定に維持し、この設定は、1μsのパルス整形、5×0.5のゲイン、単極パルス整形とした。
Using an oscilloscope, it is determined to maintain the output pulse from the
5種類の実験環境を、条件範囲の下でパルス処理性能を評価するよう設けた。実験変数を表1に示す。第1データ収集実験において、水を収容した袋のみを検出器14の前方に配置したが、次の実験(より関心のあるスペクトルにするため)では、「ポリ」目標対象物を追加した。
分析の目的は、各線源構成における放射エネルギースペクトルを決定することであった。 The purpose of the analysis was to determine the radiant energy spectrum in each source configuration.
分析をオフラインで行い、記録データを、処理モジュール18内に送って再生し、パルス処理の出力を使用して、コンピュータ20上で表示するためエネルギースペクトルを生成した。分析処理を図8に示し、分析の中間ステップも示す。
The analysis was performed off-line, and the recorded data was sent into the
パルス処理モジュール18の様々な段からのデータを、図18に示す。上から下まで順番に、(i)14ビットの精度および26.5MHzで作動したAFE94からの出力であり、約381μsの期間にわたるデジタル化検出器データを示し、(ii)パルス位置決定段の出力であり、データストリームにおける各ガンマ線事象の瞬間的位置を識別する出力を垂線により示し、(iii)パルス識別段の出力であり、全ガンマ事象のエネルギーを推定し、元のシステム入力データに重ねて出力を示し、パルス処理モジュール18の累積復元関数を示し、これにより複数の累積パルスでさえも正確に特徴付けすることができる、(iv)検証段の出力であって、推定した全信号パラメータの正確性を決定するために用いて、サンプル8300などに見られるような、検証信号における大きなスパイクを識別し、不正確な信号推定を廃棄する。
Data from various stages of the
パルス処理の実行に加えて、検出器14の中性子源をオン状態にしてデータのどの部分を記録するか、線源をオフ状態にしてデータのどの部分を記録するかを決定する必要がある。実験の設定(セットアップ)において、この同期データは利用可能ではなく、したがって、データを検査して、中性子源の負荷時間率(10μsはオン状態で、90μsはオフ状態)を理解することに基づいて、線源がオンかオフかを決定した。しかし、同期信号がない場合、この割り当てはエラーの影響を受けやすく、以下の問題を起しやすい。すなわち、
1.線源がオフ状態であるのに、線源がオン状態であると割り当てられた信号はオン状態である期間中の検出数は線源がオフ状態のときよりも相当多いので、「線源オン状態時」スペクトルの著しい劣化は起こりにくい。
2.線源がオン状態であるのに、線源がオフ状態であると割り当てた信号は、この種の誤割り当ては、「線源オフ状態時」スペクトルの劣化を起しがちである。さらなる誤検出もあり得るため、特徴分解は、同期信号が利用可能であるのが望ましい。
In addition to performing the pulse processing, it is necessary to determine which part of the data is recorded with the neutron source of the
1. Since the number of detections during the period when the source is in the on state, even though the source is in the off state, is significantly higher than when the source is in the off state, Significant degradation of the “on-state” spectrum is unlikely.
2. Signals assigned as the source is off while the source is in the on state are prone to this type of misassignment resulting in spectral degradation “when the source is off”. Since there may be further false detections, it is desirable for feature decomposition to be able to use a synchronization signal.
実験結果
6回の実験を、表1に示した様々な目標対象物設定および中性子強度で行った。各実験において、データをパルス整形増幅器16の出力で記録した。各実験において、1000個のデータファイルを記録し、各データは260,000個のデータサンプルを有する、または26.25MHzのサンプリング率で約9.9msの期間にわたるデータを有する。したがって、各実験に関して10秒未満の期間にわたるデータ全体を記録した。
Experimental Results Six experiments were performed with various target object settings and neutron intensities shown in Table 1. In each experiment, data was recorded at the output of the
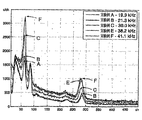
実験例A,B,C,E,Fの間に収集した処理データの結果を図19〜25に示す。これら図面は、各実験で生成したエネルギースペクトルを示し、チャネル数に対する計数(カウント)としてプロットした。(実験例A,B,C,E,Fの)5個のスペクトルは、それぞれの場合で重なり合うので、スペクトル間の差が観察できる。いくつかの場合において、スペクトルを実験に応じてさらにラベル付けする。図19〜21は複合ガンマ線スペクトルであり、これらスペクトルは、中性子源がオン状態のときおよびオフ状態のときで影響を受ける。図22および23は中性子パルス発生中で収集したスペクトルであるとともに、図24および25は中性パルス発生事象相互間で収集したスペクトルを示す。 The results of the processing data collected during Experimental Examples A, B, C, E, and F are shown in FIGS. These figures show the energy spectrum generated in each experiment, plotted as a count against the number of channels. Since five spectra (experimental examples A, B, C, E, and F) overlap in each case, the difference between the spectra can be observed. In some cases, the spectra are further labeled depending on the experiment. 19-21 are composite gamma ray spectra, which are affected when the neutron source is in the on state and in the off state. 22 and 23 are spectra collected during neutron pulse generation, and FIGS. 24 and 25 show spectra collected between neutral pulse generation events.
特に、図19は「線源オン状態」および「線源オフ状態」の双方における全体エネルギーである。図20は「線源オン状態」および「線源オフ状態」の双方における低エネルギーである。図21は「線源オン状態」および「線源オフ状態」の双方における高エネルギーである。 In particular, FIG. 19 shows the total energy in both the “source on state” and the “source off state”. FIG. 20 shows low energy in both “source on state” and “source off state”. FIG. 21 shows high energy in both the “source on state” and the “source off state”.
図22は「線源オン状態」スペクトルの低エネルギースペクトルである。図23は「線源オン状態」スペクトルの高エネルギースペクトルである。図24は「線源オフ状態」”スペクトルの低エネルギースペクトルである。図25は「線源オフ状態」”スペクトルの高エネルギースペクトルである。 FIG. 22 is a low energy spectrum of the “source on state” spectrum. FIG. 23 is a high energy spectrum of the “source on state” spectrum. 24 is a low energy spectrum of the “source off state” spectrum. FIG. 25 is a high energy spectrum of the “source off state” spectrum.
これら図面に存在するデータは、装置10の性能を示す。パルス処理モジュール18のスループット(処理量)能力は図20および21から特に明らかとなり、検出器内のカウント記録が20kHzから丁度40kHzを越えるように2倍にすることは、エネルギーピークの高さでも同様の増加を生成する。このことは、パルス処理モジュール18は高スループットを維持して、パルス累積による損失が少ないという考察を支持する。
Data present in these drawings indicates the performance of the
処理モジュール18のデッド時間を図26に示す。上から下まで順番に図26は、(i)十分なパルス累積が確実に存在する、実験例F(例えば図17)中に検出器14から受信した入力データストリーム、(ii)パルス位置特定出力、(iii)パルス識別出力、(iv)検証エラー信号を示す。図26は、どのようにパルス累積を、2個のパルス累積および決定した相対エネルギーの合計として正確に推定するかを示す(1.7μsの期間にわたる実験例では順次のパルス間に遅延を有する)。
The dead time of the
本発明の別の実施形態によれば、図27においてスクリーニングする貨物284を運ぶトラック282(背面図)とともに線図的に示す貨物スクリーニング装置280を提供する。装置280は、図1の装置10と多くの点で同様であり、同様の特徴を同様の参照符号で示す。
According to another embodiment of the present invention, a
しかしながら、装置280は、パルス中性子源および個別のガンマ線検出器288を有する点で図1の実施形態と異なる。このことは、貨物または積荷284を、中性子源286と検出器288との間に配置して検査することができる。
However, the
検出器288の出力を、同軸ケーブル22aを介して、パルス整形増幅器16内に供給する。中性子源286は同期信号を出力して、同期信号をデータケーブル22dによりパルス処理モジュール18に送信し、所要に応じて、検出器からの信号を中性子源がオン状態またはオフ状態に応じて分離して分析することができる。
The output of the
図28は、本発明の別の実施形態による中性子活性化技術により、薬、化学物質および爆発物などの不法物品を検出するためのスクリーニングシステム290の概略図である(検査する物品を、図示の例ではスーツケース292の形式として示す)。スクリーニングシステム290は、片側構成とし、それぞれスーツケース292と同じ側面側に配置した放射源294および放射能検出器296を有する。放射源294は、この実施形態において、電気的中性子発生器(ENG)を備え、他の実施形態と同様に、AmBe源またはCf252源などの同位体源を備えることができる。ENGの中性子出力は、同位体源の出力より著しく高く、また使用していないときにスイッチを切ることができるため中性子源はより安全である。中性子をENG内で、3重水素または重水素ターゲット298内に重水素イオンを電気的に加速させることにより発生する。ENG294は何100kHzまでの率のパルスを発生することもでき、連続する中性子またはガンマ線流束の時間的分布を分析するために用いることができる。ENG294は、ENG94の作動を制御するための電子的サブシステム300を有し、作動は中性子の生成およびフェールセーフシステムの双方を含む。
FIG. 28 is a schematic diagram of a
使用にあたり、ENG294は等方的に中性子を発射し、スーツケース292と相互作用する。これら中性子はスーツケース292の構成要素と相互作用し、放射流束を放射検出器296により検出する。放射は、後方散乱中性子およびガンマ線を含み、検出器296は中性子検出器およびガンマ線検出器の両方を備える。他の実施形態において、検出器296は用途に応じて、中性子検出器のみ、またはガンマ線検出器のみを備えることができる。
In use,
スクリーニングシステム290は、さらに、ENG294と放射能検出器296との間にシールド302を備え、スーツケースと相互作用しない放射源の直接検出を削減する。スクリーニングシステム290は、検出器296により出力する信号を増幅する増幅器304と、図9の実施形態のパルス累積を復元する信号処理方法により増幅信号を受信および処理する検出電子機器306を有する。
The
スクリーニングシステム290は、さらに、測定中にシステム290を支持する安定化アームを有する。このような測定は、検査する物品、物品内に存在する不法品の量、および容認可能な測定信頼性があるとみなせるものに基づいて2〜5分行う。例えば、この装置から30cmに位置するスーツケース内の1kgの爆発物TNTを検出するには5分かかり、より大質量のTNTは、例えば5kgであれば、2分で済む。
The
この実施形態において、検出器296はビスマスゲルマニウム(BGO)シンチレーション検出器を備えて、光電子増倍管との組み合わせで、光電子への放射事象を検出する発射光を変換するために用いて、光電子を迅速に増幅および処理する(検出電子機器306による)。BGO検出器は、優れた放射耐性、入射する放射事象の高検出効率(その高濃度および高Z値)、および機械的強度を有する利点がある。しかし、BGOシンチレーションに基づく検出システムは約3μsのデッド時間を有するために、300nsの減衰期間を有するシンチレーション光出力を有するものとする(デッド時間は、ある事象を検出した後に、いかなる連続事象をも正確に検出できない期間である)。もし2個の事象がデッド時間内に起こったなら、それらは互いの頂点で累積し、各事象のエネルギーを正確に決定できない。このことが起こるとき、全累積事象は、結果として生ずるエネルギースペクトルが誤っていることを確実になくすために廃棄する。
In this embodiment, the
図29aおよび図29bは、検出器のパーセント表示スループット(処理量)の計算結果を、すなわち、パルス累積により影響を受けない放射事象の入力を、入力計数率に対して、スクリーニングシステム290(320aおよび320bで星印プロット)、および従来のデータ処理を行うように変更したスクリーニングシステム290(322aおよび322bで丸印プロット)の双方についてプロットする。双方の場合について、スクリーニングシステム290のデッド時間を3μsと仮定する。80kHzの入力計数率において、検出器296上で衝突する全事象のおよそ40%を、従来データ処理を実行するときのパルス累積のために失われる。
FIGS. 29a and 29b show the results of calculating the percent display throughput (throughput) of the detector, i.e., the input of radiation events not affected by pulse accumulation, against the input count rate, screening system 290 (320a and 29a). The plot is for both the star plot at 320b) and the
図30は同様のデータを、スクリーニングシステム290(320cで星印プロット)、および従来のデータ処理を行うように変更したスクリーニングシステム290(322cで丸印プロット)の双方についてプロットするが、しかし、出力計数率(9kHz)を入力計数率(kHZ)に対してプロットする。理想限界(すなわち、スループットは入力に等しい)を破線で示す。図から明らかなように、計数率はすぐに頂点となり(ポイント330参照)、入力計数率のさらなる増加は、検出事象数を増加しない。BGO検出器は、固定デッド時間を有し、したがって、入力計数率が増加するにつれて、累積の可能性が増加する。この理由は、入力計数率が増加するにつれて、パルス累積による破損データを廃棄しなければならず、使用できないからである。
FIG. 30 plots similar data for both the screening system 290 (star plot at 320c) and the
図29aを参照すると、従来のデータ処理を行うスクリーニングシステム290が40%のデッド時間(つまり80kHz)を有する入力計数率において、本実施形態によるスクリーニングシステム290は98%(ポイント326参照)程度のスループットを有する。したがって、分析する特定物品およびENG294の中性子出力流束に基づいて、不法品の検出に必要な時間を減少する。したがって、物品のスクリーニングは従来のデータ処理に必要な時間の65%以下で完了することが予想できて、例えば上記のシナリオのようにTNT爆発物1kgに対して3.25分、5kgのTNT爆発物に対して1.33分で済む。
Referring to FIG. 29a, the
さらに、スクリーニングシステム290は、BGOなどの従来シンチレーション検出器および従来電子機器の性能に対して著しく高い計数率で作動することができる。図29aおよび29bは、入力計数率800kHZでさえ、スクリーニングシステム290により達成するパーセント表示スループット内に小さな減少のみがあることを示す。800kHzの入力計数率(点328)において、スループットは85%以上を維持する。
Further, the
検出器296に対する入力計数率を800kHzとする作動点をENG294について選択する場合、爆発物または他の不法品についてスーツケース292を検査するために必要な時間をさらに削減することが可能であり、これら結果から、1kgのTNT爆発物をおよそ30sで検出し、5kgのTNT爆発物を20s以下で検出できることが予想できる。
If an operating point with an input count rate of 800 kHz for the
図31は、代替の実施形態の概略図であり、両側構成のスクリーニングシステム340示す(検査下にある物品342を、この実施形態においてトラック344の荷台上における船舶輸送用コンテナの形式として示す)。
FIG. 31 is a schematic diagram of an alternative embodiment, showing a two-sided screening system 340 (shown as the form of a shipping container on the bed of a
スクリーニングシステム340は検査する物品342が通過するスクリーニング橋門(ポータル)346(第1および第2の側壁348a,348bを備える)を有する。第1壁348aは第1放射源350aを有し、放射源を概して上方からの扇状放射内に検査する物品342を配置する。第2壁348bは第2放射源350bを有し、放射源を概して下方からの扇状放射による検査する物品342を配置する。放射源350a,350bは、ガンマ線放射源、またはガンマ線源および中性子線源もしくはX線源のどちらかを備えるものとする。この実施形態において、各放射源350a,350bは、661.6keVのガンマ線を発射する平行化(コリメート)した1.0キュリーセシウム137(Cs137)線源、または1173.2keVガンマ線および1332.5keVガンマ線を発射する平行化(コリメート)したコバルト60(Co60)線源を備える。
The
スクリーニングシステム340は、第1および第2のポータル壁348a,348b内にそれぞれ配置する第1および第2の2つの検出器アレイ352a,352bを有し、アレイは放射源350a,350bからの後方散乱放射およびよび透過放射を検出するよう配置する。各検出器アレイ352a,352bは、256ヨウ化ナトリウム(NaI)シンチレータ検出器を備え、これらNaIシンチレータのそれぞれは1.125平方インチ(28.6mm2)の前面を有し、それぞれ光電子増倍管(図示せず)に接続する。光電子増倍管からの信号を検出電子機器(図示せず)に出力して、図9の実施形態のパルス累積復元信号処理方法によって増幅信号を処理する。
The
各検出器は、コンテナ342を透過または背面で反射した後に相互作用する放射流束を記録する。トラックがポータル346を通過するにつれて、スライス状で画像を構築し、画像は透過画像または後方散乱画像であり、検出器アレイ352a,352b内の各検出器は垂直分解(解像)の1画素を与える。
Each detector records the radiant flux that interacts after transmission through the
検出器アレイ352a,352bのシンチレーション材料であるヨウ化ナトリウム(NaI)は、妥当な優れたエネルギー分解能および停止能力を有し、比較的安価であるが、240nsの減衰期間であるシンチレーション光出力を有する。この減衰期間のために、NaIシンチレータに基づく検出器システムは、5μs程度のデッド時間を有する。エネルギー範囲を、背景を除外して信号−ノイズ比を改善するために放射源により発射する主要ガンマ線の周りに配置する場合(例えばCs137線源に対して661.6±15%の範囲)、累積は範囲(窓)外に落ちるために2つの事象を廃棄する。
Sodium iodide (NaI), the scintillation material for
図32は、検出器のパーセント表示スループットの計算結果を、すなわち、パルス累積により影響を受けない放射事象の入力を、入力計数率に対して、スクリーニングシステム340(360で星印プロット)、および従来のデータ処理を行うように変更したスクリーニングシステム340(362で丸印プロット)の双方についてプロットしている。双方の場合について、スクリーニングシステム340のNaI検出器のデッド時間は5μsと仮定する。
FIG. 32 shows the calculated percent display throughput of the detector, ie, the input of radiation events not affected by pulse accumulation, the input count rate, the screening system 340 (star plot at 360), and conventional Are plotted for both screening systems 340 (circled plots at 362) modified to perform the data processing. For both cases, the dead time of the NaI detector of
入力計数率が80kHzである場合、従来のデータ処理方法を使用するとき、検出器上の全衝突事象の約60%を、パルス累積(例えば点364)のために失う。しかしながら、スクリーニングシステム340は98%(点366)以上のスループットを有する。したがって、もしコンテナ342を、スクリーニングシステム340を用いて同様の入力計数率で検査するなら、従来の処理方法を用いるために必要な時間の45%で検査を完了することができ、すなわち、120sの検査を54s程度で完了することが予想される。
If the input count rate is 80 kHz, about 60% of all collision events on the detector are lost due to pulse accumulation (eg, point 364) when using conventional data processing methods. However, the
さらにその上、スクリーニングシステム340は、例えばNaIシンチレーション検出器などを有する従来のシステムと比較して、著しく高い計数率で作動することができる。したがって、80kHzの入力計数率を有する検査を800kHzの入力計数率を使用するまで増加して、10倍することによりコンテナ342を検査するために必要な時間を減少させることが可能である。このことは、80kHzの入力計数率と比較していくらかのスループットのロスを生じるが(すなわち98%〜90%まで)、80kHzにおける従来の処理よりは40%のスループットであり1.45倍(90%/40%=1.45)の改善がまだ得られる。したがって、全増加はおよそ1.45×10=14.5倍の検査速度か、少なくとも振幅のオーダーを、高計数率のスクリーニングシステム340を使用することにより達成できる。
Furthermore, the
本発明の範囲内における変更は、当業者によりすぐに実行できる。したがって、本発明は、実施形態を用いて本明細書に記載した特定実施形態に限定するものではない。 Modifications within the scope of the invention can be readily implemented by those skilled in the art. Accordingly, the present invention is not limited to the specific embodiments described herein using the embodiments.
以下の特許請求の範囲および本発明の上述した説明において、本明細書が言語表現または必要な推定のために別の面を必要とする箇所以外では、用語「備える」は包括的な意味で用いて、すなわち記載した特徴の存在を明白にするが、本発明の様々な実施形態においてさらなる特徴の存在または追加を除外しない。 In the following claims and in the above description of the invention, the term “comprising” is used in a generic sense, except where this specification requires another aspect for linguistic expression or necessary presumption. Ie, the presence of the described features is obvious, but does not exclude the presence or addition of additional features in various embodiments of the invention.
さらに、従来技術に対するいかなる参照も、そのような従来技術形態の暗示または通常一般知識の一部として形成する意図はない。 Moreover, no reference to the prior art is intended to form as part of such prior art forms of implications or general knowledge.
Claims (21)
励起放射によりスクリーニング対象物を放射するステップと、
前記対象物近傍に配置した放射検出器から検出器出力データを収集するステップと、および
検出器出力データにおける個別信号を分解する分解ステップであって、(i)前記データ内に存在する信号の信号形状を決定するステップ、(ii)前記信号の少なくとも信号位置を含む一つ以上のパラメータの推定を行うステップ、および(iii)少なくとも前記信号形状および前記パラメータ推定から各前記信号形状のエネルギーを決定するステップにより分解する、該分解ステップと
を備え、
スクリーニング時間を短縮し、ドウェル時間を短縮し、分解能を改善するおよび/またはスループットを増加する、方法。 A screening method comprising:
Radiating the screening object by excitation radiation;
Collecting detector output data from a radiation detector disposed in the vicinity of the object; and decomposing the individual signals in the detector output data, wherein: (i) a signal of a signal present in the data Determining a shape; (ii) estimating one or more parameters including at least a signal position of the signal; and (iii) determining energy of each signal shape from at least the signal shape and the parameter estimation. Disassembling step by step,
A method of reducing screening time, reducing dwell time, improving resolution and / or increasing throughput.
デジタル時系列形式のデジタル化検出器出力データとして前記検出器出力データを得るステップと、
デジタル時系列に基づき、少なくとも信号形状、信号の瞬間的位置、および信号振幅の関数としての数学モデルを形成するステップと、
を備え、
各前記信号のエネルギーを決定するステップは、前記数学モデルに基づいて前記信号の放射事象を示す振幅を決定するステップを備える、方法。 The method of claim 1, wherein the decomposing step of decomposing individual signals comprises:
Obtaining the detector output data as digitized detector output data in digital time series format;
Forming a mathematical model based on the digital time series as a function of at least the signal shape, the instantaneous position of the signal, and the signal amplitude;
With
Determining the energy of each signal comprises determining an amplitude indicative of a radiation event of the signal based on the mathematical model.
スクリーニングすべき対象物に対して放射する放射源と、
対象物が発生する放射を検出し、また放射に応答する検出器データを出力する放射検出器と、
デジタル形式の検出器データを受信するプロセッサであって、データ内に存在する各信号の信号形状を決定するステップ、信号の一つ以上のパラメータに関するパラメータ推定を行い、少なくとも信号形状およびパラメータ推定から各信号のエネルギーを決定し、前記一つ以上のパラメータは少なくとも信号の瞬間的位置を含むものとしたエネルギー決定ステップを行うようプログラムした、該プロセッサと、
を備え、
スクリーニング時間を短縮し、ドウェル時間を短縮し、分解能を改善するおよび/またはスループットを増加する、装置。 A screening device,
A radiation source that radiates the object to be screened;
A radiation detector that detects radiation generated by the object and outputs detector data responsive to the radiation;
A processor for receiving detector data in digital form, determining a signal shape of each signal present in the data, performing parameter estimation on one or more parameters of the signal, and at least determining each signal from the signal shape and parameter estimation A processor programmed to determine an energy of a signal, wherein the one or more parameters include at least an instantaneous position of the signal;
With
An apparatus that reduces screening time, reduces dwell time, improves resolution and / or increases throughput.
各前記信号のエネルギーを決定するステップは、前記数学モデルに基づいて前記信号の放射事象を示す振幅を決定するステップを備える、装置。 11. The apparatus of claim 10, wherein the processor obtains the detector output data in digital time series format, and as a function of at least signal shape, signal instantaneous position, and signal amplitude based on the digital time series. Program the steps to form a mathematical model of
Determining the energy of each said signal comprises determining an amplitude indicative of a radiation event of said signal based on said mathematical model.
スクリーニング装置の放射検出器から検出器出力データを収集するステップと、
検出器出力データにおける個別信号を分解する分解ステップであって、(i)前記データに存在する信号の信号形状を決定するステップ、(ii)前記信号の一つ以上のパラメータを推定し、前記一つ以上のパラメータは少なくとも信号の瞬間的位置を含むものとした、パラメータ推定ステップ、(iii)少なくとも前記信号形状および前記パラメータ推定から各前記信号形状のエネルギーを決定するステップによって前記分解を行う、該分解ステップと
対象物または複数対象物における前記化学的要素の存在から生ずる少なくとも前記信号の形状、パラメータ、信号形状のエネルギーから前記化学的要素の量を決定するステップと、
を備え、
スクリーニング時間を短縮し、ドウェル時間を短縮し、分解能を改善するおよび/またはスループットを増加する、方法。 A method for screening chemical elements within an object or objects, comprising:
Collecting detector output data from the radiation detector of the screening device;
A decomposition step of decomposing an individual signal in the detector output data, (i) determining a signal shape of a signal present in the data; (ii) estimating one or more parameters of the signal; One or more parameters including at least an instantaneous position of the signal, and (iii) performing the decomposition by determining at least the signal shape and the energy of each signal shape from the parameter estimation, Decomposing and determining the amount of the chemical element from at least the signal shape, parameters, and signal shape energy resulting from the presence of the chemical element in the object or objects;
With
A method of reducing screening time, reducing dwell time, improving resolution and / or increasing throughput.
デジタル時系列形式のデジタル化検出器出力データとして前記検出器出力データを得るステップと、
デジタル時系列に基づき、少なくとも信号形状、信号の瞬間的位置、および信号振幅の関数としての数学モデルを形成するステップと、
を備え、
各前記信号のエネルギーを決定するステップは、前記数学モデルに基づいて前記信号の放射事象を示す振幅を決定するステップを備える、方法。 The method of claim 17, wherein the step of decomposing an individual signal comprises:
Obtaining the detector output data as digitized detector output data in digital time series format;
Forming a mathematical model based on the digital time series as a function of at least the signal shape, the instantaneous position of the signal, and the signal amplitude;
With
Determining the energy of each signal comprises determining an amplitude indicative of a radiation event of the signal based on the mathematical model.
励起放射によりスクリーニングするよう対象物を照射するステップと、
対象物近傍に配置した放射検出器から検出器出力データを収集するステップと、
検出器出力データ内の個別信号を分解する分解ステップであって、(i)デジタル系列として検出器出力データを得るまたは表現するステップ、(ii)データ内に存在する信号の信号形状を決定するステップ、(iii)数学変換により信号形状を変換することによって変換した信号形状を形成するステップ、(iv)数学変換によりデジタル系列を変換することによって、変換した信号を有する変換したデジタル系列を形成するステップ、(v)少なくとも変換したデジタル系列および変換した信号形状の関数を評価し、これにより関数出力を得るステップ、(vi)モデルにより関数出力をモデル化するステップ、(vii)モデルに基づく関数出力の少なくとも一つのパラメータを決定するステップ、(viii)関数出力の少なくとも一つの決定したパラメータから信号のパラメータを決定するステップにより、前記分解を行う、該分解ステップと、
を備え、
スクリーニング時間を短縮し、ドウェル時間を短縮し、分解能を改善するおよび/またはスループットを増加する、方法。 A screening method comprising:
Illuminating the object for screening with excitation radiation;
Collecting detector output data from a radiation detector located near the object;
A decomposing step of decomposing an individual signal in the detector output data, wherein (i) obtaining or representing the detector output data as a digital sequence; (ii) determining a signal shape of a signal present in the data , (Iii) forming a transformed signal shape by transforming the signal shape by mathematical transformation, (iv) forming a transformed digital sequence having the transformed signal by transforming the digital sequence by mathematical transformation , (V) evaluating a function of at least the transformed digital sequence and the transformed signal shape, thereby obtaining a function output, (vi) modeling the function output by a model, (vii) function output based on the model Determining at least one parameter; (viii) a parameter of the signal from at least one determined parameter of the function output. Performing the decomposition by the step of determining data, and
With
A method of reducing screening time, reducing dwell time, improving resolution and / or increasing throughput.
スクリーンすべき対象物を照射する放射源と、
対象物が発生する放射を検出し、放射に応答する検出器データを出力する放射検出器と、
デジタル系列として検出器データを受信するプロセッサであって、(i)デジタル系列として検出器出力データを得るまたは表現するステップ、(ii)データ内に存在する信号の信号形状を得るまたは決定するステップ、(iii)数学変換により信号形状を変換することによって変換した信号形状を形成するステップ、(iv)数学変換によりデジタル系列を変換することによって、変換した信号を有する変換した系列を形成するステップ、(v)少なくとも変換した系列および変換した信号形状の関数を評価することにより関数出力を得るステップ、(vi)モデルにより関数出力をモデル化するステップ、(vii)モデルに基づく関数出力の少なくとも一つのパラメータを決定するステップ、(viii)関数出力の少なくとも一つの決定したパラメータから信号のパラメータを決定するステップを行うようにプログラムした、該プロセッサと、
を備え、
スクリーニング時間を短縮し、ドウェル時間を短縮し、分解能を改善するおよび/またはスループットを増加する、方法。 A screening device,
A radiation source for illuminating the object to be screened;
A radiation detector that detects radiation generated by the object and outputs detector data responsive to the radiation;
A processor for receiving detector data as a digital sequence, comprising: (i) obtaining or representing detector output data as a digital sequence; (ii) obtaining or determining a signal shape of a signal present in the data; (iii) forming a transformed signal shape by transforming the signal shape by mathematical transformation; (iv) forming a transformed sequence having the transformed signal by transforming the digital sequence by mathematical transformation; v) obtaining a function output by evaluating a function of at least the transformed series and the transformed signal shape, (vi) modeling the function output by a model, (vii) at least one parameter of the function output based on the model (Viii) determining a signal parameter from at least one determined parameter of the function output. The processor programmed to perform the determining steps;
With
A method of reducing screening time, reducing dwell time, improving resolution and / or increasing throughput.
スクリーニング装置の放射検出器から検出器出力データを収集するステップと、
検出器出力データにおける個別信号を分解する分解ステップであって、(i)デジタル系列として検出器出力データを得るまたは表現するステップ、(ii)データ内に存在する信号の信号形状を得るまたは決定するステップ、(iii)数学的変換により信号形状を変換することによって変換した信号形状を形成するステップ、(iv)数学的変換によりデジタル系列を変換することによって、変換した信号を有する変換した系列を形成するステップ、(v)少なくとも変換した系列および変換した信号形状の関数を評価し、これにより関数出力を得るステップ、(vi)モデルにより関数出力をモデル化するステップ、(vii)モデルに基づく関数出力の少なくとも一つのパラメータを決定するステップ、(viii)関数出力の少なくとも一つの決定したパラメータから信号のパラメータを決定するステップにより、前記解を行う、該分解ステップと、
対象物または複数対象物における前記化学的要素の存在から生ずる少なくとも前記信号形状、パラメータ、信号形状のエネルギーから前記化学的要素の量を決定するステップと、
を備え、
スクリーニング時間を短縮し、ドウェル時間を短縮し、分解能を改善するおよび/またはスループットを増加する、方法。 A method for screening chemical elements within an object or objects, comprising:
Collecting detector output data from the radiation detector of the screening device;
A decomposition step of decomposing an individual signal in the detector output data, (i) obtaining or representing the detector output data as a digital sequence, (ii) obtaining or determining a signal shape of a signal present in the data (Iii) forming a transformed signal shape by transforming the signal shape by mathematical transformation; (iv) forming a transformed sequence having the transformed signal by transforming the digital sequence by mathematical transformation (V) evaluating a function of at least the transformed series and transformed signal shape, thereby obtaining a function output, (vi) modeling the function output by a model, (vii) a function output based on the model Determining at least one parameter of the signal; (viii) determining the signal parameters from the at least one determined parameter of the function output. By determining the meter performs the solution, and the decomposition step,
Determining the amount of the chemical element from at least the signal shape, parameters, energy of the signal shape resulting from the presence of the chemical element in the object or objects;
With
A method of reducing screening time, reducing dwell time, improving resolution and / or increasing throughput.
Applications Claiming Priority (5)
| Application Number | Priority Date | Filing Date | Title |
|---|---|---|---|
| US4116308P | 2008-03-31 | 2008-03-31 | |
| US61/041,163 | 2008-03-31 | ||
| US13887908P | 2008-12-18 | 2008-12-18 | |
| US61/138,879 | 2008-12-18 | ||
| PCT/AU2009/000393 WO2009121130A1 (en) | 2008-03-31 | 2009-03-31 | Screening method and apparatus |
Related Child Applications (1)
| Application Number | Title | Priority Date | Filing Date |
|---|---|---|---|
| JP2013220221A Division JP5916684B2 (en) | 2008-03-31 | 2013-10-23 | Screening method and apparatus |
Publications (1)
| Publication Number | Publication Date |
|---|---|
| JP2011516838A true JP2011516838A (en) | 2011-05-26 |
Family
ID=41134741
Family Applications (2)
| Application Number | Title | Priority Date | Filing Date |
|---|---|---|---|
| JP2011502191A Pending JP2011516838A (en) | 2008-03-31 | 2009-03-31 | Screening method and apparatus |
| JP2013220221A Active JP5916684B2 (en) | 2008-03-31 | 2013-10-23 | Screening method and apparatus |
Family Applications After (1)
| Application Number | Title | Priority Date | Filing Date |
|---|---|---|---|
| JP2013220221A Active JP5916684B2 (en) | 2008-03-31 | 2013-10-23 | Screening method and apparatus |
Country Status (6)
| Country | Link |
|---|---|
| US (1) | US8954300B2 (en) |
| EP (1) | EP2260296A4 (en) |
| JP (2) | JP2011516838A (en) |
| CN (1) | CN101983332A (en) |
| AU (1) | AU2009230874B2 (en) |
| WO (1) | WO2009121130A1 (en) |
Cited By (2)
| Publication number | Priority date | Publication date | Assignee | Title |
|---|---|---|---|---|
| JP2015517672A (en) * | 2012-05-22 | 2015-06-22 | ザ・ボーイング・カンパニーTheBoeing Company | Reconfigurable detection system |
| JP2020091278A (en) * | 2018-12-06 | 2020-06-11 | キヤノンメディカルシステムズ株式会社 | PET device, method and program |
Families Citing this family (14)
| Publication number | Priority date | Publication date | Assignee | Title |
|---|---|---|---|---|
| CN101983342A (en) * | 2008-03-31 | 2011-03-02 | 南方创新国际股份有限公司 | Method and apparatus for borehole logging |
| WO2011160690A1 (en) * | 2010-06-23 | 2011-12-29 | Arktis Radiation Detectors Ltd. | A method for obtaining information about a radiation source or a material interacting with a radiation source and a measurement setup for performing the method |
| WO2014173812A1 (en) * | 2013-04-24 | 2014-10-30 | Koninklijke Philips N.V. | Pulse processing circuit with correction means |
| RU2681377C1 (en) * | 2013-12-11 | 2019-03-06 | Саутерн Инновейшн Интернэшнл Пти Лтд | Method and apparatus for resolving signals in data |
| US10444304B2 (en) | 2014-03-26 | 2019-10-15 | General Electric Company | Particle event recordation |
| AU2014268284A1 (en) | 2014-11-30 | 2016-06-16 | Southern Innovation International Pty Ltd | Method and apparatus for material identification |
| JP6629100B2 (en) * | 2016-02-26 | 2020-01-15 | キヤノンメディカルシステムズ株式会社 | Radiation detection device and radiation detection system |
| CA3025821A1 (en) * | 2016-05-30 | 2017-12-07 | Southern Innovation International Pty Ltd | Material characterisation system and method |
| US10962485B2 (en) | 2016-05-30 | 2021-03-30 | Southern Innovation International Pty Ltd | System and method for material characterization |
| US11408838B2 (en) * | 2017-05-31 | 2022-08-09 | Aachen Institute For Nuclear Training Gmbh | Method and device for multielement analysis on the basis of neutron activation, and use |
| CN109227226B (en) * | 2018-11-12 | 2020-11-03 | 中国科学院光电技术研究所 | Uniform-sliding method for residence time in optical element processing process |
| EP3726258B1 (en) * | 2019-04-16 | 2023-10-04 | Detection Technology Oyj | Imaging method and system |
| CN113359178B (en) * | 2021-03-29 | 2023-05-16 | 山西中辐核仪器有限责任公司 | Radiometer based on self-adaptive dead time compensation |
| CN114252899B (en) * | 2022-03-02 | 2022-05-20 | 四川新先达测控技术有限公司 | Cascade impulse convolution forming method and device for kernel signal |
Citations (1)
| Publication number | Priority date | Publication date | Assignee | Title |
|---|---|---|---|---|
| WO2006029475A1 (en) * | 2004-09-16 | 2006-03-23 | Southern Innovation International Pty Ltd | Method and apparatus for resolving individual signals in detector output data. |
Family Cites Families (57)
| Publication number | Priority date | Publication date | Assignee | Title |
|---|---|---|---|---|
| US4658216A (en) * | 1983-07-14 | 1987-04-14 | The United States Of America As Represented By The Department Of Energy | High resolution, high rate X-ray spectrometer |
| JPS63163215A (en) * | 1986-12-26 | 1988-07-06 | Fuji Electric Co Ltd | Measuring instrument for in-canister charging level of radioactive material |
| US5210423A (en) * | 1989-09-22 | 1993-05-11 | Siemens Gammasonics, Inc. | Method and apparatus for unpiling pulses generated by piled-up scintillation events |
| US5225682A (en) * | 1992-01-24 | 1993-07-06 | The United States Of America As Represented By The United States Department Of Energy | Method and apparatus for providing pulse pile-up correction in charge quantizing radiation detection systems |
| FR2686982B1 (en) * | 1992-01-30 | 1997-12-19 | Schlumberger Services Petrol | METHOD FOR SPECTROSCOPY OF NUCLEAR PULSES WITH A HIGH COUNTING RATE. |
| JPH05323039A (en) * | 1992-05-21 | 1993-12-07 | Toshiba Corp | Radiation inspector |
| US5349193A (en) * | 1993-05-20 | 1994-09-20 | Princeton Gamma Tech, Inc. | Highly sensitive nuclear spectrometer apparatus and method |
| US5532944A (en) * | 1994-07-28 | 1996-07-02 | Sorrento Electronics, Inc. | Multi-channel analysis system and method using digital signal processing |
| EP0880821B1 (en) | 1995-08-14 | 2003-12-17 | William K. Warburton | Method and apparatus for digitally based high speed x-ray spectrometer |
| US5884234A (en) * | 1996-08-30 | 1999-03-16 | Schlumberger Technology Corporation | Method for pulse shape regulation and discrimination in a nuclear spectroscopy system |
| FR2753279B1 (en) * | 1996-09-09 | 1998-11-13 | Smv Int | PROCESS FOR TREATING PULSES DELIVERED BY A GAMMA CAMERA AND GAMMA CAMERA IMPLEMENTING THIS METHOD |
| JPH10186041A (en) | 1996-12-21 | 1998-07-14 | Horiba Ltd | Pulse processor of x-ray analyzing device |
| US6026135A (en) * | 1997-04-04 | 2000-02-15 | Her Majesty The Queen In Right Of Canada, As Represented By The Minister Of National Defence Of Her Majesty's Canadian Government | Multisensor vehicle-mounted mine detector |
| US6936822B2 (en) | 1997-05-07 | 2005-08-30 | Board Of Regents, The University Of Texas System | Method and apparatus to prevent signal pile-up |
| US20030165212A1 (en) * | 1998-02-18 | 2003-09-04 | Maglich Bogdan C. | Method and apparatus for detecting, locating, and analyzing chemical compounds using subatomic particle activation |
| EP1042690A4 (en) | 1998-05-09 | 2003-05-21 | Canberra Ind Inc | Digital pulse de-randomization for radiation spectroscopy |
| US6160259A (en) * | 1998-10-23 | 2000-12-12 | Adac Laboratories | Channel-specific control of pulse integration in a gamma camera system in response to pulse pile-up |
| US6366872B1 (en) | 1998-12-23 | 2002-04-02 | Varian, Inc. | Data prediction in DSP methods for transient spectroscopies |
| JP3836629B2 (en) | 1999-06-22 | 2006-10-25 | 日本電子株式会社 | Digital pulse processor |
| JP3907910B2 (en) | 2000-03-28 | 2007-04-18 | 日本電子株式会社 | Digital pulse processor used in energy dispersive spectrometer |
| JP2001337168A (en) | 2000-05-29 | 2001-12-07 | Jeol Ltd | Ad converter for measuring radiation |
| JP4160275B2 (en) | 2001-05-28 | 2008-10-01 | 浜松ホトニクス株式会社 | Energy measuring method and measuring device |
| US20030076914A1 (en) * | 2001-10-23 | 2003-04-24 | Tiller Donald E. | Method and apparatus for measuring radiation in a borehole |
| US6590957B1 (en) * | 2002-03-13 | 2003-07-08 | William K. Warburton | Method and apparatus for producing spectra corrected for deadtime losses in spectroscopy systems operating under variable input rate conditions |
| JP3980451B2 (en) | 2002-08-30 | 2007-09-26 | 株式会社東芝 | Waveform discrimination device |
| DE60313364T2 (en) | 2002-12-10 | 2008-01-03 | Commonwealth Scientific And Industrial Research Organisation | RADIOGRAPHIC DEVICE |
| US7135688B2 (en) * | 2003-06-02 | 2006-11-14 | Mirmar Sensor, L.L.C. | Apparatus and method for the detection of the energy of ionizing electro-magnetic radiation |
| FR2870603B1 (en) | 2004-05-19 | 2006-07-28 | Commissariat Energie Atomique | MEASUREMENT AND PROCESSING OF A SIGNAL COMPRISING ELEMENTARY PULSE STACKS |
| US7966155B2 (en) | 2004-06-04 | 2011-06-21 | William K. Warburton | Method and apparatus for improving detection limits in x-ray and nuclear spectroscopy systems |
| GB2421317B (en) * | 2004-12-15 | 2009-02-11 | Agilent Technologies Inc | A method and apparatus for detecting leading pulse edges |
| US20060157655A1 (en) * | 2005-01-19 | 2006-07-20 | Richard Mammone | System and method for detecting hazardous materials |
| US7439515B2 (en) * | 2005-06-17 | 2008-10-21 | Siemens Medical Solutions Usa, Inc. | Pipeline processing of pulse pile-up correction in a nuclear medicine imaging system |
| RU2414724C2 (en) | 2005-10-28 | 2011-03-20 | Конинклейке Филипс Электроникс, Н.В. | Method and apparatus for spectral computer tomography |
| JP4358814B2 (en) | 2005-11-09 | 2009-11-04 | 花王株式会社 | Sample analysis method |
| JP4706566B2 (en) | 2006-06-09 | 2011-06-22 | 株式会社島津製作所 | X-ray analysis signal processor |
| WO2007146350A2 (en) | 2006-06-14 | 2007-12-21 | Baker Hughes Incorporated | Pileup rejection |
| JP4787989B2 (en) | 2006-11-10 | 2011-10-05 | 横河電機株式会社 | Peak detection circuit, multi-channel analyzer and radiation measurement system |
| US7725281B2 (en) * | 2006-12-21 | 2010-05-25 | Canberra Industries, Inc. | Method for pole-zero adjustment in radiation measurement systems |
| US7430481B2 (en) | 2007-01-12 | 2008-09-30 | R. J. Lee Group, Inc. | Methods for detecting and analyzing piled-up X-rays in an X-ray spectrometry system |
| EP2156219B1 (en) | 2007-06-19 | 2012-11-21 | Koninklijke Philips Electronics N.V. | Digital pulse processing for multi-spectral photon counting readout circuits |
| US7741609B2 (en) | 2007-08-03 | 2010-06-22 | Pulsetor, Llc | Adapting a high-performance pulse processor to an existing spectrometry system |
| JP5349476B2 (en) * | 2007-08-03 | 2013-11-20 | パルセータ,エルエルシー | Method for detecting edge indicating photon in energy dispersive radiation spectroscopic analysis system, pulse processor for executing the method, and energy dispersive radiation spectroscopic analysis system |
| US8415635B2 (en) | 2007-10-18 | 2013-04-09 | Koninklijke Philips Electronics N.V. | Particle-counting apparatus with pulse shortening |
| KR101583272B1 (en) | 2007-11-02 | 2016-01-07 | 유니버시티 오브 워싱톤 스루 이츠 센터 포 커머셜리제이션 | Data acquisition for positron emission tomography |
| US9008969B2 (en) | 2007-12-10 | 2015-04-14 | Schlumberger Technology Corporation | Pulsed x-ray signal processing |
| JP5043728B2 (en) | 2008-03-19 | 2012-10-10 | 日本電子株式会社 | Pulse processor for radiation measurement |
| US7999220B2 (en) * | 2008-05-30 | 2011-08-16 | Precision Energy Services, Inc. | Borehole measurements using a fast and high energy resolution gamma ray detector assembly |
| US7807973B2 (en) | 2008-08-01 | 2010-10-05 | Pulsetor, Llc | Pileup rejection in an energy-dispersive radiation spectrometry system |
| CN101666227B (en) | 2008-09-03 | 2013-02-20 | 中国石油天然气集团公司 | Method for acquiring natural gamma spectra |
| DE102008048306B4 (en) * | 2008-09-22 | 2016-06-09 | Siemens Healthcare Gmbh | Method for the detection of X-ray radiation and X-ray system |
| DE102009018995B4 (en) * | 2009-04-27 | 2017-10-12 | Siemens Healthcare Gmbh | Method and circuit for determining an intensity of ionizing radiation |
| WO2011002452A1 (en) | 2009-06-30 | 2011-01-06 | Analogic Corporation | Enhanced photon detection for scanner |
| EP2290403A1 (en) | 2009-08-28 | 2011-03-02 | Paul Scherrer Institut | X-ray detector with integrating readout chip for single photon resolution |
| FR2951036A1 (en) | 2009-10-01 | 2011-04-08 | Commissariat Energie Atomique | DEVICE FOR PROCESSING A SIGNAL DELIVERED BY A RADIATION DETECTOR |
| KR101092648B1 (en) | 2010-04-28 | 2011-12-13 | 서강대학교산학협력단 | Method for detecting arrival time of gamma ray pulse signal in PET detector |
| US9057789B2 (en) | 2010-09-02 | 2015-06-16 | Hitachi, Ltd. | Radiation measuring device |
| CN102073059B (en) | 2010-12-31 | 2013-05-22 | 华中科技大学 | Digital pileup waveform processing method and system |
-
2009
- 2009-03-31 US US12/935,586 patent/US8954300B2/en active Active
- 2009-03-31 AU AU2009230874A patent/AU2009230874B2/en active Active
- 2009-03-31 WO PCT/AU2009/000393 patent/WO2009121130A1/en active Application Filing
- 2009-03-31 CN CN200980111982.9A patent/CN101983332A/en active Pending
- 2009-03-31 JP JP2011502191A patent/JP2011516838A/en active Pending
- 2009-03-31 EP EP09728564.7A patent/EP2260296A4/en not_active Withdrawn
-
2013
- 2013-10-23 JP JP2013220221A patent/JP5916684B2/en active Active
Patent Citations (2)
| Publication number | Priority date | Publication date | Assignee | Title |
|---|---|---|---|---|
| WO2006029475A1 (en) * | 2004-09-16 | 2006-03-23 | Southern Innovation International Pty Ltd | Method and apparatus for resolving individual signals in detector output data. |
| JP2008513740A (en) * | 2004-09-16 | 2008-05-01 | サザン イノヴェーション インターナショナル プロプライアトリー リミテッド | Apparatus and method for separating individual signals in detector output data |
Cited By (3)
| Publication number | Priority date | Publication date | Assignee | Title |
|---|---|---|---|---|
| JP2015517672A (en) * | 2012-05-22 | 2015-06-22 | ザ・ボーイング・カンパニーTheBoeing Company | Reconfigurable detection system |
| JP2020091278A (en) * | 2018-12-06 | 2020-06-11 | キヤノンメディカルシステムズ株式会社 | PET device, method and program |
| JP7297579B2 (en) | 2018-12-06 | 2023-06-26 | キヤノンメディカルシステムズ株式会社 | PET device, method and program |
Also Published As
| Publication number | Publication date |
|---|---|
| AU2009230874A1 (en) | 2009-10-08 |
| WO2009121130A1 (en) | 2009-10-08 |
| US20110035197A1 (en) | 2011-02-10 |
| EP2260296A4 (en) | 2016-04-06 |
| AU2009230874B2 (en) | 2014-06-26 |
| JP5916684B2 (en) | 2016-05-11 |
| EP2260296A1 (en) | 2010-12-15 |
| US8954300B2 (en) | 2015-02-10 |
| CN101983332A (en) | 2011-03-02 |
| JP2014041147A (en) | 2014-03-06 |
Similar Documents
| Publication | Publication Date | Title |
|---|---|---|
| JP5916684B2 (en) | Screening method and apparatus | |
| JP5022902B2 (en) | Apparatus and method for separating individual signals in detector output data | |
| US9310513B2 (en) | Method and apparatus for borehole logging | |
| US8471210B2 (en) | Radiation imaging method with individual signal resolution | |
| US9311277B2 (en) | Method of identifying materials from multi-energy X-rays | |
| JP5914347B2 (en) | Method for correcting measured X-ray spectrum and device for correcting measured X-ray spectrum | |
| JP2013512443A5 (en) | ||
| Mohammadian-Behbahani et al. | Pile-up correction algorithm based on successive integration for high count rate medical imaging and radiation spectroscopy | |
| EP2783243B1 (en) | Detector apparatus and method | |
| JP7239921B2 (en) | Positron annihilation spectrometer | |
| AU2005284602B2 (en) | Method and apparatus for resolving individual signals in detector output data. | |
| WO2013076506A2 (en) | Portable detector apparatus |
Legal Events
| Date | Code | Title | Description |
|---|---|---|---|
| A621 | Written request for application examination |
Free format text: JAPANESE INTERMEDIATE CODE: A621 Effective date: 20120328 |
|
| A131 | Notification of reasons for refusal |
Free format text: JAPANESE INTERMEDIATE CODE: A131 Effective date: 20130723 |
|
| A977 | Report on retrieval |
Free format text: JAPANESE INTERMEDIATE CODE: A971007 Effective date: 20130724 |
|
| A521 | Request for written amendment filed |
Free format text: JAPANESE INTERMEDIATE CODE: A523 Effective date: 20131023 |
|
| A02 | Decision of refusal |
Free format text: JAPANESE INTERMEDIATE CODE: A02 Effective date: 20140415 |