JP2011069754A - Shearing viscosity estimation method and rheogram creation method - Google Patents
Shearing viscosity estimation method and rheogram creation method Download PDFInfo
- Publication number
- JP2011069754A JP2011069754A JP2009221873A JP2009221873A JP2011069754A JP 2011069754 A JP2011069754 A JP 2011069754A JP 2009221873 A JP2009221873 A JP 2009221873A JP 2009221873 A JP2009221873 A JP 2009221873A JP 2011069754 A JP2011069754 A JP 2011069754A
- Authority
- JP
- Japan
- Prior art keywords
- viscosity
- shear
- polymer
- region
- polymer solution
- Prior art date
- Legal status (The legal status is an assumption and is not a legal conclusion. Google has not performed a legal analysis and makes no representation as to the accuracy of the status listed.)
- Pending
Links
Images


Classifications
-
- G—PHYSICS
- G01—MEASURING; TESTING
- G01N—INVESTIGATING OR ANALYSING MATERIALS BY DETERMINING THEIR CHEMICAL OR PHYSICAL PROPERTIES
- G01N11/00—Investigating flow properties of materials, e.g. viscosity, plasticity; Analysing materials by determining flow properties
- G01N11/10—Investigating flow properties of materials, e.g. viscosity, plasticity; Analysing materials by determining flow properties by moving a body within the material
- G01N11/14—Investigating flow properties of materials, e.g. viscosity, plasticity; Analysing materials by determining flow properties by moving a body within the material by using rotary bodies, e.g. vane
Abstract
Description
本発明は、溶媒にポリマーが溶解した非ニュートン性の高分子溶液についてのせん断粘度推算方法、およびせん断速度とせん断粘度との関係を示す流動曲線を作成する方法に関する。 The present invention relates to a method for estimating shear viscosity of a non-Newtonian polymer solution in which a polymer is dissolved in a solvent, and a method for creating a flow curve indicating the relationship between shear rate and shear viscosity.
高分子材料であるポリマーは、繊維、成形材料、シート、フィルムなど、様々な用途に応じて賦形される。このようにポリマーを賦形する方法としては、ポリマーを水や有機溶媒などの溶媒に溶解して高分子溶液とし、これを賦形する方法があり、例えば、繊維の湿式紡糸、溶剤キャストフィルムや塗膜の形成などがその例である。
このような高分子溶液を用いた賦形においては、高分子溶液の流動特性が製品の生産性や性能に影響を及ぼす場合も多い。
A polymer that is a polymer material is shaped according to various uses such as fibers, molding materials, sheets, and films. As a method for shaping the polymer in this way, there is a method in which the polymer is dissolved in a solvent such as water or an organic solvent to form a polymer solution, which is shaped, for example, wet spinning of fibers, solvent cast film, An example is the formation of a coating film.
In such shaping using a polymer solution, the flow characteristics of the polymer solution often affect the productivity and performance of the product.
高分子溶液が賦形される過程では、高分子溶液は広いせん断速度域の流動を受けることが多い。例えば湿式紡糸の場合は、高分子溶液がノズルまで供給される際の配管内での流動は、比較的低せん断速度であるのに対し、ノズルから高分子溶液が押し出される際のノズル内での流動は、非常に高せん断速度となる。一概には言えないが、このような場合の低せん断速度と高せん断速度とは、少なくとも2桁以上、場合によっては5桁以上異なることもある。
したがって、生産性よく、性能のよい製品を生産するためには、このような広いせん断速度域での高分子溶液の流動特性を事前に把握しておくことが極めて重要である。
In the process of forming a polymer solution, the polymer solution often undergoes a flow in a wide shear rate range. For example, in the case of wet spinning, the flow in the pipe when the polymer solution is supplied to the nozzle has a relatively low shear rate, whereas the flow in the nozzle when the polymer solution is extruded from the nozzle. The flow has a very high shear rate. Although it cannot be generally stated, the low shear rate and the high shear rate in such a case may differ by at least two orders of magnitude, and in some cases, by five orders of magnitude or more.
Therefore, in order to produce a product with good productivity and good performance, it is extremely important to know in advance the flow characteristics of the polymer solution in such a wide shear rate region.
高分子溶液の流動特性を測定する方法としては、落球粘度計、回転粘度計、毛管粘度計(細管粘度計)などの粘度計を用いて、粘度を実測する方法がある(例えば非特許文献1参照。)。特に、粘度のせん断速度依存性を測定するには、回転粘度計や細管粘度計が好ましく、これらの粘度計は数多く市販されている。 As a method of measuring the flow characteristics of a polymer solution, there is a method of actually measuring the viscosity using a viscometer such as a falling ball viscometer, a rotational viscometer, a capillary viscometer (capillary viscometer) (for example, Non-Patent Document 1). reference.). In particular, to measure the shear rate dependence of viscosity, a rotational viscometer or a capillary viscometer is preferred, and many of these viscometers are commercially available.
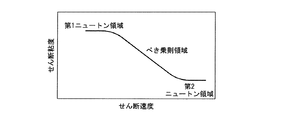
ところが、例えば繊維の湿式紡糸などに使用される高分子溶液は、溶液中の高分子鎖の絡み合いなどに起因する非ニュートン流体であることが多い(非特許文献2参照。)。非特許文献2にも記載されているように、このような高分子溶液は、図10に示すように、低せん断速度域では一定の粘度を示し(第1ニュートン領域)、その後、高せん断速度域になると粘度が低下し(べき乗則(power lowあるいは指数則とも言う)領域)、その後、さらに高せん断速度域では粘度が一定値になる(第2ニュートン領域)。
そのため、非ニュートン流体である高分子溶液について、限られた狭い範囲のせん断速度域での粘度を測定しても、そのデータから、広いせん断速度域にわたる流動特性を把握することは困難である。
However, polymer solutions used for, for example, wet spinning of fibers are often non-Newtonian fluids due to entanglement of polymer chains in the solution (see Non-Patent Document 2). As described in
Therefore, even when the viscosity of a polymer solution that is a non-Newtonian fluid is measured in a limited narrow shear rate region, it is difficult to grasp the flow characteristics over a wide shear rate region from the data.
そこで、非ニュートン性の高分子溶液について、広いせん断速度域にわたる流動特性を把握するためには、上述したような粘度計を用いて、広いせん断速度域にわたるせん断粘度を実測することが有効と考えられる。
一般に、比較的せん断速度が低い領域での粘度測定には回転粘度計が好ましく、せん断速度が高い領域での粘度測定には細管粘度計が好ましいことが知られている。例えば、溶融樹脂の流動特性においては、細管粘度計を用いて1000000(/sec)程度の高せん断速度域でまで測定されている例もある(特許文献1参照。)。
そこで、第1ニュートン領域からべき乗則領域までのような、比較的低せん断速度域においては、回転粘度計を用い、べき乗則領域よりも高せん断速度域においては、細管粘度計を用いることで、広いせん断速度域にわたるせん断粘度を実測できるとも考えられる(非特許文献3参照。)。
Therefore, in order to understand the flow characteristics of a non-Newtonian polymer solution over a wide shear rate range, it is effective to actually measure the shear viscosity over a wide shear rate range using a viscometer as described above. It is done.
In general, it is known that a rotational viscometer is preferable for viscosity measurement in a region where the shear rate is relatively low, and a capillary viscometer is preferable for viscosity measurement in a region where the shear rate is high. For example, in the flow characteristics of a molten resin, there is an example in which measurement is performed up to a high shear rate region of about 1000000 (/ sec) using a capillary viscometer (see Patent Document 1).
Therefore, by using a rotational viscometer in a relatively low shear rate region, such as from the first Newton region to the power law region, and using a capillary viscometer in a higher shear rate region than the power law region, It is also considered that the shear viscosity over a wide shear rate range can be measured (see Non-Patent Document 3).
しかしながら、例えば、高分子溶液を湿式紡糸する際において、高分子溶液がノズルから押し出される際には、高分子溶液の流動状態は、べき乗則領域よりもさらに高せん断速度域である第2ニュートン領域となっている可能性がある。そのため、このように湿式紡糸の際の高分子溶液の流動特性を把握するためには、べき乗則領域〜第2ニュートン領域までの広いせん断速度域において粘度測定が可能な、極めてレンジの広い細管粘度計を用いて測定することが必要となる。ところが、第2ニュートン領域のような極めて高いせん断速度域での粘度測定が可能な細管粘度計は、実質的には存在しない。そのため、このような極めて高いせん断速度域での粘度測定は困難である(非特許文献4参照。)。 However, for example, when the polymer solution is wet-spun, when the polymer solution is pushed out of the nozzle, the flow state of the polymer solution is the second Newton region, which is a higher shear rate region than the power law region. It may be. Therefore, in order to grasp the flow characteristics of the polymer solution during wet spinning in this way, it is possible to measure the viscosity in a wide shear rate range from the power law region to the second Newton region, and the capillary viscosity with a very wide range. It is necessary to measure using a meter. However, there is virtually no capillary viscometer capable of measuring viscosity in a very high shear rate region such as the second Newton region. Therefore, it is difficult to measure the viscosity in such an extremely high shear rate region (see Non-Patent Document 4).
また、高分子溶液は溶融樹脂と比較して粘度が低いために、細管粘度計にサンプルを充填する際に、毛管(オリフィス)からサンプルが流れ出すなどして測定が難しいという問題もある。さらに、高分子溶液が賦形される際の温度は、ほとんどの場合室温以上であるために、細管粘度計での測定時にもサンプルを加熱する必要がある。そのため、溶媒として有機溶媒を含有し、加熱に際しては安全性や環境面での配慮が必要となるような場合であっても、高分子溶液の粘度測定を問題なく行えるような特殊な細管粘度計が必要となる。 In addition, since the polymer solution has a lower viscosity than the molten resin, there is a problem that when the sample is filled in the capillary viscometer, the sample flows out of the capillary (orifice) and is difficult to measure. Furthermore, since the temperature at which the polymer solution is shaped is in most cases room temperature or higher, it is necessary to heat the sample during measurement with a capillary viscometer. Therefore, a special capillary viscometer that contains an organic solvent as a solvent and can measure the viscosity of a polymer solution without problems even when safety and environmental considerations are required during heating. Is required.
また、特許文献2には、石炭スラリー調製例として、第2ニュートン領域のせん断速度で石炭スラリーを調製する方法が開示されているが、石炭スラリーの第2ニュートン領域でのせん断速度は、4〜6(/sec)とされており、比較的低せん断速度である。よって、第2ニュートン領域でのせん断速度が非常に大きな高分子溶液には、特許文献2の技術を適用することはできない。
このように非ニュートン流体である高分子溶液について、粘度計を用いて、広いせん断速度域にわたるせん断粘度を実測することは困難である。
そこで、限られた範囲のせん断速度域での粘度を実測し、その測定値から、その他のせん断速度での粘度を推算する方法により、広いせん断速度域にわたる流動特性を把握する方法が考えられる。
例えば、非特許文献4には、非ニュートン性を有する高分子溶液の粘度を回転粘度計により測定し、これにべき乗則を適用して粘度を推算する方法が記載されている。
As described above, it is difficult to actually measure the shear viscosity of the polymer solution that is a non-Newtonian fluid using a viscometer over a wide shear rate range.
Therefore, a method of grasping the flow characteristics over a wide shear rate range by measuring the viscosity in a limited range of shear rate and estimating the viscosity at other shear rates from the measured value can be considered.
For example, Non-Patent Document 4 describes a method in which the viscosity of a polymer solution having non-Newtonian properties is measured with a rotational viscometer, and the viscosity is estimated by applying a power law thereto.
しかしながら、この方法で推算すると、べき乗則領域までの粘度を推算することはできるものの、それ以降の第2ニュートン領域においても、せん断速度の増加に伴って粘度が無限に低下していく結果となるため、粘度が一定になるはずの第2ニュートン領域での粘度を推算することはできなかった。 However, when this method is used for estimation, the viscosity up to the power law region can be estimated, but in the second Newton region thereafter, the viscosity decreases infinitely as the shear rate increases. Therefore, the viscosity in the second Newton region where the viscosity should be constant could not be estimated.
本発明の目的は、第2ニュートン領域での粘度を推算する方法を提供し、さらに、このような方法を用いることで、第1ニュートン領域から第2ニュートン領域までの広いせん断速度範囲における高分子溶液の流動曲線を作成する方法を提供することである。 An object of the present invention is to provide a method for estimating the viscosity in the second Newton region, and further to use such a method to provide a polymer in a wide shear rate range from the first Newton region to the second Newton region. It is to provide a method for creating a flow curve of a solution.
本発明者が鋭意検討した結果、詳しくは後述するように、高分子の絡み合いに注目し、高分子濃度の低い低濃度高分子溶液の粘度測定結果を基に、高分子濃度と粘度の関係を求め、これを高濃度に外挿して第2ニュートン領域における粘度に見立てることによって、第2ニュートン領域におけるせん断粘度(第2ニュートン粘度)を適切に算出できることを見出し、本発明を完成するに至った。 As a result of intensive studies by the inventor, as will be described in detail later, paying attention to the entanglement of the polymer, the relationship between the polymer concentration and the viscosity is determined based on the viscosity measurement result of the low concentration polymer solution having a low polymer concentration. It was found that the shear viscosity (second Newton viscosity) in the second Newton region can be appropriately calculated by extrapolating this to a high concentration and assuming the viscosity in the second Newton region, and the present invention has been completed. .
本発明の流動曲線の作成方法は、溶媒にポリマーが溶解した非ニュートン性の高分子溶液について、せん断速度とせん断粘度との関係を示す流動曲線を作成する方法であって、
前記高分子溶液と同種の溶媒およびポリマーからなり、前記高分子溶液よりも高分子濃度が低く、かつ、互いに高分子濃度が異なる複数種の低濃度高分子溶液について、せん断速度依存性がない領域におけるせん断粘度をそれぞれ実測して、高分子濃度とせん断粘度との関係を示す線形近似式を求め、該線形近似式に前記高分子溶液の高分子濃度を代入する方法により、該高分子溶液の第2ニュートン領域におけるせん断粘度を求める、第2ニュートン領域粘度算出工程を有することを特徴とする。
本発明の流動曲線の作成方法は、さらに、せん断速度を変化させ、その際のせん断粘度を実測する方法により、前記高分子溶液の第1ニュートン領域におけるせん断速度とせん断粘度との関係を求める、第1ニュートン領域粘度実測工程と、
該第1ニュートン領域粘度実測工程で実測されたせん断粘度とその際のせん断速度とを式(I)に代入して、式(I)中の係数aと指数nとを算出した後、該式(I)を用いて、前記高分子溶液のべき乗則領域におけるせん断速度とせん断粘度との関係を求める、べき乗則領域粘度算出工程とを有することが好ましい。

前記第1ニュートン領域粘度実測工程では、前記せん断速度を低速度側から高速度側に変化させ、各せん断速度でのせん断粘度を実測するとともに、各せん断速度でのせん断応力も実測し、前記せん断速度を低速度側から高速度側に変化させても、前記せん断応力が増加しなくなるせん断速度γiを求め、
前記べき乗則領域粘度算出工程では、前記せん断速度γiよりも低速度側に隣接する2点のせん断速度γi−1およびγi−2と、これらに対応するせん断粘度ηi−1およびηi−2とを前記式(I)に代入することが好ましい。
前記せん断粘度を回転粘度計により実測することが好ましい。
また、前記回転粘度計は、コーンプレート型であることが好ましい。
The flow curve creation method of the present invention is a method of creating a flow curve showing the relationship between shear rate and shear viscosity for a non-Newtonian polymer solution in which a polymer is dissolved in a solvent,
A region having no shear rate dependency for a plurality of types of low-concentration polymer solutions comprising the same type of solvent and polymer as the polymer solution and having a polymer concentration lower than that of the polymer solution and different from each other. Each of the shear viscosities of the polymer solution was measured to obtain a linear approximation formula indicating the relationship between the polymer concentration and the shear viscosity, and the polymer solution concentration of the polymer solution was substituted into the linear approximation formula. It has the 2nd Newton area viscosity calculation process of calculating | requiring the shear viscosity in a 2nd Newton area.
The flow curve creation method of the present invention further determines the relationship between the shear rate and the shear viscosity in the first Newton region of the polymer solution by changing the shear rate and measuring the shear viscosity at that time. A first Newton region viscosity measurement step;
Substituting the shear viscosity actually measured in the first Newton region viscosity actual measurement step and the shear rate at that time into the equation (I) to calculate the coefficient a and the index n in the equation (I), It is preferable to have a power law region viscosity calculating step of obtaining a relationship between the shear rate and the shear viscosity in the power law region of the polymer solution using (I).
In the first Newton region viscosity measurement step, the shear rate is changed from the low speed side to the high speed side, the shear viscosity at each shear rate is measured, and the shear stress at each shear rate is also measured. Even when the speed is changed from the low speed side to the high speed side, the shear rate γ i at which the shear stress does not increase is obtained,
Wherein in the power law region viscosity calculating step wherein a shear rate gamma i-1 and gamma i-2 of two points adjacent to the lower speed side from the shear rate gamma i, shear viscosity eta i-1 and eta corresponding to these It is preferable to substitute i-2 into the formula (I).
It is preferable to actually measure the shear viscosity with a rotational viscometer.
The rotational viscometer is preferably a cone plate type.
本発明のせん断粘度推算方法は、溶媒にポリマーが溶解した非ニュートン性の高分子溶液について、第2ニュートン領域でのせん断粘度を求めるせん断粘度推算方法であって、
前記高分子溶液と同種の溶媒およびポリマーからなり、前記高分子溶液よりも高分子濃度が低く、かつ、互いに高分子濃度が異なる複数種の低濃度高分子溶液について、せん断速度依存性がない領域におけるせん断粘度をそれぞれ実測して、高分子濃度とせん断粘度との関係を示す線形近似式を求め、該線形近似式に前記高分子溶液の高分子濃度を代入する方法により、該高分子溶液の第2ニュートン領域におけるせん断粘度を求めることを特徴とする。
The shear viscosity estimation method of the present invention is a shear viscosity estimation method for determining the shear viscosity in the second Newton region for a non-Newtonian polymer solution in which a polymer is dissolved in a solvent,
A region having no shear rate dependency for a plurality of types of low-concentration polymer solutions comprising the same type of solvent and polymer as the polymer solution and having a polymer concentration lower than that of the polymer solution and different from each other. Each of the shear viscosities of the polymer solution was measured to obtain a linear approximation formula indicating the relationship between the polymer concentration and the shear viscosity, and the polymer solution concentration of the polymer solution was substituted into the linear approximation formula. The shear viscosity in the second Newton region is obtained.
本発明によれば、第2ニュートン領域での粘度を推算する方法を提供でき、さらに、このような方法を用いることで、第1ニュートン領域から第2ニュートン領域までの広いせん断速度範囲における高分子溶液の流動曲線を作成する方法を提供することができる。 According to the present invention, it is possible to provide a method for estimating the viscosity in the second Newton region, and by using such a method, a polymer in a wide shear rate range from the first Newton region to the second Newton region. A method of creating a flow curve of a solution can be provided.
以下、本発明について、詳細に説明する。
本発明では、水、有機溶媒などの溶媒に、例えばポリアクリロニトリル、ポリメタクリル酸メチル、ポリフッ化ビニリデン、ポリビニルピロリドン、ポリエチレングリコール、酢酸セルロースなどの高分子(ポリマー)が溶解した、非ニュートン性である高分子溶液を対象とし、この高分子溶液について、せん断速度とせん断粘度との関係を明らかにし、これらの関係を示す流動曲線を作成する。
非ニュートン性を示す非ニュートン流体は、せん断速度とせん断粘度との関係が線形ではなく、図10に示したように、低せん断速度域において一定のせん断粘度を示す第1ニュートン領域と、その後、高せん断速度域になるとせん断粘度が低下するべき乗則領域と、その後、さらに高せん断速度域では再度せん断粘度が一定値になる第2ニュートン領域とを有するものである。
以下、非ニュートン流体である高分子溶液について、第1ニュートン領域から第2ニュートン領域までの広いせん断速度範囲における流動曲線(せん断速度−せん断粘度)を作成する方法について、具体的に説明する。
Hereinafter, the present invention will be described in detail.
In the present invention, non-Newtonian, in which a polymer such as polyacrylonitrile, polymethyl methacrylate, polyvinylidene fluoride, polyvinyl pyrrolidone, polyethylene glycol, cellulose acetate or the like is dissolved in a solvent such as water or an organic solvent. For a polymer solution, the relationship between shear rate and shear viscosity is clarified for this polymer solution, and a flow curve showing these relationships is created.
The non-Newtonian fluid exhibiting non-Newtonian properties has a non-linear relationship between shear rate and shear viscosity, and as shown in FIG. 10, a first Newton region exhibiting a constant shear viscosity in a low shear rate region, and thereafter It has a power law region where the shear viscosity should decrease when the high shear rate region is reached, and then a second Newton region where the shear viscosity becomes a constant value again in the high shear rate region.
Hereinafter, a method for creating a flow curve (shear rate-shear viscosity) in a wide shear rate range from the first Newton region to the second Newton region for the polymer solution that is a non-Newtonian fluid will be described in detail.
なお、対象とする高分子溶液中のポリマーおよび溶媒は、それぞれ1種であっても、複数種であってもよい。また、ポリマーは共重合体であっても構わない。 In addition, the polymer and the solvent in the target polymer solution may be one kind or plural kinds, respectively. The polymer may be a copolymer.
(第1ニュートン領域粘度実測工程)
第1ニュートン領域粘度実測工程(以下、工程(1)という場合もある。)では、高分子溶液に与えるせん断速度を変化させ、その際のせん断粘度を実測する方法により、高分子溶液の第1ニュートン領域(低せん断速度領域)におけるせん断速度とせん断粘度との関係を求める。
具体的には、細管粘度計、回転粘度計のように、せん断速度に対するせん断粘度の測定が可能な粘度計を用いて、高分子溶液にせん断速度を与え、その際のせん断粘度を実測する。ついで、高分子溶液に与えるせん断速度を他の値に変化させ、その際のせん断粘度を実測する。この際、好ましくは、せん断速度を低速度側から高速度側に変化させていく。このような手順を繰り返すことにより、多数の(せん断速度,せん断粘度)のデータを採取し、その結果、第1ニュートン領域におけるせん断速度とせん断粘度との関係を求めることができる。そして、これらデータについて、通常、横軸をせん断速度、縦軸をせん断粘度としてグラフ化すれば、第1ニュートン領域における目的の流動曲線を得ることができる。
(First Newton region viscosity measurement process)
In the first Newton region viscosity measurement step (hereinafter also referred to as step (1)), the shear rate applied to the polymer solution is changed, and the shear viscosity at that time is measured to measure the first viscosity of the polymer solution. The relationship between shear rate and shear viscosity in the Newton region (low shear rate region) is obtained.
Specifically, a shear rate is given to the polymer solution using a viscometer capable of measuring the shear viscosity with respect to the shear rate, such as a capillary viscometer and a rotational viscometer, and the shear viscosity at that time is measured. Next, the shear rate applied to the polymer solution is changed to another value, and the shear viscosity at that time is measured. At this time, the shear rate is preferably changed from the low speed side to the high speed side. By repeating such a procedure, a large number of data (shear rate, shear viscosity) can be collected, and as a result, the relationship between the shear rate and the shear viscosity in the first Newton region can be obtained. And about these data, if the horizontal axis | shaft is normally made into a graph with a shear rate and a vertical axis | shaft as a shear viscosity, the target flow curve in a 1st Newton area | region can be obtained.
工程(1)においては、このようにせん断速度を変化させてせん断粘度を実測するが、データの取得に当たっては、その際のせん断応力も確認することが好ましい。これは精度のよい流動曲線を得る観点から重要である。
すなわち、せん断速度を低速度側から高速度側に変化させていくと、それに伴って、せん断応力は通常増加していく。しかしながら、より高速度側になると、実験精度が低下するために、図1のグラフに示すように、測定されるせん断応力がばらつくようになったり、せん断速度の増加に伴って増加するはずのせん断応力が低下したりする。このような実験精度の低下は、例えば粘度計が回転粘度計の場合には、遠心力によってサンプルが測定部から飛び出してしまったり、サンプル内で流れの乱れが生じることに起因して測定状態が不安定になり、定常値が得られにくくなったりするなどの理由によるものである。このような高速度側での精度の低い実測データは削除して、流動曲線には採用しないことが好ましい。
そこで、せん断速度を低速度側から高速度側に変化させても、せん断応力が増加しなくなった時点のせん断速度γiを求め、このせん断速度γiよりも低速度側のせん断速度でのデータのみを採用し、せん断速度γi以上の高速度側のデータは採用しないようにすることが好ましい。
このようにせん断速度を変化させた際にせん断応力をも実測し、その挙動を判断基準とすることによって、精度の良いデータのみを採用することができる。
なお、せん断粘度の実測法としては、せん断速度を変化させてせん断応力を測定し、せん断応力をせん断速度で除することで、せん断粘度を求める方法が一般的である。工程(1)では、そのような方法を採用してせん断粘度を求めてよい。
In step (1), the shear viscosity is actually measured by changing the shear rate in this way, but it is preferable to confirm the shear stress at the time of data acquisition. This is important from the viewpoint of obtaining an accurate flow curve.
That is, when the shear rate is changed from the low speed side to the high speed side, the shear stress usually increases accordingly. However, since the experimental accuracy decreases at higher speeds, as shown in the graph of FIG. 1, the shear stress to be measured varies, or shear that should increase as the shear rate increases. The stress decreases. For example, when the viscometer is a rotational viscometer, the measurement accuracy is reduced due to the sample jumping out of the measurement unit due to centrifugal force or the flow being disturbed in the sample. This is because it becomes unstable and it becomes difficult to obtain a steady value. It is preferable that such actually measured data with low accuracy on the high speed side is deleted and not adopted in the flow curve.
Therefore, the data of the shear rate be changed to the high speed side from the low speed side, determine the shear rate gamma i at which the shear stress is no longer increased, at a shear rate of lower speed side than the shear rate gamma i It is preferable that only high-speed data having a shear rate γ i or higher is not used.
In this way, when the shear rate is changed, the shear stress is also actually measured, and the behavior thereof is used as a criterion, so that only accurate data can be employed.
As a method for actually measuring the shear viscosity, a method of measuring the shear viscosity by changing the shear rate and dividing the shear stress by the shear rate to obtain the shear viscosity is general. In step (1), such a method may be adopted to determine the shear viscosity.
工程(1)において実測する(せん断速度,せん断粘度)のデータ数(測定点数)としては、せん断速度一桁あたり、3以上10以下の範囲が好ましい。このような範囲であると、なめらかな流動曲線を作成できる。また、次の工程(べき乗則領域粘度算出工程)では、この(せん断速度,せん断粘度)のデータを用いて、べき乗則領域のせん断粘度を算出するが、その際の算出精度を良好にすることができる。特に、データ数がせん断速度一桁あたり10を超えると、次の工程(べき乗則領域粘度算出工程)において、後述するように、せん断速度γiよりも低速度側のデータのうち最も高速度側の2点のデータを採用した場合に、ごく狭い範囲のせん断速度範囲のデータを用いてべき乗則領域のせん断粘度を算出することになる。その結果、僅かなデータの振れが、特に高せん断速度側の粘度の推算に大きな影響を及ぼす可能性がある。
なお、実測するデータ数の好適な範囲について、せん断速度一桁あたりの数で特定している理由は、一般に、せん断速度とせん断粘度との関係を示す流動曲線では、通常は横軸のせん断速度を対数スケールとすることが多いためである。
The number of data (number of measurement points) of (shear rate, shear viscosity) measured in step (1) is preferably in the range of 3 to 10 per digit of the shear rate. Within such a range, a smooth flow curve can be created. In the next step (power law region viscosity calculation step), the shear viscosity of the power law region is calculated using the data of this (shear rate, shear viscosity), and the calculation accuracy at that time should be improved. Can do. In particular, when the number of data exceeds 10 per digit of the shear rate, in the next step (power law region viscosity calculation step), as will be described later, among the data on the lower speed side than the shear rate γ i, the highest speed side When the data of these two points are employed, the shear viscosity in the power law region is calculated using data in a very narrow shear rate range. As a result, slight data fluctuations can have a significant effect on the estimation of viscosity, particularly on the high shear rate side.
Note that the reason why the suitable range of the number of measured data is specified by the number per one digit of the shear rate is generally because the flow curve indicating the relationship between the shear rate and the shear viscosity is usually the shear rate on the horizontal axis. This is because is often a logarithmic scale.
(べき乗則領域粘度算出工程)
次に、べき乗則領域粘度算出工程(以下、工程(2)という場合もある。)では、まず、上述した工程(1)で実測されたせん断粘度とその際のせん断速度とを下記の式(I)に代入して、式(I)中の係数aと指数nとを算出する。
こうして係数aと指数nとが決定された式(I)は、高分子溶液のべき乗則領域におけるせん断速度とせん断粘度との関係式となる。
Next, in the power law region viscosity calculation step (hereinafter also referred to as step (2)), first, the shear viscosity actually measured in step (1) described above and the shear rate at that time are expressed by the following formula ( Substituting into I), the coefficient a and the index n in the formula (I) are calculated.
The formula (I) in which the coefficient a and the index n are thus determined is a relational expression between the shear rate and the shear viscosity in the power law region of the polymer solution.
具体的には、まず、工程(1)で実測された多数の(せん断速度,せん断粘度)のデータのうち、2点を式(I)に代入して、式(I)中の係数aと指数nとを算出する。
ここで、代入する2点のデータとしては、図1に示すように、工程(1)において決定されたせん断速度γiよりも低速度側のデータであることが、データの精度の点で好ましい。さらには、せん断速度γiに隣接する2点のデータ、すなわち、(せん断速度γn−1,せん断粘度ηn−1)と、(せん断速度γn−2,せん断粘度ηn−2)のデータを採用することが好ましい。このようにせん断速度γiよりも低速度側のデータのうち、最も高速度側の2点のデータを採用することにより、適切な係数aと指数nとを算出することができる。
なお、非特許文献2に記載されているように、高分子溶液においては、指数nの値はほぼ0.8以下になることが知られている。そのため、2点のデータを代入して上述のようにして算出された指数nが仮に0.8を超えた場合には、式(I)に代入した2点のデータが適切なデータではなかった可能性がある。その際には、再度、工程(1)での実測データを見直したり、せん断速度γiの決定が適切であったかを見直したりし、再検討する必要がある。
Specifically, first, among the many data of (shear rate, shear viscosity) actually measured in step (1), two points are substituted into the formula (I), and the coefficient a in the formula (I) An index n is calculated.
Here, as the data of the two points to be substituted, as shown in FIG. 1, it is preferable in terms of data accuracy that the data is lower than the shear rate γ i determined in the step (1). . Furthermore, data of two points adjacent to the shear rate γ i , that is, (shear rate γ n-1 , shear viscosity η n-1 ) and (shear rate γ n-2 , shear viscosity η n-2 ). It is preferable to employ data. As described above, by adopting data at two points on the highest speed side among the data on the lower speed side than the shear speed γ i , an appropriate coefficient a and index n can be calculated.
As described in
こうして係数aと指数nとが決定した式(I)により、べき乗則領域でのせん断速度とせん断粘度との関係を明らかにすることができる。そして、この式(I)により求められるせん断速度とせん断粘度のデータについて、通常、横軸をせん断速度、縦軸をせん断粘度としてグラフ化すれば、べき乗則領域における目的の流動曲線を得ることができる。 Thus, the relationship between the shear rate and the shear viscosity in the power law region can be clarified by the formula (I) in which the coefficient a and the index n are determined. And about the data of the shear rate and the shear viscosity obtained by this formula (I), if the horizontal axis is the shear rate and the vertical axis is the shear viscosity, the desired flow curve in the power law region can be obtained. it can.
(第2ニュートン領域粘度算出工程)
次に第2ニュートン領域粘度算出工程(以下、工程(3)という場合もある。)においては、第2ニュートン領域におけるせん断粘度を算出する。
第2ニュートン領域では、高分子溶液中の高分子鎖は、せん断によって絡み合いがほぐれた状態、あるいは絡み合いが極めて少ない状態にあると考えられる。一方、高分子溶液は、その高分子濃度が低いほど、高分子鎖の絡み合いが少ない。
そこで、高分子濃度の低い高分子溶液を第2ニュートン領域における高分子溶液に見立てて、本工程(3)では以下のようにして第2ニュートン領域におけるせん断粘度(第2ニュートン粘度)を求める。
(Second Newton region viscosity calculation step)
Next, in the second Newton region viscosity calculating step (hereinafter, also referred to as step (3)), the shear viscosity in the second Newton region is calculated.
In the second Newton region, the polymer chains in the polymer solution are considered to be in a state where the entanglement is loosened by shearing or in a state where the entanglement is extremely small. On the other hand, the polymer solution has less entanglement of polymer chains as the polymer concentration is lower.
Accordingly, assuming that a polymer solution having a low polymer concentration is a polymer solution in the second Newton region, in this step (3), the shear viscosity (second Newton viscosity) in the second Newton region is obtained as follows.
まず、せん断粘度を算出したい目的の高分子溶液と同種の溶媒およびポリマーからなり、目的の高分子溶液よりも高分子濃度が低く、かつ、互いに高分子濃度が異なる複数種の低濃度高分子溶液を用意する。
例えば、図2に示すように、高分子濃度が異なる5種類の低濃度高分子溶液A、B、C、D、Eを用意し、これらについて、例えば工程(1)での実測方法と同様にして、せん断速度を変化させてせん断粘度を実測する。
すると、図2においては、溶液Dおよび溶液Eに認められるように、せん断速度が大きくなると、せん断粘度が低下し始める。そこで、各低濃度高分子溶液A〜Eについて、このような低下が認められるせん断速度よりも低速度側の低せん断速度でのせん断粘度、すなわち、せん断速度依存性がない領域のせん断粘度の値(図2のa値、b値、c値、d値、e値)を求める。
First, multiple low-concentration polymer solutions consisting of the same type of solvent and polymer as the target polymer solution for which shear viscosity is to be calculated, having a polymer concentration lower than that of the target polymer solution and different from each other. Prepare.
For example, as shown in FIG. 2, five types of low-concentration polymer solutions A, B, C, D, and E having different polymer concentrations are prepared, and for example, the same as the measurement method in step (1). The shear viscosity is actually measured by changing the shear rate.
Then, in FIG. 2, as can be seen from the solution D and the solution E, when the shear rate increases, the shear viscosity starts to decrease. Therefore, for each of the low-concentration polymer solutions A to E, the shear viscosity at a low shear rate lower than the shear rate at which such a decrease is observed, that is, the value of the shear viscosity in a region having no shear rate dependency. (A value, b value, c value, d value, e value in FIG. 2) are obtained.
なお、ここで用いる低濃度高分子溶液とは、溶媒の種類、ポリマーの種類が目的の高分子溶液と同じであり、高分子濃度のみが目的の高分子溶液とは異なる溶液である。また、例えば、ポリマーが複数のポリマーの混合物である場合には、複数のポリマーの比率は目的の高分子溶液と同じにする。また、溶媒についても、複数の溶媒の混合物である場合には、その比率は目的の高分子溶液と同じにする。 The low-concentration polymer solution used here is a solution in which the type of solvent and the type of polymer are the same as the target polymer solution, and only the polymer concentration is different from the target polymer solution. For example, when the polymer is a mixture of a plurality of polymers, the ratio of the plurality of polymers is the same as that of the target polymer solution. In addition, when the solvent is a mixture of a plurality of solvents, the ratio is the same as that of the target polymer solution.
ついで、これら低濃度高分子溶液A、B、C、D、Eの各濃度と、これらについて、せん断速度依存性がない領域のせん断粘度(a値、b値、c値、d値、e値)とをプロットして、図3に示すように、高分子溶液の高分子濃度−せん断粘度のグラフを作成する。すると、低濃度側では、高分子濃度に対して直線的にせん断粘度が増加するが、ある濃度以上になると急激な粘度増加が見られる。この急激な粘度増加は、濃度が高くなるにつれて現れた高分子鎖の絡み合いの寄与と考えられる。
したがって、このような絡み合いの寄与がない部分、すなわち、直線的にせん断粘度が増加する部分のデータのみを用いて、高分子溶液の高分子濃度−せん断粘度の線形近似式を求める。
そして、得られた線形近似式に、目的とする高分子溶液の高分子濃度を代入することにより、せん断速度に依存しない一定値である第2ニュートン粘度を算出することができる。
Next, the respective concentrations of these low-concentration polymer solutions A, B, C, D, and E, and the shear viscosity (a value, b value, c value, d value, e value) of these regions having no shear rate dependency. And a graph of polymer concentration-shear viscosity of the polymer solution is created as shown in FIG. Then, on the low concentration side, the shear viscosity increases linearly with respect to the polymer concentration, but when the concentration exceeds a certain level, a sharp increase in viscosity is observed. This rapid increase in viscosity is considered to be a contribution of the entanglement of polymer chains that appears as the concentration increases.
Accordingly, a linear approximate expression of the polymer concentration-shear viscosity of the polymer solution is obtained using only data of a portion where such an entanglement does not contribute, that is, a portion where the shear viscosity increases linearly.
Then, by substituting the polymer concentration of the target polymer solution into the obtained linear approximation formula, the second Newton viscosity, which is a constant value independent of the shear rate, can be calculated.
ここで線形近似式を求める際には、汎用的な表計算ソフトウェア(例えばマイクロソフト社の表計算ソフトウェア「エクセル(登録商標)」など)を使用してもよい。例えば、エクセル(登録商標)を利用した場合、線形近似式の信頼性の参考値となるR2乗値が0.8以上になるように近似式を求めることが好ましい。R2乗値が0.8未満の場合は、経験的に、線形近似が不適切となり、第2ニュートン粘度の値を大きめに見積もる可能性があることがわかっている。また、得られた近似式によっては、切片がマイナスの値になる場合がある。高分子溶液の濃度が0%の際のせん断粘度は、溶媒のせん断粘度に相当するが、溶媒のせん断粘度がマイナス値になることはないので、この場合は原点を通る近似式としてもよい。高分子溶液の濃度が0%のせん断粘度は、溶媒の粘度を測定した値とするのが好ましいものの、溶媒の粘度は非常に小さく、測定が困難な場合もある。原点を通るということは、溶媒の粘度が0ということになるが、高分子の存在に起因する粘度に比べ、溶媒自身の粘度は非常に小さいので、一次関数で近似する場合は原点を通る近似式としても、その影響は小さい。従って、本発明においては、原点を通る近似式を用いてもよいものとする。
なお、原点を通る近似式とした場合のR2乗値の検証(0.8未満か否かの判断)は、原点を通る近似式のR2乗値で行う。
Here, when obtaining the linear approximation formula, general-purpose spreadsheet software (for example, Microsoft spreadsheet software “Excel (registered trademark)”) may be used. For example, when Excel (registered trademark) is used, it is preferable to obtain the approximate expression so that the R square value, which is a reference value of the reliability of the linear approximate expression, is 0.8 or more. When the R-square value is less than 0.8, it is empirically found that the linear approximation becomes inappropriate and the value of the second Newton viscosity may be estimated to be large. Moreover, depending on the obtained approximate expression, the intercept may be a negative value. The shear viscosity when the concentration of the polymer solution is 0% corresponds to the shear viscosity of the solvent. However, since the shear viscosity of the solvent does not become a negative value, an approximate expression passing through the origin may be used in this case. The shear viscosity at a polymer solution concentration of 0% is preferably a value obtained by measuring the viscosity of the solvent, but the viscosity of the solvent is very small and may be difficult to measure. Passing through the origin means that the viscosity of the solvent is zero, but the viscosity of the solvent itself is very small compared to the viscosity due to the presence of the polymer, so when approximating with a linear function, approximation through the origin Even as a formula, the effect is small. Therefore, in the present invention, an approximate expression passing through the origin may be used.
The verification of the R-square value in the case of the approximate expression passing through the origin (determination of whether or not it is less than 0.8) is performed using the R-square value of the approximate expression passing through the origin.
以上のようにして、工程(1)〜工程(3)を行うことによって、第1ニュートン領域、べき乗則領域、第2ニュートン領域のそれぞれの領域でのせん断速度−せん断粘度の関係を明らかにすることができる。
したがって、各工程で得られた各領域でのせん断速度−せん断粘度の関係を合成してつなげ、1つのグラフとして表すことによって、図4に示すように、第1ニュートン領域から第2ニュートン領域に及ぶ広いせん断速度に対して、せん断粘度が示された流動曲線を作成することができる。
As described above, by performing the steps (1) to (3), the relationship between the shear rate and the shear viscosity in each of the first Newton region, the power law region, and the second Newton region is clarified. be able to.
Therefore, by synthesizing and connecting the relationship between the shear rate and the shear viscosity in each region obtained in each step and expressing it as one graph, as shown in FIG. 4, from the first Newton region to the second Newton region. For a wide range of shear rates, a flow curve showing shear viscosity can be generated.
なお、このように各領域でのせん断速度−せん断粘度の関係を合成するにあたっては、工程(2)で決定された式(I)に、工程(3)で算出された第2ニュートン粘度を代入することによって、べき乗則領域と第2ニュートン領域の境界のせん断速度を決定することができる。 In synthesizing the relationship between the shear rate and the shear viscosity in each region as described above, the second Newton viscosity calculated in the step (3) is substituted into the formula (I) determined in the step (2). By doing so, the shear rate at the boundary between the power law region and the second Newton region can be determined.
本発明において、せん断粘度の測定には、上述のとおり、細管粘度計を使用しても回転粘度計を使用しても構わないが、せん断応力が小さい低せん断速度域での測定精度の観点からは、回転粘度計を用いることが好ましい。さらに、測定温度が室温より高い場合や、溶媒が有機溶媒の場合のデータ精度が向上の観点からは、溶剤蒸発防止のための機構(例えば、溶媒の蒸発をできるだけ抑制するため、回転粘度計の測定部を覆う部材の使用など。)を採用することが好ましい。 In the present invention, as described above, the shear viscosity may be measured using a capillary viscometer or a rotational viscometer, but from the viewpoint of measurement accuracy in a low shear rate region where shear stress is small. Is preferably a rotational viscometer. Further, from the viewpoint of improving data accuracy when the measurement temperature is higher than room temperature or when the solvent is an organic solvent, a mechanism for preventing solvent evaporation (for example, a rotational viscometer It is preferable to employ the use of a member that covers the measurement unit.
また、回転粘度計の中でも、せん断速度の均一性や、サンプル使用量の少なさなどの点から、コーンプレート型の回転粘度計が好ましい。できるだけ高せん断速度側までデータを取得するためには、用いるコーンのコーン角は2度以下が好ましく、1度以下がより好ましい。低コーン角側の限度は測定の容易さの点から、一般に0.2度以上である。コーンの直径は、測定する高分子溶液の粘度にもよるが、一般に10mm〜60mm程度である。
なお、上述の工程(1)でのせん断粘度の測定と、工程(3)でのせん断粘度の測定では、必ずしも同じコーンを用いる必要はない。例えば、工程(1)での測定よりも工程(3)での測定の方が粘度の低い高分子溶液を測定するので、より大きな直径のコーンを使用して測定することにより、検出されるトルク値が大きくなり、データの精度を高めることができる。同様な理由で、工程(1)での測定よりも工程(3)での測定のコーン角を小さくすることも可能である。
Of the rotational viscometers, a cone plate type rotational viscometer is preferable in terms of uniformity of shear rate and a small amount of sample used. In order to acquire data up to as high a shear rate as possible, the cone angle of the cone used is preferably 2 degrees or less, more preferably 1 degree or less. The limit on the low cone angle side is generally 0.2 degrees or more from the viewpoint of ease of measurement. The diameter of the cone is generally about 10 mm to 60 mm, although it depends on the viscosity of the polymer solution to be measured.
Note that the same cone is not necessarily used in the measurement of the shear viscosity in the above-described step (1) and the measurement of the shear viscosity in the step (3). For example, since the measurement in the step (3) measures the polymer solution having a lower viscosity than the measurement in the step (1), the torque detected by the measurement using the cone having a larger diameter. The value becomes larger and the accuracy of the data can be improved. For the same reason, it is possible to make the cone angle of the measurement in the step (3) smaller than the measurement in the step (1).
以上説明したように、このような方法では、工程(3)において、第2ニュートン領域における高分子溶液を濃度の低い高分子溶液に見立てることにより、従来、実測も推算も困難であった第2ニュートン粘度を適切に算出することができる。そして、このように算出された第2ニュートン粘度と、工程(1)での実測データおよび工程(2)での算出データとを組み合わせることによって、広いせん断速度に対してせん断粘度が示された流動曲線を作成することができる。
よって、このような流動曲線を用いることによって、広いせん断速度での高分子溶液の流動特性を把握でき、例えば、繊維の湿式紡糸、溶剤キャストフィルムや塗膜の形成など、高分子溶液の賦形を経て製造される製品の製造において、生産性を向上させ、製品の性能を改善することも可能となる。また、高分子溶液の流動に関わる材料設計を定量的に行うこともできる。特に繊維の湿式紡糸では、上述したように、高分子溶液は広いせん断速度を受けるため、本発明の方法は特に有効である。
As described above, according to such a method, in the step (3), the polymer solution in the second Newton region is regarded as a polymer solution having a low concentration, so that it is difficult to actually measure and estimate the second solution. Newtonian viscosity can be calculated appropriately. Then, by combining the second Newton viscosity calculated in this way with the actually measured data in the step (1) and the calculated data in the step (2), the flow showing the shear viscosity with respect to a wide shear rate. A curve can be created.
Therefore, by using such a flow curve, it is possible to grasp the flow characteristics of a polymer solution at a wide shear rate, for example, shaping of a polymer solution such as wet spinning of a fiber, formation of a solvent cast film or a coating film. In the manufacture of products manufactured through the above, it is possible to improve productivity and improve product performance. In addition, material design relating to the flow of the polymer solution can be quantitatively performed. Particularly in wet spinning of fibers, as described above, since the polymer solution is subjected to a wide shear rate, the method of the present invention is particularly effective.
以下、実施例により本発明をさらに詳細に説明するが、これらに限定されるものではない。なお、実施例中で用いたサンプルおよび測定方法は、以下の通りである。 EXAMPLES Hereinafter, although an Example demonstrates this invention further in detail, it is not limited to these. The samples and measurement methods used in the examples are as follows.
<高分子(ポリマー)>
重量平均分子量(Mw)が約400000、アクリロニトリル含量が約96%のポリアクリロニトリル系重合体を用いた。
<Polymer>
A polyacrylonitrile polymer having a weight average molecular weight (Mw) of about 400,000 and an acrylonitrile content of about 96% was used.
<工程(1)でのせん断粘度の測定>
高分子溶液のせん断粘度測定には、ティー・エイ・インスツルメント・ジャパン(株)製のレオメーター(AR550)を用い、コーン角:0.5°、直径40mmのコーンにて測定を行った。なお、測定の際には、蒸発防止用の機構(測定部を覆うことのできる専用の市販品の使用。)を採用した。
<Measurement of shear viscosity in step (1)>
The shear viscosity of the polymer solution was measured using a rheometer (AR550) manufactured by TA Instruments Japan Co., Ltd., with a cone having a cone angle of 0.5 ° and a diameter of 40 mm. . In the measurement, a mechanism for preventing evaporation (use of a dedicated commercial product that can cover the measurement part) was adopted.
<工程(3)でのせん断粘度の測定>
コーン角:2°、直径60mmのコーンを使用した以外は、工程(1)でのせん断粘度の測定と同様にして、第2ニュートン粘度決定のためのせん断粘度の測定を行った。なお、せん断速度依存性がない領域の粘度の線形近似式は、付属の解析ソフトを用いて、Newtonianでフィッティングすることにより求めた。
<Measurement of shear viscosity in step (3)>
Cone angle: Measurement of the shear viscosity for determining the second Newtonian viscosity was performed in the same manner as the measurement of the shear viscosity in the step (1) except that a cone having a diameter of 2 ° and a diameter of 60 mm was used. In addition, the linear approximation formula of the viscosity of the area | region which does not have shear rate dependence was calculated | required by fitting with Newtonian using attached analysis software.
[実施例]<高分子溶液の流動曲線の作成>
ポリアクリロニトリル系重合体の高分子溶液の80℃での流動曲線取得例を示す。
(工程(1))
ポリアクリロニトリル系重合体をN,N−ジメチルアセトアミドに21wt%になるように溶解して、得られた高分子溶液の80℃でのせん断粘度を低せん断速度域において測定した。
その結果を図5に示す。
この測定結果では、せん断速度が527.3(/sec)と575.4(/sec)の時のせん断応力が、いずれも3285(Pa)であった。よって、せん断速度575.4(/sec)をせん断速度γiと判定し、このせん断速度γi以上のデータを削除し、図6に示す曲線を得た。
[Example] <Creation of flow curve of polymer solution>
An example of obtaining a flow curve of a polymer solution of polyacrylonitrile-based polymer at 80 ° C. is shown.
(Process (1))
A polyacrylonitrile-based polymer was dissolved in N, N-dimethylacetamide so as to be 21 wt%, and the obtained polymer solution was measured for shear viscosity at 80 ° C. in a low shear rate region.
The result is shown in FIG.
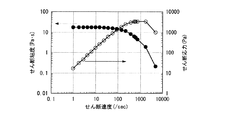
In this measurement result, the shear stress when the shear rate was 527.3 (/ sec) and 575.4 (/ sec) was 3285 (Pa). Thus, shear rate 575.4 a (/ sec) determined that the shear rate gamma i, deleting the shear rate gamma i more data to obtain a curve shown in FIG.
(工程(2))
次に、べき乗則領域のせん断粘度を推算するため、工程(1)で実測され、採用されたデータのうち、表1に示す高せん断速度側の2点のデータを式(I)に代入したところ、
a=579.2、n=0.7231となり、下記に示すべき乗則域の粘度式(II)を得た。
このように算出されたnの値は0.8以下であったので、式(I)に代入したデータおよびべき乗則域の粘度式(II)は、ともに問題ないと判断できた。
(Process (2))
Next, in order to estimate the shear viscosity in the power law region, among the data actually measured and adopted in the step (1), two data on the high shear rate side shown in Table 1 were substituted into the formula (I). However,
a = 579.2, n = 0.7231, and the viscosity formula (II) in the power law range shown below was obtained.
Since the value of n calculated in this way was 0.8 or less, it was determined that both the data substituted into the formula (I) and the power law range viscosity formula (II) were satisfactory.
(工程(3))
続いて、第2ニュートン粘度を決定するため、ポリアクリロニトリル系重合体を1wt%、2.5wt%、5wt%、7.5wt%、10wt%、12.5wt%、15wt%になるようにN,N−ジメチルアセトアミドに溶解した低濃度高分子溶液を調製した(7種類)。そして、これらについて、取得する流動曲線の温度と同じ80℃において、せん断粘度の測定を行った。
測定結果を図7に示す。
(Process (3))
Subsequently, in order to determine the second Newtonian viscosity, the polyacrylonitrile-based polymer is N, 1 wt%, 2.5 wt%, 5 wt%, 7.5 wt%, 10 wt%, 12.5 wt%, 15 wt%. Low-concentration polymer solutions dissolved in N-dimethylacetamide were prepared (7 types). And about these, the shear viscosity was measured in 80 degreeC same as the temperature of the acquired flow curve.
The measurement results are shown in FIG.
図7に示すように、高分子濃度が高いものについては、高せん断速度側では、粘度が低下する様子が観測された。そのため、この領域のデータは除外して、すなわち、せん断速度依存性がない領域のせん断粘度を用いて、図8のように高分子濃度とせん断速度との関係を示すグラフを作成し、Newtonianにてフィッティングを行い、線形近似式を得た。
なお、表2に、フィッティングの際に採用したデータの高せん断速度側の上限と、フィッティングにより得られたせん断粘度を示す。
As shown in FIG. 7, it was observed that the viscosity of the polymer having a high polymer concentration decreased on the high shear rate side. Therefore, excluding the data in this region, that is, using the shear viscosity of the region that does not depend on the shear rate, a graph showing the relationship between the polymer concentration and the shear rate is created as shown in FIG. To obtain a linear approximation.
Table 2 shows the upper limit on the high shear rate side of the data adopted in the fitting and the shear viscosity obtained by the fitting.
ここで、高分子溶液の濃度1wt%、2.5wt%、5wt%に対して、線形近似を行ったところ、y=0.0056x−0.0051であった。切片が負となったので、切片を0として改めて線形近似を行い、y=0.0043xを得た。この時のR2乗値は0.8873であった。なお、xは高分子溶液の濃度(wt%)、yはせん断粘度(Pa・s)である。
また、高分子溶液の濃度1wt%、2.5wt%、5wt%、7.5wt%に対して、線形近似を行ったところ、y=0.0132x−0.0222となった。切片が負となったので、切片を0として改めて線形近似を行い、y=0.0092xを得た。しかし、この時のR2乗値は0.7473であった。
Here, when linear approximation was performed with respect to the concentration of the polymer solution of 1 wt%, 2.5 wt%, and 5 wt%, y = 0.0006x−0.0051. Since the intercept became negative, the intercept was set to 0 and linear approximation was performed again to obtain y = 0.004x. The R square value at this time was 0.8873. Note that x is the concentration (wt%) of the polymer solution, and y is the shear viscosity (Pa · s).
Moreover, when linear approximation was performed with respect to the polymer solution concentrations of 1 wt%, 2.5 wt%, 5 wt%, and 7.5 wt%, y = 0.0132x−0.0222 was obtained. Since the intercept became negative, the intercept was set to 0 and linear approximation was performed again to obtain y = 0.0002x. However, the R-square value at this time was 0.7473.
先にも述べたように、R2乗値は0.8以上であることが経験的に好ましい。よって、低濃度高分子溶液の濃度として1wt%、2.5wt%、5wt%を採用して線形近似した、近似式y=0.0043xを採用した。 As described above, it is empirically preferable that the R-square value is 0.8 or more. Therefore, the approximate expression y = 0.004x, which is linearly approximated by adopting 1 wt%, 2.5 wt%, 5 wt% as the concentration of the low concentration polymer solution, was employed.
この近似式のxに目的とする高分子溶液濃度の21wt%を代入した結果、この21wt%ポリアクリロニトリル系重合体高分子溶液の80℃での第2ニュートン粘度は0.090(Pa・s)と算出された。 As a result of substituting 21 wt% of the target polymer solution concentration for x in this approximate expression, the second Newton viscosity at 80 ° C. of this 21 wt% polyacrylonitrile polymer solution is 0.090 (Pa · s). Calculated.
以上工程(1)〜(3)により、各領域でのせん断速度とせん断粘度との関係を求めることができた。
なお、工程(3)で得られた第2ニュートン粘度を、式(II)に代入した結果、べき乗則領域と第2ニュートン領域との境界のせん断速度は184938(/sec)であることがわかった。
Through the above steps (1) to (3), the relationship between the shear rate and the shear viscosity in each region could be obtained.
As a result of substituting the second Newton viscosity obtained in the step (3) into the formula (II), it was found that the shear rate at the boundary between the power law region and the second Newton region is 184938 (/ sec). It was.
ついで、各領域でのせん断速度−せん断粘度の関係を合成してつなげ、1つのグラフとして表すことによって、図9に示すように、80℃でのポリアクリロニトリル系重合体の高分子溶液について、第1ニュートン領域から第2ニュートン領域に及ぶ広いせん断速度に対して、せん断粘度が示された流動曲線を作成することができた。 Next, the relationship between the shear rate and the shear viscosity in each region was synthesized and connected as a single graph. As shown in FIG. 9, the polyacrylonitrile polymer polymer solution at 80 ° C. For a wide shear rate from the 1 Newton region to the 2nd Newton region, a flow curve showing shear viscosity could be created.
Claims (6)
前記高分子溶液と同種の溶媒およびポリマーからなり、前記高分子溶液よりも高分子濃度が低く、かつ、互いに高分子濃度が異なる複数種の低濃度高分子溶液について、せん断速度依存性がない領域におけるせん断粘度をそれぞれ実測して、高分子濃度とせん断粘度との関係を示す線形近似式を求め、該線形近似式に前記高分子溶液の高分子濃度を代入する方法により、該高分子溶液の第2ニュートン領域におけるせん断粘度を求める、第2ニュートン領域粘度算出工程を有することを特徴とする流動曲線の作成方法。 For a non-Newtonian polymer solution in which a polymer is dissolved in a solvent, a method of creating a flow curve showing the relationship between shear rate and shear viscosity,
A region having no shear rate dependency for a plurality of types of low-concentration polymer solutions comprising the same type of solvent and polymer as the polymer solution and having a polymer concentration lower than that of the polymer solution and different from each other. Each of the shear viscosities of the polymer solution was measured to obtain a linear approximation formula indicating the relationship between the polymer concentration and the shear viscosity, and the polymer solution concentration of the polymer solution was substituted into the linear approximation formula. A flow curve creation method comprising a second Newton region viscosity calculation step of obtaining a shear viscosity in a second Newton region.
該第1ニュートン領域粘度実測工程で実測されたせん断粘度とその際のせん断速度とを式(I)に代入して、式(I)中の係数aと指数nとを算出した後、該式(I)を用いて、前記高分子溶液のべき乗則領域におけるせん断速度とせん断粘度との関係を求める、べき乗則領域粘度算出工程とをさらに有することを特徴とする請求項1に記載の流動曲線の作成方法。
Substituting the shear viscosity actually measured in the first Newton region viscosity actual measurement step and the shear rate at that time into the equation (I) to calculate the coefficient a and the index n in the equation (I), 2. The flow curve according to claim 1, further comprising: a power law region viscosity calculating step of obtaining a relationship between a shear rate and a shear viscosity in the power law region of the polymer solution using (I). How to create
前記べき乗則領域粘度算出工程では、前記せん断速度γiよりも低速度側に隣接する2点のせん断速度γi−1およびγi−2と、これらに対応するせん断粘度ηi−1およびηi−2とを前記式(I)に代入することを特徴とする請求項2に記載の流動曲線の作成方法。 In the first Newton region viscosity measurement step, the shear rate is changed from the low speed side to the high speed side, the shear viscosity at each shear rate is measured, and the shear stress at each shear rate is also measured. Even when the speed is changed from the low speed side to the high speed side, the shear rate γ i at which the shear stress does not increase is obtained,
Wherein in the power law region the viscosity calculating step, the shear rates gamma i-1 and gamma i-2 of two points adjacent to the lower speed side than the shear rate gamma i, shear viscosity eta i-1 and eta corresponding to these 3. The method of creating a flow curve according to claim 2, wherein i-2 is substituted into the formula (I).
前記高分子溶液と同種の溶媒およびポリマーからなり、前記高分子溶液よりも高分子濃度が低く、かつ、互いに高分子濃度が異なる複数種の低濃度高分子溶液について、せん断速度依存性がない領域におけるせん断粘度をそれぞれ実測して、高分子濃度とせん断粘度との関係を示す線形近似式を求め、該線形近似式に前記高分子溶液の高分子濃度を代入する方法により、該高分子溶液の第2ニュートン領域におけるせん断粘度を求めることを特徴とするせん断粘度推算方法。 A non-Newtonian polymer solution in which a polymer is dissolved in a solvent, a shear viscosity estimating method for obtaining a shear viscosity in a second Newton region,
A region having no shear rate dependency for a plurality of types of low-concentration polymer solutions comprising the same type of solvent and polymer as the polymer solution and having a polymer concentration lower than that of the polymer solution and different from each other. Each of the shear viscosities of the polymer solution was measured to obtain a linear approximation formula indicating the relationship between the polymer concentration and the shear viscosity, and the polymer solution concentration of the polymer solution was substituted into the linear approximation formula. A shear viscosity estimation method characterized by obtaining a shear viscosity in a second Newton region.
Priority Applications (1)
| Application Number | Priority Date | Filing Date | Title |
|---|---|---|---|
| JP2009221873A JP2011069754A (en) | 2009-09-28 | 2009-09-28 | Shearing viscosity estimation method and rheogram creation method |
Applications Claiming Priority (1)
| Application Number | Priority Date | Filing Date | Title |
|---|---|---|---|
| JP2009221873A JP2011069754A (en) | 2009-09-28 | 2009-09-28 | Shearing viscosity estimation method and rheogram creation method |
Publications (1)
| Publication Number | Publication Date |
|---|---|
| JP2011069754A true JP2011069754A (en) | 2011-04-07 |
Family
ID=44015155
Family Applications (1)
| Application Number | Title | Priority Date | Filing Date |
|---|---|---|---|
| JP2009221873A Pending JP2011069754A (en) | 2009-09-28 | 2009-09-28 | Shearing viscosity estimation method and rheogram creation method |
Country Status (1)
| Country | Link |
|---|---|
| JP (1) | JP2011069754A (en) |
Cited By (4)
| Publication number | Priority date | Publication date | Assignee | Title |
|---|---|---|---|---|
| WO2014132412A1 (en) * | 2013-02-28 | 2014-09-04 | 株式会社 エー・アンド・デイ | Method for finding shear rate of fluid, and program and device for same |
| KR20170113791A (en) * | 2016-03-25 | 2017-10-13 | 주식회사 엘지화학 | Prediction method for slot coating failure |
| JP2019507879A (en) * | 2016-03-07 | 2019-03-22 | アドヴァンスド ポリマー モニタリング テクノロジーズ インコーポレイテッドAdvanced Polymer Monitoring Technologies, Inc. | Device and method for simultaneously identifying intrinsic viscosity and non-newton behavior of polymers |
| CN112012728A (en) * | 2020-08-19 | 2020-12-01 | 中国石油天然气股份有限公司 | Method for determining flow velocity of polymer in reservoir interstitial space |
-
2009
- 2009-09-28 JP JP2009221873A patent/JP2011069754A/en active Pending
Cited By (8)
| Publication number | Priority date | Publication date | Assignee | Title |
|---|---|---|---|---|
| WO2014132412A1 (en) * | 2013-02-28 | 2014-09-04 | 株式会社 エー・アンド・デイ | Method for finding shear rate of fluid, and program and device for same |
| JP6016934B2 (en) * | 2013-02-28 | 2016-10-26 | 株式会社エー・アンド・デイ | Method, program and apparatus for determining fluid shear rate |
| JP2019507879A (en) * | 2016-03-07 | 2019-03-22 | アドヴァンスド ポリマー モニタリング テクノロジーズ インコーポレイテッドAdvanced Polymer Monitoring Technologies, Inc. | Device and method for simultaneously identifying intrinsic viscosity and non-newton behavior of polymers |
| JP2021103175A (en) * | 2016-03-07 | 2021-07-15 | フルエンス アナリティクス, ファーマリー アドヴァンスド ポリマー モニタリング テクノロジーズ, インコーポレイテッドFLUENCE ANALYTICS, formerly ADVANCED POLYMER MONITORING TECHNOLOGIES, INC. | Device and method for specifying simultaneously intrinsic viscosity of polymer and non-newtonian behavior |
| KR20170113791A (en) * | 2016-03-25 | 2017-10-13 | 주식회사 엘지화학 | Prediction method for slot coating failure |
| KR102065964B1 (en) | 2016-03-25 | 2020-01-15 | 주식회사 엘지화학 | Prediction method for slot coating failure |
| CN112012728A (en) * | 2020-08-19 | 2020-12-01 | 中国石油天然气股份有限公司 | Method for determining flow velocity of polymer in reservoir interstitial space |
| CN112012728B (en) * | 2020-08-19 | 2024-03-26 | 中国石油天然气股份有限公司 | Method for determining flow velocity of polymer between reservoir gaps |
Similar Documents
| Publication | Publication Date | Title |
|---|---|---|
| Mermet-Guyennet et al. | LAOS: The strain softening/strain hardening paradox | |
| Othman et al. | Wall slip and melt fracture of poly (lactides) | |
| Münstedt | Rheological experiments at constant stress as efficient method to characterize polymeric materials | |
| McDougall et al. | Inferring meaningful relaxation spectra from experimental data | |
| De Sousa et al. | Analytical model of atomic-force-microscopy force curves in viscoelastic materials exhibiting power law relaxation | |
| Woo Inn | Melt fracture and wall slip of metallocene-catalyzed bimodal polyethylenes in capillary flow | |
| JP2011069754A (en) | Shearing viscosity estimation method and rheogram creation method | |
| Medina-Bañuelos et al. | Tangential annular (Couette) flow of a viscoplastic microgel with wall slip | |
| Ebrahimi et al. | Wall slip of polydisperse linear polymers using double reptation | |
| Köpplmayr et al. | A novel online rheometer for elongational viscosity measurement of polymer melts | |
| JP2017188032A (en) | Prediction method of performance of polymer composition | |
| Evans et al. | Major roles of blend partner fragility and dye placement on component glass transition temperatures: Fluorescence study of near-infinitely dilute species in binary blends | |
| Tan et al. | Gelation behavior of polyacrylonitrile solution in relation to aging process and gel concentration | |
| Berens et al. | Particle size and molecular weight effects on the melt flow of emulsion PVC | |
| Münstedt | Elastic behavior of polymer melts: rheology and processing | |
| Andablo-Reyes et al. | A study on the stability of the stress response of nonequilibrium ultrahigh molecular weight polyethylene melts during oscillatory shear flow | |
| Torres et al. | Branching structure and strain hardening of branched metallocene polyethylenes | |
| Oosterlinck et al. | Morphology development of a polystyrene/polymethylmethacrylate blend during start-up of uniaxial elongational flow | |
| Gusenbauer et al. | Visualization of the stimuli-responsive surface behavior of functionalized wood material by chemical force microscopy | |
| Teixeira et al. | A Small‐Scale Experimental Extrusion Set‐Up for Exploring Relationships Between Process‐Induced Structures and Characteristics of Multiphase Polymer Systems | |
| Malkin et al. | Pressure losses in flow of viscoelastic polymeric fluids through short channels | |
| Kriksin et al. | Nonmonotonic incommensurability effects in lamellar-in-lamellar self-assembled multiblock copolymers | |
| CN106124744A (en) | A kind of method testing coal tar pitch rheological characteristic | |
| Wales | A collaborative study of capillary flow of a highly lubricated unplasticized poly (vinyl chloride) | |
| Swallow | Viscosity of polydimethylsiloxane gum: Shear and temperature dependence from dynamic and capillary rheometry |