JP2010540902A - Hydrocarbon detection method using wavelet dominant frequency and energy loss on the high frequency side of wavelet dominant frequency - Google Patents
Hydrocarbon detection method using wavelet dominant frequency and energy loss on the high frequency side of wavelet dominant frequency Download PDFInfo
- Publication number
- JP2010540902A JP2010540902A JP2010525882A JP2010525882A JP2010540902A JP 2010540902 A JP2010540902 A JP 2010540902A JP 2010525882 A JP2010525882 A JP 2010525882A JP 2010525882 A JP2010525882 A JP 2010525882A JP 2010540902 A JP2010540902 A JP 2010540902A
- Authority
- JP
- Japan
- Prior art keywords
- frequency
- dominant frequency
- energy loss
- spectrum
- delta
- Prior art date
- Legal status (The legal status is an assumption and is not a legal conclusion. Google has not performed a legal analysis and makes no representation as to the accuracy of the status listed.)
- Granted
Links
- 229930195733 hydrocarbon Natural products 0.000 title claims abstract description 35
- 150000002430 hydrocarbons Chemical class 0.000 title claims abstract description 34
- 239000004215 Carbon black (E152) Substances 0.000 title claims abstract description 28
- 238000001514 detection method Methods 0.000 title description 16
- 238000000034 method Methods 0.000 claims abstract description 36
- 238000001228 spectrum Methods 0.000 claims abstract description 35
- 238000005259 measurement Methods 0.000 claims abstract description 28
- 238000012545 processing Methods 0.000 claims abstract description 7
- 230000007423 decrease Effects 0.000 claims description 8
- 238000010521 absorption reaction Methods 0.000 claims description 2
- 238000004458 analytical method Methods 0.000 description 8
- 230000003595 spectral effect Effects 0.000 description 7
- 230000006870 function Effects 0.000 description 6
- 230000008859 change Effects 0.000 description 5
- 238000000354 decomposition reaction Methods 0.000 description 4
- 238000010586 diagram Methods 0.000 description 4
- 239000012530 fluid Substances 0.000 description 4
- 230000003993 interaction Effects 0.000 description 4
- 230000035699 permeability Effects 0.000 description 4
- 238000004880 explosion Methods 0.000 description 3
- 239000000203 mixture Substances 0.000 description 3
- 239000003208 petroleum Substances 0.000 description 3
- 230000008569 process Effects 0.000 description 3
- 230000007704 transition Effects 0.000 description 3
- 238000004364 calculation method Methods 0.000 description 2
- 238000013480 data collection Methods 0.000 description 2
- 239000007789 gas Substances 0.000 description 2
- 239000011435 rock Substances 0.000 description 2
- 238000005070 sampling Methods 0.000 description 2
- 238000010183 spectrum analysis Methods 0.000 description 2
- XLYOFNOQVPJJNP-UHFFFAOYSA-N water Substances O XLYOFNOQVPJJNP-UHFFFAOYSA-N 0.000 description 2
- 230000002159 abnormal effect Effects 0.000 description 1
- 238000007405 data analysis Methods 0.000 description 1
- 230000000694 effects Effects 0.000 description 1
- 125000001183 hydrocarbyl group Chemical group 0.000 description 1
- 239000007788 liquid Substances 0.000 description 1
- 238000012986 modification Methods 0.000 description 1
- 230000004048 modification Effects 0.000 description 1
- 230000001902 propagating effect Effects 0.000 description 1
- 239000000758 substrate Substances 0.000 description 1
- 230000009466 transformation Effects 0.000 description 1
- 238000000844 transformation Methods 0.000 description 1
Images


Classifications
-
- G—PHYSICS
- G01—MEASURING; TESTING
- G01V—GEOPHYSICS; GRAVITATIONAL MEASUREMENTS; DETECTING MASSES OR OBJECTS; TAGS
- G01V1/00—Seismology; Seismic or acoustic prospecting or detecting
- G01V1/28—Processing seismic data, e.g. for interpretation or for event detection
- G01V1/30—Analysis
Landscapes
- Engineering & Computer Science (AREA)
- Remote Sensing (AREA)
- Physics & Mathematics (AREA)
- Life Sciences & Earth Sciences (AREA)
- Acoustics & Sound (AREA)
- Environmental & Geological Engineering (AREA)
- Geology (AREA)
- General Life Sciences & Earth Sciences (AREA)
- General Physics & Mathematics (AREA)
- Geophysics (AREA)
- Geophysics And Detection Of Objects (AREA)
- Measurement Of Mechanical Vibrations Or Ultrasonic Waves (AREA)
Abstract
本発明の一実施形態による方法は,関心領域の地震トレースデータを取得するステップと,前記地震トレースデータを処理して前記地震データからの少なくとも1つのサンプルの少なくとも1つのスペクトルを計算するステップと,前記少なくとも1つのスペクトルの少なくとも1つの優位周波数(CQD)を計算するステップと,前記少なくとも1つのスペクトルの前記少なくとも1つの優位周波数(QD)以上の周波数の少なくとも1つのエネルギー損失の測定を計算するステップと,前記少なくとも1つの優位周波数(CQD)及び前記少なくとも1つのエネルギー損失の測定を用いて関心領域の炭化水素貯留層を特定するステップと,を含む。
【選択図】図4A method according to an embodiment of the present invention includes obtaining seismic trace data of a region of interest; processing the seismic trace data to calculate at least one spectrum of at least one sample from the seismic data; Calculating at least one dominant frequency (CQD) of the at least one spectrum, and calculating at least one energy loss measurement of the at least one dominant frequency (QD) or higher of the at least one spectrum. And identifying a hydrocarbon reservoir of the region of interest using the at least one dominant frequency (CQD) and the at least one energy loss measurement.
[Selection] Figure 4
Description
本発明は,地震データを用いた炭化水素検出方法及びシステムに関する。 The present invention relates to a hydrocarbon detection method and system using seismic data.
既存の地震探査炭化水素直接検出方法は,主として,地球に存在する音響反射境界の特性に焦点を合わせている。これらの方法は,該境界自体からの音響反射の強度が,所定の境界の上層及び下層内の岩石の特定の岩石学的特性により決定される,という理論の上に成り立っている。 Existing seismic direct hydrocarbon detection methods focus primarily on the properties of the acoustic reflection boundaries present on the earth. These methods are based on the theory that the intensity of acoustic reflection from the boundary itself is determined by specific petrological properties of rocks in the upper and lower layers of a given boundary.
しかしながら,該反射ベースの方法は完璧とはいえない。ある境界の各点における反射は,少なくとも8つの変数(P波速度(上),S波速度(上),密度(上),P波速度(下),S波速度(下),密度(下),入射光線経路の角度,同調効果又はその欠落を引き起こしうる層厚)に依存する。これら変数間の相互作用は,特定の一つを正確に決定するのを困難にする。 However, the reflection-based method is not perfect. Reflection at each point of a boundary is at least eight variables (P wave velocity (up), S wave velocity (up), density (up), P wave velocity (down), S wave velocity (down), density (down) ), The angle of the incident beam path, the tuning effect or the layer thickness that can cause it to be lost. The interaction between these variables makes it difficult to determine exactly one particular one.
従って,反射境界の強度に依存しない直接検出方法が好ましい。 Therefore, a direct detection method that does not depend on the intensity of the reflection boundary is preferable.
本発明の一側面は,炭化水素検出方法に関する。本発明の一側面による方法は,関心領域の地震トレースデータを取得するステップと,前記地震トレースデータを処理して前記地震データからの少なくとも1つのサンプルの吸うなくとも1つのスペクトルを計算するステップと,前記少なくとも1つのスペクトルの少なくとも1つの優位周波数(ωD)を計算するステップと,前記少なくとも1つのスペクトルの前記少なくとも1つの優位周波数(ωD)以上の周波数の少なくとも1つのエネルギー損失の測定を計算するステップと,前記少なくとも1つの優位周波数(ωD)及び前記少なくとも1つのエネルギー損失の測定を用いて関心領域の炭化水素貯留層を特定するステップと,を含む。 One aspect of the present invention relates to a hydrocarbon detection method. A method according to one aspect of the invention includes obtaining seismic trace data of a region of interest; processing the seismic trace data to calculate at least one sample of the at least one sample from the seismic data; , Calculating at least one dominant frequency (ω D ) of the at least one spectrum, and measuring at least one energy loss at a frequency greater than or equal to the at least one dominant frequency (ω D ) of the at least one spectrum. Calculating and determining a hydrocarbon reservoir of the region of interest using the at least one dominant frequency (ω D ) and the at least one energy loss measurement.
本発明の他の側面及び利点は,以下の説明及び添付の特許請求の範囲から明らかになるであろう。 Other aspects and advantages of the invention will be apparent from the following description and the appended claims.
以下に記載の添付図面を参照する。 Reference is made to the accompanying drawings described below.
本発明の実施形態は,地震データを用いた炭化水素検出方法及びシステムに関する。特に,本発明の実施形態は,地震データから2つの測定を導出し,該2つの測定を結び付けて炭化水素検出のための指標としての第3の測定を生成することに依存する。あるいは,該2つの導出された測定は,炭化水素の位置を示すために一緒に解釈されうる。地震データから導出される該2つの測定は,優位周波数(ωD)及び該優位周波数(ωD)以上のエネルギー損失率を含む。 Embodiments described herein relate generally to a hydrocarbon detection method and system using seismic data. In particular, embodiments of the present invention rely on deriving two measurements from seismic data and combining the two measurements to generate a third measurement as an indicator for hydrocarbon detection. Alternatively, the two derived measurements can be interpreted together to indicate the position of the hydrocarbon. The two measurements are derived from seismic data includes a dominant frequency (omega D) and該優position frequency (omega D) or rate of energy loss.
優位周波数(ωD)は,最大振幅スペクトルから特定しうる。本発明の属する技術の分野における通常の知識を有する者であれば,該分析にフーリエ変換や高速フーリエ変換を含む(但し,これらに限定されない)複数の変換の任意の一つを用いて,時間領域地震データをサンプル毎に周波数領域データに変換しうることを理解するであろう。また,該データは,スペクトル分析を容易にするためのさまざまな機能で操作しうる。本発明の実施例によれば,優位周波数(ωD)の測定は,任意の適切な方法で行うことができ,その一つは,米国特許出願公開第11/788,910号明細書に記載されており,引用によりその全文を本明細書に組み込む。 The dominant frequency (ω D ) can be identified from the maximum amplitude spectrum. A person having ordinary knowledge in the technical field to which the present invention pertains uses any one of a plurality of transformations including, but not limited to, Fourier transform and fast Fourier transform in the analysis, and It will be appreciated that domain seismic data can be converted to frequency domain data for each sample. The data can also be manipulated with various functions to facilitate spectral analysis. According to embodiments of the present invention, the measurement of dominant frequency (ω D ) can be performed in any suitable manner, one of which is described in US patent application Ser. No. 11 / 788,910. Which is incorporated herein by reference in its entirety.
上述の通り,ある層を伝播する地震波のエネルギーの減衰は,該層の炭化水素の種類及び量を含むさまざまな要因によって引き起こされうる。該減衰は,周波数の関数として変化しうる。従って,優位周波数(ωD)近傍の周波数の関数としてのエネルギー損失の分析は,該層の炭化水素の種類及び量の指標を提供しうる。特に,本発明の方法は,優位周波数(ωD)よりも高い周波数におけるエネルギー損失率を利用する。優位周波数(ωD)以上のスペクトルのエネルギー損失率を測定する方法は多数ある。これらの方法には,本明細書に記載のデルタ周波数(ωdelta),本明細書に記載の「ωf2」,及び1/Qgが含まれる(但し,これらに限定されない)。1/Qgは,米国特許第7,243,029号明細書に記載されており,引用によりその全文を本明細書に組み込む。 As noted above, the attenuation of seismic energy propagating through a layer can be caused by a variety of factors including the type and amount of hydrocarbons in the layer. The attenuation can vary as a function of frequency. Thus, analysis of energy loss as a function of frequency near the dominant frequency (ω D ) can provide an indication of the type and amount of hydrocarbons in the layer. In particular, the method of the present invention utilizes the energy loss rate at frequencies higher than the dominant frequency (ω D ). There are many methods for measuring the energy loss rate of the spectrum above the dominant frequency (ω D ). These methods include (but are not limited to) the delta frequency (ω delta ) described herein, “ω f2 ” and 1 / Q g as described herein. 1 / Q g is described in U.S. Patent No. 7,243,029 Pat incorporated herein in its entirety by reference.
優位周波数(ωD)及び該優位周波数(ωD)の高周波側のエネルギー損失の測定が測定されると,これらの2つの測定は,これらが推移し低下する(すなわち,両値が相互に関連し低下する)位置を測定し,炭化水素貯留の位置を特定するために直接解釈することができる。あるいは,これらの2つの測定は,曲線が推移し低下する関心領域を特定するための第3のデータセットを計算するための別のアルゴリズムへの入力として使用することができる。 When measurement energy loss of the high frequency side of the dominant frequency (omega D) and該優position frequency (omega D) is measured, these two measurements, they remained reduced (i.e., both values are related to each other Can be interpreted directly to determine the location of the hydrocarbon reservoir. Alternatively, these two measurements can be used as input to another algorithm to calculate a third data set to identify a region of interest where the curve will transition and decline.
以下の説明は,本発明のさまざまな実施形態を網羅している。これらのシステム及び方法は,境界反射分析に基づくものではなく,地下層を伝播する際の地震波の変化に基づいている。上述の通り,地震波が地下層を伝播する際,該エネルギーは,伝播の経路に沿って,基質の種類,孔隙率,浸透率,流体の種類,温度,及び圧力を含む該層の岩石特性に応じて,さまざまな程度及びさまざまな形で減衰する。当業者は,以下の説明が,例示のみを目的としており,本発明の範囲から逸脱することなくさまざまな改変が可能であることを理解するであろう。 The following description covers various embodiments of the invention. These systems and methods are not based on boundary reflection analysis, but are based on changes in seismic waves as they propagate through the underground. As described above, when seismic waves propagate through the underground layer, the energy is reflected in the rock properties of the layer, including substrate type, porosity, permeability, fluid type, temperature, and pressure along the propagation path. Correspondingly, it attenuates in various degrees and in various forms. Those skilled in the art will appreciate that the following description is for illustrative purposes only and that various modifications are possible without departing from the scope of the present invention.
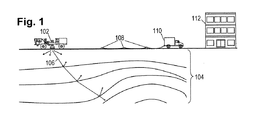
図1は,開示するシステム及び方法の使用のための例示的コンテキストを示す。(水中測量における)振動トラック,小爆発,空気銃などの地震源102は,地下層104を伝播する地震波を発生させる。選択された伝播路106に示されるように,地震波は,地下層104間の境界において反射及び屈折し,最終的に,反射された地震波の一部は,受信機108のアレイに到達する。該アレイは,通常,格子状に配置された多数の受信機108を含む。受信機108は,地震波を後にレコーダートラックなどの記録設備110において記録される電気信号に変換する。最終的に,該記録データは,分析のために中央施設112に輸送又は伝送される。
FIG. 1 illustrates an exemplary context for use of the disclosed system and method. A seismic source 102 (such as underwater surveying), such as a vibrating track, a small explosion, or an air gun, generates seismic waves that propagate through the
地震源102は,通常,受信機108のアレイに対してさまざまな位置で何度も爆発を起こす。受信機108のアレイは,その後移動され,該プロセスが何度も繰り返されうる。複数の源及び受信機の位置を使用することにより,さまざまな伝播路からのデータを雑音を減衰させる形で結集することができる。
The
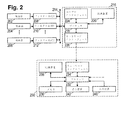
図2は,地震データの収集及び分析に用いられるさまざまなシステム及び装置のブロック図を示す。検出器202,204,206は,地震波を後に増幅される電気信号に変換する変換器である。アナログ・デジタル変換器(ADC)ブロック208,210,212は,それぞれ,検出器202,204,206から増幅電気信号を受け取る。ADCブロック208,210,212は,該増幅電気信号をフィルタリングして,これらをデジタル形式に変換する。デジタルサンプリングは,例えば,1〜4ミリ秒間隔で行われる。各受信機108は,少なくとも1つの検出器及びADCブロックを含みうる。
FIG. 2 shows a block diagram of various systems and devices used for seismic data collection and analysis. The
バス214は,ADCブロック208,210,212を記録システム216に連結する。バス214は,複数のワイヤ,ケーブル,及び/又は対応アダプターとの無線接続の簡易表現である。
図示する記録システム216は,プロセッサ218,記憶装置220,ユーザーインターフェース224,及びネットワークインターフェース226を含みうる。プロセッサ218は,例えば,受信機からデジタルデータを収集及びフォーマットし,該デジタルデータを記憶装置220のファイルに記憶しうる。あるいは,該デジタルデータは,遠隔記憶のためにネットワーク上でストリーミングされうる。該ファイルは,ファイル内のデータに関するヘッダー情報,例えば,アレイ受信機の数,デジタル化サンプルのビット解像度,サンプリングレート,記録期間の開始時間及び長さ,並びに源及びアレイ中の各受信機の位置,を含みうる。該地震データサンプルは,受け取り時に多重化されてファイルに書き込まれうる。地震源102の各爆発ごとに新たなファイルが作成されうる。
The illustrated
データの収集及び記録方法は,ユーザーインターフェース224を通じて制御しうる。通常,ユーザーインターフェース224は,ユーザーが設定可能なオプションをプロセッサ218が表示するディスプレー,及びユーザーが所望の設定をプロセッサ218に伝えるのに使用可能なキーパッドその他の入力装置を含む。調査が終了すると,地震データファイルは,ネットワークインターフェース226を通じて炭化水素検出システム230に輸送又は伝送されうる。
Data collection and recording methods may be controlled through the
本発明の一実施形態によれば,炭化水素検出システム230は,ソフトウェアを使用した炭化水素検出システムとして動作するように設定された汎用コンピュータでありうる。システム230は,プロセッサ232,ネットワークインターフェース234,メモリ装置236,記憶装置238,入力装置240,及び表示装置242を含みうる。ネットワークインターフェース234は,プロセッサ232を記録システム216に連結しうり,プロセッサ232が記録システム216に記憶されたソフトウェア及びデータを取り出すのを可能にする。メモリ装置236に記憶されたソフトウェアは,入力装置240及びディスプレー242を通じてユーザーとやりとりをするようにプロセッサ232を設定しうる。
According to one embodiment of the present invention, the
ユーザーは,プロセッサ232に記憶装置238に記憶された地震データファイル処理プログラムを実行させうる。プロセッサ232は,通常,プログラムの一部又は全部を高速アクセスのためにメモリ236にコピーすることによりプログラムの実行を開始する。データフェイル処理プログラムは,ユーザーからの指示に基づいて,記憶装置238から地震データファイルを取り出しうる。データファイル処理プログラムは,その後,データにプリスタック処理を施してデータをスタックし,スタックしたデータを新たな地震データセットとして記憶する。
The user can cause the
次に,ユーザーは,プロセッサ232に炭化水素検出プログラムを実行させうる。データファイル処理プログラム同様に,プロセッサ232は,炭化水素検出プログラムをメモリ236にコピーすることにより実行を開始しうる。炭化水素検出プログラムは,ユーザーからの指示に基づいて,生の地震データファイルから及び/又は地震のスタックデータセットからトレースを取り出すようにプロセッサ232を設定しうる。炭化水素検出プログラムは,以下にて詳細に説明するようにトレースを処理し,ユーザーが見るためのセクションやボリュームを最終的に作成するようにプロセッサ232を設定しうる。
The user can then cause the
以下の考察は,システム230により実施されるさまざまな実施方法について説明する。対応する図面は,構成要素の動作を表すブロックと潜在的動作順序を表す矢印を有するフローチャートの形で例示的方法を示す。システム230は,さまざまな方法の構成要素の動作を,示された順序や異なる順序で実行しうる。あるいは,動作の大部分は,順序を変更して,あるいは,同時に実行されうる。該方法は,最終的にハードウェアによって実行されるが,該方法の制御論理は,ソフトウェア,ファームウェア,及び/又はシステム230のハードウェアに実装しうる。
The following discussion describes various implementation methods implemented by the
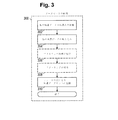
本発明の一実施形態によれば,図3は,地震データファイル処理プログラムにより実行される選択動作を含む,地震データセットを取得する例示的方法300のフローチャートを示す。ブロック302において,記録システム(図2中,216で示される)は,前述の通り,生の地震データを取得して記録する。ブロック304において,炭化水素検出システム(図2中,230で示される)は,該生の地震データを(ユーザからの指示に基づいて)取り出し,該デジタル化サンプルを記録する。前述の通り,記録システム216は,該データを取得時に記憶しうる。システム230は,該データファイルのフォーマットをトレースベースのフォーマットに変換しうる。すなわち,該デジタル化サンプルは,各受信機に別個の時系列を提供するように記録される。システム230は,さらに,各トレースと,例えば,受信器と地震源の中間に位置しうる地図位置を結び付けうる。
In accordance with one embodiment of the present invention, FIG. 3 shows a flowchart of an
方法300は,2つの選択ブロック306,308を含み,これらは互いに独立に省略可能である。ブロック306において,システム230は,プリスタック処理を実行しうる。ブロック308において,システム230は,各地図位置に対して,該地図位置を受信器と地震源の中間点として有するトレースを特定しうる。該トレースは,オフセット,すなわち,地図位置と受信器の距離,に基づいて分類されうる。次に,システム230は,共通オフセットを有する特定トレースを平均化する(「スタックする」)。但し,スタッキングバリエーションによっては,システム230は,地図位置に対して特定されたすべてのトレースを,オフセット及び推定速度の関数として時間領域に最初に拡張した後に,これらのトレースをスタックしうる。スタッキング動作308は,さらに,トレースの信号対雑音比を強化する。ブロック310において,システム230は,再フォーマットした(及び,選択的にフィルタリング及びスタックした)地震データセットを記憶装置(図2中,238で示される)に記憶しうる。
The
ほとんどの地震データ処理ソフトウェアは,該トレースベースのフォーマットの地震データにアクセスするように設定されている。従って,システム230は,前記動作を繰り返すことなく,複数の炭化水素検出方法を実行しうる。
Most seismic data processing software is configured to access seismic data in the trace-based format. Accordingly, the
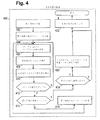
図4は,本発明の一実施形態による炭化水素検出方法400のフローチャート図を示す。ブロック402から開始して,システム230は,(ユーザーからの指示に基づいて)地震データセット内の関心領域を特定する。該関心領域は,全地震データボリュームを含みうり,あるいは,データセットのサブセットでありうる。ブロック404において,システム230は,関心領域と通じて系統的に動作し始め,該地震データセットから最初のトレースを取得する。
FIG. 4 shows a flowchart diagram of a
ブロック406において,システム230は,地震データ内の各関心サンプルにおける周波数スペクトルを計算する。これは,サンプル(例えば,トレース上の選択窓又は区間)におけるスペクトル分解と呼ばれる。サンプルにおけるスペクトル分解を計算する方法は多数ある。該スペクトル分解の一例は,米国特許出願公開第11/788,910号明細書に記載されている。
At
ブロック408において,システム230は,優位周波数(ωD)を測定し,該測定をサンプルの記憶装置に出力する。優位周波数(ωD)は,スペクトルが最大マグニチュードを有する周波数と定義される。優位周波数(ωD)の測定方法は,サンプルの信号スペクトル(又は平滑信号スペクトル)を最初に計算することを含みうる。次に,信号スペクトル又は平滑信号スペクトルの最大マグニチュードは,優位周波数(ωD)を定義する。平滑信号スペクトルを含む該方法は,米国特許出願公開第11/788,910号明細書に記載されている。しかしながら,本発明の方法は,必ずしも平滑信号スペクトルの計算を含まない。代わりに,本発明の方法はまた,平滑信号スペクトルを最初に計算することなく優位周波数(ωD)を決定する。
At
ブロック410において,システム230は,優位周波数(ωD)の高周波側のエネルギー損失(又はエネルギー損失率)を測定し,サンプルの該測定を記憶装置に出力する。該エネルギー損失率の測定方法は複数ある。一例は,スペクトル分析において閾値を設定し,該閾値が優位周波数(ωD)の高周波側のスペクトル曲線と交差する切片を指標として用いる,というものである。該切片が発生する周波数は,エネルギー損失率の指標として用いうる。あるいは,優位周波数(ωD)と該切片点の周波数の差を指標として用いうる。
In block 410, the
ブロック412において,システム230は,分析対象のトレース上の最後のサンプルが検査されたかどうかを判定する。検査されていない場合,システム230は,次のサンプルを検査するためにブロック406に戻る。最後のサンプルがトレースで分析されると,システム230は,ブロック414に進む。
At
ブロック414において,システム230は,関心領域の最後のトレースが検査されたかどうかを判定する。検査されていない場合,システム230は,ブロック416に進み,分析のための次のトレースを取得し,該次のトレースに対し,ステップ406〜414を繰り返す。ブロック414は,最後のトレースが分析されたと判定する場合,システム230は,ブロック418に進み,結果を出力する。
At
ブロック418において,システム230は,ユーザーがブロック408及び410で生成された結果のさらなる分析を希望するかどうかを判定する。希望しない場合,システム230は,ブロック422に進む。希望する場合,システム230は,ブロック420に進む。
At
ブロック420において,システム230は,ブロック408及び410で生成された結果に関するさらなる分析を実行する。該分析は,優位周波数(ωΔ)及び優位周波数(ωΔ)の高周波側のエネルギー損失の測定が推移し低下する,すなわち,両パラメータが相互に関連し値が減少する,炭化水素の存在を示す位置をハイライトするために,さまざまなアルゴリズムから成りうる。但し,該炭化水素は,ガス状又は液体状の炭化水素を含みうる。
At
ブロック422において,システム230は,結果を記憶装置又はユーザーに出力する。
In
該優位周波数ωDは,地震信号の振幅から独立しているが,とりわけ,貯留層流体特性(ガス,石油,水,及び/又はその混合物),貯留層多孔性,浸透性,並びに炭化水素貯留層に入る直前の地震波のスペクトル形状及びエネルギー準位,の相互作用に依存する。 The dominant frequency ω D is independent of the amplitude of the seismic signal, but, among other things, reservoir fluid properties (gas, petroleum, water, and / or mixtures thereof), reservoir porosity, permeability, and hydrocarbon storage. It depends on the interaction between the spectral shape and energy level of the seismic wave just before entering the layer.
図5は,曲線501で示されるサンプルで計算されたスペクトル,及びユーザー定義の閾値502を示す。閾値502は,0と優位の準位の間の任意の準位で決定しうる。適正な値は,優位準位の1%と優位準位の30%の間である。準位のわずかな変化によって測定値の大きな変化が引き起こされるのを回避するためには,該準位を0以上に設定するのが好ましい。また,該準位を優位準位以下に設定するのが好ましい。なぜなら,該準位にて測定値が0になるからである。閾値の選択は,解釈上であり,部分的にスペクトルの解釈される雑音レベルに基づいてなされ,その目的は,閾値を雑音レベル以上に設定することにある。
FIG. 5 shows the spectrum calculated for the sample shown by
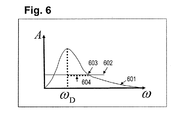
図6は,曲線601で示されるサンプルにおいて計算されたスペクトル,及び該サンプルにおいて計算されたスペクトルが優位周波数ωDよりも高い周波数のユーザー定義の閾値602と交差する603で表わされる点ωF2を示す。ωF2とωDのヘルツ差は,デルタ周波数であり,以下のように表わされうる。

該デルタ周波数ωDeltaは,地震信号の振幅から独立しているが,例えば,貯留層流体特性(ガス,石油,水,及び/又はこれらの混合物),貯留層多孔性,浸透性,並びに炭化水素貯留層に入る直前に存在するサンプルにおいて計算されるスペクトルのエネルギー準位及びスペクトルの形状,の相互作用に依存する。 The delta frequency ω Delta is independent of the amplitude of the seismic signal, but includes, for example, reservoir fluid properties (gas, petroleum, water, and / or mixtures thereof), reservoir porosity, permeability, and hydrocarbons. Depends on the interaction between the spectral energy level and the spectral shape calculated in the sample that exists just before entering the reservoir.
同様に,ωF2は,地震信号の振幅から独立しているが,例えば,貯留層流体特性(ガス,石油,及び/又はその混合物),貯留層多孔性,浸透性,並びに炭化水素貯留層に入る直前の地震波のスペクトル形状及びエネルギー準位,の相互作用に依存する。 Similarly, ω F2 is independent of the amplitude of the seismic signal, but for example, reservoir fluid properties (gas, petroleum, and / or mixtures thereof), reservoir porosity, permeability, and hydrocarbon reservoir It depends on the interaction between the spectrum shape and energy level of the seismic wave just before entering.
再び図4を参照すると,ブロック408において,システム230は,サンプルで計算されたスペクトルの優位周波数ωDを特定しうる。
Referring again to FIG. 4, at
再び図4を参照すると,ブロック410において,システム230は,サンプルで計算されたスペクトルのデルタ周波数ωDeltaや,サンプルで計算されたスペクトルのωF2や,サンプルで計算されたスペクトルの1/Qg(Qgは,優位周波数の高周波側(すなわち,ω>ωD)のスペクトルの信号減衰率を特徴付けるガス吸収率であり,米国特許第7,243,029号明細書に記載されている)を計算したり,優位周波数ωD以上(すなわち,ω>ωD)のエネルギー損失率のその他の測定を行いうる。
Referring again to FIG. 4, at block 410, the
ブロック416において,システム230は,トレースの関心領域の最後の時間間隔が処理されたかどうかを判定する。処理されていなければ,システム230は,処理する次の関心トレースを選択し,関心領域にあるすべてのトレースの時間間隔が処理されるまで,ブロック406〜416の動作を繰り返す。優位周波数の値ωD及びデルタ周波数ωDelta(又はωF2)がトレースの関心領域の各サンプルに対して決定されると,システム230は,ブロック414からブロック418へ進む。この時点において,システム230は,各サンプルにおけるωD及びωDelta(又はωF2あるいは1/Qg)の値を含む。これらの値は,曲線として示すことができる。すなわち,解釈のためにトレースの時間関数としてプロットすることができる。
At
あるいは,システム230は,ブロック418からブロック420へ進んで,これらωD及びωDelta(又はωF2又は1/Qg)のデータセットを検査し,優位周波数の値ωD及び優位周波数の値ωD(例えば,ωDelta又はωF2又は1/Qg)以上のエネルギー損失の測定が推移し低下する(すなわち,両パラメータが相互に関連し値が低下する)位置を判定しうる。
Alternatively,
ブロック420における処理は,さまざまな形をとりうる。一例として,システム230は,ωD及びωDelta又はωF2の曲線が推移し低下する位置に異常が存在するかどうかを判定しうる。ユーザーは,異なるエネルギー準位の閾値602を設定しうる。本明細書で使用する「異常」の語は,周辺領域と比べてωD及びωDeltaの曲線が推移し低下する位置の値をさす。
The processing at
ブロック422において,システム230は,優位周波数ωDelta,デルタ周波数ωDelta,ωF2,1/Qg,又はこれらの組み合わせの測定を出力する。また,当業者であれば,システム230がこれらのパラメータを入力として用いた任意の計算されたデータセットをも出力しうることを理解するであろう。
At
すべての選択されたトレースが処理されると,システム230は,優位周波数ωD,及び/又はデルタ周波数ωDelta,及び/又はωF2異常,及び/又は1/Qg,及び/又はωD及びωDelta(又はωF2又は1/Qg)の曲線を同時に表示又は使用することにより特定された異常を示しうる。表示フォーマットは,設定可能である。従って,該異常は,一次元(例えば,トレースの時間軸),二次元(例えば,マップビュー,コンターマップ,カラーコードマップ,又は垂直断面),三次元(例えば,時間又は深度構造マップ上に重ね合わされた結果のマグニチュードを表すためにカラーで示された結果のプランビューマップ),又はそれ以上の次元の関数としてみなしうる。優位周波数ωD,及び/又はデルタ周波数ωDelta,及び/又はωF2異常,及び/又は1/Qg,及び/又はωD及びωDelta(又はωF2又は1/Qg)の曲線を同時に表示又は使用することにより特定された異常は,コンター(例えば,時間又は深度コンター)により断面図又は平面図の地震トレースデータのビューにも重ね合わせうる。
Once all selected traces have been processed, the
上述の方法及び動作は,時間軸を有する地震トレースデータに関して述べたが,深度軸を有する地震トレースデータに容易に適用しうる。 Although the methods and operations described above have been described with respect to seismic trace data having a time axis, they can be readily applied to seismic trace data having a depth axis.
本発明の一部の実施形態によれば,任意の周知の3Dデジタル出力フォーマット,例えば,SEGYフォーマット(Barry et al., “Recommended Standards for Digital Tape Formats,” Digital Tape Standards, Society of Exploration Geophysics, 1980)などを本発明の実施形態と併用しうる。 According to some embodiments of the present invention, any well-known 3D digital output format, such as the SEGY format (Barry et al., “Recommended Standards for Digital Tape Formats,” Digital Tape Standards, Society 80 And the like can be used in combination with the embodiment of the present invention.
図7は,2.4秒と3.0秒の間の時間サンプルにおけるデータのトレースに関するスペクトル分解の一例を示す。垂直軸が時間である。水平軸は周波数であり,時間−周波数値はカラーで示される。また,図7には,デルタ周波数ωDeltaの測定が702で表示される曲線で示されている。また,図7には,優位周波数ωD及びデルタ周波数ωDeltaが推移し低下する位置が示されている。該位置は706で表示されている。706等で表示される位置は,炭化水素を含む位置を示す。 FIG. 7 shows an example of spectral decomposition for a trace of data in a time sample between 2.4 and 3.0 seconds. The vertical axis is time. The horizontal axis is frequency and time-frequency values are shown in color. In FIG. 7, the measurement of the delta frequency ω Delta is shown by a curve displayed at 702. Further, FIG. 7 shows a position where the dominant frequency ω D and the delta frequency ω Delta change and decrease. The position is indicated by 706. A position indicated by 706 or the like indicates a position including hydrocarbons.
以上,本発明の特定の実施形態について開示し述べたが,本発明は,該考察に限定されるものではなく,添付特許請求の範囲にのみ限定される。 While specific embodiments of the invention have been disclosed and described above, the invention is not limited to such considerations, but only by the scope of the appended claims.
Claims (9)
前記地震トレースデータを処理して前記地震データからの少なくとも1つのサンプルの少なくとも1つのスペクトルを計算するステップと,
前記少なくとも1つのスペクトルの少なくとも1つの優位周波数(ωD)を計算するステップと,
前記少なくとも1つのスペクトルの前記少なくとも1つの少なくとも優位周波数(ωD)以上の周波数における少なくとも1つのエネルギー損失の測定を計算するステップと,
前記少なくとも1つの優位周波数(ωD)及び前記少なくとも1つのエネルギー損失の測定を用いて前記関心領域の炭化水素貯留層を特定するステップと,
を含む炭化水素の検出方法。 Acquiring seismic trace data of the region of interest;
Processing the seismic trace data to calculate at least one spectrum of at least one sample from the seismic data;
Calculating at least one dominant frequency (ω D ) of the at least one spectrum;
Calculating at least one energy loss measurement at a frequency above the at least one at least dominant frequency (ω D ) of the at least one spectrum;
Identifying a hydrocarbon reservoir in the region of interest using the at least one dominant frequency (ω D ) and the at least one energy loss measurement;
A method for detecting hydrocarbons.
請求項1に記載の方法。 The step of identifying includes the step of identifying a region where the measured value of the at least one dominant frequency (ω D ) and the at least one energy loss is reduced;
The method of claim 1.
請求項1に記載の方法。 The energy loss measurement is ω F2 , the frequency at which the calculated spectrum exceeds a selected threshold on the high frequency side of the dominant frequency (ω D ),
The method of claim 1.
請求項3に記載の方法。 The energy loss measurement is ω Delta (ω Delta = ω F2 −ω D ),
The method of claim 3.
請求項1に記載の方法。 Processing the seismic trace data to calculate at least one spectrum includes calculating at least one smoothed signal spectrum;
The method of claim 1.
請求項5に記載の方法。 The energy loss measurement is ω F2 , the frequency at which the calculated spectrum exceeds a selected threshold on the high frequency side of the dominant frequency (ω D ),
The method of claim 5.
請求項6に記載の方法。 The energy loss measurement is ω Delta (ω Delta = ω F2 −ω D ),
The method of claim 6.
請求項1に記載の方法。 The energy loss measurement is 1 / Q g (Q g is the gas absorption rate characterizing the signal attenuation rate of the high frequency spectrum of the dominant frequency (ω D ).
The method of claim 1.
請求項8に記載の方法。 The identifying step includes identifying a position where both the dominant frequency (ω D ) and 1 / Q g values decrease;
The method of claim 8.
Applications Claiming Priority (3)
| Application Number | Priority Date | Filing Date | Title |
|---|---|---|---|
| US11/903,602 US7876643B2 (en) | 2007-09-24 | 2007-09-24 | Methods of hydrocarbon detection using wavelet dominant frequency and a measure of energy loss on the high-frequency side of wavelet dominant frequency |
| US11/903,602 | 2007-09-24 | ||
| PCT/US2008/074996 WO2009042355A2 (en) | 2007-09-24 | 2008-09-02 | Methods of hydrocarbon detection using wavelet dominant frequency and a measure of energy loss on the high-frequency side of wavelet dominant frequency |
Publications (2)
| Publication Number | Publication Date |
|---|---|
| JP2010540902A true JP2010540902A (en) | 2010-12-24 |
| JP5355575B2 JP5355575B2 (en) | 2013-11-27 |
Family
ID=40471426
Family Applications (1)
| Application Number | Title | Priority Date | Filing Date |
|---|---|---|---|
| JP2010525882A Expired - Fee Related JP5355575B2 (en) | 2007-09-24 | 2008-09-02 | Hydrocarbon detection method using wavelet dominant frequency and energy loss on the high frequency side of wavelet dominant frequency |
Country Status (6)
| Country | Link |
|---|---|
| US (1) | US7876643B2 (en) |
| EP (1) | EP2201409A4 (en) |
| JP (1) | JP5355575B2 (en) |
| AU (1) | AU2008305385B2 (en) |
| CA (1) | CA2700627C (en) |
| WO (1) | WO2009042355A2 (en) |
Cited By (2)
| Publication number | Priority date | Publication date | Assignee | Title |
|---|---|---|---|---|
| JP2019007873A (en) * | 2017-06-27 | 2019-01-17 | ジャパングリーンクライメートキャピタル合同会社 | Underground survey system and method for underground survey |
| JP2019109168A (en) * | 2017-12-20 | 2019-07-04 | 株式会社安藤・間 | Bedrock evaluation method |
Families Citing this family (13)
| Publication number | Priority date | Publication date | Assignee | Title |
|---|---|---|---|---|
| US9043155B2 (en) * | 2010-10-07 | 2015-05-26 | Westerngeco L.L.C. | Matching pursuit-based apparatus and technique to construct a seismic signal using a predicted energy distribution |
| AU2015202249B2 (en) * | 2010-11-23 | 2017-01-05 | Apex Spectral Technology, Inc. | Methods of hydrocarbon detection using spectra dominant frequency and measures of energy decay on the low side and high side of spectra dominant frequency |
| WO2012071115A2 (en) * | 2010-11-23 | 2012-05-31 | Apex Spectral Technology, Inc. | Methods of hydrocarbon detection using spectra dominant frequency and measures of energy decay on the low side and high side of spectra dominant frequency |
| CN105093284A (en) * | 2014-05-16 | 2015-11-25 | 中国石油化工股份有限公司 | Amplitude spectrum smoothing method for projecting dominant frequency |
| CN106199714B (en) * | 2016-08-15 | 2017-11-24 | 北京海思派克科技有限公司 | The method and apparatus that the equivalent dominant frequency of geological data calculates |
| CN109726409A (en) * | 2017-10-30 | 2019-05-07 | 中国石油化工股份有限公司 | A kind of recognition methods of gas reservoir water enchroachment (invasion) predominant pathway |
| CN109752758B (en) * | 2019-01-16 | 2019-08-27 | 中国石油大学(华东) | Seismic data decomposition method, system, storage medium and terminal |
| US11269101B2 (en) | 2019-04-16 | 2022-03-08 | Saudi Arabian Oil Company | Method and system of direct gas reservoir detection using frequency slope |
| CN110361780B (en) * | 2019-07-26 | 2021-01-12 | 西南交通大学 | Seismic wave selection method based on conditional mean input energy spectrum |
| JP7191901B2 (en) * | 2020-07-27 | 2022-12-19 | 日本電子株式会社 | Sample analysis device and method |
| US11762116B2 (en) | 2021-03-18 | 2023-09-19 | Saudi Arabian Oil Company | System and method of hydrocarbon detection using nonlinear model frequency slope |
| CN117805900A (en) * | 2022-09-30 | 2024-04-02 | 中国石油化工股份有限公司 | A gas-bearing prediction method based on dominant incident angle-frequency dual-domain attenuation |
| CN118409351B (en) * | 2024-04-23 | 2025-05-27 | 上海雨辰工程技术有限公司 | A method for fitting ground motion response spectrum without baseline drift |
Citations (1)
| Publication number | Priority date | Publication date | Assignee | Title |
|---|---|---|---|---|
| US20050043892A1 (en) * | 2003-08-19 | 2005-02-24 | Apex Metalink, Inc. | Systems and methods of hydrocarbon detection using wavelet energy absorption analysis |
Family Cites Families (6)
| Publication number | Priority date | Publication date | Assignee | Title |
|---|---|---|---|---|
| US5173880A (en) * | 1989-12-26 | 1992-12-22 | Exxon Production Research Company | Method of generating seismic wavelets using seismic range equation |
| US5414674A (en) * | 1993-11-12 | 1995-05-09 | Discovery Bay Company | Resonant energy analysis method and apparatus for seismic data |
| US5583825A (en) * | 1994-09-02 | 1996-12-10 | Exxon Production Research Company | Method for deriving reservoir lithology and fluid content from pre-stack inversion of seismic data |
| US6092025A (en) * | 1998-11-19 | 2000-07-18 | Phillips Petroleum Company | Hydrocarbon edge detection using seismic amplitude |
| AU2004267449B2 (en) * | 2003-08-19 | 2008-05-22 | Apex Spectral Technology, Inc. | Systems and methods of hydrocarbon detection using wavelet energy absorption analysis |
| US6931324B2 (en) * | 2003-10-16 | 2005-08-16 | Rdspi, L.P. | Method for determining formation quality factor from seismic data |
-
2007
- 2007-09-24 US US11/903,602 patent/US7876643B2/en active Active
-
2008
- 2008-09-02 JP JP2010525882A patent/JP5355575B2/en not_active Expired - Fee Related
- 2008-09-02 EP EP08799064.4A patent/EP2201409A4/en not_active Withdrawn
- 2008-09-02 AU AU2008305385A patent/AU2008305385B2/en not_active Ceased
- 2008-09-02 WO PCT/US2008/074996 patent/WO2009042355A2/en not_active Ceased
- 2008-09-02 CA CA2700627A patent/CA2700627C/en active Active
Patent Citations (1)
| Publication number | Priority date | Publication date | Assignee | Title |
|---|---|---|---|---|
| US20050043892A1 (en) * | 2003-08-19 | 2005-02-24 | Apex Metalink, Inc. | Systems and methods of hydrocarbon detection using wavelet energy absorption analysis |
Cited By (3)
| Publication number | Priority date | Publication date | Assignee | Title |
|---|---|---|---|---|
| JP2019007873A (en) * | 2017-06-27 | 2019-01-17 | ジャパングリーンクライメートキャピタル合同会社 | Underground survey system and method for underground survey |
| JP2019109168A (en) * | 2017-12-20 | 2019-07-04 | 株式会社安藤・間 | Bedrock evaluation method |
| JP7030502B2 (en) | 2017-12-20 | 2022-03-07 | 株式会社安藤・間 | Rock evaluation method |
Also Published As
| Publication number | Publication date |
|---|---|
| CA2700627C (en) | 2016-07-05 |
| JP5355575B2 (en) | 2013-11-27 |
| CA2700627A1 (en) | 2009-04-02 |
| US7876643B2 (en) | 2011-01-25 |
| US20090080289A1 (en) | 2009-03-26 |
| EP2201409A2 (en) | 2010-06-30 |
| AU2008305385A1 (en) | 2009-04-02 |
| WO2009042355A3 (en) | 2009-05-07 |
| AU2008305385B2 (en) | 2012-12-06 |
| WO2009042355A2 (en) | 2009-04-02 |
| EP2201409A4 (en) | 2016-05-25 |
Similar Documents
| Publication | Publication Date | Title |
|---|---|---|
| JP5355575B2 (en) | Hydrocarbon detection method using wavelet dominant frequency and energy loss on the high frequency side of wavelet dominant frequency | |
| AU2008242961B2 (en) | Methods of hydrocarbon detection using spectral energy analysis | |
| US9551799B2 (en) | Methods of hydrocarbon detection using spectra dominant frequency and measures of energy decay on the low side and high side of spectra dominant frequency | |
| WO2017024702A1 (en) | Inversion system for ray elastic parameter | |
| RU2369884C2 (en) | Facility and methods of meausurement of interval time for drilling agent in borehole | |
| CN102830423B (en) | Reservoir fluid detection method and reservoir fluid detection device | |
| US8639442B2 (en) | Identifying invalid seismic data | |
| GB2573358A (en) | Gauge length optimization for signal preservation and gauge length processing for distributed vibration sensing | |
| RU2457508C2 (en) | Calibration of pressure gradient records | |
| US6374186B1 (en) | Method for overpressure detection from compressional-and- shear-wave data | |
| Wang et al. | Near-Surface Attenuation and Velocity Structures in Taiwan from Wellhead and Borehole Recordings Comparisons. | |
| CN120405751A (en) | A coal mine disaster data analysis and prediction system based on three-component micro-motion detection | |
| Taweesintananon et al. | Near-surface characterization using shear-wave resonances: A case study from offshore Svalbard, Norway | |
| AU2015202249B2 (en) | Methods of hydrocarbon detection using spectra dominant frequency and measures of energy decay on the low side and high side of spectra dominant frequency | |
| CN111077574A (en) | A method, device and system for determining formation elastic parameters | |
| Hall et al. | Effect of source effort and source distance on optical-fibre data at CaMI. FRS, Newell County, Alberta | |
| AU2004267449B2 (en) | Systems and methods of hydrocarbon detection using wavelet energy absorption analysis | |
| Kim et al. | Calibration of acoustic gauge in the field using seismic Lg phase and coupled high-frequency local infrasound | |
| CN121091347A (en) | Methods and apparatus for determining geological information | |
| Guo et al. | Using Wide-Angle Reflection Wave Technology to Detect Seismic Inversion Data of Complex Geological Structure Zone for a Future Smart World | |
| JP2006292415A (en) | Cavity exploration method | |
| CN121721704A (en) | A method, system, electronic device, and medium for determining near-surface information. | |
| Zhou et al. | Seismicity and reservoir monitoring in the Groningen | |
| MX2007007535A (en) | Process of electromagnetic, electric, and seismic micro time-lapse for the direct detection of hydrocarbons, saline intrusions and abnormalities in live tissues. |
Legal Events
| Date | Code | Title | Description |
|---|---|---|---|
| A621 | Written request for application examination |
Free format text: JAPANESE INTERMEDIATE CODE: A621 Effective date: 20110826 |
|
| A131 | Notification of reasons for refusal |
Free format text: JAPANESE INTERMEDIATE CODE: A131 Effective date: 20130326 |
|
| A601 | Written request for extension of time |
Free format text: JAPANESE INTERMEDIATE CODE: A601 Effective date: 20130626 |
|
| A602 | Written permission of extension of time |
Free format text: JAPANESE INTERMEDIATE CODE: A602 Effective date: 20130703 |
|
| A521 | Request for written amendment filed |
Free format text: JAPANESE INTERMEDIATE CODE: A523 Effective date: 20130704 |
|
| TRDD | Decision of grant or rejection written | ||
| A01 | Written decision to grant a patent or to grant a registration (utility model) |
Free format text: JAPANESE INTERMEDIATE CODE: A01 Effective date: 20130806 |
|
| A61 | First payment of annual fees (during grant procedure) |
Free format text: JAPANESE INTERMEDIATE CODE: A61 Effective date: 20130827 |
|
| R150 | Certificate of patent or registration of utility model |
Ref document number: 5355575 Country of ref document: JP Free format text: JAPANESE INTERMEDIATE CODE: R150 Free format text: JAPANESE INTERMEDIATE CODE: R150 |
|
| R250 | Receipt of annual fees |
Free format text: JAPANESE INTERMEDIATE CODE: R250 |
|
| R250 | Receipt of annual fees |
Free format text: JAPANESE INTERMEDIATE CODE: R250 |
|
| R250 | Receipt of annual fees |
Free format text: JAPANESE INTERMEDIATE CODE: R250 |
|
| R250 | Receipt of annual fees |
Free format text: JAPANESE INTERMEDIATE CODE: R250 |
|
| LAPS | Cancellation because of no payment of annual fees |