JP2007301003A - Motor function testing apparatus and method for comparing phases between motor waveforms - Google Patents
Motor function testing apparatus and method for comparing phases between motor waveforms Download PDFInfo
- Publication number
- JP2007301003A JP2007301003A JP2006130124A JP2006130124A JP2007301003A JP 2007301003 A JP2007301003 A JP 2007301003A JP 2006130124 A JP2006130124 A JP 2006130124A JP 2006130124 A JP2006130124 A JP 2006130124A JP 2007301003 A JP2007301003 A JP 2007301003A
- Authority
- JP
- Japan
- Prior art keywords
- motion
- waveform
- peak
- waveforms
- frequency
- Prior art date
- Legal status (The legal status is an assumption and is not a legal conclusion. Google has not performed a legal analysis and makes no representation as to the accuracy of the status listed.)
- Abandoned
Links
Images
Classifications
-
- A—HUMAN NECESSITIES
- A61—MEDICAL OR VETERINARY SCIENCE; HYGIENE
- A61B—DIAGNOSIS; SURGERY; IDENTIFICATION
- A61B5/00—Measuring for diagnostic purposes; Identification of persons
- A61B5/103—Detecting, measuring or recording devices for testing the shape, pattern, colour, size or movement of the body or parts thereof, for diagnostic purposes
- A61B5/11—Measuring movement of the entire body or parts thereof, e.g. head or hand tremor, mobility of a limb
- A61B5/1101—Detecting tremor
-
- A—HUMAN NECESSITIES
- A61—MEDICAL OR VETERINARY SCIENCE; HYGIENE
- A61B—DIAGNOSIS; SURGERY; IDENTIFICATION
- A61B5/00—Measuring for diagnostic purposes; Identification of persons
- A61B5/103—Detecting, measuring or recording devices for testing the shape, pattern, colour, size or movement of the body or parts thereof, for diagnostic purposes
- A61B5/11—Measuring movement of the entire body or parts thereof, e.g. head or hand tremor, mobility of a limb
- A61B5/1124—Determining motor skills
- A61B5/1125—Grasping motions of hands
-
- A—HUMAN NECESSITIES
- A61—MEDICAL OR VETERINARY SCIENCE; HYGIENE
- A61B—DIAGNOSIS; SURGERY; IDENTIFICATION
- A61B5/00—Measuring for diagnostic purposes; Identification of persons
- A61B5/103—Detecting, measuring or recording devices for testing the shape, pattern, colour, size or movement of the body or parts thereof, for diagnostic purposes
- A61B5/11—Measuring movement of the entire body or parts thereof, e.g. head or hand tremor, mobility of a limb
- A61B5/1126—Measuring movement of the entire body or parts thereof, e.g. head or hand tremor, mobility of a limb using a particular sensing technique
-
- A—HUMAN NECESSITIES
- A61—MEDICAL OR VETERINARY SCIENCE; HYGIENE
- A61B—DIAGNOSIS; SURGERY; IDENTIFICATION
- A61B5/00—Measuring for diagnostic purposes; Identification of persons
- A61B5/68—Arrangements of detecting, measuring or recording means, e.g. sensors, in relation to patient
- A61B5/6801—Arrangements of detecting, measuring or recording means, e.g. sensors, in relation to patient specially adapted to be attached to or worn on the body surface
- A61B5/6813—Specially adapted to be attached to a specific body part
- A61B5/6825—Hand
- A61B5/6826—Finger
Abstract
Description
本発明は、運動機能を検査する装置に関し、特に、運動センサによって取得された運動波形を解析して、定量的な運動情報を表示する装置、および、運動波形間の位相比較方法に関する。 The present invention relates to a device for examining a motor function, and more particularly to a device for analyzing a motion waveform acquired by a motion sensor and displaying quantitative motion information, and a phase comparison method between motion waveforms.
脳梗塞は、脳の栄養動脈の狭窄あるいは閉塞によって、その灌流域に梗塞巣(虚血性脳実質壊死)を生じたものをいう。脳梗塞は、病巣部位に対応して、例えば、運動麻痺、感覚障害、失調、眼球運動異常等の、特有の症状が出現する。従来、脳梗塞を診断するために、このような症状の診察所見に加えて、X線CT、MRI、脳血管造影等の検査所見を参考にして診断が下されていた。しかし、このような診断方法では、症状や梗塞部位を診断することができても、例えば、運動麻痺による運動機能の低下を定量的に評価することは難しい。
そこで、運動機能を定量的に評価する方法として、例えば、被験者に指をコンピュータのキーボードをタッピングする(叩く)方法が研究されてきた(例えば、非特許文献1参照)。非特許文献1に記載の方法によれば、片側麻痺の脳梗塞患者に対し、両手で指タッピングを行わせ、そのタッピング間隔の平均値および標準偏差を求め、これにより運動機能を定量的に評価することができる。
Therefore, as a method for quantitatively evaluating motor function, for example, a method of tapping (hitting) a finger on a computer keyboard with respect to a subject has been studied (for example, see Non-Patent Document 1). According to the method described in
しかしながら、非特許文献1に記載の方法は、両手間のタッピングタイミングの位相のずれを経時的に解析することができないため、両手間の運動の関連性を詳細に知ることができないという問題があった。
However, the method described in Non-Patent
そこで、本発明は、複数の運動の関連性を詳細に評価可能な運動機能検査装置および運動波形間の位相比較方法を提供することを課題とする。 Then, this invention makes it a subject to provide the motor function test | inspection apparatus which can evaluate the relationship of several exercise | movement in detail, and the phase comparison method between exercise | movement waveforms.
前記目的を達成するために、本発明は、運動センサから取得された時系列の波形データを解析する解析手段と、前記解析手段により解析された解析結果を表示する表示手段とを備えた運動機能検査装置であって、前記解析手段は、複数の前記波形データに基づいてそれぞれ取得される複数の運動波形間の位相を比較する位相比較手段を含むことを特徴とする運動機能検査装置である。 In order to achieve the above object, the present invention provides an exercise function comprising: analysis means for analyzing time-series waveform data acquired from a movement sensor; and display means for displaying an analysis result analyzed by the analysis means. An inspection apparatus, wherein the analysis means includes a phase comparison means for comparing phases between a plurality of motion waveforms respectively acquired based on the plurality of waveform data.
このような構成によれば、複数の運動波形間の位相を比較できるので、複数の運動の関連性の詳細な評価を好適に行うことができる。
なお、他の発明に関しては、本明細書中で明らかにする。
According to such a configuration, the phases between the plurality of motion waveforms can be compared, so that detailed evaluation of the relevance of the plurality of motions can be suitably performed.
Other inventions will be clarified in this specification.
本発明によれば、複数の運動の関連性を詳細に評価することができる。 According to the present invention, the relevance of a plurality of exercises can be evaluated in detail.
以下、本発明を実施するための最良の形態(以下「実施形態」という)について、適宜図面を参照しながら詳細に説明する。 Hereinafter, the best mode for carrying out the present invention (hereinafter referred to as “embodiment”) will be described in detail with reference to the drawings as appropriate.
<<第一の実施形態>>
まず、第一の実施形態について図面を参照して説明する。この第一の実施形態は、複数の運動波形に対してそれぞれ周波数解析演算を行うことにより、複数の運動波形間の位相を比較する実施形態である。
<< first embodiment >>
First, a first embodiment will be described with reference to the drawings. The first embodiment is an embodiment in which phases between a plurality of motion waveforms are compared by performing frequency analysis calculation on each of the plurality of motion waveforms.
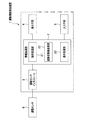
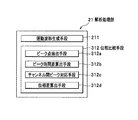
図1は、第一の実施形態の運動機能検査装置の全体構成を示すブロック図である。図1に示すように、運動機能検査装置1は、情報処理部2と、運動センサインタフェース3と、表示手段4と、入力手段5とを含んで構成される。
FIG. 1 is a block diagram showing the overall configuration of the motor function testing device of the first embodiment. As shown in FIG. 1, the motor
なお、被験者の運動情報を波形データとして取得する運動センサ6は、運動センサインタフェース3を介して運動機能検査装置1に接続されている。運動センサ6は、被験者の運動情報を時系列上に検出するものであって、距離、速度、加速度、躍度のうち、少なくとも1つに対応する被験者の運動情報を、波形データとして取得できるものであればよい。
The
ここで、「被験者」とは、運動センサ6による測定対象であって、動作するものであればどのようなものであってもよく、例えば、機械、動物、人間等である。そして、本実施形態においては特に記載のない限り、被験者が、例えば、運動麻痺を発現した脳梗塞患者、パーキンソン病患者、頚椎症患者等の運動機能に障害を有する患者である場合を想定している。
Here, the “subject” is an object to be measured by the
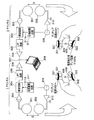
図2は、本実施形態における運動センサ6の構成の一例を示すブロック図である。図2に示すように、例えば、運動センサ6は磁気センサ型のタッピング装置であって、被験者の両手に装着された同じ構成のタッピング装置(1チャンネル、2チャンネル)がそれぞれ取得した波形データを一台のコンピュータ8に出力する構成となっている。従って、本実施形態においては、運動センサ6として主に1チャンネルのタッピング装置について説明し、1チャンネルと2チャンネルとで重複する説明は省略する。
FIG. 2 is a block diagram showing an example of the configuration of the
図2において、発信用コイル302は親指の背側に装着されており、受信用コイル301は人差し指の背側に装着されている。発信用コイル302はコイル装着部材322に巻き付けてあり、電流発生用アンプ310と接続されている。受信用コイル301はコイル装着部材321に巻き付けてあり、プリアンプ回路303と接続されている。
なお、発信用コイル302および受信用コイル301が巻き付けられたコイル装着部材322,321は、例えばゴムやスポンジ等の弾性変形可能な部材からなるバンド406,405を介して、それぞれの指に装着されている。
In FIG. 2, the
The
そして、交流発生回路309によって特定の周波数(例えば20kHz等)を持つ交流電圧が作成される。交流発生回路309によって作成された特定の周波数を持つ交流電圧は、電流発生用アンプ回路310によって特定の周波数を持つ交流電流に変換され、電流発生用アンプ回路310によって作成された交流電流を発信用コイル302に流す構成とする。発信用コイル302によって発生した磁場は、受信用コイル301内に誘起起電力を発生させる。
Then, an AC voltage having a specific frequency (for example, 20 kHz) is created by the
発生した誘起起電力(交流発生回路309によって作成された特定の周波数を持つ交流電圧と同じ周波数を有している)は、プリアンプ回路303によって増幅され、増幅後の信号は検波回路304に入力される。
検波回路304では交流発生回路309によって作成された特定の周波数または2倍周波数によって検波を行うため、交流発生回路309の出力は、位相調整回路311によって位相を調整された後、参照信号311Aとして検波回路304の参照信号入力端子に接続される。
The generated electromotive force (having the same frequency as the AC voltage having a specific frequency created by the AC generation circuit 309) is amplified by the
Since the
また特定周波数の2倍周波数で検波する場合は、位相調整回路311は必ずしも必要ではない。2倍周波数で検波する簡単な回路構成としては、交流発生回路309の特定周波数を2倍の周波数としておき、分周器によって半分の周波数に変換した後に、電流発生用アンプ回路310に入力する構成とし、参照信号311Aには交流発生回路309の特定周波数の2倍の周波数の信号を検波回路304の参照信号入力端子に接続する構成とする。
In addition, the
検波回路304の出力は、LPF(Low−Pass filter)回路305を通され、所望の電圧を得るためにアンプ回路306によって増幅された後、出力307を得る。出力307は、被験者に装着された受信用コイル301と発信用コイル302との相対距離Dに相当する電圧である。
そして、出力307は、コンピュータ308内蔵のアナログデジタル変換ボード(ADボード)によってデジタルデータに変換されてコンピュータ308に入力される。
The output of the
The
ここで、本実施形態においては、被験者に対して、例えば、人指し指および親指の腹側同士を重ね合わせるタッピング運動を、両手で同時に、20秒間できるだけ速く行うというタスクを与えている(同期運動)。また、被験者に対して、例えば、人指し指および親指の腹側同士を重ね合わせるタッピング運動を、両手で交互に、20秒間できるだけ速く行うというタスクを与えている(非同期運動)。
そして、本実施形態の運動センサ6は、このときの運動情報を、距離波形に変換可能な波形データとして取得するものとする。すなわち、本実施形態においては、いずれのタスクにおいても、1チャンネルおよび2チャンネルのタッピング装置で測定された2つの波形データが取得される。従って、本実施形態においては、「複数の」波形データとして、1チャンネルおよび2チャンネルからなるタッピング装置により同じ時間帯に並行して測定された2つの波形データを想定して説明するが、本発明の「複数の」波形データとは、これに限定されるものではない。
Here, in the present embodiment, for example, a task is given to the subject to perform a tapping motion for overlapping the ventral sides of the index finger and the thumb with both hands simultaneously as fast as possible for 20 seconds (synchronous motion). In addition, a task is given to the subject, for example, to perform a tapping motion that overlaps the ventral sides of the index finger and the thumb alternately with both hands as quickly as possible for 20 seconds (asynchronous motion).
And the
図1に示す情報処理部2は、運動センサ6によって取得された波形データを解析して運動の特徴量を抽出し、これらの抽出された特徴量を、適宜、被験者情報等とともに表示手段4に表示させるものである。
The
運動センサインタフェース3は、例えば、一般のコンピュータに備えられるアナログデジタル変換ボード(以下「ADボード」という)を含み、運動センサ6により検出されたアナログ信号の波形データを、所定のサンプリング周波数Sfでデジタル信号の波形データに変換し、情報処理部2に入力するものである。
なお、このサンプリング周波数Sfは、後記するように、運動波形から周波数解析区間を抽出する際にも用いられる。
The
The sampling frequency S f is also used when extracting a frequency analysis section from the motion waveform, as will be described later.
表示手段4は、情報処理部2により処理された被験者情報や運動情報を表示するものであって、例えば、LCD(Liquid Crystal Display)等によって実現することができる。
The
また、入力手段5は、図示しない運動機能検査装置1の操作者が、被験者情報等を入力したり測定や解析を指示したりするためのものであって、キーボードやマウス等によって実現することができる。また、被験者情報等を入力したり測定や解析を指示する場合には、操作者による入力を補助するユーザインタフェースとして、表示手段4に入力画面を表示させるようにしてもよい。
The input means 5 is used by an operator of the motor function testing apparatus 1 (not shown) for inputting subject information and instructing measurement and analysis, and can be realized by a keyboard, a mouse, or the like. it can. In addition, when inputting subject information or instructing measurement or analysis, an input screen may be displayed on the
情報処理部2は、解析処理部21と、被験者情報処理部22と、表示処理部23とを含んで構成される。情報処理部2は、CPU(Central Processing Unit)と、ROM(Read Only Memory)やRAM(Random Access Memory)等からなるメモリと、ハードディスク装置等を含んで構成される。前記した情報処理部2内の各処理部21〜23は、CPUがメモリまたはハードディスク装置に格納されたプログラムまたはデータをメモリに読み出して、演算処理を実行することにより実現することができる。
The
(解析処理部)
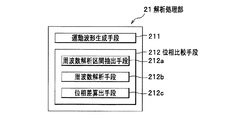
図3は、第一の実施形態の解析処理部21の構成を示すブロック図である。解析処理部21は、運動センサ6から入力された波形データに基づいて、運動の特徴量を抽出するものである。そして、解析処理部21により解析された結果は、被験者情報処理部22に備わる図示しない被験者データDBに記録され、表示処理部23によって適宜被験者データDBから読み出されて表示手段4に表示される。
ここで、解析処理部21は、図3に示すように、運動波形生成手段211と、位相比較手段212とを含んで構成される。
(Analysis processing section)
FIG. 3 is a block diagram illustrating a configuration of the
Here, as shown in FIG. 3, the
[運動波形生成手段]
運動センサ6から取得された波形データは、運動波形を直接表すものではなく、運動波形に変換可能な電圧出力である。
運動波形生成手段211は、この電圧出力である波形データを、対応する運動波形に変換し、変換された運動波形を時間微分または時間積分することによって、距離波形と、速度波形と、加速度波形と、躍度波形とを補完的に生成するものである。
[Motion waveform generation means]
The waveform data acquired from the
The motion waveform generation means 211 converts the waveform data, which is the voltage output, into a corresponding motion waveform, and performs time differentiation or time integration on the converted motion waveform, thereby obtaining a distance waveform, a velocity waveform, and an acceleration waveform. The jerk waveform is generated in a complementary manner.
ここで、「運動波形」とは、距離波形、速度波形、加速度波形、躍度波形、および、該4種類の運動波形(距離波形、速度波形、加速度波形、躍度波形)にそれぞれ変換可能な波形データのうち、少なくとも1つを含む。すなわち、本実施形態の運動機能検査装置1の解析対象となる運動波形とは、運動センサ6によって測定された波形データに基づいて取得可能なものであって、例えば、運動センサ6によって測定された波形データ自身であってもよいし、波形データから変換および補完的に生成された前記4種類の運動波形であってもよい。
これらの運動波形の時間幅Tは、通常、運動センサ6による測定時間である。例えば、被験者のタッピング運動を20秒間測定した場合には、運動波形の時間幅Tは20秒となる。
Here, the “movement waveform” can be converted into a distance waveform, a velocity waveform, an acceleration waveform, a jerk waveform, and the four types of movement waveforms (distance waveform, velocity waveform, acceleration waveform, jerk waveform), respectively. At least one of the waveform data is included. That is, the motion waveform to be analyzed by the motion
The time width T of these motion waveforms is usually the time measured by the
[位相比較手段]
位相比較手段212は、複数の波形データに基づいてそれぞれ取得された複数の運動波形間の位相を比較するものである。
第一の実施形態においては、位相比較手段212は、複数の運動波形に対してそれぞれ周波数解析演算を行って、周波数強度が最大となる周波数(以下「最大周波数」という)の位相を算出し、この最大周波数の位相を比較することにより、複数の運動波形の位相を比較する。
ここで、第一の実施形態の位相比較手段212は、周波数解析区間抽出手段212aと、周波数解析手段212bと、位相差算出手段212cとを含んで構成される。
[Phase comparison means]
The phase comparison unit 212 compares phases between a plurality of motion waveforms respectively acquired based on a plurality of waveform data.
In the first embodiment, the phase comparison unit 212 performs a frequency analysis calculation on each of the plurality of motion waveforms to calculate the phase of the frequency at which the frequency intensity is maximum (hereinafter referred to as “maximum frequency”), By comparing the phases of the maximum frequencies, the phases of a plurality of motion waveforms are compared.
Here, the phase comparison unit 212 of the first embodiment includes a frequency analysis
<周波数解析区間抽出手段>
周波数解析区間抽出手段212aは、運動波形において、周波数解析手段212bによる周波数解析の対象となる所定時間幅T0の周波数解析区間を抽出するものである。
このとき、抽出する周波数解析区間の時間幅T0を長くするほど、各周波数解析区間での周波数解析の精度が向上する。一方で、抽出する周波数解析区間の時間幅T0を短くするほど、一つの運動波形あたり多数の周波数解析区間を抽出することができるため、周波数解析の結果である最大周波数の位相等の情報を経時的に細かく算出することができる。従って、抽出する周波数解析区間の時間幅T0は、適宜適切な長さが選択されることが好ましい。本実施形態においては、例えば、20秒間の運動波形に対して周波数解析区間が10秒間として説明する。
<Frequency analysis section extraction means>
The frequency analysis
At this time, the accuracy of frequency analysis in each frequency analysis section improves as the time width T 0 of the frequency analysis section to be extracted is increased. On the other hand, the shorter the time width T 0 of the frequency analysis section to be extracted, the more frequency analysis sections can be extracted per one motion waveform, so the information such as the phase of the maximum frequency that is the result of the frequency analysis can be obtained. It can be calculated finely over time. Therefore, it is preferable that an appropriate length is appropriately selected as the time width T 0 of the frequency analysis section to be extracted. In the present embodiment, for example, a frequency analysis section is assumed to be 10 seconds for a motion waveform of 20 seconds.
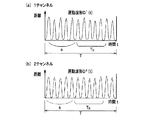
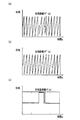
ここで、図4を参照して、周波数解析区間抽出手段212aが、運動波形の一例としての距離波形から周波数解析区間を抽出する手順を説明する。図4は、距離波形から複数の周波数解析区間を抽出する手順を説明するための概念図であって、図4(a)は1チャンネルで取得された距離波形、図4(b)は2チャンネルで取得された距離波形を示している。
なお、距離波形の解析は他の運動波形の解析にも同じように適用することができるため、以下の説明においては「距離波形」の代わりにその上位概念である「運動波形」の単語を用いて説明する。また、1チャンネル運動波形D1(t)および2チャンネルの運動波形D2(t)において、それぞれ周波数解析区間を抽出する手順は同じであるので、特にD1(t)とD2(t)とを区別せずに運動波形Dn(t)として説明する。
Here, with reference to FIG. 4, a procedure in which the frequency analysis
Note that distance waveform analysis can be applied to other motion waveform analysis in the same way, so in the following explanation, the word “motion waveform”, which is the superordinate concept, is used instead of “distance waveform”. I will explain. Further, in the 1-channel motion waveform D 1 (t) and the 2-channel motion waveform D 2 (t), the procedure for extracting the frequency analysis section is the same, so that D 1 (t) and D 2 (t) are particularly the same. The movement waveform D n (t) will be described without distinction between the two.
まず、周波数解析区間抽出手段212aは、運動波形Dn(t)を離散表示する。ここで、離散表示された運動波形Dn iは、次の(1)式により表すことができる。
First, the frequency analysis
Dn(t)=Dn i ・・・(1)
(n=チャンネル番号)
(i=1、・・・、LT)
(運動波形の時間点数LT
=運動波形の時間幅T×サンプリング周波数Sf)
D n (t) = D n i (1)
(N = channel number)
(I = 1,..., L T )
(Time point of motion waveform L T
= Time width of motion waveform T × Sampling frequency S f )
なお、図4においては、運動波形Dn(t)を示しているが、実際に周波数解析区間を抽出する際には、離散化された運動波形Dn iを用いている。 In FIG. 4, the motion waveform D n (t) is shown, but when the frequency analysis section is actually extracted, the discretized motion waveform D n i is used.
次に、周波数解析区間抽出手段212aは、離散化された運動波形Dn iから所定時間幅T0の周波数解析区間Dn u、iを抽出する。ここで、抽出された周波数解析区間Dn u、iは、次の(2)式により表すことができる。
Dn u、i=Dn j ・・・(2)
(i=1、・・・、LT0)
(j=u+i)
(周波数解析区間までの時間点数u
=周波数解析区間までの時間幅s×Sf)
(周波数解析区間の時間点数LT0
=周波数解析区間の時間幅T0×Sf)
Next, the frequency analysis
D n u , i = D n j (2)
(I = 1,..., L T0 )
(J = u + i)
(Time points u until frequency analysis interval
= Time width to frequency analysis interval s × S f )
( Number of time points in frequency analysis section L T0
= Time width of frequency analysis section T 0 × S f )
すなわち、(2)式においては、所定時間幅T0の周波数解析区間Dn u、iを、1/サンプリング周波数Sfの時間(微小時間)ずつずらしながら抽出している。
そして、周波数解析区間抽出手段212aにより抽出された各周波数解析区間Dn u、iは、周波数解析手段212bに出力される。
That is, in the expression (2), the frequency analysis sections D n u and i having the predetermined time width T 0 are extracted while being shifted by the time (minute time) of the 1 / sampling frequency S f .
The frequency analysis sections D n u and i extracted by the frequency analysis
<周波数解析手段>
周波数解析手段212bは、抽出された各周波数解析区間Dn u、iの周波数解析を行い、各周波数解析区間Dn u、iにおける最大周波数の位相を算出するものである。
ここで、周波数解析手段212bが、周波数解析区間Dn u、iの周波数解析を行う手順を説明する。
まず、周波数解析手段212bは、例えば、デジタルフーリエ変換により、各周波数解析区間Dn u、iにおける周波数強度An u、kと位相Θn u、kとを算出する。ここで、デジタルフーリエ変換の処理は次の(3)式により表すことができる。
<Frequency analysis means>
Frequency analysis means 212b, each frequency analysis section D n u is extracted, performs frequency analysis of i, and calculates the phase of the maximum frequency in each frequency analysis section D n u, i.
Here, a procedure in which the
First, the
周波数解析区間Dn u、i→周波数強度An u、k、位相Θn u、k ・・・(3)
(k=1、・・・、Lf)
(周波数の離散点数Lf=LT0/2)
(k/T0=周波数)
Frequency analysis section D n u , i → frequency intensity A n u , k , phase Θ n u , k (3)
(K = 1, Lf )
(Number of discrete points of frequency L f = L T0 / 2)
(K / T 0 = frequency)
次に、周波数解析手段212bは、(3)式において、[0≦u≦LT−LT0]を満たす全てのuについて、周波数強度An u、kおよび位相Θn u、kを求める。
そして、周波数解析手段212bは、各時刻uについて周波数強度An u、kを最大とする周波数kを探索し、k(u)と設定する。
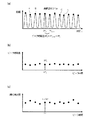
そして、周波数解析手段212bは、周波数k(u)における位相Θn u、k(u)を、各時刻uにおける最大周波数の位相Θn uとする。この最大周波数の位相Θn uにおいて、uは(2)式に示されるように周波数解析区間までの時間幅(周波数解析区間の開始時間)sを離散化したものであるから、Θn u=Θn(s)であり、図5(a),(b)のような位相曲線Θn(s)として表すことができる。なお、図5(a)は、1チャンネルの位相曲線Θ1(s)であり、図5(b)は、2チャンネルの位相曲線Θ2(s)である。
ここで、周波数解析手段212bにより算出された最大周波数の位相Θn(s)は、位相差算出手段212cに出力される。
Next, the
Then, the
Then, the frequency analysis means 212b is a phase Θ n u, k (u) at frequency k (u), the phase theta n u of the maximum frequency at each time u. In this maximum frequency phase Θ n u , u is a discretized time width (start time of the frequency analysis interval) s up to the frequency analysis interval as shown in the equation (2), so Θ n u = Θ n (s), which can be expressed as a phase curve Θ n (s) as shown in FIGS. FIG. 5A shows a phase curve Θ 1 (s) for one channel, and FIG. 5B shows a phase curve Θ 2 (s) for two channels.
Here, the phase Θ n (s) of the maximum frequency calculated by the
<位相差算出手段>
位相差算出手段212cは、複数の運動波形Dn(t)に関してそれぞれ求められた最大周波数の位相Θn(s)を比較し、複数の運動波形間の最大周波数の位相差Θ(s)を算出するものである。
ここで、例えば、本実施形態のように、1チャンネルおよび2チャンネルのタッピング装置からなる運動センサ6を用いて取得される2つの運動波形間の位相を比較する場合、最大周波数の位相差Θ(s)は次の(4)式により求めることができる。
<Phase difference calculating means>
The phase difference calculation means 212c compares the phase Θ n (s) of the maximum frequency obtained for each of the plurality of motion waveforms D n (t), and calculates the phase difference Θ (s) of the maximum frequency between the plurality of motion waveforms. Is to be calculated.
Here, for example, when the phases between two motion waveforms acquired using the
最大周波数の位相差Θ(s)
=2チャンネルの最大周波数の位相Θ2(s)
−1チャンネルの最大周波数の位相Θ1(s) ・・・(4)
Maximum frequency phase difference Θ (s)
= Phase of maximum frequency of 2 channels Θ 2 (s)
−1 channel maximum frequency phase Θ 1 (s) (4)
この最大周波数の位相差Θ(s)は、図5(c)のような位相差曲線Θ(s)として表すことができる。
また、3つ以上の運動波形間の最大周波数の位相差Θ(s)は、例えば、一つの運動波形(例えば、D1(t))の最大周波数の位相を基準とし、他の運動波形(例えば、D2(t)、D3(t))の最大周波数の位相との差分をそれぞれ算出することで求めることができる。
This maximum frequency phase difference Θ (s) can be expressed as a phase difference curve Θ (s) as shown in FIG.
In addition, the phase difference Θ (s) of the maximum frequency between three or more motion waveforms is, for example, based on the phase of the maximum frequency of one motion waveform (for example, D 1 (t)) as another motion waveform ( For example, it can be obtained by calculating the difference between the phase of the maximum frequency of D 2 (t) and D 3 (t)).
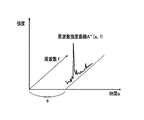
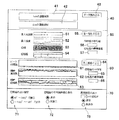
なお、周波数解析手段212bが行う、一般的なデジタルフーリエ変換等の周波数解析によって、前記した最大周波数の位相Θn(s)だけでなく、最大周波数および最大周波数の強度を算出することができる。言い換えると、第一の実施形態の運動機能検査装置1を用いて運動波形を周波数解析すれば、それぞれの運動波形に関して図6で示すような微小時間毎の周波数強度曲線An(s、f)を取得することができる。周波数解析手段212bは、このような微小時間毎の周波数強度曲線An(s、f)を用いて、最大周波数の位相だけでなく、運動のさまざまな特徴量を算出することができる。例えば、周波数解析手段212bは、微小時間毎の周波数強度曲線An(s、f)から、周波数解析区間に対応する時間(例えば、周波数解析区間までの時間幅s)、周波数fおよび周波数強度の特徴量を読み出したり、さらに、周波数強度曲線An(s、f)から、最大周波数、最大周波数の強度および周波数解析区間に対応する時間の特徴量を算出したりすることができる。
Not only the above-described maximum frequency phase Θ n (s) but also the maximum frequency and the intensity of the maximum frequency can be calculated by frequency analysis such as general digital Fourier transform performed by the
(被験者情報処理部)
図1に戻って、被験者情報処理部22は、被験者情報や解析結果等の情報を記録する図示しない被験者データDBを備え、被験者データDBに記録される情報の管理を行うものである。
より詳細には、被験者情報処理部22は、1)被験者情報の登録、修正、削除および検索、ソート、2)被験者情報と運動波形との関連付け、3)運動波形の解析結果の登録、修正、削除(項目の追加、修正、削除)、4)統計処理を行った場合には、その統計処理結果の登録、修正、削除の主に4項目の処理、を被験者データDBとの連携によって行う。
また、被験者データDBに登録される被験者情報としては、被験者ID、氏名、生年月日、年齢、身長、体重、疾患名、被験者に関するコメント等が挙げられる。
なお、被験者情報処理部22による、これらの情報管理は、従来公知のプログラムとデータ構成によって容易に実現することができるものである。
また、被験者データDBは、ハードディスク装置等によって実現することができる。
(Subject Information Processing Department)
Returning to FIG. 1, the subject
More specifically, the subject
The subject information registered in the subject data DB includes subject ID, name, date of birth, age, height, weight, disease name, comments on the subject, and the like.
The information management by the subject
The subject data DB can be realized by a hard disk device or the like.
(表示処理部)
表示処理部23は、表示手段4に、被験者データDBに登録された被験者情報や運動波形の解析結果等の情報を、グラフやテーブルの形式を適宜用いて視覚的に理解しやすい表示形式で表示させるものである。表示処理部23は、図5で示した位相曲線Θn(s)や位相差曲線Θ(s)を作成して表示させるだけでなく、例えば、周波数解析区間に対応する時間(例えば、周波数解析区間までの時間幅s)、周波数fおよび周波数強度の特徴量のうち少なくとも二つの特徴量を含む相関図を作成したり、さらに、最大周波数、最大周波数の強度および周波数解析区間に対応する時間sの特徴量のうち少なくとも二つの特徴量を含む相関図を作成したりして表示させることができる。
(Display processing part)
The
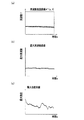
図7(a)は、周波数解析区間までの時間幅s、周波数fおよび周波数強度の3つの特徴量の相関関係を示したグラフである。図7(a)で示したグラフは、実際の表示画面には白黒ではなくカラーで輝度の濃淡が示されており、その輝度の濃淡によって周波数の強度が示される。また、図7(b)は、周波数解析区間までの時間幅sおよび最大周波数の2つの特徴量の相関関係を示したグラフである。図7(c)は、周波数解析区間までの時間幅sおよび最大周波数の強度(図中では最大強度と記載)の2つの特徴量の相関関係を示したグラフである。 FIG. 7A is a graph showing a correlation between three feature amounts of a time width s, a frequency f, and a frequency intensity up to the frequency analysis section. In the graph shown in FIG. 7A, the intensity of the frequency is indicated by the intensity of the luminance in the actual display screen in which the intensity of the intensity is shown in color instead of black and white. FIG. 7B is a graph showing a correlation between two feature amounts of the time width s to the frequency analysis section and the maximum frequency. FIG. 7C is a graph showing the correlation between two feature amounts, the time width s to the frequency analysis section and the intensity of the maximum frequency (denoted as maximum intensity in the figure).
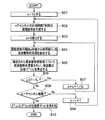
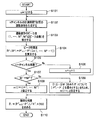
[位相比較方法]
次に、図3を参照しつつ、図8を参照して、第一の実施形態の運動機能検査装置1を用いて複数の運動波形の位相を比較する方法の一例を説明する。図8は、第一の実施形態の運動機能検査装置1の位相比較処理を説明するためのフローチャートである。
[Phase comparison method]
Next, referring to FIG. 8 with reference to FIG. 3, an example of a method for comparing phases of a plurality of motion waveforms using the motor
まず、解析処理部21の運動波形生成手段211は、nチャンネルの運動センサ6(図1参照)から取得された波形データを解析するにあたり、n=1と設定する(ステップS01)。
First, the motion waveform generation means 211 of the
次に、解析処理部21の運動波形生成手段211は、nチャンネルの波形データに基づいて、時間幅Tの運動波形を生成する(ステップS02)。なお、前記したように、時間幅Tは、通常、運動センサ6による測定時間である。
Next, the motion waveform generation means 211 of the
そして、解析処理部21の位相比較手段212は、周波数解析区間抽出手段212aによって、運動波形の開始s秒後の周波数解析区間を抽出するにあたり、s=0秒と設定する(ステップS03)。
Then, the phase comparison unit 212 of the
そして、解析処理部21の位相比較手段212は、周波数解析区間抽出手段212aによって、運動波形の開始s秒後から時間幅T0の周波数解析区間を抽出する(ステップS04)。
Then, the phase comparison unit 212 of the
そして、解析処理部21の位相比較手段212は、周波数解析手段212bによって、抽出された周波数解析区間について周波数解析演算を行い、最大周波数の位相Θn(s)を算出する(ステップS05)。例えば、この周波数解析演算は、デジタルフーリエ変換である。
Then, the phase comparison unit 212 of the
そして、解析処理部21の位相比較手段212は、周波数解析手段212bによって、s≦T−T0であるかどうか判定し(ステップS06)、s≦T−T0であれば(ステップS06でYes)、s=s+1/Sfとして(ステップS07)、ステップS04に戻り、0≦s≦T−T0を満たす全ての時間sについて最大周波数の位相Θn(s)を算出するまで、ステップS04〜S07を繰り返す。一方で、s>T−T0であれば(ステップS06でNo)ステップS08に進む。
Then, the phase comparison unit 212 of the
そして、解析処理部21の運動波形生成手段211は、n=チャンネル総数かどうか判定し(ステップS08)、n=チャンネル総数でなければ(ステップS08でNo)、n=n+1として(ステップS09)、ステップS02に戻り、n=チャンネル総数となるまで、ステップS02〜ステップS09を繰り返す。一方で、n=チャンネル総数であれば(ステップS08でYES)、ステップS10に進む。
Then, the motion waveform generation means 211 of the
そして、解析処理部21の位相比較手段212は、位相差算出手段212cによって、チャンネル間の最大周波数の位相差Θ(s)を算出する(ステップS10)。前記したように、例えば、チャンネル総数が2つの場合には、(4)式で算出することができる。
Then, the phase comparison unit 212 of the
<<第二の実施形態>>
次に、第二の実施形態について図面を参照して説明する。この第二の実施形態は、複数の運動波形に対してそれぞれピーク点を抽出し、ピーク点の時間差に基づいて複数の運動波形間の位相を比較する実施形態である。
この第二の実施形態は、第一の実施形態と比較して、解析処理部21内の位相比較手段において特徴的な構成を有するものである。従って、第二の実施形態の説明において、特に解析処理部21の位相比較手段312に関して詳細に説明するが、第一の実施形態と重複する説明は省略する。
<< Second Embodiment >>
Next, a second embodiment will be described with reference to the drawings. In the second embodiment, peak points are extracted from a plurality of motion waveforms, and phases between the plurality of motion waveforms are compared based on a time difference between the peak points.
This second embodiment has a characteristic configuration in the phase comparison means in the
(解析処理部)
図9は、第二の実施形態の解析処理部21の構成を示すブロック図である。第二の実施形態の解析処理部21は、運動波形生成手段211および位相比較手段312を含んで構成される。
また、第二の実施形態の位相比較手段312は、ピーク点抽出手段312aと、ピーク時間差算出手段312bと、チャンネル間ピーク対応手段(運動波形間ピーク対応手段に相当する)312cと、位相差算出手段312dとを含んで構成される。
(Analysis processing section)
FIG. 9 is a block diagram illustrating a configuration of the
Further, the phase comparison means 312 of the second embodiment includes a peak point extraction means 312a, a peak time difference calculation means 312b, an inter-channel peak correspondence means (corresponding to a motion waveform peak correspondence means) 312c, and a phase difference calculation.
<ピーク点抽出手段>
ピーク点抽出手段312aは、運動波形においてピーク点(1、・・・、Mn;Mnはピーク点数)を抽出するものである。図10(a)において、運動値(距離値)が所定値以上のピーク点を黒丸(●)で示しているが、所定値以下のピーク点(図示せず)を抽出する構成としてもよい。また、所定値以上および所定値以下の両方のピーク点を抽出する構成としてもよい。
そして、ピーク点抽出手段312aにより抽出されたピーク点(1、・・・、Mn)は、ピーク時間差算出手段312bおよびチャンネル間ピーク対応手段312cに出力される。
<Peak point extraction means>
The peak point extraction means 312a extracts peak points (1,..., M n ; M n is the number of peak points) in the motion waveform. In FIG. 10A, the peak point where the motion value (distance value) is a predetermined value or more is indicated by a black circle (●), but a peak point (not shown) having a predetermined value or less may be extracted. Moreover, it is good also as a structure which extracts both the peak point more than predetermined value and below predetermined value.
The peak points (1,..., M n ) extracted by the peak
<ピーク時間差算出手段>
ピーク時間差算出手段312bは、一つの運動波形において時間的に隣り合うピーク点の時間差からなるピーク時間差を算出するものである。図10(a)において、時間的に隣り合うピーク点とは、例えばAおよびB、あるいは、CおよびDである。ピーク時間差Rn iは、次の(5)式により求めることができる。
<Peak time difference calculation means>
The peak time difference calculation means 312b calculates a peak time difference composed of the time differences between temporally adjacent peak points in one motion waveform. In FIG. 10A, the temporally adjacent peak points are, for example, A and B, or C and D. The peak time difference R n i can be obtained by the following equation (5).
Rn i=Pn i+1−Pn i (i=1、・・・、Mn−1) ・・・(5) R n i = P n i + 1 −P n i (i = 1,..., M n −1) (5)
図10(b)は、ピーク時間差Rn iと、ピーク時間差Rn iの算出に用いた一方のピーク点のピーク時間(例えば、Pn i)との相関関係をプロットした図である。
また、図10(c)は、1/ピーク時間差Rn iと、ピーク時間差Rn iの算出に用いた一方のピーク点のピーク時間(例えば、Pn i)との相関関係をプロットした図である。ここで、1/ピーク時間差Rn iは、そのピーク時間における瞬間的な周波数(以下「瞬時周波数」という)に相当するものである。
そして、ピーク時間差算出手段312bにより算出されたピーク時間差Rn iは、位相差算出手段312dに出力される。
FIG. 10B is a graph plotting the correlation between the peak time difference R n i and the peak time (for example, P n i ) at one of the peak points used to calculate the peak time difference R n i .
FIG. 10C is a graph plotting the correlation between 1 / peak time difference R n i and the peak time (for example, P n i ) of one peak point used for calculating the peak time difference R n i . It is. Here, the 1 / peak time difference R n i corresponds to an instantaneous frequency at the peak time (hereinafter referred to as “instantaneous frequency”).
Then, the peak time difference R n i calculated by the peak time
<チャンネル間ピーク対応手段>
チャンネル間ピーク対応手段312cは、複数の運動波形間においてピーク点を対応させるものである。
ここで、チャンネル間ピーク対応手段312cが、1チャンネルおよび2チャンネルで取得された2つの運動波形間でピーク点を対応させる手順について図11を参照して説明する。図11は、2つの運動波形間でピーク点を対応させる手順を説明するための図であって、2つの運動波形においてそれぞれ生成されたピーク時間差−ピーク時間プロット(図10(b)参照)を重畳した部分拡大図である。
また、図11(a)は2つの運動波形においてピーク点数Mnが同じ場合、図11(b)は2つの運動波形においてピーク点数Mnが異なる場合である。図11において、黒丸(●)は、1チャンネルの運動波形におけるピーク点であって、白丸(○)は、2チャンネルの運動波形におけるピーク点である。
<Channel peak measure>
The inter-channel peak correspondence means 312c associates peak points among a plurality of motion waveforms.
Here, the procedure in which the
FIG. 11A shows a case where the number of peak points M n is the same in the two motion waveforms, and FIG. 11B shows a case where the number of peak points M n is different in the two motion waveforms. In FIG. 11, black circles (●) are peak points in the motion waveform of one channel, and white circles (◯) are peak points in the motion waveform of two channels.
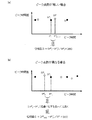
図11(a)に示すように、2つの運動波形においてそれぞれ抽出されたピーク点数Mnが同じ場合(図11(a)ではピーク点がともに3つずつ)には、チャンネル間ピーク対応手段312cは、運動波形間のピーク点を時間順に対応させる。
具体的には、図11(a)においては、チャンネル間ピーク対応手段312cは、m(i)=i(i=1、・・・、M1)と設定することにより、P2 m(i)とP1 iとを対応させる。
ここで、チャンネル間で対応させたピーク点の情報は、位相差算出手段312dに出力される。
As shown in FIG. 11 (a), when the number of peak points Mn extracted in the two motion waveforms is the same (three peak points in FIG. 11 (a)), the inter-channel peak correspondence means 312c. Associates peak points between motion waveforms in time order.
Specifically, in FIG. 11A, the inter-channel peak correspondence means 312c sets P 2 m (i by setting m (i) = i (i = 1,..., M 1 ). ) And P 1 i .
Here, the information on the peak point corresponding to the channel is output to the phase difference calculating means 312d.
また、図11(b)に示すように、2つの運動波形においてそれぞれ抽出されたピーク点数Mnが異なる場合(図11(b)では4つのピーク点(●)と3つのピーク点(○))には、まず、チャンネル間ピーク対応手段312cは、一つの運動波形のピーク点(例えば、1チャンネルのピーク点(●))を基準ピーク点と設定し、もう一つの運動波形のピーク点(例えば、2チャンネルのピーク点(○))を比較ピーク点と設定する。
次に、チャンネル間ピーク対応手段312cは、基準ピーク点(●)ごとに各比較ピーク点(○)との時間差を算出し、基準ピーク点(●)に対して最も時間差が小さくなるような比較ピーク点(○)を基準ピーク点(●)ごとに選択することにより、運動波形間のピーク点を対応させる。
具体的には、チャンネル間ピーク対応手段312cは、図11(b)において、|P2 j−P1 i|を最小とするjをm(i)と設定し、P2 m(i)とP1 iとを対応させる。
ここで、チャンネル間で対応させたピーク点の情報は、位相差算出手段312dに出力される。
Further, as shown in FIG. 11B, when the number of peak points M n extracted in the two motion waveforms are different (in FIG. 11B, four peak points (●) and three peak points (◯)). ), The inter-channel peak correspondence means 312c first sets the peak point of one motion waveform (for example, the peak point (●) of one channel) as the reference peak point, and the peak point ( For example, the peak point (◯) of
Next, the inter-channel peak correspondence means 312c calculates a time difference from each comparison peak point (O) for each reference peak point (●), and makes a comparison such that the time difference is the smallest with respect to the reference peak point (●). By selecting a peak point (◯) for each reference peak point (●), the peak points between the motion waveforms are made to correspond.
Specifically, the
Here, the information on the peak point corresponding to the channel is output to the phase difference calculating means 312d.
なお、図11では、2つの運動波形間のピーク点を対応させる場合について説明したが、3つ以上の運動波形間のピーク点も、同様に対応させることができる。
例えば、3つ以上の運動波形においてそれぞれ抽出されたピーク点数Mnが同じ場合、チャンネル間ピーク対応手段312cは、図11(a)と同様に運動波形間のピーク点を時間順に対応させる。
In addition, although FIG. 11 demonstrated the case where the peak point between two motion waveforms was matched, the peak point between three or more motion waveforms can also be matched similarly.
For example, when the number of peak points M n extracted in three or more motion waveforms is the same, the inter-channel peak correspondence means 312c associates the peak points between the motion waveforms in time order as in FIG.
また、例えば、3つ以上の運動波形においてそれぞれ抽出されたピーク点数Mnが異なる場合、チャンネル間ピーク対応手段312cは、3つ以上の運動波形のうち一つの運動波形のピーク点を基準ピーク点と設定し、他の運動波形のピーク点を比較ピーク点と設定する。次に、チャンネル間ピーク対応手段312cは、基準ピーク点と比較ピーク点との時間差を算出し、基準ピーク点に対して最も時間差が小さくなるような比較ピーク点を基準ピーク点ごとに選択することにより、運動波形間のピーク点を対応させる。
Further, for example, when the number of extracted peak points M n is different in three or more motion waveforms, the inter-channel peak correspondence means 312c uses the peak point of one motion waveform as a reference peak point among the three or more motion waveforms. And set the peak point of the other motion waveform as the comparative peak point. Next, the inter-channel
<位相差算出手段>
位相差算出手段312dは、ピーク時間差およびチャンネル間で対応させたピーク点の時間差に基づいて、複数の運動波形間の位相差Θiを算出するものである。ここで、第二の実施形態の位相差算出手段312により算出される位相差Θiは、そのピーク時間における瞬間的な位相差(以下「瞬時位相差」という)に相当するものである。
例えば、本実施形態のように、1チャンネルおよび2チャンネルのタッピング装置からなる運動センサ6を用いて取得される2つの運動波形間の位相を比較する場合、瞬時位相差Θiは次の(6)式により求めることができる。
<Phase difference calculating means>
The phase difference calculating means 312d calculates the phase difference Θ i between a plurality of motion waveforms based on the peak time difference and the time difference between the peak points corresponding to the channels. Here, the phase difference Θ i calculated by the phase difference calculating means 312 of the second embodiment corresponds to an instantaneous phase difference at the peak time (hereinafter referred to as “instantaneous phase difference”).
For example, as in the present embodiment, when the phases between two motion waveforms acquired using the
Θi=(P2 m(i)−P1 i)/R1 i×360 ・・・(6) Θ i = (P 2 m (i) −P 1 i ) / R 1 i × 360 (6)
ここで、(6)式の(P2 m(i)−P1 i)は、チャンネル間で対応させたピーク点の時間差(チャンネル間時間差)である。
また、3つ以上の運動波形間の瞬時位相差Θiは、例えば、1つの運動波形(例えば、D1(t))の瞬時位相を基準とし、他の運動波形(例えば、D2(t)、D3(t))の瞬時位相との差分をそれぞれ算出することで求めることができる。
Here, (P 2 m (i) −P 1 i ) in the equation (6) is a time difference (peak time difference) between peak points corresponding to each other between channels.
The instantaneous phase difference Θ i between three or more motion waveforms is based on the instantaneous phase of one motion waveform (for example, D 1 (t)), for example, and other motion waveforms (for example, D 2 (t ) And D 3 (t)) can be obtained by calculating respective differences from the instantaneous phase.
[位相比較方法]
次に、図9を参照しつつ、図12を参照して、第二の実施形態の運動機能検査装置1を用いて複数の運動波形の位相を比較する方法の一例を説明する。図12は、第二の実施形態の運動機能検査装置1の位相比較処理を説明するためのフローチャートである。
[Phase comparison method]
Next, referring to FIG. 12 with reference to FIG. 9, an example of a method for comparing phases of a plurality of motion waveforms using the motor
まず、解析処理部21の運動波形生成手段211は、nチャンネルの運動センサ6(図1参照)から取得された波形データを解析するにあたり、n=1と設定する(ステップS101)。
First, the motion waveform generation means 211 of the
次に、解析処理部21の運動波形生成手段211は、nチャンネルの波形データに基づいて、時間幅Tの運動波形を生成する(ステップS102)。なお、前記したように、時間幅Tは、通常、運動センサ6による測定時間である。
Next, the motion waveform generation means 211 of the
そして、解析処理部21の位相比較手段312は、ピーク点抽出手段312aによって、運動波形のピーク点(1、・・・、Mn;Mnはピーク点数)を抽出する(ステップS103)。
Then, the phase comparison unit 312 of the
そして、解析処理部21の位相比較手段312は、ピーク時間差算出手段312bによって、一つの運動波形において時間的に隣り合うピーク点の時間差からなるピーク時間差Rn i(Rn i=Pn i+1−Pn i (i=1、・・・、Mn−1))を算出する(ステップS104)。
Then, the phase comparison unit 312 of the
そして解析処理部21の運動波形生成手段211は、n=チャンネル総数かどうか判定し(ステップS105)、n=チャンネル総数でなければ(ステップS105でNo)、n=n+1として(ステップS106)、ステップS102に戻り、n=チャンネル総数となるまで、ステップS102〜ステップS106を繰り返す。一方で、n=チャンネル総数であれば(ステップS105でYES)、ステップS107に進む。
Then, the motion waveform generation means 211 of the
そして、解析処理部21の位相比較手段312は、チャンネル間ピーク対応手段312cによって、複数の運動波形間においてピーク点数が同じかどうか判定し(ステップS107)、ピーク点数が同じ場合には(ステップS107でYes)、m(i)=i(i=1、・・・、M1)と設定して(ステップS108)、ステップS110に進む。一方で、ピーク点数が異なる場合には(ステップS107でNo)、[1≦i≦Mn]を満たすiについて、|P2 j−P1 i|を最小とするjを求め、m(i)=jと設定して(ステップS109)、ステップS110に進む。
Then, the phase comparison unit 312 of the
そして、解析処理部21の位相比較手段312は、位相差算出手段312dによって、複数の運動波形間の瞬時位相差を算出する(ステップS110)。なお、前記したように、瞬時位相差は(6)式を用いて算出することができる。
Then, the phase comparison unit 312 of the
[表示画面例]
図13は、第一実施形態および第二実施形態の表示処理部23によって、表示手段4に表示される画面構成の一例を示す図である。
図13に示すように、表示手段4に表示される表示画面は、例えば、運動波形表示欄40と、第一の実施形態による解析結果を表示する第一解析表示欄50と、第二の実施形態による解析結果を表示する第二解析表示欄60と、第一解析表示欄50内および第二解析表示欄60内で表示される位相差の表示形式を設定する位相差表示設定欄70とで概略構成される。
[Display screen example]
FIG. 13 is a diagram illustrating an example of a screen configuration displayed on the
As shown in FIG. 13, the display screen displayed on the display means 4 includes, for example, an exercise
運動波形表示欄40では、例えば、1チャンネルで取得された運動波形41および2チャンネルで取得された運動波形42が表示される。このような表示は、運動センサ6で運動を測定後、データ読み込みボタン43を押すことによって、画面に表示させることができる。また、図示しないが、適宜所望する運動波形に変換および補完的に生成して表示させることもできる。
In the exercise
第一解析表示欄50は、第一の実施形態による解析結果の表示欄であって、例えば、第一の実施形態で算出方法を記載した、最大周波数、最大周波数の強度(図では最大強度と記載)、最大周波数の位相、最大周波数の位相差がそれぞれの表示欄51〜54に経時的なグラフとして表示される。このような表示は、操作者が第一解析の実行ボタン55を押すと、解析処理部21および表示処理部23を含んでなる情報処理部2が、運動波形41,42についての解析処理を行い、解析結果を画面に表示させることにより実行される。また、情報処理部2は、表示された最大周波数の位相差54に関してその平均値および標準偏差を算出し、それぞれの表示欄56,57に表示させることができる。
The first
第二解析表示欄60は、第二の実施形態による解析結果の表示欄であって、例えば、第二の実施形態で算出方法を記載した、ピーク時間差、瞬時周波数、瞬時位相差がそれぞれの表示欄61〜63に経時的なグラフとして表示される。このような表示は、操作者が第二解析の実行ボタン64を押すと、解析処理部21および表示処理部23を含んでなる情報処理部2が、運動波形41,42についての解析処理を行い、解析結果を画面に表示させることにより実行される。また、情報処理部2は、表示された瞬時位相差63に関してその平均値および標準偏差を算出し、それぞれの表示欄65,66に表示させることができる。
The second
位相差表示設定欄70は、第一解析表示欄50内および第二解析表示欄60内で表示される位相差表示欄54,63の表示形式の設定欄である。位相差表示選択ボタン71は、操作者が、位相差表示欄54,63のグラフの縦軸を、0°〜360°で表示するか、または、−180°〜180°で表示するか、選択することができる。このような構成とすることによって、同期運動と非同期運動とのどちらの運動波形について解析した場合でも、最大周波数の位相差または瞬時位相差を示す位相差曲線を位相差表示欄54,63の中央に表示させることができる。
位相差の平均値直線の表示選択ボタン72は、位相差表示欄54,63に位相差の平均値直線を表示させるか否か、操作者が選択するためのものである。
異常部位の表示選択ボタン73は、位相差曲線において、所定の条件を満たした時間帯(例えば、閾値を超えた時間帯)を異常部位と判定し、異常部位を表示させるか否か選択することができる。異常部位は、例えば、その時間帯の色が他の時間帯と異なる色で表示される。このような構成とすることによって、被験者の運動において不具合があった箇所を容易に理解することができる。
The phase difference
The phase difference average value straight line
The abnormal region
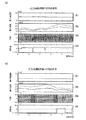
図14は、表示画面の第一解析表示欄50に表示される第一実施形態の解析結果の一例を示す図であって、(a)は被験者に同期運動のタスクを与えた場合、(b)は、被験者に非同期運動のタスクを与えた場合である。なお、図14で示した波形の形状は一例であって、図13の第一解析表示欄50に示した波形の形状と必ずしも一致しない。
FIG. 14 is a diagram showing an example of the analysis result of the first embodiment displayed in the first
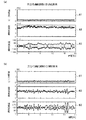
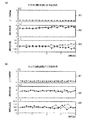
図15は、表示画面の第二解析表示欄60に表示される第二実施形態の解析結果の一例を示す図であって、(a)は被験者に同期運動のタスクを与えた場合、(b)は、被験者に非同期運動のタスクを与えた場合である。なお、図15で示した波形の形状は一例であって、図13の第二解析表示欄60に示した波形の形状と必ずしも一致しない。また、図16は、図15の部分拡大図である。
FIG. 15 is a diagram showing an example of the analysis result of the second embodiment displayed in the second
なお、このような解析結果の表示手段4への表示は、表示処理部23が従来公知のプログラム処理を運動波形の解析結果に対して行うことにより、容易に実現することができる。また、表示処理部23は、解析結果を同時に一画面に表示させる必要はなく、適宜操作者が選択する項目に関して表示させる構成としてもよい。
このように、解析結果を表示手段4に表示することによって、被験者の運動機能を定量的および視覚的に理解しやすいという効果を奏する。
Such display of the analysis result on the display means 4 can be easily realized by the
Thus, by displaying the analysis result on the display means 4, there is an effect that the motor function of the subject can be easily understood quantitatively and visually.
以上示したように、第一および第二の実施形態によれば、複数の運動波形間の位相を比較できるので、例えば、被験者に同期運動のタスクを与えた場合には、位相が一致するかどうかを指標として、被験者の運動機能が正常かどうかを判断することができる。また、例えば被験者に非同期運動のタスクを与えた場合には、位相が常に180度ずれているかどうか(適切に交互に運動が行われているかどうか)を指標として、被験者の運動機能が正常かどうかを判断することができる。
従って、本発明は、運動麻痺を発現した脳梗塞患者、パーキンソン病患者、頚椎症患者等の運動機能に障害を有する患者の運動機能の検査に特に好適である。
As described above, according to the first and second embodiments, the phase between a plurality of motion waveforms can be compared. For example, when a subject is given a task of synchronous motion, do the phases match? Whether or not the subject's motor function is normal can be determined using whether or not as an index. In addition, for example, when a subject is given a task of asynchronous movement, whether the subject's motor function is normal or not, using whether the phase is always 180 degrees out of phase (whether or not exercise is performed appropriately alternately) Can be judged.
Therefore, the present invention is particularly suitable for the examination of the motor function of patients with impaired motor function, such as cerebral infarction patients, Parkinson's disease patients, and cervical spondylosis patients who have developed motor paralysis.
また、第一の実施形態によれば、運動波形からピーク点を抽出せずに、複数の運動波形間の位相を比較することができる。すなわち、ピーク点の抽出抜けの影響を受けないので、安定した解析結果を得ることができる。また、所定時間幅の周波数解析区間に関して解析を行うので、ばらつきの少ない解析結果を得ることができる。 Further, according to the first embodiment, it is possible to compare phases between a plurality of motion waveforms without extracting peak points from the motion waveforms. That is, since it is not affected by the omission of peak point extraction, a stable analysis result can be obtained. In addition, since the analysis is performed with respect to the frequency analysis section having a predetermined time width, an analysis result with little variation can be obtained.
また、第二の実施形態によれば、抽出したピーク点毎に、複数の運動波形間の位相を比較することができる。また、位相を比較する際に、所定時間幅の解析区間を設定する必要がないので、計測した運動波形の時間幅T全体を解析に利用することができる。 Moreover, according to 2nd embodiment, the phase between several motion waveforms can be compared for every extracted peak point. Moreover, since it is not necessary to set an analysis section having a predetermined time width when comparing phases, the entire time width T of the measured motion waveform can be used for analysis.
すなわち、第一および第二の実施形態を、目的に応じてどちらかを選択したり、あるいは組み合わせたりして実施することによって、複数の運動波形間の位相の比較をより適切に行うことができる。 That is, the phase comparison between a plurality of motion waveforms can be performed more appropriately by implementing the first and second embodiments by selecting or combining them according to the purpose. .
なお、本発明は前記実施形態に限定されるものではなく、その技術思想のおよぶ範囲で種々の変更実施を行うことができる。
例えば、解析処理部により出力された解析結果を、そのまま出力するだけでなく、統計処理を施した後に出力する構成としてもよい。この場合には、情報処理部内に統計処理部を設け、図示しない被験者データDBに記録された被験者情報に基づいて解析結果をグループ化(例えば、健常群と疾患別群とに区分)し、統計処理(例えば、平均値や分散値の算出)を実行させることができる。
In addition, this invention is not limited to the said embodiment, A various change implementation can be performed in the range which the technical idea covers.
For example, the analysis result output by the analysis processing unit may be output not only as it is but also after being subjected to statistical processing. In this case, a statistical processing unit is provided in the information processing unit, and analysis results are grouped (for example, divided into a normal group and a disease-specific group) based on subject information recorded in a subject data DB (not shown). Processing (for example, calculation of an average value or a variance value) can be executed.
また、本実施形態においては、運動センサ6によって測定された電圧出力(波形データ)を距離波形等の運動波形に変換した後に、位相比較等の解析を行ったが、本発明はこれに限定されるものではなく、例えば、直接、電圧出力(波形データ)に基づいて解析してもよい。
Further, in this embodiment, the voltage output (waveform data) measured by the
また、本実施形態においては、運動センサ6の受信コイル301および発信コイル302を親指および人差し指に装着したが、どの指に受信コイル301や発信コイル302を装着してもよい。さらには、例えば、まぶた、唇、腕、足等の、動作する指以外の体の部分に受信コイル301と発信コイル302とを装着してもよい。
In this embodiment, the receiving
また、本実施形態においては、運動センサ6として、距離波形に変換可能な波形データの取得に好適な磁気センサ型のタッピング装置を用いたが、運動情報を波形データとして取得することができればどのような運動センサ6であっても構わない。例えば、運動センサ6は、従来公知のストレインゲージ、加速度計、速度計等であってもよく、また、画像データを取得し、画像解析することによって被験者の運動情報を取得する構成であってもよい。
In the present embodiment, a magnetic sensor type tapping device suitable for acquiring waveform data that can be converted into a distance waveform is used as the
また、本実施形態で説明した運動機能検査装置を用いた位相比較方法は、一般的なコンピュータにプログラムを実行させ、コンピュータ内の演算装置や記憶装置を動作させることにより実現される。従って、本発明は、運動波形間の位相比較方法を記録したプログラムにも容易に適用されうる。 The phase comparison method using the motor function testing device described in the present embodiment is realized by causing a general computer to execute a program and operating an arithmetic device or a storage device in the computer. Therefore, the present invention can be easily applied to a program that records a phase comparison method between motion waveforms.
1 運動機能検査装置
2 情報処理部
3 運動センサインタフェース
4 表示手段
5 入力手段
6 運動センサ
21 解析処理部(解析手段)
22 被験者情報処理部
23 表示処理部
211 運動波形生成手段
212,312 位相比較手段
212a 周波数解析区間抽出手段
212b 周波数解析手段
212c,312d 位相差算出手段
312a ピーク点抽出手段
312b ピーク時間差算出手段
312c チャンネル間時間差算出手段(運動波形間時間差算出手段)
DESCRIPTION OF
22 Subject
Claims (14)
前記解析手段は、複数の前記波形データに基づいてそれぞれ取得される複数の運動波形間の位相を比較する位相比較手段を含むことを特徴とする運動機能検査装置。 A motor function testing device comprising: analysis means for analyzing time-series waveform data acquired from a motion sensor; and display means for displaying an analysis result analyzed by the analysis means,
The motor function testing apparatus characterized in that the analysis means includes phase comparison means for comparing phases between a plurality of motion waveforms respectively acquired based on the plurality of waveform data.
前記運動波形において、所定時間幅の周波数解析区間を抽出する周波数解析区間抽出手段と、
前記周波数解析区間の周波数解析演算を行い、前記周波数解析区間の最大周波数の位相を算出する周波数解析手段と、
前記複数の運動波形間の前記最大周波数の位相差を算出する位相差算出手段と、
を含むことを特徴とする請求項2に記載の運動機能検査装置。 The phase comparison means includes
In the motion waveform, frequency analysis section extraction means for extracting a frequency analysis section having a predetermined time width;
Frequency analysis means for performing frequency analysis calculation of the frequency analysis section and calculating a phase of the maximum frequency of the frequency analysis section;
Phase difference calculating means for calculating a phase difference of the maximum frequency between the plurality of motion waveforms;
The motor function testing device according to claim 2, comprising:
前記運動波形において、前記所定時間幅より小さい時間幅でずらしながら複数の前記周波数解析区間を抽出することを特徴とする請求項3に記載の運動機能検査装置。 The frequency analysis section extraction means includes
The motor function testing device according to claim 3, wherein a plurality of the frequency analysis sections are extracted while being shifted by a time width smaller than the predetermined time width in the motion waveform.
前記周波数解析区間の最大周波数および前記最大周波数の強度を算出することを特徴とする請求項3に記載の運動機能検査装置。 The frequency analysis means further includes
The motor function testing device according to claim 3, wherein the maximum frequency of the frequency analysis section and the intensity of the maximum frequency are calculated.
前記運動波形のピーク点を抽出するピーク点抽出手段と、
時間的に隣り合う前記ピーク点の時間差からなるピーク時間差を算出するピーク時間差算出手段と、
前記複数の運動波形間において前記ピーク点を対応させる運動波形間ピーク対応手段と、
対応させた前記ピーク点の時間差からなる運動波形間時間差および前記ピーク時間差に基づいて、前記複数の運動波形間の位相差を算出する位相差算出手段と、
を含むことを特徴とする請求項2に記載の運動機能検査装置。 The phase comparison means includes
Peak point extraction means for extracting a peak point of the motion waveform;
A peak time difference calculating means for calculating a peak time difference consisting of a time difference between the peak points adjacent in time;
A motion waveform peak correspondence means for corresponding the peak point between the plurality of motion waveforms;
A phase difference calculating means for calculating a phase difference between the plurality of motion waveforms based on the time difference between the motion waveforms consisting of the time difference between the peak points and the peak time difference,
The motor function testing device according to claim 2, comprising:
前記複数の運動波形において抽出したピーク点の数が同じである場合には、前記複数の運動波形間で前記ピーク点を時間順に対応させることを特徴とする請求項7に記載の運動機能検査装置。 The movement waveform peak correspondence means is:
8. The motor function testing device according to claim 7, wherein when the number of peak points extracted in the plurality of motion waveforms is the same, the peak points are associated in time order between the plurality of motion waveforms. .
前記複数の運動波形において抽出したピーク点の数が異なる場合には、前記複数の運動波形のうち一つの運動波形の前記ピーク点を基準ピーク点とし、前記基準ピーク点との前記運動波形間時間差が最小となるように前記複数の運動波形のうち前記一つの運動波形とは異なる運動波形のピーク点を対応させることを特徴とする請求項7に記載の運動機能検査装置。 The movement waveform peak correspondence means is:
When the number of peak points extracted in the plurality of motion waveforms is different, the peak point of one motion waveform among the plurality of motion waveforms is set as a reference peak point, and the time difference between the motion waveforms from the reference peak point The motor function testing device according to claim 7, wherein a peak point of a motion waveform different from the one motion waveform among the plurality of motion waveforms is made to correspond to a minimum.
前記位相比較手段は、
前記運動波形において、所定時間幅の周波数解析区間を抽出する周波数解析区間抽出ステップと、
前記周波数解析区間の周波数解析演算を行い、前記周波数解析区間の最大周波数の位相を算出する周波数解析ステップと、
前記複数の運動波形間の前記最大周波数の位相差を算出する位相差算出ステップと、
を実行することを特徴とする運動波形間の位相比較方法。 Analyzing means for analyzing time-series waveform data acquired from the motion sensor, and display means for displaying the analysis result analyzed by the analyzing means, the analyzing means each based on the plurality of waveform data Using a motor function testing device including a phase comparison means for comparing phases between a plurality of acquired motion waveforms, the phases between the plurality of motion waveforms respectively acquired based on the plurality of waveform data are compared. A phase comparison method between motion waveforms,
The phase comparison means includes
In the motion waveform, a frequency analysis interval extraction step for extracting a frequency analysis interval of a predetermined time width;
A frequency analysis step of performing a frequency analysis calculation of the frequency analysis section and calculating a phase of a maximum frequency of the frequency analysis section;
A phase difference calculating step of calculating a phase difference of the maximum frequency between the plurality of motion waveforms;
A phase comparison method between motion waveforms.
前記運動波形において、前記所定時間幅より小さい時間幅でずらしながら複数の前記周波数解析区間を抽出することを特徴とする請求項10に記載の運動波形間の位相比較方法。 The frequency analysis interval extraction step includes
The phase comparison method between motion waveforms according to claim 10, wherein a plurality of the frequency analysis sections are extracted while being shifted by a time width smaller than the predetermined time width in the motion waveforms.
前記位相比較手段は、
前記運動波形のピーク点を抽出するピーク点抽出ステップと、
時間的に隣り合う前記ピーク点の時間差からなるピーク時間差を算出するピーク時間差算出ステップと、
前記複数の運動波形間において前記ピーク点を対応させる運動波形間ピーク対応ステップと、
対応させた前記ピーク点の時間差からなる運動波形間時間差および前記ピーク時間差に基づいて、前記複数の運動波形間の位相差を算出する位相差算出ステップと、
を実行することを特徴とする運動波形間の位相比較方法。 Analyzing means for analyzing time-series waveform data acquired from the motion sensor, and display means for displaying the analysis result analyzed by the analyzing means, the analyzing means each based on the plurality of waveform data Using a motor function testing device including a phase comparison means for comparing phases between a plurality of acquired motion waveforms, the phases between the plurality of motion waveforms respectively acquired based on the plurality of waveform data are compared. A phase comparison method between motion waveforms,
The phase comparison means includes
A peak point extracting step for extracting a peak point of the motion waveform;
A peak time difference calculating step for calculating a peak time difference consisting of a time difference between the peak points adjacent in time;
A peak correspondence step between motion waveforms that associates the peak points between the plurality of motion waveforms;
A phase difference calculating step of calculating a phase difference between the plurality of motion waveforms based on the time difference between the motion waveforms composed of the time difference between the peak points and the peak time difference;
A phase comparison method between motion waveforms.
前記複数の運動波形において抽出したピーク点の数が同じである場合には、前記複数の運動波形間で前記ピーク点を時間順に対応させることを特徴とする請求項12に記載の運動波形間の位相比較方法。 The peak correspondence step between the movement waveforms
13. The motion waveforms according to claim 12, wherein when the number of peak points extracted in the plurality of motion waveforms is the same, the peak points are correlated in time order between the plurality of motion waveforms. Phase comparison method.
前記複数の運動波形において抽出したピーク点の数が異なる場合には、前記複数の運動波形のうち一つの運動波形の前記ピーク点を基準ピーク点とし、前記基準ピーク点との前記運動波形間時間差が最小となるように前記複数の運動波形のうち前記一つの運動波形とは異なる運動波形のピーク点を対応させることを特徴とする請求項12に記載の運動波形間の位相比較方法。 The peak correspondence step between the movement waveforms
When the number of peak points extracted in the plurality of motion waveforms is different, the peak point of one motion waveform among the plurality of motion waveforms is set as a reference peak point, and the time difference between the motion waveforms from the reference peak point The phase comparison method between motion waveforms according to claim 12, wherein a peak point of a motion waveform different from the one motion waveform among the plurality of motion waveforms is associated with each other so as to minimize the motion waveform.
Priority Applications (3)
| Application Number | Priority Date | Filing Date | Title |
|---|---|---|---|
| JP2006130124A JP2007301003A (en) | 2006-05-09 | 2006-05-09 | Motor function testing apparatus and method for comparing phases between motor waveforms |
| US11/746,144 US20070272599A1 (en) | 2006-05-09 | 2007-05-09 | Moving body inspection apparatus and method of comparing phases between movement waveforms |
| US12/368,786 US20090192418A1 (en) | 2006-05-09 | 2009-02-10 | Moving Body Inspection Apparatus And Method of Comparing Phases Between Movement Waveforms |
Applications Claiming Priority (1)
| Application Number | Priority Date | Filing Date | Title |
|---|---|---|---|
| JP2006130124A JP2007301003A (en) | 2006-05-09 | 2006-05-09 | Motor function testing apparatus and method for comparing phases between motor waveforms |
Publications (2)
| Publication Number | Publication Date |
|---|---|
| JP2007301003A true JP2007301003A (en) | 2007-11-22 |
| JP2007301003A5 JP2007301003A5 (en) | 2009-02-12 |
Family
ID=38748548
Family Applications (1)
| Application Number | Title | Priority Date | Filing Date |
|---|---|---|---|
| JP2006130124A Abandoned JP2007301003A (en) | 2006-05-09 | 2006-05-09 | Motor function testing apparatus and method for comparing phases between motor waveforms |
Country Status (2)
| Country | Link |
|---|---|
| US (2) | US20070272599A1 (en) |
| JP (1) | JP2007301003A (en) |
Cited By (9)
| Publication number | Priority date | Publication date | Assignee | Title |
|---|---|---|---|---|
| JP2009136667A (en) * | 2007-11-14 | 2009-06-25 | Hitachi Computer Peripherals Co Ltd | Living body inspection system, living body inspection apparatus, and living body inspection method |
| JP2010273878A (en) * | 2009-05-28 | 2010-12-09 | Yamaha Corp | Motion evaluation device and program |
| CN105005867A (en) * | 2015-07-31 | 2015-10-28 | 重庆世纪精信实业(集团)有限公司 | Industrial robot processing nonconforming product statistical device based on construction synchronization and method |
| CN105170483A (en) * | 2015-07-31 | 2015-12-23 | 重庆世纪精信实业(集团)有限公司 | Unqualified machined industrial mechanical arm product statistical method and device based on construction synchronization |
| WO2016031348A1 (en) * | 2014-08-29 | 2016-03-03 | 日立マクセル株式会社 | Brain dysfunction evaluation system, brain dysfunction evaluation method, and program |
| WO2016031349A1 (en) * | 2014-08-28 | 2016-03-03 | 日立マクセル株式会社 | Movement function assessment system and movement function measurement apparatus |
| US9931063B2 (en) | 2010-03-17 | 2018-04-03 | Hitachi Maxell, Ltd. | Sensor for measuring motor function, a plastic band, and a device for measuring motor function |
| WO2023148881A1 (en) * | 2022-02-03 | 2023-08-10 | 公立大学法人名古屋市立大学 | System and method for outputting information about possibility of having idiopathic normal pressure hydrocephalus |
| CN116602643A (en) * | 2023-07-20 | 2023-08-18 | 成都晨电智能科技有限公司 | Sampling method and circuit for power frequency interference resistant signal and double-electrode heart rate sensor |
Families Citing this family (7)
| Publication number | Priority date | Publication date | Assignee | Title |
|---|---|---|---|---|
| SE0801267A0 (en) | 2008-05-29 | 2009-03-12 | Cunctus Ab | Method of a user unit, a user unit and a system comprising said user unit |
| JP5175683B2 (en) * | 2008-10-23 | 2013-04-03 | 日立コンシューマエレクトロニクス株式会社 | Estimation method of finger tapping force |
| EP2484281A4 (en) * | 2009-09-30 | 2015-05-06 | Mitsubishi Chem Corp | Body movement signal information processing method, information processing system and information processing device |
| US8888720B2 (en) * | 2010-04-02 | 2014-11-18 | Stanford P. Hudson | Great toe dorsiflexion detection |
| JP5558902B2 (en) * | 2010-04-28 | 2014-07-23 | 日立コンシューマエレクトロニクス株式会社 | Motor function analyzer |
| WO2016009644A1 (en) * | 2014-07-15 | 2016-01-21 | 旭化成株式会社 | Input device, biosensor, program, computer-readable medium, and mode setting method |
| CN105982658B (en) * | 2015-02-13 | 2019-04-23 | 华硕电脑股份有限公司 | Physiologic information method for detecting and device |
Family Cites Families (2)
| Publication number | Priority date | Publication date | Assignee | Title |
|---|---|---|---|---|
| US6546134B1 (en) * | 1999-03-29 | 2003-04-08 | Ruth Shrairman | System for assessment of fine motor control in humans |
| JP4043309B2 (en) * | 2002-07-29 | 2008-02-06 | 富士通テン株式会社 | In-vehicle human body detection method |
-
2006
- 2006-05-09 JP JP2006130124A patent/JP2007301003A/en not_active Abandoned
-
2007
- 2007-05-09 US US11/746,144 patent/US20070272599A1/en not_active Abandoned
-
2009
- 2009-02-10 US US12/368,786 patent/US20090192418A1/en not_active Abandoned
Cited By (17)
| Publication number | Priority date | Publication date | Assignee | Title |
|---|---|---|---|---|
| JP2009136667A (en) * | 2007-11-14 | 2009-06-25 | Hitachi Computer Peripherals Co Ltd | Living body inspection system, living body inspection apparatus, and living body inspection method |
| JP2010273878A (en) * | 2009-05-28 | 2010-12-09 | Yamaha Corp | Motion evaluation device and program |
| US9931063B2 (en) | 2010-03-17 | 2018-04-03 | Hitachi Maxell, Ltd. | Sensor for measuring motor function, a plastic band, and a device for measuring motor function |
| JP2016049123A (en) * | 2014-08-28 | 2016-04-11 | 日立マクセル株式会社 | Exercise function evaluation system and exercise function measurement device |
| US11172849B2 (en) | 2014-08-28 | 2021-11-16 | Maxell, Ltd. | Movement function assessment system and movement function measurement apparatus |
| WO2016031349A1 (en) * | 2014-08-28 | 2016-03-03 | 日立マクセル株式会社 | Movement function assessment system and movement function measurement apparatus |
| WO2016031348A1 (en) * | 2014-08-29 | 2016-03-03 | 日立マクセル株式会社 | Brain dysfunction evaluation system, brain dysfunction evaluation method, and program |
| JP2016049282A (en) * | 2014-08-29 | 2016-04-11 | 日立マクセル株式会社 | Brain dysfunction evaluation system, brain dysfunction evaluation method and program |
| US11064914B2 (en) | 2014-08-29 | 2021-07-20 | Maxell, Ltd. | Brain dysfunction evaluation system, brain dysfunction evaluation method, and program |
| US11850042B2 (en) | 2014-08-29 | 2023-12-26 | Maxell, Ltd. | Brain dysfunction evaluation system, brain dysfunction evaluation method, and program |
| CN105170483B (en) * | 2015-07-31 | 2017-10-20 | 重庆世纪精信实业(集团)有限公司 | Based on the synchronous industry mechanical arm processing defective work statistical method of construction and device |
| CN105170483A (en) * | 2015-07-31 | 2015-12-23 | 重庆世纪精信实业(集团)有限公司 | Unqualified machined industrial mechanical arm product statistical method and device based on construction synchronization |
| CN105005867B (en) * | 2015-07-31 | 2018-05-15 | 重庆世纪精信实业(集团)有限公司 | Based on the synchronous industry mechanical arm processing defective work statistic device of construction and method |
| CN105005867A (en) * | 2015-07-31 | 2015-10-28 | 重庆世纪精信实业(集团)有限公司 | Industrial robot processing nonconforming product statistical device based on construction synchronization and method |
| WO2023148881A1 (en) * | 2022-02-03 | 2023-08-10 | 公立大学法人名古屋市立大学 | System and method for outputting information about possibility of having idiopathic normal pressure hydrocephalus |
| CN116602643A (en) * | 2023-07-20 | 2023-08-18 | 成都晨电智能科技有限公司 | Sampling method and circuit for power frequency interference resistant signal and double-electrode heart rate sensor |
| CN116602643B (en) * | 2023-07-20 | 2023-11-17 | 成都晨电智能科技有限公司 | Sampling method and circuit for power frequency interference resistant signal and double-electrode heart rate sensor |
Also Published As
| Publication number | Publication date |
|---|---|
| US20090192418A1 (en) | 2009-07-30 |
| US20070272599A1 (en) | 2007-11-29 |
Similar Documents
| Publication | Publication Date | Title |
|---|---|---|
| JP2007301003A (en) | Motor function testing apparatus and method for comparing phases between motor waveforms | |
| US11850042B2 (en) | Brain dysfunction evaluation system, brain dysfunction evaluation method, and program | |
| JP5038620B2 (en) | Motor function testing device | |
| JP4630115B2 (en) | Motion analysis display device | |
| Joundi et al. | Rapid tremor frequency assessment with the iPhone accelerometer | |
| US20220382554A1 (en) | Task execution order determination system and task execution method | |
| Gottlibe et al. | Stroke identification using a portable EEG device–A pilot study | |
| US7455648B2 (en) | Living body inspection apparatus | |
| Kandori et al. | Quantitative magnetic detection of finger movements in patients with Parkinson’s disease | |
| Fanelli et al. | Fully automated, real-time, calibration-free, continuous noninvasive estimation of intracranial pressure in children | |
| EP1495721A2 (en) | Biological-sound data processing system, program, and recording medium | |
| Howell et al. | Determining the utility of a smartphone-based gait evaluation for possible use in concussion management | |
| Schaefer et al. | Establishing wrist-based cutpoints for the actical accelerometer in elementary school-aged children | |
| Vienne-Jumeau et al. | Personalized template-based step detection from inertial measurement units signals in multiple sclerosis | |
| Bergamin et al. | Validation of the mywellness key in walking and running speeds | |
| CN111246794B (en) | Abnormal data processing system and abnormal data processing method | |
| Ding et al. | Point-of-care technologies in heart, lung, blood and sleep disorders from the Center for Advancing Point-of-Care Technologies | |
| KR101747866B1 (en) | Parkinson's disease indicator evaluation device and method using accelerator sensor | |
| JP2023020273A (en) | Information processing device, program and information processing method | |
| WO2023100347A1 (en) | Finger tapping measurement processing device, method, and computer program | |
| Wu et al. | A portable monitoring system with automatic event detection for sleep apnea level-IV evaluation | |
| Martín-González et al. | Mapping Raw Acceleration Data on ActiGraph Counts: A Machine Learning Approach | |
| Bobrova et al. | Algorithm for Fetal Activity Passive Monitoring | |
| EP4188203A1 (en) | Systems and methods for digitographic measurement of parkinson's disease | |
| WO2013190902A1 (en) | Information processing device, information processing method, control program, and recording medium |
Legal Events
| Date | Code | Title | Description |
|---|---|---|---|
| A521 | Written amendment |
Free format text: JAPANESE INTERMEDIATE CODE: A523 Effective date: 20081216 |
|
| A621 | Written request for application examination |
Free format text: JAPANESE INTERMEDIATE CODE: A621 Effective date: 20081216 |
|
| A762 | Written abandonment of application |
Free format text: JAPANESE INTERMEDIATE CODE: A762 Effective date: 20101125 |