JP2007178294A - Edge detection method and edge detection device - Google Patents
Edge detection method and edge detection device Download PDFInfo
- Publication number
- JP2007178294A JP2007178294A JP2005377799A JP2005377799A JP2007178294A JP 2007178294 A JP2007178294 A JP 2007178294A JP 2005377799 A JP2005377799 A JP 2005377799A JP 2005377799 A JP2005377799 A JP 2005377799A JP 2007178294 A JP2007178294 A JP 2007178294A
- Authority
- JP
- Japan
- Prior art keywords
- curve
- edge
- model curve
- edge position
- pattern
- Prior art date
- Legal status (The legal status is an assumption and is not a legal conclusion. Google has not performed a legal analysis and makes no representation as to the accuracy of the status listed.)
- Granted
Links
Images


Landscapes
- Image Analysis (AREA)
- Length-Measuring Devices Using Wave Or Particle Radiation (AREA)
- Testing Or Measuring Of Semiconductors Or The Like (AREA)
- Image Processing (AREA)
Abstract
Description
本発明は、測長対象のパターンのエッジ位置を画像上で検出するエッジ位置検出方法およびエッジ検出装置に関するものである。 The present invention relates to an edge position detection method and an edge detection apparatus for detecting an edge position of a pattern to be measured on an image.
従来、走査型電子顕微鏡などで取得したマスクやLSI上のパターンの測長は、当該パターン画像上で当該パターンの左端、右端の位置をそれぞれ決めて両者の間の距離を測長し、当該パターンの幅の寸法を自動計測している。 Conventionally, the length of a pattern on a mask or LSI acquired with a scanning electron microscope or the like is determined by determining the positions of the left and right ends of the pattern on the pattern image and measuring the distance between the two. The width dimension is automatically measured.
この際、パターンの左端、右端の位置は、ラインプロファイル(パターンを横切る走査について、そのときの横軸を距離、縦軸を輝度としたときのラインプロファイル)の中点の位置(あるいは所定閾値02.と0.8を横切るときのその中点の位置)を決めて、当該位置(左端、右端)の間の距離を寸法として自動計測していた。 At this time, the positions of the left end and the right end of the pattern are the positions of the center points of the line profile (the line profile when the horizontal axis is distance and the vertical axis is brightness for scanning across the pattern) (or the predetermined threshold value 02). . And 0.8 and the midpoint position when crossing 0.8) was determined, and the distance between the positions (left end, right end) was automatically measured as a dimension.
また、ラインプロファイルの端(パターンの端)の部分について、予め1次、2次などの曲線を決めておき、当該曲線がラインプロファイルと一致する点をエッジ位置(左端、右端)と求め、当該求めた位置(左端、右端)の間の距離をパターンの寸法と自動計測していた。 Also, for the end of the line profile (the end of the pattern), first-order and second-order curves are determined in advance, and the point where the curve matches the line profile is determined as the edge position (left end, right end) The distance between the obtained positions (left end, right end) was automatically measured with the pattern dimension.
しかし、上述した従来の前者の手法では、パターンのエッジ部分のラインプロファイルにノイズが乗っていた場合にはその精度、更に再現性が充分に得られないという問題があった。 However, the above-described conventional method has a problem that accuracy and further reproducibility cannot be obtained when noise is applied to the line profile at the edge portion of the pattern.
また、上述した従来の後者の手法では、パターンのエッジ部分について予め決めた1次、2次などの曲線と最も一致する点を求めていたため、当該曲線が現在測定しようとするパターンのエッジ部分の曲線に必ずしも最適でなく、充分な精度、更に、再現性が得られないという問題があった。 In the latter latter method described above, the edge portion of the pattern is determined to be the point that most closely matches a predetermined first-order or second-order curve. There is a problem that the curve is not necessarily optimal and sufficient accuracy and reproducibility cannot be obtained.
本発明は、これらの問題を解決するため、測長対象領域から取得したラインプロファイルの1本あるいは複数本からモデル曲線を生成し、当該生成したモデル曲線とラインプロファイルのエッジ付近の曲線との差の絶対値が最小のフィッティングポイントを求め、これに所定閾値のときのシフト量を加算してエッジ位置と決定するようにしている。 In order to solve these problems, the present invention generates a model curve from one or a plurality of line profiles acquired from the measurement target region, and the difference between the generated model curve and the curve near the edge of the line profile. The fitting point having the smallest absolute value of the value is obtained, and the shift amount at the predetermined threshold value is added to this to determine the edge position.
本発明は、取得したラインプロファイルの1本あるいは複数本からモデル曲線を生成し、当該生成したモデル曲線とラインプロファイルのエッジ付近の曲線との差の絶対値が最小のフィッティングポイントを求め、これに所定閾値のときのシフト量を加算してエッジ位置と決定することにより、ラインプロファイルのエッジ部分のノイズなどの影響を極力排した高精度かつ再現性良好なエッジ位置を決定してパターンの精密測長を実現することが可能となる。 According to the present invention, a model curve is generated from one or a plurality of acquired line profiles, and a fitting point having a minimum absolute value of a difference between the generated model curve and a curve near the edge of the line profile is obtained. By determining the edge position by adding the shift amount at the predetermined threshold value, the edge position of the edge portion of the line profile is determined as much as possible to determine the edge position with high accuracy and good reproducibility. It becomes possible to realize the length.
本発明は、取得したラインプロファイルの1本あるいは複数本からモデル曲線を生成し、当該生成したモデル曲線とラインプロファイルのエッジ付近の曲線との差の絶対値が最小のフィッティングポイントを求め、これに所定閾値のときのシフト量を加算してエッジ位置と決定し、ラインプロファイルのエッジ部分のノイズなどの影響を極力排した高精度かつ再現性良好なエッジ位置を決定してパターンの精密測長を実現した。 According to the present invention, a model curve is generated from one or a plurality of acquired line profiles, and a fitting point having a minimum absolute value of a difference between the generated model curve and a curve near the edge of the line profile is obtained. Accurate measurement of the pattern is performed by determining the edge position by adding the shift amount at the predetermined threshold and determining the edge position with high accuracy and good reproducibility, eliminating the influence of noise etc. of the edge part of the line profile as much as possible. It was realized.
図1は、本発明のシステム構成図を示す。
図1において、電子光学系1は、走査型電子顕微鏡などの鏡筒であって、電子線ビームを発生する電子銃、発生された電子線ビームを集束する集束レンズ、集束された電子線ビームを試料3の上で細く絞る対物レンズ、試料3の上で細く絞られた電子線ビームを平面走査(X方向およびY方向に走査)するための2段の偏向系、更に、細く絞った電子線ビームで試料3の上を平面走査したときに放出された2次電子、光、反射された反射電子を検出する検出器などから構成され、試料3の表面の画像(2次電子画像、反射電子画像)などを生成するものである。
FIG. 1 shows a system configuration diagram of the present invention.
In FIG. 1, an electron
試料室2は、図示外の真空排気系で真空排気して試料3を真空中に収納する容器である。
The
試料3は、測長対象の試料であって、例えばマスクやLSIなどの測長対象のパターンの形成されたものである。
The
PC11は、パソコンであって、プログラムに従い各種処理を実行するものであり、ここでは、画像取得手段12、シフト量算出手段13、エッジ位置算出手段14、画像ファイル15、出力ファイル16、表示装置17、および入出力手段18などから構成されるものである。
The PC 11 is a personal computer and executes various processes according to a program. Here, the image acquisition means 12, the shift amount calculation means 13, the edge position calculation means 14, the
画像取得手段12は、図示外の制御系に指示を発し、電子光学系1を動作させて試料3の表面の画像(例えばマスクのパターンの部分の画像(2次電子画像、反射電子画像))を取得する公知のものである。
The image acquisition means 12 issues an instruction to a control system (not shown) and operates the electron
シフト量算出手段13は、ラインプロファイルから生成したモデル曲線が所定閾値と交差する点の位置(シフト量、図4の(a)参照)を算出するものである(図2から図5を用いて後述する)。 The shift amount calculation means 13 calculates the position (shift amount, see FIG. 4A) of the point where the model curve generated from the line profile intersects the predetermined threshold (see FIGS. 2 to 5). Will be described later).
エッジ位置算出手段14は、画像上でパターンのエッジ位置を算出するものである(
図2から図5を用いて後述する)。
The edge position calculation means 14 calculates the edge position of the pattern on the image (
(It will be described later with reference to FIGS. 2 to 5).
画像ファイル15は、試料3から取得した画像を保持するものである。
出力ファイル16は、エッジ位置などの算出、計測した結果を格納するものである。
The
The
表示装置17は、画像などを表示するものである。
入出力装置18は、各種入力装置(例えばマウス、キーボード)および各種出力装置である。
The display device 17 displays an image or the like.
The input / output device 18 is various input devices (for example, a mouse and a keyboard) and various output devices.
次に、図2のフローチャートの順番に従い、図1の構成の動作を詳細に説明する。
図2は、本発明の動作説明フローチャートを示す。
Next, the operation of the configuration of FIG. 1 will be described in detail according to the order of the flowchart of FIG.
FIG. 2 shows a flowchart for explaining the operation of the present invention.
図2の(a)は、モデル曲線の決定のフローチャートを示す。
図2の(a−1)において、S1は、1番目のプロファイルから得られた3次曲線をモデル曲線とする。これは、後述する図3の(b)の画像上のパターンを横切るプロファイルを異なる位置で複数取得し、1番目のプロファイルのエッジ近傍の曲線をそのまま3次曲線で近似してモデル曲線と決定することを意味する。
FIG. 2A shows a flowchart for determining a model curve.
In (a-1) of FIG. 2, S1 uses a cubic curve obtained from the first profile as a model curve. This is obtained by obtaining a plurality of profiles crossing the pattern on the image of FIG. 3B (to be described later) at different positions and approximating the curve near the edge of the first profile as it is with a cubic curve to determine a model curve. Means that.
以上のS1によって、パターンを横切るラインプロファイルの1番目のエッジ近傍の曲線を3次曲線で近似し、モデル曲線を生成することにより、ラインプロファイルに適したモデル曲線を動的に自動生成することが可能となる。そして、生成したモデル曲線と1番目、2番目、・・・50番目のプロファイルとそれぞれ重ねてその差の絶対値の総和が最も小さくなる位置をフィッティングポイントをそれぞれ算出する(図3の(c),(d)参照)。 By the above S1, a curve near the first edge of the line profile crossing the pattern is approximated by a cubic curve, and a model curve is generated, thereby automatically generating a model curve suitable for the line profile. It becomes possible. Then, the generated model curve and the first, second,..., 50th profiles are overlapped with each other, and the fitting point is calculated for each position where the sum of the absolute values of the differences becomes the smallest ((c) in FIG. 3). (See (d)).
図2の(a−2)において、S11は、1番目のプロファイルのエッジ付近から、最初の3次のモデル曲線を決める。これは、既述したS1と同様に、1番目のプロファイルのエッジ付近の曲線を、3次曲線で表した(近似した)モデル曲線を生成する。 In FIG. 2A-2, S11 determines the first cubic model curve from the vicinity of the edge of the first profile. This generates a model curve representing (approximate) a curve near the edge of the first profile with a cubic curve, similar to S1 described above.
S12は、2番目のプロファイルのエッジ付近で、最初のモデル曲線と比較を行う。よく合致した処で、2番目の3次曲線近似と最初のモデル曲線との平均化処理を行う。これにより、1番目と2番目のプロファイルのエッジ付近で両者の平均化された3次曲線のモデル曲線が生成されることとなる。 S12 compares with the first model curve near the edge of the second profile. In a well matched place, the second cubic curve approximation and the first model curve are averaged. As a result, a model curve of a cubic curve averaged between the edges of the first and second profiles is generated.
S13は、これを新たなモデル曲線として、50番目まで繰り返す。最終に得られた3次曲線をモデル曲線とする。 S13 repeats this up to the 50th as a new model curve. The cubic curve finally obtained is used as a model curve.
以上のS11からS13によって、パターンを横切るラインプロファイルの1番目のエッジ近傍の曲線を3次曲線で近似し、モデル曲線を生成し、次に、当該モデル曲線と2番目のラインプロファイルとの平均化処理して3次曲線を作成することを50番目のラインプロファイルまで繰り返し、最終的に得られた3次曲線をモデル曲線として算出することにより、1番目から50番目のラインプロファイルを3次曲線近似で平均化処理してより精度の高くかつ再現性の良好なモデル曲線を、動的に自動生成することが可能となる。 Through S11 to S13, a curve near the first edge of the line profile crossing the pattern is approximated by a cubic curve to generate a model curve, and then the model curve and the second line profile are averaged. Processing to create a cubic curve is repeated up to the 50th line profile, and the finally obtained cubic curve is calculated as a model curve to approximate the first to 50th line profiles to a cubic curve. Thus, it is possible to automatically generate a model curve with higher accuracy and better reproducibility by averaging.
図2の(b)は、フィッティングポイントの算出フローチャートを示す。
図2の(b)において、S21は、モデル曲線とエッジ付近で、ずらしながら、夫々の位置でのモデル曲線とプロファイルの輝度の差の絶対値の総和を求め、総和が最小になる所をフィット位置(フィッティングポイント)とする。これは、後述する図3の(c)、(d)に示すように、図2の(a)で生成したモデル曲線を、ラインプロファイルのエッジ付近でずらしながら、当該モデル曲線とラインプロファイルの輝度の差の絶対値の総和を求め、当該総和が最小となるフィッティングポイント(モデル曲線の例えば最小値となる位置)を算出する。
FIG. 2B illustrates a fitting point calculation flowchart.
In FIG. 2 (b), S21 calculates the sum of absolute values of the difference between the brightness of the model curve and the profile at each position while shifting near the edge of the model curve and fits the place where the sum is minimized. Position (fitting point). This is because, as shown in FIGS. 3C and 3D described later, the brightness of the model curve and the line profile is shifted while shifting the model curve generated in FIG. 2A near the edge of the line profile. The sum of absolute values of the differences is obtained, and a fitting point at which the sum is minimum (for example, the position of the model curve where the minimum value is obtained) is calculated.
以上のS21によって、図2の(a)で算出したモデル曲線と、1番目、2番目、・・・50番目のラインプロファイルのエッジ付近で最も一致するフィッティングポイントをそれぞれ自動算出することが可能となる。 By the above S21, it is possible to automatically calculate the fitting points that most closely match the model curve calculated in FIG. 2A and the edges of the first, second,..., 50th line profiles. Become.
図2の(c)は、エッジ検出のフローチャートを示す。
図2の(c)において、S31は、モデル曲線の最大値と最小値の差を1とする(規格化する)。
FIG. 2C shows a flowchart of edge detection.
In FIG. 2C, in S31, the difference between the maximum value and the minimum value of the model curve is set to 1 (normalized).
S32は、モデル曲線上で指定された閾値の位置を求める。これは、後述する図4の(e)に示すように、モデル曲線上で指定された閾値(例えば0.8、最適値は実験で求める)と交差する位置(横軸も位置)を求める。 In S32, the position of the threshold value designated on the model curve is obtained. As shown in (e) of FIG. 4 to be described later, this obtains a position (horizontal axis is also a position) that intersects a threshold value (for example, 0.8, the optimum value is obtained by experiment) specified on the model curve.
S33は、モデル曲線の始点(左端)から閾値までの距離をシフト値とする。これは、図4の(e)に示すように、モデル曲線の始点(左端、フィッティングポイント)からS32で算出した閾値と交差する位置までの距離をシフト値として求める。 In S33, the distance from the start point (left end) of the model curve to the threshold value is set as a shift value. As shown in FIG. 4 (e), the distance from the start point (left end, fitting point) of the model curve to the position intersecting with the threshold value calculated in S32 is obtained as a shift value.
S34は、夫々のプロファイルで見つけたフィッティングポイントに加える。
S35は、各エッジ位置とする。これらS34、S35は、S33で求めた図4の(e)のシフト値を、1番目から50番目のラインプロファイルについてS21で算出したフィッティングポイントにそれぞれ加えて各エッジ位置と決定する。
S34 is added to the fitting points found in each profile.
S35 is each edge position. In S34 and S35, the shift values shown in FIG. 4 (e) obtained in S33 are added to the fitting points calculated in S21 for the first to 50th line profiles, and the edge positions are determined.
以上のS31からS35によって、モデル曲線上で所定閾値(例えば0.8)と交差する位置を求めてこの位置とモデル曲線の始点(フィッティングポイントに相当)との距離をシフト値として算出し、当該算出したシフト値を、1番目から50番目のラインプロファイルについてS21でモデル曲線とそれぞれフィッティングしたフィッティングポイントに加算して各ラインプロファイルのエッジ位置をそれぞれ算出することが可能となる。これにより、モデル曲線を1つのラインプロファイルあるいは複数(あるいは全部)のラインプロファイルから動的に最適に作成することが可能となり、しかも、更に、実験で求めた閾値がモデル曲線との交点の位置(シフト値)を求めてフィッティングポイントに加算してエッジ位置を算出することで最適なエッジ位置を決定でき、高精度かつ再現性良好なパターンのエッジ位置を画像上で自動算出することが可能となる。 Through S31 to S35 described above, a position that intersects a predetermined threshold (for example, 0.8) on the model curve is obtained, and the distance between this position and the start point of the model curve (corresponding to the fitting point) is calculated as a shift value. It is possible to calculate the edge position of each line profile by adding the calculated shift value to the fitting points fitted to the model curve in S21 for the first to 50th line profiles. As a result, a model curve can be dynamically and optimally created from one line profile or a plurality (or all) of line profiles, and the threshold value obtained by experiment is the position of the intersection with the model curve ( The optimum edge position can be determined by calculating the edge position by obtaining the shift value and adding it to the fitting point, and the edge position of the pattern with high accuracy and good reproducibility can be automatically calculated on the image. .
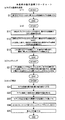
図3および図4は、本発明の説明図を示す。
図3の(a)は、モデル曲線の例を示す。図示のモデル曲線は、既述した図2の(a−1)あるいは(a−2)で自動生成した3次のモデル曲線の例を示す。図2の(a−1)では1〜50番目のラインプロファイル中の1つ(例えば1番目)のラインプロファイルのエッジ付近の曲線を3次曲線で近似して生成したモデル曲線である。また、図2の(a−2)では1〜50番目のラインプロファイルの1番目で作成した3次曲線のモデル曲線を、2番目、3番目・・・50番目のラインプロファイルで平均化処理した後の3次曲線のモデル曲線である。
3 and 4 are explanatory diagrams of the present invention.
FIG. 3A shows an example of a model curve. The illustrated model curve shows an example of a third-order model curve automatically generated in (a-1) or (a-2) of FIG. 2 described above. (A-1) in FIG. 2 is a model curve generated by approximating a curve near the edge of one (for example, the first) line profile in the 1st to 50th line profiles with a cubic curve. Further, in (a-2) of FIG. 2, the model curve of the cubic curve created at the first of the first to 50th line profiles is averaged with the second, third,..., 50th line profiles. It is a model curve of a later cubic curve.
以上のように、測長対象のパターンのラインプロファイルのエッジ付近からモデル曲線を生成することにより、画像上のラインプロファイルに最適なモデル曲線を動的かつ自動的に作成することが可能となる。 As described above, by generating a model curve from the vicinity of the edge of the line profile of the pattern to be measured, it is possible to dynamically and automatically create a model curve optimal for the line profile on the image.
図3の(b)は、マスク上のパターンを横切る異なる場所から複数のラインプロファイルを取得する様子を示す。ここでは、1番目から50番目までの50本のラインプロファイルを取得する。 FIG. 3B shows how a plurality of line profiles are acquired from different locations across the pattern on the mask. Here, 50 line profiles from the first to the 50th are acquired.
図3の(c)は、モデル曲線を1番目のラインプロファイルにエッジ付近でずらしながら輝度の差の絶対値の総和を求める様子を示す。 FIG. 3C shows a state in which the sum of absolute values of luminance differences is obtained while shifting the model curve to the first line profile near the edge.
図3の(d)は、1番目のラインプロファイルのフィット位置(フィッティングポイント)を算出した状態を示す。これは、図3の(c)で算出した総和が最小の位置を、フィッティングポイントして算出する。尚、計算を簡略化し、図3の(c)で、モデル曲線を1番目のラインプロファイルにエッジ付近でずらしながら輝度の差(あるいは輝度の絶対値の差)が最小となる位置を、フィッティングポイントして求めるようにしても良い。 FIG. 3D shows a state where the fitting position (fitting point) of the first line profile is calculated. This is calculated by using the fitting point as the position where the sum total calculated in FIG. Note that the calculation is simplified, and in FIG. 3C, the position at which the difference in luminance (or the difference in absolute value of luminance) is minimized while shifting the model curve to the first line profile near the edge is the fitting point. You may make it ask.
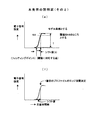
図4の(e)は、モデル曲線のシフト値を算出する様子を示す。モデル曲線は、図3の(a)でラインプロファイルから動的に自動作成したものであり、当該モデル曲線の閾値(例えば0.8、この値は実験で最適の値を算出)との交点と、当該モデル曲線の始点(最小値、フィッティングポイントに相当する位置)との距離をシフト値として算出する。 FIG. 4E shows how the shift value of the model curve is calculated. The model curve is dynamically created automatically from the line profile in FIG. 3A, and the intersection with the threshold of the model curve (for example, 0.8, which is an optimum value calculated by experiment) The distance from the start point (minimum value, position corresponding to the fitting point) of the model curve is calculated as a shift value.
図4の(f)は、1番目のプロファイルのエッジ位置決定の様子を示す。1番目のプロファイルのフィッティングポイントは、既述した図3の(d)で算出し、当該算出した1番目のラインプロファイルのフィッティングポイントに、図4の(e)で算出したモデル曲線のシフト値を加算し、エッジ位置を算出する。同様に、2番目から50番目のエッジ位置をそれぞれ算出する。そして、これら算出したエッジ位置の平均値を算出して当該パターンのエッジ位置と決定する。モデル曲線を固定とした場合に比較し、本発明の図2から図4でラインプロファイルから動的に3次曲線のモデル曲線を自動生成してエッジ位置を算出した実験では、測定再現精度が0.1nm程度(20%)改善された(図5参照)。 FIG. 4F shows how the edge position of the first profile is determined. The fitting point of the first profile is calculated in (d) of FIG. 3 described above, and the shift value of the model curve calculated in (e) of FIG. 4 is added to the calculated fitting point of the first line profile. Add the edge position to calculate the edge position. Similarly, the second to 50th edge positions are calculated. Then, the average value of the calculated edge positions is calculated and determined as the edge position of the pattern. Compared to the case where the model curve is fixed, the measurement reproduction accuracy is 0 in the experiment in which the edge position is calculated by automatically generating the model curve of the cubic curve dynamically from the line profile in FIGS. 2 to 4 of the present invention. It was improved by about 1 nm (20%) (see FIG. 5).
図5は、結果例を示す。横軸のThreshold(閾値)を変えたときの縦軸の3σ(偏差)の変化の様子を示す。横軸の閾値は、既述した図4の(e)のモデル曲線と交差する閾値の値を表し、偏差の3σは1番目から50番目のプロファイルについて求めたエッジ位置の公知の偏差(3σ)である。 FIG. 5 shows an example result. The state of change of 3σ (deviation) on the vertical axis when the threshold value on the horizontal axis is changed is shown. The threshold value on the horizontal axis represents the value of the threshold value that intersects the model curve of FIG. 4E described above, and the deviation 3σ is the known deviation (3σ) of the edge position obtained for the first to 50th profiles. It is.
図5の(a)は従来手法(モデル曲線が固定)の場合の例を示し、図5の(b)は本発明の図2から図4で説明した手法(モデル曲線を動的に算出)の場合の例を示す。両者を同じ条件で実験したものが図示のぞれぞれも曲線であり、図5の(b)の本発明の手法は測定再現精度(3σ)が良好で、0.1nm程度(20%)改善できた。 5A shows an example in the case of the conventional method (model curve is fixed), and FIG. 5B is the method described in FIGS. 2 to 4 of the present invention (model curve is dynamically calculated). An example of the case is shown. Each of the drawings is a curve obtained by experimenting under the same conditions. The method of the present invention shown in FIG. 5B has a good measurement reproducibility (3σ) and is about 0.1 nm (20%). I was able to improve.
本発明は、取得したラインプロファイルの1本あるいは複数本からモデル曲線を生成し、当該生成したモデル曲線とラインプロファイルのエッジ付近の曲線との差の絶対値が最小のフィッティングポイントを求め、これに所定閾値のときのシフト量を加算してエッジ位置と決定し、ラインプロファイルのエッジ部分のノイズなどの影響を極力排した高精度かつ再現性良好なエッジ位置を決定してパターンの精密測長を実現するエッジ検出方法およびエッジ検出装置に関するものである。 According to the present invention, a model curve is generated from one or a plurality of acquired line profiles, and a fitting point having a minimum absolute value of a difference between the generated model curve and a curve near the edge of the line profile is obtained. Accurate measurement of the pattern is performed by determining the edge position by adding the shift amount at the predetermined threshold and determining the edge position with high accuracy and good reproducibility, eliminating the influence of noise etc. of the edge part of the line profile as much as possible. The present invention relates to an edge detection method and an edge detection apparatus to be realized.
1:電子光学系
2:試料室
3:試料
11:PC(パソコン)
12:画像取得手段
13:シフト量算出手段
14:エッジ位置算出手段
15:画像ファイル
16:出力ファイル
17:表示装置
18:入出力装置
1: Electro-optical system 2: Sample chamber 3: Sample 11: PC (personal computer)
12: Image acquisition means 13: Shift amount calculation means 14: Edge position calculation means 15: Image file 16: Output file 17: Display device 18: Input / output device
Claims (5)
前記測長対象のパターンを横切る異なる場所の複数のラインプロファイルを取得するステップと、
前記取得したラインプロファイルのエッジ付近の曲線からモデル曲線を生成するステップと、
前記生成したモデル曲線と、前記複数のプロファイルとをそれぞれ重ねてその輝度の差をもとにフッティングポイントをそれぞれ算出するステップと、
前記算出したフッティングポイントに、前記モデル曲線が所定閾値を横切る点の位置を加算した点をエッジ位置とそれぞれ算出するステップと
を有することを特徴とするエッジ位置検出方法。 In an edge position detection method for detecting an edge position of a pattern to be measured on an image,
Obtaining a plurality of line profiles at different locations across the pattern to be measured;
Generating a model curve from a curve near the edge of the acquired line profile;
Calculating the footing points based on the difference in luminance by superimposing the generated model curve and the plurality of profiles, respectively;
An edge position detection method comprising: calculating a point obtained by adding a position of a point where the model curve crosses a predetermined threshold to the calculated footing point, and an edge position.
前記測長対象のパターンを横切る異なる場所の複数のラインプロファイルを取得する手段と、
前記取得したラインプロファイルのエッジ付近の曲線からモデル曲線を生成する手段と、
前記生成したモデル曲線と、前記複数のプロファイルとをそれぞれ重ねてその輝度の差をもとにフッティングポイントをそれぞれ算出する手段と、
前記算出したフッティングポイントに、前記モデル曲線が所定閾値を横切る点の位置を加算した点をエッジ位置とそれぞれ算出する手段と
を備えたことを特徴とするエッジ位置検出装置。 In an edge position detection device for detecting an edge position of a pattern on an image,
Means for acquiring a plurality of line profiles at different locations across the pattern to be measured;
Means for generating a model curve from a curve near an edge of the acquired line profile;
Means for calculating a footing point based on a difference in luminance by superimposing the generated model curve and the plurality of profiles, respectively;
An edge position detection apparatus comprising: a point obtained by adding a position of a point where the model curve crosses a predetermined threshold to the calculated footing point, and an edge position.
Priority Applications (1)
| Application Number | Priority Date | Filing Date | Title |
|---|---|---|---|
| JP2005377799A JP4783629B2 (en) | 2005-12-28 | 2005-12-28 | Edge detection method and edge detection apparatus |
Applications Claiming Priority (1)
| Application Number | Priority Date | Filing Date | Title |
|---|---|---|---|
| JP2005377799A JP4783629B2 (en) | 2005-12-28 | 2005-12-28 | Edge detection method and edge detection apparatus |
Publications (2)
| Publication Number | Publication Date |
|---|---|
| JP2007178294A true JP2007178294A (en) | 2007-07-12 |
| JP4783629B2 JP4783629B2 (en) | 2011-09-28 |
Family
ID=38303626
Family Applications (1)
| Application Number | Title | Priority Date | Filing Date |
|---|---|---|---|
| JP2005377799A Expired - Fee Related JP4783629B2 (en) | 2005-12-28 | 2005-12-28 | Edge detection method and edge detection apparatus |
Country Status (1)
| Country | Link |
|---|---|
| JP (1) | JP4783629B2 (en) |
Cited By (2)
| Publication number | Priority date | Publication date | Assignee | Title |
|---|---|---|---|---|
| CN102252616A (en) * | 2011-03-17 | 2011-11-23 | 上海亚尚电子科技有限公司 | Integrated circuit detection-orientated computer auxiliary management device and method and system |
| JP2013037009A (en) * | 2012-10-05 | 2013-02-21 | Horon:Kk | Contour line extraction method, contour line extraction program and area measuring method |
Citations (5)
| Publication number | Priority date | Publication date | Assignee | Title |
|---|---|---|---|---|
| JPH08111599A (en) * | 1994-10-11 | 1996-04-30 | Fujitsu Ltd | Aligning method and device |
| JP2002310618A (en) * | 2001-04-19 | 2002-10-23 | Murata Mfg Co Ltd | Size measurement device, size measurement method and inspection device for electronic component |
| JP2003100828A (en) * | 2001-09-27 | 2003-04-04 | Toshiba Corp | Micro pattern inspecting method and system, cd-sem device managing method and system and program and computer readable recording medium |
| JP2003178314A (en) * | 2001-09-26 | 2003-06-27 | Toshiba Corp | Pattern evaluation device, pattern evaluation method and program |
| JP2005228560A (en) * | 2004-02-12 | 2005-08-25 | Toshiba Corp | Image processing method and image processing apparatus |
-
2005
- 2005-12-28 JP JP2005377799A patent/JP4783629B2/en not_active Expired - Fee Related
Patent Citations (5)
| Publication number | Priority date | Publication date | Assignee | Title |
|---|---|---|---|---|
| JPH08111599A (en) * | 1994-10-11 | 1996-04-30 | Fujitsu Ltd | Aligning method and device |
| JP2002310618A (en) * | 2001-04-19 | 2002-10-23 | Murata Mfg Co Ltd | Size measurement device, size measurement method and inspection device for electronic component |
| JP2003178314A (en) * | 2001-09-26 | 2003-06-27 | Toshiba Corp | Pattern evaluation device, pattern evaluation method and program |
| JP2003100828A (en) * | 2001-09-27 | 2003-04-04 | Toshiba Corp | Micro pattern inspecting method and system, cd-sem device managing method and system and program and computer readable recording medium |
| JP2005228560A (en) * | 2004-02-12 | 2005-08-25 | Toshiba Corp | Image processing method and image processing apparatus |
Cited By (2)
| Publication number | Priority date | Publication date | Assignee | Title |
|---|---|---|---|---|
| CN102252616A (en) * | 2011-03-17 | 2011-11-23 | 上海亚尚电子科技有限公司 | Integrated circuit detection-orientated computer auxiliary management device and method and system |
| JP2013037009A (en) * | 2012-10-05 | 2013-02-21 | Horon:Kk | Contour line extraction method, contour line extraction program and area measuring method |
Also Published As
| Publication number | Publication date |
|---|---|
| JP4783629B2 (en) | 2011-09-28 |
Similar Documents
| Publication | Publication Date | Title |
|---|---|---|
| JP5103219B2 (en) | Pattern dimension measurement method | |
| JP5319931B2 (en) | Electron microscope system and pattern dimension measuring method using the same | |
| US8330104B2 (en) | Pattern measurement apparatus and pattern measurement method | |
| US7145156B2 (en) | Image processing method, image processing apparatus and semiconductor manufacturing method | |
| US7408154B2 (en) | Scanning electron microscope, method for measuring a dimension of a pattern using the same, and apparatus for correcting difference between scanning electron microscopes | |
| WO2017179138A1 (en) | Pattern measurement device and pattern measurement method | |
| JP4585822B2 (en) | Dimension measuring method and apparatus | |
| JP5066252B2 (en) | Pattern length measuring device and pattern length measuring method | |
| JP2005322423A (en) | Electron microscope, its system, and dimension measuring method using them | |
| WO2010061516A1 (en) | Image formation method and image formation device | |
| JP2019039884A (en) | Pattern measuring method, and pattern measurement device | |
| JP2020521325A (en) | Measuring height differences in patterns on semiconductor wafers | |
| JP3893539B2 (en) | Shape measuring method and apparatus | |
| JP4783629B2 (en) | Edge detection method and edge detection apparatus | |
| JP6088337B2 (en) | Pattern inspection method and pattern inspection apparatus | |
| JP3959379B2 (en) | Shape measuring apparatus and shape measuring method | |
| JP2011180066A (en) | Image comparison method and image comparison program | |
| WO2012120576A1 (en) | Scanning electron microscope | |
| JP2013200319A (en) | Electron microscope system and pattern dimension measuring method using the same | |
| JP2009014519A (en) | Area measuring method and area measuring program | |
| JP6207893B2 (en) | Template creation device for sample observation equipment | |
| JP2007192752A (en) | Method and apparatus for edge detection | |
| US20070284525A1 (en) | Line-width measurement adjusting method and scanning electron microscope | |
| JP2007163417A (en) | Image position measuring method and image position measuring instrument | |
| JPH07122574B2 (en) | Cross-sectional shape measurement method |
Legal Events
| Date | Code | Title | Description |
|---|---|---|---|
| A621 | Written request for application examination |
Free format text: JAPANESE INTERMEDIATE CODE: A621 Effective date: 20081203 |
|
| A977 | Report on retrieval |
Free format text: JAPANESE INTERMEDIATE CODE: A971007 Effective date: 20101001 |
|
| A131 | Notification of reasons for refusal |
Free format text: JAPANESE INTERMEDIATE CODE: A131 Effective date: 20101019 |
|
| A521 | Request for written amendment filed |
Free format text: JAPANESE INTERMEDIATE CODE: A523 Effective date: 20101218 |
|
| A131 | Notification of reasons for refusal |
Free format text: JAPANESE INTERMEDIATE CODE: A131 Effective date: 20110419 |
|
| A521 | Request for written amendment filed |
Free format text: JAPANESE INTERMEDIATE CODE: A523 Effective date: 20110610 |
|
| TRDD | Decision of grant or rejection written | ||
| A01 | Written decision to grant a patent or to grant a registration (utility model) |
Free format text: JAPANESE INTERMEDIATE CODE: A01 Effective date: 20110705 |
|
| A01 | Written decision to grant a patent or to grant a registration (utility model) |
Free format text: JAPANESE INTERMEDIATE CODE: A01 |
|
| A61 | First payment of annual fees (during grant procedure) |
Free format text: JAPANESE INTERMEDIATE CODE: A61 Effective date: 20110711 |
|
| FPAY | Renewal fee payment (event date is renewal date of database) |
Free format text: PAYMENT UNTIL: 20140715 Year of fee payment: 3 |
|
| R150 | Certificate of patent or registration of utility model |
Free format text: JAPANESE INTERMEDIATE CODE: R150 |
|
| R250 | Receipt of annual fees |
Free format text: JAPANESE INTERMEDIATE CODE: R250 |
|
| LAPS | Cancellation because of no payment of annual fees |