JP2005116626A - Position detector, position detecting method, and exposure system - Google Patents
Position detector, position detecting method, and exposure system Download PDFInfo
- Publication number
- JP2005116626A JP2005116626A JP2003345890A JP2003345890A JP2005116626A JP 2005116626 A JP2005116626 A JP 2005116626A JP 2003345890 A JP2003345890 A JP 2003345890A JP 2003345890 A JP2003345890 A JP 2003345890A JP 2005116626 A JP2005116626 A JP 2005116626A
- Authority
- JP
- Japan
- Prior art keywords
- image
- mark
- energy distribution
- correlation
- distribution
- Prior art date
- Legal status (The legal status is an assumption and is not a legal conclusion. Google has not performed a legal analysis and makes no representation as to the accuracy of the status listed.)
- Withdrawn
Links
Images


Classifications
-
- G—PHYSICS
- G06—COMPUTING; CALCULATING OR COUNTING
- G06T—IMAGE DATA PROCESSING OR GENERATION, IN GENERAL
- G06T7/00—Image analysis
- G06T7/70—Determining position or orientation of objects or cameras
- G06T7/73—Determining position or orientation of objects or cameras using feature-based methods
-
- G—PHYSICS
- G06—COMPUTING; CALCULATING OR COUNTING
- G06V—IMAGE OR VIDEO RECOGNITION OR UNDERSTANDING
- G06V10/00—Arrangements for image or video recognition or understanding
- G06V10/20—Image preprocessing
- G06V10/25—Determination of region of interest [ROI] or a volume of interest [VOI]
-
- G—PHYSICS
- G06—COMPUTING; CALCULATING OR COUNTING
- G06V—IMAGE OR VIDEO RECOGNITION OR UNDERSTANDING
- G06V10/00—Arrangements for image or video recognition or understanding
- G06V10/40—Extraction of image or video features
- G06V10/42—Global feature extraction by analysis of the whole pattern, e.g. using frequency domain transformations or autocorrelation
- G06V10/431—Frequency domain transformation; Autocorrelation
Abstract
Description
本発明は、パターン位置を検出する技術に関する。また、本発明は、特にデジタル画像を用いたパターン位置の検出技術に関し、例えば、生産ラインにおける半導体製造装置などにおいて、パターン位置を画像処理技術やパターン認識技術を用いて検出する技術に関する。 The present invention relates to a technique for detecting a pattern position. The present invention also relates to a technique for detecting a pattern position using a digital image, and more particularly to a technique for detecting a pattern position using an image processing technique or a pattern recognition technique in a semiconductor manufacturing apparatus in a production line.
半導体製造装置においては、ウェハ上にレチクルパターンを投影露光する前に、ウェハとレチクルの位置合わせが行われる。この位置合わせを行うには、通常、CCDカメラなどの画像入力装置を用いてウェハ上のマークを中心としたデジタル画像(以下、観測画像とする)を半導体製造装置に取り込み、パターン認識技術を用いて観測画像中でのマークの位置を検出する。検出の手順は、まず観測画像全体から大まかな位置を絞り、次に絞り込んだ領域から精密な位置を検出するという2つに分けられる。 In the semiconductor manufacturing apparatus, the wafer and the reticle are aligned before the reticle pattern is projected and exposed on the wafer. In order to perform this alignment, a digital image centered on a mark on the wafer (hereinafter referred to as an observation image) is usually taken into a semiconductor manufacturing device using an image input device such as a CCD camera, and pattern recognition technology is used. The position of the mark in the observation image is detected. The detection procedure is divided into two steps: first, a rough position is narrowed down from the entire observation image, and then a precise position is detected from the narrowed down area.
本願発明では、特に上記検出の手順のうち、観測画像全体から大まかな位置(以下、マーク位置検出とする)を絞ることを対象としている。 In the present invention, in particular, in the detection procedure described above, an object is to narrow down a rough position (hereinafter referred to as mark position detection) from the entire observation image.
通常、このマーク位置検出にはパターン認識技術が用いられる。そして、このパターン認識技術を用いて観測画像の各位置においる評価値を算出し、最大の評価値をもつ位置をマーク位置としている。 Usually, a pattern recognition technique is used for this mark position detection. Then, an evaluation value at each position of the observation image is calculated using this pattern recognition technique, and a position having the maximum evaluation value is set as a mark position.
従来から用いられているパターン認識技術には、(i)マークのエッジ情報をテンプレートとして注目位置の近傍画像(以下、部分画像とする)の相関度を算出するベクトル相関法(例えば、特許文献1参照)、(ii)設計したマークの画像と観測画像の輝度値を用いた相互相関法、(iii)設計したマークの画像をフーリエ変換しその位相成分のみを逆フーリエ変換して得られた画像(以下、フーリエ位相画像)と観測画像のフーリエ位相画像を用いた相互相関法(以下、フーリエ位相相関法とする)などがある。 Conventional pattern recognition techniques include (i) a vector correlation method that calculates the degree of correlation of an image near a target position (hereinafter referred to as a partial image) using mark edge information as a template (for example, Patent Document 1). (Ii) Cross-correlation method using designed mark image and observed image brightness value, (iii) Image obtained by Fourier transform of designed mark image and inverse Fourier transform of only its phase component (Hereinafter referred to as a Fourier phase image) and a cross-correlation method using a Fourier phase image of an observation image (hereinafter referred to as a Fourier phase correlation method).
(i)〜(iii)のようなパターン認識技術を用いてマーク位置検出を行う場合、観測画像の様々な画質劣化によって検出率は大きく低下する。半導体製造装置では同じパターンをウェハ上に露光するため観測画像として同じ画像が取り込まれるはずである。しかし、プロセスの変動、照明条件などにより1)観測画像毎に各部分画像の平均輝度が異なる場合、2)マーク信号の振幅とノイズ信号の振幅の差が少なくなる場合がある。 When mark position detection is performed using pattern recognition techniques such as (i) to (iii), the detection rate is greatly reduced due to various image quality degradations of the observed image. In the semiconductor manufacturing apparatus, since the same pattern is exposed on the wafer, the same image should be captured as an observation image. However, 1) When the average luminance of each partial image differs for each observed image due to process variations, illumination conditions, etc. 2) The difference between the amplitude of the mark signal and the amplitude of the noise signal may be reduced.
そこで、従来技術の原理的な強み・弱みを踏まえた上で、上記1)、2)の画質劣化にロバスト性があるか否かを以下に述べる。 Therefore, based on the principle strengths and weaknesses of the prior art, whether or not the image quality degradation in 1) and 2) is robust will be described below.
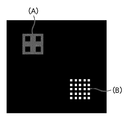
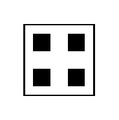
まず、ベクトル相関法の原理的な強みは、部分画像中の決められた位置でのエッジの強弱を正規化して相関度を算出しているため、部分画像の平均輝度に左右されにくいテンプレートの形状認識を行えることである。例えば、図10に示すように、平均輝度aの画像(A)と画像(A)のコントラストを変化させた平均輝度bの画像(B)に対して、テンプレート画像(T)を用いて相関度を算出すると画像(A)も画像(B)も同じ値になる。図11(A)、(B)に部分画像の例を示す。図12は、図11の部分画像(A)と図11の部分画像(B)のコントラストを低くして平均輝度を下げた部分画像を含む観測画像の例である。また、図13は、図11の部分画像(A)のコントラストを低くして平均輝度を下げた部分画像と図11の部分画像(B)を含む観測画像の例である。この図12、13に図14のテンプレート画像を用いて相関度を算出すると、図12の部分画像(A)と図13の部分画像(A)の値、及び、図12の部分画像(B)と図13の部分画像(B)の値は同じ値になる。このことから、ベクトル相関法では、上記1)観測画像毎に各部分画像の平均輝度が異なる場合であっても同じ形状であれば安定して同じ相関度を算出できる。 First, the principle strength of the vector correlation method is to calculate the degree of correlation by normalizing the strength of the edge at a predetermined position in the partial image, so the shape of the template is less sensitive to the average brightness of the partial image. It can be recognized. For example, as shown in FIG. 10, a template image (T) is used to correlate an image (B) with an average luminance a and an image (B) with an average luminance b in which the contrast of the image (A) is changed. As a result, image (A) and image (B) have the same value. FIGS. 11A and 11B show examples of partial images. FIG. 12 is an example of an observation image including a partial image in which the contrast between the partial image (A) in FIG. 11 and the partial image (B) in FIG. 11 is lowered to lower the average luminance. FIG. 13 is an example of an observation image including a partial image in which the contrast of the partial image (A) in FIG. 11 is lowered to lower the average luminance and the partial image (B) in FIG. When the correlation degree is calculated using the template image of FIG. 14 in FIGS. 12 and 13, the values of the partial image (A) in FIG. 12 and the partial image (A) in FIG. 13 and the partial image (B) in FIG. And the partial image (B) in FIG. 13 have the same value. From this, in the vector correlation method, even if the average luminance of each partial image differs for each of the above-mentioned 1) observation images, the same correlation can be stably calculated as long as the shape is the same.
次に、ベクトル相関法の原理的な弱みは、マークのエッジ位置を予め複数点だけ決めておき部分画像の相関度を算出するために、決めた点の位置以外にもエッジが存在するような部分画像をマークと誤る場合があることである。例えば、図15ではテンプレート画像(T)の1,2,3,4の位置でのエッジ情報を用いて部分画像(S)の相関度を算出しており、部分画像(S)とマーク画像の相関度が同じになる。また、上記2)マーク信号の振幅とノイズ信号の振幅の差が少なくなる場合には、マークのエッジ情報とノイズ部のエッジ情報の差が無くなり誤検出する場合があることである。例えば、図15のテンプレート画像(T)の1,2,3,4の位置でのエッジ情報を用いた場合、図16ではマーク画像(M)とノイズ画像(N)の相関度の差はほとんどない。
Next, the principle weakness of the vector correlation method is that there are edges other than the determined point positions in order to calculate the degree of correlation of partial images by determining a plurality of mark edge positions in advance. The partial image may be mistaken as a mark. For example, in FIG. 15, the degree of correlation between the partial image (S) and the mark image is calculated using edge information at
相互相関法やフーリエ位相相関法の原理的な強みは、部分画像全体の輝度情報を用いて相関度を算出しているため、テンプレート画像のみが存在する部分画像の相関度はテンプレート画像とテンプレート画像には無い部分が同時に存在する部分画像の相関度よりも高くなり区別できることである。例えば、図15ではテンプレート画像(T)を用いた場合、部分画像(S)の相関度よりもマーク画像の相関度の方が高くなる。 The principle strength of the cross-correlation method and the Fourier phase correlation method is to calculate the degree of correlation using the luminance information of the entire partial image. Therefore, the degree of correlation between the partial image where only the template image exists is the template image and the template image. This means that the degree of correlation is higher than the degree of correlation of partial images in which parts that are not present simultaneously exist. For example, in FIG. 15, when the template image (T) is used, the correlation degree of the mark image is higher than the correlation degree of the partial image (S).
しかしながら、相互相関法やフーリエ位相相関法の原理的な弱みは、部分画像の輝度の強弱を用いて相関度を算出しているため、部分画像毎の平均輝度に相関度が左右されることである。例えば、テンプレート画像に図14を用いた場合、図12の観測画像では輝度平均の高い部分画像(A)の相関度が輝度平均の低い部分画像(B)の相関度よりも高く、図13の観測画像では輝度平均の高い部分画像(B)の相関度が輝度平均の低い部分画像(A)の相関度よりも高くなる場合がある。このことから、上記1)観測画像毎に各部分画像の平均輝度が異なる場合には誤検出する場合がある。また、上記2)マーク信号の振幅とノイズ信号の振幅の差が少なくなる場合には、マーク画像とノイズ画像の差が小さくなり、しかも、マーク画像の平均輝度とノイズ画像の平均輝度が近くなるために、誤検出する場合がある。例えば、図15のテンプレート画像(T)を用いた場合、図16ではマーク画像(M)とノイズ画像(N)の相関度の差はほとんどない。
上記のような原理的な弱みにより、以下の課題がある。
(i)のベクトル相関法では、
(A)予め複数点だけ決めた点位置以外にもエッジが存在するような部分画像をマークと誤検出する場合がある。
(ii)の相互相関法や(iii)のフーリエ位相相関法では、
(B)マーク画像の平均輝度がその他の部分の平均輝度よりも低いときに誤検出する場合がある。
(C)また、ベクトル相関法、相互相関法、フーリエ位相相関法の共通の課題として、観測画像のノイズ量が多い場合、マークと他の部分の評価値差が小さくなり誤検出する場合がある。
Due to the above-mentioned fundamental weaknesses, there are the following problems.
In the vector correlation method of (i),
(A) In some cases, a partial image in which an edge exists in addition to a point position determined only in advance is erroneously detected as a mark.
In the cross correlation method (ii) and the Fourier phase correlation method (iii),
(B) A false detection may occur when the average brightness of the mark image is lower than the average brightness of other portions.
(C) Also, a common problem with the vector correlation method, cross-correlation method, and Fourier phase correlation method is that when there is a large amount of noise in the observed image, the evaluation value difference between the mark and other parts may become small, resulting in false detection. .
本発明は、上記従来のパターン認識技術の原理的な弱みを解決し、マークの誤検出を低減することを目的とする。 An object of the present invention is to solve the fundamental weaknesses of the above-described conventional pattern recognition technology and to reduce erroneous mark detection.
上述した課題を解決するため、本発明は従来技術の強みを活かしつつ弱みを補うことを行った。即ち、
相互相関法やフーリエ位相相関法は部分画像全体の位置での輝度情報を用いていることが強みであり、ベクトル相関法は用いる情報の位置を限定していることが弱みとなっている。そこで、まず、部分画像全体の位置での輝度情報を用いることとした。
In order to solve the above-described problems, the present invention compensates for the weaknesses while taking advantage of the strengths of the prior art. That is,
The cross-correlation method and the Fourier phase correlation method have the advantage of using luminance information at the position of the entire partial image, and the vector correlation method has a weakness in that the position of information to be used is limited. Therefore, first, luminance information at the position of the entire partial image is used.
次に、ベクトル相関法は、部分画像の平均輝度に左右されない形状認識ができることが強みであり、相互相関法やフーリエ位相相関法は、部分画像毎の平均輝度に相関度が左右されることが弱みとなっている。そこで、部分画像全体の位置での輝度情報を用いて、平均輝度に左右されずに、部分画像に含まれる周期的パターンが現れる位置とその強さを定量的に評価できる特徴空間を生成することとした。 Next, the vector correlation method has the advantage of being able to recognize the shape independent of the average luminance of the partial images, and the cross correlation method and the Fourier phase correlation method can affect the degree of correlation depending on the average luminance of each partial image. It is a weakness. Therefore, using the luminance information at the position of the entire partial image, to generate a feature space that can quantitatively evaluate the position and strength of the periodic pattern included in the partial image, regardless of the average luminance. It was.
具体的には、次の3点を実現した。
(i)部分画像全体の位置での輝度情報を用いる。
(ii)、(i)の輝度情報を用いて、部分画像に含まれる周期的パターンが現れる位置とその強さを定量的に評価できる特徴空間を生成する。
Specifically, the following three points were realized.
(I) Luminance information at the position of the entire partial image is used.
Using the luminance information of (ii) and (i), a feature space that can quantitatively evaluate the position and strength of the periodic pattern included in the partial image is generated.
これにより、繰り返し出現する図形が部分画像に存在する場合、その図形がある位置でどれくらいの確率で出現するかを部分画像毎に把握できる。 Thereby, when a figure that repeatedly appears in a partial image, it is possible to grasp for each partial image how much the figure appears at a certain position.
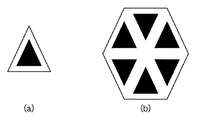
例えば、図1(a)の図形で構成される図1(b)の部分画像に上記(i)、(ii)を実行すると図1(c)の特徴空間が生成される。図1(c)のX軸、Y軸は、部分画像の座標位置に相当する。また、図1(c)のZ軸は、図形の出現確率である。図1(b)のA点には図1(a)の図形が4個接している、B点には2個接している、C点には1個接している。この接している個数に相当する尺度に、図1(c)の特徴空間ではZ軸の大きさを用いている。図1(b)のA,B,Cの各位置に相当する位置でのZ軸の大きさ(確率)は、A点の確率>B点の確率>C点の確率となっており、接している個数の大きさの順番を保っている。
(iii)更に、(ii)の特徴空間を確率の最大値と最小値を用いて正規化する。
For example, when the above (i) and (ii) are executed on the partial image shown in FIG. 1 (b) composed of the graphic shown in FIG. 1 (a), the feature space shown in FIG. 1 (c) is generated. The X axis and Y axis in FIG. 1C correspond to the coordinate positions of the partial images. In addition, the Z axis in FIG. 1C is the appearance probability of a figure. In FIG. 1B, four points of FIG. 1A are in contact with point A, two points are in contact with point B, and one point is in contact with point C. In the feature space of FIG. 1 (c), the size of the Z axis is used as a scale corresponding to the number in contact. The size (probability) of the Z axis at the positions corresponding to the positions A, B, and C in FIG. 1B is the probability of point A> probability of point B> probability of point C. The order of the size of the number is kept.
(Iii) Furthermore, the feature space of (ii) is normalized using the maximum value and the minimum value of probability.
これにより、部分画像毎の輝度変化に左右されない特徴空間を実現できる。 Thereby, the feature space which is not influenced by the luminance change for every partial image is realizable.
そこで、本発明では、上記(i)、(ii)、(iii)を実現するために以下を実行した。
ステップ1:マークは同一の小図形で構成されるものとする(図1(b)や図2(b)など)。
ステップ2:フーリエ変換などの直交変換を用いて、マーク画像中の周期的パターンの繰り返し位置とその位置での周期性の強さ(以下、確率分布とする)を求め、強さの最大値と最小値を用いて正規化する。
ステップ3:観測画像中の部分画像毎にステップ2を実行する。
ステップ4:ステップ2で求めたマークの確率分布における特徴のある位置を求める。
ステップ5:ステップ4で求めた位置におけるマークの確率分布の成分及びステップ4で求めた位置における部分画像の確率分布の成分同士の相関度を求める。この操作を全ての部分画像に行う。
ステップ6:ステップ5で求めた相関度が最大の部分画像の位置をマーク位置とする。
Therefore, in the present invention, in order to realize the above (i), (ii), and (iii), the following is executed.
Step 1: Marks are assumed to be composed of the same small figure (FIG. 1 (b), FIG. 2 (b), etc.).
Step 2: Using orthogonal transform such as Fourier transform, the repetition position of the periodic pattern in the mark image and the strength of periodicity at that position (hereinafter referred to as probability distribution) are obtained, and the maximum strength value Normalize using the minimum value.
Step 3:
Step 4: A characteristic position in the probability distribution of the mark obtained in
Step 5: The degree of correlation between the component of the probability distribution of the mark at the position obtained in Step 4 and the component of the probability distribution of the partial image at the position obtained in Step 4 is obtained. This operation is performed on all partial images.
Step 6: The position of the partial image having the maximum correlation obtained in Step 5 is set as the mark position.
[作用及び効果]
図9は、上段に部分画像を他段にその確率分布を示した例である。画像サイズはMxM画素、確率分布のX軸、Y軸は確率変数を、Z軸は確率を示している。
[Action and effect]
FIG. 9 is an example in which the partial image is shown in the upper stage and the probability distribution is shown in the other stage. The image size is MxM pixels, the X-axis and Y-axis of the probability distribution are random variables, and the Z-axis is the probability.
A1は、理想的なマーク画像とその確率分布である。A2,A3は、実際にCCDカメラから取り込んだマーク画像とその確率分布である。B1,B2は、実際にCCDカメラから取り込んだノイズの多い背景画像とその確率分布である。Cは、実際にCCDカメラから取り込んだ周期的パターンの多い画像とその確率分布である。D,Eは、実際にCCDカメラから取り込んだ画像とその確率分布である。 A1 is an ideal mark image and its probability distribution. A2 and A3 are mark images actually taken from the CCD camera and their probability distributions. B1 and B2 are the noisy background images actually captured from the CCD camera and their probability distributions. C is an image with many periodic patterns actually captured from a CCD camera and its probability distribution. D and E are images actually taken from the CCD camera and their probability distributions.
図9には示していないが、画像のコントラストが変化しても上記画像の確率分布に変化はない。また、画像の平均輝度が変化しても上記画像の確率分布に変化はない。これにより、従来のパターン認識技術(ii)、(iii)の課題(B)を解決できた。 Although not shown in FIG. 9, even if the contrast of the image changes, the probability distribution of the image does not change. Even if the average luminance of the image changes, the probability distribution of the image does not change. Thereby, the problem (B) of the conventional pattern recognition techniques (ii) and (iii) could be solved.
次に、図9ではA1の確率分布と相関の高いA2,A3の確率分布がマークであると判定できる。更に、A1の確率分布とマーク以外の確率分布との相関はA2,A3に比べて非常に低くなり、マーク画像の相関度と他部画像の相関度の差を明確に出来た。これにより、従来のパターン認識技術の課題(A),(C)を解決できた。 Next, in FIG. 9, it can be determined that the probability distributions A2 and A3 having a high correlation with the probability distribution A1 are marks. Furthermore, the correlation between the probability distribution of A1 and the probability distribution other than the mark is much lower than that of A2 and A3, and the difference between the correlation degree of the mark image and the correlation degree of the other images could be clarified. As a result, the problems (A) and (C) of the conventional pattern recognition technology were solved.
よって、劣化画像に対してもロバストなパターン認識を行え、マークの誤検出率の低減につながった。例えば、半導体製造装置では、マーク検出の失敗による装置停止も減少し、装置稼働率と生産性の向上につながった。 Therefore, robust pattern recognition can be performed even for degraded images, leading to a reduction in mark false detection rate. For example, in semiconductor manufacturing equipment, equipment stoppage due to mark detection failure has decreased, leading to improvements in equipment availability and productivity.
本発明の実施態様の例を以下に列挙する。 Examples of embodiments of the present invention are listed below.
[実施態様1]
複数個の同一図形から構成されるマークを画像として取り込む画像取り込み手段と、前記画像中の部分画像領域毎に、前記マークを構成する前記図形が所定の位置に存在する確率を算出する算出手段と、前記算出手段により算出される確率の二次元的な配置における最大値を示す位置をマーク位置とする位置検出手段とを有することを特徴とする。
[Embodiment 1]
Image capturing means for capturing a mark composed of a plurality of identical figures as an image; and calculating means for calculating a probability that the figure constituting the mark exists at a predetermined position for each partial image area in the image; , And a position detection unit that uses a position indicating the maximum value in the two-dimensional arrangement of the probabilities calculated by the calculation unit as a mark position.
[実施態様2]
上記実施態様1において、前記算出手段は、前記部分画像領域内に存在する周期的パターンの位置及びその位置でどの程度の確率で周期的パターンが存在するかを示した確率分布と、検出したいマーク画像の確率分布同士の相関度とを算出することにより前記確率を得ることを特徴とする。
[Embodiment 2]
In the first embodiment, the calculation means includes a probability distribution indicating a position of the periodic pattern existing in the partial image region and a probability of the periodic pattern existing at the position, and a mark to be detected. The probability is obtained by calculating the degree of correlation between probability distributions of images.
[実施態様3]
上記実施態様2において、前記算出手段は、特定成分同士の相関値、或いは、確率分布のパワースペクトラムにおける特定成分同士の相関値、或いは、確率分布若しくは確率分布のパワースペクトラムの特定成分の寄与率同士の相関値を算出することにより前記確率分布同士の相関度を得ることを特徴とする。
[Embodiment 3]
In the second embodiment, the calculating means calculates correlation values between specific components, correlation values between specific components in the power spectrum of the probability distribution, or contribution rates of specific components in the probability distribution or the power spectrum of the probability distribution. The degree of correlation between the probability distributions is obtained by calculating the correlation value.
[実施態様4]
上記実施態様2において、前記算出手段は、部分画像を直交変換をすることで得られる周波数領域のエネルギー分布を算出する第1のエネルギー分布算出手段と、前記第1のエネルギー分布算出手段により得られる周波数領域のエネルギー分布を当該第1のエネルギー分布算出手段で用いた直交変換の逆変換をすることで得られる実空間のエネルギー分布を算出する第2のエネルギー分布算出手段とを有することを特徴とする。
[Embodiment 4]
In the second embodiment, the calculation unit is obtained by a first energy distribution calculation unit that calculates an energy distribution in a frequency domain obtained by orthogonally transforming a partial image, and the first energy distribution calculation unit. And a second energy distribution calculating means for calculating an energy distribution in the real space obtained by performing an inverse transformation of the orthogonal transformation used for the energy distribution in the frequency domain by the first energy distribution calculating means. To do.
[実施態様5]
上記実施態様4において、前記周波数領域のエネルギー分布は、離散フーリエ変換、離散ウェーヴレット変換、2次元離散コサイン変換、2次元離散サイン変換の少なくとも1つを用いて算出されることを特徴とする。
[Embodiment 5]
In the fourth embodiment, the frequency domain energy distribution is calculated using at least one of discrete Fourier transform, discrete wavelet transform, two-dimensional discrete cosine transform, and two-dimensional discrete sine transform.
[実施態様6]
上記実施態様4において、前記実空間のエネルギー分布は、離散逆フーリエ変換、離散逆ウェーヴレット変換、2次元離散逆コサイン変換、2次元逆離散サイン変換の少なくとも1つを用いて算出されることを特徴とする。
[Embodiment 6]
In the embodiment 4, the energy distribution in the real space is calculated using at least one of discrete inverse Fourier transform, discrete inverse wavelet transform, two-dimensional discrete inverse cosine transform, and two-dimensional inverse discrete sine transform. Features.
[実施態様7]
上記実施態様4において、前記周波数領域のエネルギー分布は、最大値及び最小値で正規化されていることを特徴とする。
[Embodiment 7]
In the fourth embodiment, the energy distribution in the frequency domain is normalized with a maximum value and a minimum value.
[実施態様8]
上記実施態様4において、前記実空間のエネルギー分布は、最大値及び最小値で正規化されていることを特徴とする。
[Embodiment 8]
In the fourth embodiment, the energy distribution in the real space is normalized by a maximum value and a minimum value.
[実施態様9]
上記実施態様3において、前記特定成分は、テンプレート用マークの画像における確率分布、或いは、確率分布のパワースペクトラム、或いは、確率分布若しくは確率分布のパワースペクトラムの特徴を示す位置の値を要素としたベクトルであることを特徴とする。
[Embodiment 9]
In the third embodiment, the specific component is a probability distribution in the template mark image, or a power spectrum of the probability distribution, or a vector whose element is a position value indicating the characteristics of the probability distribution or the power spectrum of the probability distribution. It is characterized by being.
[実施態様10]
複数個の同一図形から構成されるマークを画像として取り込む画像取り込み工程と、前記画像中の部分画像領域毎に、前記マークを構成する前記図形が所定の位置に存在する確率を算出する算出工程と、前記算出工程における確率の二次元的な配置における最大値を示す位置をマーク検出位置とする位置検出工程とを有することを特徴とする。
[Embodiment 10]
An image capturing step for capturing a mark composed of a plurality of identical figures as an image, and a calculation step for calculating a probability that the figure constituting the mark exists at a predetermined position for each partial image area in the image; And a position detecting step in which the position indicating the maximum value in the two-dimensional arrangement of the probabilities in the calculating step is a mark detecting position.
[実施態様11]
対象物上に形成されたマークを撮像する撮像手段と、前記撮像手段により得られた前記マークの画像の部分画像を直交変換することにより周波数空間におけるエネルギー分布を得、該エネルギー分布を逆直交変換することにより実空間におけるエネルギー分布を得る第1算出手段と、前記算出手段により得られたエネルギー分布と、予め得られた前記マークのエネルギー分布との相関度を算出する第2算出手段とを有することを特徴とする。
[Embodiment 11]
An energy distribution in the frequency space is obtained by orthogonally transforming the imaging means for imaging the mark formed on the object and a partial image of the image of the mark obtained by the imaging means, and the energy distribution is inversely orthogonal transformed. First calculating means for obtaining an energy distribution in real space, and second calculating means for calculating a correlation between the energy distribution obtained by the calculating means and the energy distribution of the mark obtained in advance. It is characterized by that.
[実施態様12]
上記実施態様11において、前記第2算出手段は、前記相関度を算出する対象となる各エネルギー分布のパワースペクトルに基づいて前記相関度を算出することを特徴とする。
[Embodiment 12]
In the
[実施態様13]
上記実施態様12において、前記第2算出手段は、前記相関度を算出する対象となる各エネルギー分布を各要素値の和により正規化して得られる各分布に基づいて前記相関度を算出することを特徴とする。
[Embodiment 13]
In the twelfth embodiment, the second calculation means calculates the correlation degree based on each distribution obtained by normalizing each energy distribution for which the correlation degree is calculated by a sum of element values. Features.
[実施態様14]
上記実施態様11乃至13のいずれかの位置検出装置を含むことを特徴とする露光装置。
[Embodiment 14]
An exposure apparatus comprising the position detection device according to any one of the
[実施態様15]
対象物上に形成されたマークを撮像する撮像工程と、前記撮像工程において得られた前記マークの画像の部分画像を直交変換することにより周波数空間におけるエネルギー分布を得、該エネルギー分布を逆直交変換することにより実空間におけるエネルギー分布を得る第1算出工程と、前記第1算出工程において得られたエネルギー分布と、予め得られた前記マークのエネルギー分布との相関度を算出する第2算出工程とを有することを特徴とする。
[Embodiment 15]
An energy distribution in the frequency space is obtained by orthogonally transforming an imaging process for imaging the mark formed on the object and a partial image of the image of the mark obtained in the imaging process, and the energy distribution is inversely orthogonal transformed. A first calculation step of obtaining an energy distribution in real space by performing a second calculation step of calculating a degree of correlation between the energy distribution obtained in the first calculation step and the energy distribution of the mark obtained in advance. It is characterized by having.
以上説明したように、本発明によれば、上記従来のパターン認識技術の原理的な弱みを解決し、マークの誤検出を低減できる。 As described above, according to the present invention, it is possible to solve the fundamental weaknesses of the conventional pattern recognition technology and to reduce mark detection errors.
以下、本発明に係る実施の形態について、添付図面を参照して詳細に説明する。 Embodiments according to the present invention will be described below in detail with reference to the accompanying drawings.
なお、下記の実施形態では、特に半導体露光装置を例にとり、観測画像全体からマークの大まかな位置検出方法(以下、プリアライメント検出とする)を説明する。また、CCDカメラなどの画像入力装置から取り込まれた観測画像は、輝度画像とする。 In the following embodiment, a rough mark position detection method (hereinafter referred to as pre-alignment detection) from the entire observation image will be described by taking a semiconductor exposure apparatus as an example. An observation image taken from an image input device such as a CCD camera is a luminance image.
[第1実施形態]
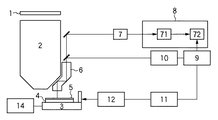
図3に半導体露光装置の概略構成を示したもので、本発明の第1実施形態は図3のオフアクシススコープ6によるプリアライメント検出に対して適用したものである。
[First Embodiment]
FIG. 3 shows a schematic configuration of a semiconductor exposure apparatus. The first embodiment of the present invention is applied to pre-alignment detection by the off-
露光対象パターンはレチクル1上に存在し、不図示の照明系でI線あるいはエキシマレーザ光を使って照明され、投影レンズ2によりウエハ5に露光される。
The exposure target pattern exists on the
プリアライメントはウエハ5が不図示のウエハ搬送装置によって、XYステージ3上のウエハ吸着チャック4に載せられてから行われる。ウエハ5はチャック4上に搬送装置の精度で載せられているため、精度上そのままウエハの精密な位置計測に移行することはできない。その為、ウエハ上のプリアライメント(粗合わせ)用の検出マークを投影レンズ2の外側に構成されるオフアクシススコープ6で観察し、CCDカメラ7で光電変換した後、プリアライメント画像処理装置8で検出マークの位置情報を検出する。プリアライメント画像処理装置8内では、光電変換されたビデオ信号をA/D変換装置71でデジタル情報にし、画像メモリを有する画像処理プロセッサ72でプリアライメントマーク位置の検出を行なう。
The pre-alignment is performed after the wafer 5 is placed on the wafer suction chuck 4 on the
プリアライメントマークの画像を取り込んだときのXYステージ3の位置はレーザ干渉計12によって正確に測定されており、露光装置制御装置9がマーク位置のずれとXYステージ3の位置から、チャック4上に置かれているウエハ5のずれ量を正しく計測する。
The position of the
本実施形態ではオフアクシススコープの照明として暗視野照明を用いて説明する。暗視野照明ではマーク段差のエッジ位置からの散乱光がCCDカメラなどで受光されるが、本発明は明視野照明にも同様に適用できる。 In the present embodiment, description will be made using dark field illumination as illumination of the off-axis scope. In dark field illumination, scattered light from the edge position of the mark step is received by a CCD camera or the like, but the present invention can be similarly applied to bright field illumination.
次に、本実施形態のプリアライメント検出に係わるマークについて述べる。 Next, marks related to pre-alignment detection according to the present embodiment will be described.
図1(a)、図2(a)はマークを構成する小図形の例である。図1(b)、図2(b)は図1(a)、図2(a)の小図形から構成されるマークの例である。 FIG. 1A and FIG. 2A are examples of small figures constituting a mark. FIGS. 1B and 2B are examples of marks composed of the small figures in FIGS. 1A and 2A.
以下に、本実施形態の位置検出装置及びその位置検出装置を用いた半導体露光装置におけるプリアライメント検出の処理手順を図4を参照して説明する。 The pre-alignment detection processing procedure in the position detection apparatus of the present embodiment and the semiconductor exposure apparatus using the position detection apparatus will be described below with reference to FIG.
図4は処理手順のフローチャートを示す。 FIG. 4 shows a flowchart of the processing procedure.
図4において、先ず、予め登録しておいたマーク用の画像を記憶装置から読み込む(S4100)。 In FIG. 4, first, a mark image registered in advance is read from the storage device (S4100).
そして、この画像を変数Imgに代入する(S4101)。 Then, this image is substituted into a variable Img (S4101).
次に、S4101の画像Img中の周期的パターンの繰り返し位置とその位置での周期的繰り返しの強さを示す確率分布を算出する(S4102)。 Next, a probability distribution indicating the repetition position of the periodic pattern in the image Img of S4101 and the intensity of the periodic repetition at that position is calculated (S4102).
このS4102の確率分布をマークの確率分布とする(S4103)。 The probability distribution of S4102 is set as the probability distribution of the mark (S4103).
次に、部分画像の確率分布を以下の手順で算出する。 Next, the probability distribution of the partial image is calculated by the following procedure.
CCDカメラなどの画像入力装置から観測画像を読み込む(S4104)。 An observation image is read from an image input device such as a CCD camera (S4104).
観測画像から部分画像を取り出す(S4106)。 A partial image is extracted from the observed image (S4106).
取り出した部分画像を変数Imgに代入する(S4107)。 The extracted partial image is substituted into a variable Img (S4107).
そして、S4107の画像Img中の周期的パターンの繰り返し位置とその位置での周期的繰り返しの強さを示す確率分布を算出する(S4108)。 Then, a probability distribution indicating the repetition position of the periodic pattern in the image Img in S4107 and the intensity of the periodic repetition at that position is calculated (S4108).
このS4108の確率分布を部分画像の確率分布とする(S4109)。 The probability distribution of S4108 is set as the probability distribution of the partial image (S4109).
予め登録しておいた着目位置を記憶装置から読み込む(S4110)。 The position of interest registered in advance is read from the storage device (S4110).
S4110の着目位置に対応するS4103でのマークの確率分布の値と、S4110の着目位置に対応するS4109での部分画像の確率分布の値とを用いて相関度を算出し、この相関度を部分画像の位置での相関度とする(S4111)。 The degree of correlation is calculated using the value of the probability distribution of the mark in S4103 corresponding to the position of interest of S4110 and the value of the probability distribution of the partial image in S4109 corresponding to the position of interest of S4110. The degree of correlation at the position of the image is set (S4111).
S4106からS4111までの操作を取り出す部分画像がなくなるまで行う(S4105)。 The operations from S4106 to S4111 are performed until there are no partial images to be extracted (S4105).
最後に、S4100からS4111での操作を行って得られた観測画像の位置に対応した相関度分布の値で、最大値を示す位置をマーク位置とする(S4112)。 Finally, the position indicating the maximum value among the correlation degree distribution values corresponding to the position of the observed image obtained by performing the operations from S4100 to S4111 is set as the mark position (S4112).
図5は、図4のS4102及びS4108の画像Img中の周期的パターンの繰り返し位置とその位置での周期的繰り返しの強さを示す確率分布を算出する(以下、確率分布算出とする)処理手順を示す。以下では、図5に従って確率分布算出の方法について説明する。 FIG. 5 is a processing procedure for calculating a probability distribution indicating the repetition position of the periodic pattern in the image Img of S4102 and S4108 in FIG. 4 and the intensity of the periodic repetition at that position (hereinafter referred to as probability distribution calculation). Indicates. Hereinafter, the probability distribution calculation method will be described with reference to FIG.
まず、図4のS4101あるいは図4のS4107の変数Imgを画像データ(以下、画像行列Imgとする)として読み込む(S5100)。 First, the variable Img in S4101 in FIG. 4 or S4107 in FIG. 4 is read as image data (hereinafter referred to as image matrix Img) (S5100).
次に、周波数分解し周波数位置での周期的パターンの繰り返しの強さを分布として抽出し、この分布を実空間に戻すことで画素位置での周期的パターンの繰り返しの強さを示す分布を得ることをS5101〜S5106で行う。 Next, frequency decomposition is performed and the repetition strength of the periodic pattern at the frequency position is extracted as a distribution. By returning this distribution to the real space, a distribution indicating the repetition strength of the periodic pattern at the pixel position is obtained. This is performed in S5101 to S5106.
S5100の画像の行列Imgを2次元離散フーリエ変換した行列(以下、フーリエ変換行列とする)を算出する(S5101)。 A matrix obtained by performing two-dimensional discrete Fourier transform on the matrix Img of the image in S5100 (hereinafter referred to as Fourier transform matrix) is calculated (S5101).
このフーリエ変換行列の共役複素行列(以下、共役複素行列とする)を算出する(S5102)。 A conjugate complex matrix (hereinafter referred to as a conjugate complex matrix) of the Fourier transform matrix is calculated (S5102).
そして、フーリエ変換行列と共役複素行列の対応する要素同士の乗算により周波数領域のエネルギー分布を算出し、その分布を正規化した行列(以下、正規化エネルギースペクトル分布とする)を算出する(S5103)。 Then, an energy distribution in the frequency domain is calculated by multiplying corresponding elements of the Fourier transform matrix and the conjugate complex matrix, and a matrix obtained by normalizing the distribution (hereinafter referred to as a normalized energy spectrum distribution) is calculated (S5103). .
S5103の正規化エネルギースペクトル分布の2次元逆離散フーリエ変換により実空間のエネルギー分布(以下、複素実空間エネルギー分布とする)を算出する(S5104)。 The real space energy distribution (hereinafter referred to as complex real space energy distribution) is calculated by the two-dimensional inverse discrete Fourier transform of the normalized energy spectrum distribution of S5103 (S5104).
S5104の複素実空間エネルギー分布の絶対値をとり実部のみにする(以下、実空間エネルギー分布とする)を算出する(S5105)。 The absolute value of the complex real space energy distribution in S5104 is taken and only the real part is obtained (hereinafter referred to as real space energy distribution) (S5105).
S5105の実空間エネルギー分布をこの分布の最大値と最小値で正規化した分布を算出し、画像Imgの確率分布とする(S5106)。 A distribution obtained by normalizing the real space energy distribution of S5105 with the maximum value and the minimum value of this distribution is calculated and set as a probability distribution of the image Img (S5106).
S5101〜S5106では、2次元離散フーリエ変換と2次元離散逆フーリエ変換を用いて、周波数分解し周波数位置での周期的パターンの繰り返しの強さを分布として抽出し、この分布を実空間に戻すことで画素位置での周期的パターンの繰り返しの強さを示す分布を得ることを行ったが、以下のような直交変換を用いても等価な処理を実現できる。つまり、2次元離散ウェーヴレット変換と2次元離散逆ウェーヴレット変換、2次元離散コサイン変換と2次元離散逆コサイン変換、2次元離散サイン変換と2次元離散逆サイン変換などである。 In S5101 to S5106, using two-dimensional discrete Fourier transform and two-dimensional discrete inverse Fourier transform, frequency decomposition is performed to extract the intensity of repetition of the periodic pattern at the frequency position as a distribution, and this distribution is returned to the real space. The distribution showing the repetition strength of the periodic pattern at the pixel position is obtained in the above, but an equivalent process can be realized even by using the following orthogonal transformation. That is, two-dimensional discrete wavelet transform and two-dimensional discrete inverse wavelet transform, two-dimensional discrete cosine transform and two-dimensional discrete inverse cosine transform, two-dimensional discrete sine transform and two-dimensional discrete inverse sine transform.
図6に、図4のS4111の処理手順(以下、確率分布同士の相関度算出とする)を示す。この手順に従って、確率分布同士の相関度算出の方法について説明する。 FIG. 6 shows the processing procedure of S4111 in FIG. 4 (hereinafter referred to as correlation degree calculation between probability distributions). A method for calculating the degree of correlation between probability distributions will be described in accordance with this procedure.
まず、図4のマークの確率分布と部分画像の確率分布を読み込む(S6100)。 First, the probability distribution of the mark and the probability distribution of the partial image in FIG. 4 are read (S6100).
次に、S4110で読み込んだ着目位置情報を読み込む。但し、この着目位置は確率分布上の位置である(S6101)。 Next, the target position information read in S4110 is read. However, this position of interest is a position on the probability distribution (S6101).
そして、着目位置情報に対応するマークの確率分布上の各値を要素としたベクトル(以下 特定成分ベクトルHとする)を算出する(S6102)。 Then, a vector (hereinafter referred to as a specific component vector H) having each value on the probability distribution of the mark corresponding to the target position information as an element is calculated (S6102).
更に、着目位置情報に対応する部分画像の確率分布上の各値を要素としたベクトル(以下、特定成分ベクトルDとする)を算出する(S6103)。 Further, a vector (hereinafter referred to as a specific component vector D) having each value on the probability distribution of the partial image corresponding to the position information of interest as an element is calculated (S6103).
最後に、特定成分ベクトルHと特定成分ベクトルDの相関度を算出する(S6104)。 Finally, the degree of correlation between the specific component vector H and the specific component vector D is calculated (S6104).
[第2実施形態]
本実施形態では、確率分布同士の相関度算出に関して、上記[第一実施形態]で説明した図6とは異なる方法での算出方法を実施した。
[Second Embodiment]
In this embodiment, regarding the calculation of the degree of correlation between probability distributions, a calculation method using a method different from that in FIG. 6 described in the above [first embodiment] is performed.
[第1実施形態]とは、確率分布同士の相関度算出の処理手順が異なる。以下には、確率分布同士の相関度算出方法のみを示す。 The processing procedure for calculating the degree of correlation between probability distributions is different from that of the first embodiment. Only the method for calculating the correlation between probability distributions will be shown below.
図7に、図4のS4111の処理手順を示す。この手順に従って、確率分布同士の相関度算出の方法を説明する。 FIG. 7 shows the processing procedure of S4111 in FIG. A method for calculating the degree of correlation between probability distributions will be described in accordance with this procedure.
まず、図4のマークの確率分布と部分画像の確率分布を読み込む(S7100)。 First, the probability distribution of the mark and the probability distribution of the partial image in FIG. 4 are read (S7100).
次に、マークの確率分布のパワースペクトラムと部分画像の確率分布のパワースペクトラムを算出する(S7101)。 Next, the power spectrum of the probability distribution of the mark and the power spectrum of the probability distribution of the partial image are calculated (S7101).
そして、S4110で読み込んだ着目位置情報を読み込む。但し、この着目位置はパワースペクトラムの空間上での周波数位置である(S7102)。 Then, the target position information read in S4110 is read. However, this position of interest is a frequency position in the power spectrum space (S7102).
それから、着目位置情報に対応するマーク確率分布のパワースペクトラム空間上の各値を要素としたベクトル(以下、特定成分ベクトルPHとする)を算出する(S7103)。 Then, a vector (hereinafter referred to as a specific component vector PH) having each value in the power spectrum space of the mark probability distribution corresponding to the position information of interest as an element is calculated (S7103).
更に、着目位置情報に対応する部分画像確率分布のパワースペクトラム空間上の各値を要素としたベクトル(以下、特定成分ベクトルPDとする)を算出する(S7104)。 Further, a vector (hereinafter referred to as a specific component vector PD) having each value on the power spectrum space of the partial image probability distribution corresponding to the position-of-interest information as an element is calculated (S7104).
最後に、特定成分ベクトルPHと特定成分ベクトルPDの相関度を算出する(S7105)。 Finally, the degree of correlation between the specific component vector PH and the specific component vector PD is calculated (S7105).
[第3実施形態]
本実施形態では、確率分布同士の相関度算出に関して、上記[第1実施形態]、[第2実施形態]で説明した図6とは異なる方法での算出方法を実施した。 [第一実施形態]、[第二実施形態]とは、確率分布同士の相間度算出の処理手順が異なる。以下には、確率分布同士の相関度算出方法のみを示す。
[Third Embodiment]
In the present embodiment, regarding the calculation of the degree of correlation between probability distributions, a calculation method using a method different from that in FIG. 6 described in the above [first embodiment] and [second embodiment] is implemented. The processing procedure for calculating the degree of correlation between probability distributions is different from that of the first embodiment and the second embodiment. Only the method for calculating the correlation between probability distributions will be shown below.
図8に、図4のS4111の処理手順を示す。この手順に従って、確率分布同士の相関度算出の方法を説明する。 FIG. 8 shows the processing procedure of S4111 in FIG. A method for calculating the degree of correlation between probability distributions will be described in accordance with this procedure.
まず、図4のマークの確率分布と部分画像の確率分布を読み込む(S8100)。 First, the probability distribution of the mark and the probability distribution of the partial image in FIG. 4 are read (S8100).
次に、S4110で読み込んだ着目位置情報を読み込む。但し、この着目位置は確率分布上の位置である(S8101)。 Next, the target position information read in S4110 is read. However, this position of interest is a position on the probability distribution (S8101).
そして、着目位置情報に対応するマーク確率分布値の和に対する着目位置情報に対応する各値の割合(寄与率)を要素としたベクトル(以下、寄与率ベクトルCH とする)を算出する(S8102)。 Then, a vector having the ratio (contribution rate) of each value corresponding to the target position information to the sum of the mark probability distribution values corresponding to the target position information as an element (hereinafter referred to as a contribution rate vector CH) is calculated (S8102). .
更に、着目位置情報に対応する部分画像の確率分布値の和に対する着目位置情報に対応する各値の割合(寄与率)を要素としたベクトル(以下、寄与率ベクトルCDとする)を算出する(S8103)。 Further, a vector (hereinafter referred to as a contribution rate vector CD) having the ratio (contribution rate) of each value corresponding to the position information of interest to the sum of the probability distribution values of the partial images corresponding to the position of interest information as elements is calculated (hereinafter referred to as contribution rate vector CD) ( S8103).
最後に、寄与率ベクトルCHと寄与率ベクトルCDの相関度を算出する(S8104)。 Finally, the degree of correlation between the contribution rate vector CH and the contribution rate vector CD is calculated (S8104).
[他の実施形態]
本発明の目的は、前述した実施形態の確率分布算出の方法を含む位置検出方法又は露光方法等を実現するソフトウェアのプログラムを、システム或いは装置に直接或いは遠隔から供給し、そのシステム或いは装置のコンピュータが該供給されたプログラムコードを読み出して実行することによっても達成され、その場合も本発明の実施形態に含まれる。その場合、プログラムの機能を有していれば、形態は、プログラムである必要はない。
[Other Embodiments]
An object of the present invention is to supply a software program for realizing a position detection method or an exposure method including the probability distribution calculation method of the above-described embodiment directly or remotely to a system or apparatus, and the computer of the system or apparatus Is also achieved by reading out and executing the supplied program code, which is also included in the embodiment of the present invention. In that case, as long as it has the function of a program, the form does not need to be a program.
従って、本発明の機能処理をコンピュータで実現するために、該コンピュータにインストールされるプログラムコード自体も本発明を実現するものである。つまり、本発明の機能処理を実現するためのコンピュータプログラム自体も本発明の実施形態に含まれる。 Accordingly, since the functions of the present invention are implemented by computer, the program code installed in the computer also implements the present invention. That is, the computer program itself for realizing the functional processing of the present invention is also included in the embodiment of the present invention.
その場合、プログラムの機能を有していれば、オブジェクトコード、インタプリタにより実行されるプログラム、OSに供給するスクリプトデータ等、プログラムの形態を問わない。 In this case, the program may be in any form as long as it has a program function, such as an object code, a program executed by an interpreter, or script data supplied to the OS.
プログラムを供給するための記録媒体としては、例えば、フレキシブルディスク、ハードディスク、光ディスク、光磁気ディスク、MO、CD−ROM、CD−R、CD−RW、磁気テープ、不揮発性のメモリカード、ROM、DVD(DVD−ROM、DVD−R)などがある。 As a recording medium for supplying the program, for example, flexible disk, hard disk, optical disk, magneto-optical disk, MO, CD-ROM, CD-R, CD-RW, magnetic tape, nonvolatile memory card, ROM, DVD (DVD-ROM, DVD-R).
また、当該プログラムの供給方法としては、例えば、クライアントコンピュータのブラウザを用いてインターネットのホームページに接続させ、該ホームページから本発明のコンピュータプログラムそのもの、もしくは圧縮され自動インストール機能を含むファイルをハードディスク等の記録媒体にダウンロードさせることによっても可能である。また、本発明のプログラムを構成するプログラムコードを複数のファイルに分割し、それぞれのファイルを異なるホームページからダウンロードさせることによっても可能である。つまり、本発明の機能処理をコンピュータで実現するためのプログラムファイルを複数のユーザに対してダウンロードさせるWWWサーバも、本発明の実施形態に含まれるものである。 As a method for supplying the program, for example, the computer program itself of the present invention or a compressed file including an automatic installation function is recorded on a hard disk or the like by connecting to a homepage on the Internet using a browser of a client computer. It is also possible by downloading to a medium. It is also possible to divide the program code constituting the program of the present invention into a plurality of files and download each file from a different home page. That is, a WWW server that allows a plurality of users to download a program file for realizing the functional processing of the present invention on a computer is also included in the embodiment of the present invention.
また、本発明のプログラムを暗号化してCD−ROM等の記憶媒体に格納してユーザに配布し、所定の条件をクリアしたユーザに対し、インターネットを介してホームページから暗号化を解く鍵情報をダウンロードさせ、その鍵情報を使用することにより暗号化されたプログラムを実行してコンピュータにインストールさせることによっても、当該プログラムの供給は可能である。 In addition, the program of the present invention is encrypted, stored in a storage medium such as a CD-ROM, distributed to users, and key information for decryption is downloaded from a homepage via the Internet to users who have cleared predetermined conditions. The program can also be supplied by executing the program encrypted by using the key information and installing the program on the computer.
また、コンピュータが、読み出したプログラムを実行することによって、前述した実施形態の機能が実現される他、そのプログラムの指示に基づき、コンピュータ上で稼動しているOSなどが、実際の処理の一部または全部を行なうことによっても前述した実施形態の機能は実現され得る。 In addition to the functions of the above-described embodiments being realized by the computer executing the read program, the OS running on the computer based on the instruction of the program is a part of the actual processing. Alternatively, the functions of the above-described embodiments can also be realized by performing all of them.
さらに、記録媒体から読み出されたプログラムが、コンピュータに挿入された機能拡張ボードやコンピュータに接続された機能拡張ユニットに備わるメモリに書き込まれた後、そのプログラムの指示に基づき、その機能拡張ボードや機能拡張ユニットに備わるCPUなどが実際の処理の一部または全部を行なうことよっても前述した実施形態の機能は実現さ得る。 Furthermore, after the program read from the recording medium is written in a memory provided in a function expansion board inserted into the computer or a function expansion unit connected to the computer, the function expansion board or The functions of the above-described embodiments can also be realized by the CPU or the like provided in the function expansion unit performing part or all of the actual processing.
1 レチクル
2 投影レンズ
3 ステージ
4 ウエハチャック
5 ウエハ
6 オフアクシススコープ
7 CCDカメラ
8 画像処理装置
9 露光装置制御装置
10 照明装置
11 レーザ干渉計計測部
12 レーザ干渉計
51 プリアライメントマーク
52 検出位置
71 A/D変換装置
72 画像処理装置プロセッサ
1 reticle
2 Projection lens
3 stages
4 Wafer chuck
5 wafers
6 Off-axis scope
7 CCD camera
8 Image processing device
9 Exposure unit controller
10 Lighting equipment
11 Laser interferometer measurement unit
12 Laser interferometer
51 Pre-alignment mark
52 Detection position
71 A / D converter
72 Image processor processor
Claims (15)
前記画像中の部分画像領域毎に、前記マークを構成する前記図形が所定の位置に存在する確率を算出する算出手段と、
前記算出手段により算出される確率の二次元的な配置における最大値を示す位置をマーク位置とする位置検出手段とを有することを特徴とする位置検出装置。 Image capturing means for capturing a mark composed of a plurality of identical figures as an image;
Calculating means for calculating a probability that the figure constituting the mark exists at a predetermined position for each partial image region in the image;
A position detection device comprising: a position detection unit that uses a position indicating the maximum value in a two-dimensional arrangement of the probabilities calculated by the calculation unit as a mark position.
前記第1のエネルギー分布算出手段により得られる周波数領域のエネルギー分布を当該第1のエネルギー分布算出手段で用いた直交変換の逆変換をすることで得られる実空間のエネルギー分布を算出する第2のエネルギー分布算出手段とを有することを特徴とする請求項2に記載の位置検出装置。 The calculation means includes first energy distribution calculation means for calculating an energy distribution in a frequency domain obtained by performing orthogonal transformation on a partial image;
Calculating a real space energy distribution obtained by performing an inverse transformation of an orthogonal transformation using the energy distribution in the frequency domain obtained by the first energy distribution calculating unit in the first energy distribution calculating unit; The position detection apparatus according to claim 2, further comprising an energy distribution calculation unit.
前記画像中の部分画像領域毎に、前記マークを構成する前記図形が所定の位置に存在する確率を算出する算出工程と、
前記算出工程における確率の二次元的な配置における最大値を示す位置をマーク検出位置とする位置検出工程とを有することを特徴とする位置検出方法。 An image capturing process for capturing a mark composed of a plurality of identical figures as an image;
A calculation step of calculating a probability that the figure constituting the mark is present at a predetermined position for each partial image region in the image;
A position detecting step, wherein a position indicating the maximum value in the two-dimensional arrangement of the probabilities in the calculating step is a mark detecting position.
前記撮像手段により得られた前記マークの画像の部分画像を直交変換することにより周波数空間におけるエネルギー分布を得、該エネルギー分布を逆直交変換することにより実空間におけるエネルギー分布を得る第1算出手段と、
前記算出手段により得られたエネルギー分布と、予め得られた前記マークのエネルギー分布との相関度を算出する第2算出手段とを有することを特徴とする位置検出装置。 Imaging means for imaging a mark formed on the object;
First calculating means for obtaining an energy distribution in the frequency space by orthogonally transforming a partial image of the image of the mark obtained by the imaging means, and obtaining an energy distribution in the real space by performing inverse orthogonal transformation on the energy distribution; ,
A position detection apparatus comprising: second calculation means for calculating a degree of correlation between the energy distribution obtained by the calculation means and the energy distribution of the mark obtained in advance.
前記撮像工程において得られた前記マークの画像の部分画像を直交変換することにより周波数空間におけるエネルギー分布を得、該エネルギー分布を逆直交変換することにより実空間におけるエネルギー分布を得る第1算出工程と、
前記第1算出工程において得られたエネルギー分布と、予め得られた前記マークのエネルギー分布との相関度を算出する第2算出工程とを有することを特徴とする位置検出方法。 An imaging step of imaging a mark formed on the object;
A first calculation step of obtaining an energy distribution in a frequency space by orthogonally transforming a partial image of the image of the mark obtained in the imaging step and obtaining an energy distribution in a real space by performing an inverse orthogonal transformation of the energy distribution; ,
A position detection method comprising: a second calculation step of calculating a degree of correlation between the energy distribution obtained in the first calculation step and the energy distribution of the mark obtained in advance.
Priority Applications (2)
| Application Number | Priority Date | Filing Date | Title |
|---|---|---|---|
| JP2003345890A JP2005116626A (en) | 2003-10-03 | 2003-10-03 | Position detector, position detecting method, and exposure system |
| US10/952,765 US7418125B2 (en) | 2003-10-03 | 2004-09-30 | Position detection technique |
Applications Claiming Priority (1)
| Application Number | Priority Date | Filing Date | Title |
|---|---|---|---|
| JP2003345890A JP2005116626A (en) | 2003-10-03 | 2003-10-03 | Position detector, position detecting method, and exposure system |
Publications (2)
| Publication Number | Publication Date |
|---|---|
| JP2005116626A true JP2005116626A (en) | 2005-04-28 |
| JP2005116626A5 JP2005116626A5 (en) | 2006-11-16 |
Family
ID=34386352
Family Applications (1)
| Application Number | Title | Priority Date | Filing Date |
|---|---|---|---|
| JP2003345890A Withdrawn JP2005116626A (en) | 2003-10-03 | 2003-10-03 | Position detector, position detecting method, and exposure system |
Country Status (2)
| Country | Link |
|---|---|
| US (1) | US7418125B2 (en) |
| JP (1) | JP2005116626A (en) |
Cited By (1)
| Publication number | Priority date | Publication date | Assignee | Title |
|---|---|---|---|---|
| JP2018508039A (en) * | 2015-02-28 | 2018-03-22 | シャンハイ マイクロ エレクトロニクス イクイプメント(グループ)カンパニー リミティド | Substrate pre-alignment method |
Families Citing this family (13)
| Publication number | Priority date | Publication date | Assignee | Title |
|---|---|---|---|---|
| JP2006005242A (en) * | 2004-06-18 | 2006-01-05 | Canon Inc | Apparatus and method for image processing, exposure device, and device manufacturing method |
| JP2006216865A (en) * | 2005-02-04 | 2006-08-17 | Canon Inc | Method and device for discrimination, exposure device and device manufacturing method |
| JP4891712B2 (en) * | 2006-09-05 | 2012-03-07 | 株式会社日立ハイテクノロジーズ | Inspection device using template matching method using similarity distribution |
| US8086043B2 (en) * | 2007-12-21 | 2011-12-27 | Ati Technologies Ulc | System and method of image correlation based on image structure |
| JP5058002B2 (en) * | 2008-01-21 | 2012-10-24 | 株式会社豊田中央研究所 | Object detection device |
| US20100166257A1 (en) * | 2008-12-30 | 2010-07-01 | Ati Technologies Ulc | Method and apparatus for detecting semi-transparencies in video |
| KR101914101B1 (en) | 2011-06-28 | 2018-11-02 | 삼성전자 주식회사 | Apparatus and method of controlling chuck, and exposure apparatus and control method thereof |
| CN104885014B (en) | 2012-10-26 | 2017-05-31 | 迈普尔平版印刷Ip有限公司 | Substrate and the system for determining the position of substrate in photoetching |
| US10223800B2 (en) | 2014-03-28 | 2019-03-05 | Hewlett-Packard Development Company, L.P. | Determine presence of quasi-periodic two-dimensional object |
| US9484188B2 (en) * | 2015-03-11 | 2016-11-01 | Mapper Lithography Ip B.V. | Individual beam pattern placement verification in multiple beam lithography |
| TWI583174B (en) * | 2016-07-06 | 2017-05-11 | 虹光精密工業股份有限公司 | Image processing device, copy apparatus and copy method with image shifting and filling functions |
| WO2019101338A1 (en) * | 2017-11-24 | 2019-05-31 | Ecole Polytechnique Federale De Lausanne (Epfl) | Method of handwritten character recognition confirmation |
| CN110827432B (en) * | 2019-11-11 | 2021-12-28 | 深圳算子科技有限公司 | Class attendance checking method and system based on face recognition |
Family Cites Families (9)
| Publication number | Priority date | Publication date | Assignee | Title |
|---|---|---|---|---|
| JPH07120621B2 (en) * | 1989-05-08 | 1995-12-20 | キヤノン株式会社 | Alignment method |
| US5841520A (en) * | 1995-08-09 | 1998-11-24 | Nikon Corporatioin | Exposure apparatus and method that use mark patterns to determine image formation characteristics of the apparatus prior to exposure |
| JPH10242041A (en) * | 1997-02-26 | 1998-09-11 | Nikon Corp | Position detection method and apparatus, and aligner |
| US6225639B1 (en) * | 1999-08-27 | 2001-05-01 | Agere Systems Guardian Corp. | Method of monitoring a patterned transfer process using line width metrology |
| JP4532640B2 (en) | 2000-01-14 | 2010-08-25 | キヤノン株式会社 | Position detection apparatus and exposure apparatus using the same |
| US6559953B1 (en) * | 2000-05-16 | 2003-05-06 | Intel Corporation | Point diffraction interferometric mask inspection tool and method |
| US7068833B1 (en) * | 2000-08-30 | 2006-06-27 | Kla-Tencor Corporation | Overlay marks, methods of overlay mark design and methods of overlay measurements |
| JP3486606B2 (en) * | 2000-09-08 | 2004-01-13 | キヤノン株式会社 | Diffractive optical element and optical system using the same |
| JP2003315973A (en) * | 2002-04-19 | 2003-11-06 | Fujitsu Ltd | Mask design device, mask design method, program, and method of manufacturing semiconductor device |
-
2003
- 2003-10-03 JP JP2003345890A patent/JP2005116626A/en not_active Withdrawn
-
2004
- 2004-09-30 US US10/952,765 patent/US7418125B2/en not_active Expired - Fee Related
Cited By (2)
| Publication number | Priority date | Publication date | Assignee | Title |
|---|---|---|---|---|
| JP2018508039A (en) * | 2015-02-28 | 2018-03-22 | シャンハイ マイクロ エレクトロニクス イクイプメント(グループ)カンパニー リミティド | Substrate pre-alignment method |
| US10416578B2 (en) | 2015-02-28 | 2019-09-17 | Shanghai Micro Electronics Equipment (Group) Co., Ltd. | Substrate pre-alignment method |
Also Published As
| Publication number | Publication date |
|---|---|
| US20050074160A1 (en) | 2005-04-07 |
| US7418125B2 (en) | 2008-08-26 |
Similar Documents
| Publication | Publication Date | Title |
|---|---|---|
| JP2005116626A (en) | Position detector, position detecting method, and exposure system | |
| US7925076B2 (en) | Inspection apparatus using template matching method using similarity distribution | |
| KR100554639B1 (en) | Pattern Inspection Method and Apparatus, and Pattern Alignment Method | |
| JP4910128B2 (en) | Defect inspection method for object surface | |
| KR20070062905A (en) | Differential comparison inspection method and apparatus thereof | |
| JP2011007728A (en) | Method, apparatus and program for defect detection | |
| JP2009294027A (en) | Pattern inspection device and method of inspecting pattern | |
| KR20150041439A (en) | Device for measuring critical dimension of pattern and method thereof | |
| JP4532640B2 (en) | Position detection apparatus and exposure apparatus using the same | |
| JP2005182164A (en) | Image area determination method, and image area determination apparatus, image correction apparatus, and digital watermark extraction apparatus capable of using method | |
| JP2009047458A (en) | Circuit pattern inspection device and inspection method | |
| KR20080011635A (en) | Method and system for defect detection | |
| US6628409B2 (en) | Method for determining the distance between periodic structures on an integrated circuit or a photomask | |
| JP6326243B2 (en) | Image processing apparatus and three-dimensional shape measuring apparatus | |
| JP2675167B2 (en) | Pattern recognition method | |
| JP4696574B2 (en) | Semiconductor inspection equipment | |
| JP2002198406A (en) | Appearance inspecting method | |
| JP4484041B2 (en) | Edge position detection device | |
| JP3182517B2 (en) | Defect detection apparatus and method | |
| JP2926118B2 (en) | Defect detection method | |
| JP2012063193A (en) | Height measurement instrument and height measurement method | |
| JP3447717B2 (en) | Image processing device | |
| JP3262030B2 (en) | Defect detection device | |
| JP3570201B2 (en) | Image recognition device and image recognition method | |
| JP2007317013A (en) | Position detector |
Legal Events
| Date | Code | Title | Description |
|---|---|---|---|
| A521 | Request for written amendment filed |
Free format text: JAPANESE INTERMEDIATE CODE: A523 Effective date: 20060929 |
|
| A621 | Written request for application examination |
Free format text: JAPANESE INTERMEDIATE CODE: A621 Effective date: 20060929 |
|
| A761 | Written withdrawal of application |
Free format text: JAPANESE INTERMEDIATE CODE: A761 Effective date: 20090309 |