JP2004192543A - Alarm analysis device, method and program - Google Patents
Alarm analysis device, method and program Download PDFInfo
- Publication number
- JP2004192543A JP2004192543A JP2002362531A JP2002362531A JP2004192543A JP 2004192543 A JP2004192543 A JP 2004192543A JP 2002362531 A JP2002362531 A JP 2002362531A JP 2002362531 A JP2002362531 A JP 2002362531A JP 2004192543 A JP2004192543 A JP 2004192543A
- Authority
- JP
- Japan
- Prior art keywords
- alarm
- content
- time
- probability
- bit string
- Prior art date
- Legal status (The legal status is an assumption and is not a legal conclusion. Google has not performed a legal analysis and makes no representation as to the accuracy of the status listed.)
- Granted
Links
Images


Abstract
Description
【0001】
【発明の属する技術分野】
本発明は、化学プラント等におけるコンピュータを用いた制御システムで発生するアラームの解析を行うアラーム解析装置、アラーム解析方法並びにアラーム解析プログラムに関する。
【0002】
【従来の技術】
化学プラントにおいては、さまざまな計器、機器、装置等が用いられている。そして、化学プラントにおいて生産管理、安全管理、品質管理、稼動状況管理を行うために、これらの計器等が異常を検出した場合はアラーム信号を発生させ、プラント制御用のコンピュータに送信している。プラント制御用のコンピュータはこのアラームの信号を受信して、表示装置に表示させている。例えば、温度計、流量計、液面計、気圧計、電流計、電圧計、ph計等の計器類では計測値が所定の設定値(上限値)を越えた時又は所定の設定値(下限値)を下回った時にそれぞれアラームを発生する。そしてプロセス中の連続値が異常な値を取ったときにそれを警告する役割を持つ。そして、この設定値は実行されるプロセスによって異なる値を設定しなければならない。また機器、装置等は正常に運転されていない状態になったらアラームが発生する。これらのアラームがプラント内のそれぞれの計器類から発生され、トラブル発生時にはオペレーター等に報知する。
【0003】
各計器類からアラームが発生した場合、アラームが発生したことのみではなく、その発生した計器類を特定するためのタグが制御用のコンピュータに表示される。このタグには計器等の設置されている場所、計器の種類、番号あるいはアラームの種類等の情報が含まれる。そして、作業者は発生したアラームに応じた対処、処置を行い、異常事態から正常運転に復帰させていた。このアラームを監視することによりトラブルの早期発見を図ることができる。このタグは発生した日時とともコンピュータのデータベースに記憶され、アラームログとしてコンピュータに表示することができる。このアラームログはプラントの管理状況を把握されるために用いられている。
【0004】
さらにアラームだけではなく、コンピュータの操作記録、操作時間などの操作情報や計器からのアナログ信号が日時とともにコンピュータにデータベースとして記録される。これらはそれぞれオペレーションログやデータログとしてコンピュータに表示することができる。これらの情報に基づいて、プラントの管理が行われている。さらに、これらのデータベースから工程変更イベント発生時にそのイベントに対応する過去のアラーム事例などの危険予知情報を検索し、その検索結果をコンピュータに表示させるプロセスアラーム表示装置が開示されている(例えば、特許文献1)。あるいは、アラーム情報やイベント情報に基づいて問題点や対策を推定したり、アラーム発生回数と操作回数に基づいて問題点と対策を類型化するプラントの制御方法が開示されている(例えば、特許文献2)。
【0005】
一方、アラームによっては安全のため他の機器類へのインターロックが取られており、他の機器の動作を自動的に停止させることができるようになっている。例えば、ある機器の冷却水流量が設定値を下回った場合は、その機器を自動的に停止させ、その機器の故障を回避している。あるいは、一つの機器が停止した場合は、それと連動して動作している機器が停止し、機器の故障を回避している。これにより、さらなるトラブルの発生を未然に防止して、プラント全体の安全性、稼働率を保持することが可能となる。
【0006】
しかし、従来のプラントでは以下のような問題点が発生してしまっていた。大規模プラントでは品質の向上や設備の複雑化に伴い、アラームの設定が厳しくなりやすい。また、使用される計器類が多数、多種類になってしまうと一つの計器で発生したアラームによって、アラームの連鎖が生じてしまうという問題点があった。すなわち、上述のようにある一つのアラームが発生して、他の機器の動作が停止した時に、それと連鎖してまた別の機器の動作が停止し、アラームが発生することがあった。そして、別の機器が停止することにより、さらに計器の計測値が設定値を越えてしまいアラームが発生する。そして、一つの計器類のアラームによって、正常に動作していた計器類までアラームが連鎖的に発生してしまう。このような、アラームの連鎖により、多数のアラームが1度に或いは一定の時間遅れを持って発生してしまうことがあった。
【0007】
このように連鎖的にアラームが発生した場合、作業者は根本的な原因がなにかを把握することができないため、正常な状態への復帰に時間がかかり、プラントの稼働率、生産性が低下してしまうという問題点があった。また、プラントの大規模化、複雑化によってアラームの連鎖がプラント全体まで広がってしまい、復帰に要する時間がさらに長くなってしまうという問題点が生じていた。特に熟練した作業者でない場合には、多量のアラームが発生すると復帰に時間がかかってしまうだけでなく、誤った処置をしてしまうことがあった。従って、復帰にかかる時間のさらなる長期化を招き、プラントの安全性の面でも問題が生じてしまっていた。
【0008】
一方、プラントで用いられるプロセスを変更すれば、計器の設定値や機器の動作モードを変えなければならない。例えば、使用する薬品や材料に応じて、反応時の温度、圧力、ph等が異なる。従って、計器類の設定値の最適値も変更される。従って、計器類の設定値をプロセスに応じて変更する必要がある。この変更は制御用コンピュータにその値を入力することによって行われる。あるいは制御用コンピュータに設定値が既に入力されている場合は、その設定ファイルを読み込むことによって行われる。しかし、プロセス変更直後にはプロセスの反応が安定しないことがある。この場合、計測値がハンチングすることにより計器の上限値及び下限値を交互に越え、アラームが連続して発生することもある。あるいは、異なる設定値を入力してしまうことや異なる設定ファイルを読み込んでしまうことによりアラームが発生することもある。さらには、新しいプロセスを行う場合にはその設定値が適切でない場合もある。そして、このアラームが起点となってさらなるアラームの連鎖が生じてしまうことがあった。よって復帰に時間を要し稼働率、生産性が低下してしまうことがあった。
【0009】
【特許文献1】
特開2001−265429号公報
【特許文献2】
特開2001−195122号公報
【0010】
【発明が解決しようとする課題】
このように、従来のアラーム解析システムでは、連鎖的なアラームが発生した場合に、その根本的な原因を追求することが出来ず復帰に時間がかかってしまいプラントの生産性を低下させるという問題点があった。
【0011】
本発明は、このような問題点を解決するためになされたもので、プラントで連鎖的に発生するアラームを的確に分析することができ、復帰時間を短縮することができるアラーム解析装置、アラーム解析方法、アラーム解析プログラムを提供することを目的とする。
【0012】
【課題を解決するための手段】
本発明にかかるアラーム解析装置はプラントで発生するアラームのアラーム情報及びプラントの計器類を操作する操作情報に基づいてプラントのアラームを解析するアラーム解析装置であって、発生したアラームの内容と発生時刻を対応させたアラーム情報を記憶するアラーム情報記憶部(例えば、本実施の形態におけるアラーム情報記憶部12)と、操作した内容と操作時刻を対応させた操作情報を記憶する操作情報記憶部(例えば、本実施の形態における操作情報記憶部14)と、アラーム内容及び操作内容のそれぞれの内容に対して、前記アラーム発生時刻及び操作時刻をビット列に変換するビット列変換部(例えば、本実施の形態におけるビット列変換部51)と、前記アラーム内容及び操作内容から第1の内容と前記第1の内容と異なる第2の内容を抽出し、抽出された2つの内容に対応するビット列に基づいて2つの内容の相関値を算出し、算出された相関値に基づいて独立性確率を算出する独立性確率算出部(例えば、本実施の形態における独立性確率算出部53)と、前記アラーム内容及び操作内容のそれぞれの内容に対して算出された独立性確率に基づいて、前記アラーム内容及び操作内容のクラスタリングを行うクラスタリング部(例えば、本実施の形態におけるクラスタリング部54)と、前記クラスタリングされた結果を表示する表示部(例えば、本実施の形態における表示部16)を備えるものである。これにより、的確にアラームの解析を行うことができる。
【0013】
上述のアラーム解析装置においてビット列変換の単位時間を入力する入力部をさらに備え、前記入力された単位時間に対応したビット列を生成するようにビット列変換を行うようにしてもよい。
上述のアラーム解析装置において前記入力部においてクラスタ数を入力し、前記入力されたクラスタ数に対応したクラスタを生成するようにクラスタリングを行うようにしてもよい。これにより、より的確なアラームの解析を行うことができる。
【0014】
さらに、上述のアラーム解析装置において前記独立性確率算出部は第1の内容と第2の内容がそれぞれ発生した回数に基づいて前記第1の内容と第2の内容が同時発生する回数に対応した確率分布を算出し、前記相関値以上の値を取る確率を独立性確率とすることが望ましい。これにより、発生頻度とは関係なくアラームの相関を調べることができる。
【0015】
上述のアラーム解析装置は前記第1の内容及び第2の内容に対応するビット列に基づいて、相互相関関数を求める相互相関関数算出部(例えば、本実施の形態における相互相関関数算出部52)をさらに備え、前記独立性確率算出部では前記相互相関関数の最大の相関値に基づいて独立性確率を算出することが望ましい。これにより、ある一定の時間遅れを持って連鎖的に発生するアラームを関連付けることができる。
【0016】
上述のアラーム解析装置の好適な実施の形態は前記表示部ではクラスタリングした結果に基づくデンドログラムの一部又は全部を表示するものである。
【0017】
本発明にかかるアラーム解析方法は発生したアラームの内容と時刻を対応させアラーム情報を記憶するステップと、操作した操作内容と時刻を対応させた操作情報を記憶するステップと、アラーム内容及び操作内容のそれぞれの内容に対して、発生したアラーム発生時刻及び操作した操作時刻をビット列に変換するステップと、前記アラーム内容及び操作内容から第1の内容と前記第1の内容と異なる第2の内容を抽出するステップと抽出された2つの内容に対応するビット列に基づいて2つの内容の相関値を算出するステップと、前記相関値に基づいて独立性確率を算出するステップと、クラスタ数を入力するステップと、前記アラーム内容及び操作内容のそれぞれの内容に対して算出された独立性確率に基づいて、前記アラーム内容及び操作内容について前記クラスタ数に応じたクラスタを生成するようクラスタリングを行うステップと、前記クラスタリングされた結果を表示するステップを備えるものである。これにより、的確にアラームの解析を行うことができる。
【0018】
上述のアラーム解析方法において前記第1の内容と前記第2の内容が計算期間内にそれぞれ発生した回数に基づいて前記第1の内容と第2の内容が同時発生する回数に応じた確率分布を算出し、前記相関値以上の値を取る確率を独立性確率とするようにしてもよい。これにより発生頻度には関係なくアラームを関連付けることができる。
【0019】
上述のアラーム解析方法の好適な実施の形態は計算期間とビット列変換の単位時間を入力するステップをさらに備え、計算期間内に発生したアラーム発生時刻及び操作した操作時刻を計算期間及びビット列変換の単位時間に対応したビット長のビット列に変換するものである。
【0020】
上述のアラーム解析方法は最大遅れ時間を入力するステップと、前記最大遅れ時間とビット列変換の単位時間に応じたサンプル数の相関値を計算して相互相関関数を算出するステップと、前記相互相関関数の値が最大となる最大相関値を算出するステップをさらに備え、前記独立性確率を算出するステップでは前記最大相関値に基づいて独立性確率を算出することが望ましい。これにより、時間遅れで発生するアラームの関連付けを行うことができる。
【0021】
上述のアラーム解析方法の好適な実施例は前記表示するステップではクラスタリングした結果に基づくデンドログラムの一部又は全部を表示することを特徴とするものである。
【0022】
本発明にかかるアラーム解析プログラムは、発生したアラームの内容及び発生時刻を有するアラーム情報及び操作者が操作した内容及び操作時刻を有する操作情報に基づいてプラントのアラームの解析を行うアラーム解析プログラムであって、アラーム内容及び操作内容のそれぞれの内容に対して、計算期間内に発生したアラーム発生時刻及び操作した操作時刻をビット列に変換するステップと前記アラーム内容及び操作内容の中から第1の内容と前記第1の内容と異なる第2の内容を抽出するステップと、抽出された2つの内容のビット列に基づいて2つの内容の相関値を算出するステップと、前記相関値に基づいて独立性確率を算出するステップと、それぞれの内容に対して算出された前記独立性確率に基づいてクラスタリングを行うステップと前記クラスタリングされた結果をコンピュータの表示部に表示するステップを備えるものである。これにより、的確にアラームの解析を行うことができる。
【0023】
コンピュータに対して最大遅れ時間を入力するステップと、前記最大遅れ時間に対して相互相関関数を算出するステップと、前記相互相関関数に基づいて最大相関値を算出するステップをさらに備え、前記独立性確率を算出するステップでは前記最大相関値に基づいて独立性確率を算出するものである。これにより、時間遅れで発生するアラームの関連付けを行うことができる。
【0024】
上述のアラーム解析プログラムにおいて前記第1の内容と前記第2の内容がそれぞれ発生した回数に基づいて前記第1の内容と第2の内容が同時発生する回数に応じた確率分布を算出し、前記相関値以上の値を取る確率を独立性確率とするようにしてもよい。これにより発生頻度には関係なくアラームを関連付けることができる。
【0025】
上述のアラーム解析プログラムはコンピュータに対してクラスタ数を入力するステップをさらに備え、前記入力されたクラスタ数に対応したクラスタを生成するようにクラスタリングを行うことが望ましい。これにより、より的確に連鎖するアラームの解析を行うことができる。
【0026】
上述のアラーム解析プログラムの好適な実施の形態は前記表示するステップではクラスタリングした結果に基づく樹状図の一部又は全部を表示することを特徴とするものである。
【0027】
【発明の実施の形態】
本発明の実施の形態1.
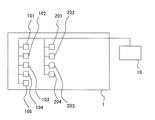
本発明にかかるアラーム解析装置について図1〜図8を用いて説明する。図1は本発明にかかるアラーム解析装置が用いられるプラント全体を示す模式図である。1がプラント、10が制御用コンピュータ(以下、PCとする。)である。101〜105が計器類であり、これらは同じユニットに属している。201〜204も計器類であり、これらは同じユニットに属している。ユニットとはプラントを場所や工程に応じて区分けしたもので1つのプラントは通常複数のユニットから構成されている。そして、これらのユニットに複数の計器類、機器、装置等が設けられているものとする。
【0028】
この計器類はそれぞれが1つの計器、機器、装置である。この機器、装置にはヒーター、空調器、バルブ等が含まれる。この計器には温度計、流量計、液面計、気圧計、電流計、電圧計、ph計等の計器が含まれるものとする。これらの計器類には上限値、下限値が設定されている。これらの上下限値は2段階に設定されていることがあり、その設定値(閾値)を高い順にHH、HI、LO、LLとする。正常に稼動している時では、計器が計測している連続値はHIとLOの間になっている。また、連続値がHIを越えた状態よりもHHを越えた状態の方が、より危険度が高いことを意味する。同様にLOを越えた状態よりもLLを越えた状態の方が、より危険度が高いことを意味する。この閾値を越えたとき、その計器は計測値に応じて、それぞれHHアラーム、HIアラーム、LOアラーム、LLアラームを発生する。従って、一つの計器で4種類のアラームが発生することになる。なお、それぞれの計器にHH、HI、LO、LLの4つの設定値が設けられていない場合もある。例えば、流量等は設定値以上であればよいため、LO、LLしか設けられていない場合もある。また機器、装置では機器の故障等の異常が発生したときにもアラームが発生する。
【0029】
それぞれの計器類はLAN等の通信網を介してPC10に接続されている。そして、それぞれの計器類で発生したアラームはPC10の画面上に表示され、オペレーターに報知される。なお、これらの計器類はシーケンサーを介して接続されていても良い。さらにアラームだけででなく、計器の測定値がPC10に入力されている。
【0030】
このPC10の構成について図2を用いて説明する。図2はPC10の内部構成を示すブロック図である。11は通信部、12はアラーム情報記憶部、13は測定データ記憶部、14は操作情報記憶部、15は解析部、16は表示部、17は入力部である。通信部11はイーサネット(登録商標)ポート等の通信ポートであり、光ファイバケーブル等を介して、各計器類との信号の送受信を行う。アラーム情報記憶部12、測定データ記憶部13、操作情報記憶部14はハードディスク、ROM、RAM等の内部又は外部の記憶手段であり、それぞれの情報がデータベースとして記憶される。解析部15はCPU、MPU等により構成され、アラーム情報や操作情報に基づいてアラームの解析を行う。表示部16は液晶ディスプレイ、CRT等の表示手段であり、アラームログ、測定データの連続値、操作情報ログ等が表示される。さらに、プロセスの選択、実行、中止等をする画面或いは計器類の設定値を変更するための入力画面や発生したアラームの情報が表示される。入力部17はキーボードやマウス等からなる入力手段である。アラームログ、測定データ、操作情報を見たい時は入力部17によって、表示部16に表示された画面上で所定の操作をする。またプロセスの選択、実行、中止や計器類の設定値の設定等も同様に行う。入力部17によって計器類への指示がされると、通信部11によって各計器類の指示に対応した信号が送信される。
【0031】
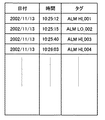
プラント内の各計器類で発生したアラーム及び計器の測定値がPC10の通信部11により受信される。この受信された信号はそれぞれアラーム情報記憶部12と測定データ記憶部13にデータベースとして記憶される。アラーム情報記憶部12ではアラームが発生した時間及びアラームタグが記憶される。アラームタグにはアラームが発生した機器の番号、種類、ユニット番号、アラームの種類(HH、HILO、LLのいずれか)等の情報が含まれる。このアラーム情報記憶部12に記憶されたアラームタグを発生時間順に並べたものがアラームログとなる。オペレーターは表示部16に表示されたアラームログ表示ボタンをマウス等で押すことにより、このアラームログを表示させることができる。このアラームログは図3に示すよう表示部16に表示される。アラームが発生した日付及び時間とそれに対応したアラームタグが表示される。一番上のタグにおいて、ALMはアラームを意味している。HIは計器の連続値がHIの設定値を越えたことを意味している。001は計器毎に付された番号であり、この番号からアラームを発生した計器の場所、種類、所属するユニットを把握することができる。このようなアラームが発生した順番に並べられて表示される。
【0032】
同様に測定データ記憶部13に記憶された測定データも表示部16に表示することができる。測定データはプロット図等によってグラフ化して表示できる。また測定データはリアルタイムで表示部16にされてもよいし、表示したい計器の測定データを選択できるようになっている。なお、一部の計器のみに対して測定データを記憶するようにしてもよい。
オペレーターは入力部17を用いてプロセスの変更や設定値の変更を行うことができる。操作した内容は操作情報記憶部14にデータベースとして記憶される。操作情報記憶部14にはオペレーターが操作した日付、時間、操作内容の他に操作したオペレーターの情報が記憶される。この操作情報はアラームログと同様に操作情報ログとして表示部16に表示することが出来る。この操作情報ログの表示では操作した日付、時間、操作内容の他に操作したオペレーターの情報が表示される。
【0033】
オペレーターが本発明にかかるアラーム解析を実行すると、解析部15はアラームの解析を行う。解析部15はアラーム情報記憶部12に記憶されたアラーム情報、測定データ記憶部13に記憶された測定データ、操作情報記憶部14に記憶された操作情報に基づいて解析を行う。本形態では、それぞれのアラーム及び操作がどの程度の相関を持って発生しているかに着目して解析を行う。具体的には1つのアラーム又は操作(以下イベントとする)とその他のイベントが頻繁に同時発生しているかを調べる。あるいは2つのイベントが一定の時間遅れを持って発生しているかを調べる。そして、これらに基づいてそれぞれの相互相関関数を算出する。この相互相関関数から2つのイベント発生の独立性確率を算出する。この独立性確率は2つのアラームの非類似度を示すことになる。この独立性確率(非類似度)に基づいてイベントのクラスタリングを行う。そしてクラスタリング結果を表示部16に表示させる。本発明にかかるアラーム解析方法はこのようにしてプラントで発生するアラーム及びイベントの解析を行うものである。
【0034】
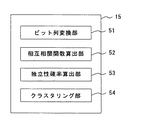
次にこの解析方法について図4、図5を用いて詳細に説明する。図4は解析部15内の構成を示すブロック図である。図5は解析手順を示すフローチャートである。図4において51はビット列変換部、52は相互相関関数算出部、53は独立性確率算出部、54はクラスタリング部である。
【0035】
まず、オペレーターは解析を実行する際に、ビット列変換の単位時間、最大遅れ時間、計算期間の3つのパラメーターを入力する(S102)。例えば、計算期間に2002年11月13日0:00〜2002年11月14日0:00と入力したとすると、その24時間に発生したイベントの情報(以下、イベント情報とする。)に基づいて解析が行われる。ビット列変換の単位時間に1分と入力したとすると、この24時間が1分毎に区分され、24時間×60分=1440のサンプル数のデータについて解析が行われる。なお、最大遅れ時間については後述する。
【0036】
上記のパラメーターを入力すると、まず各々のイベントが発生したイベント発生時刻データ(アラーム発生時刻データと操作時刻データ)が生成される(S101)。すなわち、各々のイベントに対してそのイベントが発生した回数分のデータ列が生成される(S101)。そして、ビット列変換部51はイベント発生時刻データの2値化を行い、上記の計算期間とビット列変換の単位時間に対応するビット長のビット列を生成する(S103)。すなわち、2002年11月13日の0:00〜0:01にそのイベントが発生していれば1、発生していなければ0となり、これを0:01〜0:02、0:02〜0:03と順番に上記のサンプル数だけ2値化を行う。従って、1ビット×サンプル数のビット長のビット列が生成される。そしてこのビット列には原則としてイベントが発生した回数だけ1のビットがあることになる。ただし、同じビット列変換の単位時間に2度同じイベントがあった場合は、1のビットが立つのでこの限りではない。このビット列が全イベントに対して生成される。このビット列のデータを示したグラフの一例を図6に示す。図6の横軸は時間を示しており、1単位がビット列変換の単位時間(1分)に対応している。従って、計算期間の初めの時刻から1分毎に分けられており、1単位がサンプル番号(1〜1440)を示していることになる。縦軸はアラーム1(ALM_001)〜アラーム6(ALM_006)に対応しており、それぞれのビット列が示されている。そして、それぞれアラームに縦のマーカーがあるビット列変換の単位時間でアラームが発生していることとなる。すなわち、縦のマーカーの数が多いほど、頻繁に発生するアラームとなる。
【0037】
次に、相互相関関数算出部52は全てのイベント情報の中から第1の内容のイベントと第1の内容と異なる第2の内容のイベント(以下、イベントペア)を抽出して相関値を求め、相互相関関数を算出する(S104)。ここでは説明のためアラーム1とアラーム2のイベントペアが抽出されたとする。アラーム1とアラーム2のビット列に基づいて2ビットのビット列を生成する。アラーム1、アラーム2の両方が同時に発生している時間では(1、1)となる。より正確にはビット列変換の単位時間の間に両方のアラームが発生している場合は(1、1)となる。両方とも発生していない時間では(0、0)となる。一方のみ発生している時間では(1、0)又は(0、1)となる。ここでは(1、1)、(1、0)、(0、1)、(0、0)の2ビットのデータがサンプル数分、すなわち1440個並ぶことになる。そして、2ビットのデータの積を求める。つまり(1、1)のみ1となり、それ以外の(0、0)、(0、1)、(1、0)は0となる。そして、1440のデータの中で1となった数、すなわち両方のアラームが同時に発生した数を算出する。この数は計算期間内にアラーム1とアラーム2が同時に発生している回数を示している。次にサンプル数を1つずらして、同様の演算を行う。すなわちアラーム1が発生した後、1分遅れでアラーム2が発生する回数を同様に調べる。このようにサンプル数を最大遅れ時間分だけ順番にずらしていき、アラーム1と2が時間遅れで発生する回数の算出を行う。なお、この同時発生の回数又は時間遅れで発生する回数を相関値とする。例えば、最大遅れ時間を100分と入力している場合は、最大で±100サンプル(最大遅れ時間100分/ビット列変換の単位時間1分)ずらして演算を行う。この場合、全部で201の相関値が算出されることになる。そして、横軸にずらしたサンプル数(遅れ時間)、縦軸に相関値とした関数が相互相関関数となる。この相互相関関数を全てのイベントペア(アラームと操作、アラームとアラーム、操作と操作)に対して求める。この相互相関関数の例を図7に示す。図4(a)はアラーム4(ALM_004)とアラーム5(ALM_005)の相互相関関数を示している。図4(b)はアラーム2(ALM_002)とアラーム4(ALM_004)の相関関数を示している。
【0038】
この201の相関値の中で最も大きい相関値(最大相関値)を求める(S105)。アラーム4とアラーム5はずれ量が0の時、最大相関値114をとる。アラーム2とアラーム4はずれ量が80の時、最大相関値2を取る。この最大相関値を全てのイベントペアに対して求める。このように最大遅れ時間に対して相互相関関数を算出することにより、それぞれのアラームが同時に発生する場合のみならず、一定の時間遅れを持って発生する場合についても解析を行うことができる。よってより的確に解析を行うことができる。なお、時間遅れによりずらした分に対応するデータはカウントされないため、計算時間に比べて、最大遅れ時間は十分短くすることが望ましい。
【0039】
次に独立性確率算出部53はイベントペアに対する独立性確率を算出する(S106)。この独立性確率はイベントペアの最大相関値以上の最大相関値が発生し得る確率のことで、上記の最大相関値と同時発生の期待値に基づいて算出することができる。なお、同時発生の期待値とは、アラームが発生した回数に基づいて、確率的にどの程度2つのアラームが同時に発生するかを示す値である。すなわち、2つのアラームの発生回数が多くなるほどアラームが同時発生する回数は多くなる。よって、元のアラーム発生回数に応じて、ある最大相関値を取る確率が変動する。例えば、アラーム4とアラーム5の発生回数が両方とも120回だったとする。この場合、最大相関値114を取る確率は双方の発生回数が120回なので極めて低い。従って、アラーム4とアラーム5は関連していることになる。一方、アラーム3とアラーム6は最大相関値が114を取り、それぞれが1000回発生したとする。この場合、2つのアラームに相関がなくても相関値が114となる確率はアラーム4、5に比べて高くなる。従って、アラーム4とアラーム5はアラーム3とアラーム6に比べて関連していないことになる。このように同じ相関値であったとしてもアラーム4とアラーム5は極めて類似しており、アラーム3とアラーム6はそれほど類似していないと言える。このように同じ最大相関値を取ったイベントペアがあったとしても、元のイベントの発生回数に応じてその相関値が持つ意味が異なる。アラームの発生回数によって同時発生する期待値を考慮することにより、2つのアラームのより正確な類似度を求めることができる。なお、アラーム同士のペアについて述べたが、アラームと操作のイベントペア、操作同士のイベントペアでも同様である。イベントのそれぞれのビット列が1となっている数(計算期間におけるアラーム発生回数に相当)に基づいてこの期待値を算出することができる。そして、その期待値に基づいてある相関値となる確率を求め、相関値に対する確率分布を算出する(S107)。
【0040】
次にこの確率分布に基づいて最大相関値以上となる独立性確率を算出する(S108)。この独立性確率はその最大相関値がどの程度の確率で起こり得るかを示している。すなわち、独立性確率が低いほど、2つのアラームに相関があり類似していることになる。また独立性確率が高いほど、2つのアラームに相関がなく類似していないことになる。このように、最大相関値と同時発生の期待値から独立性確率を求めることで、アラームの発生頻度に応じた2つのアラームの相関度を求めることができる。
【0041】
上記の独立性確率をそれぞれのイベントのペアに対して求める。例えば、アラームが50個、操作が50個ある場合について考え、それぞれをALM_001〜ALM_050、OP_001〜OP_050とする。ALM_001についてはALM_002〜ALM_050とOP_001〜OP_050に対する独立性確率を全部で99個算出する。同様にALM_002に対してはALM_003〜ALM_050及びOP_001〜OP_050に対する独立性確率を全部で98個算出する。なお、ALM_001及びALM_002に基づく独立性確率とALM_002及びALM_001に基づく独立性確率は等しくなるため省略できる。このように、全部で100個のイベント各々を対にして、それぞれの独立性確率を算出する。
【0042】
次に、クラスタリング部54は独立性確率を非類似度と定義し、階層クラスタ分析を行う。すなわち、非類似度に基づいて各イベントの階層型クラスタリングを行う(S108)。ここでは非類似度から類似度(1と非類似度の差)を求め、この類似度を2つのイベント間の距離として、距離の近いものから同じクラスタに入れてグループ分けを行っている。なお本実施の形態では通常の多変量解析に利用されている群平均法を用いており、クラスタ間の距離は2つのクラスタ内の全イベントペアの距離の平均距離として定義される。この平均距離に基づいてクラスタリングを行っている。なお、クラスタリングには最短距離法(最近隣法)、最遠距離法(最遠隣法)、重心法を用いても良い。さらには、これらの方法に重み付けを行っても良い。
【0043】
この階層型クラスタリングの結果を表示する画面の一例を図8に示す。61はクラスタ表示部、62はイベント表示部、63はクラスタ数入力部、64は非類似度(独立性確率)表示部である。この画面はPC10の表示部16に表示され、キーボードやマウスを用いてクラスタ数入力部63に数値が入力される。
【0044】
図8では全イベント数が192のプラントに対して、クラスタ数を5と設定してクラスタリングを行っている例を示す。クラスタ表示部61はデンドログラム(樹状図)の一部に相当し、クラスタに対応するフォルダーがツリー状に表示されている。全イベントを異なるクラスタに分けるとデンドログラム全体を示すことになる。クラスタ表示部で一つのクラスタを指定すると、イベント表示部62にそのクラスタに存在するイベントのリストが表示される。クラスタ数はクラスタ数入力部63に値を入力することによって決定される。このクラスタ数によって非類似度が決定され、非類似度表示部64に表示される。この非類似度以上となるイベントは異なるクラスタに分けられる。なお、非類似度は表示されなくてもよいし、非類似度の代わりに類似度が表示されてもよい。
【0045】
同じクラスタに存在するイベントは1つのフォルダーに含まれる。このフォルダーに含まれるイベントの数はフォルダーの横の数値で示されている。図8ではツリーの最下層にそれぞれ1、5、29、151、6のイベント数のクラスタが存在する。なお、イベントが1つしか無い場合はフォルダーではなく、そのイベントのアイコンで表示される(例えば、図8のALM_001)。この場合、イベント数は表示されない。ここでALMはアラームを、OPは操作を示し、その後の数字、記号がその内容(タグ)を示している。この上層には2つ以上のクラスタが含まれるクラスタが存在していることになる。入力されたクラスタ数に応じて、表示されるクラスタ数及びクラスタ表示部のツリーが変化することになる。このクラスタ数を増やすことにより、より階層分けが進み、同一クラスタに含まれるイベントがより相関が高い(類似している)イベントとなる。そして、クラスタ数を順番に増やしていき、多数のイベントを含むクラスタが発生した時に連鎖発生するアラーム群が2つに分けられたことになる。例えば、図8では151のイベントを含むクラスタと29のイベントを含むクラスタは多数のアラームが同時又は時間遅れを持って連鎖的に発生する可能性が高いことを意味している。このように、このクラスタ数を調整することによって、アラームの解析に適したクラスタに分けることができ、的確にアラームの分析を行うことができる。
【0046】
5つのイベントが含まれるクラスタを選択すると、イベント表示部62にはALM_003、ALM_021、ALM_022、OP_021、OP_022とこのクラスタ含まれる5つのイベントが表示される。この場合、ALM_021、ALM_022に対応する処置としてそれぞれOP_021、OP_022の操作が行われているが、ALM_003に対応する処置が行われていないことが分かる。またALM_021、ALM_022はアラームの番号が近く、ユニットが同じで近接する計器類に対してアラームが発生している。しかし、ALM_0003は番号が離れており、異なるユニットで離間した計器類にまでアラームが発生している事が分かる。このように、一見しただけではプラントにおいて相関していないと考えられる計器類にまでアラームが連鎖的に発生することを認識することが可能になる。従って、作業者はアラームの相関関係を把握することができる。また、あるクラスタにアラームだけが入っていれば、適切な操作がなされていない可能性があることも認識することができる。この場合、発生したアラームに基づいて、適切な操作を行うようにすれば復帰時間を短縮することができる。さらに、あるクラスタに多数のアラームがあるときは、アラームが連鎖的に発生しており、冗長なアラームが存在する可能性があることを認識することができる。この場合、設定値を適切な値に変更するようにしてもよい。逆にクラスタに複数の操作があるときは、冗長な操作がされている可能性があることを認識するができる。不要な操作を排除して、効果的な操作を行うことができる。この場合、過去に行った適切な処置(設定値の変更、機器の動作変更等の操作)を行うようにしてもよい。このようにして適切な処置を行うことにより、復帰時間の短縮化を図ることができる。よって、プラントの稼動率を向上することができ、生産性を改善することが出来る。さらに、プロセス変更などの所定の操作と同じクラスタに存在するアラームを調べることにより、プロセス変更と同時に発生するアラームを認識することができ、計器類に適切な設定値を設定することができる。このように、アラームと操作を関連させてクラスタリングを行うことにより、様々な有益な情報を得ることが出来る。本実施の形態にかかるアラーム解析方法を用いることによって、イベントの発生頻度以外の観点からアラームを解析することができ、連鎖的に発生するアラームに対して適切な対処、処置を行うことが可能になる。例えば、従来までは全く関連のない計器類と考えられていたものであっても、連鎖したアラームを発生することが認識できそれに応じた設定値の変更やプロセスの最適化を図ることができる。
【0047】
発明の実施の形態2.
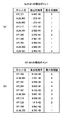
本実施の形態にかかるアラーム解析装置について図9を用いて説明する。本実施の形態では実施の形態1のアラーム解析装置にある特定のアラーム・操作に対して類似ポイントを検索する機能をさらに追加している。すなわち、本実施の形態ではある一つのイベントに注目し、そのイベントと類似するアラームと操作を抽出することができるようになっている。図9(a)はALM_001に類似するアラーム・操作を示す表である。図9(b)はOP_001に類似アラーム・操作を示す表である。
【0048】
例えば、図8のクラスタリングされた画面において、ALM_001をダブルクリックしたとする。ALM_001の類似ポイントが表示される。すなわち、ALM_001と類似度が高いイベント(独立性確率が低いイベント)から順番に表示される。このようにALM_001に対して類似するアラームと操作を表示させ、関連しているイベントを確認することが出来る。同様にして、OP_001の類似ポイントを表示させた結果を図9(b)に示す。本実施の形態ではこのようにある一つのアラーム又は操作に注目して、そのイベントに対して独立性確率が低い順に他のイベントを表示させることができる。特に、発生頻度が多いアラームや復帰時間が長いアラーム等について、本実施の形態で示す情報を表示させることにより、その原因を追求することが容易になる。よって、作業者が適切な処置、対処を行うことができ、復帰時間を短縮することができる。
【0049】
その他の実施の形態.
本発明は上述した実施例だけに限られず、様々な変更が可能である。実施の形態1で示したタグ名、アラーム数、操作数、イベント数、ビット列変換の単位時間、計算期間、最大遅れ時間等は例示であり、上記以外の値であっても良い。例えば、アラーム数、操作数、イベント数はプラントで使用している計器類の数や操作内容の数に応じて異なるものとなる。また、ビット列変換の単位時間、計算時間、最大遅れ時間はオペレーターが任意に設定できるようにしてもよいし、所定の値が設定されていてもよい。
【0050】
実施の形態1では最大遅れ時間に対応するサンプル数に対して相互相関関数を求めたが、最大遅れ時間を0として同時発生の相関値のみでクラスタリングを行っても良い。この場合、時間遅れ発生の相関値が不要となり、相互相関関数を算出することなくクラスタリングを行うことができるため、計算時間の短縮を図ることができる。
【0051】
本発明にかかるアラーム解析装置、アラーム解析方法は実施の形態1で示した通常のパーソナルコンピュータ(PC)以外にもワークステーション、汎用機、FAコンピュータや、これらの組合せによって実施可能であることを容易に理解できるであろう。ただし、これらの構成要素は例示であり、その全ての構成要素が本発明の必須の構成要素となるわけではない。また、プラントに接続された情報処理端末に限らず、収集されたイベント情報を異なる情報処理端末にコピーして解析を行っても良い。さらに、情報処理端末は物理的に単一である必要はなく、複数の端末により並列処理を行っても良い。さらに制御用コンピュータは1つに限らず複数あってもよい。
【0052】
オペレーティング・システムとしては、WindowsNT(マイクロソフトの商標)、Windows95(マイクロソフトの登録商標)、Windows3.x(マイクロソフトの登録商標)、OS/2(IBMの登録商標)、AIX(IBMの登録商標)上のX−WINDOWシステム(MITの登録商標)、Solaris(サンマイクロシステムズの登録商標)などの、標準でGUIマルチウインドウ環境をサポートするものや、PC−DOS(IBMの登録商標)、MS−DOS(マイクロソフトの登録商標)などのキャラクタ・ベース環境のもの、さらにはOS/Open(IBMの登録商標)VxWorks(Wind River Systems, Inc.の登録商標)等のリアルタイムOSでも実現可能であり、特定のオペレーティング・システム環境に限定されるものではない。
【0053】
上述の例において、システムのハードディスク、メモリ等の記憶手段等にインストールされた各種のプログラムは、様々な種類の記憶媒体に格納することが可能であり、また、通信媒体を介して伝達されることが可能である。ここで、記憶媒体には、例えば、フレキシブルディスク、ハードディスク、磁気ディスク、光磁気ディスク、CD−ROM、DVD、ROMカートリッジ、バッテリバックアップ付きRAMメモリカートリッジ、フラッシュメモリカートリッジ、不揮発性RAMカートリッジ等を含む。また、通信媒体には、電話回線等の有線通信媒体、マイクロ波回線等の無線通信媒体等を含み、インターネットも含まれる。本発明は化学プラントに限らず、発電プラント、製造プラント、食品プラント等の様々なプラントやシステムに利用することが出来る。さらには、エラーログからの通信網の故障伝播解析、治療履歴からの伝染病の院内感染解析、勾配履歴と商品広告からの宣伝効果の解析に利用することも可能である。
【0054】
【発明の効果】
本発明によれば、プラントで連鎖的に発生するアラームを的確に分析することができ、復帰時間を短縮することができるアラーム解析方法、アラーム解析装置、アラーム解析プログラムを提供することができる。
【図面の簡単な説明】
【図1】本発明の実施の形態1にかかるアラーム解析方法が用いられるプラントの模式図である。
【図2】本発明の実施の形態1にかかるアラーム解析装置の構成を示すブロック図である。
【図3】アラームログを表示した画面を示す図である。
【図4】本発明の実施の形態1にかかるアラーム解析装置の解析部の構成を示すブロック図である。
【図5】本発明の実施の形態1にかかるアラーム解析方法の解析手順を示すフローチャートである。
【図6】本発明の実施の形態1にかかるアラーム解析装置で2値化したビット列を示すグラフ図である。
【図7】本発明の実施の形態1にかかるアラーム解析方法で算出した相互相関関数を示す図である。
【図8】本発明の実施の形態1にかかるアラーム解析装置でクラスタリング結果を表示した画面を示す図である。
【図9】本発明の実施の形態2にかかるアラーム解析相違で解析された結果を表示した画面を示す図である。
【符号の説明】
1 プラント、 10 制御用コンピュータ、11 通信部、
12 アラーム情報記憶部、13 測定データ記憶部、14 操作情報記憶部
15 解析部、16 入力部、17 表示部
51 ビット列変換部、52 相関関数算出部、53 独立性確率算出部
54 クラスタリング部
61 クラスタ表示部、62 イベント表示部、63 クラスタ数入力部
64 非類似度表示部
101〜105 計器類、201〜204 計器類[0001]
TECHNICAL FIELD OF THE INVENTION
The present invention relates to an alarm analysis device, an alarm analysis method, and an alarm analysis program for analyzing an alarm generated in a control system using a computer in a chemical plant or the like.
[0002]
[Prior art]
In a chemical plant, various instruments, devices, devices, and the like are used. Then, in order to perform production management, safety management, quality management, and operation status management in a chemical plant, when these instruments and the like detect an abnormality, an alarm signal is generated and transmitted to a computer for plant control. The plant control computer receives the alarm signal and displays it on the display device. For example, in instruments such as a thermometer, a flow meter, a liquid level gauge, a barometer, an ammeter, a voltmeter, and a ph meter, when a measured value exceeds a predetermined set value (upper limit value) or a predetermined set value (lower limit value). Value), an alarm is generated. And it has a role to warn when a continuous value in the process takes an abnormal value. This set value must be set differently depending on the process to be executed. In addition, an alarm is generated when a device, device, or the like is not operating normally. These alarms are generated from the respective instruments in the plant, and are notified to an operator or the like when a trouble occurs.
[0003]
When an alarm is generated from each instrument, not only the occurrence of the alarm but also a tag for specifying the generated instrument is displayed on the control computer. This tag includes information such as the place where the instrument is installed, the type of instrument, the number, and the type of alarm. Then, the operator takes measures and measures in accordance with the generated alarm, and returns to normal operation from an abnormal situation. By monitoring this alarm, a trouble can be found early. This tag is stored in the computer database along with the date and time of occurrence, and can be displayed on the computer as an alarm log. This alarm log is used to grasp the management status of the plant.
[0004]
Further, not only alarms, but also operation information such as operation records and operation times of the computer and analog signals from the instruments are recorded in the computer as a database together with the date and time. These can be displayed on a computer as an operation log and a data log, respectively. Plant management is performed based on these pieces of information. Further, there is disclosed a process alarm display device that searches for danger prediction information such as past alarm cases corresponding to a process change event from a database when a process change event occurs, and displays the search result on a computer (for example, Patent Reference 1). Alternatively, a plant control method for estimating a problem or countermeasure based on alarm information or event information or categorizing a problem or countermeasure based on the number of alarm occurrences and the number of operations has been disclosed (for example, Patent Document 1). 2).
[0005]
On the other hand, depending on the alarm, an interlock to another device is taken for safety, and the operation of the other device can be automatically stopped. For example, when the cooling water flow rate of a certain device falls below a set value, the device is automatically stopped to avoid failure of the device. Alternatively, when one device stops, the device operating in conjunction therewith stops, thereby avoiding a failure of the device. As a result, it is possible to prevent the occurrence of further troubles and maintain the safety and operation rate of the entire plant.
[0006]
However, the conventional plant has the following problems. In a large-scale plant, the setting of alarms tends to be stricter as quality improves and equipment becomes more complicated. In addition, there is a problem that if a large number of instruments are used, an alarm generated by one instrument causes a chain of alarms. That is, when one alarm is generated and the operation of another device is stopped as described above, the operation of another device is stopped in tandem with the alarm and an alarm is generated. When another device stops, the measured value of the meter further exceeds the set value, and an alarm is generated. Then, the alarm of one instrument causes a chain of alarms to the instruments that are operating normally. Due to such a chain of alarms, many alarms may be generated at once or with a certain time delay.
[0007]
When alarms occur in a chain like this, the operator cannot grasp the root cause, so it takes time to return to the normal state, and the plant operation rate and productivity decrease. There was a problem that would. In addition, there has been a problem in that the chain of alarms has spread to the entire plant due to the increase in size and complexity of the plant, and the time required for recovery has been further increased. In particular, if the operator is not a skilled worker, when a large number of alarms are generated, not only a long time is required for recovery but also an erroneous treatment may be performed. Accordingly, the time required for the recovery is further prolonged, and a problem also occurs in terms of plant safety.
[0008]
On the other hand, if the process used in the plant is changed, the set values of the instruments and the operation modes of the devices must be changed. For example, the temperature, pressure, pH and the like during the reaction differ depending on the chemicals and materials used. Therefore, the optimal values of the instrument settings are also changed. Therefore, it is necessary to change the set values of the instruments according to the process. This change is made by inputting the value into the control computer. Alternatively, when the setting value has already been input to the control computer, the setting is performed by reading the setting file. However, the reaction of the process may not be stable immediately after the process change. In this case, the hunting of the measured value may alternately exceed the upper limit value and the lower limit value of the meter, and an alarm may be continuously generated. Alternatively, an alarm may be generated by inputting different setting values or reading a different setting file. Furthermore, when performing a new process, the set value may not be appropriate. In some cases, this alarm is used as a starting point to generate a further chain of alarms. Therefore, it takes time to return, and the operation rate and productivity may be reduced.
[0009]
[Patent Document 1]
JP 2001-265429 A
[Patent Document 2]
JP 2001-195122 A
[0010]
[Problems to be solved by the invention]
As described above, in the conventional alarm analysis system, when a chain of alarms occurs, it is not possible to pursue the root cause, and it takes a long time to recover, thereby lowering the productivity of the plant. was there.
[0011]
The present invention has been made to solve such a problem, and an alarm analysis device and an alarm analysis device capable of accurately analyzing an alarm that occurs in a chain in a plant and shortening a recovery time. An object of the present invention is to provide a method and an alarm analysis program.
[0012]
[Means for Solving the Problems]
An alarm analysis device according to the present invention is an alarm analysis device for analyzing a plant alarm based on alarm information of an alarm generated in a plant and operation information for operating instrumentation of the plant, the content and time of the generated alarm. The alarm information storage unit (for example, the alarm
[0013]
The above-described alarm analyzer may further include an input unit for inputting a unit time for bit string conversion, and perform the bit string conversion so as to generate a bit string corresponding to the input unit time.
In the above-described alarm analysis device, the number of clusters may be input to the input unit, and clustering may be performed so as to generate clusters corresponding to the input number of clusters. As a result, more accurate alarm analysis can be performed.
[0014]
Further, in the above-described alarm analysis device, the independence probability calculation unit may correspond to the number of times the first content and the second content occur simultaneously based on the number of times the first content and the second content occur. It is desirable that a probability distribution is calculated and a probability of taking a value equal to or larger than the correlation value is set as an independence probability. As a result, the correlation of the alarm can be checked regardless of the frequency of occurrence.
[0015]
The above-described alarm analysis device includes a cross-correlation function calculator (for example, a
[0016]
In a preferred embodiment of the alarm analysis device described above, the display unit displays a part or all of a dendrogram based on a result of clustering.
[0017]
The alarm analysis method according to the present invention includes a step of storing alarm information by associating the content of the generated alarm with the time; a step of storing operation information by associating the content of the operated operation with the time; Converting the generated alarm occurrence time and the operated time of operation into a bit string for each of the contents, and extracting first contents and second contents different from the first contents from the alarm contents and the operation contents And calculating a correlation value between the two contents based on the bit strings corresponding to the two extracted contents, calculating an independence probability based on the correlation value, and inputting the number of clusters. Based on the independence probability calculated for each of the alarm content and the operation content, the alarm content and And performing clustering to generate a cluster according to the number of said clusters for work contents, those comprising the step of displaying the result of the above clustering. As a result, the alarm can be accurately analyzed.
[0018]
In the above-described alarm analysis method, a probability distribution according to the number of times the first contents and the second contents occur simultaneously is determined based on the number of times the first contents and the second contents occur within the calculation period. The probability of calculating and taking a value greater than or equal to the correlation value may be used as the independence probability. Thus, an alarm can be associated regardless of the frequency of occurrence.
[0019]
The preferred embodiment of the above-described alarm analysis method further comprises a step of inputting a calculation period and a unit time of bit string conversion, and the alarm occurrence time and the operation time operated during the calculation period are calculated in the calculation period and the bit string conversion unit. It is converted into a bit string having a bit length corresponding to time.
[0020]
The above-described alarm analysis method includes a step of inputting a maximum delay time, a step of calculating a correlation value of the number of samples according to the maximum delay time and a unit time of bit string conversion to calculate a cross-correlation function, It is preferable that the method further includes a step of calculating a maximum correlation value that maximizes the value of., And in the step of calculating the independence probability, the independence probability is calculated based on the maximum correlation value. As a result, it is possible to associate an alarm that occurs with a time delay.
[0021]
In a preferred embodiment of the alarm analysis method described above, the displaying step displays a part or all of the dendrogram based on the clustering result.
[0022]
An alarm analysis program according to the present invention is an alarm analysis program for analyzing a plant alarm based on alarm information having the content and time of occurrence of an alarm and operation information having the content and operation time of an operator. Converting the alarm occurrence time and the operation time during the calculation period into a bit string for each of the alarm content and the operation content; and converting the first content from the alarm content and the operation content. Extracting a second content different from the first content, calculating a correlation value between the two contents based on the extracted bit strings of the two contents, and calculating an independence probability based on the correlation value. Calculating and clustering based on the independence probabilities calculated for the respective contents. And-up the clustered results are those comprising a step of displaying on the display unit of the computer. As a result, the alarm can be accurately analyzed.
[0023]
A step of inputting a maximum delay time to a computer; a step of calculating a cross-correlation function for the maximum delay time; and a step of calculating a maximum correlation value based on the cross-correlation function; In the step of calculating the probability, the independence probability is calculated based on the maximum correlation value. As a result, it is possible to associate an alarm that occurs with a time delay.
[0024]
Calculating a probability distribution according to the number of times the first content and the second content occur simultaneously based on the number of times the first content and the second content occur in the alarm analysis program, The probability of taking a value equal to or greater than the correlation value may be used as the independence probability. Thus, an alarm can be associated regardless of the frequency of occurrence.
[0025]
The above-described alarm analysis program preferably further includes a step of inputting the number of clusters to the computer, and it is preferable that clustering is performed so as to generate clusters corresponding to the input number of clusters. Thereby, it is possible to analyze the chained alarm more accurately.
[0026]
In a preferred embodiment of the above-mentioned alarm analysis program, the displaying step displays a part or the whole of a dendrogram based on a result of the clustering.
[0027]
BEST MODE FOR CARRYING OUT THE INVENTION
An alarm analysis device according to the present invention will be described with reference to FIGS. FIG. 1 is a schematic diagram showing an entire plant in which the alarm analysis device according to the present invention is used. 1 is a plant and 10 is a control computer (hereinafter, referred to as PC). 101 to 105 are instruments, which belong to the same unit.
[0028]
The instruments are each one instrument, device, and device. The devices and devices include heaters, air conditioners, valves, and the like. This instrument includes instruments such as a thermometer, a flow meter, a liquid level gauge, a barometer, an ammeter, a voltmeter, and a ph meter. Upper and lower limits are set for these instruments. These upper and lower limits may be set in two stages, and the set values (thresholds) are set to HH, HI, LO, and LL in descending order. During normal operation, the continuous value measured by the instrument is between HI and LO. In addition, a state where the continuous value exceeds HH is higher in danger than a state where the continuous value exceeds HI. Similarly, a state exceeding LL means a higher risk than a state exceeding LO. When the threshold is exceeded, the instrument generates an HH alarm, a HI alarm, a LO alarm, and an LL alarm, respectively, according to the measured value. Therefore, four types of alarms are generated by one instrument. Note that there are cases where the four setting values of HH, HI, LO, and LL are not provided in each instrument. For example, since the flow rate and the like need only be equal to or greater than the set value, only LO and LL may be provided in some cases. Also, in the case of a device or an apparatus, an alarm is generated when an abnormality such as a device failure occurs.
[0029]
Each instrument is connected to the
[0030]
The configuration of the
[0031]
The alarm generated in each instrument in the plant and the measurement value of the instrument are received by the
[0032]
Similarly, the measurement data stored in the measurement
The operator can change the process or change the set value using the
[0033]
When the operator executes the alarm analysis according to the present invention, the
[0034]
Next, this analysis method will be described in detail with reference to FIGS. FIG. 4 is a block diagram showing a configuration inside the
[0035]
First, when performing an analysis, the operator inputs three parameters of a unit time of bit string conversion, a maximum delay time, and a calculation period (S102). For example, if it is assumed that 0:00 on November 13, 2002 and 0:00 on November 14, 2002 are input in the calculation period, information based on the event that has occurred in the past 24 hours (hereinafter referred to as event information) will be described. The analysis is performed. Assuming that 1 minute is input as the unit time of the bit string conversion, the 24 hours are divided into 1 minute, and data of 24 hours × 60 minutes = 1440 samples is analyzed. The maximum delay time will be described later.
[0036]
When the above parameters are input, first, event occurrence time data (alarm occurrence time data and operation time data) at which each event has occurred is generated (S101). That is, for each event, a data string for the number of times the event has occurred is generated (S101). Then, the bit
[0037]
Next, the cross-correlation
[0038]
The largest correlation value (maximum correlation value) among the 201 correlation values is obtained (S105). When the deviation amount between the
[0039]
Next, the independence
[0040]
Next, an independence probability that is equal to or greater than the maximum correlation value is calculated based on the probability distribution (S108). The independence probability indicates how likely the maximum correlation value is to occur. That is, the lower the independence probability is, the more similar the two alarms are. Also, the higher the probability of independence, the less closely the two alarms are correlated and dissimilar. As described above, by obtaining the independence probability from the maximum correlation value and the expected value of simultaneous occurrence, the degree of correlation between two alarms according to the frequency of occurrence of the alarm can be obtained.
[0041]
The above independence probabilities are determined for each pair of events. For example, consider a case where there are 50 alarms and 50 operations, and let them be ALM_001 to ALM_050 and OP_001 to OP_050. For ALM_001, 99 independence probabilities for ALM_002 to ALM_050 and OP_001 to OP_050 are calculated in total. Similarly, for ALM_002, 98 independence probabilities for ALM_003 to ALM_050 and OP_001 to OP_050 are calculated in total. Note that the independence probability based on ALM_001 and ALM_002 and the independence probability based on ALM_002 and ALM_001 are equal, and therefore can be omitted. In this way, the independence probabilities are calculated for each of the 100 events as a pair.
[0042]
Next, the clustering unit 54 defines the independence probability as the dissimilarity and performs a hierarchical cluster analysis. That is, hierarchical clustering of each event is performed based on the dissimilarity (S108). Here, the similarity (the difference between 1 and the dissimilarity) is obtained from the dissimilarity, and the similarity is set as the distance between two events, and the grouping is performed by putting the similarity into the same cluster from the closest one. In this embodiment, the group averaging method used for ordinary multivariate analysis is used, and the distance between clusters is defined as the average distance of all event pairs in two clusters. Clustering is performed based on this average distance. Note that the shortest distance method (the nearest neighbor method), the farthest distance method (the farthest neighbor method), or the centroid method may be used for clustering. Further, these methods may be weighted.
[0043]
FIG. 8 shows an example of a screen displaying the result of the hierarchical clustering. 61 is a cluster display unit, 62 is an event display unit, 63 is a cluster number input unit, and 64 is a dissimilarity (independence probability) display unit. This screen is displayed on the display unit 16 of the
[0044]
FIG. 8 shows an example in which clustering is performed on a plant having a total number of events of 192 by setting the number of clusters to 5. The
[0045]
Events that exist in the same cluster are included in one folder. The number of events contained in this folder is indicated by a number next to the folder. In FIG. 8, clusters with the number of events of 1, 5, 29, 151, and 6 respectively exist at the lowest layer of the tree. If there is only one event, the event is displayed not as a folder but as an icon of the event (for example, ALM_001 in FIG. 8). In this case, the number of events is not displayed. Here, ALM indicates an alarm, OP indicates an operation, and subsequent numbers and symbols indicate the contents (tags). In this upper layer, there are clusters including two or more clusters. The number of clusters to be displayed and the tree of the cluster display section change according to the input number of clusters. By increasing the number of clusters, hierarchical division is further advanced, and events included in the same cluster become events having higher correlation (similarity). Then, by increasing the number of clusters in order, the alarm group that is chained when a cluster including a large number of events occurs is divided into two groups. For example, in FIG. 8, a cluster including 151 events and a cluster including 29 events mean that a large number of alarms are likely to occur simultaneously or in a chain with a time delay. As described above, by adjusting the number of clusters, the clusters can be divided into clusters suitable for alarm analysis, and alarm analysis can be performed accurately.
[0046]
When a cluster including five events is selected, the
[0047]
An alarm analysis device according to the present embodiment will be described with reference to FIG. In the present embodiment, a function of searching for a similar point for a specific alarm / operation in the alarm analyzer of the first embodiment is further added. That is, in the present embodiment, attention is paid to one event, and an alarm and an operation similar to the event can be extracted. FIG. 9A is a table showing alarms / operations similar to ALM_001. FIG. 9B is a table showing alarms / operations similar to OP_001.
[0048]
For example, suppose that ALM_001 is double-clicked on the clustered screen of FIG. A similar point of ALM_001 is displayed. That is, events having a high similarity to ALM_001 (events having a low independence probability) are displayed in order. In this manner, similar alarms and operations can be displayed for ALM_001, and related events can be confirmed. Similarly, FIG. 9B shows the result of displaying the similar point of OP_001. In the present embodiment, attention can be paid to one alarm or operation as described above, and other events can be displayed in descending order of the independence probability with respect to the event. In particular, by displaying the information shown in the present embodiment for an alarm that frequently occurs, an alarm that has a long recovery time, and the like, it becomes easy to find the cause. Therefore, the operator can take appropriate measures and measures, and the return time can be reduced.
[0049]
Other embodiments.
The present invention is not limited to the above-described embodiment, and various modifications are possible. The tag name, the number of alarms, the number of operations, the number of events, the unit time of bit string conversion, the calculation period, the maximum delay time, and the like described in the first embodiment are examples, and may be other values. For example, the number of alarms, the number of operations, and the number of events vary depending on the number of instruments and the number of operation contents used in the plant. The unit time, the calculation time, and the maximum delay time of the bit string conversion may be arbitrarily set by the operator, or may be set to predetermined values.
[0050]
In the first embodiment, the cross-correlation function is obtained for the number of samples corresponding to the maximum delay time. However, clustering may be performed using only simultaneous correlation values with the maximum delay time being 0. In this case, the correlation value of the occurrence of the time delay becomes unnecessary, and the clustering can be performed without calculating the cross-correlation function, so that the calculation time can be reduced.
[0051]
The alarm analysis device and the alarm analysis method according to the present invention can be easily implemented by a workstation, a general-purpose machine, an FA computer, or a combination thereof in addition to the ordinary personal computer (PC) shown in the first embodiment. You will understand. However, these components are merely examples, and not all of them are essential components of the present invention. In addition, not limited to the information processing terminal connected to the plant, the collected event information may be copied to another information processing terminal for analysis. Further, the information processing terminal does not need to be physically single, and a plurality of terminals may perform parallel processing. Further, the number of control computers is not limited to one, but may be plural.
[0052]
Operating systems include WindowsNT (a trademark of Microsoft), Windows95 (a registered trademark of Microsoft), Windows3. x (registered trademark of Microsoft), OS / 2 (registered trademark of IBM), X-WINDOW system on AIX (registered trademark of IBM) (registered trademark of MIT), Solaris (registered trademark of Sun Microsystems), etc. The one that supports the GUI multi-window environment as standard, the one based on character-based environment such as PC-DOS (registered trademark of IBM), the one of MS-DOS (registered trademark of Microsoft), and the OS / Open (registered trademark of IBM) ) A real-time OS such as VxWorks (registered trademark of Wind River Systems, Inc.) can also be realized, and is not limited to a specific operating system environment.
[0053]
In the above example, various programs installed in storage means such as a hard disk and a memory of the system can be stored in various types of storage media, and transmitted via a communication medium. Is possible. Here, the storage medium includes, for example, a flexible disk, a hard disk, a magnetic disk, a magneto-optical disk, a CD-ROM, a DVD, a ROM cartridge, a RAM memory cartridge with a battery backup, a flash memory cartridge, a nonvolatile RAM cartridge, and the like. Further, the communication medium includes a wired communication medium such as a telephone line, a wireless communication medium such as a microwave line, and the like, and also includes the Internet. The present invention is not limited to chemical plants, but can be used in various plants and systems such as power plants, manufacturing plants, and food plants. Furthermore, it can also be used for analysis of communication network failure propagation from error logs, analysis of in-hospital infection of infectious diseases from treatment history, and analysis of advertising effects from gradient history and product advertisement.
[0054]
【The invention's effect】
Advantageous Effects of Invention According to the present invention, it is possible to provide an alarm analysis method, an alarm analysis device, and an alarm analysis program that can accurately analyze an alarm that occurs in a chain in a plant and that can shorten a recovery time.
[Brief description of the drawings]
FIG. 1 is a schematic diagram of a plant in which an alarm analysis method according to a first embodiment of the present invention is used.
FIG. 2 is a block diagram illustrating a configuration of the alarm analysis device according to the first embodiment of the present invention;
FIG. 3 is a diagram showing a screen displaying an alarm log.
FIG. 4 is a block diagram illustrating a configuration of an analysis unit of the alarm analysis device according to the first embodiment of the present invention;
FIG. 5 is a flowchart illustrating an analysis procedure of the alarm analysis method according to the first embodiment of the present invention;
FIG. 6 is a graph showing a bit string binarized by the alarm analysis device according to the first exemplary embodiment of the present invention;
FIG. 7 is a diagram illustrating a cross-correlation function calculated by the alarm analysis method according to the first embodiment of the present invention;
FIG. 8 is a diagram showing a screen on which a clustering result is displayed by the alarm analysis device according to the first exemplary embodiment of the present invention;
FIG. 9 is a diagram illustrating a screen displaying a result analyzed based on a difference in alarm analysis according to the second embodiment of the present invention;
[Explanation of symbols]
1 plant, 10 control computer, 11 communication unit,
12 alarm information storage unit, 13 measurement data storage unit, 14 operation information storage unit
15 analysis unit, 16 input unit, 17 display unit
51 bit string converter, 52 correlation function calculator, 53 independence probability calculator
54 Clustering Department
61 cluster display section, 62 event display section, 63 cluster number input section
64 dissimilarity indicator
101-105 instruments, 201-204 instruments
Claims (16)
発生したアラームの内容と発生時刻を対応させたアラーム情報を記憶するアラーム情報記憶部と、
操作した内容と操作時刻を対応させた操作情報を記憶する操作情報記憶部と、
アラーム内容及び操作内容のそれぞれの内容に対して、前記アラーム発生時刻及び操作時刻をビット列に変換するビット列変換部と、
前記アラーム内容及び操作内容から第1の内容と前記第1の内容と異なる第2の内容を抽出し、抽出された2つの内容に対応するビット列に基づいて2つの内容の相関値を算出し、算出された相関値に基づいて独立性確率を算出する独立性確率算出部と、
前記アラーム内容及び操作内容のそれぞれの内容に対して算出された独立性確率に基づいて、前記アラーム内容及び操作内容のクラスタリングを行うクラスタリング部と、
前記クラスタリングされた結果を表示する表示部を備えるアラーム解析装置。An alarm analyzer that analyzes a plant alarm based on alarm information of an alarm generated in the plant and operation information for operating instrumentation of the plant,
An alarm information storage unit that stores alarm information in which the content of the generated alarm corresponds to the time of occurrence;
An operation information storage unit that stores operation information in which operation contents correspond to operation times;
A bit string conversion unit that converts the alarm occurrence time and the operation time into a bit string for each of the alarm content and the operation content;
Extracting a first content and a second content different from the first content from the alarm content and the operation content, and calculating a correlation value between the two content based on a bit string corresponding to the extracted two content; An independence probability calculation unit that calculates an independence probability based on the calculated correlation value,
A clustering unit that performs clustering of the alarm content and the operation content based on the independence probability calculated for each of the alarm content and the operation content;
An alarm analysis device including a display unit for displaying the clustered result.
前記入力された単位時間に対応したビット列を生成するようにビット列変換を行う請求項1記載のアラーム解析装置。An input unit for inputting a unit time of the bit string conversion is further provided,
2. The alarm analysis device according to claim 1, wherein bit string conversion is performed so as to generate a bit string corresponding to the input unit time.
前記入力されたクラスタ数に対応したクラスタを生成するようにクラスタリングを行う請求項2記載のアラーム解析装置。Input the number of clusters in the input unit,
3. The alarm analysis device according to claim 2, wherein clustering is performed so as to generate clusters corresponding to the input number of clusters.
前記独立性確率算出部では前記相互相関関数の最大の相関値に基づいて独立性確率を算出する請求項1乃至4いずれかに記載のアラーム解析装置。A cross-correlation function calculating unit for obtaining a cross-correlation function based on the bit strings corresponding to the first content and the second content;
The alarm analysis device according to claim 1, wherein the independence probability calculation unit calculates the independence probability based on a maximum correlation value of the cross-correlation function.
操作した操作内容と時刻を対応させた操作情報を記憶するステップと、
アラーム内容及び操作内容のそれぞれの内容に対して、前記アラーム発生時刻及び操作時刻をビット列に変換するステップと、
前記アラーム内容及び操作内容から第1の内容と前記第1の内容と異なる第2の内容を抽出するステップと
抽出された2つの内容に対応するビット列に基づいて2つの内容の相関値を算出するステップと、
前記相関値に基づいて独立性確率を算出するステップと、
クラスタ数を入力するステップと
前記アラーム内容及び操作内容のそれぞれの内容に対して算出された独立性確率に基づいて、前記アラーム内容及び操作内容について前記クラスタ数に応じたクラスタを生成するようクラスタリングを行うステップと、
前記クラスタリングされた結果を表示するステップを備えるアラーム解析方法。Storing the alarm information by associating the content of the generated alarm with the time;
Storing operation information in which the operation contents and the time corresponding to the operated operation are stored;
Converting the alarm occurrence time and the operation time into a bit string for each of the alarm contents and the operation contents;
Extracting a first content and a second content different from the first content from the alarm content and the operation content, and calculating a correlation value between the two content based on a bit string corresponding to the extracted two content. Steps and
Calculating the independence probability based on the correlation value,
Based on the step of inputting the number of clusters and the independence probability calculated for each of the alarm content and the operation content, clustering is performed so as to generate a cluster corresponding to the number of clusters for the alarm content and the operation content. Steps to perform;
Displaying the clustered result.
前記ビット列に変換するステップでは、計算期間内に発生したアラーム発生時刻及び操作した操作時刻を計算期間及びビット列変換の単位時間に対応したビット長のビット列に変換することを特徴とする請求項7又は8記載のアラーム解析方法。Further comprising a step of inputting a calculation period and a unit time of bit string conversion,
8. The method according to claim 7, wherein, in the step of converting into a bit string, an alarm generation time and an operation time when the alarm occurred during a calculation period are converted into a bit string having a bit length corresponding to a calculation time and a unit time of bit string conversion. 8. The alarm analysis method according to 8.
前記最大遅れ時間とビット列変換の単位時間に応じたサンプル数の相関値を計算して相互相関関数を算出するステップと、
前記相互相関関数の値が最大となる最大相関値を算出するステップをさらに備え、
前記独立性確率を算出するステップでは前記最大相関値に基づいて独立性確率を算出する請求項7乃至9いずれかに記載のアラーム解析方法。Inputting a maximum delay time;
Calculating a cross-correlation function by calculating a correlation value of the number of samples according to the unit time of the maximum delay time and bit string conversion,
The method further comprises a step of calculating a maximum correlation value at which the value of the cross-correlation function is maximum,
The alarm analysis method according to claim 7, wherein in the step of calculating the independence probability, the independence probability is calculated based on the maximum correlation value.
アラーム内容及び操作内容のそれぞれの内容に対して、計算期間内に発生したアラーム発生時刻及び操作した操作時刻をビット列に変換するステップと、
前記アラーム内容及び操作内容の中から第1の内容と前記第1の内容と異なる第2の内容を抽出するステップと、
抽出された2つの内容のビット列に基づいて2つの内容の相関値を算出するステップと、
前記相関値に基づいて独立性確率を算出するステップと、
それぞれの内容に対して算出された前記独立性確率に基づいてクラスタリングを行うステップと
前記クラスタリングされた結果をコンピュータの表示部に表示するステップを備えるアラーム解析プログラム。An alarm analysis program for analyzing the alarm of the plant based on the alarm information having the content and the time of occurrence of the alarm and the operation information having the content and operation time operated by the operator,
For each of the alarm content and the operation content, converting the alarm occurrence time and the operation time operated during the calculation period into a bit string;
Extracting a first content and a second content different from the first content from the alarm content and the operation content;
Calculating a correlation value of the two contents based on the extracted bit strings of the two contents;
Calculating the independence probability based on the correlation value,
An alarm analysis program, comprising: a step of performing clustering based on the independence probability calculated for each content; and a step of displaying the clustered result on a display unit of a computer.
前記最大遅れ時間に対して相互相関関数を算出するステップと、
前記相互相関関数に基づいて最大相関値を算出するステップをさらに備え、
前記独立性確率を算出するステップでは前記最大相関値に基づいて独立性確率を算出する請求項12記載のアラーム解析プログラム。Entering a maximum delay time for the computer;
Calculating a cross-correlation function for the maximum delay time,
Further comprising calculating a maximum correlation value based on the cross-correlation function,
13. The alarm analysis program according to claim 12, wherein in the step of calculating the independence probability, the independence probability is calculated based on the maximum correlation value.
前記入力されたクラスタ数に対応したクラスタを生成するようにクラスタリングを行う請求項12乃至14いずれかに記載のアラーム解析プログラム。Further comprising the step of entering the number of clusters for the computer,
15. The alarm analysis program according to claim 12, wherein clustering is performed so as to generate clusters corresponding to the input number of clusters.
Priority Applications (1)
| Application Number | Priority Date | Filing Date | Title |
|---|---|---|---|
| JP2002362531A JP4079761B2 (en) | 2002-12-13 | 2002-12-13 | Alarm analysis apparatus, alarm analysis method, and alarm analysis program |
Applications Claiming Priority (1)
| Application Number | Priority Date | Filing Date | Title |
|---|---|---|---|
| JP2002362531A JP4079761B2 (en) | 2002-12-13 | 2002-12-13 | Alarm analysis apparatus, alarm analysis method, and alarm analysis program |
Publications (2)
| Publication Number | Publication Date |
|---|---|
| JP2004192543A true JP2004192543A (en) | 2004-07-08 |
| JP4079761B2 JP4079761B2 (en) | 2008-04-23 |
Family
ID=32760950
Family Applications (1)
| Application Number | Title | Priority Date | Filing Date |
|---|---|---|---|
| JP2002362531A Expired - Lifetime JP4079761B2 (en) | 2002-12-13 | 2002-12-13 | Alarm analysis apparatus, alarm analysis method, and alarm analysis program |
Country Status (1)
| Country | Link |
|---|---|
| JP (1) | JP4079761B2 (en) |
Cited By (5)
| Publication number | Priority date | Publication date | Assignee | Title |
|---|---|---|---|---|
| WO2013003165A2 (en) | 2011-06-28 | 2013-01-03 | Honeywell International Inc. | Historical alarm analysis apparatus and method |
| WO2018073955A1 (en) * | 2016-10-21 | 2018-04-26 | 日本電気株式会社 | System analysis method, system analysis device, and program |
| KR20200025277A (en) * | 2018-08-30 | 2020-03-10 | 한국항공우주연구원 | Method for maintenance period decision for pump or blower for satellite thermal vacuum chamber and control apparatus and method for pump or blower maintenance using the same |
| US10635096B2 (en) | 2017-05-05 | 2020-04-28 | Honeywell International Inc. | Methods for analytics-driven alarm rationalization, assessment of operator response, and incident diagnosis and related systems |
| US10747207B2 (en) | 2018-06-15 | 2020-08-18 | Honeywell International Inc. | System and method for accurate automatic determination of “alarm-operator action” linkage for operator assessment and alarm guidance using custom graphics and control charts |
-
2002
- 2002-12-13 JP JP2002362531A patent/JP4079761B2/en not_active Expired - Lifetime
Cited By (9)
| Publication number | Priority date | Publication date | Assignee | Title |
|---|---|---|---|---|
| WO2013003165A2 (en) | 2011-06-28 | 2013-01-03 | Honeywell International Inc. | Historical alarm analysis apparatus and method |
| WO2013003165A3 (en) * | 2011-06-28 | 2013-02-28 | Honeywell International Inc. | Historical alarm analysis apparatus and method |
| EP2726947A4 (en) * | 2011-06-28 | 2015-06-24 | Honeywell Int Inc | Historical alarm analysis apparatus and method |
| US9355477B2 (en) | 2011-06-28 | 2016-05-31 | Honeywell International Inc. | Historical alarm analysis apparatus and method |
| WO2018073955A1 (en) * | 2016-10-21 | 2018-04-26 | 日本電気株式会社 | System analysis method, system analysis device, and program |
| US10635096B2 (en) | 2017-05-05 | 2020-04-28 | Honeywell International Inc. | Methods for analytics-driven alarm rationalization, assessment of operator response, and incident diagnosis and related systems |
| US10747207B2 (en) | 2018-06-15 | 2020-08-18 | Honeywell International Inc. | System and method for accurate automatic determination of “alarm-operator action” linkage for operator assessment and alarm guidance using custom graphics and control charts |
| KR20200025277A (en) * | 2018-08-30 | 2020-03-10 | 한국항공우주연구원 | Method for maintenance period decision for pump or blower for satellite thermal vacuum chamber and control apparatus and method for pump or blower maintenance using the same |
| KR102115430B1 (en) * | 2018-08-30 | 2020-05-26 | 한국항공우주연구원 | Method for pump or blower maintenance for satellite thermal vacuum chamber |
Also Published As
| Publication number | Publication date |
|---|---|
| JP4079761B2 (en) | 2008-04-23 |
Similar Documents
| Publication | Publication Date | Title |
|---|---|---|
| JP4314123B2 (en) | Alarm analysis device, alarm analysis method, and alarm analysis program | |
| US20110178963A1 (en) | system for the detection of rare data situations in processes | |
| JP6708203B2 (en) | Information processing apparatus, information processing method, and program | |
| KR20080098332A (en) | Graphical user interface for presenting multivariate fault contributions | |
| US20160109526A1 (en) | System and method for ups battery monitoring and data analysis | |
| JP2013008111A (en) | Abnormality sign diagnostic device and abnormality sign diagnostic method | |
| WO2022038804A1 (en) | Diagnostic device and parameter adjustment method | |
| Dorgo et al. | Decision trees for informative process alarm definition and alarm-based fault classification | |
| WO2021241576A1 (en) | Abnormal modulation cause identification device, abnormal modulation cause identification method, and abnormal modulation cause identification program | |
| JP2019036186A (en) | Abnormality detection model construction apparatus, abnormality detection model construction method and program | |
| Xie et al. | Monitoring time-between-events for health management | |
| US7529790B1 (en) | System and method of data analysis | |
| JP4079761B2 (en) | Alarm analysis apparatus, alarm analysis method, and alarm analysis program | |
| CN110009126A (en) | The online alarm analysis method merged based on PLS model with PCA contribution degree | |
| WO2019073512A1 (en) | System analysis method, system analysis device, and program | |
| CN115917460A (en) | Abnormal modulation cause identification device, abnormal modulation cause identification method, and abnormal modulation cause identification program | |
| CN112949735A (en) | Liquid hazardous chemical substance volatile concentration abnormity discovery method based on outlier data mining | |
| WO2017046906A1 (en) | Data analysis device and analysis method | |
| TWI639908B (en) | Method for detecting and diagnosing an abnormal process | |
| CN110517731A (en) | Genetic test quality monitoring data processing method and system | |
| US11954945B2 (en) | Systems and methods for analyzing machine performance | |
| Ding et al. | A data analytic engine towards self-management of cyber-physical systems | |
| CN111638989B (en) | Fault diagnosis method, device, storage medium and equipment | |
| CN105930870A (en) | Engineering safety monitoring data outlier detection method | |
| JP7180772B2 (en) | MONITORING METHOD, MONITORING DEVICE, RECORDING MEDIUM |
Legal Events
| Date | Code | Title | Description |
|---|---|---|---|
| A621 | Written request for application examination |
Free format text: JAPANESE INTERMEDIATE CODE: A621 Effective date: 20041224 |
|
| A131 | Notification of reasons for refusal |
Free format text: JAPANESE INTERMEDIATE CODE: A131 Effective date: 20070724 |
|
| A521 | Request for written amendment filed |
Free format text: JAPANESE INTERMEDIATE CODE: A523 Effective date: 20070919 |
|
| A131 | Notification of reasons for refusal |
Free format text: JAPANESE INTERMEDIATE CODE: A131 Effective date: 20071023 |
|
| A521 | Request for written amendment filed |
Free format text: JAPANESE INTERMEDIATE CODE: A523 Effective date: 20071219 |
|
| TRDD | Decision of grant or rejection written | ||
| A01 | Written decision to grant a patent or to grant a registration (utility model) |
Free format text: JAPANESE INTERMEDIATE CODE: A01 Effective date: 20080129 |
|
| A61 | First payment of annual fees (during grant procedure) |
Free format text: JAPANESE INTERMEDIATE CODE: A61 Effective date: 20080205 |
|
| FPAY | Renewal fee payment (event date is renewal date of database) |
Free format text: PAYMENT UNTIL: 20110215 Year of fee payment: 3 |
|
| R150 | Certificate of patent or registration of utility model |
Free format text: JAPANESE INTERMEDIATE CODE: R150 Ref document number: 4079761 Country of ref document: JP Free format text: JAPANESE INTERMEDIATE CODE: R150 |
|
| FPAY | Renewal fee payment (event date is renewal date of database) |
Free format text: PAYMENT UNTIL: 20120215 Year of fee payment: 4 |
|
| FPAY | Renewal fee payment (event date is renewal date of database) |
Free format text: PAYMENT UNTIL: 20130215 Year of fee payment: 5 |
|
| FPAY | Renewal fee payment (event date is renewal date of database) |
Free format text: PAYMENT UNTIL: 20140215 Year of fee payment: 6 |
|
| EXPY | Cancellation because of completion of term |