ES2906161T3 - Complementary Approaches for IL-2-Based Therapies and Mesenchymal Stem Cell-Based Therapies - Google Patents
Complementary Approaches for IL-2-Based Therapies and Mesenchymal Stem Cell-Based Therapies Download PDFInfo
- Publication number
- ES2906161T3 ES2906161T3 ES16804415T ES16804415T ES2906161T3 ES 2906161 T3 ES2906161 T3 ES 2906161T3 ES 16804415 T ES16804415 T ES 16804415T ES 16804415 T ES16804415 T ES 16804415T ES 2906161 T3 ES2906161 T3 ES 2906161T3
- Authority
- ES
- Spain
- Prior art keywords
- biomarkers
- levels
- individual
- sample
- expression
- Prior art date
- Legal status (The legal status is an assumption and is not a legal conclusion. Google has not performed a legal analysis and makes no representation as to the accuracy of the status listed.)
- Active
Links
Classifications
-
- A—HUMAN NECESSITIES
- A61—MEDICAL OR VETERINARY SCIENCE; HYGIENE
- A61K—PREPARATIONS FOR MEDICAL, DENTAL OR TOILETRY PURPOSES
- A61K35/00—Medicinal preparations containing materials or reaction products thereof with undetermined constitution
- A61K35/12—Materials from mammals; Compositions comprising non-specified tissues or cells; Compositions comprising non-embryonic stem cells; Genetically modified cells
- A61K35/28—Bone marrow; Haematopoietic stem cells; Mesenchymal stem cells of any origin, e.g. adipose-derived stem cells
-
- A—HUMAN NECESSITIES
- A61—MEDICAL OR VETERINARY SCIENCE; HYGIENE
- A61K—PREPARATIONS FOR MEDICAL, DENTAL OR TOILETRY PURPOSES
- A61K38/00—Medicinal preparations containing peptides
- A61K38/16—Peptides having more than 20 amino acids; Gastrins; Somatostatins; Melanotropins; Derivatives thereof
- A61K38/17—Peptides having more than 20 amino acids; Gastrins; Somatostatins; Melanotropins; Derivatives thereof from animals; from humans
- A61K38/19—Cytokines; Lymphokines; Interferons
- A61K38/20—Interleukins [IL]
- A61K38/2013—IL-2
-
- A—HUMAN NECESSITIES
- A61—MEDICAL OR VETERINARY SCIENCE; HYGIENE
- A61K—PREPARATIONS FOR MEDICAL, DENTAL OR TOILETRY PURPOSES
- A61K38/00—Medicinal preparations containing peptides
- A61K38/16—Peptides having more than 20 amino acids; Gastrins; Somatostatins; Melanotropins; Derivatives thereof
- A61K38/43—Enzymes; Proenzymes; Derivatives thereof
-
- A—HUMAN NECESSITIES
- A61—MEDICAL OR VETERINARY SCIENCE; HYGIENE
- A61P—SPECIFIC THERAPEUTIC ACTIVITY OF CHEMICAL COMPOUNDS OR MEDICINAL PREPARATIONS
- A61P35/00—Antineoplastic agents
-
- C—CHEMISTRY; METALLURGY
- C07—ORGANIC CHEMISTRY
- C07K—PEPTIDES
- C07K16/00—Immunoglobulins [IGs], e.g. monoclonal or polyclonal antibodies
- C07K16/18—Immunoglobulins [IGs], e.g. monoclonal or polyclonal antibodies against material from animals or humans
- C07K16/24—Immunoglobulins [IGs], e.g. monoclonal or polyclonal antibodies against material from animals or humans against cytokines, lymphokines or interferons
- C07K16/244—Interleukins [IL]
- C07K16/246—IL-2
-
- C—CHEMISTRY; METALLURGY
- C12—BIOCHEMISTRY; BEER; SPIRITS; WINE; VINEGAR; MICROBIOLOGY; ENZYMOLOGY; MUTATION OR GENETIC ENGINEERING
- C12N—MICROORGANISMS OR ENZYMES; COMPOSITIONS THEREOF; PROPAGATING, PRESERVING, OR MAINTAINING MICROORGANISMS; MUTATION OR GENETIC ENGINEERING; CULTURE MEDIA
- C12N5/00—Undifferentiated human, animal or plant cells, e.g. cell lines; Tissues; Cultivation or maintenance thereof; Culture media therefor
- C12N5/0018—Culture media for cell or tissue culture
-
- C—CHEMISTRY; METALLURGY
- C12—BIOCHEMISTRY; BEER; SPIRITS; WINE; VINEGAR; MICROBIOLOGY; ENZYMOLOGY; MUTATION OR GENETIC ENGINEERING
- C12N—MICROORGANISMS OR ENZYMES; COMPOSITIONS THEREOF; PROPAGATING, PRESERVING, OR MAINTAINING MICROORGANISMS; MUTATION OR GENETIC ENGINEERING; CULTURE MEDIA
- C12N5/00—Undifferentiated human, animal or plant cells, e.g. cell lines; Tissues; Cultivation or maintenance thereof; Culture media therefor
- C12N5/06—Animal cells or tissues; Human cells or tissues
- C12N5/0602—Vertebrate cells
- C12N5/0652—Cells of skeletal and connective tissues; Mesenchyme
- C12N5/0662—Stem cells
- C12N5/0663—Bone marrow mesenchymal stem cells (BM-MSC)
-
- C—CHEMISTRY; METALLURGY
- C12—BIOCHEMISTRY; BEER; SPIRITS; WINE; VINEGAR; MICROBIOLOGY; ENZYMOLOGY; MUTATION OR GENETIC ENGINEERING
- C12N—MICROORGANISMS OR ENZYMES; COMPOSITIONS THEREOF; PROPAGATING, PRESERVING, OR MAINTAINING MICROORGANISMS; MUTATION OR GENETIC ENGINEERING; CULTURE MEDIA
- C12N5/00—Undifferentiated human, animal or plant cells, e.g. cell lines; Tissues; Cultivation or maintenance thereof; Culture media therefor
- C12N5/06—Animal cells or tissues; Human cells or tissues
- C12N5/0602—Vertebrate cells
- C12N5/0652—Cells of skeletal and connective tissues; Mesenchyme
- C12N5/0662—Stem cells
- C12N5/0667—Adipose-derived stem cells [ADSC]; Adipose stromal stem cells
-
- C—CHEMISTRY; METALLURGY
- C12—BIOCHEMISTRY; BEER; SPIRITS; WINE; VINEGAR; MICROBIOLOGY; ENZYMOLOGY; MUTATION OR GENETIC ENGINEERING
- C12Q—MEASURING OR TESTING PROCESSES INVOLVING ENZYMES, NUCLEIC ACIDS OR MICROORGANISMS; COMPOSITIONS OR TEST PAPERS THEREFOR; PROCESSES OF PREPARING SUCH COMPOSITIONS; CONDITION-RESPONSIVE CONTROL IN MICROBIOLOGICAL OR ENZYMOLOGICAL PROCESSES
- C12Q1/00—Measuring or testing processes involving enzymes, nucleic acids or microorganisms; Compositions therefor; Processes of preparing such compositions
- C12Q1/68—Measuring or testing processes involving enzymes, nucleic acids or microorganisms; Compositions therefor; Processes of preparing such compositions involving nucleic acids
- C12Q1/6876—Nucleic acid products used in the analysis of nucleic acids, e.g. primers or probes
- C12Q1/6883—Nucleic acid products used in the analysis of nucleic acids, e.g. primers or probes for diseases caused by alterations of genetic material
- C12Q1/6886—Nucleic acid products used in the analysis of nucleic acids, e.g. primers or probes for diseases caused by alterations of genetic material for cancer
-
- G—PHYSICS
- G01—MEASURING; TESTING
- G01N—INVESTIGATING OR ANALYSING MATERIALS BY DETERMINING THEIR CHEMICAL OR PHYSICAL PROPERTIES
- G01N33/00—Investigating or analysing materials by specific methods not covered by groups G01N1/00 - G01N31/00
- G01N33/48—Biological material, e.g. blood, urine; Haemocytometers
- G01N33/50—Chemical analysis of biological material, e.g. blood, urine; Testing involving biospecific ligand binding methods; Immunological testing
- G01N33/53—Immunoassay; Biospecific binding assay; Materials therefor
- G01N33/574—Immunoassay; Biospecific binding assay; Materials therefor for cancer
-
- C—CHEMISTRY; METALLURGY
- C12—BIOCHEMISTRY; BEER; SPIRITS; WINE; VINEGAR; MICROBIOLOGY; ENZYMOLOGY; MUTATION OR GENETIC ENGINEERING
- C12N—MICROORGANISMS OR ENZYMES; COMPOSITIONS THEREOF; PROPAGATING, PRESERVING, OR MAINTAINING MICROORGANISMS; MUTATION OR GENETIC ENGINEERING; CULTURE MEDIA
- C12N2501/00—Active agents used in cell culture processes, e.g. differentation
- C12N2501/20—Cytokines; Chemokines
- C12N2501/23—Interleukins [IL]
- C12N2501/2302—Interleukin-2 (IL-2)
-
- C—CHEMISTRY; METALLURGY
- C12—BIOCHEMISTRY; BEER; SPIRITS; WINE; VINEGAR; MICROBIOLOGY; ENZYMOLOGY; MUTATION OR GENETIC ENGINEERING
- C12N—MICROORGANISMS OR ENZYMES; COMPOSITIONS THEREOF; PROPAGATING, PRESERVING, OR MAINTAINING MICROORGANISMS; MUTATION OR GENETIC ENGINEERING; CULTURE MEDIA
- C12N2501/00—Active agents used in cell culture processes, e.g. differentation
- C12N2501/65—MicroRNA
-
- C—CHEMISTRY; METALLURGY
- C12—BIOCHEMISTRY; BEER; SPIRITS; WINE; VINEGAR; MICROBIOLOGY; ENZYMOLOGY; MUTATION OR GENETIC ENGINEERING
- C12Q—MEASURING OR TESTING PROCESSES INVOLVING ENZYMES, NUCLEIC ACIDS OR MICROORGANISMS; COMPOSITIONS OR TEST PAPERS THEREFOR; PROCESSES OF PREPARING SUCH COMPOSITIONS; CONDITION-RESPONSIVE CONTROL IN MICROBIOLOGICAL OR ENZYMOLOGICAL PROCESSES
- C12Q2600/00—Oligonucleotides characterized by their use
- C12Q2600/158—Expression markers
-
- G—PHYSICS
- G01—MEASURING; TESTING
- G01N—INVESTIGATING OR ANALYSING MATERIALS BY DETERMINING THEIR CHEMICAL OR PHYSICAL PROPERTIES
- G01N2333/00—Assays involving biological materials from specific organisms or of a specific nature
- G01N2333/435—Assays involving biological materials from specific organisms or of a specific nature from animals; from humans
- G01N2333/46—Assays involving biological materials from specific organisms or of a specific nature from animals; from humans from vertebrates
- G01N2333/47—Assays involving proteins of known structure or function as defined in the subgroups
- G01N2333/4701—Details
- G01N2333/4703—Regulators; Modulating activity
-
- G—PHYSICS
- G01—MEASURING; TESTING
- G01N—INVESTIGATING OR ANALYSING MATERIALS BY DETERMINING THEIR CHEMICAL OR PHYSICAL PROPERTIES
- G01N2333/00—Assays involving biological materials from specific organisms or of a specific nature
- G01N2333/435—Assays involving biological materials from specific organisms or of a specific nature from animals; from humans
- G01N2333/475—Assays involving growth factors
- G01N2333/495—Transforming growth factor [TGF]
-
- G—PHYSICS
- G01—MEASURING; TESTING
- G01N—INVESTIGATING OR ANALYSING MATERIALS BY DETERMINING THEIR CHEMICAL OR PHYSICAL PROPERTIES
- G01N2333/00—Assays involving biological materials from specific organisms or of a specific nature
- G01N2333/435—Assays involving biological materials from specific organisms or of a specific nature from animals; from humans
- G01N2333/52—Assays involving cytokines
- G01N2333/54—Interleukins [IL]
- G01N2333/55—IL-2
-
- G—PHYSICS
- G01—MEASURING; TESTING
- G01N—INVESTIGATING OR ANALYSING MATERIALS BY DETERMINING THEIR CHEMICAL OR PHYSICAL PROPERTIES
- G01N2333/00—Assays involving biological materials from specific organisms or of a specific nature
- G01N2333/435—Assays involving biological materials from specific organisms or of a specific nature from animals; from humans
- G01N2333/705—Assays involving receptors, cell surface antigens or cell surface determinants
-
- G—PHYSICS
- G01—MEASURING; TESTING
- G01N—INVESTIGATING OR ANALYSING MATERIALS BY DETERMINING THEIR CHEMICAL OR PHYSICAL PROPERTIES
- G01N2333/00—Assays involving biological materials from specific organisms or of a specific nature
- G01N2333/90—Enzymes; Proenzymes
- G01N2333/91—Transferases (2.)
- G01N2333/912—Transferases (2.) transferring phosphorus containing groups, e.g. kinases (2.7)
- G01N2333/91205—Phosphotransferases in general
-
- G—PHYSICS
- G01—MEASURING; TESTING
- G01N—INVESTIGATING OR ANALYSING MATERIALS BY DETERMINING THEIR CHEMICAL OR PHYSICAL PROPERTIES
- G01N2333/00—Assays involving biological materials from specific organisms or of a specific nature
- G01N2333/90—Enzymes; Proenzymes
- G01N2333/914—Hydrolases (3)
- G01N2333/948—Hydrolases (3) acting on peptide bonds (3.4)
- G01N2333/95—Proteinases, i.e. endopeptidases (3.4.21-3.4.99)
- G01N2333/964—Proteinases, i.e. endopeptidases (3.4.21-3.4.99) derived from animal tissue
- G01N2333/96425—Proteinases, i.e. endopeptidases (3.4.21-3.4.99) derived from animal tissue from mammals
- G01N2333/96427—Proteinases, i.e. endopeptidases (3.4.21-3.4.99) derived from animal tissue from mammals in general
- G01N2333/9643—Proteinases, i.e. endopeptidases (3.4.21-3.4.99) derived from animal tissue from mammals in general with EC number
- G01N2333/96466—Cysteine endopeptidases (3.4.22)
-
- G—PHYSICS
- G01—MEASURING; TESTING
- G01N—INVESTIGATING OR ANALYSING MATERIALS BY DETERMINING THEIR CHEMICAL OR PHYSICAL PROPERTIES
- G01N2333/00—Assays involving biological materials from specific organisms or of a specific nature
- G01N2333/90—Enzymes; Proenzymes
- G01N2333/914—Hydrolases (3)
- G01N2333/948—Hydrolases (3) acting on peptide bonds (3.4)
- G01N2333/95—Proteinases, i.e. endopeptidases (3.4.21-3.4.99)
- G01N2333/964—Proteinases, i.e. endopeptidases (3.4.21-3.4.99) derived from animal tissue
- G01N2333/96425—Proteinases, i.e. endopeptidases (3.4.21-3.4.99) derived from animal tissue from mammals
- G01N2333/96427—Proteinases, i.e. endopeptidases (3.4.21-3.4.99) derived from animal tissue from mammals in general
- G01N2333/9643—Proteinases, i.e. endopeptidases (3.4.21-3.4.99) derived from animal tissue from mammals in general with EC number
- G01N2333/96486—Metalloendopeptidases (3.4.24)
Landscapes
- Health & Medical Sciences (AREA)
- Life Sciences & Earth Sciences (AREA)
- Engineering & Computer Science (AREA)
- Chemical & Material Sciences (AREA)
- Biomedical Technology (AREA)
- Immunology (AREA)
- Organic Chemistry (AREA)
- General Health & Medical Sciences (AREA)
- Zoology (AREA)
- Biotechnology (AREA)
- Bioinformatics & Cheminformatics (AREA)
- Genetics & Genomics (AREA)
- Wood Science & Technology (AREA)
- Medicinal Chemistry (AREA)
- Developmental Biology & Embryology (AREA)
- Cell Biology (AREA)
- Proteomics, Peptides & Aminoacids (AREA)
- Veterinary Medicine (AREA)
- Animal Behavior & Ethology (AREA)
- Public Health (AREA)
- Pharmacology & Pharmacy (AREA)
- Biochemistry (AREA)
- Microbiology (AREA)
- Epidemiology (AREA)
- Hematology (AREA)
- General Engineering & Computer Science (AREA)
- Molecular Biology (AREA)
- Gastroenterology & Hepatology (AREA)
- Pathology (AREA)
- Analytical Chemistry (AREA)
- Rheumatology (AREA)
- Hospice & Palliative Care (AREA)
- Oncology (AREA)
- Urology & Nephrology (AREA)
- Physics & Mathematics (AREA)
- Biophysics (AREA)
- General Chemical & Material Sciences (AREA)
- Nuclear Medicine, Radiotherapy & Molecular Imaging (AREA)
- Chemical Kinetics & Catalysis (AREA)
- Virology (AREA)
Abstract
Un método para determinar si un individuo elegible para recibir una terapia basada en IL-2 puede experimentar un evento adverso asociado con la terapia basada en IL-2, comprendiendo el método: (a) medir los niveles de expresión de al menos dos biomarcadores seleccionados de un panel de biomarcadores en una muestra de sangre, plasma o suero obtenida del individuo, en el que la muestra se combina con IL-2 in vitro antes de la terapia basada en IL-2, y en el que el panel de biomarcadores consiste en TGFβ1, PLEKHA6, CTSB, FERMT1, CRMP1, VEGFB, VEGFA, y PLEKHA1; y (b) comparar los niveles de los biomarcadores con los niveles de referencia, en el que un aumento en los niveles por encima de los niveles de referencia indica que el individuo puede experimentar un evento adverso asociado con la terapia basada en IL-2, y en el que una disminución o ningún cambio en los niveles comparados con los niveles de referencia indica que es posible que el individuo no experimente un evento adverso asociado con la terapia basada en IL-2.A method of determining whether an individual eligible to receive IL-2 based therapy may experience an adverse event associated with IL-2 based therapy, the method comprising: (a) measuring the expression levels of at least two selected biomarkers from a panel of biomarkers in a sample of blood, plasma, or serum obtained from the individual, wherein the sample is combined with IL-2 in vitro prior to IL-2-based therapy, and wherein the panel of biomarkers consists at TGFβ1, PLEKHA6, CTSB, FERMT1, CRMP1, VEGFB, VEGFA, and PLEKHA1; and (b) comparing the levels of the biomarkers to reference levels, wherein an increase in levels above reference levels indicates that the individual may experience an adverse event associated with IL-2-based therapy, and wherein a decrease or no change in levels compared to baseline levels indicates that the individual may not experience an adverse event associated with IL-2 based therapy.
Description
DESCRIPCIÓNDESCRIPTION
Métodos complementarios para terapias basadas en IL-2 y terapias basadas en células madre mesenquimales Complementary Approaches for IL-2-Based Therapies and Mesenchymal Stem Cell-Based Therapies
ANTECEDENTES DE LA INVENCIÓNBACKGROUND OF THE INVENTION
La interleucina 2 (IL-2) es un tipo de molécula de señalización de citocinas en el sistema inmune, y se usa terapéuticamente. La IL-2 se fabrica usando tecnología de ADN recombinante, y se comercializa como una sustancia terapéutica proteica denominada aldesleukina (con la marca Proleukin®). La IL-2 está aprobada en varios países para el tratamiento de cánceres (melanoma metastásico y carcinoma de células renales) y del VIH.Interleukin 2 (IL-2) is a type of cytokine signaling molecule in the immune system, and is used therapeutically. IL-2 is manufactured using recombinant DNA technology, and is marketed as a therapeutic protein substance called aldesleukin (under the brand name Proleukin®). IL-2 is approved in several countries for the treatment of cancers (metastatic melanoma and renal cell carcinoma) and HIV.
La IL-2 ha sido aprobada como agente quimioterapéutico para el tratamiento del cáncer con un régimen de dosis alta, pero también puede administrarse en forma de dosis baja. El régimen de dosis alta consiste en administrar el fármaco por vía intravenosa, cada ocho horas, según se tolere, hasta 15 dosis. La terapia con dosis alta de IL-2 produce tasas de respuesta general de solo alrededor del 15% al 20%; además, se asocia con toxicidades significativas que afectan esencialmente a todos los sistemas de órganos. Debido a la gravedad de estos efectos secundarios, los pacientes son hospitalizados, y a veces necesitan apoyo de la unidad de cuidados intensivos mientras se administra el medicamento; en casos graves, se suspende el tratamiento con IL-2.IL-2 has been approved as a chemotherapeutic agent for the treatment of cancer with a high-dose regimen, but it can also be administered in low-dose form. The high-dose regimen consists of administering the drug intravenously, every 8 hours as tolerated, for up to 15 doses. High-dose IL-2 therapy produces overall response rates of only about 15% to 20%; furthermore, it is associated with significant toxicities affecting essentially all organ systems. Due to the severity of these side effects, patients are hospitalized, sometimes requiring intensive care unit support while the medication is administered; in severe cases, IL-2 treatment is discontinued.
Las células madre mesenquimales humanas (MSC) son actualmente una de las principales fuentes de células madre para el trasplante para tratar una variedad de afecciones (Kucerova, Cancer Res 1 de julio de 2007 67; 6304). Tales células madre trasplantadas, en presencia de un entorno proinflamatorio o de otro modo inhóspito in vivo, pueden producir eventos adversos no deseados. Poco se sabe sobre el grado en el que las propiedades beneficiosas de las MSC se ven afectadas por su entorno local. PANELLI MONICA C ET AL: “Forecasting the cytokine storm following systemic interleukin (IL)-2 administration”, JOURNAL OF TRANSLATIONAL MEDICINE, BIOMED CENTRAL, vol. 2, no. 1,2 de junio de 2004, página 17, y el documento US 2013/252821A1 se refieren a eventos adversos que ocurren durante o después de la terapia basada en IL-2.Human mesenchymal stem cells (MSCs) are currently one of the main sources of stem cells for transplantation to treat a variety of conditions (Kucerova, Cancer Res 2007 Jul 1 67;6304). Such transplanted stem cells, in the presence of a proinflammatory or otherwise inhospitable environment in vivo, can produce undesirable adverse events. Little is known about the degree to which the beneficial properties of MSCs are affected by their local environment. PANELLI MONICA C ET AL: “Forecasting the cytokine storm following systemic interleukin (IL)-2 administration”, JOURNAL OF TRANSLATIONAL MEDICINE, BIOMED CENTRAL, vol. 2, no. June 1, 2004, page 17, and US 2013/252821A1 refer to adverse events occurring during or after IL-2-based therapy.
En conjunto, hasta la fecha, se sabe poco sobre cómo determinar los posibles eventos adversos asociados con la administración de una terapia con IL-2, y los posibles efectos adversos del entorno en las MSC trasplantadas. De este modo, existe la necesidad de métodos y kits complementarios para mejorar el tratamiento de pacientes que son tratados con IL-2, y para pacientes que reciben terapias basadas en MSC. Se describen aquí métodos y kits para estos fines.Overall, to date, little is known about how to determine potential adverse events associated with the administration of IL-2 therapy, and potential adverse environmental effects in transplanted MSCs. Thus, there is a need for complementary methods and kits to improve the treatment of patients who are treated with IL-2, and for patients who receive MSC-based therapies. Methods and kits for these purposes are described here.
SUMARIO DE LA INVENCIÓNSUMMARY OF THE INVENTION
La presente invención se describe en las reivindicaciones adjuntas. Se describen aquí métodos y kits complementarios para determinar si una persona elegible para recibir una terapia basada en IL-2 o si una persona que ya recibe una terapia basada en IL-2 experimentará potencialmente eventos adversos asociados con esa terapia basada en IL-2. Si se determina que el individuo puede experimentar eventos adversos, tal como un mayor riesgo de tumorigénesis o metástasis, en lugar de la erradicación de la enfermedad subyacente tal como cáncer, se puede tomar la decisión de tratamiento de no someterse a ninguna otra terapia adicional basada en IL-2. Asimismo, si se determina que es probable que el individuo puede no experimentar eventos adversos asociados con la terapia basada en IL-2, se puede tomar la decisión de comenzar o continuar la administración de la terapia basada en IL-2.The present invention is described in the appended claims. Described herein are methods and companion kits for determining whether a person eligible to receive IL-2-based therapy or whether a person already receiving IL-2-based therapy will potentially experience adverse events associated with that IL-2-based therapy. If it is determined that the individual may experience adverse events, such as an increased risk of tumorigenesis or metastasis, rather than eradication of the underlying disease such as cancer, a treatment decision may be made not to undergo any further therapy based on in IL-2. Likewise, if it is determined that the individual may not likely experience adverse events associated with IL-2-based therapy, a decision may be made to begin or continue administration of IL-2-based therapy.
También se describen aquí métodos y kits complementarios para determinar si un individuo elegible para recibir una terapia basada en MSC experimentará potencialmente eventos adversos asociados con la terapia.Also described herein are companion methods and kits for determining whether an individual eligible to receive an MSC-based therapy will potentially experience therapy-associated adverse events.
De este modo, en un aspecto de la descripción, se proporcionan aquí métodos para determinar si un individuo elegible para recibir una terapia basada en IL-2 puede experimentar un evento adverso asociado con la terapia basada en IL-2, comprendiendo el método: (a) medir los niveles de expresión de al menos dos biomarcadores seleccionados de un panel de biomarcadores en una muestra del individuo, en el que (1) el individuo ha recibido al menos una dosis de una terapia basada en IL-2 o (2) la muestra se combina con IL-2 in vitro, y en el que el panel de biomarcadores comprende TIE-1, TIE-2, TIMP-4, FGF1, LIF, TGFBR2, CSF1, TGFa, TGFP1, IL17D, SDF2, TGFBRAP1, FGF11, TNFSF13B, FGF14, IL1 b, IL-11, IL-32, IL-6, IL1RN, IL-20RB, IL-21R, PLAU, GNB2L1, PLEKHA6, CTSB, FERMT1, CRMP1, VEGFB, VEGFA, y PLEKHA1; y (b) comparar los niveles de los biomarcadores con los niveles de referencia, en el que un aumento en los niveles por encima de los niveles de referencia indica que el individuo puede experimentar un evento adverso asociado con la terapia basada en IL-2, y en el que una disminución o ningún cambio en los niveles comparados con los niveles de referencia indica que es posible que el individuo no experimente un evento adverso asociado con la terapia basada en IL-2. En una variación de la descripción, el individuo ha recibido (por ejemplo, se le ha administrado) al menos una dosis de una terapia basada en IL-2; en algunas variaciones, el individuo ha recibido la terapia basada en IL-2 para el tratamiento de un cáncer. En algunas variaciones, la muestra se ha obtenido del individuo 24, 48 o 72 horas después de haber recibido la terapia basada en IL-2. En otra variación, la muestra del individuo se combina con IL-2 in vitro para un análisis más detallado; en algunas variaciones, la muestra se puede combinar durante un período de alrededor de 24 horas, después de lo cual se miden los biomarcadores 24, 48 o 72 horas después de la eliminación de la IL-2. Como se contempla aquí, la muestra puede ser cualquier muestra biológica; en una variación, la muestra es una muestra de sangre, plasma o suero. En una variación particular, el método comprende medir los niveles de expresión de al menos tres biomarcadores del panel de biomarcadores, al menos cuatro biomarcadores del panel de biomarcadores, o al menos cinco biomarcadores del panel de biomarcadores. En algunas variaciones, el método comprende medir los niveles de expresión de TIE-1, TIE-2, TIMP-4, VEGFA, PLEKHA1, VEGFB, CRMP1, FERMT1, CTSB, PLEKHA6, GNB2L1, y TGFP1. En algunas variaciones, el método puede comprender además medir biomarcadores adicionales. En una variación particular, el método comprende además medir el nivel de expresión de SIVA1, y preguntar por la disminución de la expresión de este biomarcador. Como se contempla aquí, se pueden medir los niveles de expresión de ARN o proteína. Por consiguiente, en una variación, el método comprende medir los niveles de proteína de los biomarcadores, por ejemplo con un ensayo ELISA, una matriz proteómica de anticuerpos, inmunohistoquímica, o espectrometría de masas. En otra variación, el método comprende medir los niveles de ARN de los biomarcadores, por ejemplo con un ensayo de Q-PCR o RNA-seq. En algunas variaciones, el método comprende obtener la muestra del individuo como parte del método. Tras la determinación de los resultados de la expresión, el método puede comprender además administrar una cantidad eficaz de la terapia basada en IL-2 al individuo si se determina en la etapa (b) que el individuo puede no experimentar un evento adverso asociado con la terapia basada en IL-2. El método puede incluso comprender además administrar una terapia de rejuvenecimiento al individuo si se determina en la etapa (b) que el individuo puede experimentar un evento adverso asociado con la terapia basada en IL-2.Thus, in one aspect of the disclosure, methods are provided herein for determining whether an individual eligible to receive IL-2-based therapy may experience an adverse event associated with IL-2-based therapy, the method comprising: ( a) measuring the expression levels of at least two biomarkers selected from a panel of biomarkers in a sample from the individual, in which (1) the individual has received at least one dose of an IL-2-based therapy or (2) the sample is combined with IL-2 in vitro, and wherein the biomarker panel comprises TIE-1, TIE-2, TIMP-4, FGF1, LIF, TGFBR2, CSF1, TGFa, TGFP1, IL17D, SDF2, TGFBRAP1, FGF11, TNFSF13B, FGF14, IL1 b, IL-11, IL-32, IL-6, IL1RN, IL-20RB, IL-21R, PLAU, GNB2L1, PLEKHA6, CTSB, FERMT1, CRMP1, VEGFB, VEGFA, and PLEKHA1; and (b) comparing the levels of the biomarkers to reference levels, wherein an increase in levels above reference levels indicates that the individual may experience an adverse event associated with IL-2-based therapy, and wherein a decrease or no change in levels compared to baseline levels indicates that the individual may not experience an adverse event associated with IL-2 based therapy. In a variation of the description, the individual has received (eg, administered) at least one dose of an IL-2-based therapy; in some variations, the individual has received IL-2-based therapy for the treatment of a cancer. In some variations, the sample has been obtained from the individual 24, 48, or 72 hours after receiving IL-2-based therapy. In another variation, the individual's sample is combined with IL-2 in vitro for further analysis; in some variations, the sample may be pooled for a period of about 24 hours, after which biomarkers are measured 24, 48, or 72 hours after IL-2 clearance. As contemplated herein, the sample can be any biological sample; in one variation, the sample is a blood, plasma, or serum sample. In a particular variation, the method comprises measuring the expression levels of at least three biomarkers from the panel of biomarkers, at least four biomarkers from the biomarker panel, or at least five biomarkers from the biomarker panel. In some variations, the method comprises measuring the expression levels of TIE-1, TIE-2, TIMP-4, VEGFA, PLEKHA1, VEGFB, CRMP1, FERMT1, CTSB, PLEKHA6, GNB2L1, and TGFP1. In some variations, the method may further comprise measuring additional biomarkers. In a particular variation, the method further comprises measuring the level of expression of SIVA1, and asking about the decrease in the expression of this biomarker. As contemplated herein, RNA or protein expression levels can be measured. Accordingly, in one variation, the method comprises measuring the protein levels of the biomarkers, for example with an ELISA assay, antibody array proteomics, immunohistochemistry, or mass spectrometry. In another variation, the method comprises measuring the RNA levels of the biomarkers, for example with a Q-PCR or RNA-seq assay. In some variations, the method comprises obtaining the sample from the individual as part of the method. Following determination of the expression results, the method may further comprise administering an effective amount of the IL-2-based therapy to the individual if it is determined in step (b) that the individual may not experience an adverse event associated with the IL-2-based therapy. The method may even further comprise administering a rejuvenating therapy to the individual if it is determined in step (b) that the individual may experience an adverse event associated with the IL-2 based therapy.
En otro aspecto, la descripción proporciona un método de tratamiento de un individuo para cáncer con una terapia basada en IL-2. En una variación, el método de tratamiento de un individuo para cáncer con una terapia basada en IL-2 comprende (a) medir los niveles de expresión de al menos dos biomarcadores seleccionados de un panel de biomarcadores en una muestra del individuo, en el que (1) el individuo ha recibido al menos una dosis de una terapia basada en IL-2 o (2) la muestra se combina con IL-2 in vitro, y en el que el panel de biomarcadores comprende comprises TIE-1, TIE-2, TIMP-4, FGF1, LIF, TGFBR2, CSF1, TGFa, TGFP1, IL17D, SDF2, TGFBRAP1, FGF11, TNFSF13B, FGF14, IL1B, IL-11, IL-32, IL-6, IL1RN, IL-20RB, IL-21R, PLAU, GNB2L1, PLEKHA6, CTSB, FERMT1, CRMP1, VEGFB, VEGFA, y PLEKHA1; (b) comparar los niveles de los biomarcadores con los niveles de referencia, en el que ningún cambio o una disminución en los niveles por debajo de los niveles de referencia indica que el individuo puede no experimentar un evento adverso asociado con la terapia basada en IL-2; y (c) administrar una cantidad eficaz de la terapia basada en IL-2 al individuo si se determina en la etapa (b) que el individuo puede no experimentar un evento adverso asociado con la terapia basada en IL-2. En otra variación, el método de tratamiento de un individuo para cáncer con una terapia basada en IL-2 comprende administrar una cantidad eficaz de la terapia basada en IL-2 al individuo cuando los niveles de expresión de al menos dos biomarcadores disminuyen o no muestran cambio, en comparación con los niveles de referencia en una muestra del individuo, en el que (1) el individuo ha recibido al menos una dosis de una terapia basada en IL-2 o (2) la muestra se combina con IL-2 in vitro, y en el que el panel de biomarcadores comprende TIE-1, TIE-2, TIMP-4, FGF1, LIF, TGFBR2, CSF1, TGFa, TGFP1, IL17D, SDF2, TGFBRAP1, FGF11, TNFSF13B, FGF14, IL1B, IL-11, IL-32, IL-6, IL1RN, IL-20RB, IL-21R, PLAU, GNB2L1, PLEKHA6, CTSB, FERMT1, c Rm P1, VEGFB, VEGFA, y PLEKHA1. En una variación de la descripción, el individuo ha recibido (por ejemplo, se le ha administrado) al menos una dosis de una terapia basada en IL-2. En algunas variaciones, la muestra se ha obtenido del individuo 24, 48 o 72 horas después de haber recibido la terapia basada en IL-2. En otra variación, la muestra del individuo se combina con IL-2 in vitro para un análisis más detallado; en algunas variaciones, la muestra se puede combinar durante un período de alrededor de 24 horas, después de lo cual se miden los biomarcadores 24, 48 o 72 horas después de la eliminación de la IL-2. Como se contempla aquí, la muestra puede ser cualquier muestra biológica; en una variación, la muestra es una muestra de sangre, plasma o suero. En una variación particular, el método comprende medir los niveles de expresión de al menos tres biomarcadores del panel de biomarcadores, al menos cuatro biomarcadores del panel de biomarcadores, o al menos cinco biomarcadores del panel de biomarcadores. En algunas variaciones, el método comprende medir los niveles de expresión de TIE-1, TI E-2, TIMP-4, VEGFA, PLEKHA1, VEGFB, CRMP1, FERMT1, CTSB, PLEKHA6, GNB2L1, y TGF¡31. En algunas variaciones, el método puede comprender además medir biomarcadores adicionales. En una variación particular, el método comprende además medir el nivel de expresión de SIVA1, y preguntar por la disminución de la expresión de este biomarcador. Como se contempla aquí, se pueden medir los niveles de expresión de ARN o proteína. Por consiguiente, en una variación, el método comprende medir los niveles de proteína de los biomarcadores, por ejemplo con un ensayo ELISA, una matriz proteómica de anticuerpos, inmunohistoquímica, o espectrometría de masas. En otra variación, el método comprende medir los niveles de ARN de los biomarcadores, por ejemplo con un ensayo Q-PCR o RNA-seq. En algunas variaciones, el método comprende obtener la muestra del individuo como parte del método. El método puede incluso comprender además administrar una terapia de rejuvenecimiento al individuo si se determina que el individuo puede experimentar un evento adverso asociado con la terapia basada en IL-2.In another aspect, the disclosure provides a method of treating an individual for cancer with IL-2-based therapy. In a variation, the method of treating an individual for cancer with an IL-2-based therapy comprises (a) measuring the expression levels of at least two biomarkers selected from a panel of biomarkers in a sample of the individual, wherein (1) the individual has received at least one dose of an IL-2-based therapy or (2) the sample is combined with IL-2 in vitro, and wherein the biomarker panel comprises TIE-1, TIE- 2, TIMP-4, FGF1, LIF, TGFBR2, CSF1, TGFa, TGFP1, IL17D, SDF2, TGFBRAP1, FGF11, TNFSF13B, FGF14, IL1B, IL-11, IL-32, IL-6, IL1RN, IL-20RB, IL-21R, PLAU, GNB2L1, PLEKHA6, CTSB, FERMT1, CRMP1, VEGFB, VEGFA, and PLEKHA1; (b) comparing the levels of the biomarkers with the reference levels, in which no change or a decrease in the levels below the reference levels indicates that the individual may not experience an adverse event associated with IL-based therapy -two; and (c) administering an effective amount of the IL-2-based therapy to the individual if it is determined in step (b) that the individual may not experience an adverse event associated with the IL-2-based therapy. In another variation, the method of treating an individual for cancer with an IL-2-based therapy comprises administering an effective amount of the IL-2-based therapy to the individual when expression levels of at least two biomarkers are decreased or absent. change, compared to baseline levels in a sample from the individual, in which (1) the individual has received at least one dose of an IL-2-based therapy or (2) the sample is combined with IL-2 in vitro, and wherein the biomarker panel comprises TIE-1, TIE-2, TIMP-4, FGF1, LIF, TGFBR2, CSF1, TGFa, TGFP1, IL17D, SDF2, TGFBRAP1, FGF11, TNFSF13B, FGF14, IL1B, IL -11, IL-32, IL-6, IL1RN, IL-20RB, IL-21R, PLAU, GNB2L1, PLEKHA6, CTSB, FERMT1, c Rm P1, VEGFB, VEGFA, and PLEKHA1. In a variation of the description, the individual has received (eg, administered) at least one dose of an IL-2-based therapy. In some variations, the sample has been obtained from the individual 24, 48, or 72 hours after receiving IL-2-based therapy. In another variation, the individual's sample is combined with IL-2 in vitro for further analysis; in some variations, the sample may be pooled for a period of about 24 hours, after which biomarkers are measured 24, 48, or 72 hours after IL-2 clearance. As contemplated herein, the sample can be any biological sample; in one variation, the sample is a blood, plasma, or serum sample. In a particular variation, the method comprises measuring the expression levels of at least three biomarkers from the panel of biomarkers, at least four biomarkers from the panel of biomarkers, or at least five biomarkers from the panel of biomarkers. In some variations, the method comprises measuring the expression levels of TIE-1, TI E-2, TIMP-4, VEGFA, PLEKHA1, VEGFB, CRMP1, FERMT1, CTSB, PLEKHA6, GNB2L1, and TGFα31. In some variations, the method may further comprise measuring additional biomarkers. In a particular variation, the method further comprises measuring the level of expression of SIVA1, and asking about the decrease in the expression of this biomarker. As contemplated herein, RNA or protein expression levels can be measured. Accordingly, in one variation, the method comprises measuring the protein levels of the biomarkers, for example with an ELISA assay, antibody array proteomics, immunohistochemistry, or mass spectrometry. In another variation, the method comprises measuring the RNA levels of the biomarkers, for example with a Q-PCR or RNA-seq assay. In some variations, the method comprises obtaining the sample from the individual as part of the method. The method may even further comprise administering a rejuvenating therapy to the individual if it is determined that the individual may experience an adverse event associated with the IL-2 based therapy.
En otro aspecto, la descripción proporciona un método para determinar si una población de células madre mesenquimales (MSC) es adecuada para la administración a un individuo para una terapia basada en MSC, que comprende: (a) incubar IL-2 con la población de MSC; (b) medir los niveles de expresión en las MSC de al menos dos biomarcadores seleccionados de un panel de biomarcadores, en el que el panel de biomarcadores comprende TIE-1, TIE-2, TIMP-4, FGF1, LIF, TGFBR2, CSF1, TGFa, TGFP1, IL17D, SDF2, TGFBRAP1, FGF11, TNFSF13B, FGF14, IL1B, IL-11, IL-32, IL-6, IL1RN, IL-20RB, IL-21R, PLAU, GNB2L1, PLEKHA6, CTSB, FERMT1, CRMP1, VEGFB, VEGFA, y PLEKHA1; y (c) comparar los niveles de los biomarcadores con los niveles de referencia, en el que un aumento en los niveles por encima de los niveles de referencia indica que las MSC no son adecuadas para la administración a un individuo, y ningún cambio o disminución en los niveles por debajo de los niveles de referencia indica que las MSC son adecuadas para la administración a un individuo. En algunas variaciones, el método comprende medir los niveles de expresión de al menos tres biomarcadores del panel de biomarcadores, medir los niveles de expresión de al menos cuatro biomarcadores del panel de biomarcadores, o medir los niveles de expresión de al menos cinco biomarcadores del panel de biomarcadores. En algunas variaciones, el método comprende medir los niveles de expresión de TIE-1, TIE-2, TIMP-4, VEGFA, PLEKHA1, VEGFB, CRMP1, FERMT1, CTSB, PLEKHA6, GNB2L1, y TGFP1. En algunas variaciones, el método puede comprender además medir biomarcadores adicionales. En una variación particular, el método comprende además medir el nivel de expresión de SIVA1, y preguntar por la disminución de la expresión de este biomarcador. Como se contempla aquí, se pueden medir los niveles de expresión de ARN o proteína. Por consiguiente, en una variación, el método comprende medir los niveles de proteína de los biomarcadores, por ejemplo con un ensayo ELISA, una matriz proteómica de anticuerpos, inmunohistoquímica, o espectrometría de masas. En otra variación, el método comprende medir los niveles de ARN de los biomarcadores, por ejemplo con un ensayo Q-PCR o RNA-seq. En algunas variaciones, el período de incubación es de alrededor de 24 horas. En algunas variaciones, la medida se realiza 24, 48 o 72 horas después del período de incubación con IL-2. En algunas variaciones, el método comprende además administrar la población de células al individuo. El método puede comprender además rejuvenecer las células antes de administrar las células al individuo.In another aspect, the disclosure provides a method of determining whether a population of mesenchymal stem cells (MSCs) is suitable for administration to an individual for MSC-based therapy, comprising: (a) incubating IL-2 with the population of MSC; (b) measuring expression levels in MSCs of at least two biomarkers selected from a panel of biomarkers, wherein the panel of biomarkers comprises TIE-1, TIE-2, TIMP-4, FGF1, LIF, TGFBR2, CSF1 , TGFa, TGFP1, IL17D, SDF2, TGFBRAP1, FGF11, TNFSF13B, FGF14, IL1B, IL-11, IL-32, IL-6, IL1RN, IL-20RB, IL-21R, PLAU, GNB2L1, PLEKHA6, CTSB, FERMT1 , CRMP1, VEGFB, VEGFA, and PLEKHA1; and (c) comparing the levels of the biomarkers to reference levels, wherein an increase in levels above reference levels indicates that the MSCs are not suitable for administration to an individual, and no change or decrease at levels below reference levels indicates that the MSCs are suitable for administration to an individual. In some variations, the method comprises measuring the expression levels of at least three biomarkers from the panel of biomarkers, measuring the expression levels of at least four biomarkers from the biomarker panel, or measure the expression levels of at least five biomarkers from the biomarker panel. In some variations, the method comprises measuring the expression levels of TIE-1, TIE-2, TIMP-4, VEGFA, PLEKHA1, VEGFB, CRMP1, FERMT1, CTSB, PLEKHA6, GNB2L1, and TGFP1. In some variations, the method may further comprise measuring additional biomarkers. In a particular variation, the method further comprises measuring the level of expression of SIVA1, and asking about the decrease in the expression of this biomarker. As contemplated herein, RNA or protein expression levels can be measured. Accordingly, in one variation, the method comprises measuring the protein levels of the biomarkers, for example with an ELISA assay, antibody array proteomics, immunohistochemistry, or mass spectrometry. In another variation, the method comprises measuring the RNA levels of the biomarkers, for example with a Q-PCR or RNA-seq assay. In some variations, the incubation period is around 24 hours. In some variations, the measurement is made 24, 48, or 72 hours after the IL-2 incubation period. In some variations, the method further comprises administering the cell population to the individual. The method may further comprise rejuvenating the cells prior to administering the cells to the individual.
En otro aspecto de la descripción, se proporcionan aquí kits para evaluar la idoneidad de una población de MSC para trasplante o para determinar si se debe administrar una terapia basada en IL-2, que comprenden reactivos para medir el nivel de expresión de al menos dos biomarcadores seleccionados de un panel de biomarcadores en una muestra, en el que el panel de biomarcadores comprende TIE-1, TIE-2, TIMP-4, FGF1, LIF, TGFBR2, CSF1, TGFa, TGFP1, IL17D, SDF2, TGFBRAP1, FGF11, TNFSF13B, FGF14, IL1 b, IL-11, IL-32, IL-6, IL1RN, IL-20RB, IL-21R, PLAU, GNB2L1, PLEKHA6, CTSB, FERMT1, CRMP1, VEGFB, VEGFA, y PLEKHA1. En algunas variaciones, el kit comprende reactivos para medir el nivel de expresión de al menos tres biomarcadores en la muestra, para medir el nivel de expresión de al menos cuatro biomarcadores en la muestra, o para medir el nivel de expresión de al menos cinco biomarcadores en la muestra. En algunas variaciones, el kit comprende reactivos para medir TIE-1, TIE-2, TIMP-4, VEGFA, PLEKHA1, VEGFB, CRMP1, FERMT1, CTSB, PLEKHA6, GNB2L1, y TGFP1. En algunas variaciones, el kit comprende IL-2.In another aspect of the disclosure, kits for evaluating the suitability of a population of MSCs for transplantation or for determining whether to administer IL-2-based therapy are provided herein, comprising reagents for measuring the expression level of at least two biomarkers selected from a panel of biomarkers in a sample, wherein the panel of biomarkers comprises TIE-1, TIE-2, TIMP-4, FGF1, LIF, TGFBR2, CSF1, TGFa, TGFP1, IL17D, SDF2, TGFBRAP1, FGF11 , TNFSF13B, FGF14, IL1 b, IL-11, IL-32, IL-6, IL1RN, IL-20RB, IL-21R, PLAU, GNB2L1, PLEKHA6, CTSB, FERMT1, CRMP1, VEGFB, VEGFA, and PLEKHA1. In some variations, the kit comprises reagents to measure the expression level of at least three biomarkers in the sample, to measure the expression level of at least four biomarkers in the sample, or to measure the expression level of at least five biomarkers. in the sample. In some variations, the kit comprises reagents to measure TIE-1, TIE-2, TIMP-4, VEGFA, PLEKHA1, VEGFB, CRMP1, FERMT1, CTSB, PLEKHA6, GNB2L1, and TGFP1. In some variations, the kit comprises IL-2.
Debe entenderse que una, algunas o todas las propiedades de las diversas variaciones descritas aquí pueden combinarse para formar otras variaciones de la presente descripción. Estos y otros aspectos resultarán evidentes para un experto en la técnica.It is to be understood that one, some, or all of the properties of the various variations described herein may be combined to form other variations of the present description. These and other aspects will be apparent to one skilled in the art.
BREVE DESCRIPCIÓN DE LOS DIBUJOSBRIEF DESCRIPTION OF THE DRAWINGS
La FIG. 1A es un esquema que ilustra el posicionamiento de los MSC in vivo en los vasos sanguíneos, haciéndolas capaces de detectar y responder a un entorno inflamatorio, y tratamiento con citocinas.FIG. 1A is a schematic illustrating the positioning of MSCs in vivo in blood vessels, rendering them capable of sensing and responding to an inflammatory environment, and cytokine treatment.
La FIG. 1B es un gráfico que ilustra un método ejemplar para evaluar a un individuo o a una célula madre para determinar si se debe iniciar o continuar una terapia basada en IL-2.FIG. 1B is a graph illustrating an exemplary method of evaluating an individual or stem cell to determine whether to start or continue IL-2-based therapy.
La FIG. 2A es un esquema de un ensayo ejemplar para determinar si debe administrarse una terapia basada en IL-2. La FIG. 2B ilustra los resultados del cribado ejemplares usando el ensayo que se muestra en la FIG. 2A. En la FIG. 2B, el resultado es positivo, con la expresión de varios marcadores aumentada, lo que indica que los posibles eventos adversos podrían estar asociados con la administración de IL-2.FIG. 2A is a schematic of an exemplary assay to determine whether IL-2-based therapy should be administered. FIG. 2B illustrates exemplary screening results using the assay shown in FIG. 2A. In FIG. 2B, the result is positive, with the expression of several markers increased, indicating that possible adverse events could be associated with the administration of IL-2.
Las FIGS. 3A-3D ilustran cómo la senescencia replicativa (SEN) perjudica las propiedades migratorias de las células madre mesenquimales derivadas de tejido adiposo humano (hADSC, también denominadas aquí indistintamente hADSC). La FIG. 3A muestra una curva de crecimiento de las hADSC, y se representa como duplicación de la población acumulativa a lo largo del día en cultivo. La FIG. 3B muestra la detección de P-galactosidasa asociada a la senescencia. La FIG. 3C muestra ensayos de migración ex vivo para hADSC SR (izquierda) y SEN (derecha). La FIG. 3D muestra la migración de SR-hADSC (izquierda) y SEN-hADSC (derecha). FIGS. 3A-3D illustrate how replicative senescence (SEN) impairs the migratory properties of human adipose-derived mesenchymal stem cells (hADSCs, also referred to herein interchangeably as hADSCs). FIG. 3A shows a growth curve of hADSCs, and is plotted as cumulative population doubling over the day in culture. FIG. 3B shows the detection of P-galactosidase associated with senescence. FIG. 3C shows ex vivo migration assays for hADSC SR (left) and SEN (right). FIG. 3D shows the migration of SR-hADSC (left) and SEN-hADSC (right).
Las FIGS.4A-4C ilustran la expresión génica de las isoformas del receptor de IL-2 y su asociación con la membrana en SR-hADSC y SEN-hADSC inducidas con IL-2. La FIG. 4A muestra una representación esquemática de la composición del receptor de IL-2. La FIG. 4B muestra los receptores a, P y g de IL-2 evaluados mediante PCR cuantitativa (Q-PCR) de hADSC SR y SEN, en presencia o ausencia de IL-2. La FIG. 4C muestra los niveles de proteína asociada a la membrana celular de IL-2Ra e IL-2Rp.FIGS.4A-4C illustrate gene expression of IL-2 receptor isoforms and their membrane association in IL-2-induced SR-hADSC and SEN-hADSC. FIG. 4A shows a schematic representation of the composition of the IL-2 receptor. FIG. 4B shows IL-2 receptors a, P and g evaluated by quantitative PCR (Q-PCR) of hADSC SR and SEN, in the presence or absence of IL-2. FIG. 4C shows the cell membrane associated protein levels of IL-2Ra and IL-2Rp.
La FIG. 5 ilustra el efecto de la estimulación de las hADSC SR y SEN con IL-2. La expresión de ARNm de STAT5A, STAT5B y VEGFA se evaluó mediante RT-PCR cuantitativa.FIG. 5 illustrates the effect of stimulation of SR and SEN hADSCs with IL-2. STAT5A, STAT5B and VEGFA mRNA expression was assessed by quantitative RT-PCR.
Las FIGS. 6A-6D muestran una comparación de los niveles de expresión génica entre células SR y SEN tras el tratamiento con IL-2.FIGS. 6A-6D show a comparison of gene expression levels between SR and SEN cells after IL-2 treatment.
Las FIGS. 7A-7D ilustran los niveles de expresión génica para células SR y SEN tras el tratamiento con IL-2 entre conjuntos de genes funcionalmente coherentes.FIGS. 7A-7D illustrate gene expression levels for SR and SEN cells following IL-2 treatment among functionally consistent sets of genes.
Las FIGS. 8A-8D ilustran el análisis para el perfilado de RNA-seq de hADSC SR y SEN sometidas a tratamiento con IL-2. La FIG. 8A proporciona una representación esquemática del diseño del análisis de RNA-seq. La FIG. 8B muestra las distribuciones de los recuentos de lectura de RNA-seq específicos de genes para cada condición antes de la normalización de ACTB. La FIG. 8C muestra los recuentos de lectura de RNA-seq específicos de la condición para ACTB que se usaron para la normalización. La FIG. 8D muestra las distribuciones de los recuentos de lectura de RNA-seq específicos del gen para cada condición después de la normalización de ACTB.FIGS. 8A-8D illustrate analysis for RNA-seq profiling of hADSC SR and SEN subjected to IL-2 treatment. FIG. 8A provides a schematic representation of the RNA-seq analysis design. FIG. 8B shows the distributions of gene-specific RNA-seq read counts for each condition before of ACTB normalization. FIG. 8C shows condition-specific RNA-seq read counts for ACTB that were used for normalization. FIG. 8D shows the distributions of gene-specific RNA-seq read counts for each condition after ACTB normalization.
La FIG. 9 muestra la respuesta a la dosis del Consorcio de Controles de ARN Externos (ERCC, un conjunto común de controles de ARN externos) usada para el control de calidad de los experimentos de RNA-seq.FIG. 9 shows the dose response of the External RNA Controls Consortium (ERCC, a common set of external RNA controls) used for quality control of RNA-seq experiments.
Las FIGS. 10A-10B representan tablas de los genes expresados diferencialmente tras el tratamiento con IL-2 en hAMCS SEN y SR. La FIG. 10A muestra rutas biológicas enriquecidas para genes regulados al alza tras el tratamiento con IL-2 en hADSC SR y SEN. La FIG. 10B muestra rutas biológicas enriquecidas para genes regulados a la baja tras el tratamiento con IL-2 en hADSC SR y SEN.FIGS. 10A-10B depict tables of differentially expressed genes after IL-2 treatment in hAMCS SEN and SR. FIG. 10A shows enriched biological pathways for genes upregulated upon IL-2 treatment in hADSC SR and SEN. FIG. 10B shows enriched biological pathways for downregulated genes after IL-2 treatment in hADSC SR and SEN.
Las FIGS. 11-90 ilustran el aumento en la secreción de las proteínas mencionadas (factores) de SR-hADSC o SEN-hADSC, después de la incubación con medio solo (sin estimulación con IL-2) o después de la estimulación con IL-2.FIGS. 11-90 illustrate the increase in secretion of the mentioned proteins (factors) from SR-hADSC or SEN-hADSC, after incubation with medium alone (without IL-2 stimulation) or after IL-2 stimulation.
DESCRIPCIÓN DETALLADADETAILED DESCRIPTION
1. Métodos1. Methods
1. Introducción1. Introduction
Se proporcionan aquí métodos y kits complementarios útiles para terapias basadas en IL-2 y para terapias basadas en células madre mesenquimales.Useful companion methods and kits for IL-2-based therapies and for mesenchymal stem cell-based therapies are provided herein.
Específicamente, en una variación de la descripción, se proporcionan aquí métodos para determinar si un individuo elegible para recibir una terapia basada en IL-2, para el tratamiento de una afección tal como cáncer o VIH, puede experimentar un evento adverso asociado con esa terapia basada en IL-2. El método implica medir un aumento en los niveles de expresión de ciertos biomarcadores en una muestra del individuo tras la exposición a IL-2, siendo tales biomarcadores indicativos de la senescencia celular de las MSC en la muestra. La expresión de dichos biomarcadores indicaría que el individuo podría experimentar un evento adverso (tal como tumorigénesis o metástasis) si se administrara o continuara la terapia basada en IL-2. Las decisiones de tratamiento se pueden tomar con base en la práctica de este método y el uso de los kits descritos aquí.Specifically, in a variation of the description, methods are provided herein for determining whether an individual eligible to receive an IL-2-based therapy, for the treatment of a condition such as cancer or HIV, may experience an adverse event associated with that therapy. based on IL-2. The method involves measuring an increase in the expression levels of certain biomarkers in a sample of the individual after exposure to IL-2, such biomarkers being indicative of the cellular senescence of the MSCs in the sample. Expression of such biomarkers would indicate that the individual might experience an adverse event (such as tumorigenesis or metastasis) if IL-2-based therapy was administered or continued. Treatment decisions can be made based on practice of this method and use of the kits described here.
En otra variación de la descripción, se proporcionan aquí métodos para determinar la idoneidad de una población de MSC para administración (por ejemplo, trasplante) a un individuo para una terapia basada en MSC. El método implica medir un cambio en los niveles de expresión de ciertos biomarcadores en las MSC tras la exposición a IL-2, estando tales biomarcadores asociados con la senescencia celular de las MSC. Si se observa un aumento en los biomarcadores, indicaría que si las células se administraran a un individuo, el individuo podría experimentar eventos adversos asociados con el trasplante, tales como transformación metastásica y crecimiento invasivo. Por el contrario, si no se observa ningún cambio o se observa una disminución en los niveles de expresión de los biomarcadores, podría indicar la idoneidad de la población de células para la administración. Las decisiones de tratamiento con respecto al trasplante de MSC se pueden tomar en base a la práctica de este método y el uso de los kits descritos aquí.In another variation of the disclosure, methods for determining the suitability of a population of MSCs for administration (eg, transplantation) to an individual for MSC-based therapy are provided herein. The method involves measuring a change in the expression levels of certain biomarkers in MSCs upon exposure to IL-2, such biomarkers being associated with cellular senescence of MSCs. If an increase in biomarkers is seen, it would indicate that if the cells were administered to an individual, the individual could experience transplant-associated adverse events, such as metastatic transformation and invasive growth. On the contrary, if no change is observed or a decrease in the expression levels of the biomarkers is observed, it could indicate the suitability of the cell population for administration. Treatment decisions regarding MSC transplantation can be made based on practice of this method and use of the kits described here.
Estos se discuten con más detalle aquí.These are discussed in more detail here.
2. SEN-MSC y SR-MSC2. SEN-MSC and SR-MSC
Se proporcionan aquí métodos para medir los niveles de expresión de biomarcadores al exponer una muestra que comprende MSC a IL-2, en los que los biomarcadores son indicativos de senescencia celular. Como se usa aquí, las MSC SEN son aquellas células que son replicativamente senescentes. La senescencia replicativa se caracteriza por la detención del crecimiento, resistencia a la apoptosis, altos niveles de actividades metabólicas, cambios morfológicos y de tamaño celular, altos niveles de expresión de los supresores tumorales P16, P21, P53 y/o RB, aumento de la actividad de la beta galactosidasa asociada a la senescencia (SA-p-gal), y la pérdida de la capacidad de sintetizar y reparar el ADN. El envejecimiento replicativo de las MSC puede influir en sus propiedades biológicas.Provided herein are methods for measuring biomarker expression levels upon exposing a sample comprising MSCs to IL-2, wherein the biomarkers are indicative of cellular senescence. As used herein, SEN MSCs are those cells that are replicatively senescent. Replicative senescence is characterized by growth arrest, resistance to apoptosis, high levels of metabolic activities, morphological and cell size changes, high expression levels of tumor suppressors P16, P21, P53 and/or RB, increased senescence-associated beta galactosidase (SA-p-gal) activity, and loss of the ability to synthesize and repair DNA. The replicative aging of MSCs may influence their biological properties.
Las SR-MSC, por otro lado, están asociadas con ser productivas: expresan un conjunto de ARN codificantes o no codificantes indicativos de calidad; se renuevan a sí mismas; no son senescentes; no se acercan a la senescencia; se han hecho pasar 6 veces o menos; exhiben un alto potencial de crecimiento; producen proteínas de interés; permiten la regeneración de tejidos a largo plazo; inducen la corrección a largo plazo de una enfermedad; no exhiben ninguna o exhiben solo una baja probabilidad de inmortalización; exhiben potencial tumorigénico bajo o nulo; y contienen pocas o ninguna integración pro-viral. En una variación ejemplar, las células madre productivas se autorrenuevan. En algunas variaciones, las células madre productivas muestran al menos dos, tres, cuatro, cinco, o más de las características asociadas con la productividad. SR-MSCs, on the other hand, are associated with being productive: they express a set of coding or non-coding RNAs indicative of quality; they renew themselves; they are not senescent; they do not approach senescence; have been passed 6 times or less; exhibit high growth potential; produce proteins of interest; allow long-term tissue regeneration; induce long-term correction of a disease; they exhibit none or exhibit only a low probability of immortalization; exhibit low or no tumorigenic potential; and contain little or no pro-viral integration. In an exemplary variation, the productive stem cells self-renew. In some variations, productive stem cells display at least two, three, four, five, or more of the characteristics associated with productivity.
3. Detección de los biomarcadores de interés3. Detection of biomarkers of interest
Los métodos complementarios descritos aquí dependen de la medida de los niveles de expresión de al menos dos biomarcadores de un panel de biomarcadores asociados con la senescencia celular; por ejemplo, el panel puede comprender biomarcadores que son antiapoptóticos, angiogénicos, tumorigénicos, conducen al desarrollo vascular, responsables del crecimiento invasivo, metástasis, motilidad celular, migración, y similares. En general, los métodos proporcionan la medida de los marcadores para determinar si el uso de una terapia con IL-2 o el trasplante de las MSC podría provocar eventos adversos. Como se usa aquí, los eventos adversos que siguen a una terapia con IL-2 o trasplante de MSC incluyen, pero no se limitan a, un aumento en la tumorigénesis, actividad antiapoptótica, angiogénesis, desarrollo vascular, crecimiento invasivo, metástasis, motilidad celular, y migración.The complementary methods described here rely on measuring the expression levels of at least two biomarkers from a panel of biomarkers associated with cellular senescence; for example, the panel may comprise biomarkers that are anti-apoptotic, angiogenic, tumorigenic, lead to vascular growth, responsible for invasive growth, metastasis, cell motility, migration, and the like. In general, the methods provide the measurement of markers to determine if the use of IL-2 therapy or MSC transplantation could cause adverse events. As used herein, adverse events following IL-2 therapy or MSC transplantation include, but are not limited to, increased tumorigenesis, antiapoptotic activity, angiogenesis, vascular development, invasive growth, metastasis, cell motility , and migration.
Como se proporciona aquí, los biomarcadores asociados con la senescencia celular que se regulan al alza en respuesta a la IL-2 pueden incluir los enumerados en las Tablas 1-4, Tabla 5B, y FIGS. 7A-7D.As provided herein, biomarkers associated with cellular senescence that are upregulated in response to IL-2 may include those listed in Tables 1-4, Table 5B, and FIGS. 7A-7D.
En algunas variaciones, el método comprende medir los niveles de ARN de los biomarcadores. Dichos métodos son conocidos por los expertos en la técnica, e incluyen, pero no se limitan a, el uso de Q-PCR, tecnologías basadas en matriz, RNA-seq, análisis transcriptómico, análisis transcriptómico de una sola célula, e hibridación in situ.In some variations, the method comprises measuring the RNA levels of the biomarkers. Such methods are known to those of skill in the art, and include, but are not limited to, the use of Q-PCR, array-based technologies, RNA-seq, transcriptomic analysis, single-cell transcriptomic analysis, and in situ hybridization. .
En algunas variaciones, el método comprende medir los niveles de proteína de los biomarcadores. Dichos métodos son conocidos por los expertos en la técnica, e incluyen, pero no se limitan a, el uso de un ensayo ELISA, una matriz proteómica, inmunohistoquímica, transferencia Western, espectrometría de masas (MS), una matriz de anticuerpos, o un ensayo de quimioluminiscencia.In some variations, the method comprises measuring the protein levels of the biomarkers. Such methods are known to those of skill in the art, and include, but are not limited to, the use of an ELISA assay, array proteomics, immunohistochemistry, Western blotting, mass spectrometry (MS), an antibody array, or an chemiluminescence assay.
En algunas variaciones, el método comprende medir tanto los niveles de ARN como de proteína de los biomarcadores. In some variations, the method comprises measuring both the RNA and protein levels of the biomarkers.
Los biomarcadores se miden y se comparan con un nivel de referencia. Como se contempla aquí, un nivel de referencia puede comprender una muestra del mismo individuo antes del tratamiento con IL-2; puede comprender una muestra de un individuo sano que no ha recibido nada de IL-2; o puede comprender una colección de muestras que representan un grupo heterogéneo de individuos que no han recibido tratamiento con IL-2.Biomarkers are measured and compared to a reference level. As contemplated herein, a reference level may comprise a sample from the same individual prior to IL-2 treatment; it may comprise a sample from a healthy individual who has not received any IL-2; or it may comprise a collection of samples representing a heterogeneous group of individuals who have not received IL-2 treatment.
En variaciones particulares, se determina que los niveles de expresión de ARN de un biomarcador aumentan si muestran una expresión al menos 1,1, al menos 1,2, al menos 1,3, al menos 1,4, al menos 1,5, al menos 2, al menos 3, al menos 4, al menos 5, al menos 6, al menos 7, al menos 8, al menos 9, al menos 10, al menos 15, al menos 20, al menos 25, al menos 50, al menos 75, o incluso al menos 100 veces mayor que el nivel de referencia del biomarcador. El número de veces puede referirse generalmente a los valores del número de veces en bruto, a los valores GFOLD, o a los valores del número de veces calculados usando algoritmos conocidos por el experto.In particular variations, RNA expression levels of a biomarker are determined to be increased if they show at least 1.1, at least 1.2, at least 1.3, at least 1.4, at least 1.5 expression. , at least 2, at least 3, at least 4, at least 5, at least 6, at least 7, at least 8, at least 9, at least 10, at least 15, at least 20, at least 25, at minus 50, at least 75, or even at least 100 times higher than the reference level of the biomarker. The fold number can generally refer to raw fold number values, GFOLD values, or fold number values calculated using algorithms known to the skilled person.
Las diferencias dependientes del ARN en la expresión génica se pueden medir usando un método de cálculo GFOLD (Feng et al, Bioinformatics. 2012), para estimar el número de veces de los cambios que tiene en cuenta la incertidumbre de la medida de la expresión génica por RNA-seq. En estas variaciones, el uso de GFOLD permite la diferencia relativa de expresión génica, y facilita la comparación de genes con diferentes niveles de expresión o de diferentes longitudes. RNA-dependent differences in gene expression can be measured using a GFOLD calculation method (Feng et al, Bioinformatics. 2012), to estimate the fold number of changes that takes into account the uncertainty of the gene expression measurement. by RNA-seq. In these variations, the use of GFOLD allows for the relative difference in gene expression, and facilitates the comparison of genes with different expression levels or of different lengths.
En variaciones particulares, se determina que los niveles de expresión de proteínas de un biomarcador aumentan si muestran una expresión al menos 1,1, al menos 1,2, al menos 1,3, al menos 1,4, al menos 1,5, al menos 2, al menos 3, al menos 4, al menos 5, al menos 6, al menos 7, al menos 8, al menos 9, al menos 10, al menos 15, al menos 20, al menos 25, al menos 50, al menos 75, o incluso al menos 100 veces mayor que el nivel de referencia del biomarcador.In particular variations, protein expression levels of a biomarker are determined to be increased if they show at least 1.1, at least 1.2, at least 1.3, at least 1.4, at least 1.5 expression. , at least 2, at least 3, at least 4, at least 5, at least 6, at least 7, at least 8, at least 9, at least 10, at least 15, at least 20, at least 25, at minus 50, at least 75, or even at least 100 times higher than the reference level of the biomarker.
4, Identidad de los biomarcadores de interés4, Identity of biomarkers of interest
Tal como se menciona aquí, por “biomarcador” se entiende cualquier molécula biológica (o fragmento de la misma) de interés, por ejemplo un biomarcador que está presente en el citoplasma celular, en la superficie, o se segrega. Tales biomarcadores incluyen, pero no se limitan a, biomoléculas que comprenden polipéptidos, proteínas, hidratos de carbono, lípidos, glicoproteínas, ribonucleoproteínas, lipoproteínas, glicolípidos, y fragmentos de los mismos. Cuando el biomarcador comprende una proteína, la proteína puede ser una proteína segregada, una proteína intracelular, o una proteína de membrana. Las proteínas biomarcadoras incluyen, pero no se limitan a, péptidos, polipéptidos, glicoproteínas, lipoproteínas, citocinas, factores de crecimiento, anticuerpos, y otras moléculas inmunogénicas. El biomarcador también puede ser una proteína transmembránica, o puede estar unido a una proteína transmembránica o a un lípido de membrana, por ejemplo.As mentioned herein, by "biomarker" is meant any biological molecule (or fragment thereof) of interest, eg, a biomarker that is present in the cell cytoplasm, on the surface, or is secreted. Such biomarkers include, but are not limited to, biomolecules comprising polypeptides, proteins, carbohydrates, lipids, glycoproteins, ribonucleoproteins, lipoproteins, glycolipids, and fragments thereof. When the biomarker comprises a protein, the protein can be a secreted protein, an intracellular protein, or a membrane protein. Biomarker proteins include, but are not limited to, peptides, polypeptides, glycoproteins, lipoproteins, cytokines, growth factors, antibodies, and other immunogenic molecules. The biomarker may also be a transmembrane protein, or may be bound to a transmembrane protein or membrane lipid, for example.
Como se proporciona aquí, los biomarcadores asociados con la senescencia celular que se regulan al alza en respuesta a la IL-2 son los enumerados en las Tablas 1-4, Tabla 5B, y FIGS. 7A-7D.As provided herein, biomarkers associated with cellular senescence that are upregulated in response to IL-2 are those listed in Tables 1-4, Table 5B, and FIGS. 7A-7D.
En algunas variaciones, los métodos comprenden medir los niveles de expresión de al menos 3, al menos 4, al menos 5, al menos 6, al menos 7, al menos 8, al menos 9, al menos 10, al menos 11, al menos 12, al menos 13, al menos 14, al menos 15, al menos 16, al menos 17, al menos 18, al menos 19, o incluso al menos 20 biomarcadores del panel de biomarcadores para la determinación de posibles eventos adversos asociados con terapias basadas en IL-2 y/o para la determinación de la idoneidad de una población de MSC para trasplante. In some variations, the methods comprise measuring the expression levels of at least 3, at least 4, at least 5, at least 6, at least 7, at least 8, at least 9, at least 10, at least 11, at least 12, at least 13, at least 14, at least 15, at least 16, at least 17, at least 18, at least 19, or even at least 20 biomarkers from the panel of biomarkers for the determination of possible adverse events associated with IL-2 based therapies and/or for determining the suitability of an MSC population for transplantation.
En algunas variaciones, se miden los niveles de expresión de al menos dos biomarcadores seleccionados de cualquiera de los biomarcadores presentados en las Tablas 1-4. En algunas variaciones, se miden los niveles de expresión de al menos dos biomarcadores presentados en las FIGS. 7A-7D. En algunas variaciones, se miden los niveles de expresión de al menos dos biomarcadores presentados en la Tabla 5B.In some variations, the expression levels of at least two biomarkers selected from any of the biomarkers presented in Tables 1-4 are measured. In some variations, the expression levels of at least two biomarkers presented in FIGS. 7A-7D. In some variations, the expression levels of at least two biomarkers presented in Table 5B are measured.
En una variación, se miden los niveles de expresión de al menos dos biomarcadores, en el que el primer biomarcador es TIE-1 y el segundo biomarcador se selecciona del grupo que consiste en TIE-2, TIMP-4, FGF1, LIF, TGFBR2, CSF1, TGFa, TGFb1, IL17D, SDF2, TGFBRAP1, FGF11, TNFSF13B, FGF14, IL1 b, IL-11, IL-32, IL-6, IL1 RN, IL-20RB, IL-21 R, PLAU, GNB2L1, PLEKHA6, CTSB, FERMT1, CRMP1, VEGFB, VEGFA, y PLEKHA1.In one variation, the expression levels of at least two biomarkers are measured, wherein the first biomarker is TIE-1 and the second biomarker is selected from the group consisting of TIE-2, TIMP-4, FGF1, LIF, TGFBR2 , CSF1, TGFa, TGFb1, IL17D, SDF2, TGFBRAP1, FGF11, TNFSF13B, FGF14, IL1 b, IL-11, IL-32, IL-6, IL1 RN, IL-20RB, IL-21 R, PLAU, GNB2L1, PLEKHA6, CTSB, FERMT1, CRMP1, VEGFB, VEGFA, and PLEKHA1.
En una variación, se miden los niveles de expresión de al menos dos biomarcadores, en el que el primer biomarcador es TIE-2 y el segundo biomarcador se selecciona del grupo que consiste en TIE-1, TIMP-4, FGF1, LIF, TGFBR2, CSF1, TGFa, TGFb1, IL17D, SDF2, TGFBRAP1, FGF11, TNFSF13B, FGF14, IL1 b, IL-11, IL-32, IL-6, IL1 RN, IL-20RB, IL-21 R, PLAU, GNB2L1, PLEKHA6, CTSB, FERMT1, CRMP1, VEGFB, VEGFA, y PLEKHA1. En una variación, se miden los niveles de expresión de al menos dos biomarcadores, en el que el primer biomarcador es TIE-1 y el segundo biomarcador se selecciona del grupo que consiste en TIE-1, TIE-2, TIMP-4, FGF1, LIF, TGFBR2, CSF1, TGFa, TGFb1, IL17D, SDF2, TGFBRAP1, FGF11, TNFSF13B, FGF14, IL1 b, IL-11, IL-32, IL-6, IL1RN, IL-20RB, IL-21R, PLAU, GNB2L1, PLEKHA6, CTSB, FERMT1, CRMP1, VEGFB, VEGFA, y PLEKHA1.In one variation, the expression levels of at least two biomarkers are measured, wherein the first biomarker is TIE-2 and the second biomarker is selected from the group consisting of TIE-1, TIMP-4, FGF1, LIF, TGFBR2 , CSF1, TGFa, TGFb1, IL17D, SDF2, TGFBRAP1, FGF11, TNFSF13B, FGF14, IL1 b, IL-11, IL-32, IL-6, IL1 RN, IL-20RB, IL-21 R, PLAU, GNB2L1, PLEKHA6, CTSB, FERMT1, CRMP1, VEGFB, VEGFA, and PLEKHA1. In one variation, the expression levels of at least two biomarkers are measured, wherein the first biomarker is TIE-1 and the second biomarker is selected from the group consisting of TIE-1, TIE-2, TIMP-4, FGF1 , LIF, TGFBR2, CSF1, TGFa, TGFb1, IL17D, SDF2, TGFBRAP1, FGF11, TNFSF13B, FGF14, IL1 b, IL-11, IL-32, IL-6, IL1RN, IL-20RB, IL-21R, PLAU, GNB2L1, PLEKHA6, CTSB, FERMT1, CRMP1, VEGFB, VEGFA, and PLEKHA1.
En una variación, se miden los niveles de expresión de al menos dos biomarcadores, en el que el primer biomarcador es TIMP-4 y el segundo biomarcador se selecciona del grupo que consiste en TIE-1, TIE-2, FGF1, LIF, TGFBR2, CSF1, TGFa, TGFb1, IL17D, SDF2, TGFBRAP1, FGF11, TNFSF13B, FGF14, IL1 b, IL-11, IL-32, IL-6, IL1 RN, IL-20RB, IL-21 R, PLAU, GNB2L1, PLEKHA6, CTSB, FERMT1, CRMP1, VEGFB, VEGFA, y PLEKHA1.In one variation, the expression levels of at least two biomarkers are measured, wherein the first biomarker is TIMP-4 and the second biomarker is selected from the group consisting of TIE-1, TIE-2, FGF1, LIF, TGFBR2 , CSF1, TGFa, TGFb1, IL17D, SDF2, TGFBRAP1, FGF11, TNFSF13B, FGF14, IL1 b, IL-11, IL-32, IL-6, IL1 RN, IL-20RB, IL-21 R, PLAU, GNB2L1, PLEKHA6, CTSB, FERMT1, CRMP1, VEGFB, VEGFA, and PLEKHA1.
En una variación, se miden los niveles de expresión de al menos dos biomarcadores, en el que el primer biomarcador es FGF1 y el segundo biomarcador se selecciona del grupo que consiste en TIE-1, TIE-2, TIMP-4, LIF, TGFBR2, CSF1, TGFa, TGFb1, IL17D, SDF2, TGFBRAP1, FGF11, TNFSF13B, FGF14, IL1 b, IL-11, IL-32, IL-6, IL1 RN, IL-20RB, IL-21 R, PLAU, GNB2L1, PLEKHA6, CTSB, FERMT1, CRMP1, VEGFB, VEGFA, y PLEKHA1.In one variation, the expression levels of at least two biomarkers are measured, wherein the first biomarker is FGF1 and the second biomarker is selected from the group consisting of TIE-1, TIE-2, TIMP-4, LIF, TGFBR2 , CSF1, TGFa, TGFb1, IL17D, SDF2, TGFBRAP1, FGF11, TNFSF13B, FGF14, IL1 b, IL-11, IL-32, IL-6, IL1 RN, IL-20RB, IL-21 R, PLAU, GNB2L1, PLEKHA6, CTSB, FERMT1, CRMP1, VEGFB, VEGFA, and PLEKHA1.
En una variación, se miden los niveles de expresión de al menos dos biomarcadores, en el que el primer biomarcador es LIF y el segundo biomarcador se selecciona del grupo que consiste en TIE-1, TIE-2, TIMP-4, FGF1, TGFBR2, CSF1, TGFa, TGFb1, IL17D, SDF2, TGFBRAP1, FGF11, TNFSF13B, FGF14, IL1 b, IL-11, IL-32, IL-6, IL1 RN, IL-20RB, IL-21 R, PLAU, GNB2L1, PLEKHA6, CTSB, FERMT1, CRMP1, VEGFB, VEGFA, y PLEKHA1.In one variation, the expression levels of at least two biomarkers are measured, wherein the first biomarker is LIF and the second biomarker is selected from the group consisting of TIE-1, TIE-2, TIMP-4, FGF1, TGFBR2 , CSF1, TGFa, TGFb1, IL17D, SDF2, TGFBRAP1, FGF11, TNFSF13B, FGF14, IL1 b, IL-11, IL-32, IL-6, IL1 RN, IL-20RB, IL-21 R, PLAU, GNB2L1, PLEKHA6, CTSB, FERMT1, CRMP1, VEGFB, VEGFA, and PLEKHA1.
En una variación, se miden los niveles de expresión de al menos dos biomarcadores, en el que el primer biomarcador es TGFBR2 y el segundo biomarcador se selecciona del grupo que consiste en TIE-1, TIE-2, TIMP-4, FGF1, LIF, CSF1, TGFa, TGFb1, IL17D, SDF2, TGFBRAP1, FGF11, TNFSF13B, FGF14, IL1 b, IL-11, IL-32, IL-6, IL1 RN, IL-20RB, IL-21 R, PLAU, GNB2L1, PLEKHA6, CTSB, FERMT1, CRMP1, VEGFB, VEGFA, y PLEKHA1.In one variation, expression levels of at least two biomarkers are measured, wherein the first biomarker is TGFBR2 and the second biomarker is selected from the group consisting of TIE-1, TIE-2, TIMP-4, FGF1, LIF , CSF1, TGFa, TGFb1, IL17D, SDF2, TGFBRAP1, FGF11, TNFSF13B, FGF14, IL1 b, IL-11, IL-32, IL-6, IL1 RN, IL-20RB, IL-21 R, PLAU, GNB2L1, PLEKHA6, CTSB, FERMT1, CRMP1, VEGFB, VEGFA, and PLEKHA1.
En una variación, se miden los niveles de expresión de al menos dos biomarcadores, en el que el primer biomarcador es CSF1 y el segundo biomarcador se selecciona del grupo que consiste en TIE-1, TIE-2, TIMP-4, FGF1, LIF, TGFBR2, TGFa, TGFb1, IL17D, SDF2, TGFBRAP1, FGF11, TNFSF13B, FGF14, IL1 b, IL-11, IL-32, IL-6, IL1RN, IL-20RB, IL-21 R, PLAU, GNB2L1, PLEKHA6, CTSB, FERMT1, CRMP1, VEGFB, VEGFA, y PLEKHA1.In one variation, the expression levels of at least two biomarkers are measured, wherein the first biomarker is CSF1 and the second biomarker is selected from the group consisting of TIE-1, TIE-2, TIMP-4, FGF1, LIF , TGFBR2, TGFa, TGFb1, IL17D, SDF2, TGFBRAP1, FGF11, TNFSF13B, FGF14, IL1 b, IL-11, IL-32, IL-6, IL1RN, IL-20RB, IL-21R, PLAU, GNB2L1, PLEKHA6 , CTSB, FERMT1, CRMP1, VEGFB, VEGFA, and PLEKHA1.
En una variación, se miden los niveles de expresión de al menos dos biomarcadores, en el que el primer biomarcador es TGFa y el segundo biomarcador se selecciona del grupo que consiste en TIE-1, TIE-2, TIMP-4, FGF1, LIF, TGFBR2, CSF1, TGFb1, IL17D, SDF2, TGFBRAP1, FGF11, TNFSF13B, FGF14, IL1 b, IL-11, IL-32, IL-6, IL1RN, IL-20RB, IL-21 R, PLAU, GNB2L1, PLEKHA6, CTSB, FERMT1, CRMP1, VEGFB, VEGFA, y PLEKHA1.In one variation, expression levels of at least two biomarkers are measured, wherein the first biomarker is TGFα and the second biomarker is selected from the group consisting of TIE-1, TIE-2, TIMP-4, FGF1, LIF , TGFBR2, CSF1, TGFb1, IL17D, SDF2, TGFBRAP1, FGF11, TNFSF13B, FGF14, IL1 b, IL-11, IL-32, IL-6, IL1RN, IL-20RB, IL-21R, PLAU, GNB2L1, PLEKHA6 , CTSB, FERMT1, CRMP1, VEGFB, VEGFA, and PLEKHA1.
En una variación, se miden los niveles de expresión de al menos dos biomarcadores, en el que el primer biomarcador es TGFb1 y el segundo biomarcador se selecciona del grupo que consiste en TIE-2, TIMP-4, FGF1, LIF, TGFBR2, CSF1, TGFa, IL17D, SDF2, TGFBRAP1, FGF11, TNFSF13B, FGF14, IL1 b, IL-11, IL-32, IL-6, IL1RN, IL-20RB, IL-21 R, PLAU, GNB2L1, PLEKHA6, CTSB, FERMT1, CRMP1, VEGFB, VEGFA, y PLEKHA1.In one variation, the expression levels of at least two biomarkers are measured, wherein the first biomarker is TGFb1 and the second biomarker is selected from the group consisting of TIE-2, TIMP-4, FGF1, LIF, TGFBR2, CSF1 , TGFa, IL17D, SDF2, TGFBRAP1, FGF11, TNFSF13B, FGF14, IL1 b, IL-11, IL-32, IL-6, IL1RN, IL-20RB, IL-21R, PLAU, GNB2L1, PLEKHA6, CTSB, FERMT1 , CRMP1, VEGFB, VEGFA, and PLEKHA1.
En una variación, se miden los niveles de expresión de al menos dos biomarcadores, en el que el primer biomarcador es IL17D y el segundo biomarcador se selecciona del grupo que consiste en TIE-1, TIMP-4, FGF1, LIF, TGFBR2, CSF1, TGFa, TGFb1, SDF2, TGFBRAP1, FGF11, TNFSF13B, FGF14, IL1 b, IL-11, IL-32, IL-6, IL1RN, IL-20RB, IL-21 R, PLAU, GNB2L1, PLEKHA6, CTSB, FERMT1, CRMP1, VEGFB, VEGFA, y PLEKHA1.In one variation, expression levels of at least two biomarkers are measured, wherein the first biomarker is IL17D and the second biomarker is selected from the group consisting of TIE-1, TIMP-4, FGF1, LIF, TGFBR2, CSF1 , TGFa, TGFb1, SDF2, TGFBRAP1, FGF11, TNFSF13B, FGF14, IL1 b, IL-11, IL-32, IL-6, IL1RN, IL-20RB, IL-21R, PLAU, GNB2L1, PLEKHA6, CTSB, FERMT1 , CRMP1, VEGFB, VEGFA, and PLEKHA1.
En una variación, se miden los niveles de expresión de al menos dos biomarcadores, en el que el primer biomarcador es SDF2 y el segundo biomarcador se selecciona del grupo que consiste en TIE-1, TIE-2, TIMP-4, FGF1, LIF, TGFBR2, CSF1, TGFa, TGFb1, IL17D, TGFBRAP1, FGF11, TNFSF13B, FGF14, IL1 b, IL-11, IL-32, IL-6, IL1RN, IL-20RB, IL-21 R, PLAU, GNB2L1, PLEKHA6, CTSB, FERMT1, CRMP1, VEGFB, VEGFA, y PLEKHA1.In one variation, the expression levels of at least two biomarkers are measured, wherein the first biomarker is SDF2 and the second biomarker is selected from the group consisting of TIE-1, TIE-2, TIMP-4, FGF1, LIF , TGFBR2, CSF1, TGFa, TGFb1, IL17D, TGFBRAP1, FGF11, TNFSF13B, FGF14, IL1 b, IL-11, IL-32, IL-6, IL1RN, IL-20RB, IL-21R, PLAU, GNB2L1, PLEKHA6 , CTSB, FERMT1, CRMP1, VEGFB, VEGFA, and PLEKHA1.
En una variación, se miden los niveles de expresión de al menos dos biomarcadores, en el que el primer biomarcador es TGFBRAP1 y el segundo biomarcador se selecciona del grupo que consiste en TIE-1, TIE-2, FGF1, LIF, TGFBR2, CSF1, TGFa, TG Fpi, IL17D, SDF2, FGF11, TNFSF13B, FGF14, IL1 b, IL-11, IL-32, IL-6, IL1RN, IL-20RB, IL-21R, PLAU, GNB2L1, PLEKHA6, CTSB, FERMT1, CRMP1, VEGFB, VEGFA, y PLEKHA1.In one variation, the expression levels of at least two biomarkers are measured, wherein the first biomarker is TGFBRAP1 and the second biomarker is selected from the group consisting of TIE-1, TIE-2, FGF1, LIF, TGFBR2, CSF1, TGFa, TG Fpi, IL17D, SDF2, FGF11, TNFSF13B, FGF14, IL1 b, IL-11, IL-32, IL-6, IL1RN, IL-20RB, IL-21R, PLAU, GNB2L1, PLEKHA6, CTSB, FERMT1, CRMP1, VEGFB, VEGFA, and PLEKHA1.
En una variación, se miden los niveles de expresión de al menos dos biomarcadores, en el que el primer biomarcador es FGF11 y el segundo biomarcador se selecciona del grupo que consiste en TIE-1, TIE-2, TIMP-4, LIF, TGFBR2, CSF1, TGFa, TGFP1, IL17D, SDF2, TGFBRAP1, TNFSF13B, FGF14, IL1 b, IL-11, IL-32, IL-6, IL1RN, IL-20RB, IL-21 R, PLAU, GNB2L1, PLEKHA6, CTSB, FERMT1, CRMP1, VEGFB, VEGFA, y PLEKHA1.In one variation, the expression levels of at least two biomarkers are measured, wherein the first biomarker is FGF11 and the second biomarker is selected from the group consisting of TIE-1, TIE-2, TIMP-4, LIF, TGFBR2 , CSF1, TGFa, TGFP1, IL17D, SDF2, TGFBRAP1, TNFSF13B, FGF14, IL1 b, IL-11, IL-32, IL-6, IL1RN, IL-20RB, IL-21R, PLAU, GNB2L1, PLEKHA6, CTSB , FERMT1, CRMP1, VEGFB, VEGFA, and PLEKHA1.
En una variación, se miden los niveles de expresión de al menos dos biomarcadores, en el que el primer biomarcador es TNFSF13B y el segundo biomarcador se selecciona del grupo que consiste en TIE-1, TIE-2, TIMP-4, FGF1, TGFBR2, CSF1, TGFa, TGFb1, IL17D, SDF2, TGFBRAP1, FGF11, FGF14, IL1 b, IL-11, IL-32, IL-6, IL1RN, IL-20RB, IL-21 R, PLAU, GNB2L1, PLEKHA6, CTSB, FERMT1, CRMP1, VEGFB, VEGFA, y PLEKHA1.In one variation, the expression levels of at least two biomarkers are measured, wherein the first biomarker is TNFSF13B and the second biomarker is selected from the group consisting of TIE-1, TIE-2, TIMP-4, FGF1, TGFBR2 , CSF1, TGFa, TGFb1, IL17D, SDF2, TGFBRAP1, FGF11, FGF14, IL1 b, IL-11, IL-32, IL-6, IL1RN, IL-20RB, IL-21R, PLAU, GNB2L1, PLEKHA6, CTSB , FERMT1, CRMP1, VEGFB, VEGFA, and PLEKHA1.
En una variación, se miden los niveles de expresión de al menos dos biomarcadores, en el que el primer biomarcador es FGF14 y el segundo biomarcador se selecciona del grupo que consiste en TIE-1, TIE-2, TIMP-4, FGF1, LIF, CSF1, TGFa, TGFb1, IL17D, SDF2, TGFBRAP1, FGF11, TNFSF13B, IL1 b, IL-11, IL-32, IL-6, IL1 RN, IL-20RB, IL-21 R, PLAU, GNB2L1, PLEKHA6, CTSB, FERMT1, CRMP1, VEGFB, VEGFA, y PLEKHA1.In one variation, the expression levels of at least two biomarkers are measured, wherein the first biomarker is FGF14 and the second biomarker is selected from the group consisting of TIE-1, TIE-2, TIMP-4, FGF1, LIF , CSF1, TGFa, TGFb1, IL17D, SDF2, TGFBRAP1, FGF11, TNFSF13B, IL1 b, IL-11, IL-32, IL-6, IL1 RN, IL-20RB, IL-21 R, PLAU, GNB2L1, PLEKHA6, CTSB, FERMT1, CRMP1, VEGFB, VEGFA, and PLEKHA1.
En una variación, se miden los niveles de expresión de al menos dos biomarcadores, en el que el primer biomarcador es IL1 b y el segundo biomarcador se selecciona del grupo que consiste en TIE-1, TIE-2, TIMP-4, FGF1, LIF, TGFBR2, TGFa, TGFb1 IL17D, SDF2, TGFBRAP1, FGF11, TNFSF13B, FGF14, IL-11, IL-32, IL-6, IL1RN, IL-20RB, IL-21R, PLAU, GNB2L1, PLEKHA6, CTSB, FERMT1, CRMP1, VEGFB, VEGFA, y PLEKHA1.In one variation, the expression levels of at least two biomarkers are measured, wherein the first biomarker is IL1 b and the second biomarker is selected from the group consisting of TIE-1, TIE-2, TIMP-4, FGF1, LIF , TGFBR2, TGFa, TGFb1 IL17D, SDF2, TGFBRAP1, FGF11, TNFSF13B, FGF14, IL-11, IL-32, IL-6, IL1RN, IL-20RB, IL-21R, PLAU, GNB2L1, PLEKHA6, CTSB, FERMT1, CRMP1, VEGFB, VEGFA, and PLEKHA1.
En una variación, se miden los niveles de expresión de al menos dos biomarcadores, en el que el primer biomarcador es IL-11, y el segundo biomarcador se selecciona del grupo que consiste en TIE-1, TIE-2, TIMP-4, FGF1, LIF, TGFBR2, CSF1, TGFb1, IL17D, SDF2, TGFBRAP1, FGF11, TNFSF13B, FGF14, IL1 b, IL-32, IL-6, IL1RN, IL-20RB, IL-21R, PLAU, GNB2L1, PLEKHA6, CTSB, FERMT1, CRMP1, VEGFB, VEGFA, y PLEKHA1.In one variation, the expression levels of at least two biomarkers are measured, wherein the first biomarker is IL-11, and the second biomarker is selected from the group consisting of TIE-1, TIE-2, TIMP-4, FGF1, LIF, TGFBR2, CSF1, TGFb1, IL17D, SDF2, TGFBRAP1, FGF11, TNFSF13B, FGF14, IL1 b, IL-32, IL-6, IL1RN, IL-20RB, IL-21R, PLAU, GNB2L1, PLEKHA6, CTSB , FERMT1, CRMP1, VEGFB, VEGFA, and PLEKHA1.
En una variación, se miden los niveles de expresión de al menos dos biomarcadores, en el que el primer biomarcador es IL-32 y el segundo biomarcador se selecciona del grupo que consiste en TIE-2, TIMP-4, FGF1, LIF, TGFBR2, CSF1, TGFa, IL17D, SDF2, TGFBRAP1, FGF11, TNFSF13B, FGF14, IL1 b, IL-11, IL-6, IL1RN, IL-20RB, IL-21R, PLAU, GNB2L1, PLEKHA6, CTSB, FERMT1, CRMP1, VEGFB, VEGFA, y PLEKHA1.In one variation, the expression levels of at least two biomarkers are measured, wherein the first biomarker is IL-32 and the second biomarker is selected from the group consisting of TIE-2, TIMP-4, FGF1, LIF, TGFBR2 , CSF1, TGFa, IL17D, SDF2, TGFBRAP1, FGF11, TNFSF13B, FGF14, IL1 b, IL-11, IL-6, IL1RN, IL-20RB, IL-21R, PLAU, GNB2L1, PLEKHA6, CTSB, FERMT1, CRMP1, VEGFB, VEGFA, and PLEKHA1.
En una variación, se miden los niveles de expresión de al menos dos biomarcadores, en el que el primer biomarcador es IL-6 y el segundo biomarcador se selecciona del grupo que consiste en TIE-1, TIMP-4, FGF1, LIF, TGFBR2, CSF1, TGFa, TGFb1, SDF2, TGFBRAP1, FGF11, TNFSF13B, FGF14, IL1 b, IL-11, IL-32, IL1RN, IL-20RB, IL-21R, PLAU, GNB2L1, PLEKHA6, CTSB, FERMT1, CRMP1, VEGFB, VEGFA, y PLEKHA1.In one variation, the expression levels of at least two biomarkers are measured, wherein the first biomarker is IL-6 and the second biomarker is selected from the group consisting of TIE-1, TIMP-4, FGF1, LIF, TGFBR2 , CSF1, TGFa, TGFb1, SDF2, TGFBRAP1, FGF11, TNFSF13B, FGF14, IL1 b, IL-11, IL-32, IL1RN, IL-20RB, IL-21R, PLAU, GNB2L1, PLEKHA6, CTSB, FERMT1, CRMP1, VEGFB, VEGFA, and PLEKHA1.
En una variación, se miden los niveles de expresión de al menos dos biomarcadores, en el que el primer biomarcador es IL1RN y el segundo biomarcador se selecciona del grupo que consiste en TIE-1, TIE-2, TIMP-4, FGF1, LIF, TGFBR2, CSF1, TGFa, TGFb1, IL17D, TGFBRAP1, FGF11, TNFSF13B, FGF14, IL1 b, IL-11, IL-32, IL-6, IL-20RB, IL-21 R, PLAU, GNB2L1, PLEKHA6, CTSB, FERMT1, CRMP1, VEGFB, VEGFA, y PLEKHA1.In one variation, the expression levels of at least two biomarkers are measured, wherein the first biomarker is IL1RN and the second biomarker is selected from the group consisting of TIE-1, TIE-2, TIMP-4, FGF1, LIF , TGFBR2, CSF1, TGFa, TGFb1, IL17D, TGFBRAP1, FGF11, TNFSF13B, FGF14, IL1 b, IL-11, IL-32, IL-6, IL-20RB, IL-21R, PLAU, GNB2L1, PLEKHA6, CTSB , FERMT1, CRMP1, VEGFB, VEGFA, and PLEKHA1.
En una variación, se miden los niveles de expresión de al menos dos biomarcadores, en el que el primer biomarcador es IL-20RB y el segundo biomarcador se selecciona del grupo que consiste en TIE-1, TIE-2, FGF1, LIF, TGFBR2, CSF1, TGFa, TGFb1, IL17D, SDF2, FGF11, TNFSF13B, FGF14, IL1 b, IL-11, IL-32, IL-6, IL1RN, IL-21R, PLAU, GNB2L1, PLEKHA6, CTSB, FERMT1, CRMP1, VEGFB, VEGFA, y PLEKHA1.In one variation, the expression levels of at least two biomarkers are measured, wherein the first biomarker is IL-20RB and the second biomarker is selected from the group consisting of TIE-1, TIE-2, FGF1, LIF, TGFBR2 , CSF1, TGFa, TGFb1, IL17D, SDF2, FGF11, TNFSF13B, FGF14, IL1 b, IL-11, IL-32, IL-6, IL1RN, IL-21R, PLAU, GNB2L1, PLEKHA6, CTSB, FERMT1, CRMP1, VEGFB, VEGFA, and PLEKHA1.
En una variación, se miden los niveles de expresión de al menos dos biomarcadores, en el que el primer biomarcador es IL-21R y el segundo biomarcador se selecciona del grupo que consiste en TIE-1, TIE-2, TIMP-4, LIF, TGFBR2, CSF1, TGFa, TGFb1, IL17D, SDF2, TGFBRAP1, TNFSF13B, FGF14, IL1 b, IL-11, IL-32, IL-6, IL1RN, IL-20RB, PLAU, GNB2L1, PLEKHA6, CTSB, FERMT1, CRMP1, VEGFB, VEGFA, y PLEKHA1.In one variation, the expression levels of at least two biomarkers are measured, wherein the first biomarker is IL-21R and the second biomarker is selected from the group consisting of TIE-1, TIE-2, TIMP-4, LIF , TGFBR2, CSF1, TGFa, TGFb1, IL17D, SDF2, TGFBRAP1, TNFSF13B, FGF14, IL1 b, IL-11, IL-32, IL-6, IL1RN, IL-20RB, PLAU, GNB2L1, PLEKHA6, CTSB, FERMT1, CRMP1, VEGFB, VEGFA, and PLEKHA1.
En una variación, se miden los niveles de expresión de al menos dos biomarcadores, en el que el primer biomarcador es PLAU y el segundo biomarcador se selecciona del grupo que consiste en TIE-1, TIE-2, TIMP-4, FGF1, TGFBR2, CSF1, TGFa, TGFb1, IL17D, SDF2, TGFBRAP1, FGF11, FGF14, IL1 b, IL-11, IL-32, IL-6, IL1RN, IL-20RB, IL-21R, GNB2L1, PLEKHA6, CTSB, FERMT1, CRMP1, VEGFB, VEGFA, y PLEKHA1.In one variation, the expression levels of at least two biomarkers are measured, wherein the first biomarker is PLAU and the second biomarker is selected from the group consisting of TIE-1, TIE-2, TIMP-4, FGF1, TGFBR2 , CSF1, TGFa, TGFb1, IL17D, SDF2, TGFBRAP1, FGF11, FGF14, IL1 b, IL-11, IL-32, IL-6, IL1RN, IL-20RB, IL-21R, GNB2L1, PLEKHA6, CTSB, FERMT1, CRMP1, VEGFB, VEGFA, and PLEKHA1.
En una variación, se miden los niveles de expresión de al menos dos biomarcadores, en el que el primer biomarcador es GNB2L1 y el segundo biomarcador se selecciona del grupo que consiste en TIE-1, TIE-2, TIMP-4, FGF1, LIF, CSF1, TGFa, TGFb1, IL17D, SDF2, TGFBRAP1, FGF11, TNFSF13B, IL1 b, IL-11, IL-32, IL-6, IL1RN, IL-20RB, IL-21 R, PLAU, PLEKHA6, CTSB, FERMT1, CRMP1, VEGFB, VEGFA, y PLEKHA1.In one variation, expression levels of at least two biomarkers are measured, wherein the first biomarker is GNB2L1 and the second biomarker is selected from the group consisting of TIE-1, TIE-2, TIMP-4, FGF1, LIF , CSF1, TGFa, TGFb1, IL17D, SDF2, TGFBRAP1, FGF11, TNFSF13B, IL1 b, IL-11, IL-32, IL-6, IL1RN, IL-20RB, IL-21R, PLAU, PLEKHA6, CTSB, FERMT1 , CRMP1, VEGFB, VEGFA, and PLEKHA1.
En una variación, se miden los niveles de expresión de al menos dos biomarcadores, en el que el primer biomarcador es PLEKHA6y el segundo biomarcador se selecciona del grupo que consiste en TIE-1, TIE-2, TIMP-4, FGF1, LIF, TGFBR2, TGFa, TGFb1, IL17D, SDF2, TGFBRAP1, FGF11, TNFSF13B, FGF14, IL-11, IL-32, IL-6, IL1RN, IL-20RB, IL-21 R, PLAU, GNB2L1, CTSB, FERMT1, CRMP1, VEGFB, VEGFA, y PLEKHA1. In one variation, expression levels of at least two biomarkers are measured, wherein the first biomarker is PLEKHA6 and the second biomarker is selected from the group consisting of TIE-1, TIE-2, TIMP-4, FGF1, LIF, TGFBR2, TGFa, TGFb1, IL17D, SDF2, TGFBRAP1, FGF11, TNFSF13B, FGF14, IL-11, IL-32, IL-6, IL1RN, IL-20RB, IL-21R, PLAU, GNB2L1, CTSB, FERMT1, CRMP1 , VEGFB, VEGFA, and PLEKHA1.
En una variación, se miden los niveles de expresión de al menos dos biomarcadores, en el que el primer biomarcador es CTSB y el segundo biomarcador se selecciona del grupo que consiste en TIE-1, TIMP-4, FGF1, LIF, TGFBR2, CSF1, TGFa, TGFb1, SDF2, TGFBRAP1, FGF11, TNFSF13B, FGF14, IL1 b, IL-11, IL-32, IL1RN, IL-20RB, IL-21R, PLAU, GNB2L1, PLEKHA6, FERMT1, CRMP1, VEGFB, VEGFA, y PLEKHA1.In one variation, expression levels of at least two biomarkers are measured, wherein the first biomarker is CTSB and the second biomarker is selected from the group consisting of TIE-1, TIMP-4, FGF1, LIF, TGFBR2, CSF1 , TGFa, TGFb1, SDF2, TGFBRAP1, FGF11, TNFSF13B, FGF14, IL1 b, IL-11, IL-32, IL1RN, IL-20RB, IL-21R, PLAU, GNB2L1, PLEKHA6, FERMT1, CRMP1, VEGFB, VEGFA, and PLEKHA1.
En una variación, se miden los niveles de expresión de al menos dos biomarcadores, en el que el primer biomarcador es FERMT1 y el segundo biomarcador se selecciona del grupo que consiste en TIE-1, TIE-2, TIMP-4, FGF1, LIF, TGFBR2, CSF1, TGFa, TGFb1, IL17D, TGFBRAP1, FGF11, TNFSF13B, FGF14, IL1 b, IL-11, IL-32, IL-6, IL-20RB, IL-21 R, PLAU, GNB2L1, PLEKHA6, CTSB, CRMP1, VEGFB, VEGFA, y PLEKHA1.In one variation, the expression levels of at least two biomarkers are measured, wherein the first biomarker is FERMT1 and the second biomarker is selected from the group consisting of TIE-1, TIE-2, TIMP-4, FGF1, LIF , TGFBR2, CSF1, TGFa, TGFb1, IL17D, TGFBRAP1, FGF11, TNFSF13B, FGF14, IL1 b, IL-11, IL-32, IL-6, IL-20RB, IL-21R, PLAU, GNB2L1, PLEKHA6, CTSB , CRMP1, VEGFB, VEGFA, and PLEKHA1.
En una variación, se miden los niveles de expresión de al menos dos biomarcadores, en el que el primer biomarcador es CRMP1 y el segundo biomarcador se selecciona del grupo que consiste en TIE-1, TIE-2, FGF1, LIF, TGFBR2, CSF1, TGFa, TGFb1, IL17D, SDF2, FGF11, TNFSF13B, FGF14, IL1 b, IL-11, IL-32, IL-6, IL1RN, IL-21R, PLAU, GNB2L1, PLEKHA6, CTSB, FERMT1, VEGFB, VEGFA, y PLEKHA1.In one variation, the expression levels of at least two biomarkers are measured, wherein the first biomarker is CRMP1 and the second biomarker is selected from the group consisting of TIE-1, TIE-2, FGF1, LIF, TGFBR2, CSF1 , TGFa, TGFb1, IL17D, SDF2, FGF11, TNFSF13B, FGF14, IL1 b, IL-11, IL-32, IL-6, IL1RN, IL-21R, PLAU, GNB2L1, PLEKHA6, CTSB, FERMT1, VEGFB, VEGFA, and PLEKHA1.
En una variación, se miden los niveles de expresión de al menos dos biomarcadores, en el que el primer biomarcador es VEGFB y el segundo biomarcador se selecciona del grupo que consiste en TIE-1, TIE-2, TIMP-4, LIF, TGFBR2, CSF1, TGFa, TGFb1, IL17D, SDF2, TGFBRAP1, TNFSF13B, FGF14, IL1 b, IL-11, IL-32, IL-6, IL1RN, IL-20RB, PLAU, GNB2L1, PLEKHA6, CTSB, FERMT1, CRMP1, VEGFA, y PLEKHA1.In one variation, expression levels of at least two biomarkers are measured, wherein the first biomarker is VEGFB and the second biomarker is selected from the group consisting of TIE-1, TIE-2, TIMP-4, LIF, TGFBR2 , CSF1, TGFa, TGFb1, IL17D, SDF2, TGFBRAP1, TNFSF13B, FGF14, IL1 b, IL-11, IL-32, IL-6, IL1RN, IL-20RB, PLAU, GNB2L1, PLEKHA6, CTSB, FERMT1, CRMP1, VEGFA, and PLEKHA1.
En una variación, se miden los niveles de expresión de al menos dos biomarcadores, en el que el primer biomarcador es VEGFA y el segundo biomarcador se selecciona del grupo que consiste en TIE-1, TIE-2, TIMP-4, FGF1, TGFBR2, CSF1, TGFa, TGFb1, IL17D, SDF2, TGFBRAP1, FGF11, FGF14, IL1 b, IL-11, IL-32, IL-6, IL1RN, IL-20RB, IL-21R, GNB2L1, PLEKHA6, CTSB, FERMT1, CRMP1, VEGFB y PLEKHA1.In one variation, expression levels of at least two biomarkers are measured, wherein the first biomarker is VEGFA and the second biomarker is selected from the group consisting of TIE-1, TIE-2, TIMP-4, FGF1, TGFBR2 , CSF1, TGFa, TGFb1, IL17D, SDF2, TGFBRAP1, FGF11, FGF14, IL1 b, IL-11, IL-32, IL-6, IL1RN, IL-20RB, IL-21R, GNB2L1, PLEKHA6, CTSB, FERMT1, CRMP1, VEGFB and PLEKHA1.
En una variación, se miden los niveles de expresión de al menos dos biomarcadores, en el que el primer biomarcador es PLEKHAl y el segundo biomarcador se selecciona del grupo que consiste en TIE-1, TIE-2, TIMP-4, FGF1, LIF, CSF1, TGFa, TGFb1, IL17D, SDF2, TGFBRAP1, FGF11, TNFSF13B, IL1 b, IL-11, IL-32, IL-6, IL1RN, IL-20RB, IL-21 R, PLAU, PLEKHA6, CTSB, FERMT1, CRMP1, VEGFB, y VEGFA.In one variation, the expression levels of at least two biomarkers are measured, wherein the first biomarker is PLEKHAl and the second biomarker is selected from the group consisting of TIE-1, TIE-2, TIMP-4, FGF1, LIF , CSF1, TGFa, TGFb1, IL17D, SDF2, TGFBRAP1, FGF11, TNFSF13B, IL1 b, IL-11, IL-32, IL-6, IL1RN, IL-20RB, IL-21R, PLAU, PLEKHA6, CTSB, FERMT1 , CRMP1, VEGFB, and VEGFA.
En otras variaciones proporcionadas aquí, de los al menos dos biomarcadores medidos, al menos un biomarcador es un factor que conduce al desarrollo vascular, incluyendo los factores implicados en el desarrollo vascular y la remodelación relacionada con la angiogénesis, tales como TIE-1, TIE-2, TiMp-4, VEGFA, VEGFB, FBLN5, FBLN7, PGF, ANGPT1, ANGPT2, ANGPTL2, ANGPTL6, TNFSF12, PRKCA, PIK3CA, y ESM1.In other variations provided here, of the at least two biomarkers measured, at least one biomarker is a factor leading to vascular development, including factors involved in vascular development and angiogenesis-related remodeling, such as TIE-1, TIE -2, TiMp-4, VEGFA, VEGFB, FBLN5, FBLN7, PGF, ANGPT1, ANGPT2, ANGPTL2, ANGPTL6, TNFSF12, PRKCA, PIK3CA, and ESM1.
En algunas variaciones proporcionadas aquí, de los al menos dos biomarcadores medidos, al menos un biomarcador es un factor antiinflamatorio o inmunomodulador tal como CD99, CERCAM, HIVEP1, PTGER1, IL-32, ITFG1, ITGA V, HIVEP2, CSF1R, TNFSF13, IRAK3, MYL9, NOS3, IL12A, TNFRSF21, IRAK1, IL33, LRRC8A, CLEC11A, CCL28, ESM1, CMIP, TNFRSF25, CHST3, CD72, CD320, CD83, IL6, CD68, CD99, IL-16, o ILF3. El método puede comprender además determinar si los niveles de expresión de KIF 14, CCL2, ILF2, IL7R, PEAR 1, o IL 16 disminuyen. In some variations provided here, of the at least two biomarkers measured, at least one biomarker is an anti-inflammatory or immunomodulatory factor such as CD99, CERCAM, HIVEP1, PTGER1, IL-32, ITFG1, ITGA V, HIVEP2, CSF1R, TNFSF13, IRAK3 , MYL9, NOS3, IL12A, TNFRSF21, IRAK1, IL33, LRRC8A, CLEC11A, CCL28, ESM1, CMIP, TNFRSF25, CHST3, CD72, CD320, CD83, IL6, CD68, CD99, IL-16, or ILF3. The method may further comprise determining whether the expression levels of KIF 14, CCL2, ILF2, IL7R, PEAR 1, or IL 16 are decreased.
En algunas variaciones proporcionadas aquí, de los al menos dos biomarcadores medidos, al menos un biomarcador es un factor de crecimiento transformante (TGFa, TGFb1 o TGFb2), el receptor del factor beta de crecimiento transformante TGFBR2, o la proteína asociada al receptor del factor beta de crecimiento transformante TGFBRAP1. In some variations provided here, of the at least two biomarkers measured, at least one biomarker is a transforming growth factor (TGFa, TGFb1, or TGFb2), the transforming growth factor beta receptor TGFBR2, or the transforming growth factor receptor-associated protein growth beta transformant TGFBRAP1.
En algunas variaciones proporcionadas aquí, de los al menos dos biomarcadores medidos, al menos un biomarcador es un factor promotor de la motilidad celular, la migración y el crecimiento invasivo, tal como TIE-1, TIE-2, TIMP-4, CGNL1, CGREF1, CRMP1, FGD6, TNK2, PTGS1, TNFAIP8, CTSB, CTSO, FAP, FERMT1, PLEKHA1, PLEKHA6, ROCK1, o ROCK2.In some variations provided here, of the at least two biomarkers measured, at least one biomarker is a factor promoting cell motility, migration, and invasive growth, such as TIE-1, TIE-2, TIMP-4, CGNL1, CGREF1, CRMP1, FGD6, TNK2, PTGS1, TNFAIP8, CTSB, CTSO, FAP, FERMT1, PLEKHA1, PLEKHA6, ROCK1, or ROCK2.
En algunas variaciones proporcionadas aquí, de los al menos dos biomarcadores medidos, al menos un biomarcador es un factor antiapoptótico, por ejemplo vEgFA, VEGFB, PLEKHA1, PLEKHA6, CRMP1, FERMY1, CTSB, TGFB1, o GNB2L1.In some variations provided here, of the at least two biomarkers measured, at least one biomarker is an antiapoptotic factor, eg , vEgFA, VEGFB, PLEKHA1, PLEKHA6, CRMP1, FERMY1, CTSB, TGFB1, or GNB2L1.
En algunas variaciones proporcionadas aquí, la disminución en los niveles de expresión de CHD24, CYR61, ILK, NEDD9, MYL9, PPAP2B, rElN, ICAM 2, lCAM3 y TLN2 se monitoriza adicionalmente, ya que estos son factores que promueven la adhesión celular.In some variations provided here, the decrease in expression levels of CHD24, CYR61, ILK, NEDD9, MYL9, PPAP2B, rElN, ICAM 2, lCAM3, and TLN2 are additionally monitored, as these are factors that promote cell adhesion.
En algunas variaciones, se mide adicionalmente la disminución en los niveles de expresión de SIVA1.In some variations, the decrease in SIVA1 expression levels is additionally measured.
En algunas variaciones proporcionadas aquí, de los al menos dos biomarcadores medidos, al menos un biomarcador es una interleucina, por ejemplo, IL1b, IL3, IL5, IL6, IL9, IL10, IL12b, proteína a de unión a IL18, IL9, IL-11, IL12a, IL12b, IL-4, o IL-16.In some variations provided here, of the at least two biomarkers measured, at least one biomarker is an interleukin, eg, IL1b, IL3, IL5, IL6, IL9, IL10, IL12b, IL18-binding protein a, IL9, IL- 11, IL12a, IL12b, IL-4, or IL-16.
En algunas variaciones proporcionadas aquí, de los al menos dos biomarcadores medidos, al menos un biomarcador es un receptor de interleucina, por ejemplo IL1Ra, IL1R4, IL10Rb, IL18Rb, IL1R2, IL-21R, IL-2Rb, IL-2Ry, IL5Ra, IL1R1, IL1R2, o IL1R4. In some variations provided here, of the at least two biomarkers measured, at least one biomarker is an interleukin receptor, for example IL1Ra, IL1R4, IL10Rb, IL18Rb, IL1R2, IL-21R, IL-2Rb, IL-2Ry, IL5Ra, IL1R1, IL1R2, or IL1R4.
En algunas variaciones proporcionadas aquí, de los al menos dos biomarcadores medidos, al menos un biomarcador es una quimiocina, por ejemplo CCL8, CCL13, CCL15, CCL17, CCL18, CCL20, CCL22, CCL24, CCL26, CXCL9, CXCL11, CCL2, CCL4, CCL5, CCL23, CCL25, CCL27, CXCL10, CCL23, CXCL16, o CCL27.In some variations provided here, of the at least two biomarkers measured, at least one biomarker is a chemokine, for example CCL8, CCL13, CCL15, CCL17, CCL18, CCL20, CCL22, CCL24, CCL26, CXCL9, CXCL11, CCL2, CCL4, CCL5, CCL23, CCL25, CCL27, CXCL10, CCL23, CXCL16, or CCL27.
En algunas variaciones proporcionadas aquí, de los al menos dos biomarcadores medidos, al menos un biomarcador es un factor de crecimiento, una hormona, o un receptor del factor de crecimiento, por ejemplo FGF6, IGF1, IGF2, LAP, NT3, PDGFAA, PDGFAB, SCF, TGF2, TGFa, TGFp1, TGFb3, TNFp, PDGFRa, PDGFRp, VEGF, VEGFD, VEGFR, FGF4, FGF9, similar a HGF, IGFBP 6, PDGFBp, IFNg, SDF1A, DR6, ENDOGLINA, ERBB3, FAS LG, GDNF, GITR LG, LEPR, SCFR, SIGLEC 5, TIE-1&2, BDNF, BMP4, FGF7, IGFBP2, DR6, ANG, CNTF, EGF, EOTAXINA 1, NGFR, ACRP30, AGRP, ANGPT2, LEP, NT4, HGF, PRL, SCFR, FAS LG, IGFBP 1, o IGFBP 2.In some variations provided here, of the at least two biomarkers measured, at least one biomarker is a growth factor, hormone, or growth factor receptor, eg FGF6, IGF1, IGF2, LAP, NT3, PDGFAA, PDGFAB , SCF, TGF2, TGFa, TGFp1, TGFb3, TNFp, PDGRa, PDGFRp, VEGF, VEGFD, VEGFR, FGF4, FGF9, HGF-like, IGFBP 6, PDGFBp, IFNg, SDF1A, DR6, ENDOGLIN, ERBB3, FAS LG, GDNF , GITR LG, LEPR, SCFR, SIGLEC 5, TIE-1&2, BDNF, BMP4, FGF7, IGFBP2, DR6, ANG, CNTF, EGF, EOTAXIN 1, NGFR, ACRP30, AGRP, ANGPT2, LEP, NT4, HGF, PRL, SCFR, FAS LG, IGFBP 1, or IGFBP 2.
En una variación, los al menos dos biomarcadores se seleccionan de un panel de biomarcadores que comprende TIE-1, TIE-2, TIMP-4, FGF1, LIF, TGFBR2, CSF1, TGFa, TGFp1, IL17D, SDF2, TGFBRAP1, FGF11, TNFSF13B, FGF14, IL1 p, IL-11, IL-32, IL-6, IL1RN, IL-20RB, IL-21R, PLAU, GNB2L1, PLEKHA6, CTSB, FERMT1, CRMP1, VEGFB, VEGFA, y PLEKHA1.In one variation, the at least two biomarkers are selected from a biomarker panel comprising TIE-1, TIE-2, TIMP-4, FGF1, LIF, TGFBR2, CSF1, TGFa, TGFp1, IL17D, SDF2, TGFBRAP1, FGF11, TNFSF13B, FGF14, IL1 p, IL-11, IL-32, IL-6, IL1RN, IL-20RB, IL-21R, PLAU, GNB2L1, PLEKHA6, CTSB, FERMT1, CRMP1, VEGFB, VEGFA, and PLEKHA1.
En una variación, el método comprende medir los niveles de expresión de al menos 2, al menos 3, al menos 4, al menos 5, al menos 6, al menos 7, al menos 8, al menos 9, al menos 10, al menos 11, al menos 12, al menos 13, al menos 14, al menos 15, al menos 16, al menos 17, al menos 18, al menos 19, o incluso al menos 20 biomarcadores seleccionados de TIE-1, TIE-2, TIMP-4, FGF1, LIF, TGFBR2, CSF1, TGFa, TGFp1, IL17D, SDF2, TGFBRAP1, FGF11, TNFSF13B, FGF14, IL1 p, IL-11, IL-32, IL-6, IL1RN, IL-20RB, IL-21R, PLAU, GNB2L1, PLEKHA6, CTSB, FERMT1, CRMP1, VEGFB, VEGFA, y PLEKHA1.In a variation, the method comprises measuring the expression levels of at least 2, at least 3, at least 4, at least 5, at least 6, at least 7, at least 8, at least 9, at least 10, at at least 11, at least 12, at least 13, at least 14, at least 15, at least 16, at least 17, at least 18, at least 19, or even at least 20 selected biomarkers of TIE-1, TIE-2 , TIMP-4, FGF1, LIF, TGFBR2, CSF1, TGFa, TGFp1, IL17D, SDF2, TGFBRAP1, FGF11, TNFSF13B, FGF14, IL1 p, IL-11, IL-32, IL-6, IL1RN, IL-20RB, IL-21R, PLAU, GNB2L1, PLEKHA6, CTSB, FERMT1, CRMP1, VEGFB, VEGFA, and PLEKHA1.
En una variación, se miden los niveles de TIE-1, TIE-2, TIMP-4, FGF1, LIF, TGFBR2, CSF1, TGFa, TGFp1, IL17D, SDF2, TGFBRAP1, FGF11, TNFSF13B, FGF14, IL1 p, IL-11, IL-32, IL-6, IL1RN, IL-20RB, IL-21R, PLAU, GNB2L1, PLEKHA6, CTSB, FERMT1, CRMP1, VEGFB, VEGFA, y PLEKHA1.In one variation, the levels of TIE-1, TIE-2, TIMP-4, FGF1, LIF, TGFBR2, CSF1, TGFa, TGFp1, IL17D, SDF2, TGFBRAP1, FGF11, TNFSF13B, FGF14, IL1 p, IL- 11, IL-32, IL-6, IL1RN, IL-20RB, IL-21R, PLAU, GNB2L1, PLEKHA6, CTSB, FERMT1, CRMP1, VEGFB, VEGFA, and PLEKHA1.
En una variación, el método comprende medir los niveles de expresión de al menos 2, al menos 3, al menos 4, al menos 5, al menos 6, al menos 7, o incluso al menos 8 biomarcadores seleccionados de VEGFA, PLEKHA1, VEGFB, CRMP1, FERMT1, CTSB, PLEKHA6, GNB2L1, y TGFp1.In a variation, the method comprises measuring the expression levels of at least 2, at least 3, at least 4, at least 5, at least 6, at least 7, or even at least 8 biomarkers selected from VEGFA, PLEKHA1, VEGFB , CRMP1, FERMT1, CTSB, PLEKHA6, GNB2L1, and TGFp1.
En una variación, el método comprende medir los niveles de expresión de VEGFA, PLEKHA1, VEGFB, CRMP1, FERMT1, CTSB, PLEKHA6, GNB2L1, y TGFp1.In one variation, the method comprises measuring the expression levels of VEGFA, PLEKHA1, VEGFB, CRMP1, FERMT1, CTSB, PLEKHA6, GNB2L1, and TGFp1.
En algunas variaciones, el método comprende además medir el nivel de SIVA1. SIVA1 es uno de los pocos biomarcadores observados que disminuyen en las SEN-MSC, cuando se exponen a IL-2.In some variations, the method further comprises measuring the level of SIVA1. SIVA1 is one of the few biomarkers observed to be decreased in SEN-MSCs, when exposed to IL-2.
En algunas variaciones, se mide la expresión de al menos dos biomarcadores seleccionados de un panel de biomarcadores que comprende TIE-1, TIE-2, TIMP-4, FGF1, LIF, TGFBR2, CSF1, TGFa, TGFp1, IL17D, SDF2, TGFBRAP1, FGF11, TNFSF13B, FGF14, IL1 p, IL-11, IL-32, IL-6, IL1RN, IL-20RB, IL-21R, PLAU, GNB2L1, PLEKHA6, CTSB, FERMT1, c Rm P1, VEGFB, VEGFA, y PLEKHA1, y se mide el nivel de expresión de SIVA1. Si se determina que el nivel de expresión de los al menos dos biomarcadores aumenta, con respecto a los niveles de referencia, y el nivel de expresión de SIVA1 disminuye, con respecto a los niveles de referencia, entonces se determina que (1) el individuo tiene una mayor probabilidad de experimentar eventos adversos asociados con la terapia basada en IL-2, o (2) la población de las MSC no es adecuada para uso en trasplantes.In some variations, the expression of at least two biomarkers selected from a biomarker panel comprising TIE-1, TIE-2, TIMP-4, FGF1, LIF, TGFBR2, CSF1, TGFa, TGFp1, IL17D, SDF2, TGFBRAP1 is measured. , FGF11, TNFSF13B, FGF14, IL1 p, IL-11, IL-32, IL-6, IL1RN, IL-20RB, IL-21R, PLAU, GNB2L1, PLEKHA6, CTSB, FERMT1, c Rm P1, VEGFB, VEGFA, and PLEKHA1, and the expression level of SIVA1 is measured. If the expression level of the at least two biomarkers is determined to be increased, relative to baseline levels, and the expression level of SIVA1 is decreased, relative to baseline levels, then it is determined that (1) the individual have a higher probability of experiencing adverse events associated with IL-2-based therapy, or (2) the MSC population is not suitable for use in transplantation.
En algunas variaciones, se mide la expresión de al menos dos biomarcadores seleccionados de un panel de biomarcadores que comprende TIE-1, TIE-2, TIMP-4, FGF1, LIF, TGFBR2, CSF1, TGFa, TGFp1, IL17D, SDF2, TGFBRAP1, FGF11, TNFSF13B, FGF14, IL1 p, IL-11, IL-32, IL-6, IL1RN, IL-20RB, IL-21R, PLAU, GNB2L1, PLEKHA6, CTSB, FERMT1, c Rm P1, VEGFB, VEGFA, y PLEKHA1, y se mide el nivel de expresión de SIVA1. Si se determina que el nivel de expresión de los al menos dos biomarcadores disminuye, o no presenta cambios, con respecto a los niveles de referencia, y el nivel de expresión de SIVA1 aumenta, con respecto a los niveles de referencia, entonces se determina que (1) el individuo tiene una mayor probabilidad de experimentar eventos adversos asociados con la terapia basada en IL-2, o (2) la población de las MSC no es adecuada para uso en trasplantes.In some variations, the expression of at least two biomarkers selected from a biomarker panel comprising TIE-1, TIE-2, TIMP-4, FGF1, LIF, TGFBR2, CSF1, TGFa, TGFp1, IL17D, SDF2, TGFBRAP1 is measured. , FGF11, TNFSF13B, FGF14, IL1 p, IL-11, IL-32, IL-6, IL1RN, IL-20RB, IL-21R, PLAU, GNB2L1, PLEKHA6, CTSB, FERMT1, c Rm P1, VEGFB, VEGFA, and PLEKHA1, and the expression level of SIVA1 is measured. If the expression level of the at least two biomarkers is determined to be decreased, or unchanged, from baseline levels, and the expression level of SIVA1 is increased, from baseline levels, then it is determined that (1) the individual is more likely to experience adverse events associated with IL-2-based therapy, or (2) the MSC population is not suitable for use in transplantation.
En algunas variaciones, se mide la expresión de al menos dos biomarcadores seleccionados de un panel de biomarcadores que comprende VEGFA, PLEKHA1, VEGFB, CRMP1, FERMT1, CTSB, PLEKHA6, GNB2L1, y TGFp1, y se mide el nivel de expresión de SIVA1. Si se determina que el nivel de expresión de los al menos dos biomarcadores aumenta, con respecto a los niveles de referencia, y el nivel de expresión de SIVA1 disminuye, con respecto a los niveles de referencia, entonces se determina que (1) el individuo tiene una mayor probabilidad de experimentar eventos adversos asociados con la terapia basada en IL-2, o (2) la población de las MSC no es adecuada para uso en trasplantes.In some variations, the expression of at least two biomarkers selected from a panel of biomarkers comprising VEGFA, PLEKHA1, VEGFB, CRMP1, FERMT1, CTSB, PLEKHA6, GNB2L1, and TGFp1 is measured, and the expression level of SIVA1 is measured. If the expression level of the at least two biomarkers is determined to be increased, relative to baseline levels, and the expression level of SIVA1 is decreased, relative to baseline levels, then it is determined that (1) the individual have a higher probability of experiencing adverse events associated with IL-2-based therapy, or (2) the MSC population is not suitable for use in transplantation.
En algunas variaciones, se mide la expresión de al menos dos biomarcadores seleccionados de un panel de biomarcadores que comprende TIE-1, TIE-2, TIMP-4, VEGFA, PLEKHA1, VEGFB, CRMP1, FERMT1, CTSB, PLEKHA6, GNB2L1, y TGFp1, y se mide el nivel de expresión de SIVA1. Si se determina que el nivel de expresión de los al menos dos biomarcadores disminuye, o no presenta cambios, con respecto a los niveles de referencia, y el nivel de expresión de SIVA1 aumenta, con respecto a los niveles de referencia, entonces se determina que (1) el individuo tiene una mayor probabilidad de experimentar eventos adversos asociados con la terapia basada en IL-2, o (2) la población de las MSC no es adecuada para uso en trasplantes.In some variations, the expression of at least two biomarkers selected from a panel of biomarkers comprising TIE-1, TIE-2, TIMP-4, VEGFA, PLEKHA1, VEGFB, CRMP1, FERMT1, CTSB, PLEKHA6, GNB2L1, and TGFp1, and the expression level of SIVA1 is measured. If the expression level of the at least two biomarkers is determined to be decreased, or unchanged, from baseline levels, and the level SIVA1 expression increases, relative to baseline levels, then it is determined that (1) the individual has a higher likelihood of experiencing adverse events associated with IL-2-based therapy, or (2) the population of MSCs it is not suitable for use in transplants.
En una variación particular de la descripción, el nivel de expresión de ARN del biomarcador TGFP1 disminuye aproximadamente 0,25 veces en la muestra tras el tratamiento con IL-2, en comparación con un nivel de referencia (muestra no tratada con IL-2). El número de veces puede ser un valor de número de veces bruto o un valor GFOLD. In a particular variation of the description, the level of RNA expression of the biomarker TGFP1 decreases approximately 0.25-fold in the sample after IL-2 treatment, compared to a reference level (sample not treated with IL-2) . The number of times can be a raw number of times value or a GFOLD value.
En una variación particular de la descripción, el nivel de expresión de ARN del biomarcador SIVA1 disminuye en alrededor de al menos 0,2 veces en la muestra tras el tratamiento con IL-2, en comparación con un nivel de referencia (muestra no tratada con IL-2). El número de veces puede ser un valor de número de veces bruto o un valor GFOLD. In a particular variation of the description, the level of RNA expression of the biomarker SIVA1 decreases by about at least 0.2-fold in the sample after treatment with IL-2, compared to a reference level (sample not treated with IL-2). IL-2). The number of times can be a raw number of times value or a GFOLD value.
En una variación particular de la descripción, el nivel de expresión de ARN del biomarcador CRMP1 aumenta en alrededor de al menos 0,22 veces en la muestra tras el tratamiento con IL-2, en comparación con un nivel de referencia (muestra no tratada con IL-2). El número de veces puede ser un valor de número de veces bruto o un valor GFOLD. In a particular variation of the description, the level of RNA expression of the CRMP1 biomarker is increased by about at least 0.22-fold in the sample after IL-2 treatment, compared to a reference level (sample not treated with IL-2). IL-2). The number of times can be a raw number of times value or a GFOLD value.
En una variación particular de la descripción, el nivel de expresión de ARN del biomarcador VEGFB aumenta en alrededor de al menos 0,19 veces en la muestra tras el tratamiento con IL-2, en comparación con un nivel de referencia (muestra no tratada con IL-2). El número de veces puede ser un valor de número de veces bruto o un valor GFOLD. In a particular variation of the description, the level of RNA expression of the VEGFB biomarker is increased by about at least 0.19-fold in the sample after IL-2 treatment, compared to a reference level (sample not treated with IL-2). IL-2). The number of times can be a raw number of times value or a GFOLD value.
En una variación particular de la descripción, el nivel de expresión de ARN del biomarcador VEGFA aumenta en alrededor de al menos 1,5 veces o alrededor de 1,78 veces en la muestra tras el tratamiento con IL-2, en comparación con un nivel de referencia (muestra no tratada con IL-2). El número de veces puede ser un valor de número de veces bruto o un valor GFOLD.In a particular variation of the description, the level of RNA expression of the biomarker VEGFA is increased by about at least 1.5-fold or about 1.78-fold in the sample after IL-2 treatment, compared to a level control (sample not treated with IL-2). The number of times can be a raw number of times value or a GFOLD value.
En una variación particular de la descripción, el nivel de expresión de ARN del biomarcador PLEKHA1 aumenta en alrededor de al menos 0,46 veces en la muestra tras el tratamiento con IL-2, en comparación con un nivel de referencia (muestra no tratada con IL-2). El número de veces puede ser un valor de número de veces bruto o un valor GFOLD. In a particular variation of the description, the level of RNA expression of the biomarker PLEKHA1 is increased by about at least 0.46-fold in the sample after IL-2 treatment, compared to a reference level (sample not treated with IL-2). IL-2). The number of times can be a raw number of times value or a GFOLD value.
En una variación particular de la descripción, el nivel de expresión de ARN del biomarcador CTSB aumenta en alrededor de al menos 0,25 veces en la muestra tras el tratamiento con IL-2, en comparación con un nivel de referencia (muestra no tratada con IL-2). El número de veces puede ser un valor de número de veces bruto o un valor GFOLD. In a particular variation of the description, the level of RNA expression of the CTSB biomarker is increased by about at least 0.25-fold in the sample after IL-2 treatment, compared to a reference level (sample not treated with IL-2). IL-2). The number of times can be a raw number of times value or a GFOLD value.
En una variación particular de la descripción, el nivel de expresión de ARN de TGFP1 disminuye en alrededor de -0,25 GFOLD, y SIVA1 disminuye en alrededor de -0,2 GFo Ld con el tratamiento con IL-2, y los niveles de CRMP1 aumentan en alrededor de 0,22 GFOLD, VEGFB aumenta en alrededor de 0,19 GFOLD, VEGFA aumenta en alrededor de 1,78 GFOLD, PLEKHA1 aumenta en alrededor de 0,459 GFOLD, CTSB aumenta en alrededor de 0,25 GFOLD, en las mismas condiciones.In a particular variation of the description, the RNA expression level of TGFP1 is decreased by about -0.25 GFOLD, and SIVA1 is decreased by about -0.2 GFo Ld with IL-2 treatment, and the levels of CRMP1 increases by about 0.22 GFOLD, VEGFB increases by about 0.19 GFOLD, VEGFA increases by about 1.78 GFOLD, PLEKHA1 increases by about 0.459 GFOLD, CTSB increases by about 0.25 GFOLD, in the same conditions.
En una variación particular de la descripción, el nivel de expresión de proteína del biomarcador TIE-1 aumenta en alrededor de al menos 2 veces, al menos 3 veces, o alrededor de 3,73 veces en la muestra tras el tratamiento con IL-2, en comparación con un nivel de referencia (muestra no tratada con IL-2).In a particular variation of the description, the protein expression level of the TIE-1 biomarker is increased by about at least 2-fold, at least 3-fold, or about 3.73-fold in the sample after IL-2 treatment. , compared to a reference level (sample not treated with IL-2).
En una variación particular de la descripción, el nivel de expresión de proteína del biomarcador TIE-2 aumenta en alrededor de al menos 2 veces, al menos 3 veces, al menos 4 veces, al menos 5 veces, o alrededor de 5,24 veces en la muestra tras el tratamiento con IL-2, en comparación con un nivel de referencia (muestra no tratada con IL-2). In a particular variation of the description, the protein expression level of the TIE-2 biomarker is increased by about at least 2-fold, at least 3-fold, at least 4-fold, at least 5-fold, or about 5.24-fold. in the sample after IL-2 treatment, compared to a reference level (sample not treated with IL-2).
En una variación particular de la descripción, el nivel de expresión de proteína del biomarcador TIMP-4 aumenta en alrededor de al menos 2 veces, al menos 3 veces, al menos 4 veces, o alrededor de 4,31 veces en la muestra tras el tratamiento con IL-2, en comparación con un nivel de referencia (muestra no tratada con IL-2).In a particular variation of the description, the protein expression level of the TIMP-4 biomarker is increased by about at least 2-fold, at least 3-fold, at least 4-fold, or about 4.31-fold in the sample after IL-2 treatment, compared to a reference level (sample not treated with IL-2).
En una variación particular de la descripción, el nivel de expresión de proteína del biomarcador IL-11 aumenta en alrededor de al menos 1,1 veces, al menos 1,2 veces, al menos 1,3 veces, al menos 1,4, o alrededor de 1,42 veces en la muestra tras el tratamiento con IL-2, en comparación con un nivel de referencia (muestra no tratada con IL-2). In a particular variation of the description, the protein expression level of the IL-11 biomarker is increased by about at least 1.1-fold, at least 1.2-fold, at least 1.3-fold, at least 1.4-fold, or about 1.42-fold in the sample after IL-2 treatment, compared to a reference level (sample not treated with IL-2).
En una variación particular de la descripción, el nivel de expresión de proteína del biomarcador IL1 b aumenta en alrededor de al menos 1,1 veces, o alrededor de 1,14 veces en la muestra tras el tratamiento con IL-2, en comparación con un nivel de referencia (muestra no tratada con IL-2).In a particular variation of the description, the protein expression level of the IL1 b biomarker is increased by about at least 1.1-fold, or about 1.14-fold in the sample after IL-2 treatment, compared to a reference level (sample not treated with IL-2).
En una variación particular de la descripción, el nivel de expresión de proteína del biomarcador TGFa aumenta en alrededor de al menos 1,5 veces, al menos 2 veces, o alrededor de 2,4 veces en la muestra tras el tratamiento con IL-2, en comparación con un nivel de referencia (muestra no tratada con IL-2).In a particular variation of the description, the protein expression level of the TGFa biomarker is increased by about at least 1.5-fold, at least 2-fold, or about 2.4-fold in the sample after IL-2 treatment. , compared to a reference level (sample not treated with IL-2).
En una variación particular de la descripción, el nivel de expresión de proteína del biomarcador TGFP1 aumenta en alrededor de al menos 1,1 veces, al menos 1,2 veces, al menos 1,3 veces, al menos 1,4 veces, o alrededor de 1,44 veces en la muestra tras el tratamiento con IL-2, en comparación con un nivel de referencia (muestra no tratada con IL-2). In a particular variation of the description, the protein expression level of the TGFP1 biomarker is increased by about at least 1.1-fold, at least 1.2-fold, at least 1.3-fold, at least 1.4-fold, or about 1.44-fold in the sample after IL-2 treatment, compared to a reference level (sample not treated with IL-2).
En una variación particular de la descripción, en una muestra, el nivel de expresión de proteína del biomarcador TIE-1 aumenta en alrededor de 3,73 veces, el nivel de expresión de proteína de TIE-2 aumenta en alrededor de 5,24 veces, el nivel de expresión de proteína de TIMP-4 aumenta en alrededor de 4,31 veces, el nivel de expresión de proteína de IL-11 aumenta en alrededor de 1,42 veces, el nivel de expresión de proteína de IL1 b aumenta en alrededor de 1,14 veces, el nivel de expresión de proteína de TGFa aumenta en alrededor de 2,4 veces, TGFP1 aumenta en alrededor de 1,44 veces, en comparación con los niveles de referencia.In a particular variation of the description, in one sample, the protein expression level of the biomarker TIE-1 increases by about 3.73-fold, the protein expression level of TIE-2 increases by about 5.24-fold , the protein expression level of TIMP-4 increases by about 4.31-fold, the protein expression level of IL-11 increases by about 1.42-fold, the protein expression level of IL1 b increases by about 1.14-fold, the protein expression level of TGFa increases by about 2.4-fold, TGFP1 increases by about 1.44-fold, compared to reference levels.
5. Métodos complementarios para la terapia de IL-25. Complementary methods for IL-2 therapy
Como se contempla aquí, la administración de IL-2 influye en las propiedades secretoras de las MSC, y el tratamiento con IL-2 puede conducir a posibles resultados adversos en ciertos individuos. Se describen aquí kits de diagnóstico, ensayos y métodos que se pueden usar para determinar si un individuo elegible para recibir una terapia basada en IL-2 puede experimentar un evento adverso asociado con la terapia basada en IL-2, en base a la caracterización de la producción de ciertos biomarcadores (como se describe anteriormente). También se describen aquí métodos para tratar a un paciente con IL-2.As contemplated herein, administration of IL-2 influences the secretory properties of MSCs, and treatment with IL-2 may lead to possible adverse outcomes in certain individuals. Described herein are diagnostic kits, assays, and methods that can be used to determine whether an individual eligible to receive IL-2-based therapy may experience an adverse event associated with IL-2-based therapy, based on characterization of the production of certain biomarkers (as described above). Methods of treating a patient with IL-2 are also described herein.
Como se usa aquí, los eventos adversos potenciales asociados con una terapia basada en IL-2 están asociados con la senescencia celular, e incluyen eventos tales como angiogénesis, tumorigénesis, desarrollo vascular, crecimiento invasivo, metástasis, motilidad celular, migración, y similares. La invención permite la determinación de si un individuo puede experimentar, experimentará, o es probable que experimente un evento adverso asociado con una terapia basada en IL-2. En una variación, la descripción permite la determinación de una mayor probabilidad de experimentar un evento adverso en alrededor de 10%, 20%, 30%, 40%, 50%, 60%, 70%, 80%, 90%, o incluso alrededor de 100% As used herein, potential adverse events associated with IL-2-based therapy are associated with cellular senescence, and include such events as angiogenesis, tumorigenesis, vascular development, invasive growth, metastasis, cell motility, migration, and the like. The invention allows for the determination of whether an individual may experience, will experience, or is likely to experience an adverse event associated with IL-2-based therapy. In one variation, the description allows the determination of a higher probability of experiencing an adverse event by about 10%, 20%, 30%, 40%, 50%, 60%, 70%, 80%, 90%, or even about 100%
En una variación, el individuo ha recibido al menos una dosis de una terapia basada en IL-2 antes de que se lleve a cabo el método en una muestra del individuo. En esta variación, el método para determinar si un individuo elegible para recibir una terapia basada en IL-2 puede experimentar un evento adverso asociado con la terapia basada en IL-2 comprende: medir los niveles de expresión de al menos dos biomarcadores seleccionados de un panel de biomarcadores indicativos de senescencia de MSC descritos aquí (el panel de biomarcadores son antiapoptóticos, angiogénicos, tumorigénicos, conducen al desarrollo vascular, son responsables del crecimiento invasivo, metástasis, motilidad celular, migración, y similares) en una muestra del individuo, en el que el individuo ha recibido al menos una dosis de una terapia basada en IL-2; y comparar los niveles de los biomarcadores con los niveles de referencia, en el que un aumento en los niveles por encima de los niveles de referencia indica que el individuo puede experimentar un evento adverso asociado con la terapia basada en IL-2, y en el que una disminución o ningún cambio en los niveles en comparación con los niveles de referencia indica que es posible que el individuo no experimente un evento adverso asociado con la terapia basada en IL-2.In one variation, the individual has received at least one dose of an IL-2-based therapy before the method is performed on a sample of the individual. In this variation, the method of determining whether an individual eligible to receive IL-2-based therapy may experience an IL-2-based therapy-associated adverse event comprises: measuring the expression levels of at least two selected biomarkers of a panel of biomarkers indicative of MSC senescence described here (the panel of biomarkers are antiapoptotic, angiogenic, tumorigenic, lead to vascular development, are responsible for invasive growth, metastasis, cell motility, migration, and the like) in a sample from the individual, in that the individual has received at least one dose of an IL-2-based therapy; and comparing the levels of the biomarkers with the reference levels, in which an increase in the levels above the reference levels indicates that the individual may experience an adverse event associated with the IL-2-based therapy, and in the that a decrease or no change in levels compared to baseline levels indicates that the individual may not experience an adverse event associated with IL-2-based therapy.
En otra variación, se obtiene una muestra del individuo y se expone a (incubada con, combinada con, etc.) IL-2 in vitro. En esta variación, el método para determinar si un individuo elegible para recibir una terapia basada en IL-2 puede experimentar un evento adverso asociado con la terapia basada en IL-2 comprende: medir los niveles de expresión de al menos dos biomarcadores seleccionados de un panel de biomarcadores indicativos de senescencia de MSC en una muestra del individuo, en el que el individuo ha recibido al menos una dosis de una terapia basada en IL-2; y comparar los niveles de los biomarcadores con los niveles de referencia, en el que un aumento en los niveles por encima de los niveles de referencia indica que el individuo puede experimentar un evento adverso asociado con la terapia basada en IL-2, y en el que una disminución o ningún cambio en los niveles en comparación con los niveles de referencia indica que es posible que el individuo no experimente un evento adverso asociado con la terapia basada en IL-2.In another variation, a sample is obtained from the individual and exposed to (incubated with, combined with, etc.) IL-2 in vitro. In this variation, the method of determining whether an individual eligible to receive IL-2-based therapy may experience an IL-2-based therapy-associated adverse event comprises: measuring the expression levels of at least two selected biomarkers of a panel of biomarkers indicative of MSC senescence in a sample from the individual, wherein the individual has received at least one dose of an IL-2-based therapy; and comparing the levels of the biomarkers with the reference levels, in which an increase in the levels above the reference levels indicates that the individual may experience an adverse event associated with the IL-2-based therapy, and in the that a decrease or no change in levels compared to baseline levels indicates that the individual may not experience an adverse event associated with IL-2-based therapy.
En otra variación, el método está dirigido a tratar a un individuo para cáncer con una terapia basada en IL-2, comprendiendo el método administrar una cantidad eficaz de la terapia basada en IL-2 al individuo cuando los niveles de expresión de al menos dos biomarcadores aumentan en comparación con los niveles de referencia en una muestra del individuo, en el que (1) el individuo ha recibido al menos una dosis de una terapia basada en IL-2 o (2) la muestra se combina con IL-2 in vitro, y en el que el panel de biomarcadores comprende biomarcadores de senescencia celular. In another variation, the method is directed to treating an individual for cancer with an IL-2 based therapy, the method comprising administering an effective amount of the IL-2 based therapy to the individual when expression levels of at least two biomarkers are increased compared to baseline levels in a sample from the individual, in which (1) the individual has received at least one dose of an IL-2-based therapy or (2) the sample is combined with IL-2 in vitro, and wherein the panel of biomarkers comprises biomarkers of cellular senescence.
Los biomarcadores, si están presentes en niveles elevados, son indicativos de la presencia de las MSC SEN, e indican la probabilidad de que un tratamiento adicional con IL-2 pueda provocar efectos adversos, tales como la promoción de la tumorigénesis, la invasión, o la metástasis en el individuo. En base a esto, se puede determinar que el individuo no debe recibir una terapia basada en IL-2. Alternativamente, si al practicar estos métodos se determina que el uso de una terapia basada en IL-2 probablemente no produciría efectos adversos (por ejemplo, es probable que no promueva la tumorigénesis, la invasión, o la metástasis), en base a la expresión de un determinado conjunto de biomarcadores, entonces podría determinarse que es aceptable administrar una terapia basada en IL-2, y opcionalmente se administraría la terapia basada en IL-2.The biomarkers, if present at high levels, are indicative of the presence of MSC SEN, and indicate the likelihood that additional IL-2 treatment may cause adverse effects, such as promotion of tumorigenesis, invasion, or metastasis in the individual. Based on this, it can be determined that the individual should not receive IL-2 based therapy. Alternatively, if by practicing these methods it is determined that the use of an IL-2-based therapy would not likely produce adverse effects (for example, would not likely promote tumorigenesis, invasion, or metastasis), based on the expression of a certain set of biomarkers, then it could be determined that it is acceptable to administer an IL-2-based therapy, and optionally the IL-2-based therapy would be administered.
Como se usa aquí, una “terapia basada en IL-2” es aquella que implica la administración de IL-2 sola, o IL-2 en combinación con otro agente. La administración de IL-2 contempla la administración de una porción activa de IL-2, sola o fusionada con otros motivos. Una terapia basada en IL-2 puede administrarse mediante cualquier forma de inyección, incluyendo inyección intravenosa (IV), intramuscular (IM), o transdérmica o subcutánea (SC); por vía oral o nasal; o por administración tópica (crema, gotitas, etc.). En una variación particular de la descripción, la IL-2 se usa como una formulación de liberación sostenida, o una formulación que se administra usando un dispositivo de liberación sostenida. Dichos dispositivos son bien conocidos en la técnica, e incluyen, por ejemplo, parches transdérmicos y bombas implantables en miniatura que pueden proporcionar la administración de fármacos a lo largo del tiempo de manera continua y constante en una variedad de dosis para lograr un efecto de liberación sostenida. También se pueden contemplar formulaciones sublinguales o de colirios.As used herein, an "IL-2-based therapy" is one that involves the administration of IL-2 alone, or IL-2 in combination with another agent. Administration of IL-2 contemplates the administration of an active portion of IL-2, alone or fused with other motifs. An IL-2-based therapy can be administered by any form of injection, including intravenous (IV), intramuscular (IM), or transdermal or subcutaneous (SC) injection; orally or nasally; or by topical administration (cream, droplets, etc.). In a particular variation of the description, IL-2 is used as a sustained release formulation, or a formulation that is administered using a sustained release device. Such devices are well known in the art, and include, for example, transdermal patches and miniature implantable pumps that can provide continuous and consistent delivery of drugs over time in a variety of dosages to achieve a sustained release effect. sustained. Sublingual or eye drop formulations may also be contemplated.
Como se proporciona aquí, la muestra usada para el análisis de expresión puede ser cualquier muestra, incluyendo, pero sin limitarse a, un tejido, biopsia, sangre, plasma, suero, orina, saliva, LCR, heces, linfa, semen, y sudor. En variaciones particulares, la muestra es una muestra de sangre, plasma, o suero; en una variación ejemplar, la muestra es sangre. Sin estar ligado a ninguna teoría, debido a que las MSC están situadas en compartimentos perivasculares, los factores producidos por las MSC en respuesta a la administración de IL-2 pueden ser sistémicos/circulatorios, y podrían medirse fácilmente en una muestra de sangre.As provided herein, the sample used for expression analysis can be any sample, including, but not limited to, tissue, biopsy, blood, plasma, serum, urine, saliva, CSF, feces, lymph, semen, and sweat. . In particular variations, the sample is a blood, plasma, or serum sample; in an exemplary variation, the sample is blood. Without being bound by theory, because MSCs are located in perivascular compartments, factors produced by MSCs in response to IL-2 administration may be systemic/circulatory, and could be readily measured in a blood sample.
En las variaciones proporcionadas aquí, los niveles de expresión de la muestra se pueden medir en cualquier momento después de la administración de la terapia basada en IL-2 al individuo, o en cualquier momento después de mezclar in vitro IL-2 (mezcla de una porción activa de IL-2, sola o fusionada con otros motivos, con la muestra), por ejemplo 15 minutos, 30 minutos, 1 hora, 2, 3, 4, 6, 12, 15, 24, 36, 48, 72, o incluso 96 horas después.In the variations provided here, sample expression levels can be measured at any time after administration of IL-2-based therapy to the individual, or at any time after IL-2 mixing in vitro (mixing of a active portion of IL-2, alone or fused with other motifs, with the sample), for example 15 minutes, 30 minutes, 1 hour, 2, 3, 4, 6, 12, 15, 24, 36, 48, 72, or even 96 hours later.
En algunas variaciones, a un individuo se le administran múltiples dosis de la terapia basada en IL-2 antes de la medida. En algunas variaciones, al individuo se le administra una dosis única de la terapia basada en IL-2 antes de la medida. Normalmente, la dosis de IL-2 depende de la selección específica del producto de IL-2. Se pueden administrar aproximadamente 0,001 a 0,1 mg/kg de peso corporal del paciente; en algunas variaciones, se pueden administrar alrededor de 0,005, 0,01, 0,05 mg/kg. En algunas variaciones, se administran 600.000 UI/kg (las UI pueden determinarse mediante un bioensayo de proliferación de linfocitos, y se expresan en Unidades Internacionales (UI) según lo establecido por el primer estándar internacional de la Organización Mundial de la Salud para la IL-2 humana. En algunas variaciones, la dosis de IL-2 oscila de 0,01 MUI/día a 3,0 MUI/día/paciente (MUI son millones de unidades internacionales). Las terapias basadas en IL-2 se pueden administrar una o más veces por día a una o más veces por semana, incluyendo una vez cada dos días. El experto apreciará que ciertos factores pueden influir en la dosis y el tiempo requerido para tratar eficazmente a un sujeto, incluyendo, pero sin limitarse a, la gravedad de la enfermedad o trastorno, los tratamientos previos, la salud general y/o la edad del sujeto, y otras enfermedades presentes. Además, el tratamiento de un sujeto con una cantidad terapéuticamente eficaz de IL-2 puede incluir un solo tratamiento, o puede incluir una serie de tratamientos. En una variación, las composiciones se administran cada 8 horas durante cinco días, seguido de un período de descanso de 2 a 14 días, por ejemplo 9 días, seguido de cinco días adicionales de administración cada 8 horas.In some variations, an individual is administered multiple doses of IL-2-based therapy prior to measurement. In some variations, the individual is administered a single dose of IL-2-based therapy prior to measurement. Normally, the dose of IL-2 depends on the specific selection of the IL-2 product. About 0.001 to 0.1 mg/kg of patient body weight can be administered; in some variations around 0.005, 0.01, 0.05 mg/kg can be given. In some variations, 600,000 IU/kg are administered (IU can be determined by lymphocyte proliferation bioassay, and are expressed in International Units (IU) as established by the World Health Organization's first international standard for IL -2 Human In some variations, the dose of IL-2 ranges from 0.01 MIU/day to 3.0 MIU/day/patient (MIU is millions of international units). one or more times per day to one or more times per week, including once every other day.The skilled person will appreciate that certain factors may influence the dose and time required to effectively treat a subject, including, but not limited to, the severity of the disease or disorder, prior treatments, the general health and/or age of the subject, and other presenting diseases.In addition, treatment of a subject with a therapeutically effective amount of IL-2 may include a single treatment, or p It can include a series of treatments. In one variation, the compositions are administered every 8 hours for five days, followed by a rest period of 2 to 14 days, eg, 9 days, followed by an additional five days of administration every 8 hours.
Los métodos complementarios para el tratamiento con IL-2 proporcionados aquí pueden ser particularmente adecuados como método complementario para el cáncer, dado el uso generalizado de agentes terapéuticos basados en IL-2 para el tratamiento del cáncer. Sin embargo, los métodos descritos no se limitan a la terapia del cáncer, y son aplicables a cualquier enfermedad para la que una IL-2 sea un tratamiento aprobado o candidato. Sin embargo, en algunas variaciones, el individuo ha recibido la terapia basada en IL-2 para el tratamiento de un cáncer. En algunas variaciones, el cáncer se selecciona de entre carcinoma de células renales, melanoma, cáncer de mama, cáncer de páncreas, cáncer de ovario, cáncer de colon, cáncer de pulmón, cáncer de pulmón no microcítico, carcinoma in situ (ISC), carcinoma de células escamosas (SCC), cáncer de tiroides, cáncer de cuello uterino, cáncer de útero, cáncer de próstata, cáncer de testículo, cáncer de cerebro, cáncer de vejiga, cáncer de estómago, hepatoma, melanoma, glioma, retinoblastoma, mesotelioma, mieloma, linfoma, y leucemia. En algunos ejemplos, el cáncer es un cáncer en etapa tardía, un cáncer metastático, o un cáncer recidivante. En otras variaciones, el tratamiento con IL-2 es para cualquier afección asociada o causada por una respuesta inmunitaria indeseable, por ejemplo para enfermedades inflamatorias, relacionadas con el sistema inmunitario, o autoinmunes, incluyendo, pero sin limitación, vasculitis relacionada con VHC, uveítis, miositis, diabetes tipo I, lupus eritematoso sistémico, vasculitis sistémica, psoriasis, alergia, asma, enfermedad de Crohn, esclerosis múltiple, artritis reumatoide, aterosclerosis, enfermedad tiroidea autoinmune, enfermedades neurodegenerativas, enfermedad de Alzheimer, enfermedad de injerto frente a hospedante, aborto espontáneo, y rechazo de aloinjertos.The complementary methods for IL-2 treatment provided herein may be particularly suitable as a complementary method for cancer, given the widespread use of IL-2-based therapeutics for the treatment of cancer. However, the methods described are not limited to cancer therapy, and are applicable to any disease for which IL-2 is an approved or candidate treatment. However, in some variations, the individual has received IL-2-based therapy for the treatment of a cancer. In some variations, the cancer is selected from renal cell carcinoma, melanoma, breast cancer, pancreatic cancer, ovarian cancer, colon cancer, lung cancer, non-small cell lung cancer, carcinoma in situ (ISC), squamous cell carcinoma (SCC), thyroid cancer, cervical cancer, uterine cancer, prostate cancer, testicular cancer, brain cancer, bladder cancer, stomach cancer, hepatoma, melanoma, glioma, retinoblastoma, mesothelioma , myeloma, lymphoma, and leukemia. In some examples, the cancer is a late stage cancer, a metastatic cancer, or a recurrent cancer. In other variations, IL-2 treatment is for any condition associated with or caused by an undesirable immune response, for example for inflammatory, immune-related, or autoimmune diseases, including, but not limited to, HCV-related vasculitis, uveitis , myositis, type I diabetes, systemic lupus erythematosus, systemic vasculitis, psoriasis, allergy, asthma, Crohn's disease, multiple sclerosis, rheumatoid arthritis, atherosclerosis, autoimmune thyroid disease, neurodegenerative diseases, Alzheimer's disease, graft versus host disease, spontaneous abortion, and allograft rejection.
Cuando se determine que el individuo es adecuado para recibir una terapia basada en IL-2, el tratamiento puede modificarse en función de los niveles determinados de biomarcadores detectados en la muestra, con respecto a la muestra de referencia. Los métodos se pueden usar para modificar el régimen de tratamiento (por ejemplo, aumentando la dosis o el programa de dosificación), en función de los niveles determinados de biomarcadores en la muestra con respecto a la muestra de referencia.When the individual is determined to be suitable for receiving IL-2-based therapy, the treatment may be modified based on the determined levels of biomarkers detected in the sample, relative to the reference sample. The methods can be used to modify the treatment regimen (eg, by increasing the dose or dosing schedule), based on determined levels of biomarkers in the sample relative to the reference sample.
En una variación particular, si se determina que es probable que el individuo (por ejemplo, puede que no) experimente efectos adversos de una terapia basada en IL-2, y después se le administra la terapia basada en IL-2, el individuo puede ser evaluado posteriormente de nuevo para monitorizar los efectos adversos. De este modo, en esta variación, se evalúa a un individuo para determinar la probabilidad de posibles efectos adversos tanto antes del tratamiento como una vez que ha comenzado el tratamiento. La dosis y el programa de administración se pueden ajustar en consecuencia. Por ejemplo, se pueden implementar clínicamente regímenes de dosis bajas para tratamientos con IL-2. Además de los métodos complementarios descritos aquí, el efecto del tratamiento con IL-2 se puede monitorizar mediante medidas adicionales, por ejemplo los efectos de las terapias basadas en IL-2 en la diferenciación de las células T in vivo. In a particular variation, if it is determined that the individual is likely (eg, may not) experience adverse effects from an IL-2-based therapy, and the IL-2-based therapy is then administered, the individual may be subsequently evaluated again to monitor for adverse effects. Thus, in this variation, an individual is evaluated for the likelihood of possible adverse effects both before treatment and once treatment has begun. The dose and schedule of administration can be adjusted accordingly. For example, low dose regimens for IL-2 treatments can be implemented clinically. In addition to the complementary methods described here, the effect of IL-2 treatment can be monitored by additional measures, for example the effects of IL-2-based therapies on T cell differentiation in vivo.
La FIG. 1B ilustra un método ejemplar para tratar un paciente con IL-2 consultando el estado de senescencia replicativa de MSC. En este ejemplo, el paciente se trata con una o más dosis de IL-2 101, y dentro de un período de tiempo predeterminado (por ejemplo, entre un tiempo de inicio de 1 hora, 2 horas, 3 horas, 4 horas, 5 horas, 6 horas, 7 horas, 8 horas, 9 horas, 10 horas, 11 horas, 12 horas, etc., y un tiempo de parada de 12 horas, 13 horas, 14 horas, 15 horas, 16 horas, 17 horas, 18 horas, 19 horas, 20 horas, 21 horas, 22 horas, 23 horas, 24 horas, 30 horas, 36 horas, 42 horas, 48 horas, 72 horas, o 96 horas, etc.), tomando una muestra del paciente 103. La muestra puede ser cualquier fluido o tejido apropiado como se proporciona aquí (por ejemplo, sangre, plasma sanguíneo, suero sanguíneo, orina, etc.). Esta muestra puede examinarse entonces para detectar la presencia/ausencia y/o el nivel de un panel de biomarcadores 105.FIG. 1B illustrates an exemplary method for treating a patient with IL-2 by querying the state of replicative senescence of MSCs. In this example, the patient is treated with one or more doses of IL-2 101, and within a predetermined time period (eg, between a start time of 1 hour, 2 hours, 3 hours, 4 hours, 5 hours, 6 hours, 7 hours, 8 hours, 9 hours, 10 hours, 11 hours, 12 hours, etc., and a stop time of 12 hours, 13 hours, 14 hours, 15 hours, 16 hours, 17 hours, 18 hours, 19 hours, 20 hours, 21 hours, 22 hours, 23 hours, 24 hours, 30 hours, 36 hours, 42 hours, 48 hours, 72 hours, or 96 hours, etc.), taking a sample from the patient 103 The sample may be any appropriate fluid or tissue as provided herein (eg, blood, blood plasma, blood serum, urine, etc.). This sample can then be screened for the presence/absence and/or level of a panel of biomarkers 105.
6. Control de calidad de las MSC antes del uso en terapias basadas en células6. Quality control of MSCs before use in cell-based therapies
Las MSC se administran (trasplantan) para una variedad de indicaciones. Un aspecto importante de la descripción es la determinación de qué MSC serían adecuadas para la administración, antes de la administración. Específicamente, los métodos proporcionados permiten la selección de poblaciones de MSC adecuadas para la administración, después del ensayo, para evitar o reducir la probabilidad de actividades antiapoptóticas, angiogénicas, y tumorigénicas asociadas con las MSC trasplantadas en el entorno in vivo que puede ser proinflamatorio o de otro modo no propicio. MSCs are administered (transplanted) for a variety of indications. An important aspect of the description is the determination of which MSCs would be suitable for administration, prior to administration. Specifically, the methods provided allow for the selection of MSC populations suitable for administration, after assay, to avoid or reduce the likelihood of antiapoptotic, angiogenic, and tumorigenic activities associated with transplanted MSCs in the in vivo environment that may be proinflammatory or otherwise not conducive.
De este modo, en otro aspecto, se proporcionan aquí métodos para evaluar la calidad y el potencial de las células madre en una muestra. Dichos métodos y kits son útiles para ayudar a garantizar la seguridad y la calidad de una población de MSC antes de que se utilice en un individuo.Thus, in another aspect, methods for evaluating the quality and potential of stem cells in a sample are provided herein. Such methods and kits are useful in helping to ensure the safety and quality of an MSC population before it is used in an individual.
En una variación, un método para determinar si una población de MSC es adecuada para la administración a un individuo para una terapia basada en células madre comprende (a) incubar la población de MSC con IL-2 (incubar con una porción activa de IL-2, ya sea sola o fusionada con otros motivos); (b) medir los niveles de expresión en las células de un panel de biomarcadores asociados con la senescencia celular, en el que el panel de biomarcadores son antiapoptóticos, angiogénicos, tumorigénicos, conducen al desarrollo vascular, son responsables del crecimiento invasivo, metástasis, motilidad celular, migración, y similares; (c) comparar los niveles de los biomarcadores con los niveles de referencia, en el que un aumento en los niveles por encima de los niveles de referencia indica que las células madre no son óptimas para la administración a un individuo y podrían conducir a efectos adversos si se administran. Sin embargo, ningún cambio o una disminución en los niveles por debajo de los niveles de referencia podría indicar que las células madre son adecuadas para la administración a un individuo. Generalmente, por adecuado, se pretende transmitir que las células provocarían pocos o ningún evento adverso, tales como tumorigénicos, promotores de metástasis, antiapoptóticos, y similares.In one variation, a method of determining whether a population of MSCs is suitable for administration to an individual for stem cell-based therapy comprises (a) incubating the population of MSCs with IL-2 (incubating with an active portion of IL-2). 2, either alone or merged with other motifs); (b) measuring the expression levels in cells of a panel of biomarkers associated with cellular senescence, wherein the panel of biomarkers are antiapoptotic, angiogenic, tumorigenic, lead to vascular development, are responsible for invasive growth, metastasis, motility cell, migration, and the like; (c) comparing the levels of the biomarkers to reference levels, wherein an increase in levels above reference levels indicates that the stem cells are not optimal for administration to an individual and could lead to adverse effects if administered. However, no change or a decrease in levels below background levels could indicate that the stem cells are suitable for administration to an individual. Generally, by suitable, it is meant that the cells would cause few or no adverse events, such as tumorigenic, promoters of metastasis, antiapoptotic, and the like.
En algunas variaciones, la población de células está destinada para uso autólogo. En otras variaciones, la población de células está destinada a uso alogénico. En algunas variaciones, la población de células comprende células de origen homogéneo, por ejemplo de un solo individuo. En algunas variaciones, las poblaciones de células comprenden células de origen heterogéneo, por ejemplo compuestas de células procedentes de una variedad de fuentes.In some variations, the cell population is intended for autologous use. In other variations, the cell population is intended for allogeneic use. In some variations, the cell population comprises cells of homogeneous origin, eg, from a single individual. In some variations, cell populations comprise cells of heterogeneous origin, eg, composed of cells from a variety of sources.
En las variaciones proporcionadas aquí, los niveles de expresión de la muestra se pueden medir en cualquier momento después de la incubación de la IL-2, por ejemplo 15 minutos, 30 minutos, 1 hora, 2, 3, 4, 6, 12, 15, 24, 36, 48, 72, o incluso 96 horas después de la incubación con IL-2.In the variations provided here, sample expression levels can be measured at any time after IL-2 incubation, for example 15 minutes, 30 minutes, 1 hour, 2, 3, 4, 6, 12, 15, 24, 36, 48, 72, or even 96 hours after IL-2 incubation.
II. Kits y artículos de fabricaciónII. Kits and crafting items
La presente solicitud también proporciona kits para medir los niveles de biomarcadores en una muestra.The present application also provides kits for measuring biomarker levels in a sample.
En una variación, los kits son para evaluar la idoneidad de una población de MSC para trasplante.In one variation, the kits are for evaluating the suitability of an MSC population for transplantation.
En otra variación, los kits son para determinar si se debe administrar una terapia basada en IL-2 a un individuo que la necesite.In another variation, the kits are for determining whether an IL-2-based therapy should be administered to an individual in need.
En una variación, un kit comprende reactivos para medir el nivel de expresión de ARN de al menos dos biomarcadores en una muestra. Por ejemplo, el kit puede comprender sondas o cebadores, por ejemplo cebadores de Q-PCR, específicos para al menos dos biomarcadores seleccionados de cualquiera de los biomarcadores descritos aquí. In one variation, a kit comprises reagents for measuring the level of RNA expression of at least two biomarkers in a sample. For example, the kit may comprise probes or primers, eg, Q-PCR primers, specific for at least two biomarkers selected from any of the biomarkers described herein.
En una variación particular, el kit comprende al menos dos reactivos específicos para medir un biomarcador seleccionado de TIE-1, TIE-2, TIMP-4, FGF1, FGF11, FGF14, LIF, TGFBR2, CSF1, TGFa, TGF|31, IL17D, SDF2, TGFBRAP1, TNFSF13B, IL1B, IL-11, IL-32, IL-6, IL1RN, IL-20RB, IL-21R, PLAU, GNB2L1, PLEKHA6, PLEKHA1, CTSB, FERMT1, CRMP1, VEGFB, y SIVA1, y VEGFA. En algunas variaciones, el cebador comprende un marcador, por ejemplo un marcador fluorescente. En algunas variaciones, el kit comprende al menos 3, al menos 4, al menos 5, al menos 6, al menos 7, al menos 8, al menos 9, al menos 10, al menos 11, al menos 12, al menos 13, al menos 14, al menos 15, al menos 16, al menos 17, al menos 18, al menos 19, o incluso al menos 20 reactivos, por ejemplo sondas o cebadores, para medir el nivel de expresión de ARN de biomarcadores en una muestra. In a particular variation, the kit comprises at least two specific reagents to measure a biomarker selected from TIE-1, TIE-2, TIMP-4, FGF1, FGF11, FGF14, LIF, TGFBR2, CSF1, TGFa, TGF|31, IL17D , SDF2, TGFBRAP1, TNFSF13B, IL1B, IL-11, IL-32, IL-6, IL1RN, IL-20RB, IL-21R, PLAU, GNB2L1, PLEKHA6, PLEKHA1, CTSB, FERMT1, CRMP1, VEGFB, and SIVA1, and VEGFA. In some variations, the primer comprises a label, for example a fluorescent label. In some variations, the kit comprises at least 3, at least 4, at least 5, at least 6, at least 7, at least 8, at least 9, at least 10, at least 11, at least 12, at least 13 , at least 14, at least 15, at least 16, at least 17, at least 18, at least 19, or even at least 20 reagents, for example probes or primers, to measure the level of RNA expression of biomarkers in a sample.
En otras variaciones, un kit comprende reactivos para medir el nivel de expresión de proteína de al menos dos biomarcadores en la muestra. Por ejemplo, el kit puede comprender anticuerpos específicos para al menos dos biomarcadores seleccionados de TIE-1, TIE-2, TIMP-4, FGF1, FGF11, FGF14, LIF, TGFBR2, CSF1, TGFa, TGFP1JL17D, SDF2, TGFBRAP1, TNFSF13B, IL1B, IL-11, IL-32, IL-6, IL1RN, IL-20RB, IL-21R, PLAU, GNB2L1, PLEKHA6, PLEKHA1, CTSB, FERMT1, CRMP1, VeGf B, y SIVA1, y VEGFA. En algunas variaciones, el anticuerpo comprende un marcador, por ejemplo un marcador fluorescente. En algunas variaciones, el kit comprende una matriz o placa de ELISA que comprende al menos 3, al menos 4, al menos 5, al menos 6, al menos 7, al menos 8, al menos 9, al menos 10, al menos 11, al menos 12, al menos 13, al menos 14, al menos 15, al menos 16, al menos 17, al menos 18, al menos 19, o incluso al menos 20 reactivos, por ejemplo anticuerpos, para medir el nivel de expresión de proteína de biomarcadores en una muestra.In other variations, a kit comprises reagents for measuring the level of protein expression of at least two biomarkers in the sample. For example, the kit may comprise antibodies specific for at least two biomarkers selected from TIE-1, TIE-2, TIMP-4, FGF1, FGF11, FGF14, LIF, TGFBR2, CSF1, TGFa, TGFP1JL17D, SDF2, TGFBRAP1, TNFSF13B, IL1B, IL-11, IL-32, IL-6, IL1RN, IL-20RB, IL-21R, PLAU, GNB2L1, PLEKHA6, PLEKHA1, CTSB, FERMT1, CRMP1, VeGf B, and SIVA1, and VEGFA. In some variations, the antibody comprises a label, for example a fluorescent label. In some variations, the kit comprises an ELISA array or plate comprising at least 3, at least 4, at least 5, at least 6, at least 7, at least 8, at least 9, at least 10, at least 11 , at least 12, at least 13, at least 14, at least 15, at least 16, at least 17, at least 18, at least 19, or even at least 20 reagents, for example antibodies, to measure the level of expression of biomarker protein in a sample.
En algunas variaciones, los kits comprenden además una composición de IL-2 (una composición que comprende IL-2 de longitud completa, o una porción de IL-2, sola o fusionada con otros motivos, con la muestra). Esta composición de IL-2 se puede usar para analizar una muestra in vitro o para la administración a un individuo, para la práctica de los métodos de la descripción.In some variations, the kits further comprise an IL-2 composition (a composition comprising full-length IL-2, or a portion of IL-2, alone or fused to other motifs, with the sample). This IL-2 composition can be used to test a sample in vitro or for administration to an individual to practice the methods of the disclosure.
En algunas variaciones, el kit comprende además un patrón de referencia para uso en el ensayo (una muestra que se analizará al lado para determinar que los niveles de referencia se generan en las mismas condiciones). En algunas variaciones, el kit comprende además una lista escrita de valores que sirven como niveles de referencia, por ejemplo niveles de referencia de una población de individuos sanos, o de individuos no tratados con IL-2, que proporcionan una referencia frente a la cual se pueden comprobar los resultados del ensayo.In some variations, the kit further comprises a reference standard for use in the assay (a sample to be tested side by side to determine that reference levels are generated under the same conditions). In some variations, the kit further comprises a written list of values that serve as reference levels, for example reference levels from a population of healthy individuals, or from individuals not treated with IL-2, which provide a reference against which to compare. test results can be checked.
En algunas variaciones, como se contempla aquí, los kits proporcionan múltiples ensayos para la medida de los niveles de expresión de biomarcadores particulares que se pueden usar en paralelo o en serie. Por ejemplo, un kit puede comprender tres placas de ensayo, con cebadores de Q-PCR o con anticuerpos, una dirigida a la detección de biomarcadores de factores de crecimiento, otra dirigida a la detección de biomarcadores antiapoptóticos, y otra dirigida a la detección de factores implicados en la motilidad y migración celulares. En otra variación, el kit puede comprender tres placas de ensayo, útiles para evaluar la muestra ensayada en tres momentos diferentes. Se entiende que el kit puede comprender cuatro, cinco, o más de tales placas para los fines de detección en serie o en paralelo de biomarcadores.In some variations, as contemplated herein, the kits provide multiple assays for the measurement of expression levels of particular biomarkers that can be used in parallel or in series. For example, a kit may comprise three assay plates, either with Q-PCR primers or with antibodies, one directed toward the detection of growth factor biomarkers, one directed toward the detection of antiapoptotic biomarkers, and one directed toward the detection of antiapoptotic biomarkers. factors involved in cell motility and migration. In another variation, the kit may comprise three assay plates, useful for evaluating the tested sample at three different times. It is understood that the kit may comprise four, five, or more such plates for the purposes of serial or parallel detection of biomarkers.
La presente solicitud también proporciona artículos de fabricación que comprenden uno cualquiera de los kits descritos aquí.The present application also provides articles of manufacture comprising any one of the kits described herein.
Debe entenderse que la terminología empleada aquí se usa únicamente con el fin de describir variaciones particulares, y no pretende ser limitativa, ya que el alcance de la presente invención estará limitado únicamente por las reivindicaciones adjuntas. Los siguientes ejemplos son para fines ilustrativos. Están destinados a mostrar ciertos aspectos y variaciones de la presente invención, pero no pretenden limitar la invención de ninguna manera.It should be understood that the terminology used herein is used solely for the purpose of describing particular variations, and is not intended to be limiting, as the scope of the present invention will be limited only by the appended claims. The following examples are for illustrative purposes. They are intended to show certain aspects and variations of the present invention, but are not intended to limit the invention in any way.
EJEMPLOSEXAMPLES
Ejemplo 1: Materiales y métodosExample 1: Materials and methods
Este ejemplo proporciona métodos ejemplares de la invención, y proporciona los materiales y métodos usados posteriormente en los Ejemplos 2-10.This example provides exemplary methods of the invention, and provides the materials and methods used later in Examples 2-10.
Aislamiento, cultivo y caracterización de las MSCIsolation, culture and characterization of MSCs
Las MSC usadas en esta investigación se aislaron de tejidos adiposos humanos obtenidos de donantes femeninas adultas sanas de 32 y 49 años que se sometieron a procedimientos de liposucción de rutina en el centro médico UCSD, San Diego, CA. El protocolo de aislamiento de las MSC fue aprobado por el comité de ética local, y se realizó como se describió anteriormente. Las líneas de células madre derivadas de tejido adiposo aisladas se cultivaron en medio DMEM/F12 (Life Technologies). De acuerdo con los criterios de definición mínima de MSC establecidos por la International Society for Cellular Therapy, el análisis de citometría de flujo mostró que las hADSC expresan CD29, CD73, CD90 y c D105, pero no expresan CD11b, CD14, CD19, CD34, CD45, CD80, CD86 (anticuerpos de eBiosciense, USA). El análisis morfológico mostró que las células presentan una morfología similar a la de los fibroblastos, eran adherentes al plástico, y eran capaces de diferenciarse adipogénica, condrogénica y osteogénicamente bajo condiciones in vitro usando medios de diferenciación disponibles comercialmente (Invitrogen, USA). Las duplicaciones acumulativas de la población (PD) se calcularon como PD = log(N/NO) x 3,33 a lo largo de las múltiples pasadas en función del número de días de crecimiento en cultivo, en la que NO es el número de células sembradas en el matraz, y N es el número de células recolectadas en esta pasada. En todos los experimentos se usaron poblaciones hADSC PD 4 o PD 6 SR y PD 41 y 45 para poblaciones SEN. El tratamiento con IL-2 recombinante (Peprotech, USA) se realizó como se describe (Deenick EK, Gett AV, Hodgkin PD (2003). J Immunol 170: 4963-4972). Se añadieron 20 U/ml de IL-2 a los medios de cultivo durante 24 horas a 37°C. The MSCs used in this investigation were isolated from human adipose tissues obtained from healthy adult female donors aged 32 and 49 years who underwent routine liposuction procedures at UCSD Medical Center, San Diego, CA. The MSC isolation protocol was approved by the local ethics committee, and was performed as described above. Isolated adipose-derived stem cell lines were cultured in DMEM/F12 medium (Life Technologies). In accordance with the minimal definition criteria for MSC established by the International Society for Cellular Therapy, flow cytometric analysis showed that hADSCs express CD29, CD73, CD90 and cD105, but do not express CD11b, CD14, CD19, CD34, CD45 , CD80, CD86 (antibodies from eBiosciense, USA). Morphological analysis showed that the cells had a fibroblast-like morphology, were adherent to plastic, and were capable of adipogenic, chondrogenic, and osteogenic differentiation under in vitro conditions using commercially available differentiation media (Invitrogen, USA). Cumulative population doublings (PD) were calculated as PD = log(N/NO) x 3.33 over multiple passages as a function of the number of days of growth in culture, where NO is the number of cells seeded in the flask, and N is the number of cells collected in this passage. hADSC PD 4 or PD 6 SR populations and PD 41 and 45 for SEN populations were used in all experiments. Treatment with recombinant IL-2 (Peprotech, USA) was performed as described (Deenick EK, Gett AV, Hodgkin PD (2003). J Immunol 170: 4963-4972). 20 U/ml of IL-2 was added to the culture media for 24 hours at 37°C.
Ensayo de p-galactosidasa asociada a la senescencia (SA)Senescence-associated p-galactosidase (SA) assay
El ensayo para monitorizar la expresión de la actividad de 3-galactosidasa asociada a la senescencia dependiente del pH (SA-pGal) se realizó como se describe en el kit del fabricante (BioVision) y como se publicó previamente en Wang J, Geesman GJ, Hostikka SL, Atallah M, Blackwell B, et al. (2011) Inhibition of activated pericentromeric SINE/Alu repeat transcription in senescent human adult stem cells reinstates self-renewal. Cell cycle 10: 3016-3030. Las hADSC cultivadas se lavaron con PBS durante 15 minutos a temperatura ambiente, se lavaron dos veces con PBS, y se tiñeron con suplemento que contenía X-Gal, durante la noche a 37°C. Las células se lavaron dos veces con PBS, y las imágenes se capturaron con un microscopio (Nikons, TE300, DXM1200 Digital Camera, Japón).The assay to monitor the expression of pH-dependent senescence-associated 3-galactosidase activity (SA-pGal) was performed as described in the manufacturer's kit (BioVision) and as previously published in Wang J, Geesman GJ, Hostikka SL, Atallah M, Blackwell B, et al. (2011) Inhibition of activated pericentromeric SINE/Alu repeat transcription in senescent human adult stem cells reinstates self-renewal. Cell cycle 10: 3016-3030. Cultured hADSCs were washed with PBS for 15 minutes at room temperature, washed twice with PBS, and stained with supplement containing X-Gal, overnight at 37°C. Cells were washed twice with PBS, and images were captured with a microscope (Nikons, TE300, DXM1200 Digital Camera, Japan).
Ensayo de migración e invasiónMigration and invasion assay
Los filtros Transwell procedían de Corning Incorporated (Acton, MA, USA), y todas las citocinas en uso se obtuvieron de Peprotech Inc. (Rocky Hill, NJ, USA). El ensayo de migración se realizó como se describe en Perez LM, Bernal A, San Martin N, Galvez b G (2013), Arch Physiol Biochem 119: 195-201, usando cámaras Transwell de 8 mm de grosor. Para el ensayo de migración de Transwell, 1,0 x 10⁴ células se suspendieron en 80 ul de alfa-MEM sin suero, y se sembraron en la cámara superior de placas Transwell de 24 pocillos que contenían filtros de tamaño de poro de 8 mm (Corning, Costar, USA). En la cámara inferior, se añadieron 600 ul de DMEM o medio que contenía citocinas: IL-2, IL-6, IL-8, TNF-a, HMGp1. Las concentraciones usadas fueron: 50 ng/ml de IL-2, IL-6, IL-8 y HMGp1; 30 ng/ml de TNF-a como se describe en (Perez et al., 2013, Arch Physiol Biochem 119: 195-201). Las hADSC se incubaron a 37°C durante 16 h. Las células retenidas en la cámara superior se retiraron con mediante un hisopo, y aquellas que habían migrado a través del filtro se fijaron con paraformaldehído al 4% durante 20 minutos a temperatura ambiente, y se tiñeron durante la noche con azul de toluidina al 5%. Las células se contaron en el lado inferior, en cinco campos diferentes 10x seleccionados al azar usando un microscopio de campo brillante (Nikons, TE300, DXM1200 Digital Camera, Japón). Estos experimentos se realizaron con las hADSC de dos donantes de 32 y 41 años de edad, poblaciones tanto SR o SEN, con cada donante muestreado más de tres veces.Transwell filters were from Corning Incorporated (Acton, MA, USA), and all cytokines in use were obtained from Peprotech Inc. (Rocky Hill, NJ, USA). The migration assay was performed as described in Perez LM, Bernal A, San Martin N, Galvez b G (2013), Arch Physiol Biochem 119: 195-201, using 8 mm thick Transwell chambers. For the Transwell migration assay, 1.0 x 10 4 cells were suspended in 80 ul of serum-free alpha-MEM, and plated in the upper chamber of 24-well Transwell plates containing 8 mm pore size filters ( Corning, Costa, USA). In the lower chamber, 600 ul of DMEM or medium containing cytokines: IL-2, IL-6, IL-8, TNF-a, HMGp1 were added. The concentrations used were: 50 ng/ml of IL-2, IL-6, IL-8 and HMGp1; 30 ng/ml of TNF-a as described in (Perez et al., 2013, Arch Physiol Biochem 119: 195-201). hADSCs were incubated at 37°C for 16 h. Cells retained in the upper chamber were removed with a swab, and those that had migrated through the filter were fixed with 4% paraformaldehyde for 20 min at room temperature, and stained overnight with 5% toluidine blue. . Cells were counted on the lower side, in five different randomly selected 10x fields using a bright-field microscope (Nikons, TE300, DXM1200 Digital Camera, Japan). These experiments were performed with hADSCs from two donors aged 32 and 41 years, both SR and SEN populations, with each donor sampled more than three times.
Ensayos inmunoabsorbentes ligados a enzimas (ELISA)Enzyme-linked immunosorbent assays (ELISAs)
Se sembraron hADSC (SR o SEN) a una densidad de 105 células por placa de 10 cm2, y se trataron con 20 U/ml de IL-2 durante 24 horas, con controles no tratados como se describió previamente en Deenick EK, Gett AV, Hodgkin PD (2003) Stochastic model of T cell proliferation: a calculus revealing IL-2 regulation of precursor frequencies, cell cycle time, y survival. J Immunol 170: 4963-4972. Después, las fracciones de proteínas asociadas a la membrana celular se prepararon usando Mem-PER Plus #89842 (ThermoFisher Scientific) siguiendo el protocolo del fabricante. Las medidas de las concentraciones de receptores alfa y beta de IL-2 se obtuvieron usando los kits ELISA para IL-2R alfa humano y para IL-2R beta humano, #ELH-IL-2Ra y #ELH-IL-2Rb (RayBiotech, Inc) respectivamente. Las densidades ópticas para los patrones (receptores alfa y beta de IL-2 recombinante), así como las muestras experimentales, se midieron a 450 nm mediante SPECTRA Max Plus (Molecular Devices), y las concentraciones se calcularon según lo descrito en el protocolo del fabricante.hADSC (SR or SEN) were seeded at a density of 105 cells per 10 cm2 dish, and treated with 20 U/ml IL-2 for 24 hours, with untreated controls as previously described in Deenick EK, Gett AV , Hodgkin PD (2003) Stochastic model of T cell proliferation: a calculus revealing IL-2 regulation of precursor frequencies, cell cycle time, and survival. J Immunol 170: 4963-4972. Cell membrane associated protein fractions were then prepared using Mem-PER Plus #89842 (ThermoFisher Scientific) following the manufacturer's protocol. Measurements of IL-2 alpha and beta receptor concentrations were obtained using the human IL-2R alpha and human IL-2R beta ELISA kits, #ELH-IL-2Ra and #ELH-IL-2Rb (RayBiotech, Inc) respectively. The optical densities for the standards (recombinant IL-2 alpha and beta receptors), as well as the experimental samples, were measured at 450 nm by SPECTRA Max Plus (Molecular Devices), and the concentrations were calculated as described in the protocol of the maker.
Reacción en cadena de la polimerasa cuantitativa en tiempo realReal-time quantitative polymerase chain reaction
El ARN total se aisló de las hADSC usando el RNeasy Mini Kit (Qiagen, Alemania). A continuación, se sintetizó ADNc usando el cDNA RevertAid First Strand cDNA Synthesis Kit (Fermentas, USA). La reacción en cadena de la polimerasa cuantitativa en tiempo real (Q-PCR) se realizó usando el instrumento TaqMan. Los niveles de expresión se calcularon como 2-AACt, en los que la expresión relativa se determinó mediante la normalización con respecto a la expresión del gen de beta-actina. Todos los ensayos se realizaron por triplicado, y se usaron muestras de control negativo sin ADNc. Los cebadores para la Q-PCR fueron los siguientes:Total RNA was isolated from hADSCs using the RNeasy Mini Kit (Qiagen, Germany). Next, cDNA was synthesized using the cDNA RevertAid First Strand cDNA Synthesis Kit (Fermentas, USA). Real-time quantitative polymerase chain reaction (Q-PCR) was performed using the TaqMan instrument. Expression levels were calculated as 2-AACt, where relative expression was determined by normalization to beta-actin gene expression. All assays were performed in triplicate, and negative control samples without cDNA were used. The primers for Q-PCR were the following:
Cadena alfa del receptor de IL-2 (IL-2Ra) Dir: 5’-CTGCCACTCGGAACACAAC-3’ e Inv: 5’-TGGTCCACTGGCTGCATT-3’.IL-2 receptor alpha chain (IL-2Ra) Dir: 5'-CTGCCACTCGGAACACAAC-3' and Inv: 5'-TGGTCCACTGGCTGCATT-3'.
Cadena beta del receptor de IL-2 (IL-2Rp) Dir: 5’-ACTCGAGAGCCAACATCTCC-3’ e Inv: 5’-TCCGAGGATCAGGTTGCAG-3’IL-2 receptor beta chain (IL-2Rp) Dir: 5'-ACTCGAGAGCCAACATCTCC-3' and Inv: 5'-TCCGAGGATCAGGTTGCAG-3'
Cadena Gamma 1 del receptor de IL-2 (IL-2Rg1) Dir: 5’-TGGATGGGCAGAAACGCTA-3’ e Inv: 5’-GGCTTCCAATGCAAACAGGA-3’.IL-2 receptor gamma chain 1 (IL-2Rg1) Dir: 5'-TGGATGGGCAGAAACGCTA-3' and Inv: 5'-GGCTTCCAATGCAAACAGGA-3'.
STAT 5A Dir: 5’-ACGCAGGACACAGAGAATGA-3’ e Inv: 5’-CTGGGCAAACTGAGCTTGG-3’.STAT 5A Dir: 5'-ACGCAGGACACAGAGAATGA-3' and Inv: 5'-CTGGGCAAACTGAGCTTGG-3'.
STAT 5B Dir: 5’-ACACAGCTCCAGAACACGT-3’ e Inv: 5’-TGTTGGCTTCTCGGACCAA-3’.STAT 5B Dir: 5'-ACACAGTCTCCAGAACACGT-3' and Inv: 5'-TGTTGGCTTCTCGGACCAA-3'.
VEGF A Dir: 5’-GGAGGAGGGCAGAATCATCA-3’ e Inv: 5’-ATCAGGGGCACACAGGATG-3’.VEGF A Dir: 5'-GGAGGAGGGCAGAATCATCA-3' and Inv: 5'-ATCAGGGGCACACAGGATG-3'.
Análisis transcriptómicoTranscriptomic analysis
El análisis transcriptómico se realizó con las hADSC SR y SEN tratadas con IL-2 y no tratadas (grupo de control), como se describió previamente en Deenick EK, Gett AV, Hodgkin PD (2003) Stochastic model of T cell proliferation: a calculus revealing IL-2 regulation of precursor frequencies, cell cycle time, y survival. J Immunol 170: 4963-4972. Los dos genotipos mostrados en la FIG. 3a se usaron para el análisis de cuatro condiciones diferentes: células SR o SEN, con o sin estimulación con IL-2, respectivamente. La misma cantidad (106) de células se sembró en medio DMEM F12 para cada condición experimental, y el tratamiento con IL-2 se realizó añadiendo 20 U/ml de IL-2 recombinante (Peprotech, USA) directamente en el medio durante 24 horas como se describió previamente en Deernick et al. 2003. El ARN total se aisló de las muestras usando el reactivo TRIzol (Invitrogen, USA) según las instrucciones del fabricante. Las muestras de dos pacientes diferentes se combinaron para las condiciones relevantes, y las concentraciones de ARN se midieron con el fluorímetro Qubit 2.0 usando el RNA HS Assay kit (Invitrogen, Life technologies, USA). Transcriptomic analysis was performed with IL-2 treated and untreated (control group) SR and SEN hADSCs, as previously described in Deenick EK, Gett AV, Hodgkin PD (2003) Stochastic model of T cell proliferation: a calculus revealing IL-2 regulation of precursor frequencies, cell cycle time, and survival. J Immunol 170: 4963-4972. The two genotypes shown in FIG. 3a were used for the analysis of four different conditions: SR or SEN cells, with or without IL-2 stimulation, respectively. The same amount (106) of cells was seeded in DMEM F12 medium for each experimental condition, and treatment with IL-2 was performed by adding 20 U/ml of recombinant IL-2 (Peprotech, USA) directly to the medium for 24 hours. as previously described in Deernick et al. 2003. Total RNA was isolated from the samples using the TRIzol reagent (Invitrogen, USA) according to the manufacturer's instructions. Samples from two different patients were pooled for the relevant conditions, and RNA concentrations were measured with the Qubit 2.0 fluorimeter using the RNA HS Assay kit (Invitrogen, Life technologies, USA).
Se usaron 100 ng de ARN total de cada muestra para construir las bibliotecas para la secuenciación en el sistema Ion Proton™ (Life Technologies, USA) siguiendo las instrucciones del fabricante. Antes del agotamiento del ARNr y de la construcción de la biblioteca RNA-seq, se añadió la mezcla de control ERCC RNA Spike-In (Ambion, Life Technologies) al ARN total para el análisis de control de calidad. La mezcla de control ERCC RNA Spike-In contiene 92 transcritos de 250-2000 nt de longitud que imitan los ARNm eucariotas naturales. Según el protocolo proporcionado por el fabricante, se añadieron 100 ng de ARN total a 2 ul de Mixl en una dilución 1:1000 de agregado. Posteriormente, el agotamiento de ARNr se realizó con el Low Input Ribominus Eukaryote System v2 (Ambion, Life technologies, USA). Las bibliotecas de ADNc se construyeron con Ion total RNA-seq kit v2 (Ambion, Life technologies, USA), y se codificaron con el código de barras Ion Xpress RNA-seq (Ambion, Life technologies). La distribución de tamaños y la cuantificación de las bibliotecas se realizaron en un Bioanalyzer 2100 (Agilent Technologies, USA). La secuenciación de la biblioteca se realizó en el sistema Ion Proton™ con chip PI, y cada biblioteca se secuenció 3 veces.100 ng of total RNA from each sample was used to construct the libraries for sequencing on the Ion Proton™ system (Life Technologies, USA) following the manufacturer's instructions. Prior to rRNA depletion and RNA-seq library construction, ERCC RNA Spike-In Control Mix (Ambion, Life Technologies) was added to total RNA for quality control analysis. The ERCC RNA Spike-In Control Mix contains 92 transcripts 250-2000 nt in length that mimic natural eukaryotic mRNAs. According to the protocol provided by the manufacturer, 100 ng of total RNA was added to 2 ul of Mixl in a 1:1000 dilution of aggregate. Subsequently, rRNA depletion was performed with the Low Input Ribominus Eukaryote System v2 (Ambion, Life technologies, USA). The cDNA libraries were constructed with the Ion total RNA-seq kit v2 (Ambion, Life technologies, USA), and barcoded with the Ion Xpress RNA-seq (Ambion, Life technologies). The size distribution and quantification of the libraries were performed in a Bioanalyzer 2100 (Agilent Technologies, USA). Library sequencing was performed on the Ion Proton™ System with PI Chip, and each library was sequenced 3 times.
Análisis de datos de RNA-seqRNA-seq data analysis
Las lecturas de RNA-seq de los experimentos de secuenciación individuales del sistema Ion Proton™ se combinaron para cada una de las cuatro condiciones. Las lecturas de secuencia se asignaron al ensamblaje del genoma humano de referencia hgl9 (GRCh37) usando el Torrent Mapping Alignment Program (TMAP, Life technologies). La calidad de los cuatro experimentos de RNA-seq combinados específicos de la condición se evaluó comparando los recuentos esperados de secuencias de ARN de inserción de agregados de ERCC, obtenidos del sitio web del fabricante, con los recuentos observados de etiquetas de RNA-seq que se asignan a las mismas secuencias. Los niveles iniciales de expresión génica se tomaron como la suma de las lecturas asignadas a los exones para los modelos de genes NCBI RefSeq individuales (c), y los genes poco expresados (recuentos de lectura por millón <1) se eliminaron de los análisis posteriores. Para cada biblioteca, los niveles de expresión de genes individuales se normalizaron usando los niveles de expresión de beta-actina (ACTB) (cACTB) y la longitud total del exón l de cada gen. Para la biblioteca j, el factor de normalización de beta-actina sj se calculó comoRNA-seq reads from individual Ion Proton™ System sequencing experiments were pooled for each of the four conditions. Sequence reads were assigned to the reference human genome assembly hgl9 (GRCh37) using the Torrent Mapping Alignment Program (TMAP, Life technologies). The quality of the four condition-specific pooled RNA-seq experiments was assessed by comparing the expected counts of ERCC aggregate insert RNA sequences, obtained from the manufacturer's website, with the observed counts of RNA-seq tags that are assigned to the same sequences. Baseline gene expression levels were taken as the sum of exon-mapped reads for individual NCBI RefSeq gene models (c), and poorly expressed genes (read counts per million < 1) were removed from subsequent analyses. . For each library, the expression levels of individual genes were normalized using the expression levels of beta-actin ( ACTB) ( cACTB) and the total length of exon l of each gene. For library j, the beta-actin normalization factor sj was calculated as

y el valor final de expresión normalizada para el gen i en la biblioteca j se calculó comoand the final normalized expression value for gene i in library j was calculated as

El análisis de expresión génica diferencial entre pares de bibliotecas se realizó usando el programa GFOLD v1.1.3, Feng J, Meyer Ca, Wang Q, Liu JS, Shirley Liu X, et al. (2012) GFOLD: a generalized fold change for ranking differentially expressed genes from RNA-seq data. Bioinformatics 28: 2782-2788. GFOLD se escogió en base a su comportamiento superior demostrado a la hora de caracterizar genes expresados diferencialmente en ausencia de conjuntos de datos replicados. El análisis GFOLD produce una puntuación que mide el grado de expresión génica diferencial entre condiciones; aquí se utilizó el punto de corte de la puntuación GFOLD recomendado de ±0,01 para definir los genes expresados diferencialmente. El análisis de enriquecimiento funcional para genes expresados diferencialmente entre pares de bibliotecas se realizó usando el programa GSEA v2.1.0. Específicamente, se identificaron de esta manera rutas individuales que contienen múltiples genes que se regulan al alza o a la baja con el tratamiento con IL-2 en SR, SEN, o ambas. Las rutas individuales para conjuntos específicos de genes regulados diferencialmente (IL-2+ regulado al alza en SR, y/o SEN e IL-2+ regulado a la baja en SR y/o SEN) se relacionaron mediante redes en las que los nodos corresponden a las rutas, y los bordes corresponden a la presencia de genes compartidos entre rutas.Differential gene expression analysis between library pairs was performed using the GFOLD v1.1.3 program, Feng J, Meyer Ca, Wang Q, Liu JS, Shirley Liu X, et al. (2012) GFOLD: a generalized fold change for ranking differentially expressed genes from RNA-seq data. Bioinformatics 28: 2782-2788. GFOLD was chosen based on its demonstrated superior performance in characterizing differentially expressed genes in the absence of replicate data sets. GFOLD analysis produces a score that measures the degree of differential gene expression between conditions; here the recommended GFOLD score cutoff of ±0.01 was used to define differentially expressed genes. Functional enrichment analysis for differentially expressed genes between library pairs was performed using the GSEA v2.1.0 program. Specifically, single pathways containing multiple genes that are upregulated or downregulated with IL-2 treatment in SR, SEN, or both, were thus identified. Individual pathways for specific sets of differentially regulated genes (IL-2+ upregulated in SR, and/or SEN and IL-2+ downregulated in SR and/or SEN) were related via networks in which nodes correspond to pathways, and the edges correspond to the presence of shared genes between pathways.
La FIG. 9 muestra la respuesta a la dosis del Consorcio de Controles de ARN Externos (ERCC, un conjunto común de controles de ARN externos) usada para el control de calidad de los experimentos de RNA-seq. Para cada uno de los cuatro grupos de RNA-seq específicos de la condición, los recuentos esperados de secuencias de ARN de agregado de ERCC se compararon con los recuentos observados de etiquetas de RNA-seq que se asignan a las mismas secuencias. Los recuentos observados frente a los esperados estaban altamente correlacionados, como lo indica la forma de la regresión y los valores r de correlación de Pearson, consistente con los resultados de RNA-seq de alta calidad.FIG. 9 shows the dose response of the External RNA Controls Consortium (ERCC, a common set of external RNA controls) used for quality control of RNA-seq experiments. For each of the four condition-specific RNA-seq pools, the expected counts of ERCC aggregate RNA sequences were compared to the observed counts of RNA-seq tags that map to the same sequences. The observed versus expected counts were highly correlated, as indicates the shape of the regression and Pearson's correlation r-values, consistent with high-quality RNA-seq results.
Ejemplo 2: Caracterización del fenotipo senescente de MSCExample 2: Characterization of the senescent phenotype of MSC
En este ejemplo se describe un estudio que se realizó para evaluar el impacto de la senescencia replicativa en la actividad transcripcional de las MSC derivadas de tejido adiposo humano (hADSC) en respuesta a la señalización de IL-2.This example describes a study that was performed to assess the impact of replicative senescence on the transcriptional activity of human adipose-derived MSCs (hADSCs) in response to IL-2 signaling.
IL-2 señaliza a través de receptores específicos, con tres clases de receptores de superficie celular formadas por diversas combinaciones de tres subunidades de IL-2R: IL-2Ra (CD25), IL-2RP (CD 122) e IL-2Rg (CD 132). Los resultados experimentales indican que las hADSC expresan transcripcionalmente los tres receptores; sin embargo, la expresión de proteína del IL-2Ra (IL-2Ra) en las hADSC es menor que la observada para IL-2RP. Estas observaciones indican que una composición de receptor de IL-2 que consiste en las isoformas IL-2RP e IL-2Rg podría mediar en la forma predominante de reconocimiento de la citocina IL-2 por parte de las hADSC. La composición del receptor cambia solo ligeramente con el envejecimiento replicativo de las hADSC, lo que indica que la capacidad de respuesta de las hADSC a IL-2 no cambia con su senescencia.IL-2 signals through specific receptors, with three classes of cell-surface receptors made up of various combinations of three IL-2R subunits: IL-2Ra (CD25), IL-2RP (CD 122), and IL-2Rg (CD 132). Experimental results indicate that hADSCs transcriptionally express all three receptors; however, IL-2Ra (IL-2Ra) protein expression in hADSCs is lower than that observed for IL-2RP. These observations indicate that an IL-2 receptor composition consisting of IL-2RP and IL-2Rg isoforms could mediate the predominant form of IL-2 cytokine recognition by hADSCs. The receptor composition changes only slightly with replicative aging of hADSCs, indicating that the responsiveness of hADSCs to IL-2 does not change with their senescence.
Las hADSC se aislaron y cultivaron como se describe anteriormente. La senescencia replicativa ex vivo condujo a una disminución de la proliferación, acumulación de daños en el ADN, y cambios morfológicos: las hADSC se volvieron mucho más grandes, con una forma irregular y plana, y los núcleos se volvieron más circunscritos en microscopía de contraste de fase, con la aparición en el citoplasma granular de muchas inclusiones y ampliaciones. La curva de crecimiento de las hADSC obtenidas de dos pacientes diferentes se muestra en la FIG. 3A. La tinción típica para la actividad de P galactosidasa asociada a la senescencia SA para las hADSC en tasa de crecimiento lineal, SR, o cuando las líneas celulares cesan su proliferación, SEN, se muestra en la FIG. 3B.hADSCs were isolated and cultured as described above. Ex vivo replicative senescence led to decreased proliferation, accumulation of DNA damage, and morphological changes: hADSCs became much larger, irregularly shaped and flat, and nuclei became more circumscribed on contrast microscopy. of phase, with the appearance in the granular cytoplasm of many inclusions and enlargements. The growth curve of hADSC obtained from two different patients is shown in FIG. 3A. Typical staining for SA senescence-associated P-galactosidase activity for hADSCs at linear growth rate, SR, or when cell lines cease proliferation, SEN, is shown in FIG. 3B.
Ejemplo 3: Las SEN-MSC demuestran una mayor propensión a la migraciónExample 3: SEN-MSCs demonstrate a higher propensity to migrate
Este ejemplo muestra que la senescencia replicativa afecta el potencial migratorio de las hADSC. Se realizaron ensayos de migración usando un conjunto de citocinas y factores de crecimiento usando el sistema Transwell como se describe en la sección de Materiales y Métodos, a continuación. Se observó que las MSC derivadas de tejido adiposo que experimentaban senescencia replicativa demostraron una mayor propensión a la migración. Se observó que las hADSC SEN mostraban una capacidad de migración basal significativamente mayor que sus equivalentes SR (FIG. 3C). La FIG. 3C muestra ensayos de migración ex vivo para las hADSC que se autorrenuevan (SR, a la izquierda) y senescentes (SEN, a la derecha). Las líneas negras indican los valores medianos, y los bigotes indican el intervalo de valores. Las diferencias estadísticas se evaluaron mediante una prueba de la t con el valor de p (p) como se muestra.This example shows that replicative senescence affects the migratory potential of hADSCs. Migration assays using a suite of cytokines and growth factors were performed using the Transwell system as described in the Materials and Methods section, below. It was observed that adipose-derived MSCs undergoing replicative senescence demonstrated an increased propensity for migration. SEN hADSCs were found to exhibit a significantly higher basal migration capacity than their SR counterparts (FIG. 3C). FIG. 3C shows ex vivo migration assays for self-renewing (SR, left) and senescent (SEN, right) hADSCs. The black lines indicate the median values, and the whiskers indicate the range of values. Statistical differences were assessed by t-test with p-value (p) as shown.
Además, se midió la respuesta de las hADSC SEN a diferentes quimioatrayentes de citocinas. Se observó que las hADSC tienen una mayor capacidad para migrar para pasadas tardías en comparación con pasadas tempranas (FIG.In addition, the response of hADSC SEN to different cytokine chemoattractants was measured. hADSCs were found to have a greater ability to migrate for late passages compared to early passages (FIG.
3D), lo que indica que la senescencia replicativa aumenta las propiedades migratorias de las hADSC en respuesta a los quimioatrayentes ensayados. IL-2 fue el estimulante de quimiotaxis más potente en las SEN-MSC, mientras que TNF-a fue menos potente entre los quimioatrayentes ensayados en estos experimentos (FIG. 3D). La FIG. 3D muestra la migración de las hADSC que se autorrenuevan SR (a la izquierda) y de senescencia SEN (derecha). Se indujo la migración de las hADSC en presencia de diferentes citocinas (50 ng/ml de IL-2, IL-6, IL-8, HMGB1; 30 ng/ml de TNF). El gráfico representa la media de diez experimentos independientes (n=10). Los valores de p (p) relacionados con las medidas experimentales se enumeran debajo de los gráficos.3D), indicating that replicative senescence increases the migratory properties of hADSCs in response to the tested chemoattractants. IL-2 was the most potent chemotaxis stimulant in SEN-MSCs, while TNF-α was least potent among the chemoattractants tested in these experiments (FIG. 3D). FIG. 3D shows the migration of self-renewing SR (left) and senescent SEN (right) hADSCs. hADSC migration was induced in the presence of different cytokines (50 ng/ml IL-2, IL-6, IL-8, HMGB1; 30 ng/ml TNF). The graph represents the mean of ten independent experiments (n=10). The p-values (p) related to the experimental measurements are listed below the graphs.
Estos datos indicaron que la senescencia replicativa modifica las propiedades migratorias de las hADSC, y puede influir en la respuesta de las MSC al entorno inflamatorio e influir en su resultado de inmunomodulación.These data indicated that replicative senescence modifies the migratory properties of hADSCs, and may influence the response of MSCs to the inflammatory environment and influence their immunomodulation outcome.
Ejemplo 4: Respuesta diferencial a la estimulación con IL-2 en las MSC derivadas de tejido adiposo humano tras la senescencia replicativaExample 4: Differential response to IL-2 stimulation in human adipose-derived MSCs after replicative senescence
La evaluación de la expresión de las isoformas del receptor de IL-2, mediante Q-PCR, demostró cambios significativos en la expresión de la isoforma IL-2Ra en comparación con IL-2Rg e IL-2RP tras la senescencia replicativa ex vivo (FIG.Evaluation of IL-2 receptor isoform expression by Q-PCR demonstrated significant changes in IL-2Ra isoform expression compared to IL-2Rg and IL-2RP after ex vivo replicative senescence (FIG. .
4B). La FIG. 4B muestra los receptores a, P y g de IL-2, evaluados mediante PCR cuantitativa (Q-PCR), en células SR no estimuladas (IL-2-) (primera barra) y células SEN (tercera barra), y tras estimulación con 20 ug/ml de IL-2 recombinante (IL-2+) (células SR, segunda barra; células SEN, cuarta barra). Datos mostrados como número de veces de cambio (AACT). Se muestra la media ± SD de tres experimentos independientes. En particular, el aumento de la acumulación de los transcritos de IL-2RP e IL-2Ra se registró después del tratamiento con IL-2 en las hADSC tanto SR como SEN, mientras que la expresión de IL-2Ra se anuló cuando las células senescentes se sometieron a tratamientos similares (FIG. 4B).4B). FIG. 4B shows IL-2 receptors a, P and g , evaluated by quantitative PCR (Q-PCR), in unstimulated SR cells (IL-2-) (first bar) and SEN cells (third bar), and after stimulation. with 20 ug/ml recombinant IL-2 (IL-2+) (SR cells, second bar; SEN cells, fourth bar). Data displayed as number of times of change (AACT). The mean ± SD of three independent experiments is shown. Notably, increased accumulation of IL-2RP and IL-2Ra transcripts was recorded after IL-2 treatment in both SR and SEN hADSCs, whereas IL-2Ra expression was abrogated when senescent cells. were subjected to similar treatments (FIG. 4B).
Sin embargo, los datos indicaron que la expresión del nivel de proteína del receptor de IL-2Ra asociado a la membrana celular mostró el patrón opuesto (FIG. 4C). La FIG. 4C muestra los niveles asociados a la membrana celular de IL-2Ra e IL-2RP. Los niveles se cuantificaron mediante ELISA en las hADSC no estimuladas (IL-2-) SEN (tercera barra) y SR (primera barra), y tras la estimulación con 20 ug/ml de IL-2 recombinante (IL-2+) SEN (cuarta barra) y SR (segunda barra). Los datos se expresan como picogramo por mililitro. Los resultados son la media de tres experimentos independientes (media ± SD). La significancia estadística se estimó mediante una prueba de la t, en la que ***p<0,001, **p<0,01, *p<0,05.However, the data indicated that the protein level expression of the cell membrane associated IL-2Ra receptor showed the opposite pattern (FIG. 4C). FIG. 4C shows the cell membrane associated levels of IL-2Ra and IL-2RP. Levels were quantified by ELISA in unstimulated hADSC (IL-2-)SEN (third bar) and SR (first bar), and after stimulation with 20 ug/ml recombinant IL-2 (IL-2+) SEN (fourth bar) and SR (second bar). Data is expressed as picogram per milliliter. Results are the mean of three independent experiments (mean ± SD). Statistical significance was estimated using a t-test, where ***p<0.001, **p<0.01, *p<0.05.
Aunque el estado transcripcional de las isoformas del receptor de IL-2 varía entre los dos estados celulares diferentes (SR y SEN), no parece depender de la exposición a IL-2 (inducción) según lo medido por el ensayo ELISA (descrito en Materiales y Métodos, más arriba). Los datos también demostraron que la proteína que codifica la cadena del receptor de IL-2a es menos abundante que la isoforma de IL-2RP (compárese 120 pg/ml de IL-2Ra con 350 pg/ml de IL-2RP con 150 pg/ml de IL-2Ra y 440 pg/ml de IL-2RP tras la senescencia replicativa ex vivo) como se muestra en la FIG. 4C. Estos datos indican que la respuesta de las hADSC a la estimulación con IL-2 se produce a través del dímero del receptor de afinidad intermedia compuesto por IL-2RP (CD 122) y la IL-2Rg común (CD 132).Although the transcriptional state of IL-2 receptor isoforms varies between the two different cellular states (SR and SEN), it does not appear to depend on IL-2 exposure (induction) as measured by ELISA assay (described in Materials and Methods, above). The data also showed that the protein encoding the IL-2a receptor chain is less abundant than the IL-2RP isoform (compare 120 pg/ml IL-2Ra with 350 pg/ml IL-2RP with 150 pg/ml). ml IL-2Ra and 440 pg/ml IL-2RP after replicative senescence ex vivo) as shown in FIG. 4C. These data indicate that the response of hADSCs to IL-2 stimulation is via the intermediate affinity receptor dimer composed of IL-2RP (CD 122) and the common IL-2Rg (CD 132).
IL-2 señaliza a través de JAK1 y JAK3 para activar STAT5A y STAT5B, y además usa rutas de señalización dependientes de Ras-MAP cinasa y fosfoinositol 3-cinasa. La expresión de la diana aguas abajo de IL-2, STAT5, se muestra en las FIGS. 5, 7A y 7B, y en la tabla de las FIGS. 10A y 10B. En las hADSC, la transcripción tanto del gen STAT5A como STAT5B sigue el eje de señalización IL-2/STAT5.IL-2 signals through JAK1 and JAK3 to activate STAT5A and STAT5B, and also uses Ras-MAP kinase and phosphoinositol 3-kinase-dependent signaling pathways. Expression of the downstream target of IL-2, STAT5, is shown in FIGS. 5, 7A and 7B, and in the table of FIGS. 10A and 10B. In hADSCs, transcription of both the STAT5A and STAT5B genes follows the IL-2/STAT5 signaling axis.
La FIG. 5 ilustra el efecto de la estimulación de las hADSC SR y SEN con IL-2. IL-2 regula al alza el ARNm de un mediador de IL-2 que señaliza al gen STAT5. La expresión de ARNm de STAT5A y STAT5B se evaluó mediante RT-PCR cuantitativa en células SR (primera barra) y SEN (tercera barra) no estimuladas (IL-2-), y tras la estimulación con 20 ug/ml de IL-2 recombinante (IL-2+) (SR IL-2, segunda barra; SEN IL-2, tercera barra). Los datos se muestran como número de veces de cambio (AACT). Se muestra la media ± SD de tres experimentos independientes. La posición de los cebadores de Q-PCR se representa gráficamente. La significancia estadística se estimó mediante la prueba de la t, en la que ***p<0,001, **p<0,01.FIG. 5 illustrates the effect of stimulation of SR and SEN hADSCs with IL-2. IL-2 upregulates the mRNA of an IL-2 mediator that signals the STAT5 gene. STAT5A and STAT5B mRNA expression was assessed by quantitative RT-PCR in unstimulated (IL-2-) SR (first bar) and SEN (third bar) cells, and after stimulation with 20 ug/ml IL-2 recombinant (IL-2+) (SR IL-2, second bar; SEN IL-2, third bar). Data is shown as number of times of change (AACT). The mean ± SD of three independent experiments is shown. The position of the Q-PCR primers is plotted. Statistical significance was estimated using the t-test, where ***p<0.001, **p<0.01.
A continuación, se investigó cómo IL-2 y su diana aguas abajo STAT5 afectan los resultados transcripcionales en las hADSC tras su senescencia replicativa ex vivo. Next, we investigated how IL-2 and its downstream target STAT5 affect transcriptional outcomes in hADSCs after ex vivo replicative senescence.
La exposición a IL-2 dio como resultado una expresión génica alterada en las MSC humanas tras la senescencia replicativa. Para abordar cómo la respuesta transcripcional al eje IL-2/STAT5 cambia con el envejecimiento replicativo de las hADSC ex vivo, se realizó un análisis del transcriptoma RNA-seq, usando el sistema Ion Proton™ como se describe en el Ejemplo 1 y como se muestra en la FIG. 8A. Se compararon los niveles de expresión génica en las hADSC en cuatro condiciones (bibliotecas): autorrenovación tras cultivo ex vivo normal (SR IL-2-), autorrenovación tras 24 horas de estimulación con IL-2 recombinante (SR IL-2+), senescencia replicativa tras cultivo ex vivo normal (SEN IL-2-), y senescencia replicativa tras 24 horas de estimulación con IL-2 recombinante (SEN IL-2+). Las distribuciones de los recuentos de lectura totales para las cuatro condiciones que representan cada condición se muestran en la FIG. 8B.IL-2 exposure resulted in altered gene expression in human MSCs following replicative senescence. To address how the transcriptional response to the IL-2/STAT5 axis changes with replicative aging of hADSCs ex vivo, RNA-seq transcriptome analysis was performed, using the Ion Proton™ system as described in Example 1 and as shown in FIG. 8A. Gene expression levels in hADSCs were compared under four conditions (libraries): self-renewal after normal ex vivo culture (SR IL-2-), self-renewal after 24 hours of stimulation with recombinant IL-2 (SR IL-2+), replicative senescence after normal ex vivo culture (SEN IL-2-), and replicative senescence after 24 hours of stimulation with recombinant IL-2 (SEN IL-2+). The distributions of total read counts for the four conditions representing each condition are shown in FIG. 8B.
Los niveles de expresión de beta-actina se usaron para normalizar los niveles de expresión génica entre condiciones (como se describe en el Ejemplo 1). Este enfoque se tomó para tener en cuenta el hecho de que los niveles globales de expresión génica pueden cambiar con el tratamiento con IL-2. Las distribuciones de expresión génica normalizadas a beta-actina revelan una regulación al alza general de la expresión génica tras el tratamiento con IL-2 en los estados tanto SR como SEN (FIG. 8D). Sin embargo, la comparación de los niveles de expresión de genes individuales entre las cuatro condiciones indica que el tratamiento con IL-2 afecta más significativamente a las hADSC SEN en comparación con las hADSC SR (FIG. 6A). La FIG. 6A muestra un agrupamiento jerárquico que muestra la distancia por pares entre condiciones en base a la comparación de perfiles de expresión génica específicos de la condición. Las condiciones SR IL-2- y SR IL-2+ se agrupan estrechamente cuando se comparan los niveles de expresión de genes individuales seguidos por la condición SEN IL-2-. La condición SEN IL-2+ es un valor atípico entre las cuatro condiciones que muestra un patrón sustancialmente divergente de los niveles de expresión de genes individuales. Esto indica que la respuesta biológica al tratamiento con IL-2 en las hADSC tras la senescencia puede impedir significativamente la función de las MSC a través de la desregulación transcripcional global en respuesta a IL-2.Beta-actin expression levels were used to normalize gene expression levels between conditions (as described in Example 1). This approach was taken to account for the fact that overall levels of gene expression may change with IL-2 treatment. Gene expression distributions normalized to beta-actin reveal a general upregulation of gene expression following IL-2 treatment in both SR and SEN states (FIG. 8D). However, comparison of individual gene expression levels among the four conditions indicates that IL-2 treatment more significantly affects SEN hADSCs compared to SR hADSCs (FIG. 6A). FIG. 6A shows a hierarchical cluster showing the pairwise distance between conditions based on comparison of condition-specific gene expression profiles. The SR IL-2- and SR IL-2+ conditions cluster closely when comparing the expression levels of individual genes followed by the SEN IL-2- condition. The SEN IL-2+ condition is an outlier among the four conditions showing a substantially divergent pattern of expression levels of individual genes. This indicates that the biological response to IL-2 treatment in hADSCs after senescence can significantly impede MSC function through global transcriptional dysregulation in response to IL-2.
Los niveles de expresión se compararon adicionalmente entre condiciones para identificar genes individuales que se expresan diferencialmente, regulados al alza y a la baja, en respuesta al tratamiento con IL-2 en estados tanto SR como SEN (FIG. 6B). La FIG. 6B es un diagrama de Venn que muestra los números de genes que están regulados al alza y regulados a la baja tras el tratamiento con IL-2. Hay varios genes más que están regulados al alza (8.866) en comparación con los regulados a la baja (2.296) tras el tratamiento con IL-2 en las hADSC tanto SR como SEN. También hay una proporción sustancialmente mayor de genes que están regulados al alza en las hADSC tanto SR como SEN (35%) en comparación con los genes que están regulados a la baja en ambos estados (4%). La mayor asimetría se observa para genes que están regulados a la baja en las hADSC SEN tras el tratamiento con IL-2 (1.739); hay muchos más genes de este tipo que los observados para la condición SR IL-2+ (649). Esta diferencia indica que la divergencia global de la condición SEN IL-2+ se atribuye en gran medida a los genes que se regulan a la baja con el tratamiento con IL-2, lo cual es un resultado inesperado dada la regulación al alza global tanto en SR como en SEN tras el tratamiento con IL-2 (FIG. 6B y FIG. 8D). Expression levels were further compared between conditions to identify individual genes that are differentially expressed, upregulated and downregulated, in response to IL-2 treatment in both SR and SEN states (FIG. 6B). FIG. 6B is a Venn diagram showing the numbers of genes that are upregulated and downregulated following IL-2 treatment. There are several more genes that are upregulated (8,866) compared to downregulated (2,296) after IL-2 treatment in both SR and SEN hADSCs. There is also a substantially higher proportion of genes that are upregulated in both SR and SEN hADSCs (35%) compared to genes that are downregulated in both states (4%). The greatest asymmetry is observed for genes that are downregulated in SEN hADSCs after IL-2 treatment (1739); there are many more genes of this type than those observed for the SR IL-2+ condition (649). This difference indicates that the global divergence from SEN IL-2+ condition is largely attributed to genes that are downregulated with IL-2 treatment, which is an unexpected result given the global upregulation of both in SR as in SEN after treatment with IL-2 (FIG. 6B and FIG. 8D).
Las FIGS. 6C-6D muestran mapas de calor que muestran los niveles de expresión de genes que están regulados al alza (FIG. 6C) y regulados a la baja (FIG. 6D) tras el tratamiento con IL-2. Los niveles de expresión génica normalizados se muestran como mapas de calor en escala de grises. Los grupos corresponden a genes que están regulados al alza o a la baja en SR solo, en SEN solo, o en ambas condiciones.FIGS. 6C-6D show heat maps showing the expression levels of genes that are upregulated (FIG. 6C) and downregulated (FIG. 6D) following IL-2 treatment. Normalized gene expression levels are shown as grayscale heatmaps. Clusters correspond to genes that are upregulated or downregulated in SR alone, in SEN alone, or in both conditions.
Tomados en conjunto, estos datos indican que las hADSC SEN han perdido la capacidad de generar cambios regulatorios coordinados en respuesta al tratamiento con IL-2 en la misma medida que existe para las células SR que proliferan de forma activa. El mayor número de genes regulados al alza observados para SR IL-2+, en comparación con SEN IL-2-, es consistente con esta interpretación.Taken together, these data indicate that SEN hADSCs have lost the ability to generate coordinated regulatory changes in response to IL-2 treatment to the same extent that it exists for actively proliferating SR cells. The higher number of upregulated genes observed for SR IL-2+, compared to SEN IL-2-, is consistent with this interpretation.
Se proporcionan aquí rutas enriquecidas con el tratamiento con IL. La FIG. 10A muestra una tabla (FIG. 10A) que indica rutas biológicas enriquecidas para genes regulados al alza tras el tratamiento con IL-2 en las hADSC SR y SEN. En la FIG. 10A, las rutas enriquecidas se muestran junto con los genes regulados al alza de IL-2+ individuales que pertenecen a la ruta y los niveles de significancia del enriquecimiento de la ruta. Las rutas con miembros de genes regulados al alza en SR se muestran en la columna de la izquierda, y las rutas con miembros de genes regulados al alza en SEN se muestran en la columna de la derecha. Las rutas con miembros de genes regulados al alza tanto en SR como en SEN se muestran en la fila superior, seguidas de rutas con miembros de genes regulados al alza solo en SEN, y finalmente rutas con miembros de genes regulados al alza solo en SR. Se muestran redes que relacionan rutas que están reguladas al alza en SR (columna izquierda) y rutas que están reguladas al alza en SEN (columna derecha). Los nodos de la red representan rutas, y los tamaños de los nodos corresponden al número de genes regulados al alza en esa ruta. Los nodos de la ruta están conectados por bordes si las rutas comparten genes regulados al alza, y los pesos de los bordes corresponden al número de genes regulados al alza compartidos entre las rutas.Routes enriched with IL treatment are provided here. FIG. 10A shows a table (FIG. 10A) indicating enriched biological pathways for upregulated genes after IL-2 treatment in SR and SEN hADSCs. In FIG. 10A, enriched pathways are shown along with individual IL-2+ upregulated genes belonging to the pathway and significance levels of pathway enrichment. Pathways with upregulated gene members in SR are shown in the left column, and pathways with upregulated gene members in SEN are shown in the right column. Pathways with upregulated gene members in both SR and SEN are shown in the top row, followed by pathways with upregulated gene members only in SEN, and finally pathways with upregulated gene members only in SR. Networks are shown that relate routes that are upregulated in SR (left column) and routes that are upregulated in SEN (right column). The nodes of the network represent pathways, and the sizes of the nodes correspond to the number of upregulated genes in that pathway. Pathway nodes are connected by edges if the pathways share upregulated genes, and the edge weights correspond to the number of upregulated genes shared between the pathways.
La FIG. 10B es una tabla (FIG. 10B) que ilustra rutas biológicas enriquecidas para genes regulados a la baja tras el tratamiento con IL-2 en las hADSC SR y SEN. Las rutas enriquecidas se muestran junto con los genes regulados a la baja de IL-2+ individuales que pertenecen a la ruta y los niveles de importancia del enriquecimiento de la ruta. Las rutas con miembros de genes regulados a la baja en SR se muestran en la columna de la izquierda, y las rutas con miembros de genes regulados a la baja en SEN se muestran en la columna de la derecha. Las rutas con miembros de genes regulados a la baja tanto en SR como en SEN se muestran en la fila superior, seguidas de rutas con miembros de genes regulados a la baja solo en SEN, y finalmente rutas con miembros de genes regulados a la baja solo en SR. Se muestra una red que relaciona rutas que están reguladas a la baja en SEN (columna izquierda). Los nodos de la red representan rutas, y los tamaños de los nodos corresponden al número de genes regulados a la baja en SEN en esa ruta. Los nodos de la ruta están conectados por bordes si las rutas comparten genes regulados a la baja en SEN, y los pesos de los bordes corresponden al número de genes regulados a la baja compartidos entre las rutas.FIG. 10B is a table (FIG. 10B) illustrating enriched biological pathways for down-regulated genes following IL-2 treatment in SR and SEN hADSCs. The enriched pathways are shown along with the individual IL-2+ downregulated genes belonging to the pathway and the levels of importance of the pathway enrichment. Pathways with downregulated gene members in SR are shown in the left column, and pathways with downregulated gene members in SEN are shown in the right column. Pathways with downregulated gene members in both SR and SEN are shown in the top row, followed by pathways with downregulated gene members only in SEN, and finally pathways with downregulated gene members only in SR. A network is shown that relates routes that are down-regulated in SEN (left column). Network nodes represent pathways, and node sizes correspond to the number of SEN downregulated genes in that pathway. Pathway nodes are connected by edges if the pathways share downregulated genes in SEN, and the edge weights correspond to the number of downregulated genes shared between the pathways.
Ejemplo 5: Las propiedades tróficas de las hADSC después de la estimulación con IL-2 son susceptibles al envejecimiento replicativo Example 5: Trophic properties of hADSCs after IL-2 stimulation are susceptible to replicative aging ex vivoex vivo
Las FIGS. 7A-7D ilustran los niveles de expresión génica para células SR y SEN tras el tratamiento con IL-2 entre conjuntos de genes funcionalmente coherentes. Los niveles de expresión se muestran para conjuntos de genes caracterizados como (en la FIG. 7A) factores tróficos, (en la FIG. 7B) antiinflamatorios e inmunomoduladores, (como se muestra en la FIG. 7C) antiapoptóticos y promotores de metástasis, y (como se muestra en la FIG. 7D) promotores de la migración y la angiogénesis. Los niveles de expresión génica normalizados se muestran como mapas de calor en escala de grises.FIGS. 7A-7D illustrate gene expression levels for SR and SEN cells following IL-2 treatment among functionally consistent sets of genes. Expression levels are shown for gene sets characterized as (in FIG. 7A) trophic factors, (in FIG. 7B) anti-inflammatory and immunomodulatory, (as shown in FIG. 7C) antiapoptotic and metastasis promoters, and (as shown in FIG. 7D) promoters of migration and angiogenesis. Normalized gene expression levels are shown as grayscale heatmaps.
Las propiedades tróficas de las MSC después de la exposición a IL-2 son susceptibles al envejecimiento replicativo ex vivo (por ejemplo, FIG. 7A, Tabla 1). Se cree que la secreción de una amplia gama de moléculas bioactivas es el principal mecanismo por el cual las MSC logran sus efectos terapéuticos. Las MSC segregan un conjunto de factores de crecimiento y proteínas antiinflamatorias con mecanismos de retroalimentación complejos entre los muchos tipos de células inmunitarias.The trophic properties of MSCs after IL-2 exposure are susceptible to ex vivo replicative aging (eg, FIG. 7A, Table 1). Secretion of a wide range of bioactive molecules is thought to be the main mechanism by which MSCs achieve their therapeutic effects. MSCs secrete an array of growth factors and anti-inflammatory proteins with complex feedback mechanisms between the many types of immune cells.
La Tabla 1 muestra la expresión diferencial de factores tróficos tras el tratamiento con IL-2 en células SEN y SR. Los valores GFOLD de SR representan la diferencia en veces en las células SR tratadas con IL-2, con respecto a las células SR no tratadas con IL-2; los valores GFOLD de SEN representan la diferencia en veces en las células SEN tratadas con IL-2, con respecto a las células SEN no tratadas con IL-2. Table 1 shows the differential expression of trophic factors after IL-2 treatment in SEN and SR cells. SR GFOLD values represent the fold difference in IL-2 treated SR cells, relative to non-IL-2 treated SR cells; SEN GFOLD values represent the fold difference in IL-2 treated SEN cells, relative to non-IL-2 treated SEN cells.
T a b la 1: E x p re s ió n d ife re n c ia l d e fa c to re s t ró f ic o s t ra s e l t ra ta m ie n to c o n IL -2T a b le 1: D e f e r e n t ia l E x p re s io n o f th e s t r o ph ic fa c to rs a er il-2 treatmen t
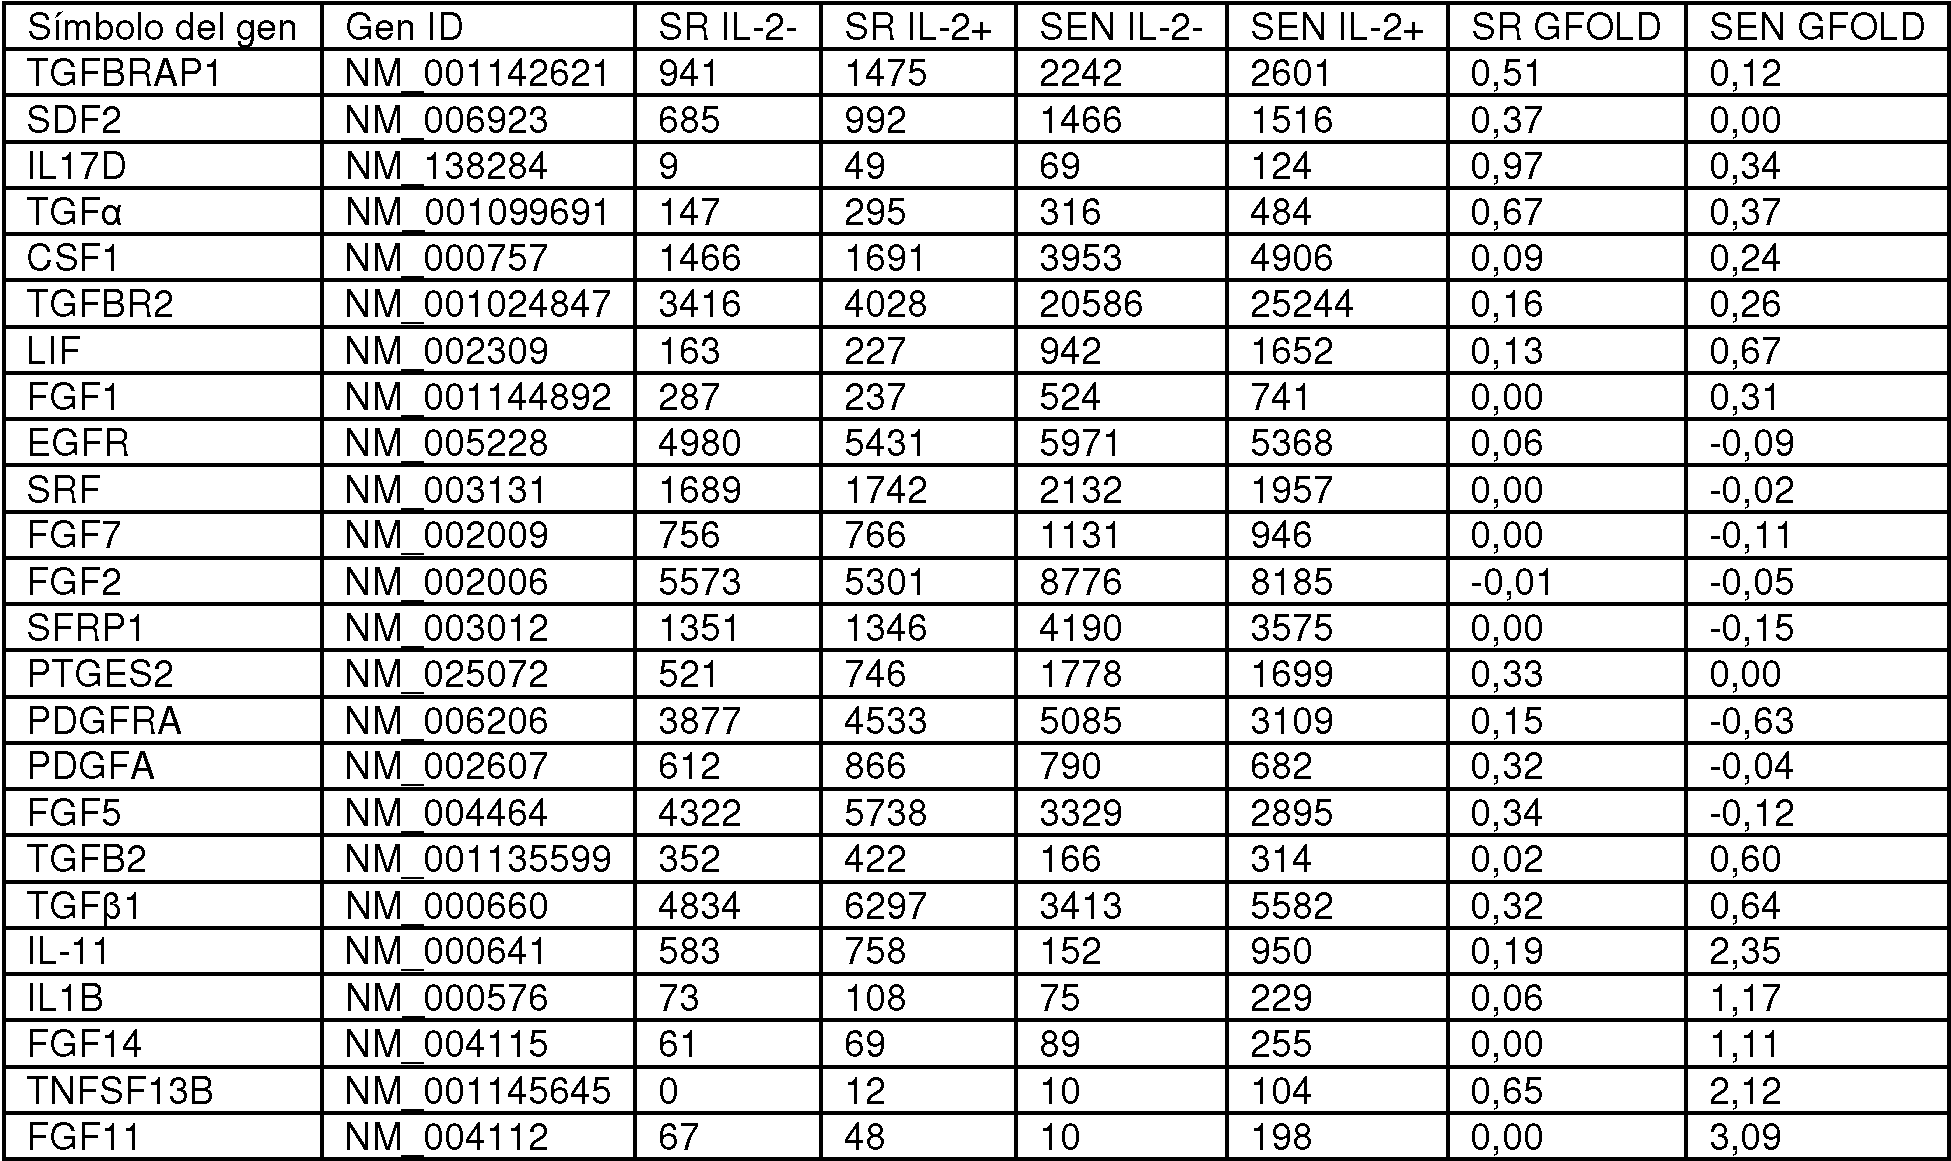
Los datos indicaron que la expresión de factores de crecimiento en las hADSC tras la estimulación con IL-2 está sujeta a cambios significativos tras la senescencia replicativa ex vivo. Mientras que la exposición de las hADSC de proliferación activa (SR) a IL-2 dio como resultado una mayor expresión de proteínas mitógenas, tales como el factor 2 derivado de células estromales (SDF2) y SDFL2, y la prostaglandina E sintetasa 2 (PTGES2), las hADSC tanto SR como SEN se caracterizan por aumentos significativos de los factores de crecimiento transformante alfa y beta (TGFa, TGFp1 y TGFp2), el receptor del factor de crecimiento transformante beta TGFBR2, y la proteína asociada al receptor del factor de crecimiento transformante beta TGFBRAP1, así como la proteína inducida por el factor de crecimiento transformante beta (TGFBI), que se sabe que aumentan la división de fibroblastos, células epiteliales y endoteliales cuando se segregan en un medio sistémico (FIG. 7A y Tablas 5A-5D).The data indicated that growth factor expression in hADSCs following IL-2 stimulation is subject to significant changes following replicative senescence ex vivo. While exposure of actively proliferating (SR) hADSCs to IL-2 resulted in increased expression of mitogenic proteins, such as stromal cell-derived factor 2 (SDF2) and SDFL2, and prostaglandin E synthetase 2 (PTGES2). ), both SR and SEN hADSCs are characterized by significant increases in transforming growth factors alpha and beta (TGFa, TGFp1, and TGFp2), transforming growth factor receptor beta TGFBR2, and growth factor receptor-associated protein transforming growth factor beta TGFBRAP1, as well as transforming growth factor beta-induced protein (TGFBI), which are known to increase the division of fibroblasts, epithelial and endothelial cells when secreted into a systemic medium (FIG. 7A and Tables 5A-5D ).
Además, las hADSC estimuladas con IL-2 tanto SR como SEN se caracterizaron por una regulación al alza del factor estimulante de colonias 1 (CSF-1), LIF, IL-11, IL-17D, IL-1 p, y la superfamilia del factor de necrosis tumoral (ligando) TNFSF13B, un gen que codifica una citocina que estimula la función de las células B y T (FIGS. 7A, 7B, y FIGS. 10A-10B).Furthermore, both SR and SEN IL-2-stimulated hADSCs were characterized by upregulation of colony-stimulating factor 1 (CSF-1), LIF, IL-11, IL-17D, IL-1 p, and the superfamily of tumor necrosis factor (ligand) TNFSF13B, a gene that encodes a cytokine that stimulates B and T cell function (FIGS. 7A, 7B, and FIGS. 10A-10B).
Teniendo en cuenta que la IL-17D paracrina induce la expresión de los genes IL-6, IL-8 y GM-CSF en las células endoteliales, y que la IL-1 p estimula la actividad del factor de crecimiento de fibroblastos (los genes TGFa, TGFp1 y TGFp2 están notablemente sobrerregulados en las hADSC expuestas a IL-2) de forma autocrina y paracrina, junto con la proliferación y maduración de timocitos y células B al inducir la liberación de IL-2 de estas células, los datos indican que el estado transcripcional de las hADSC tanto SR como SEN puede apuntar a propiedades inmunomoduladoras mejoradas de estas células después de la exposición a IL-2 a través de un circuito de retroalimentación regulatorio complejo.Taking into account that paracrine IL-17D induces the expression of IL-6, IL-8 and GM-CSF genes in endothelial cells, and that IL-1 p stimulates the activity of fibroblast growth factor (genes TGFα, TGFp1, and TGFp2 are markedly upregulated in hADSCs exposed to IL-2) in an autocrine and paracrine manner, along with proliferation and maturation of thymocytes and B cells by inducing IL-2 release from these cells, data indicate that the transcriptional state of both SR and SEN hADSCs may point to enhanced immunomodulatory properties of these cells after IL-2 exposure through a complex regulatory feedback loop.
Las hADSC tanto SR como SEN expuestas a IL-2 se caracterizan por aumentos significativos en la expresión de los factores alfa y beta de crecimiento transformante (TGFa, TGFp1 y TGFp2), el receptor del factor beta de crecimiento transformante TGFBR2, y la proteína asociada al receptor del factor beta de crecimiento transformante TGFBRAP1, así como genes inducidos por el factor de crecimiento transformante beta (TGFBI) (FIG. 7A).Both SR and SEN hADSCs exposed to IL-2 are characterized by significant increases in the expression of transforming growth factors alpha and beta (TGFa, TGFp1, and TGFp2), the transforming growth factor beta receptor TGFBR2, and the associated protein to the transforming growth factor beta receptor TGFBRAP1, as well as genes induced by transforming growth factor beta (TGFBI) (FIG. 7A).
Se proporciona aquí un biomarcador TGFp. Se cree que el TGFp es importante en la regulación del sistema inmunitario al promover la diferenciación de las células T CD4+ e inhibir la vigilancia inmunitaria, imponiendo así la inmunosupresión. Sin embargo, el mayor nivel de expresión de TGFp en MSC humanas derivadas de tejido adiposo después de la exposición a IL-2 podría promover la carcinogénesis. Además, también se observaron diferencias en la expresión dependiente de IL-2 de factores de crecimiento tras la senescencia de hADSC que no se han observado en células SR. Esto incluye la regulación al alza de un subconjunto de miembros de la familia del factor de crecimiento de fibroblastos (FGF 1, FGF 11, FGF 14), acompañada de la regulación a la baja de otros miembros, tales como FGF2, FGF5, FGF7 (FIG. 7A, Tabla 1, y Tablas 5A-5D). A TGFp biomarker is provided herein. TGFp is believed to be important in the regulation of the immune system by promoting differentiation of CD4+ T cells and inhibiting immune surveillance, thus imposing immunosuppression. However, the higher level of expression of TGFp in human MSCs derived from adipose tissue after exposure to IL-2 could promote carcinogenesis. In addition, differences in IL-2-dependent expression of growth factors were also observed following hADSC senescence that have not been observed in SR cells. This includes upregulation of a subset of fibroblast growth factor family members (FGF 1, FGF 11, FGF 14), accompanied by downregulation of other members, such as FGF2, FGF5, FGF7 ( FIG 7A, Table 1, and Tables 5A-5D).
Las hADSC SEN expuestas a IL-2 se caracterizan por la regulación al alza del ARNm de EGF, pero por la regulación a la baja del ARNm a su receptor EGFR, junto con una disminución en la expresión del factor de respuesta sérica SRF y el modulador segregado de la señalización de WNT SFRP1. Curiosamente, la expresión tanto de un potente mitógeno para las células de origen mesenquimatoso que promueve la cicatrización de heridas, PDGFA, como de su receptor, PDGFRA, se suprime significativamente en las hADSC SEN en comparación con las células SR sometidas a exposición a IL-2 (FIG. 7a , FIG. 10A, Tabla 1, y Tablas 5A-5D).IL-2-exposed SEN hADSCs are characterized by upregulation of EGF mRNA, but downregulation of mRNA to its receptor EGFR, along with decreased expression of serum response factor SRF and the modulator secreted from WNT SFRP1 signaling. Interestingly, the expression of both a potent mitogen for cells of mesenchymal origin that promotes wound healing, PDGFA, and its receptor, PDGFRA, is significantly suppressed in SEN hADSCs compared with SR cells subjected to IL- 2 (FIG. 7a, FIG. 10A, Table 1, and Tables 5A-5D).
Estos datos indican diferencias relacionadas con la senescencia en la naturaleza de la respuesta transcripcional mediada por IL-2 en las hADSC que podrían impedir las propiedades inmunomoduladoras de estas células ex vivo y, por último, in vivo. These data indicate senescence-related differences in the nature of the IL-2-mediated transcriptional response in hADSCs that might impede the immunomodulatory properties of these cells ex vivo and ultimately in vivo.
Se muestra un panel de marcadores antiinflamatorios e inmunomoduladores para MSC humanas tratadas con IL-2, IL-2 en combinación con otros fármacos, y expuestas a IL-2 (Tabla 2).A panel of anti-inflammatory and immunomodulatory markers for human MSCs treated with IL-2, IL-2 in combination with other drugs, and exposed to IL-2 is shown (Table 2).
La descripción también contempla la determinación de qué rutas se regulan en respuesta al tratamiento con IL-2. Se analizaron los genes designados como regulados al alza o a la baja en las hADSC SR y SEN tratadas con IL-2, usando un enriquecimiento integrado de conjuntos de genes y un enfoque de red de rutas para capturar la realidad biológica de las respuestas celulares coordinadas a la estimulación con IL-2. Para hacer esto, se identificaron rutas que se enriquecieron estadísticamente para genes regulados al alza o a la baja, y después se escogieron en base a los genes expresados diferencialmente que tienen en común (FIGS. 10A-10B). La representación de la red de rutas se ponderó en función del número de genes expresados diferencialmente en cada ruta y el grado en que las diferentes rutas comparten conjuntos de genes expresados diferencialmente. Este enfoque permitió la identificación de una estructura de red altamente conectada con numerosas rutas funcionalmente relacionadas, así como subestructuras de red funcionalmente relevantes.The disclosure also contemplates determining which pathways are regulated in response to IL-2 treatment. Genes designated as upregulated or downregulated in IL-2-treated SR and SEN hADSCs were analyzed using an integrated gene-set enrichment and pathway network approach to capture the biological reality of coordinated cellular responses to stimulation with IL-2. To do this, pathways that were statistically enriched for upregulated or downregulated genes were identified, and then chosen based on the differentially expressed genes they have in common (FIGS. 10A-10B). The pathway network representation was weighted based on the number of differentially expressed genes in each pathway and the extent to which the different pathways share sets of differentially expressed genes. This approach enabled the identification of a highly connected network structure with numerous functionally related routes, as well as functionally relevant network substructures.
Tras la senescencia de las hADSC, la IL-2 estimula menos las rutas genéticas que promueven la proliferación (ruta del ciclo celular, valor de q = 1,54e-5), lo que impone el punto de control G2 (ruta G2, valor de q = 5,94e-4), p53 (valor de q = 1,18e-2), la ruta principal de transducción de señales MAPK (MAPK, valor de q = 2,42e-4), y su ruta principal del subgrupo ERK (ERK, valor de q = 2,62e-2), que regulan una función celular importante tal como la supervivencia, la migración y la proliferación.After hADSC senescence, IL-2 less stimulates the genetic pathways that promote proliferation (cell cycle pathway, q value = 1.54e-5), which imposes the G2 checkpoint (G2 pathway, value of q = 5.94e-4), p53 (q value = 1.18e-2), the major MAPK signal transduction pathway (MAPK, q value = 2.42e-4), and its major pathway of ERK subgroup (ERK, q value = 2.62e-2), which regulate important cell function such as survival, migration and proliferation.
Los datos también proporcionan información sobre la funcionalidad de las MSC en entornos cancerígenos. Las hADSC tanto SR como SEN expuestas a IL-2 se caracterizan por aumentos significativos en la expresión de los factores alfa y beta de crecimiento transformante (TGFa, TGFP1 y TGFP2), el receptor del factor beta de crecimiento transformante TGFBR2, y la proteína asociada al receptor del factor beta de crecimiento transformante TGFBRAP1, así como genes inducidos por el factor de crecimiento transformante beta (TGFBI) (FIG. 7A).The data also provide insights into the functionality of MSCs in carcinogenic environments. Both SR and SEN hADSCs exposed to IL-2 are characterized by significant increases in the expression of transforming growth factors alpha and beta (TGFa, TGFP1, and TGFP2), the transforming growth factor beta receptor TGFBR2, and the associated protein to the transforming growth factor beta receptor TGFBRAP1, as well as genes induced by transforming growth factor beta (TGFBI) (FIG. 7A).
Las hADSC SEN tratadas con IL-2 muestran que los genes regulados al alza prominentes están enriquecidos para las rutas asociadas con la inflamación (ruta de IL-6, valor de q = 5,55e-3) y la señalización de EGF (valor de q = 2,33e-4), que han demostrado proporcionar ventajas de supervivencia a las MSC. Las hADSC SEN expuestas a IL-2 también se caracterizan por una mayor expresión de IL-1R, IL-6 e IL-12 (FIG. 7B).IL-2 treated SEN hADSCs show that prominent upregulated genes are enriched for pathways associated with inflammation (IL-6 pathway, q value = 5.55e-3) and EGF signaling ( q = 2.33e-4), which have been shown to provide survival advantages to MSCs. SEN hADSCs exposed to IL-2 are also characterized by increased expression of IL-1R, IL-6 and IL-12 (FIG. 7B).
La conexión observada con la ruta del VEGF angiogénico (valor de q = 5,24e-3) (FIG. 10A, lado derecho, y FIG. 7D) y la capacidad mejorada de las hADSC SEN para la migración (FIGS. 3A, 3B) pueden indicar que las SEN-MSC expuestas a IL-2 podrían adquirir las propiedades necesarias para respaldar un entorno tumorigénico y metástasis. Además, la regulación al alza de los genes incluidos en la ruta de la óxido nítrico sintasa (iNOS), ruta NOS1 (valor de q = 8,32e-2), en hADSC tras la senescencia replicativa respalda una vez más que las MSC en proceso de senescencia pueden adquirir propiedades promotoras de metástasis a través de la inmunosupresión.The observed connection to the angiogenic VEGF pathway (q value = 5.24e-3) (FIG. 10A, right side, and FIG. 7D) and the enhanced ability of SEN hADSCs to migrate (FIGS. 3A, 3B ) may indicate that SEN-MSCs exposed to IL-2 might acquire the necessary properties to support a tumorigenic environment and metastasis. In addition, the upregulation of genes included in the nitric oxide synthase (iNOS) pathway, NOS1 pathway (q-value = 8.32e-2), in hADSCs after replicative senescence further supports that MSCs in senescence process can acquire metastasis-promoting properties through immunosuppression.
Las rutas importantes para apoyar la proliferación y la reparación del ADN están reguladas a la baja en las hADCS tras la senescencia: ruta del ciclo celular (valor de q = 2,52e-5), ruta de MCM (valor de q = 1,62e-8), ruta de RB (valor de q = 6,97e-5), ruta de ATM (valor de q = 3,28e-2), ruta de p53 (valor de q = 1,86e-2), mostradas en la FIG. 10B. En general, los datos indicaron que hay más rutas biológicas sujetas a la regulación a la baja desencadenada por IL-2 en la senescencia que en la autorrenovación, y estas rutas biológicas están interconectadas (FIG. 10B), vinculando aún más un deterioro fisiológico de la respuesta a IL-2 tras el envejecimiento replicativo de las hADSC, lo que indica que tal deterioro podría ser una parte integral de la función desviada de las células madre derivadas de tejido adiposo in vivo y en las aplicaciones clínicas.Important pathways to support DNA proliferation and repair are downregulated in hADCS after senescence: cell cycle pathway (q-value = 2.52e-5), MCM pathway (q-value = 1, 62e-8), RB route (q value = 6.97e-5), ATM route (q value = 3.28e-2), p53 route (q value = 1.86e-2), shown in FIG. 10B. Overall, the data indicated that there are more biological pathways subject to IL-2-triggered downregulation in senescence than in self-renewal, and these biological pathways are interconnected (FIG. 10B), further linking a physiological impairment of IL-2 response following replicative aging of hADSCs, indicating that such impairment could be an integral part of the deviant function of adipose-derived stem cells in vivo and in clinical applications.
Los datos proporcionan una lista de dianas de marcadores moleculares críticas para la evaluación de eventos inmunomoduladores y antiinflamatorios y para tomar decisiones informativas para priorizar el uso de MSC autólogas o alogénicas para aplicaciones clínicas, y/o usadas como un diagnóstico complementario para monitorizar el tratamiento del cáncer con un agente de IL-2 y/o IL-2 con terapias celulares en entornos clínicos (Tabla 2).The data provide a list of critical molecular marker targets for evaluation of immunomodulatory and anti-inflammatory events and for making informed decisions to prioritize the use of autologous or allogeneic MSCs for clinical applications, and/or used as an adjunct diagnostic to monitor treatment of the disease. cancer with an IL-2 agent and/or IL-2 with cell therapies in clinical settings (Table 2).
La Tabla 2 muestra la expresión diferencial de factores antiinflamatorios e inmunomoduladores tras el tratamiento con IL-2 en células SEN y SR. Los valores GFOLD de SR representan la diferencia en veces en las células SR tratadas con IL-2, con respecto a las células SR no tratadas con IL-2; los valores GFOLD de SEN representan la diferencia en veces en las células SEN tratadas con IL-2, con respecto a las células SEN no tratadas con IL-2. Table 2 shows the differential expression of anti-inflammatory and immunomodulatory factors after IL-2 treatment in SEN and SR cells. SR GFOLD values represent the fold difference in IL-2 treated SR cells, relative to non-IL-2 treated SR cells; SEN GFOLD values represent the fold difference in IL-2 treated SEN cells, relative to non-IL-2 treated SEN cells.
T a b la 2 : E x p re s ió n d ife re n c ia l d e fa c to re s a n t iin f la m a to r io s e in m u n o m o d u la d o re s t ra s e l t ra ta m ie n to c o n IL -2T a b le 2 : D e f e r e n tial E x p re s io n o f s an t i n t i a n f la m a tory a n d i n m u n o m o d u l a t e r t re a t m e n t h e n IL-2

Ejemplo 6: Propiedades antiinflamatorias e inmunomoduladoras de MSC humanas expuestas a IL-2Example 6: Anti-inflammatory and immunomodulatory properties of human MSCs exposed to IL-2
A continuación, se investigó cómo la exposición al entorno proinflamatorio de IL-2, cuando se impone sobre el envejecimiento replicativo, afecta la expresión de los genes asignados para proporcionar propiedades inmunomoduladoras de las hADSC (por ejemplo, las propiedades antiinflamatorias e inmunomoduladoras de MSC humana expuesta a IL-2). Los datos demostraron que la capacidad de inmunomodulación se ve afectada por el envejecimiento replicativo de la MCS derivada de tejido adiposo humano durante la pasada ex vivo (FIG. 7B y Tabla 2).Next, we investigated how exposure to the proinflammatory milieu of IL-2, when imposed on replicative aging, affects the expression of genes assigned to provide immunomodulatory properties of hADSCs (for example, the anti-inflammatory and immunomodulatory properties of human MSC). exposed to IL-2). The data demonstrated that the immunomodulatory capacity is affected by replicative aging of human adipose tissue-derived MCS during ex vivo passage (FIG. 7B and Table 2).
La exposición a IL-2 en las hADSC SR activa un conjunto distinto de genes atribuidos a la regulación de células T. La exposición a IL-2 de las hADSC autorrenovables da como resultado la regulación al alza de genes, tales como TNFRSF21 (implicado en la diferenciación de células T), IL12A (activador de células T), ILF2 (potente regulador de la transcripción del gen IL-2 durante la activación de células T), IL33 (inductor paracrino de citocinas asociadas a células T auxiliares tipo 2), y regulación a la baja de CCL28 (factor quimiotáctico para células T CD4+, CD8+), CD320 (molécula receptora con función autocrina y paracrina para aumentar la proliferación de células plasmáticas), mostrado en la FIG. 7B, Tabla 2, y Tablas 5A-5D.IL-2 exposure in SR hADSCs activates a distinct set of genes attributed to T-cell regulation. IL-2 exposure of self-renewing hADSCs results in the upregulation of genes, such as TNFRSF21 (involved in T-cell differentiation), IL12A (T-cell activator), ILF2 (potent regulator of IL-2 gene transcription during T-cell activation), IL33 (paracrine inducer of type 2 helper T-cell-associated cytokines), and downregulation of CCL28 (chemotactic factor for CD4+, CD8+ T cells), CD320 (receptor molecule with autocrine and paracrine function to increase plasma cell proliferation), shown in FIG. 7B, Table 2, and Tables 5A-5D.
Contrariamente a eso, las hADSC SEN expuestas a IL-2 se caracterizaron por una regulación al alza transcripcional significativa de CD320, varias integrinas que podrían estar implicadas en la modulación de la función de las células T (ITG 11, ITGA V, ITFG 1), y genes que codifican moléculas reguladoras importantes tales como: el receptor de adhesión de células T (CD99), un factor atribuido al mantenimiento de células T vírgenes (CHST3), activadores de células T (HIVEP 1 e HIVEP2), un gen implicado en la ruta de señalización de células T (CMIP), y un factor autocrino/paracrino, PTGER1, implicado en la inhibición de la proliferación de células CD+ (FIG. 7B, Tabla 2, y Tablas 5A-5D).Contrary to that, IL-2-exposed SEN hADSCs were characterized by significant transcriptional upregulation of CD320, several integrins that might be involved in modulating T-cell function (ITG 11, ITGA V, ITFG 1). , and genes encoding important regulatory molecules such as: the T cell adhesion receptor (CD99), a factor attributed to the maintenance of naïve T cells (CHST3), T cell activators (HIVEP 1 and HIVEP2), a gene involved in the T cell signaling pathway (CMIP), and a factor autocrine/paracrine, PTGER1, implicated in inhibition of CD+ cell proliferation (FIG. 7B, Table 2, and Tables 5A-5D).
Los datos también demostraron que las hADSC SR expuestas a IL-2 desencadenan la regulación a la baja de las actividades transcripcionales de los genes que codifican receptores de superficie que desempeñan un papel en la proliferación y diferenciación de células B (CD72) y los macrófagos de direccionamiento (CD68). Ambos genes están significativamente regulados al alza transcripcionalmente en células senescentes tras un tratamiento similar (FIG. 7B, Tabla 2, Tablas 5A-5D). Además, las hADSC SEN tratadas con IL-2 se distinguen de las células SR tratadas de manera similar por la regulación a la baja transcripcional de los genes necesarios para la transición pro-B a pre-B, los genes LRRC8A y PEARl, que regulan un número progenitores mieloides no adherentes. Por el contrario, los genes implicados en la activación y homeostasis de los linfocitos (CD83 y TNFRSF25), así como en la transmigración de leucocitos (CERCAM), y los genes responsables de la interacción entre células endoteliales y leucocitos (ESM1), y un gen importante para el control del proceso inmunológico mediado por monocitos/macrófagos (TNFSF 13), están regulados al alza en las hADSC SEN (FIG. 7B, Tabla 2, y Tablas 5A-5D).The data also demonstrated that IL-2-exposed SR hADSCs trigger downregulation of the transcriptional activities of genes encoding surface receptors that play a role in the proliferation and differentiation of B cells (CD72) and macrophages. addressing (CD68). Both genes are significantly transcriptionally upregulated in senescent cells after similar treatment (FIG. 7B, Table 2, Tables 5A-5D). Furthermore, IL-2-treated SEN hADSCs are distinguished from similarly treated SR cells by transcriptional downregulation of genes required for the pro-B to pre-B transition, the LRRC8A and PEARl genes, which regulate a number of nonadherent myeloid progenitors. On the contrary, the genes involved in the activation and homeostasis of lymphocytes (CD83 and TNFRSF25), as well as in the transmigration of leukocytes (CERCAM), and the genes responsible for the interaction between endothelial cells and leukocytes (ESM1), and a gene important for monocyte/macrophage-mediated immune process control (TNFSF 13), are upregulated in hADSC SEN (FIG. 7B, Table 2, and Tables 5A-5D).
La exposición a IL-2 da como resultado la expresión diferencial de una serie de citocinas y factores críticos para la quimiotaxis (mostrado en la FIG. 7B y la Tabla 2).IL-2 exposure results in differential expression of a number of cytokines and factors critical for chemotaxis (shown in FIG. 7B and Table 2).
Las hADSC SR se caracterizan por la regulación al alza de los genes IL-33, IL-12A, IL10RB, IL1RAP, IL7R, ILF2 y NOS3, mientras que los genes IL-16 y CSF1R están regulados a la baja en estas células.SR hADSCs are characterized by upregulation of IL-33, IL-12A, IL10RB, IL1RAP, IL7R, ILF2, and NOS3 genes, while IL-16 and CSF1R genes are downregulated in these cells.
En las hADSC SEN tratadas en condiciones similares con IL-2, los genes que codifican las citocinas IL-32, IL-6, IL1RN, IL-20RB, IL-21R, y los inductores de inflamación TNFSF13 y TNFSF12, así como el gen que codifica el remodelador de la matriz extracelular PLAU, están regulados al alza.In SEN hADSCs treated under similar conditions with IL-2, the genes encoding the cytokines IL-32, IL-6, IL1RN, IL-20RB, IL-21R, and the inflammation inducers TNFSF13 and TNFSF12, as well as the gene encoding the extracellular matrix remodeler PLAU, are upregulated.
Al mismo tiempo, varios factores esenciales para la citocinesis, tales como MYL9, KIF14, IRAC3, así como los genes que codifican el factor quimiotáctico que atrae monocitos y basófilos (CCL2), y el gen CLEC11A que regula la proliferación y diferenciación de células precursoras hematopoyéticas, están regulados a la baja (FIG. 7B).At the same time, several factors essential for cytokinesis, such as MYL9, KIF14, IRAC3, as well as the genes that encode the chemotactic factor that attracts monocytes and basophils (CCL2), and the CLEC11A gene that regulates the proliferation and differentiation of precursor cells hematopoietic, are downregulated (FIG. 7B).
También se encuentra una regulación a la baja similar para varios genes que codifican el receptor de interleucina IL7R, IL1R1, IL15RA, y los factores de unión potenciadores de interleucina ILF2 e ILF3.Similar downregulation is also found for several genes encoding the interleukin receptor IL7R, IL1R1, IL15RA, and the interleukin-enhancing binding factors ILF2 and ILF3.
Estas observaciones, junto con la expresión transcripcional diferencial dependiente de IL-2 de citocinas en las hADSC SEN (regulación al alza de los genes IL-32, IL-6, PLAU; regulación a la baja de los genes CCL2, CLEC11A, ILF3, IRAK3, KIF14, MYL9) y en las hADSC SR (regulación al alza de los genes IL12A, IL7R, IRAK1, NOS3; regulación a la baja de los genes IL-16, CSF1R), indican que las propiedades inmunomoduladoras de las hADSC son susceptibles a los cambios impuestos por la senescencia.These observations, together with IL-2-dependent differential transcriptional expression of cytokines in SEN hADSCs (upregulation of IL-32, IL-6, PLAU genes; downregulation of CCL2, CLEC11A, ILF3 genes, IRAK3, KIF14, MYL9) and in SR hADSCs (upregulation of IL12A, IL7R, IRAK1, NOS3 genes; downregulation of IL-16, CSF1R genes), indicate that the immunomodulatory properties of hADSCs are susceptible to the changes imposed by senescence.
La conexión observada con la ruta de VEGF angiogénico (valor de q = 5,24e-3) (FIG. 10A, lado derecho, y FIG. 7D) y la capacidad mejorada de las hADSC SEN para la migración (FIGS. 4A, B) indica que las SEN-MSC expuestas a IL-2 podrían adquirir propiedades necesarias para apoyar un entorno tumorigénico y la metástasis. Además, la regulación al alza de los genes incluidos en la ruta de la óxido nítrico sintasa (iNOS), ruta NOS1 (valor de q = 8,32e-2), en las hADSC tras la senescencia replicativa también indica que las MSC en proceso de senescencia pueden adquirir propiedades promotoras de metástasis a través de la inmunosupresión.The observed connection to the angiogenic VEGF pathway (q value = 5.24e-3) (FIG. 10A, right side, and FIG. 7D) and the enhanced ability of SEN hADSCs to migrate (FIGS. 4A, B ) indicates that SEN-MSCs exposed to IL-2 could acquire properties necessary to support a tumorigenic environment and metastasis. In addition, the upregulation of genes included in the nitric oxide synthase (iNOS) pathway, NOS1 pathway (q value = 8.32e-2), in hADSCs after replicative senescence also indicates that MSCs undergoing of senescence can acquire metastasis-promoting properties through immunosuppression.
Ejemplo 7: Propiedades antiapoptóticas y promotoras de la metástasis de las hADSC estimuladas con IL-2 tras la senescencia replicativaExample 7: Anti-apoptotic and Metastasis-Promoting Properties of IL-2-Stimulated hADSCs Following Replicative Senescence
Estos experimentos también se usaron para examinar las propiedades antiapoptóticas y promotoras de metástasis de las MSC expuestas a IL-2 tras la senescencia replicativa.These experiments were also used to examine the antiapoptotic and metastasis-promoting properties of MSCs exposed to IL-2 after replicative senescence.
El panel de marcadores antiapoptóticos y promotores de metástasis para el tratamiento con IL-2, IL-2 en combinación con otros fármacos, o IL-2 en combinación con MSC, se muestra en la Tabla 3. Los datos proporcionan una lista de dianas de marcadores moleculares importantes para evaluación de eventos antiapoptóticos y que promueven la metástasis y la toma de decisiones informativas para priorizar el uso de MSC autólogas o alogénicas para aplicaciones clínicas, y/o usadas como un diagnóstico complementario de monitorización del tratamiento del cáncer con un agente IL-2 y/o IL-2 con terapias celulares en entornos clínicos (Tabla 3).The panel of antiapoptotic markers and metastasis promoters for treatment with IL-2, IL-2 in combination with other drugs, or IL-2 in combination with MSC, is shown in Table 3. The data provides a list of targets of important molecular markers for evaluation of anti-apoptotic and metastasis-promoting events and inform decision making to prioritize the use of autologous or allogeneic MSCs for clinical applications, and/or used as an adjunct diagnostic monitoring of cancer treatment with an IL agent -2 and/or IL-2 with cell therapies in clinical settings (Table 3).
La Tabla 3 muestra la expresión diferencial de factores antiapoptóticos y de metástasis tras el tratamiento con IL-2 en células SEN y SR. Los valores GFOLD de SR representan la diferencia en veces en las células SR tratadas con IL-2, con respecto a las células SR no tratadas con IL-2; los valores GFOLD de SEN representan la diferencia en veces en las células SEN tratadas con IL-2, con respecto a las células SEN no tratadas con IL-2. Table 3 shows the differential expression of antiapoptotic and metastatic factors after IL-2 treatment in SEN and SR cells. SR GFOLD values represent the fold difference in IL-2 treated SR cells, relative to non-IL-2 treated SR cells; SEN GFOLD values represent the fold difference in IL-2 treated SEN cells, relative to non-IL-2 treated SEN cells.
T a b la 3 : E x p re s ió n d ife re n c ia l d e fa c to re s a n t ia p o p tó t ic o s y d e m e tá s ta s is t ra s e l t ra ta m ie n to c o n IL -2T a b le 3 : D e f e r e n t ia l E x p re s io n o f P o p t o t ic and M e ta s t a s y s t ra t e n IL-2 TREATMENT

Por ejemplo, se ha demostrado que las MSC ayudan a revertir la apoptosis en los cardiomioblastos después de la isquemia, así como en las neuronas y los fibroblastos pulmonares dañados. La estanniocalcina 1 (STC 1) se ha identificado como un factor esencial capaz de una potente inversión apoptótica en fibroblastos dañados por los rayos UV y la acidez.For example, MSCs have been shown to help reverse apoptosis in cardiomyoblasts after ischemia, as well as in damaged lung neurons and fibroblasts. Stanniocalcin 1 (STC 1) has been identified as an essential factor capable of potent apoptotic reversal in UV- and acid-damaged fibroblasts.
Los datos indican que la exposición a IL-2 regula al alza transcripcionalmente a los genes tanto STC1 como STC2, y dicha activación no depende del envejecimiento replicativo de las hADSC, al menos ex vivo (Tablas 5A-5D). Además, los efectores paracrinos tales como VEGF y TGFB1 se han visto implicados en la reversión de la apoptosis en las células endoteliales. La expresión de los genes que codifican estos dos factores está regulado al alza en las hADSC SR y SEN tras el tratamiento con IL-2 (FIG. 7C, FIG. 5, Tabla 3, y Tablas 5A-5D).The data indicate that IL-2 exposure transcriptionally upregulates both STC1 and STC2 genes, and such activation is not dependent on hADSC replicative aging, at least ex vivo (Tables 5A-5D). Furthermore, paracrine effectors such as VEGF and TGFB1 have been implicated in the reversal of apoptosis in endothelial cells. Expression of the genes encoding these two factors is upregulated in SR and SEN hADSCs following IL-2 treatment (FIG. 7C, FIG. 5, Table 3, and Tables 5A-5D).
El tercer gráfico de la FIG. 5 muestra que IL-2 regula al alza la transcripción del gen VEGFA tras la senescencia replicativa de las hADSC. La expresión del gen VEGFA se evaluó mediante Q-PCR cuantitativa en hADSC senescentes (en negro) y autorrenovables (en blanco) no estimuladas (IL-2-), y tras la estimulación con 20 ug/ml de IL-2 recombinante (IL-2+). Datos mostrados como número de veces de cambio AACt. Se muestra la media ± SD de tres experimentos independientes. La posición de los cebadores de q-PCR se representa gráficamente. La significancia estadística se estimó mediante la prueba de la t, en la que ***p<0,001, **p<0,01.The third graph of FIG. 5 shows that IL-2 upregulates VEGFA gene transcription following replicative senescence of hADSCs. The expression of the VEGFA gene was evaluated by quantitative Q-PCR in senescent (in black) and self-renewing (in white) unstimulated hADSC (IL-2-), and after stimulation with 20 ug/ml of recombinant IL-2 (IL -2+). Data shown as number of times of AACt change. The mean ± SD of three independent experiments is shown. The position of the q-PCR primers is plotted. Statistical significance was estimated using the t-test, where ***p<0.001, **p<0.01.
Sin embargo, la actividad transcripcional de VEGFA es notablemente mayor en la senescencia que en las células que proliferan activamente, como se verifica adicionalmente mediante el análisis de Q-PCR que se muestra en la FIG. 7c . En particular, el gen SIVA1 que codifica un factor proapoptótico y un potente inductor de la apoptosis de los linfocitos T está significativamente regulado a la baja en las células senescentes tras el tratamiento con IL-2, en comparación con las hADSC que proliferan (FIG. 7C, Tabla 3, y Tablas 5A-5D). SIVA1 no es estrictamente un factor proapoptótico, sino también un potente supresor de la metástasis tumoral. Es importante destacar que varios de los factores responsables del crecimiento invasivo y la metástasis están significativamente regulados al alza en las hADSC SEN expuestas a IL-2, en comparación con las células SR tratadas de manera similar (FIG. 7C y Tabla 3). Esto incluye los genes RACKI, pLe KHAI, PLEKHA6, CTSB, CRMPl, FERMTl. Estos datos indicaron que el pretratamiento/exposición de las hADSC con IL-2 puede potenciar las propiedades antiapoptóticas de estas células en general, y que tal potenciación se efectúa por senescencia replicativa, al menos en cultivo.However, VEGFA transcriptional activity is markedly higher in senescence than in actively proliferating cells, as further verified by Q-PCR analysis shown in FIG. 7c. In particular, the SIVA1 gene encoding a proapoptotic factor and a potent inducer of T cell apoptosis is significantly downregulated in senescent cells after IL-2 treatment, compared to proliferating hADSC (FIG. 7C, Table 3, and Tables 5A-5D). SIVA1 is not strictly a proapoptotic factor, but also a potent suppressor of tumor metastasis. Importantly, several of the factors responsible for invasive growth and metastasis are significantly upregulated in IL-2-exposed SEN hADSCs, compared to similarly treated SR cells (FIG. 7C and Table 3). This includes the RACKI, pLe KHAI, PLEKHA6, CTSB, CRMPl, FERMTl genes. These data indicated that pretreatment/exposure of hADSCs with IL-2 can enhance the antiapoptotic properties of these cells in general, and that such enhancement is effected by replicative senescence, at least in culture.
Se demostró que en las hADSC SEN tratadas con IL-2, los genes regulados al alza prominentes están enriquecidos para las rutas asociadas con la inflamación (ruta de IL-6, valor de q = 5,55e-3) y la señalización de EGF (valor de q = 2,33e-4), que han demostrado proporcionar ventajas de supervivencia a las MSC. Las hADSC SEN expuestas a IL-2 también se caracterizan por una mayor expresión de IL-1 b, IL-6 e IL-12 (FIG. 7B), citocinas que se sabe que estimulan la IL-17 de los linfocitos.It was shown that in IL-2-treated SEN hADSCs, prominent upregulated genes are enriched for pathways associated with inflammation (IL-6 pathway, q-value = 5.55e-3) and EGF signaling. (q-value = 2.33e-4), which have been shown to provide survival advantages to MSCs. SEN hADSCs exposed to IL-2 are also characterized by increased expression of IL-1 b, IL-6, and IL-12 (FIG. 7B), cytokines known to stimulate IL-17 from lymphocytes.
Los datos también indicaron que los linfocitos son la única fuente de producción de IL-17, y esas MSC, particularmente en su senescencia, muestran una alta actividad transcripcional de IL-17 cuando se someten a un entorno proinflamatorio (FIG. 7A). La IL-17 derivada de MSC junto con CSF-1 derivada de MSC puede inducir la expansión de neutrófilos sistémica y la infiltración de macrófagos de manera similar a los estudios que indican un papel fundamental para estos factores en la promoción de la progresión del cáncer y la metástasis, así como en una serie de enfermedades inflamatorias, incluyendo la psoriasis.The data also indicated that lymphocytes are the sole source of IL-17 production, and those MSCs, particularly in their senescence, show high IL-17 transcriptional activity when subjected to a proinflammatory environment (FIG. 7A). MSC-derived IL-17 together with MSC-derived CSF-1 can induce systemic neutrophil expansion and macrophage infiltration similar to studies indicating a critical role for these factors in promoting cancer progression and metastasis, as well as in a number of inflammatory diseases, including psoriasis.
Ejemplo 8: El perfil transcripcional indica dianas génicas que regulan la migración mejorada y la angiogénesis en hADSC estimuladas con IL-2 tras la senescencia replicativaExample 8: Transcriptional Profiling Indicates Gene Targets Regulating Enhanced Migration and Angiogenesis in IL-2-Stimulated hADSCs Following Replicative Senescence
Se muestra el panel de los marcadores que indican migración mejorada y angiogénesis en tratamientos con IL-2 tras el envejecimiento (Tabla 4).The panel of markers indicating enhanced migration and angiogenesis in IL-2 treatments after aging is shown (Table 4).
La lista de dianas de marcadores moleculares críticas para la evaluación de eventos que promueven la migración y la angiogénesis puede ayudar a tomar decisiones informativas para priorizar el uso de MSC autólogas o alogénicas para aplicaciones clínicas, y/o usadas como un diagnóstico complementario de monitorización del tratamiento del cáncer con un agente IL-2 y/o IL-2 con terapias celulares en entornos clínicos (Tabla 4). El perfil transcripcional indica dianas génicas que regulan la migración mejorada y la angiogénesis en ADSC estimuladas con IL-2 tras la senescencia replicativa. Un análisis adicional de la respuesta transcripcional indica que la estimulación con IL-2 de las hADSC SEN mejora la expresión de genes implicados en el desarrollo vascular y la remodelación relacionada con la angiogénesis. Se observó una regulación al alza significativa de los genes VEGFA, VEGFB, FBLNS, FBLN7, PGF, ANGPTl, ANGPT2, ANGPTL2, ANGPTL6, TNFSF12, PRKCA, PIK3CA, HRAS, así como un gen que codifica un potente modulador de la adhesión entre células endoteliales y leucocitos, ESM1 (FIG. 7D, FIGS. 10A-10B, Tabla 4, y Tablas 5A-5D).The list of critical molecular marker targets for the evaluation of events that promote migration and angiogenesis can help inform decisions to prioritize the use of autologous or allogeneic MSCs for clinical applications, and/or used as an adjunct diagnostic monitoring of the disease. cancer treatment with an IL-2 and/or IL-2 agent with cell therapies in clinical settings (Table 4). Transcriptional profiling indicates gene targets that regulate enhanced migration and angiogenesis in IL-2-stimulated ADSCs following replicative senescence. Further analysis of the transcriptional response indicates that IL-2 stimulation of hADSC SEN enhances the expression of genes involved in vascular development and angiogenesis-related remodeling. Significant upregulation of VEGFA, VEGFB, FBLNS, FBLN7, PGF, ANGPTl, ANGPT2, ANGPTL2, ANGPTL6, TNFSF12, PRKCA, PIK3CA, HRAS genes was observed, as well as a gene encoding a potent modulator of cell-to-cell adhesion endothelial cells and leukocytes, ESM1 (FIG. 7D, FIGS. 10A-10B, Table 4, and Tables 5A-5D).
La Tabla 4 muestra la expresión diferencial de los factores de migración y angiogénesis tras el tratamiento con IL-2 en células SEN y SR. Los valores GFOLD de SR representan la diferencia en veces en las células SR tratadas con IL-2, con respecto a las células SR no tratadas con IL-2; los valores GFOLD de SEN representan la diferencia en veces en las células SEN tratadas con IL-2, con respecto a las células SEN no tratadas con IL-2.Table 4 shows the differential expression of migration and angiogenesis factors after IL-2 treatment in SEN and SR cells. SR GFOLD values represent the fold difference in IL-2 treated SR cells, relative to non-IL-2 treated SR cells; SEN GFOLD values represent the fold difference in IL-2 treated SEN cells, relative to non-IL-2 treated SEN cells.
Tabla 4: Expresión diferencial de factores promotores de la migración y la angiogénesis tras el tratamiento con IL-2Table 4: Differential expression of factors promoting migration and angiogenesis after treatment with IL-2

El factor de crecimiento endotelial vascular, VEGF, liberado por las MSC, permite el reclutamiento de células de linaje endotelial y el inicio de la vascularización como se dio a conocer anteriormente. Se demostró además que la regulación al alza de la expresión del gen VEGFA en las hADSC SEN puede detectarse mediante un análisis cuantitativo de RT-PCR, y la exposición a IL-2 da como resultado un aumento estadísticamente significativo de la transcripción del gen VEGFA en las hADSC SR y SEN (FIG. 7D y Tabla 4).Vascular endothelial growth factor, VEGF, released by MSCs, allows the recruitment of cells of endothelial lineage and the initiation of vascularization as previously reported. It was further shown that the upregulation of VEGFA gene expression in SEN hADSCs can be detected by quantitative RT-PCR analysis, and IL-2 exposure results in a statistically significant increase in VEGFA gene transcription in SEN hADSCs. hADSC SR and SEN (FIG. 7D and Table 4).
En respuesta a la IL-2, un grupo de genes responsables de la motilidad celular, la migración y el crecimiento invasivo están regulados al alza significativamente solo en las hADSC que experimentan senescencia replicativa: CGNL1, CGREF 1, CRMP1, FGD6, TNK2, PTGS1, TNFAIP8, CTSB, CTSO, FAP, FERMT1, PLEKHA1, PLEKHA6, ROCK1, ROCK2. Un conjunto de genes que promueven la adhesión celular, tales como CHD24, CYR61, ILK, NEDD9, MYL9, PPAP2B, RELN y TLN2, estaban regulados a la baja (FIG. 7D, Tabla 4, y Tablas 5A-5D). Estos datos respaldan aún más la evidencia experimental de la capacidad de migración mejorada de las hADSC SEN mostrada en la FIG. 3B.In response to IL-2, a group of genes responsible for cell motility, migration, and invasive growth are significantly upregulated only in hADSCs undergoing replicative senescence: CGNL1, CGREF 1, CRMP1, FGD6, TNK2, PTGS1 , TNFAIP8, CTSB, CTSO, FAP, FERMT1, PLEKHA1, PLEKHA6, ROCK1, ROCK2. A set of genes that promote cell adhesion, such as CHD24, CYR61, ILK, NEDD9, MYL9, PPAP2B, RELN, and TLN2, were downregulated (FIG. 7D, Table 4, and Tables 5A-5D). These data further support the experimental evidence for the enhanced migration capacity of SEN hADSCs shown in FIG. 3B.
Ejemplo 9: Datos de matriz proteómica de anticuerposExample 9: Antibody Proteomic Array Data
La Tabla 6 proporciona los valores brutos para todos los datos de la matriz proteómica.Table 6 provides the raw values for all the proteomics array data.
Las MSC de un paciente de 38 años en medio StemPro MSC SFM Xeno-free que contiene 10% PRP se sembraron en placas sobre un sustrato. Las hADSC SR o SEN determinadas como se describe en el Ejemplo 1 se sembraron en placa a una densidad de 2500 células/cm2 en 700 ul/cm2 de medio StemPro MSC SFM Xeno-free que contiene 10% PRP. Las hADSC SEN y SR se estimularon con IL-2 durante 24 h o permanecieron sin estimulación con IL-2 (IL-2-), después de lo cual el medio se intercambió por el medio StemPro MSC SFM Xeno-free que contiene 10% PRP. Las células se mantuvieron a 37°C y 5% de CO2 durante 24, 48 y 72 h, después de lo cual el medio se recogió y se analizó. Se analizaron volúmenes iguales de medio en RayBio C-Series Human Cytokine Antibody Array AAH-CYT-2000 (RayBiotech, Inc). C-Series Human Cytokine Antibody Array AAH-CYT-2000 se basa en el principio de ensayo de quimioluminiscencia, y contiene anticuerpos contra 174 proteínas de interés. Los datos se extrajeron de las membranas usando el software de densitometría de Biosciences LI-COR (Li-COR). Los datos brutos se normalizaron tomando la relación entre la intensidad promedio de la señal de proteína dada y el control negativo de intensidad promedio, para tener en cuenta las diferencias en la exposición y la variación de matriz a matriz. Los datos se presentan en las FIGS. 11-90, y la Tabla 6 demuestra los factores proteicos segregados tras la exposición a IL-2. Estas proteínas incluyen, pero no se limitan a, los factores indicados en las tablas en las FIGS. 7A-7D, y los perfiles secretores recapitulan los datos transcripcionales.MSCs from a 38-year-old patient in StemPro MSC SFM Xeno-free medium containing 10% PRP were plated on a substrate. SR or SEN hADSCs determined as described in Example 1 were plated at a density of 2500 cells/cm 2 in 700 ul/cm 2 StemPro MSC SFM Xeno-free medium containing 10% PRP. SEN and SR hADSCs were stimulated with IL-2 for 24 h or remained unstimulated with IL-2 (IL-2-), after which the medium was exchanged for StemPro MSC SFM Xeno-free medium containing 10% PRP. . The cells were kept at 37°C and 5% CO2 for 24, 48 and 72 h, after which the medium was collected and analyzed. Equal volumes of medium were analyzed on RayBio C-Series Human Cytokine Antibody Array AAH-CYT-2000 (RayBiotech, Inc). C-Series Human Cytokine Antibody Array AAH-CYT-2000 is based on the chemiluminescence assay principle, and contains antibodies against 174 proteins of interest. Data was extracted from the membranes using Biosciences LI-COR (Li-COR) densitometry software. The raw data was normalized by taking the ratio of the average intensity of the given protein signal to the average intensity negative control, to account for differences in exposure and matrix-to-matrix variation. The data is presented in FIGS. 11-90, and Table 6 demonstrates the protein factors secreted upon exposure to IL-2. These proteins include, but are not limited to, the factors listed in the tables in FIGS. 7A-7D, and the secretory profiles recapitulate the transcriptional data.
Las FIGS. 11-17 muestran el aumento en la secreción de las proteínas nombradas más abajo (factores) de las SR-hADSC, 24 horas después de la incubación con medios que contienen 10% PRP (plasma rico en plaquetas) solo (sin estimulación con IL-2). Los niveles de secreción se muestran con respecto a la cantidad de la proteína correspondiente presente en los niveles basales en los medios que contienen 10% PRP, usados para el soporte de las hADSC. La FIG. 11 muestra el aumento en la secreción de interleucina 5 (IL5) e interleucina 6 (IL6). La FIG. 12 muestra el aumento en la secreción del receptor 4 de interleucina 1 (IL1R4). La FIG. 13 muestra el aumento en la secreción de neurotrofina 3 (NT3), factor A alfa de crecimiento derivado de plaquetas (PDGF AA), factor A beta de crecimiento derivado de plaquetas (PDGF AB), y proteína básica proplaquetaria (PPBP). La FIG. 14 muestra el aumento en la secreción de ligando 18 de quimiocina (motivo C-C) (CCL18), ligando 25 de quimiocina (motivo C-C) (CCL25), ligando 27 de quimiocina (motivo C-C) (CCL27), y ligando 11 de quimiocina CXC (CXCL11). La FIG. 15 muestra el aumento en la secreción de la molécula 1 de adhesión intercelular (ICAM-1) y el inhibidor 2 de metaloproteinasa (TIMP-2). La FIG.FIGS. 11-17 show the increase in secretion of the below named proteins (factors) from SR-hADSCs, 24 hours after incubation with media containing 10% PRP (platelet-rich plasma) alone (without stimulation with IL- two). Secretion levels are shown relative to the amount of the corresponding protein present at basal levels in media containing 10% PRP, used for support of hADSCs. FIG. 11 shows the increase in interleukin 5 (IL5) and interleukin 6 (IL6) secretion. FIG. 12 shows the increase in interleukin 1 receptor 4 (IL1R4) secretion. FIG. 13 shows the increased secretion of neurotrophin 3 (NT3), platelet-derived growth factor A alpha (PDGF AA), platelet-derived growth factor A beta (PDGF AB), and proplatelet protein basic (PPBP). FIG. 14 shows the increase in secretion of chemokine (C-C motif) ligand 18 (CCL18), chemokine (C-C motif) ligand 25 (CCL25), chemokine (C-C motif) ligand 27 (CCL27), and CXC chemokine ligand 11 (CXCL11). FIG. 15 shows the increased secretion of intercellular adhesion molecule 1 (ICAM-1) and inhibitor of metalloproteinase 2 (TIMP-2). FIG.
16 muestra el aumento en la secreción del inhibidor 1 de metaloproteinasa (TIMP-1). La FIG. 17 muestra el aumento en la secreción de cadherina del epitelio vascular (VE) (proteína de adhesión celular dependiente de calcio).16 shows the increase in metalloproteinase inhibitor 1 (TIMP-1) secretion. FIG. 17 shows the increase in vascular epithelial (VE) cadherin secretion (calcium-dependent cell adhesion protein).
Las FIGS. 18-19 muestran el aumento en la secreción de las proteínas nombradas más abajo (factores) de las SR-hADSC, 24 horas después de la incubación con 10% PRP solo (sin estimulación con IL-2). Se encontró que estas proteínas no estaban presentes en el PRP. La FIG. 18 muestra el aumento en la secreción de interleucina 4 (IL4). La FIG. 19 muestra el aumento en la secreción de la proteína 1 de unión al factor de crecimiento similar a la insulina (IGFBP1).FIGS. 18-19 show the increase in secretion of the below named proteins (factors) from SR-hADSCs, 24 hours after incubation with 10% PRP alone (without IL-2 stimulation). These proteins were found not to be present in PRP. FIG. 18 shows the increase in interleukin 4 (IL4) secretion. FIG. 19 shows the increased secretion of insulin-like growth factor-binding protein 1 (IGFBP1).
Las FIGS. 20-31 muestran un aumento en las proteínas nombradas más abajo (factores) de las SR-hADSC, 48 horas después de la incubación con 10% PRP solo (sin estimulación con IL-2). Los niveles de secreción se muestran con respecto a la cantidad de la proteína correspondiente presente en los niveles basales en los medios que contienen 10% PRP, usados para el soporte de las hADSC. La FIG. 20 muestra el aumento en la secreción de interleucina 9 (IL9) y proteína alfa de unión a interleucina 18 (IL18BPa). La FIG. 21 muestra el aumento en la secreción del receptor tipo II de interleucina 1 (IL1R2), receptor beta de interleucina 2 (IL-2Rb), receptor gamma de interleucina 2 (IL-2Rg), receptor alfa de interleucina 5 (IL5Ra), receptor beta de interleucina 10 (IL10Rb), proteína accesoria del receptor de interleucina 18 (IL18Rb), y receptor de interleucina 21 (IL-21R). La FIG. 22 muestra el aumento en la secreción de factor 2 de crecimiento similar a la insulina (IGF2), factor alfa de crecimiento transformante (TGFa), factor beta 1 de crecimiento transformante/péptido asociado a latencia (LAP) (TGFP1), y factor de beta 2 crecimiento transformante (TGFb2). La FIG. 23 muestra el aumento en la secreción de tirosina-proteína cinasa receptora ErbB-3 (ErbB3), ligando de Fas (Fas LG), factor inhibidor de la leucemia (LIF), factor de prolactina (PRL), receptor alfa del factor de crecimiento derivado de plaquetas (PDGFRa), receptor beta del factor de crecimiento derivado de plaquetas (PDGFRP), receptor del kit del factor de células madre (SCFR), y lectina 5 similar a Ig que se une al ácido siálico (Siglec 5). La FIG. 24 muestra el aumento en la secreción del ligando 16 de quimiocina CXC (CXCL16). La FIG. 25 muestra el aumento en la secreción de molécula de adhesión celular leucocitaria activada (ALCAM), E selectina (glicoproteína de la superficie celular en inmunoadhesión), molécula 2 de adhesión intercelular (ICAM2), L selectina (molécula de adhesión de leucocitos), y molécula de adhesión de células endoteliales plaquetarias (PECAM 1). La FIG. 26 muestra el aumento en la secreción de activina A (INHBA), factor 2 de crecimiento similar a la insulina (IGF-2), y receptor de leptina (LEPR). La FIG. 27 muestra el aumento en la secreción de proteína 5 morfogenética ósea (BMP5), proteína 7 morfogenética ósea (BMP7), receptor del factor 1 estimulante de colonias de macrófagos (MCSFR), metaloproteinasa 1 la de matriz (MMP1), metaloproteinasa 3 de la matriz (MMP3), metaloproteinasa 9 de la matriz (MMP9), y metaloproteinasa 13 de la matriz (MMP13). La FIG. 28 muestra el aumento en la secreción de antígeno de diferenciación de monocitos (CD14), antígeno de diferenciación celular (CD80), cardiotrofina-1 (CT-1), y factor inhibidor de leucemia (LIF). La FIG. 29 muestra el aumento en la secreción de endoglina (ENG). La FIG. 30 muestra el aumento de la secreción de tirosina cinasa con dominios 1 similar a inmunoglobulina y similar a EGF (TIE-1), y tirosina cinasa con dominios 2 similar a inmunoglobulina y similar a EGF (TIE-2). La FIG. 31 muestra el aumento en la secreción de activina A (inhibina beta A, INHBA), receptor de leptina (leptina R), y factor beta 1 de crecimiento transformante (TGFP1).FIGS. 20-31 show an increase in the below named proteins (factors) of SR-hADSCs, 48 hours after incubation with 10% PRP alone (no IL-2 stimulation). Secretion levels are shown relative to the amount of the corresponding protein present at basal levels in media containing 10% PRP, used for support of hADSCs. FIG. 20 shows the increase in the secretion of interleukin 9 (IL9) and interleukin 18-binding protein alpha (IL18BPa). FIG. 21 shows increased secretion of type II interleukin 1 receptor (IL1R2), interleukin 2 receptor beta (IL-2Rb), interleukin 2 receptor gamma (IL-2Rg), interleukin 5 receptor alpha (IL5Ra), receptor interleukin 10 beta (IL10Rb), interleukin 18 receptor accessory protein (IL18Rb), and interleukin 21 receptor (IL-21R). FIG. 22 shows the increased secretion of insulin-like growth factor 2 (IGF2), transforming growth factor alpha (TGFa), transforming growth factor beta 1/latency-associated peptide (LAP) (TGFP1), and transforming growth beta 2 (TGFb2). FIG. 23 shows increased secretion of ErbB-3 receptor protein tyrosine kinase (ErbB3), Fas ligand (Fas LG), leukemia inhibitory factor (LIF), prolactin factor (PRL), growth factor receptor alpha platelet-derived growth factor receptor (PDGFRa), platelet-derived growth factor receptor beta (PDGFRP), stem cell factor kit receptor (SCFR), and sialic acid-binding Ig-like lectin 5 (Siglec 5). FIG. 24 shows increased secretion of CXC chemokine ligand 16 (CXCL16). FIG. 25 shows increased secretion of activated leukocyte cell adhesion molecule (ALCAM), E-selectin (immunoadhesion cell-surface glycoprotein), intercellular adhesion molecule 2 (ICAM2), L-selectin (leukocyte adhesion molecule), and platelet endothelial cell adhesion molecule (PECAM 1). FIG. 26 shows the increase in the secretion of activin A (INHBA), insulin-like growth factor 2 (IGF-2), and leptin receptor (LEPR). FIG. 27 shows increased secretion of bone morphogenetic protein 5 (BMP5), bone morphogenetic protein 7 (BMP7), macrophage colony-stimulating factor receptor 1 (MCSFR), matrix metalloproteinase 1 (MMP1), matrix metalloproteinase 3 matrix (MMP3), matrix metalloproteinase 9 (MMP9), and matrix metalloproteinase 13 (MMP13). FIG. 28 shows the increased secretion of monocyte differentiation antigen (CD14), cell differentiation antigen (CD80), cardiotrophin-1 (CT-1), and leukemia inhibitory factor (LIF). FIG. 29 shows the increase in endoglin (ENG) secretion. FIG. 30 shows increased secretion of EGF-like and immunoglobulin-like domain tyrosine kinase 1 (TIE-1), and EGF-like and immunoglobulin-like domain tyrosine kinase 2 (TIE-2). FIG. 31 shows the increase in the secretion of activin A (inhibin beta A, INHBA), leptin receptor (leptin R), and transforming growth factor beta 1 (TGFP1).
La FIG. 32 muestra el aumento en la secreción del receptor del factor de crecimiento nervioso (NGFR) de las SR-MSC, 48 horas después de la incubación con 10% PRP solo (sin estimulación con IL-2). Se encontró que NGFR no estaba presente en PRP.FIG. 32 shows the increase in nerve growth factor receptor (NGFR) secretion from SR-MSCs, 48 hours after incubation with 10% PRP alone (no IL-2 stimulation). NGFR was found not to be present in PRP.
Las FIGS. 33-39 muestran el aumento en la secreción de las proteínas nombradas más abajo (factores) de las SR-hADSC, 72 horas después de la incubación con 10% PRP solo (sin estimulación con IL-2). Los niveles de secreción se muestran con respecto a la cantidad de la proteína correspondiente presente en los niveles basales en los medios que contienen 10% PRP, usados para el soporte de las hADSC. La FIG. 33 muestra el aumento en la secreción de interleucina 1 beta (IL1 b), interleucina 3 (IL3), subunidad alfa-2 del receptor de interleucina 13 (IL13Ra2), y receptor alfa de interleucina 1 (IL1Ra). La FIG. 34 muestra el aumento en la secreción de probetacelulina (BTC), factor estimulante de colonias (CSF1), factor 6 de crecimiento de fibroblastos (FGF6), factor neurotrófico derivado de la línea de células gliales (GDNF), factor 1 de crecimiento similar a la insulina (IGF-1), leptina, y factor B beta de crecimiento derivado de plaquetas (PDGF BB). La FIG. 35 muestra el aumento en la secreción de factor de células madre/ligando de c-kit (SCF), factor 1 alfa derivado de células estromales (SDF1a), factor 1 beta derivado de células estromales (SDF1b), factor beta 1 de crecimiento transformante (TGFP1), factor beta 3 de crecimiento transformante (TGFb3), y miembro 14 de la superfamilia del factor de necrosis tumoral (TNFSF14). La FIG. 36 muestra el aumento en la secreción del factor 1 de crecimiento similar a la insulina (IGF1). La FIG. 37 muestra el aumento en la secreción del factor beta 1de crecimiento transformante (TGFP1) y factor B beta de crecimiento derivado de plaquetas (PDGF BB). La FIG. 38 muestra el aumento en la secreción de ligando 2 de quimiocina (motivo CC) (CCL2), ligando 5 de quimiocina (motivo CC) (CCL5), ligando 7 de quimiocina (motivo CC) (CCL7), ligando 8 de quimiocina (motivo CC) (CCL8), y ligando 11 de quimiocina (motivo CC) (CCL11). La FIG. 39 muestra el aumento en la secreción de ligando 13 de quimiocina (motivo CC) (CCL13), ligando 22 de quimiocina (motivo CC) (CCL22), ligando 23 de quimiocina (motivo Cc ) (CCL23), ligando 24 de quimiocina (motivo CC) (CCL24), y ligando 10 de quimiocina CXC (CXCL10).FIGS. 33-39 show the increase in secretion of the below named proteins (factors) from SR-hADSCs, 72 hours after incubation with 10% PRP alone (without IL-2 stimulation). Secretion levels are shown relative to the amount of the corresponding protein present at basal levels in media containing 10% PRP, used for support of hADSCs. FIG. 33 shows increased secretion of interleukin 1 beta (IL1 b), interleukin 3 (IL3), interleukin 13 receptor alpha-2 subunit (IL13Ra2), and interleukin 1 receptor alpha (IL1Ra). FIG. 34 shows the increased secretion of probe cellulin (BTC), colony-stimulating factor 1 (CSF1), fibroblast growth factor 6 (FGF6), glial cell line-derived neurotrophic factor (GDNF), GF-like growth factor 1 insulin (IGF-1), leptin, and platelet-derived growth factor B beta (PDGF BB). FIG. 35 shows the increase in secretion of stem cell factor/c-kit ligand (SCF), stromal cell-derived factor 1 alpha (SDF1a), stromal cell-derived factor 1 beta (SDF1b), transforming growth factor beta 1 (TGFP1), transforming growth factor beta 3 (TGFb3), and tumor necrosis factor superfamily member 14 (TNFSF14). FIG. 36 shows the increased secretion of insulin-like growth factor 1 (IGF1). FIG. 37 shows the increased secretion of transforming growth factor beta 1 (TGFP1) and platelet-derived growth factor B beta (PDGF BB). FIG. 38 shows the increase in secretion of chemokine ligand 2 (CC motif) (CCL2), chemokine ligand 5 (CC motif) (CCL5), chemokine ligand 7 (CC motif) (CCL7), chemokine ligand 8 (CC motif) CC) (CCL8), and chemokine ligand 11 (CC motif) (CCL11). FIG. 39 shows the increased secretion of chemokine (CC motif) ligand 13 (CCL13), chemokine (CC motif) ligand 22 (CCL22), chemokine (Cc motif) ligand 23 (CCL23), chemokine (CC motif) ligand 24 (CCL23), CC) (CCL24), and CXC chemokine ligand 10 (CXCL10).
Las FIGS. 40-42 muestran el aumento en la secreción de las proteínas nombradas más abajo (factores) de las SR-hADSC, 72 horas después de la incubación con 10% PRP solo (sin estimulación con IL-2). Se encontró que estos factores no estaban presentes en el PRP. La FIG. 40 muestra el aumento en la secreción de factor neurotrófico derivado del cerebro (BDNF), proteína 4 morfogenética ósea (BMP4), proteína 6 morfogenética ósea (BMP6), factor neurotrófico ciliar (CNTF), factor de crecimiento epidérmico (EGF), factor 7 de crecimiento de fibroblastos (FGF7), y proteína 4 de unión al factor de crecimiento similar a la insulina (IGFBP4). La FIG. 41 muestra el aumento en la secreción de ligando 13 de quimiocina (motivo CXC) (BLC), ligando 23 de quimiocina (motivo CC) (CCL23), ligando 28 de quimiocina (motivo CC) (CCL28), ligando 11 de quimiocina (motivo CC) (eotaxina 1), ligando 6 de quimiocina (motivo CXC) (GCP-2), FLT3LG (ligando de tirosina cinasa 3 relacionada con Fms), y fractalquina (CX3CL1). La FIG.FIGS. 40-42 show the increase in secretion of the below named proteins (factors) from SR-hADSCs, 72 hours after incubation with 10% PRP alone (without IL-2 stimulation). These factors were found not to be present in PRP. FIG. 40 shows the increased secretion of brain-derived neurotrophic factor (BDNF), bone morphogenetic protein 4 (BMP4), bone morphogenetic protein 6 (BMP6), ciliary neurotrophic factor (CNTF), epidermal growth factor (EGF), factor 7 fibroblast growth (FGF7), and insulin-like growth factor-binding protein 4 (IGFBP4). FIG. 41 shows the increase in secretion of chemokine ligand 13 (CXC motif) (BLC), chemokine ligand 23 (CC motif) (CCL23), chemokine ligand 28 (CC motif) (CCL28), chemokine ligand 11 (CC motif) CC) (eotaxin 1), chemokine (CXC motif) ligand 6 (GCP-2), FLT3LG (Fms-related tyrosine kinase ligand 3), and fractalkine (CX3CL1). FIG.
42 muestra el aumento de la secreción de angiotensina (ANG), y factor 2 estimulante de colonias (CSF2).42 shows increased secretion of angiotensin (ANG), and colony-stimulating factor 2 (CSF2).
La FIG. 43 muestra el aumento en la secreción del ligando 27 de quimiocina (motivo C-C) (CCL27) y TNFRSF1B (superfamilia de receptores del factor de necrosis tumoral, miembro 1B) de las SR-hADSC, 24 horas después de la estimulación con IL-2. Los niveles de secreción se muestran con respecto a la cantidad de la proteína correspondiente presente en los niveles basales en los medios que contienen 10% PRP, usados para el soporte de las hADSC. FIG. 43 shows increased secretion of chemokine ligand 27 (C-C motif) (CCL27) and TNFRSF1B (tumor necrosis factor receptor superfamily, member 1B) from SR-hADSCs, 24 hours after IL-2 stimulation. . Secretion levels are shown relative to the amount of the corresponding protein present at basal levels in media containing 10% PRP, used for support of hADSCs.
Las FIGS. 44-53 muestran el aumento de las proteínas nombradas más abajo (factores) de las SR-hADSC, 48 horas después de la estimulación con IL-2. Los niveles de secreción se muestran con respecto a la cantidad de la proteína correspondiente presente en los niveles basales en los medios que contienen 10% PRP, usados para el soporte de las hADSC. La FIG. 44 muestra el aumento en la secreción de interleucina 9 (IL9), interleucina 11 (IL-11), interleucina 12 alfa (IL12a), interleucina 12 beta (IL12b), y proteína alfa de unión a interleucina 18 (IL18BPa). La FIG. 45 muestra el aumento en la secreción del receptor tipo I de interleucina 1 (IL1R1), receptor tipo II de interleucina 1 (IL1R2), receptor tipo IV de interleucina 1 (IL1R4), receptor beta de interleucina 2 (IL-2Rb), receptor gamma de interleucina 2 (IL-2Rg), receptor alfa de interleucina 5 (IL5Ra), receptor beta de interleucina 10 (IL10Rb), receptor beta de interleucina 18 (IL18Rb), y receptor de interleucina 21 (IL-21R). La FIG. 46 muestra el aumento en la secreción del factor 4 de crecimiento de fibroblastos (FGF4), FGF9, MSP alfa/factor similar a HGF (similar a HGF), factor 1 de crecimiento similar a la insulina (IGF1), IGF2, proteína 6 de unión al factor de crecimiento similar a la insulina (IGFBP6), LAP (familia TGF beta), y factor A alfa de crecimiento derivado de plaquetas (PDGFAA). La FIG. 47 muestra el aumento en la secreción del factor A beta de crecimiento derivado de plaquetas (PDGFAB), factor B beta de crecimiento derivado de plaquetas (PDGFBB), factor 1 alfa derivado de células estromales (SDF1a), lectina 5 similar a Ig que se une al ácido siálico (Siglec 5), factor alfa de crecimiento transformante (TGFa), factor beta 2 de crecimiento transformante (TGFb2), factor de crecimiento endotelial vascular (VEGF), y factor D de crecimiento endotelial vascular (VEGFD). La FIG. 47 también muestra el aumento en la secreción de DR6, Dtk, EGFR, endoglina, ErbB3, Fas, Fas LG, e IGF1 sr. La FIG. 48 muestra el aumento de la secreción de leptina (LEP), receptor de leptina (LEPR), receptor del factor 1 estimulante de colonias de macrófagos (MCSFR), neurotrofina 4 (NT4), osteoprotegerina (OPG), receptor alfa del factor de crecimiento derivado de plaquetas (PDGFRa), receptor beta del factor de crecimiento derivado de plaquetas (PDGFRb), y prolactina (PRL). La FIG. 49 muestra el aumento en la secreción del receptor del factor de células madre (SCFR), receptor de angiopoyetina 1 (TIE-1), receptor de angiopoyetina 1 (TIE-2), miembro 10C de la superfamilia de TNF (TNFSF10C), miembro 10D de la superfamilia de TNF (TNFSF10D), miembro 14 de la superfamilia de TNF (TNFSF14), receptor activador del plasminógeno de uroquinasa (uPAR), y receptor 2 del factor de crecimiento endotelial vascular (VEGFR2). La FIG. 50 muestra el aumento en la secreción del ligando 2 de quimiocina (motivo C-C) (CCL2), CCL3, CCL5, CCL8, CCL17, CCL20, CCL25, ligando 5 de quimiocina CXC (CXCL5), CXCL11, y CXCL16. La FIG. 51 muestra el aumento en la secreción de molécula de adhesión celular leucocitaria activada (ALCAM), proteína 5 morfogenética ósea (BMP5), BMP7, E selectina (molécula de adhesión de células endoteliales), molécula 2 de adhesión intercelular (ICAM2), ICAM3, L selectina (molécula de adhesión de leucocitos), y metaloproteinasa 1 de la matriz (MMP1). La FIG. 52 muestra el aumento en la secreción de metaloproteinasa 13 de la matriz (MMP13), MMP3, MMP9, molécula de adhesión de células endoteliales de plaquetas (PECAM 1), inhibidores de metaloproteinasa TIMP 1, TIMP 2, TIMP 4, y cadherina del epitelio vascular (VE) (proteína de adhesión celular dependiente de calcio). La FIG. 53 muestra el aumento en la secreción de antígeno de diferenciación de monocitos (CD14), antígeno de diferenciación celular (CD80), cardiotrofina-1 (CT-1), factor inhibidor de la leucemia (LIF), factor inhibidor de la migración de macrófagos (MIF), trombopoyetina (THPO), y linfotactina (XCL1).FIGS. 44-53 show the increase in the proteins named below (factors) of SR-hADSCs, 48 hours after IL-2 stimulation. Secretion levels are shown relative to the amount of the corresponding protein present at basal levels in media containing 10% PRP, used for support of hADSCs. FIG. 44 shows the increased secretion of interleukin 9 (IL9), interleukin 11 (IL-11), interleukin 12 alpha (IL12a), interleukin 12 beta (IL12b), and interleukin 18-binding protein alpha (IL18BPa). FIG. 45 shows increased secretion of type I interleukin 1 receptor (IL1R1), type II interleukin 1 receptor (IL1R2), type IV interleukin 1 receptor (IL1R4), interleukin 2 receptor beta (IL-2Rb), receptor interleukin 2 gamma (IL-2Rg), interleukin 5 receptor alpha (IL5Ra), interleukin 10 receptor beta (IL10Rb), interleukin 18 receptor beta (IL18Rb), and interleukin 21 receptor (IL-21R). FIG. 46 shows the increased secretion of fibroblast growth factor 4 (FGF4), FGF9, MSP alpha/HGF-like factor (HGF-like), insulin-like growth factor 1 (IGF1), IGF2, protein 6 of insulin-like growth factor (IGFBP6) binding, LAP (TGF beta family), and platelet-derived growth factor A alpha (PDGFAA). FIG. 47 shows increased secretion of platelet-derived growth factor A beta (PDGFAB), platelet-derived growth factor B beta (PDGFBB), stromal cell-derived factor 1 alpha (SDF1a), Ig-like lectin 5 that is binds sialic acid (Siglec 5), transforming growth factor alpha (TGFa), transforming growth factor beta 2 (TGFb2), vascular endothelial growth factor (VEGF), and vascular endothelial growth factor D (VEGFD). FIG. 47 also shows increased secretion of DR6, Dtk, EGFR, endoglin, ErbB3, Fas, Fas LG, and IGF1 sr. FIG. 48 shows increased secretion of leptin (LEP), leptin receptor (LEPR), macrophage colony-stimulating factor receptor 1 (MCSFR), neurotrophin 4 (NT4), osteoprotegerin (OPG), growth factor receptor alpha platelet-derived growth factor receptor beta (PDGFRa), platelet-derived growth factor receptor beta (PDGFRb), and prolactin (PRL). FIG. 49 shows increased secretion of stem cell factor receptor (SCFR), angiopoietin receptor 1 (TIE-1), angiopoietin receptor 1 (TIE-2), TNF superfamily member 10C (TNFSF10C), member TNF superfamily 10D (TNFSF10D), TNF superfamily member 14 (TNFSF14), urokinase plasminogen activator receptor (uPAR), and vascular endothelial growth factor receptor 2 (VEGFR2). FIG. 50 shows the increase in secretion of chemokine ligand 2 (CC motif) (CCL2), CCL3, CCL5, CCL8, CCL17, CCL20, CCL25, CXC chemokine ligand 5 (CXCL5), CXCL11, and CXCL16. FIG. 51 shows increased secretion of activated leukocyte cell adhesion molecule (ALCAM), bone morphogenetic protein 5 (BMP5), BMP7, E-selectin (endothelial cell adhesion molecule), intercellular adhesion molecule 2 (ICAM2), ICAM3, L-selectin (leukocyte adhesion molecule), and matrix metalloproteinase 1 (MMP1). FIG. 52 shows increased secretion of matrix metalloproteinase 13 (MMP13), MMP3, MMP9, platelet endothelial cell adhesion molecule (PECAM 1), metalloproteinase inhibitors TIMP 1, TIMP 2, TIMP 4, and epithelial cadherin vascular (VE) (calcium-dependent cell adhesion protein). FIG. 53 shows increased secretion of monocyte differentiation antigen (CD14), cell differentiation antigen (CD80), cardiotrophin-1 (CT-1), leukemia inhibitory factor (LIF), macrophage migration inhibitory factor (MIF), thrombopoietin (THPO), and lymphotactin (XCL1).
La FIG. 54 muestra el aumento en la secreción del receptor del factor de crecimiento nervioso (NGFR) de las SR-hADSC, 24 o 48 horas después de la estimulación con IL-2. La FIG. 54 también muestra el aumento en la secreción de IL8 y TNFRSF1A. En la FIG. 54 se encontró que estos factores no estaban presentes en PRP.FIG. 54 shows the increase in nerve growth factor receptor (NGFR) secretion from SR-hADSCs, 24 or 48 hours after IL-2 stimulation. FIG. 54 also shows the increased secretion of IL8 and TNFRSF1A. In FIG. 54 found that these factors were not present in PRP.
Las FIGS. 55-57 muestran el aumento en la secreción de las proteínas nombradas más abajo (factores) de las SR-hADSC, 72 horas después de la estimulación con IL-2. Los niveles de secreción se muestran con respecto a la cantidad de la proteína correspondiente presente en los niveles basales en los medios que contienen 10% PRP, usados para el soporte de las hADSC. La FIG. 55 muestra el aumento en la secreción del receptor alfa de interleucina 1 (IL1 Ra), interleucina 6 (IL6), y la subunidad alfa-2 del receptor de interleucina 13 (IL13Ra2). La FIG. 56 muestra el aumento en la secreción del factor 6 de crecimiento de fibroblastos (FGF6), proteína básica proplaquetaria (PPBP), factor de células madre (SCF), y receptor 3 del factor de crecimiento endotelial vascular (VEGFR3). La FIG. 57 muestra el aumento en la secreción del ligando 22 de quimiocina (motivo C-C) (CCL22), CCL23, CCL24, CCL26, y ligando 10 de quimiocina CXC (CXCL10).FIGS. 55-57 show the increase in secretion of the below named proteins (factors) from SR-hADSCs, 72 hours after IL-2 stimulation. Secretion levels are shown relative to the amount of the corresponding protein present at basal levels in media containing 10% PRP, used for support of hADSCs. FIG. 55 shows increased secretion of interleukin 1 receptor alpha (IL1 Ra), interleukin 6 (IL6), and interleukin 13 receptor alpha-2 subunit (IL13Ra2). FIG. 56 shows the increased secretion of fibroblast growth factor 6 (FGF6), proplatelet basic protein (PPBP), stem cell factor (SCF), and vascular endothelial growth factor receptor 3 (VEGFR3). FIG. 57 shows the increase in secretion of chemokine ligand 22 (C-C motif) (CCL22), CCL23, CCL24, CCL26, and CXC chemokine ligand 10 (CXCL10).
La FIG. 58 muestra el aumento en la secreción de angiotensina (ANG), factor neurotrófico derivado del cerebro (BDNF), proteína 4 morfogenética ósea (BMP4), factor 2 estimulante de colonias (CSF2), factor de crecimiento epidérmico (EGF), factor 7 de crecimiento de fibroblastos (FGF-7), interferón gamma (IFNg), proteína 1 de unión al factor de crecimiento similar a la insulina (IGFBP 1), e IGFBP 2 de las SR-hADSC, 72 horas después de la estimulación con IL-2. Se encontró que estos factores no estaban presentes en el PRP.FIG. 58 shows increased secretion of angiotensin (ANG), brain-derived neurotrophic factor (BDNF), bone morphogenetic protein 4 (BMP4), colony-stimulating factor 2 (CSF2), epidermal growth factor (EGF), growth factor 7 fibroblast growth (FGF-7), interferon gamma (IFNg), insulin-like growth factor-binding protein 1 (IGFBP 1), and IGFBP 2 from SR-hADSCs, 72 hours after IL- two. These factors were found not to be present in PRP.
La FIG. 59 muestra el aumento en la secreción del factor 6 de crecimiento de fibroblastos (FGF6), ligando 16 de quimiocina CXC (CXCL16), y factor 1 alfa derivado de células estromales (SDF1a) de las SEN-hADSC, 24 horas después de la incubación con 10% PRP solo (sin estimulación con IL-2). Los niveles de secreción se muestran con respecto a la cantidad de la proteína correspondiente presente en los niveles basales en los medios que contienen 10% PRP, usados para el soporte de las hADSC.FIG. 59 shows increased secretion of fibroblast growth factor 6 (FGF6), CXC chemokine ligand 16 (CXCL16), and stromal cell-derived factor 1 alpha (SDF1a) from SEN-hADSCs, 24 hours after incubation. with 10% PRP alone (without IL-2 stimulation). Secretion levels are shown relative to the amount of the corresponding protein present at basal levels in media containing 10% PRP, used for support of hADSCs.
La FIG. 60 muestra el aumento en la secreción del factor neurotrófico derivado del cerebro (BDNF), quimiocina de linfocitos B (CXCL13; BLC), ligando 1 de quimiocina (motivo CC) (CCL1), Flt-3 LG (ligando de tirosina cinasa 3 relacionada con Fms), fractalquina (quimiocina de células T CX3CL1), proteína 2 quimiotáctica de granulocitos (GCP-2)/CXCL6, interleucina 1 alfa (IL1a), interleucina 4 (IL4), IL15, e interferón gamma (IFNg) de las SEN-hADSC, 24 horas después incubación con 10% PRP solo (sin estimulación con IL-2). Se encontró que estos factores no estaban presentes en el PRP.FIG. 60 shows the increase in secretion of brain-derived neurotrophic factor (BDNF), B-cell chemokine (CXCL13; BLC), chemokine (CC motif) ligand 1 (CCL1), Flt-3 LG (tyrosine kinase-related ligand 3 with Fms), fractalkine (T cell chemokine CX3CL1), granulocyte chemotactic protein 2 (GCP-2)/CXCL6, interleukin 1 alpha (IL1a), interleukin 4 (IL4), IL15, and interferon gamma (IFNg) from SEN -hADSC, 24 hours after incubation with 10% PRP alone (no IL-2 stimulation). These factors were found not to be present in PRP.
Las FIGS. 61-70 muestran el aumento en la secreción de las proteínas nombradas más abajo (factores) de las SEN-hADSC, 48 horas después de la incubación con 10% PRP solo (sin estimulación con IL-2). Los niveles de secreción se muestran con respecto a la cantidad de la proteína correspondiente presente en los niveles basales en los medios que contienen 10% PRP, usados para el soporte de las hADSC. La FIG. 61 muestra el aumento en la secreción de interleucina 2 beta (IL-2b), IL3, IL5, e IL6. La FIG. 62 muestra el aumento en la secreción del receptor tipo II de interleucina 1 (IL1R2), receptor gamma de interleucina 2 (IL-2Rg), receptor alfa de interleucina 5 (IL5Ra), receptor beta de interleucina 10 (IL10Rb), proteína alfa de unión al receptor de interleucina 18 (IL18BPa), receptor beta de interleucina 18 (IL18Rb), y receptor de interleucina 21 (IL-21R). La FIG. 63 muestra el aumento en la secreción del factor 1 de crecimiento similar a la insulina (IGF1), IGF2, LAP (familia de TGF beta), leptina (LEP), receptor de leptina (LEPR), factor A alfa de crecimiento derivado de plaquetas (PDGFAA), factor A beta de crecimiento derivado de plaquetas (PDGFAB), y factor B beta de crecimiento derivado de plaquetas (PDGFBB). La FIG. 64 muestra el aumento en la secreción del receptor alfa del factor de crecimiento derivado de plaquetas (PDGFRa), factor de células madre (SCF), receptor del factor de células madre (SCFR), factor beta 1 de crecimiento transformante (TGF b1), factor beta 2 de crecimiento transformante (TGF b2), factor alfa de crecimiento transformante (TGFa), receptor 2 del factor de crecimiento endotelial vascular (VEGFR2), y VEGFR3. La FIG. 65 muestra el aumento en la secreción del receptor 6 de muerte (DR6; miembro 21 de la superfamilia del receptor de TNF), factor neurotrófico derivado de la línea de células gliales (GDNF), neurotrofina 3 (NT3), tirosina cinasa con dominios 1 similar a inmunoglobulina y similar a EGF (TIE-1), TIE-2, y miembro 14 de la superfamilia de TNF (TNFSF14). La FIG. 66 muestra el aumento en la secreción del ligando 2 de quimiocina (motivo C-C) (CCL2), CCL5, CCL8, CCL17, CCL18, y CCL23. La FIG. 67 muestra el aumento en la secreción del ligando 24 de quimiocina (motivo C-C) (CCL24), CCL25, CCL26, CCL27, ligando 10 de quimiocina CXC (CXCL10), y CXCL11. La FIG. 68 muestra el aumento en la secreción de molécula de adhesión celular leucocitaria activada (ALCAM), proteína 5 morfogenética ósea (BMP5), BMP7, E selectina (molécula de adhesión de células endoteliales), molécula 1 de adhesión intercelular (ICAM1), ICAM2, L selectina (molécula de adhesión de leucocitos), y metaloproteinasa 1 de la matriz (MMP1). La FIG. 69 muestra el aumento en la secreción de metaloproteinasa 3 de la matriz (MMP3), MMP9, MMP13, molécula de adhesión de células endoteliales plaquetarias (PECAM 1), inhibidores de metaloproteinasa TIMP 1, TIMP 2, y TIMP 4. La FIG. 70 muestra el aumento en la secreción del antígeno de diferenciación de monocitos (CD14), antígeno de diferenciación de monocitos (CD80), cardiotrofina-1 (CT-1), y factor inhibidor de leucemia (LIF).FIGS. 61-70 show the increase in secretion of the below named proteins (factors) from SEN-hADSCs, 48 hours after incubation with 10% PRP alone (without IL-2 stimulation). Secretion levels are shown relative to the amount of the corresponding protein present at basal levels in media containing 10% PRP, used for support of hADSCs. FIG. 61 shows the increased secretion of interleukin 2 beta (IL-2b), IL3, IL5, and IL6. FIG. 62 shows increased secretion of type II interleukin 1 receptor (IL1R2), interleukin 2 receptor gamma (IL-2Rg), interleukin 5 receptor alpha (IL5Ra), interleukin 10 receptor beta (IL10Rb), interleukin 10 receptor beta (IL10Rb), binding to interleukin 18 receptor (IL18BPa), interleukin 18 receptor beta (IL18Rb), and interleukin 21 receptor (IL-21R). FIG. 63 shows increased secretion of insulin-like growth factor 1 (IGF1), IGF2, LAP (TGF beta family), leptin (LEP), leptin receptor (LEPR), platelet-derived growth factor A alpha (PDGFAA), platelet-derived growth factor A beta (PDGFAB), and platelet-derived growth factor B beta (PDGFBB). FIG. 64 shows increased secretion of platelet-derived growth factor receptor alpha (PDGFRa), stem cell factor (SCF), stem cell factor receptor (SCFR), transforming growth factor beta 1 (TGF b1), transforming growth factor beta 2 (TGF b2), transforming growth factor alpha (TGFa), vascular endothelial growth factor receptor 2 (VEGFR2), and VEGFR3. FIG. 65 shows increased secretion of death receptor 6 (DR6; member 21 of the TNF receptor superfamily), glial cell line-derived neurotrophic factor (GDNF), neurotrophin 3 (NT3), tyrosine kinase domain 1 immunoglobulin-like and EGF-like (TIE-1), TIE-2, and TNF superfamily member 14 (TNFSF14). FIG. 66 shows the increase in secretion of chemokine ligand 2 (CC motif) (CCL2), CCL5, CCL8, CCL17, CCL18, and CCL23. FIG. 67 shows the increase in secretion of chemokine ligand 24 (CC motif) (CCL24), CCL25, CCL26, CCL27, CXC chemokine ligand 10 (CXCL10), and CXCL11. FIG. 68 shows increased secretion of activated leukocyte cell adhesion molecule (ALCAM), bone morphogenetic protein 5 (BMP5), BMP7, E-selectin (endothelial cell adhesion molecule), intercellular adhesion molecule 1 (ICAM1), ICAM2, L-selectin (leukocyte adhesion molecule), and matrix metalloproteinase 1 (MMP1). FIG. 69 shows the increase in secretion of matrix metalloproteinase 3 (MMP3), MMP9, MMP13, platelet endothelial cell adhesion molecule (PECAM 1), metalloproteinase inhibitors TIMP 1, TIMP 2, and TIMP 4. FIG. 70 shows the increase in secretion of monocyte differentiation antigen (CD14), monocyte differentiation antigen (CD80), cardiotrophin-1 (CT-1), and leukemia inhibitory factor (LIF).
Las FIGS. 71-72 muestran el aumento en la secreción de las proteínas (factores) nombradas más abajo de las SEN-hADSC, 48 horas después de la incubación con 10% PRP solo (sin estimulación con IL-2). Se encontró que estos factores no estaban presentes en el PRP. La FIG. 71 muestra el aumento en la secreción de proteína 4 morfogenética ósea (BMP4), ligando 11 de quimiocina (motivo CC) (CCL11), CCL23, factor neurotrófico ciliar (CNTF), factor de crecimiento epidérmico (EGF), factor 7 de crecimiento de fibroblastos (FGF7), proteína 1 de unión al factor de crecimiento similar a la insulina (IGFBP1), IGFBP2, IGFBP4, y receptor del factor de crecimiento nervioso (NGFR). La FIG. 72 muestra el aumento en la secreción de interleucina 7 (IL7), IL10, IL13, e IL-16.FIGS. 71-72 show the increase in secretion of the proteins (factors) named below from SEN-hADSCs, 48 hours after incubation with 10% PRP alone (without IL-2 stimulation). These factors were found not to be present in PRP. FIG. 71 shows increased secretion of bone morphogenetic protein 4 (BMP4), chemokine ligand 11 (CC motif) (CCL11), CCL23, ciliary neurotrophic factor (CNTF), epidermal growth factor (EGF), epidermal growth factor 7 fibroblasts (FGF7), insulin-like growth factor binding protein 1 (IGFBP1), IGFBP2, IGFBP4, and nerve growth factor receptor (NGFR). FIG. 72 shows the increase in the secretion of interleukin 7 (IL7), IL10, IL13, and IL-16.
La FIG. 73 muestra el aumento en la secreción de probetacelulina (BTC), subunidad alfa 2 del receptor de interleucina 13 (IL13Ra2), y factor 1 beta derivado de células estromales (SDF1b) de las SEN-hADSC, 72 horas después de la incubación con 10% PRP solo (sin estimulación con IL-2). Los niveles de secreción se muestran con respecto a la cantidad de la proteína correspondiente presente en los niveles basales en los medios que contienen 10% PRP, usados para el soporte de las hADSC.FIG. 73 shows the increase in secretion of probe cellulin (BTC), interleukin 13 receptor alpha 2 subunit (IL13Ra2), and stromal cell-derived factor 1 beta (SDF1b) from SEN-hADSCs, 72 hours after incubation with 10 % PRP alone (without IL-2 stimulation). Secretion levels are shown relative to the amount of the corresponding protein present at basal levels in media containing 10% PRP, used for support of hADSCs.
La FIG. 74 muestra el aumento en la secreción del factor de crecimiento de hepatocitos (HGF), interleucina 8 (IL8), y TNFRSF1A (superfamilia de receptores del factor de necrosis tumoral, miembro 1A) de las SEN-hADSC, 72 horas después de la incubación con 10% PRP solo (sin estimulación con IL-2). Se encontró que estos factores no estaban presentes en el PRP.FIG. 74 shows increased secretion of hepatocyte growth factor (HGF), interleukin 8 (IL8), and TNFRSF1A (tumor necrosis factor receptor superfamily, member 1A) from SEN-hADSCs, 72 hours after incubation. with 10% PRP alone (without IL-2 stimulation). These factors were found not to be present in PRP.
La FIG. 75 muestra el aumento en la secreción del ligando 23 de quimiocina (motivo CC) (CCL23), factor neurotrófico ciliar (CNTF), factor de crecimiento epidérmico (EGF), CCL11 (eotaxina 1), IL4, y receptor del factor de crecimiento nervioso (NGFR) de la SEN-hADSC, 24 horas después de la estimulación con IL-2. Se encontró que estos factores no estaban presentes en el PRP.FIG. 75 shows increased secretion of chemokine (CC motif) ligand 23 (CCL23), ciliary neurotrophic factor (CNTF), epidermal growth factor (EGF), CCL11 (eotaxin 1), IL4, and nerve growth factor receptor (NGFR) of the SEN-hADSC, 24 hours after stimulation with IL-2. These factors were found not to be present in PRP.
La FIG. 75 también muestra el aumento en la secreción de CXCL16, HCC4, sgp130, y TNFRSF1B a las 24 h después de la estimulación con IL-2. Los niveles de secreción se muestran con respecto a la cantidad de la proteína correspondiente presente en los niveles basales en los medios que contienen 10% PRP.FIG. 75 also shows the increased secretion of CXCL16, HCC4, sgp130, and TNFRSF1B at 24 h after IL-2 stimulation. Secretion levels are shown relative to the amount of the corresponding protein present at basal levels in media containing 10% PRP.
Las FIGS. 76-86 muestran el aumento en la secreción de las proteínas nombradas más abajo (factores) de las SEN-hADSC, 48 horas después de la estimulación con IL-2. Los niveles de secreción se muestran con respecto a la cantidad de la proteína correspondiente presente en los niveles basales en los medios que contienen 10% PRP, usados para el soporte de las hADSC. La FIG. 76 muestra el aumento en la secreción de interleucina 1 beta (IL1 b), IL3, IL5, IL6, IL9, IL10, IL12b, y proteína alfa de unión a interleucina 18 (IL18BPa). La FIG. 77 muestra el aumento en la secreción del receptor alfa de interleucina 1 (IL1 Ra), IL1R4, IL10Rb, IL18Rb, IL1R2, IL-21R, IL-2RP, IL-2Ry, e IL5Ra. La FIG.FIGS. 76-86 show the increase in secretion of the below named proteins (factors) from SEN-hADSCs, 48 hours after IL-2 stimulation. Secretion levels are shown relative to the amount of the corresponding protein present at basal levels in media containing 10% PRP, used for support of hADSCs. FIG. 76 shows increased secretion of interleukin 1 beta (IL1 b), IL3, IL5, IL6, IL9, IL10, IL12b, and interleukin 18-binding protein alpha (IL18BPa). FIG. 77 shows increased secretion of interleukin 1 receptor alpha (IL1 Ra), IL1R4, IL10Rb, IL18Rb, IL1R2, IL-21R, IL-2RP, IL-2Ry, and IL5Ra. FIG.
78 muestra el aumento en la secreción del factor 6 de crecimiento de fibroblastos (FGF6), factores de crecimiento similares a la insulina IGF1 e IGF2, LAP (familia de TGF beta), neurotrofina 3 (NT3), factor A alfa de crecimiento derivado de plaquetas (PDGFAA), factor A beta de crecimiento derivado de plaquetas (PDGFAB), y receptor alfa del factor de crecimiento derivado de plaquetas (PDGFRa). La FIG. 79 muestra el aumento en la secreción del factor de células madre (SCF), factor de 2 crecimiento transformante (TGF2), TGFa, TGFP1, TGFb3, factor beta de necrosis tumoral (TNFb), receptor 2 del factor de crecimiento endotelial vascular (VEGF R2), y VEGF R3. La FIG. 80 muestra el aumento en la secreción de DR6 (miembro 21 de la superfamilia de receptores de TNF), endoglina (ENG), tirosinaproteína cinasa receptora erbB-3 (ErbB3), ligando de Fas (Fas LG), factor neurotrófico derivado de la línea de células gliales (GDNF), ligando de GITR (GITR LG), y receptor de leptina (LEPR). La FIG. 81 muestra el aumento en la secreción de prolactina (PRL), receptor del factor de células madre (SCFR), lectina 5 similar a Ig que se une al ácido siálico (Siglec 5), receptor de angiopoyetina 1 (TIE-1), y receptor de angiopoyetina 1 (TIE-2). La FIG. 82 muestra el aumento en la secreción del ligando 8 de quimiocina (motivo C-C) (CCL8), CCL13, CCL15, CCL17, CCL18, y CCL20. La FIG. 83 muestra el aumento en la secreción del ligando 22 de quimiocina (motivo C-C) (CCL22), CCL24, CCL26, ligando 9 de quimiocina CXC (CXCL9), y CXCL11. La FIG. 84 muestra el aumento en la secreción de activina A (INHBA), proteína 5 morfogenética ósea (BMP5), E selectina (molécula de adhesión de células endoteliales), molécula 1 de adhesión intercelular (ICAM 1), ICAM 2, L selectina (molécula de adhesión de leucocitos), y factor estimulante de colonias de macrófagos (MCSF). La FIG. 85 muestra el aumento en la secreción de metaloproteinasa 1 de la matriz (MMP1), MMP13, MMP3, MMP9, molécula de adhesión de células endoteliales plaquetarias (PECAM 1), e inhibidor 4 de metaloproteinasa (TIMP-4). La FIG. 86 muestra el aumento en la secreción del antígeno de diferenciación de monocitos (CD14), linfotactina (XCL1), cardiotrofina-1 (CT-1), factor inhibidor de la leucemia (LIF), factor inhibidor de la migración de macrófagos (MIF), y proteína básica proplaquetaria (PPBP).78 shows increased secretion of fibroblast growth factor 6 (FGF6), insulin-like growth factors IGF1 and IGF2, LAP (TGF beta family), neurotrophin 3 (NT3), growth factor A alpha derived from platelets (PDGFAA), platelet-derived growth factor A beta (PDGFAB), and platelet-derived growth factor receptor alpha (PDGFRa). FIG. 79 shows increased secretion of stem cell factor (SCF), transforming growth factor 2 (TGF2), TGFα, TGFP1, TGFb3, tumor necrosis factor beta (TNFb), vascular endothelial growth factor receptor 2 (VEGF R2), and VEGF R3. FIG. 80 shows increased secretion of DR6 (TNF receptor superfamily member 21), endoglin (ENG), erbB-3 receptor tyrosineprotein kinase (ErbB3), Fas ligand (Fas LG), line-derived neurotrophic factor of glial cells (GDNF), GITR ligand (GITR LG), and leptin receptor (LEPR). FIG. 81 shows increased secretion of prolactin (PRL), stem cell factor receptor (SCFR), sialic acid-binding Ig-like lectin 5 (Siglec 5), angiopoietin receptor 1 (TIE-1), and angiopoietin receptor 1 (AIT-2). FIG. 82 shows the increase in secretion of chemokine ligand 8 (CC motif) (CCL8), CCL13, CCL15, CCL17, CCL18, and CCL20. FIG. 83 shows the increased secretion of chemokine ligand 22 (CC motif) (CCL22), CCL24, CCL26, CXC chemokine ligand 9 (CXCL9), and CXCL11. FIG. 84 shows the increased secretion of activin A (INHBA), bone morphogenetic protein 5 (BMP5), E selectin (endothelial cell adhesion molecule), intercellular adhesion molecule 1 (ICAM 1), ICAM 2, L selectin (endothelial cell adhesion molecule). leukocyte adhesion), and macrophage colony-stimulating factor (MCSF). FIG. 85 shows increased secretion of matrix metalloproteinase 1 (MMP1), MMP13, MMP3, MMP9, platelet endothelial cell adhesion molecule (PECAM 1), and metalloproteinase inhibitor 4 (TIMP-4). FIG. 86 shows increased secretion of monocyte differentiation antigen (CD14), lymphotactin (XCL1), cardiotrophin-1 (CT-1), leukemia inhibitory factor (LIF), macrophage migration inhibitory factor (MIF) , and proplatelet basic protein (PPBP).
La FIG. 87 muestra el aumento en la secreción del factor neurotrófico derivado del cerebro (BDNF), proteína 4 morfogenética ósea (BMP4), factor 7 de crecimiento de fibroblastos (FGF7), proteína 2 de unión al factor de crecimiento similar a la insulina (IGFBP2), IL-2, IL-16, e interferón gamma (INF gamma) de las SEN-hADSC, 48 horas después de la estimulación con IL-2. Se encontró que estos factores no estaban presentes en el PRP.FIG. 87 shows increased secretion of brain-derived neurotrophic factor (BDNF), bone morphogenetic protein 4 (BMP4), fibroblast growth factor 7 (FGF7), insulin-like growth factor-binding protein 2 (IGFBP2) , IL-2, IL-16, and interferon gamma (INF gamma) from SEN-hADSCs, 48 hours after IL-2 stimulation. These factors were found not to be present in PRP.
Las FIGS. 88-89 muestran el aumento en la secreción de las proteínas nombradas más abajo (factores) de las SEN-hADSC, 72 horas después de la estimulación con IL-2. Los niveles de secreción se muestran con respecto a la cantidad de la proteína correspondiente presente en los niveles basales en los medios que contienen 10% PRP, usados para el soporte de las hADSC. La FIG. 88 muestra el aumento en la secreción de adiponectina (Acrp30), proteína relacionada con Agouti (AgRP), ANGPT2 (angiopoyetina 2), factor de crecimiento de fibroblastos básico (bFGF), probetacelulina (BTC), subunidad alfa 2 del receptor de interleucina 13 (IL13Ra2), leptina (LEP), neurotrofina 4 (NT4), y factor 1 alfa derivado de células estromales (SDF1a). La FIG. 89 muestra el aumento en la secreción del ligando 2 de quimiocina (motivo C-C) (CCL2), CCL4, CCL5, CCL23, CCL25, CCL27, ligando 10 de quimiocina CXC (CXCL10), factor 1 beta derivado de células estromales (SDF1b), inhibidores de metaloproteinasa 1 (TIMP1), TIMP2, y miembro 14 de la superfamilia del factor de necrosis tumoral (TNFSF14).FIGS. 88-89 show the increase in secretion of the below named proteins (factors) from SEN-hADSCs, 72 hours after IL-2 stimulation. Secretion levels are shown relative to the amount of the corresponding protein present at basal levels in media containing 10% PRP, used for support of hADSCs. FIG. 88 shows increased secretion of adiponectin (Acrp30), Agouti-related protein (AgRP), ANGPT2 (angiopoietin 2), basic fibroblast growth factor (bFGF), probe cellulin (BTC), interleukin 13 receptor alpha 2 subunit (IL13Ra2), leptin (LEP), neurotrophin 4 (NT4), and stromal cell-derived factor 1 alpha (SDF1a). FIG. 89 shows increased secretion of chemokine ligand 2 (C-C motif) (CCL2), CCL4, CCL5, CCL23, CCL25, CCL27, CXC chemokine ligand 10 (CXCL10), stromal cell-derived factor 1 beta (SDF1b), inhibitors of metalloproteinase 1 (TIMP1), TIMP2, and tumor necrosis factor superfamily member 14 (TNFSF14).
La FIG. 90 muestra el aumento en la secreción del factor estimulante de colonias de granulocitos y macrófagos (GM-CSF) e IL13 de las SEN-hADSC, 72 horas después de la estimulación con IL-2. Se encontró que estos factores no estaban presentes en el PRP.FIG. 90 shows the increase in granulocyte-macrophage colony-stimulating factor (GM-CSF) and IL13 secretion from SEN-hADSCs, 72 hours after IL-2 stimulation. These factors were found not to be present in PRP.
Tabla 5A: Genes regulados al alza diferencialmente en SR IL-2Table 5A: Differentially Upregulated Genes in SR IL-2


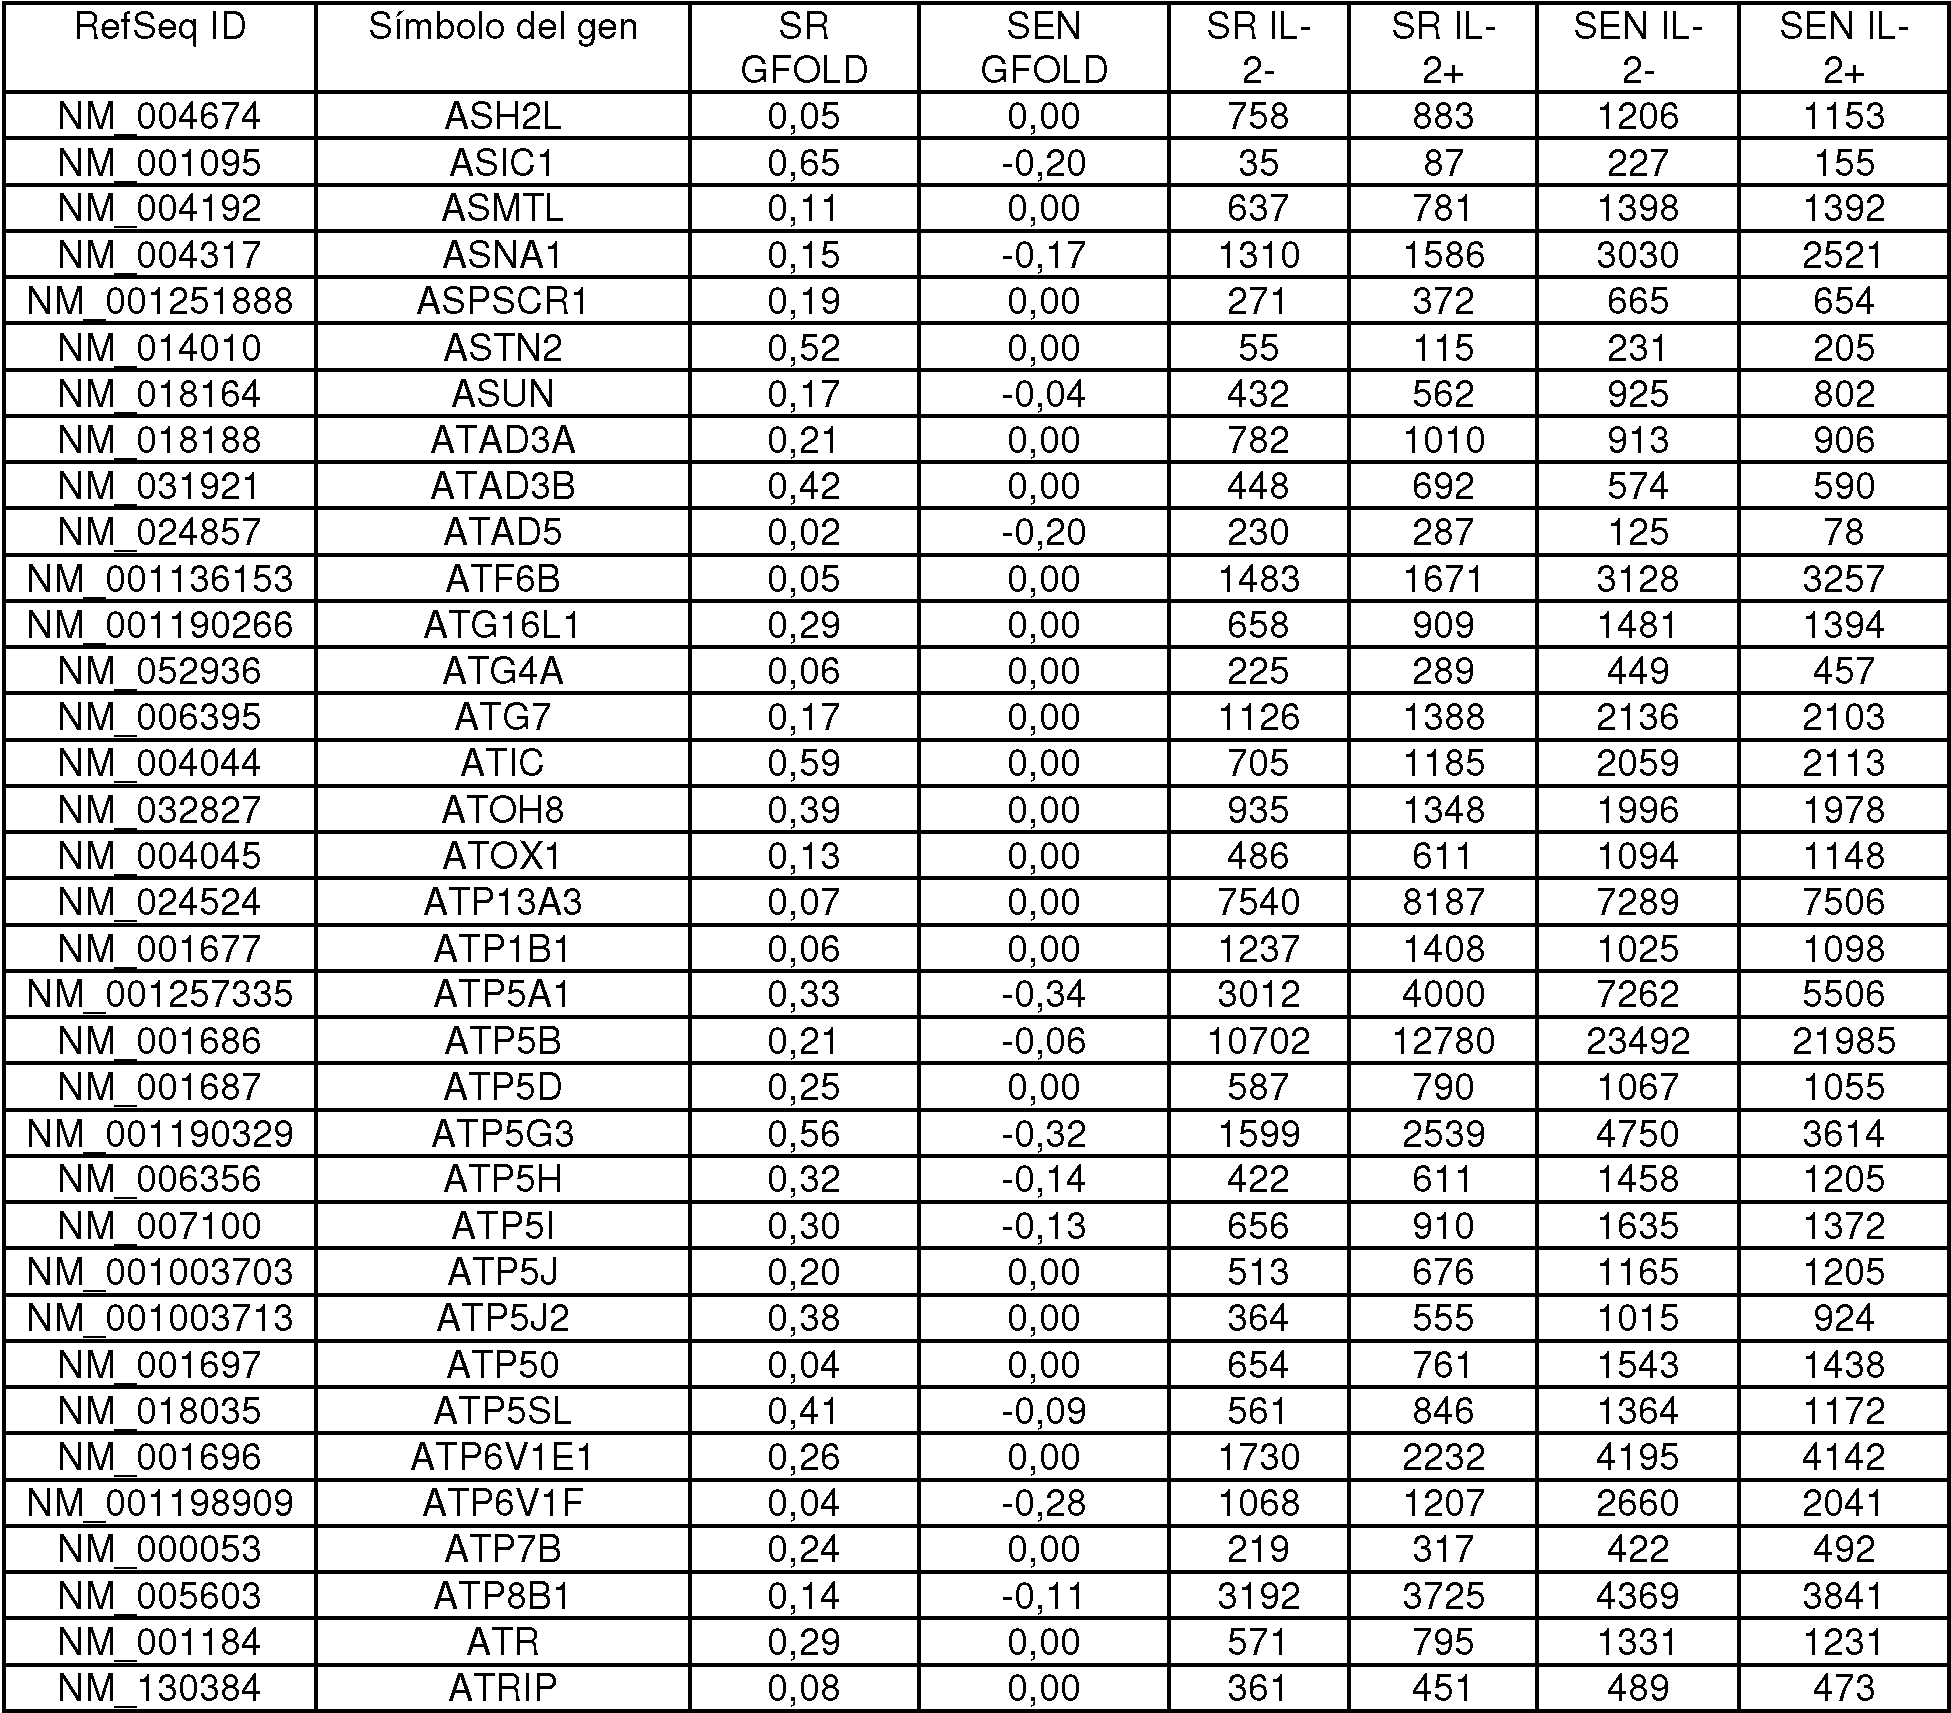


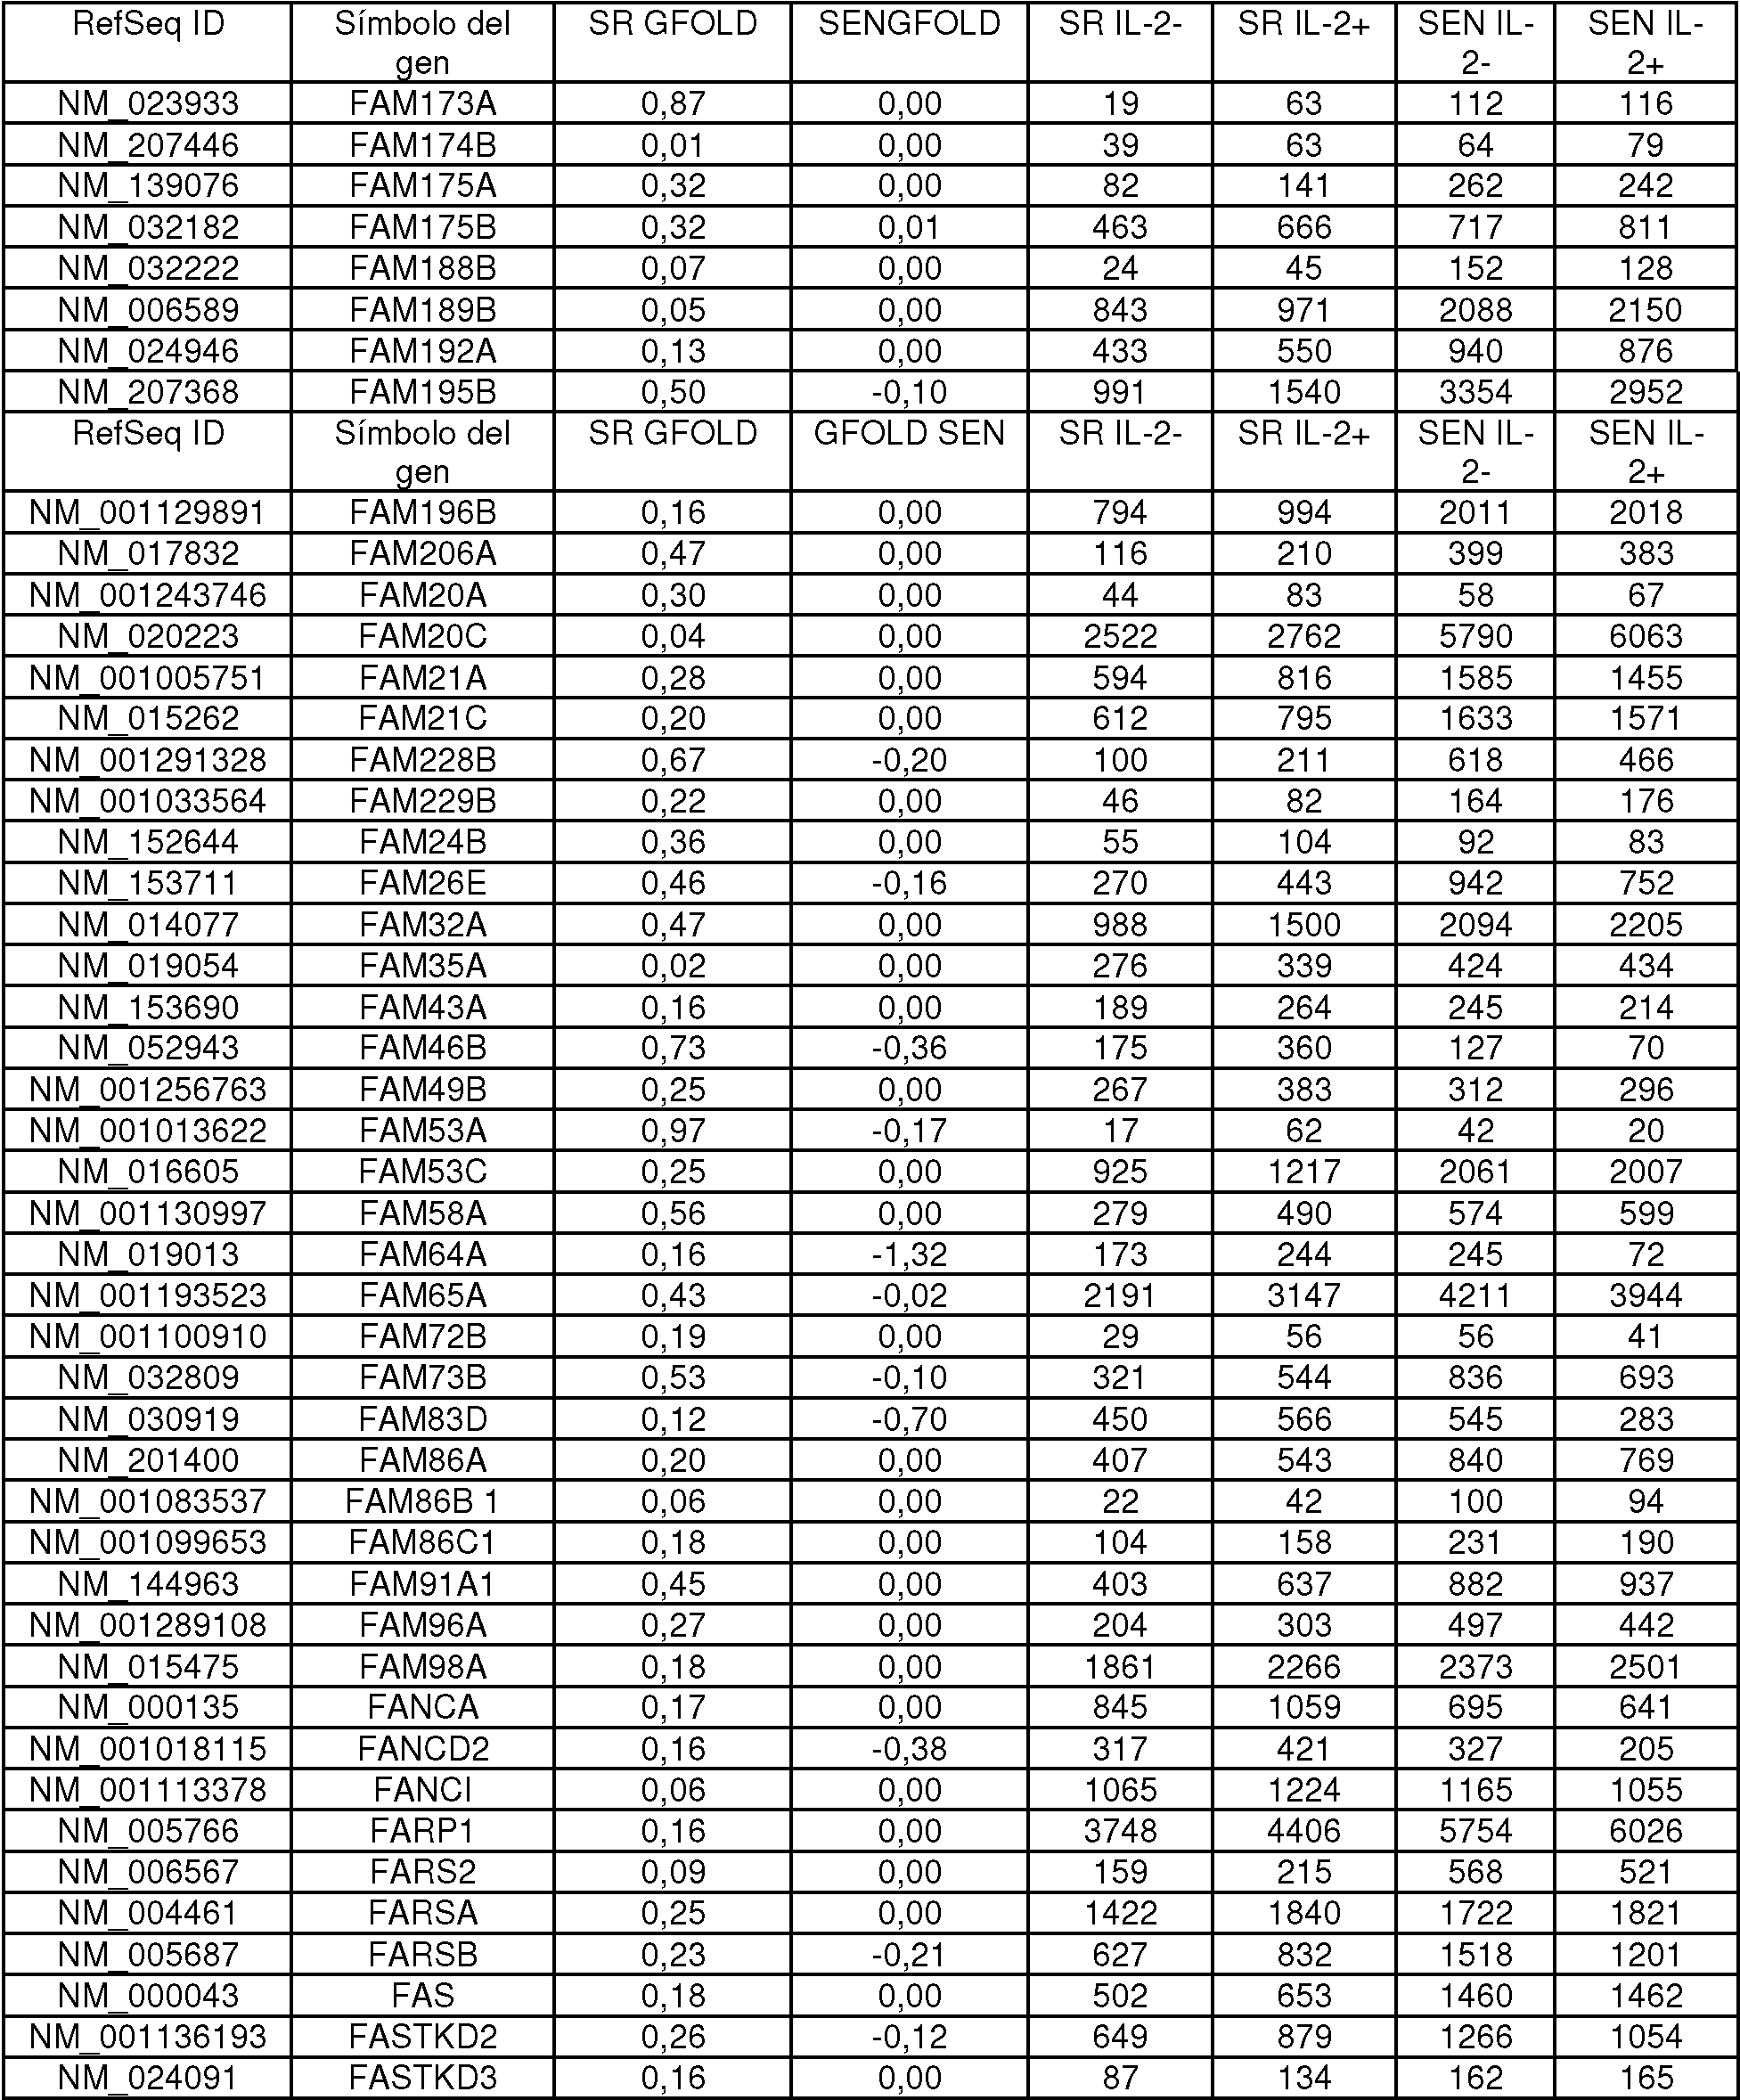


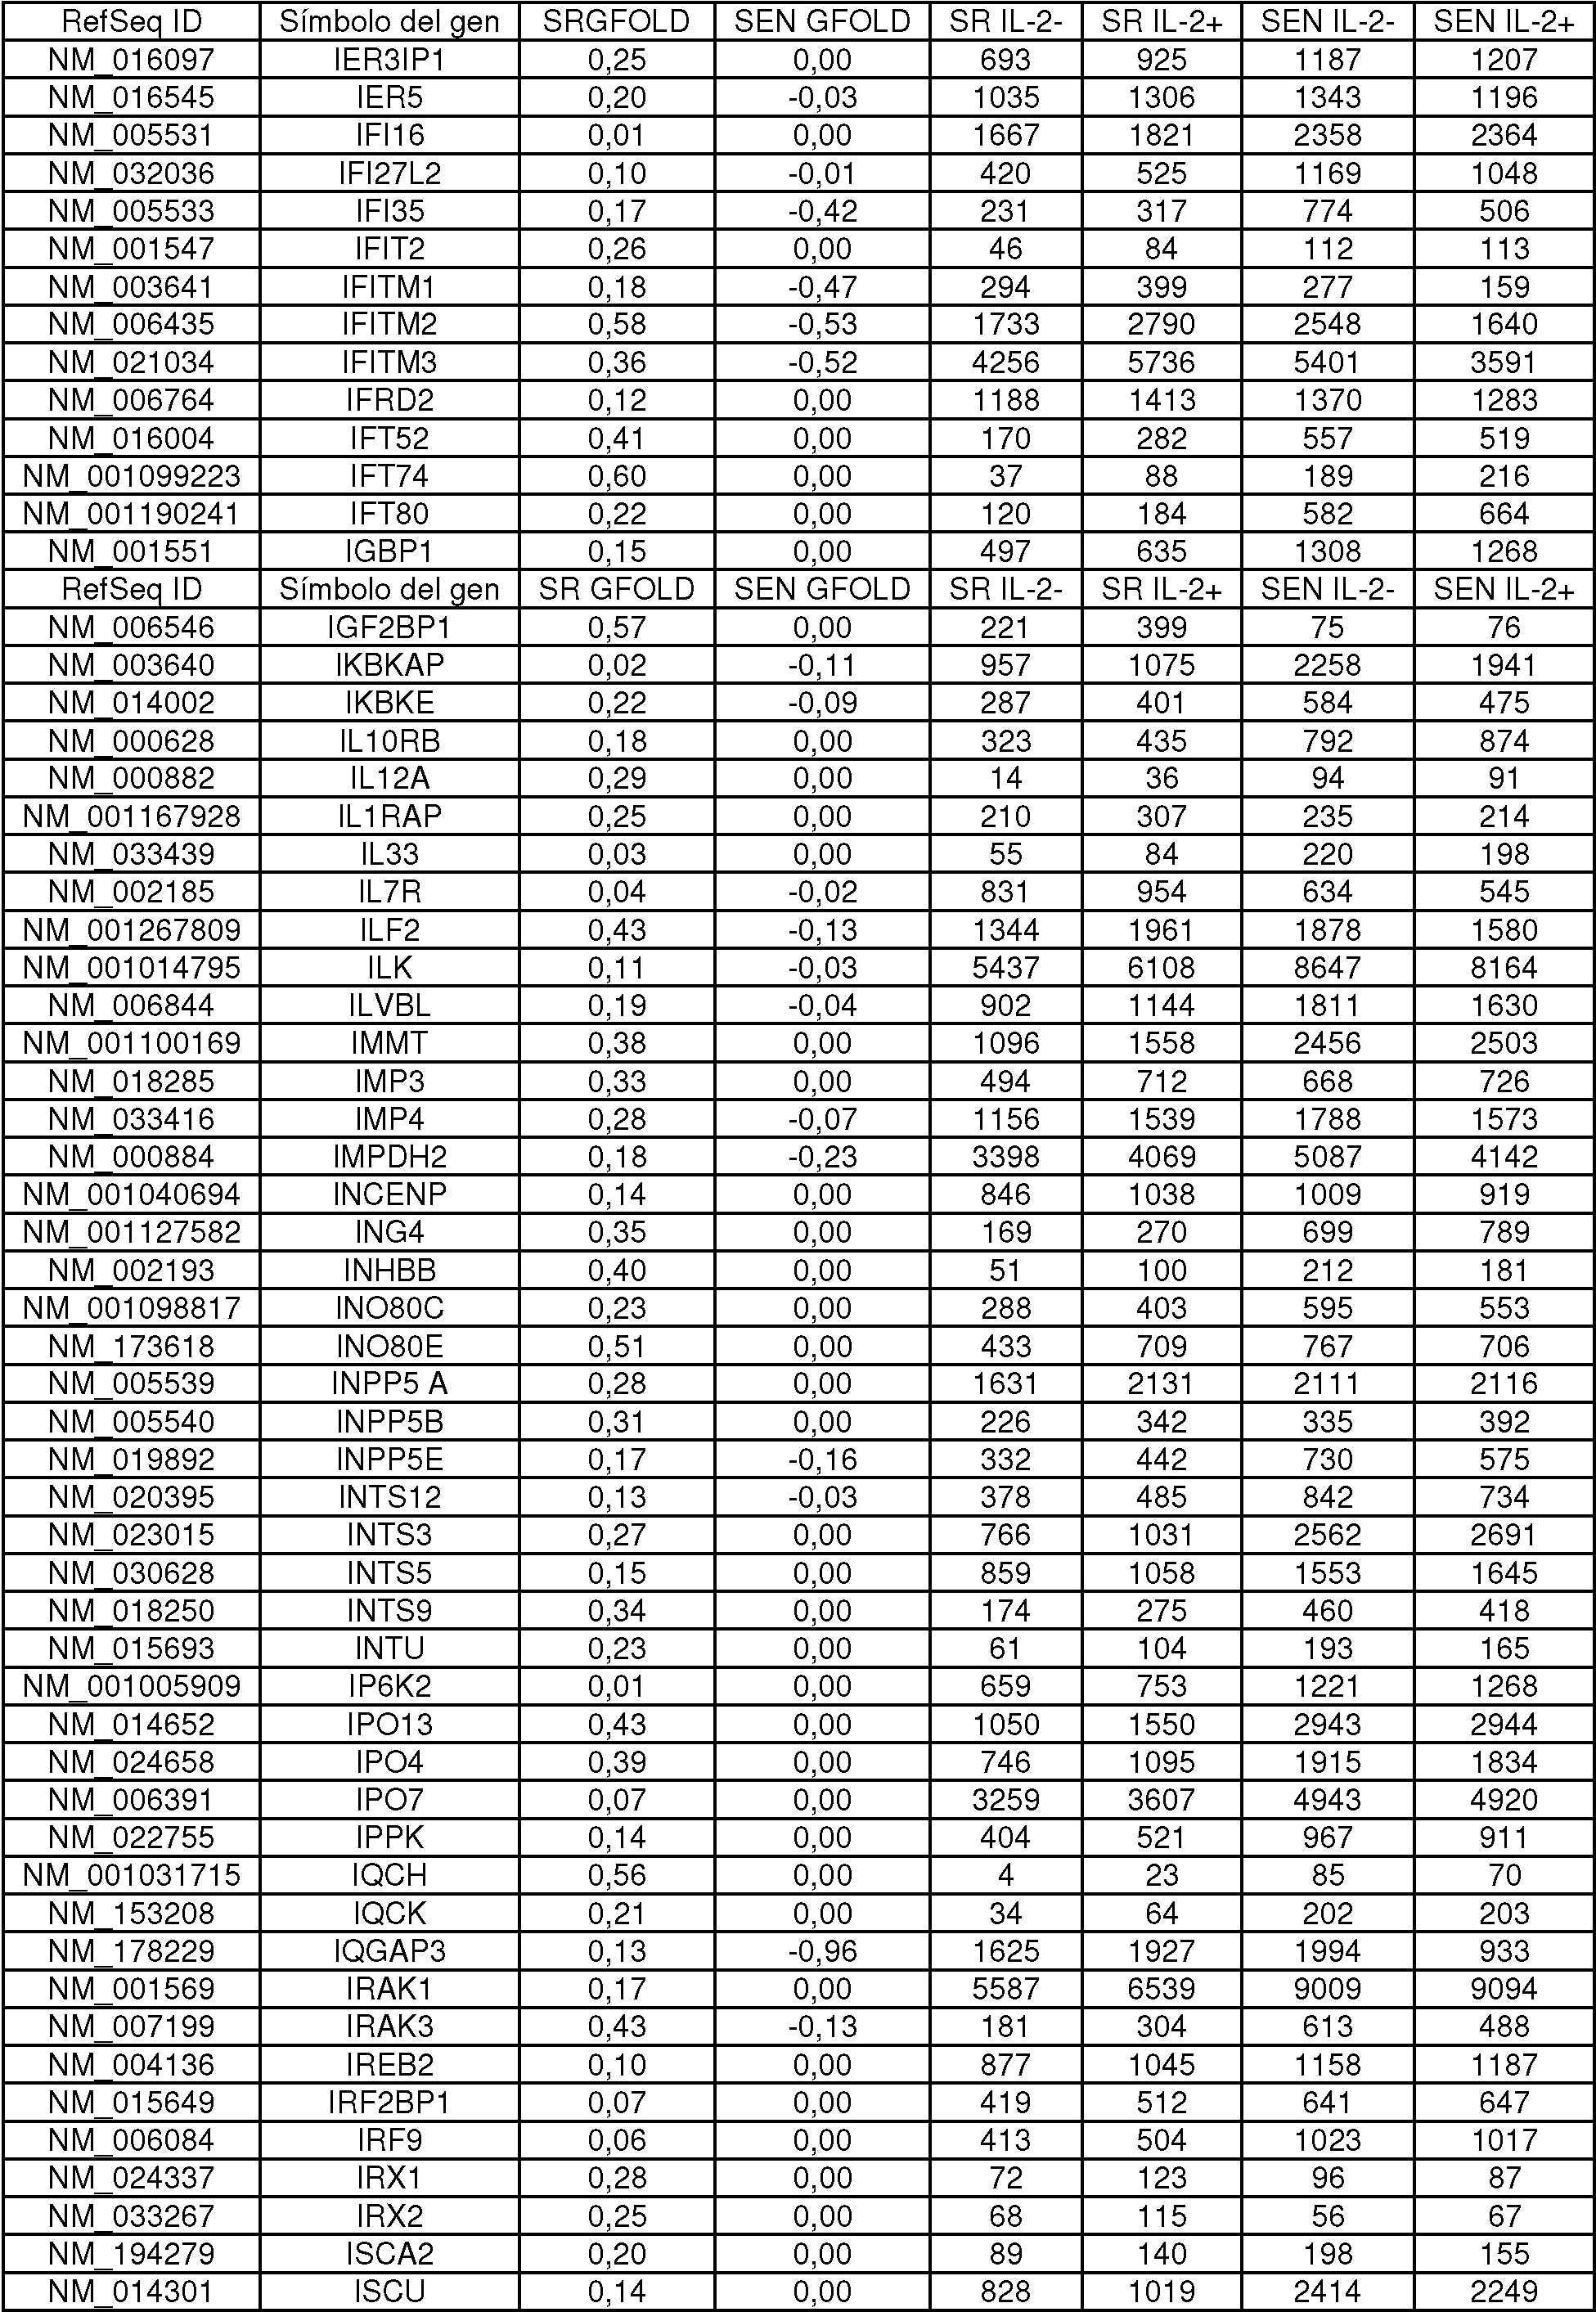


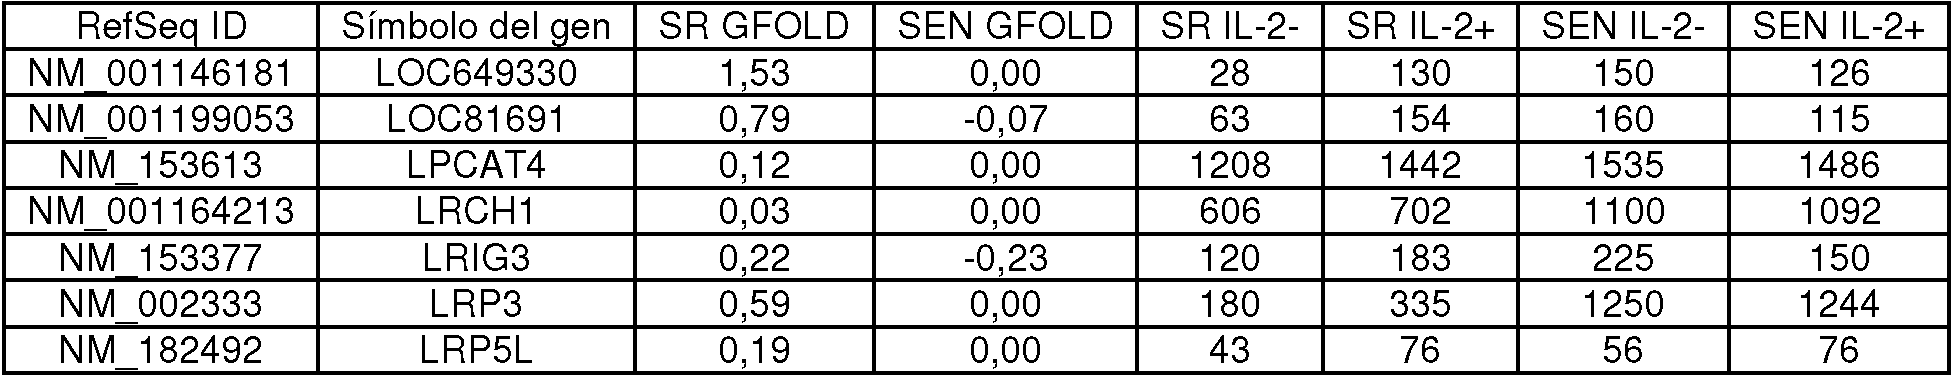


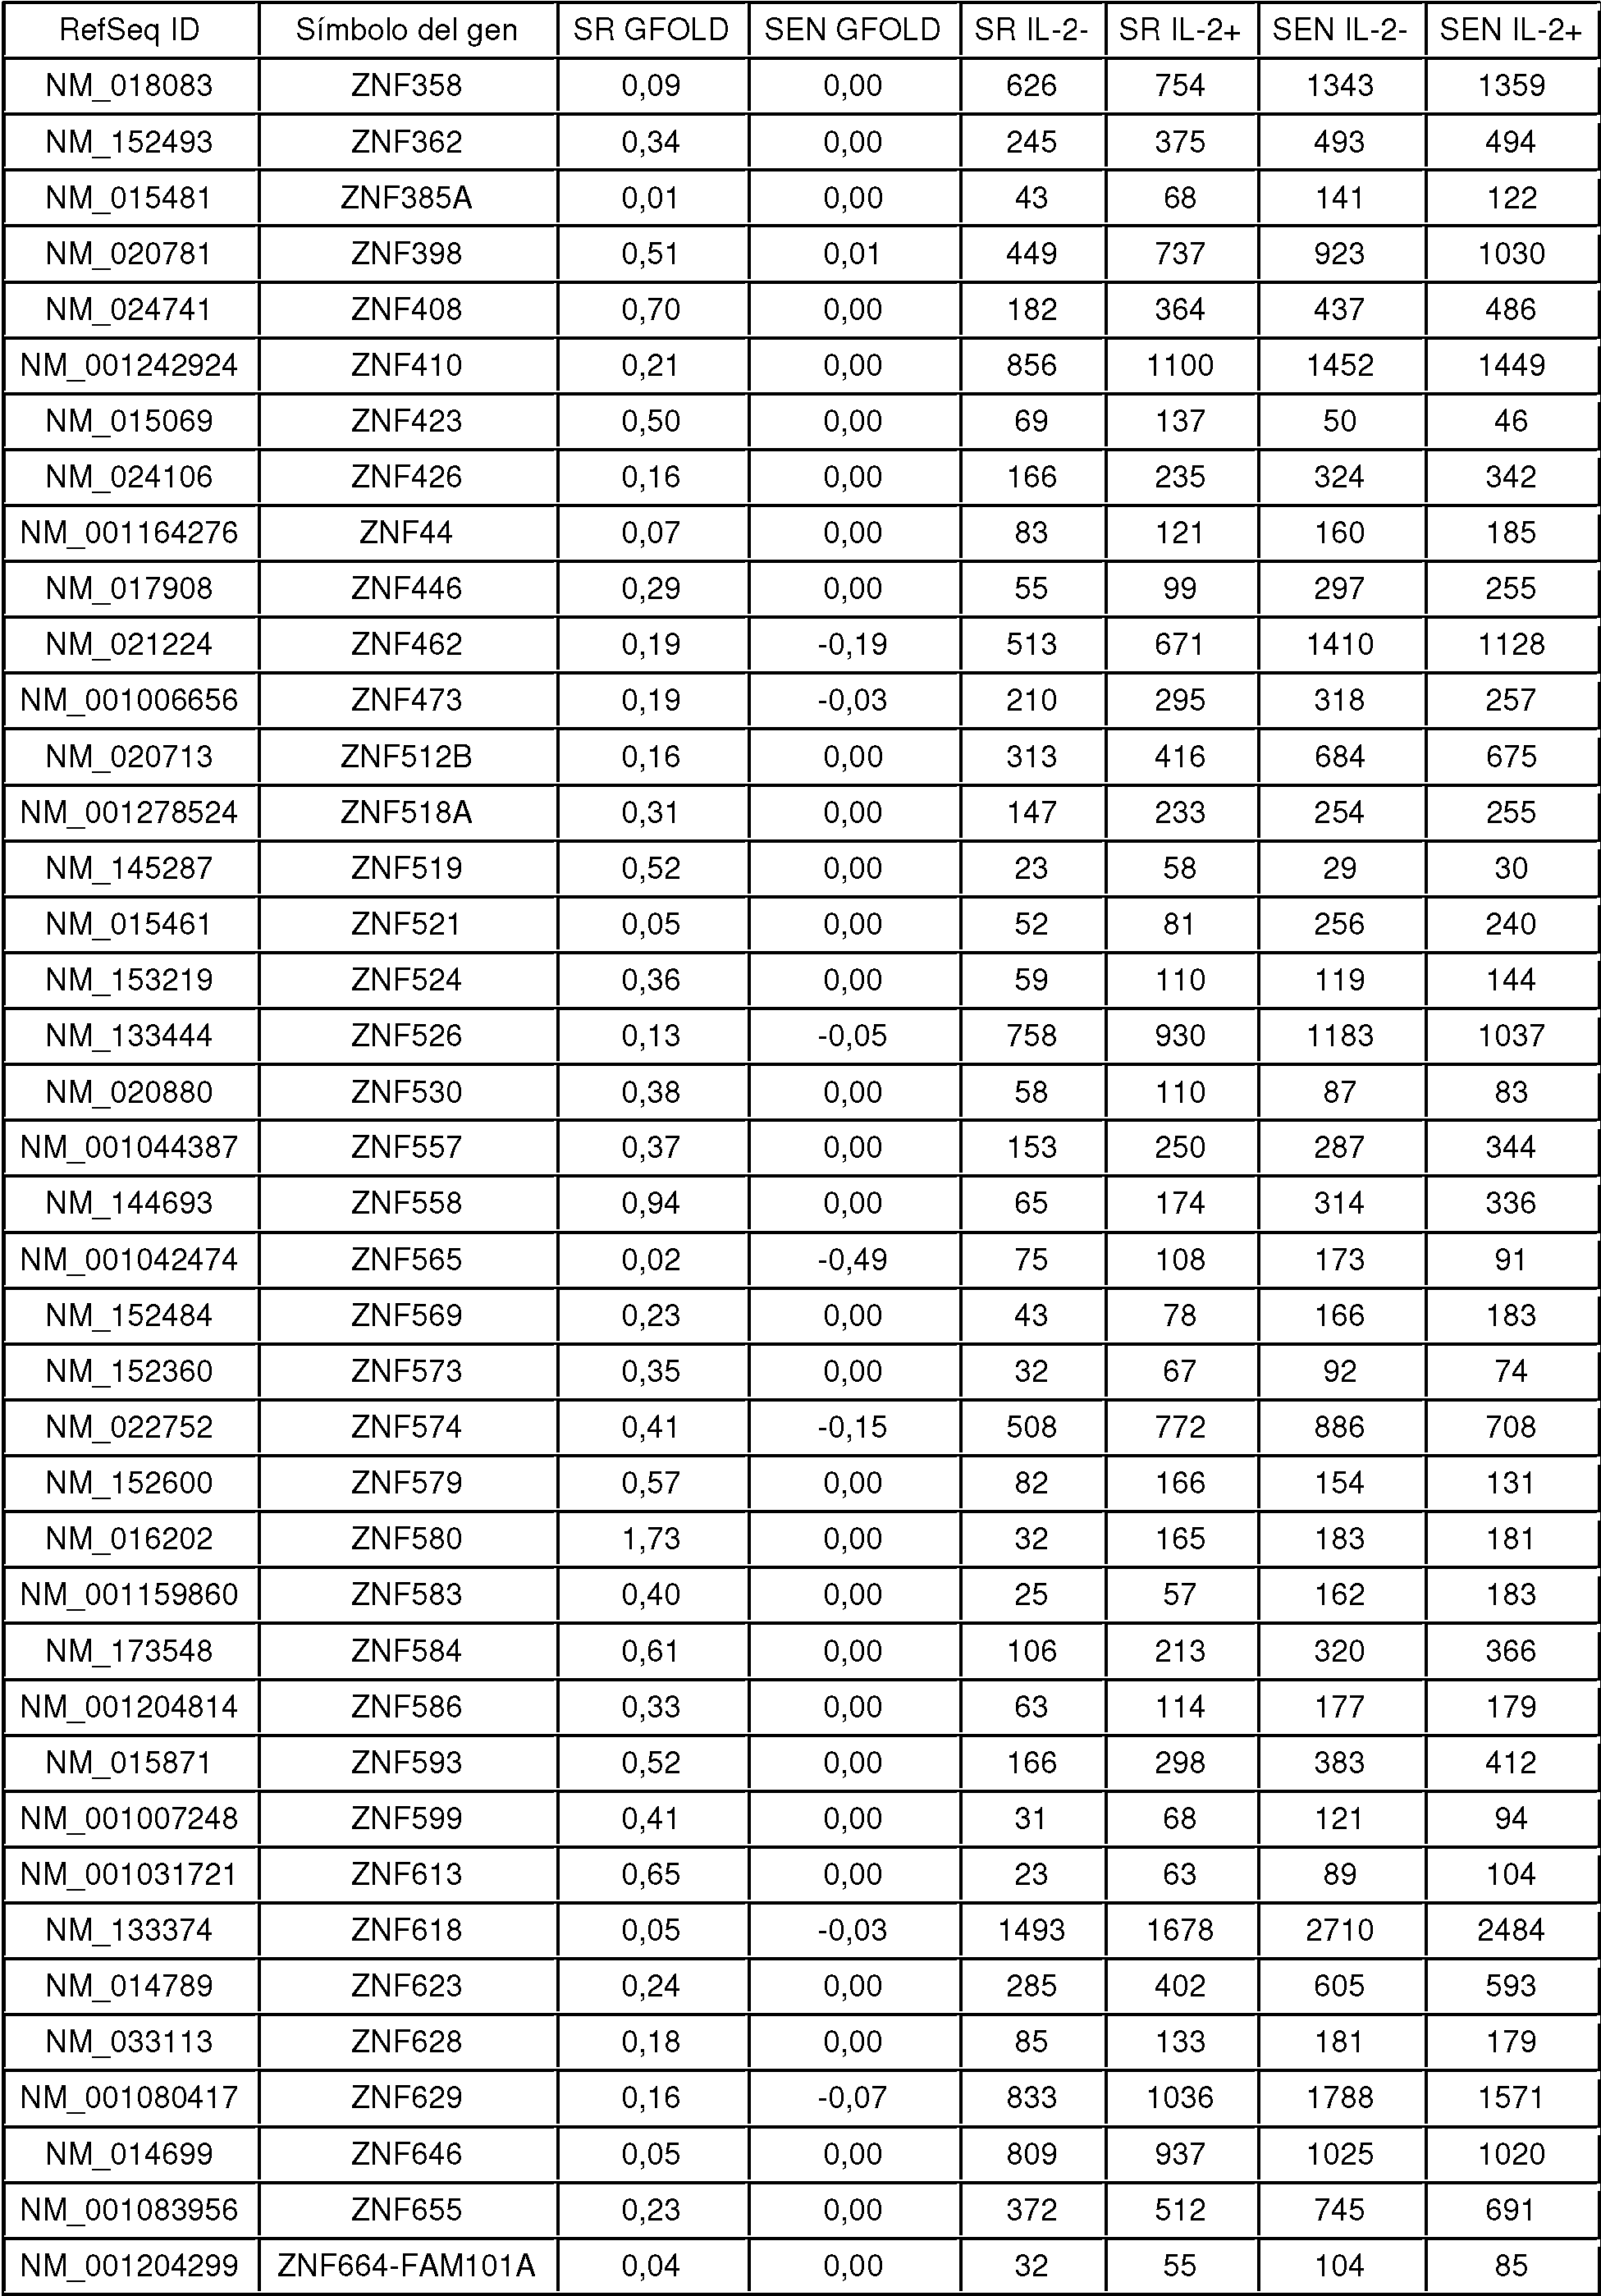

Tabla 5B: Genes regulados al alza diferencialmente en SEN IL-2Table 5B: Differentially Upregulated Genes in SEN IL-2


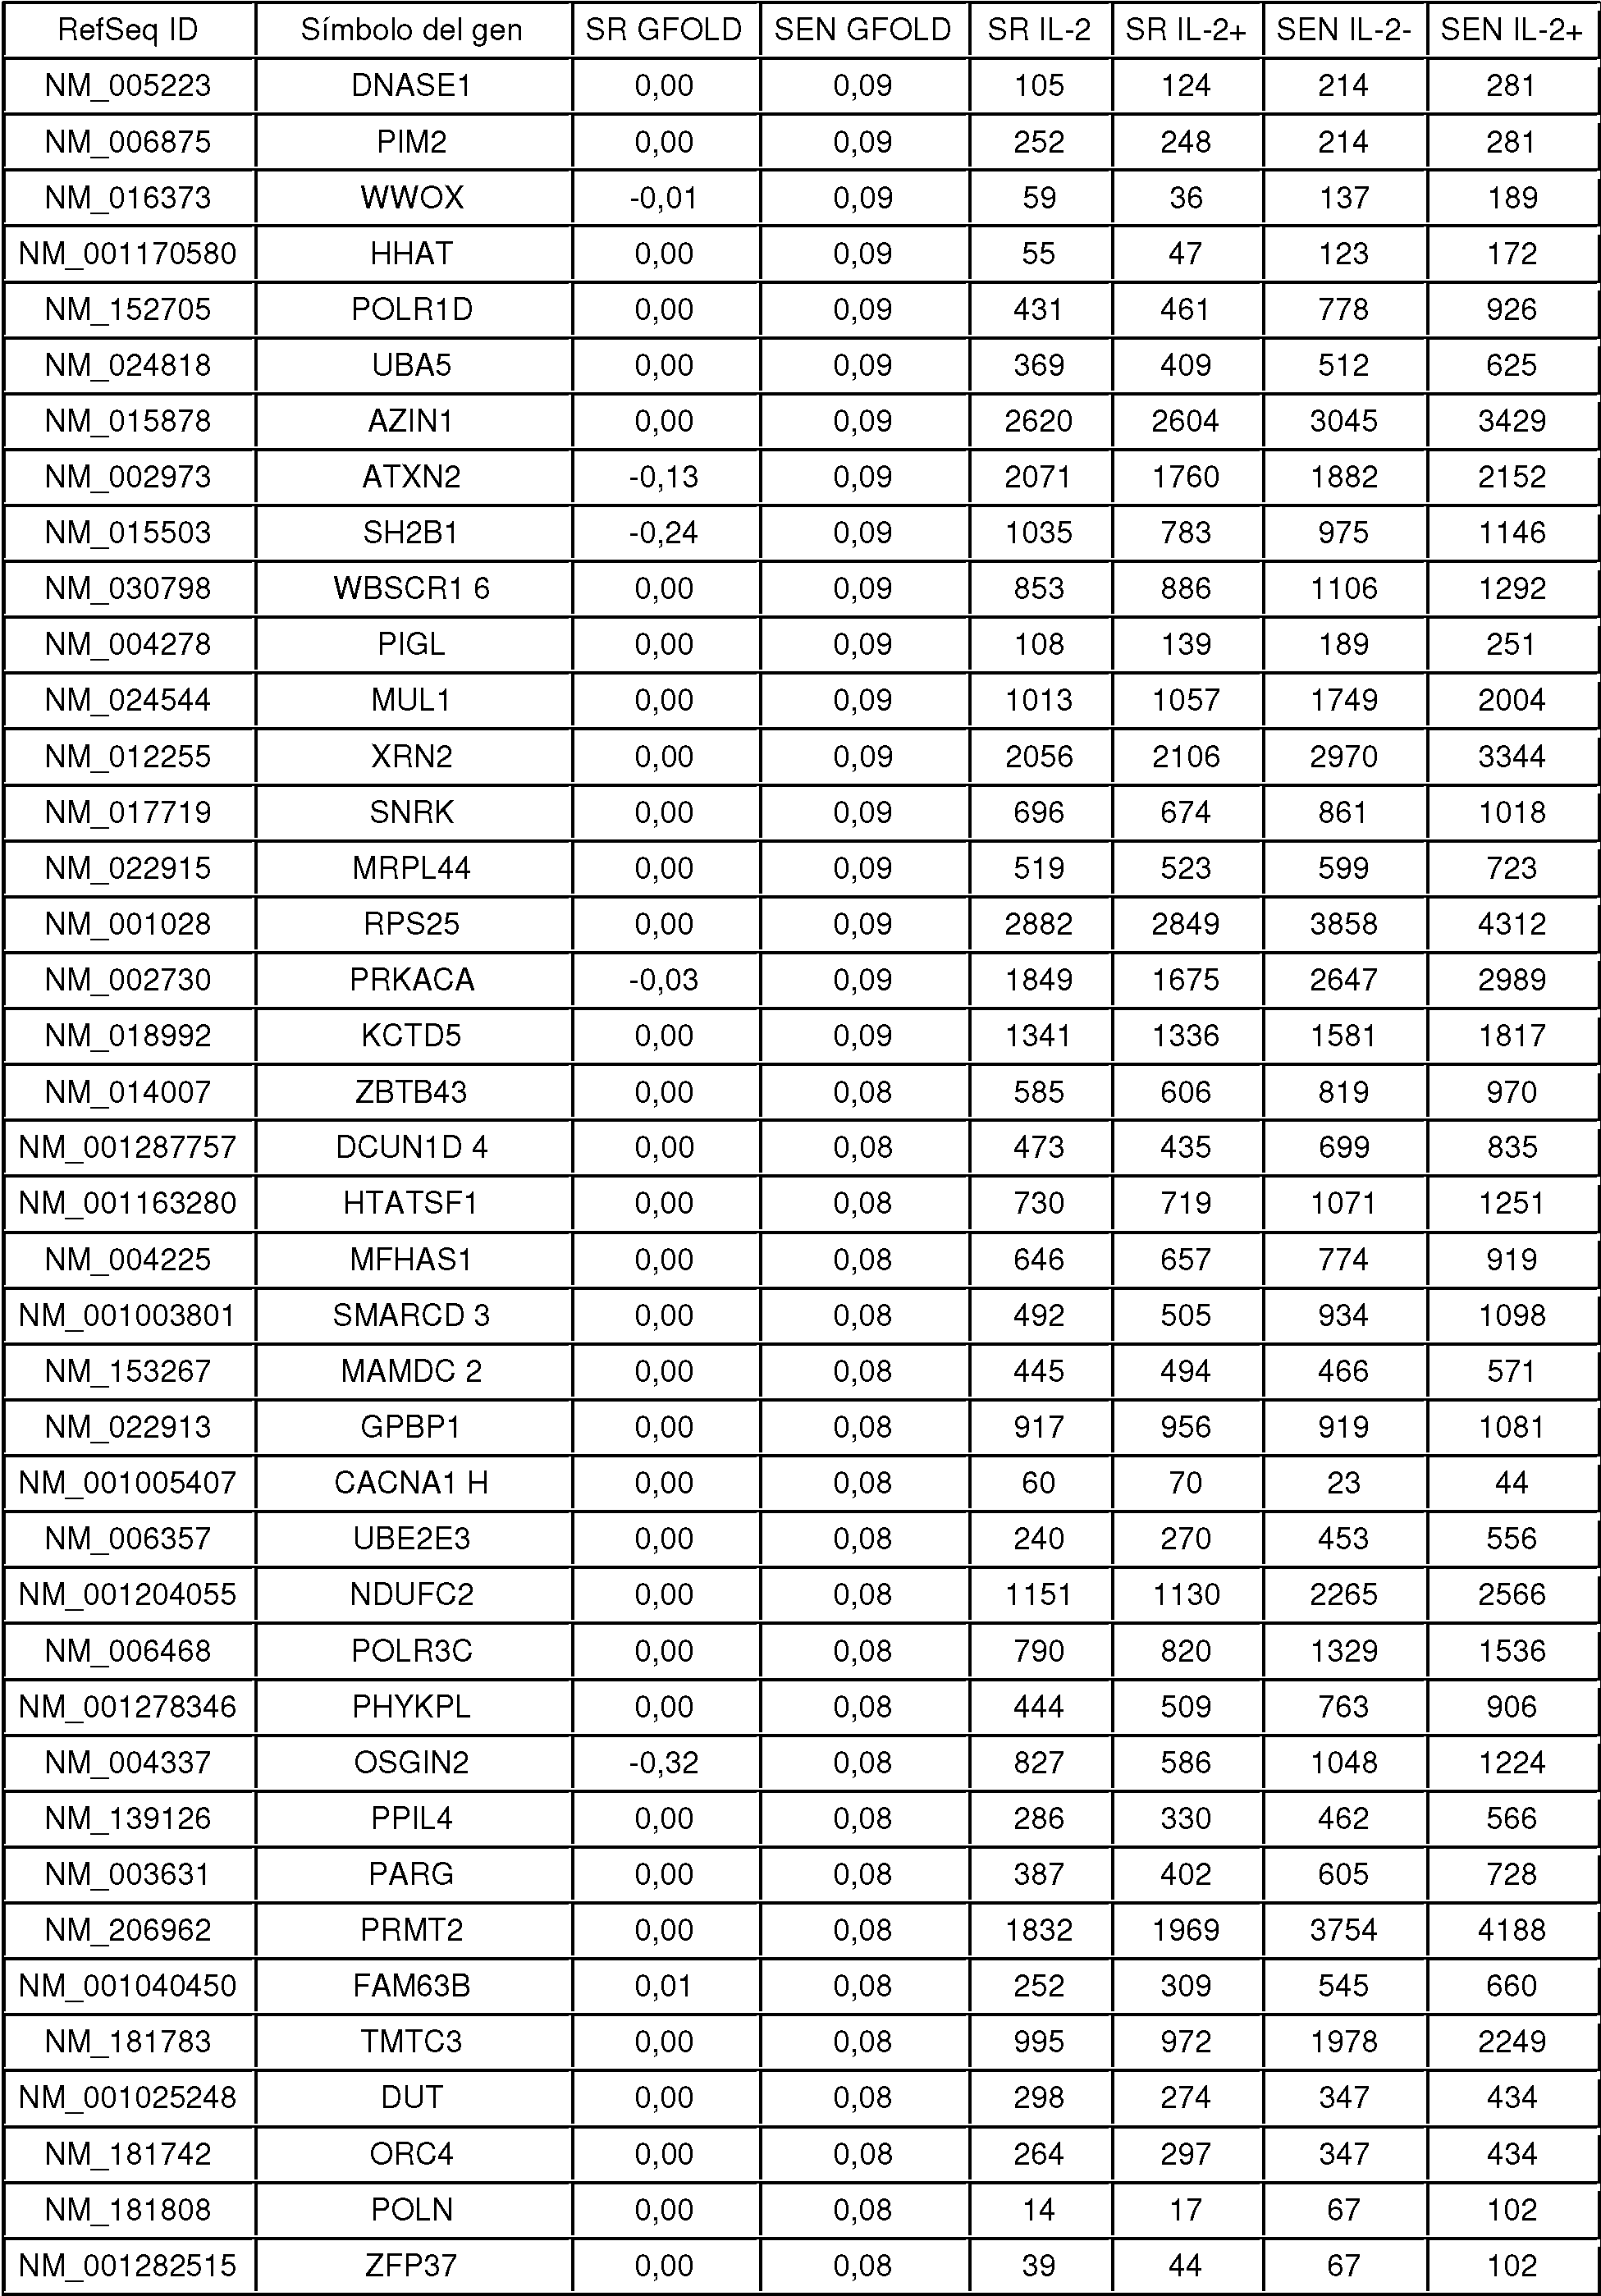


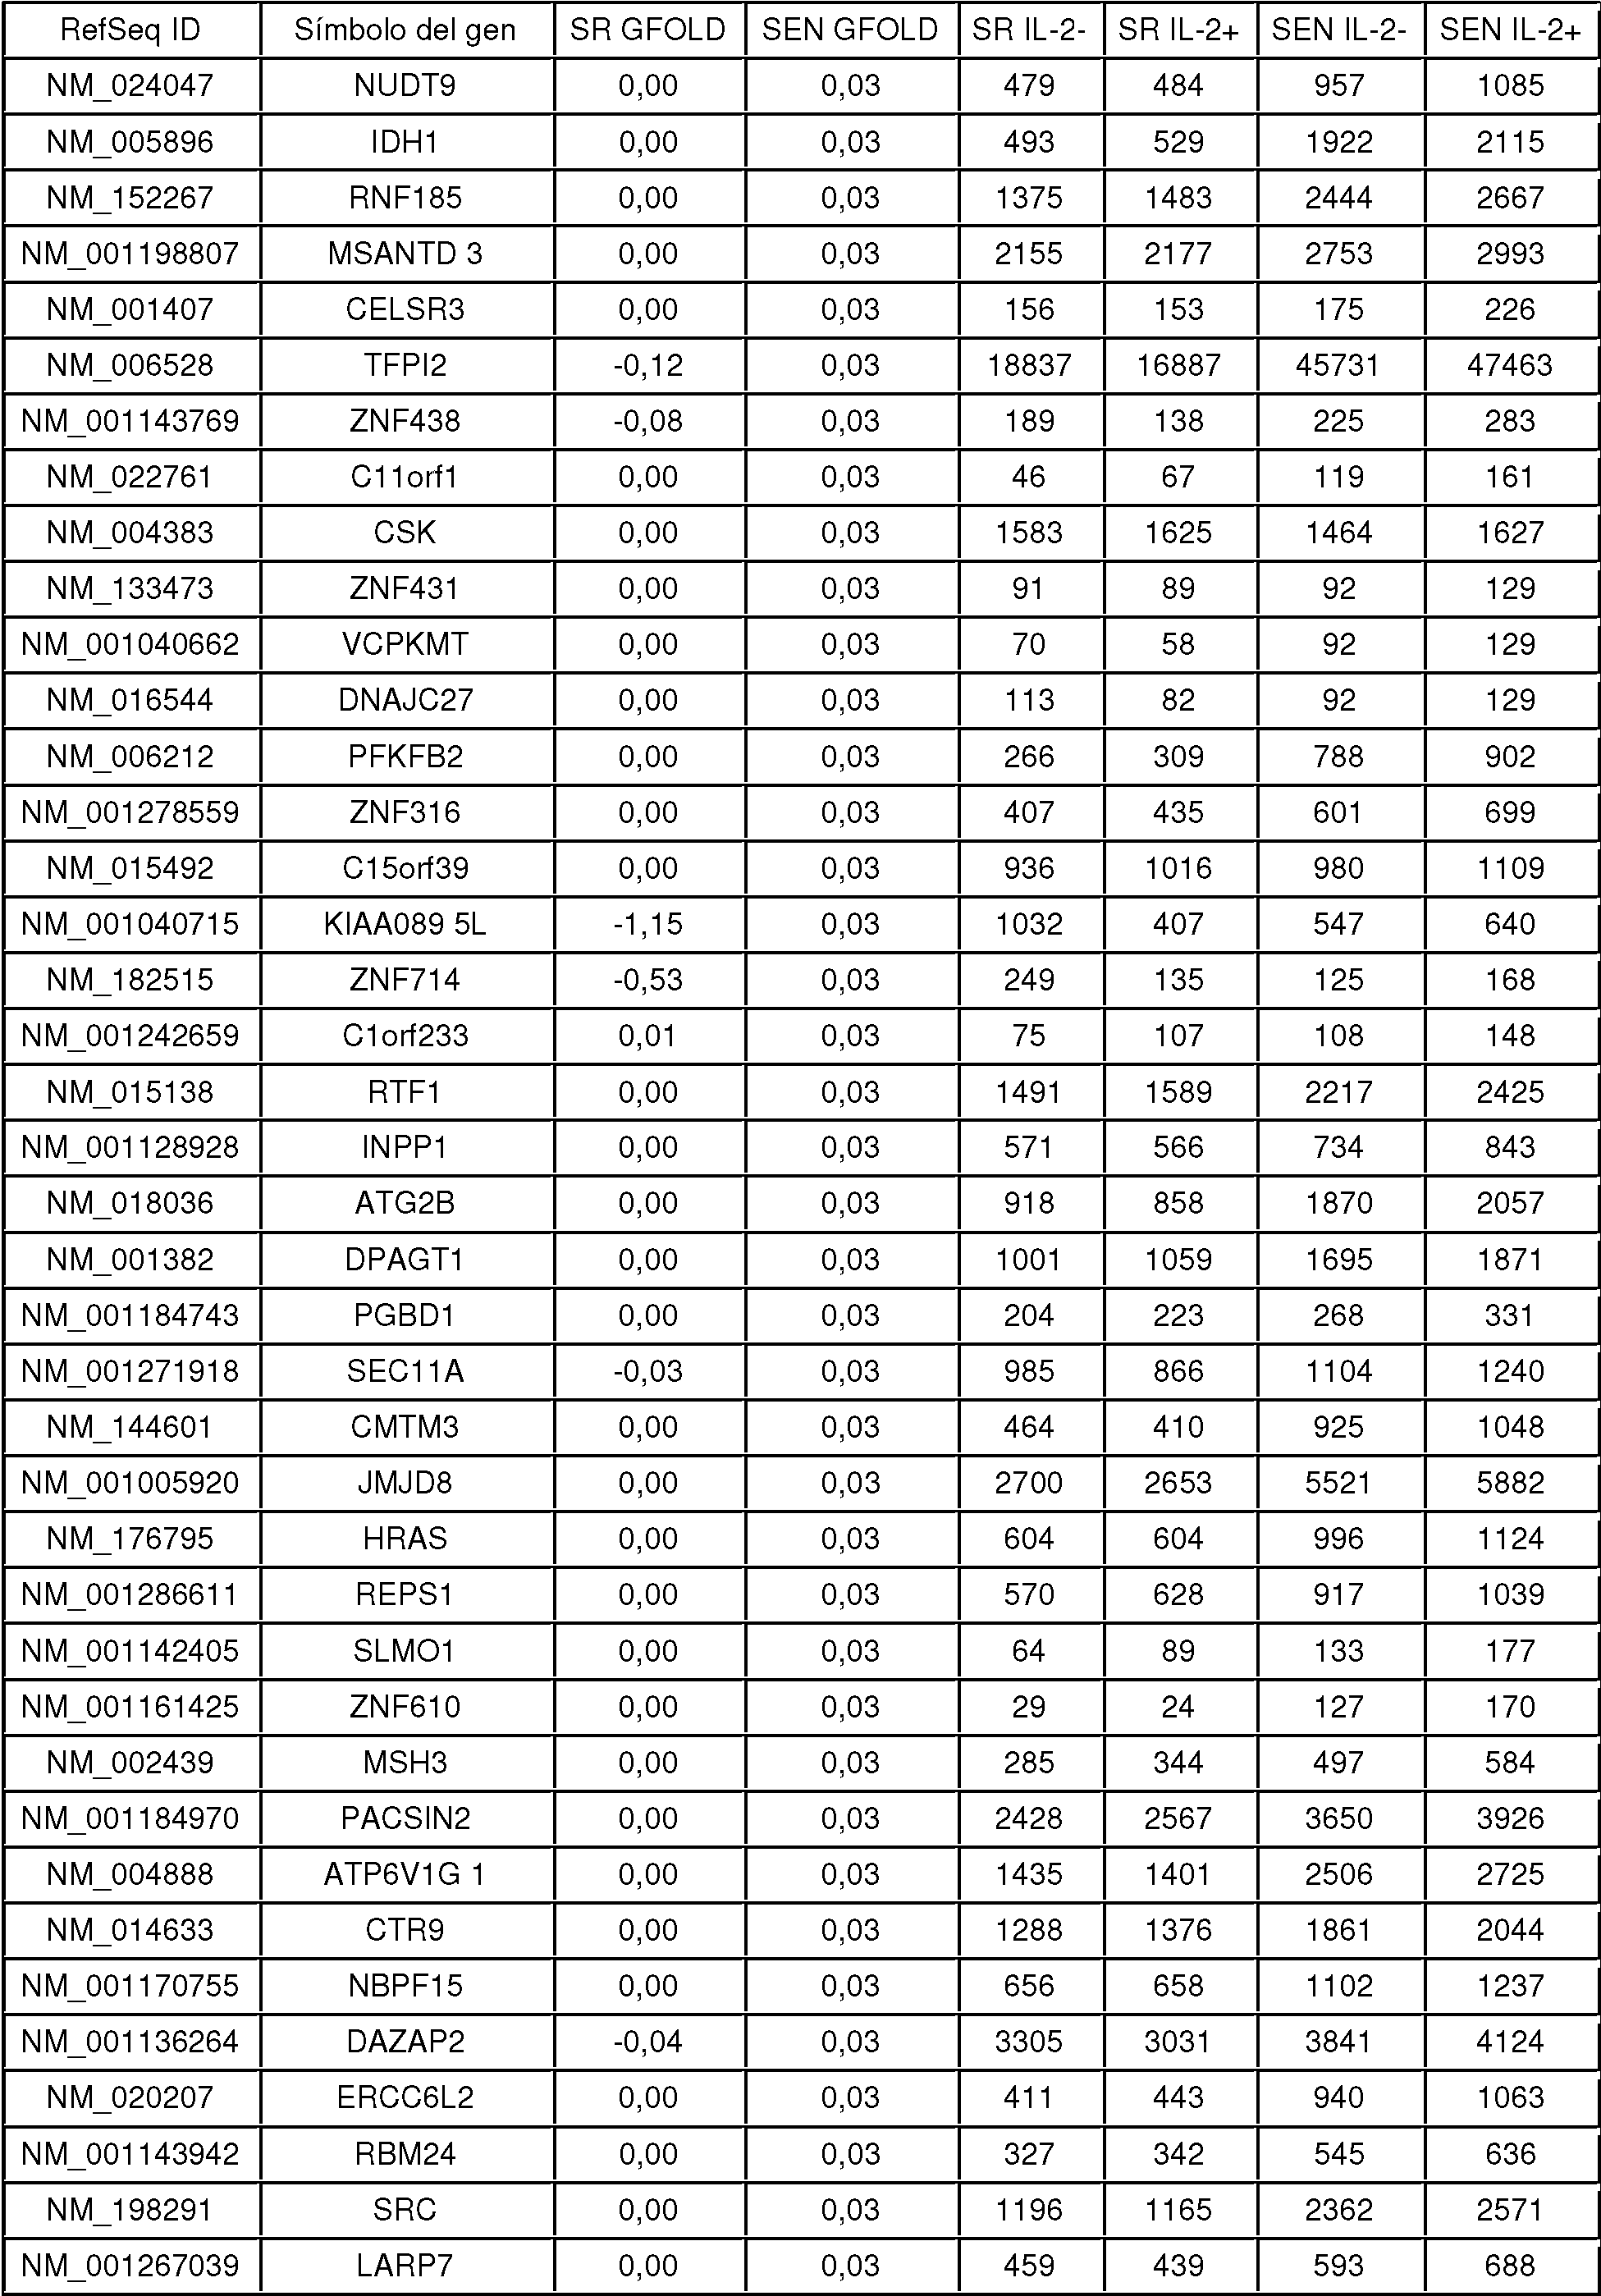


Tabla 5C: Genes re ulados a la baa diferencialmente en SR IL-2Table 5C: Genes differentially re ulated to baa in SR IL-2


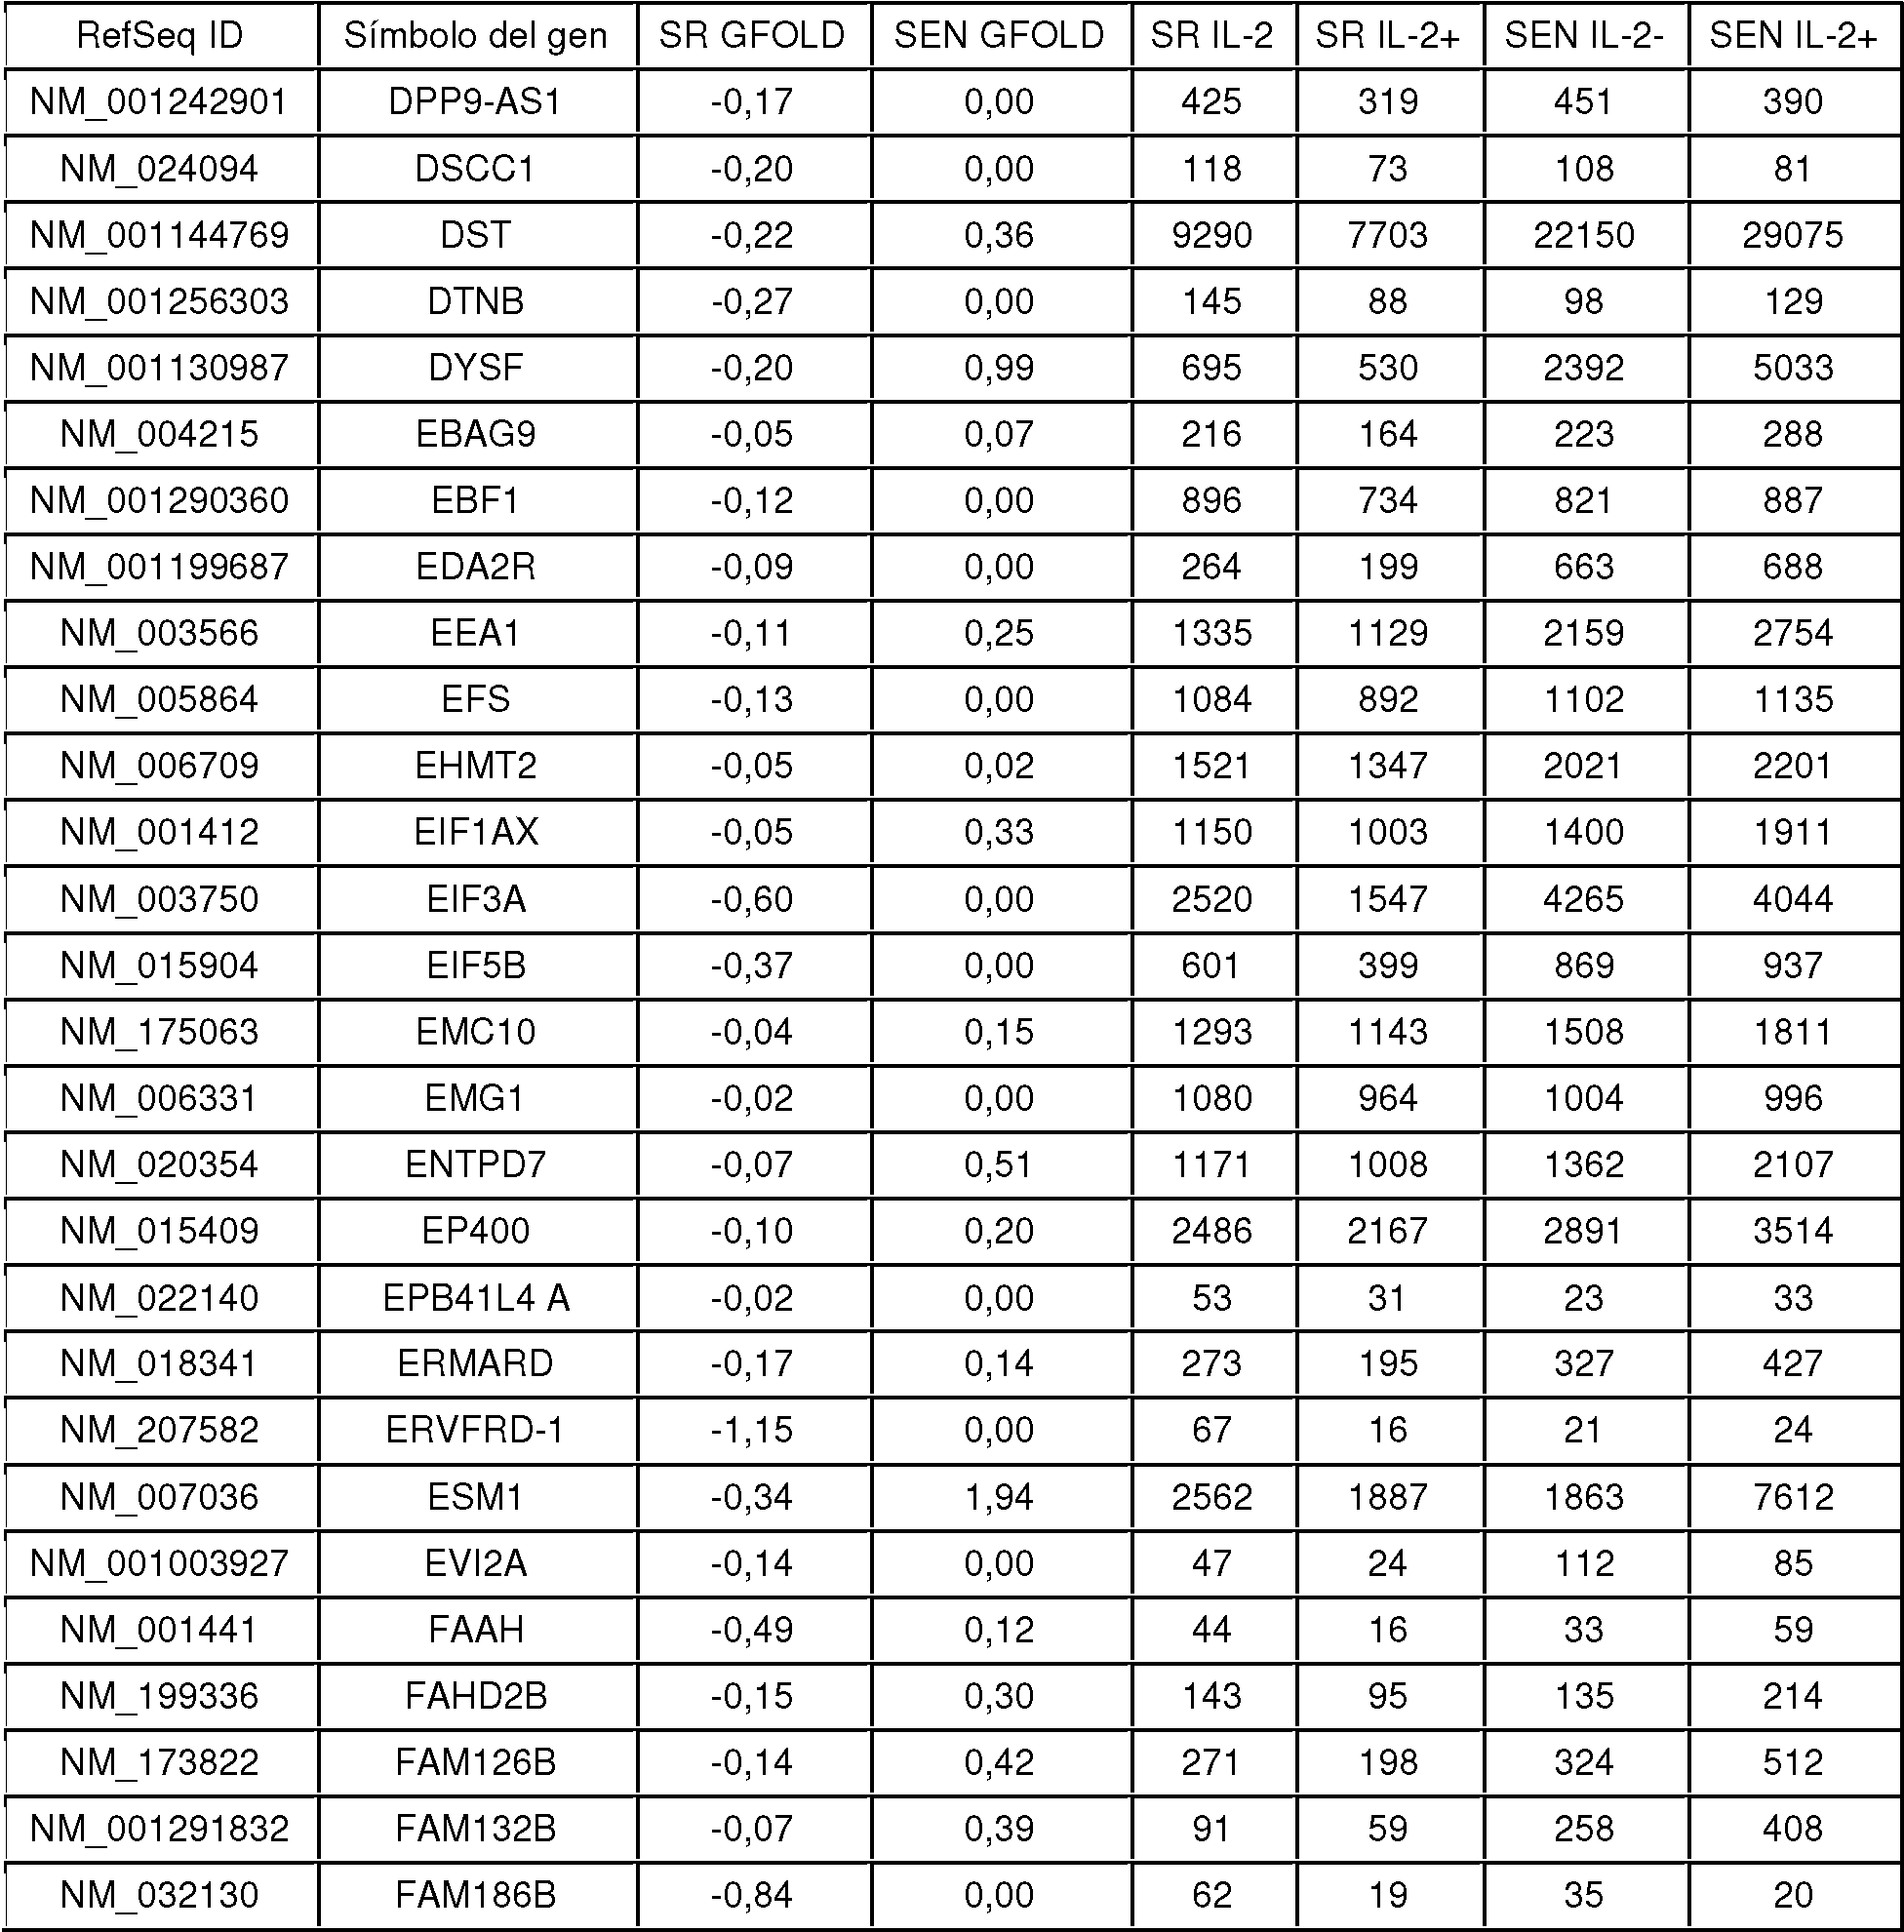


T l D: n r l l if r n i lm n n EN IL-2T l D: n r l l if r n i lm n n EN IL-2


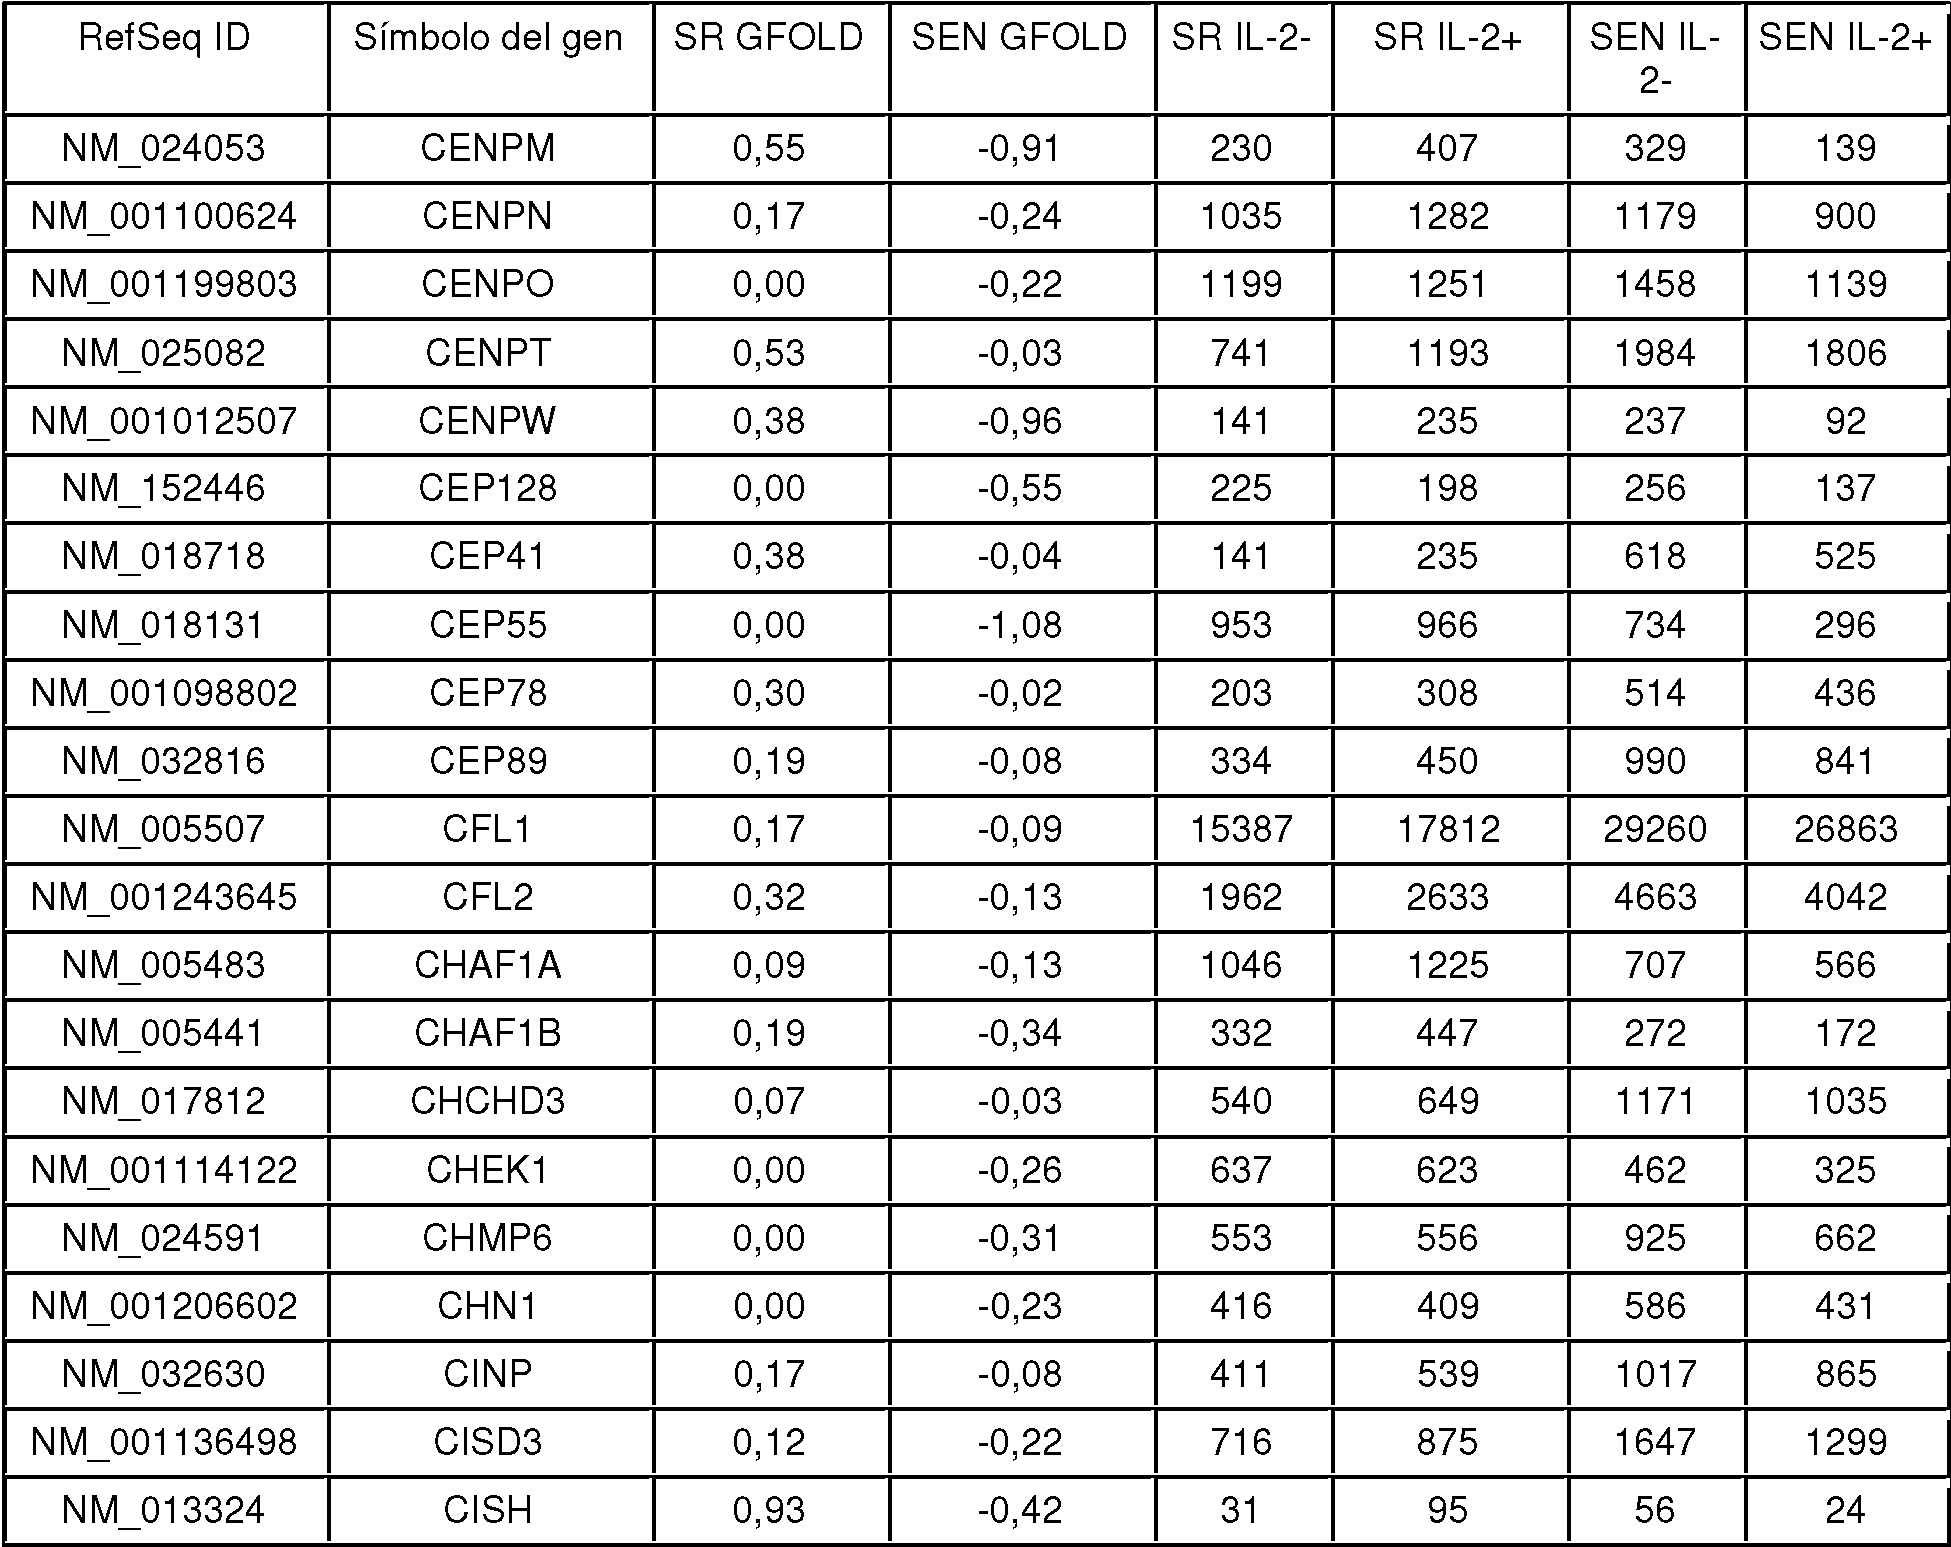


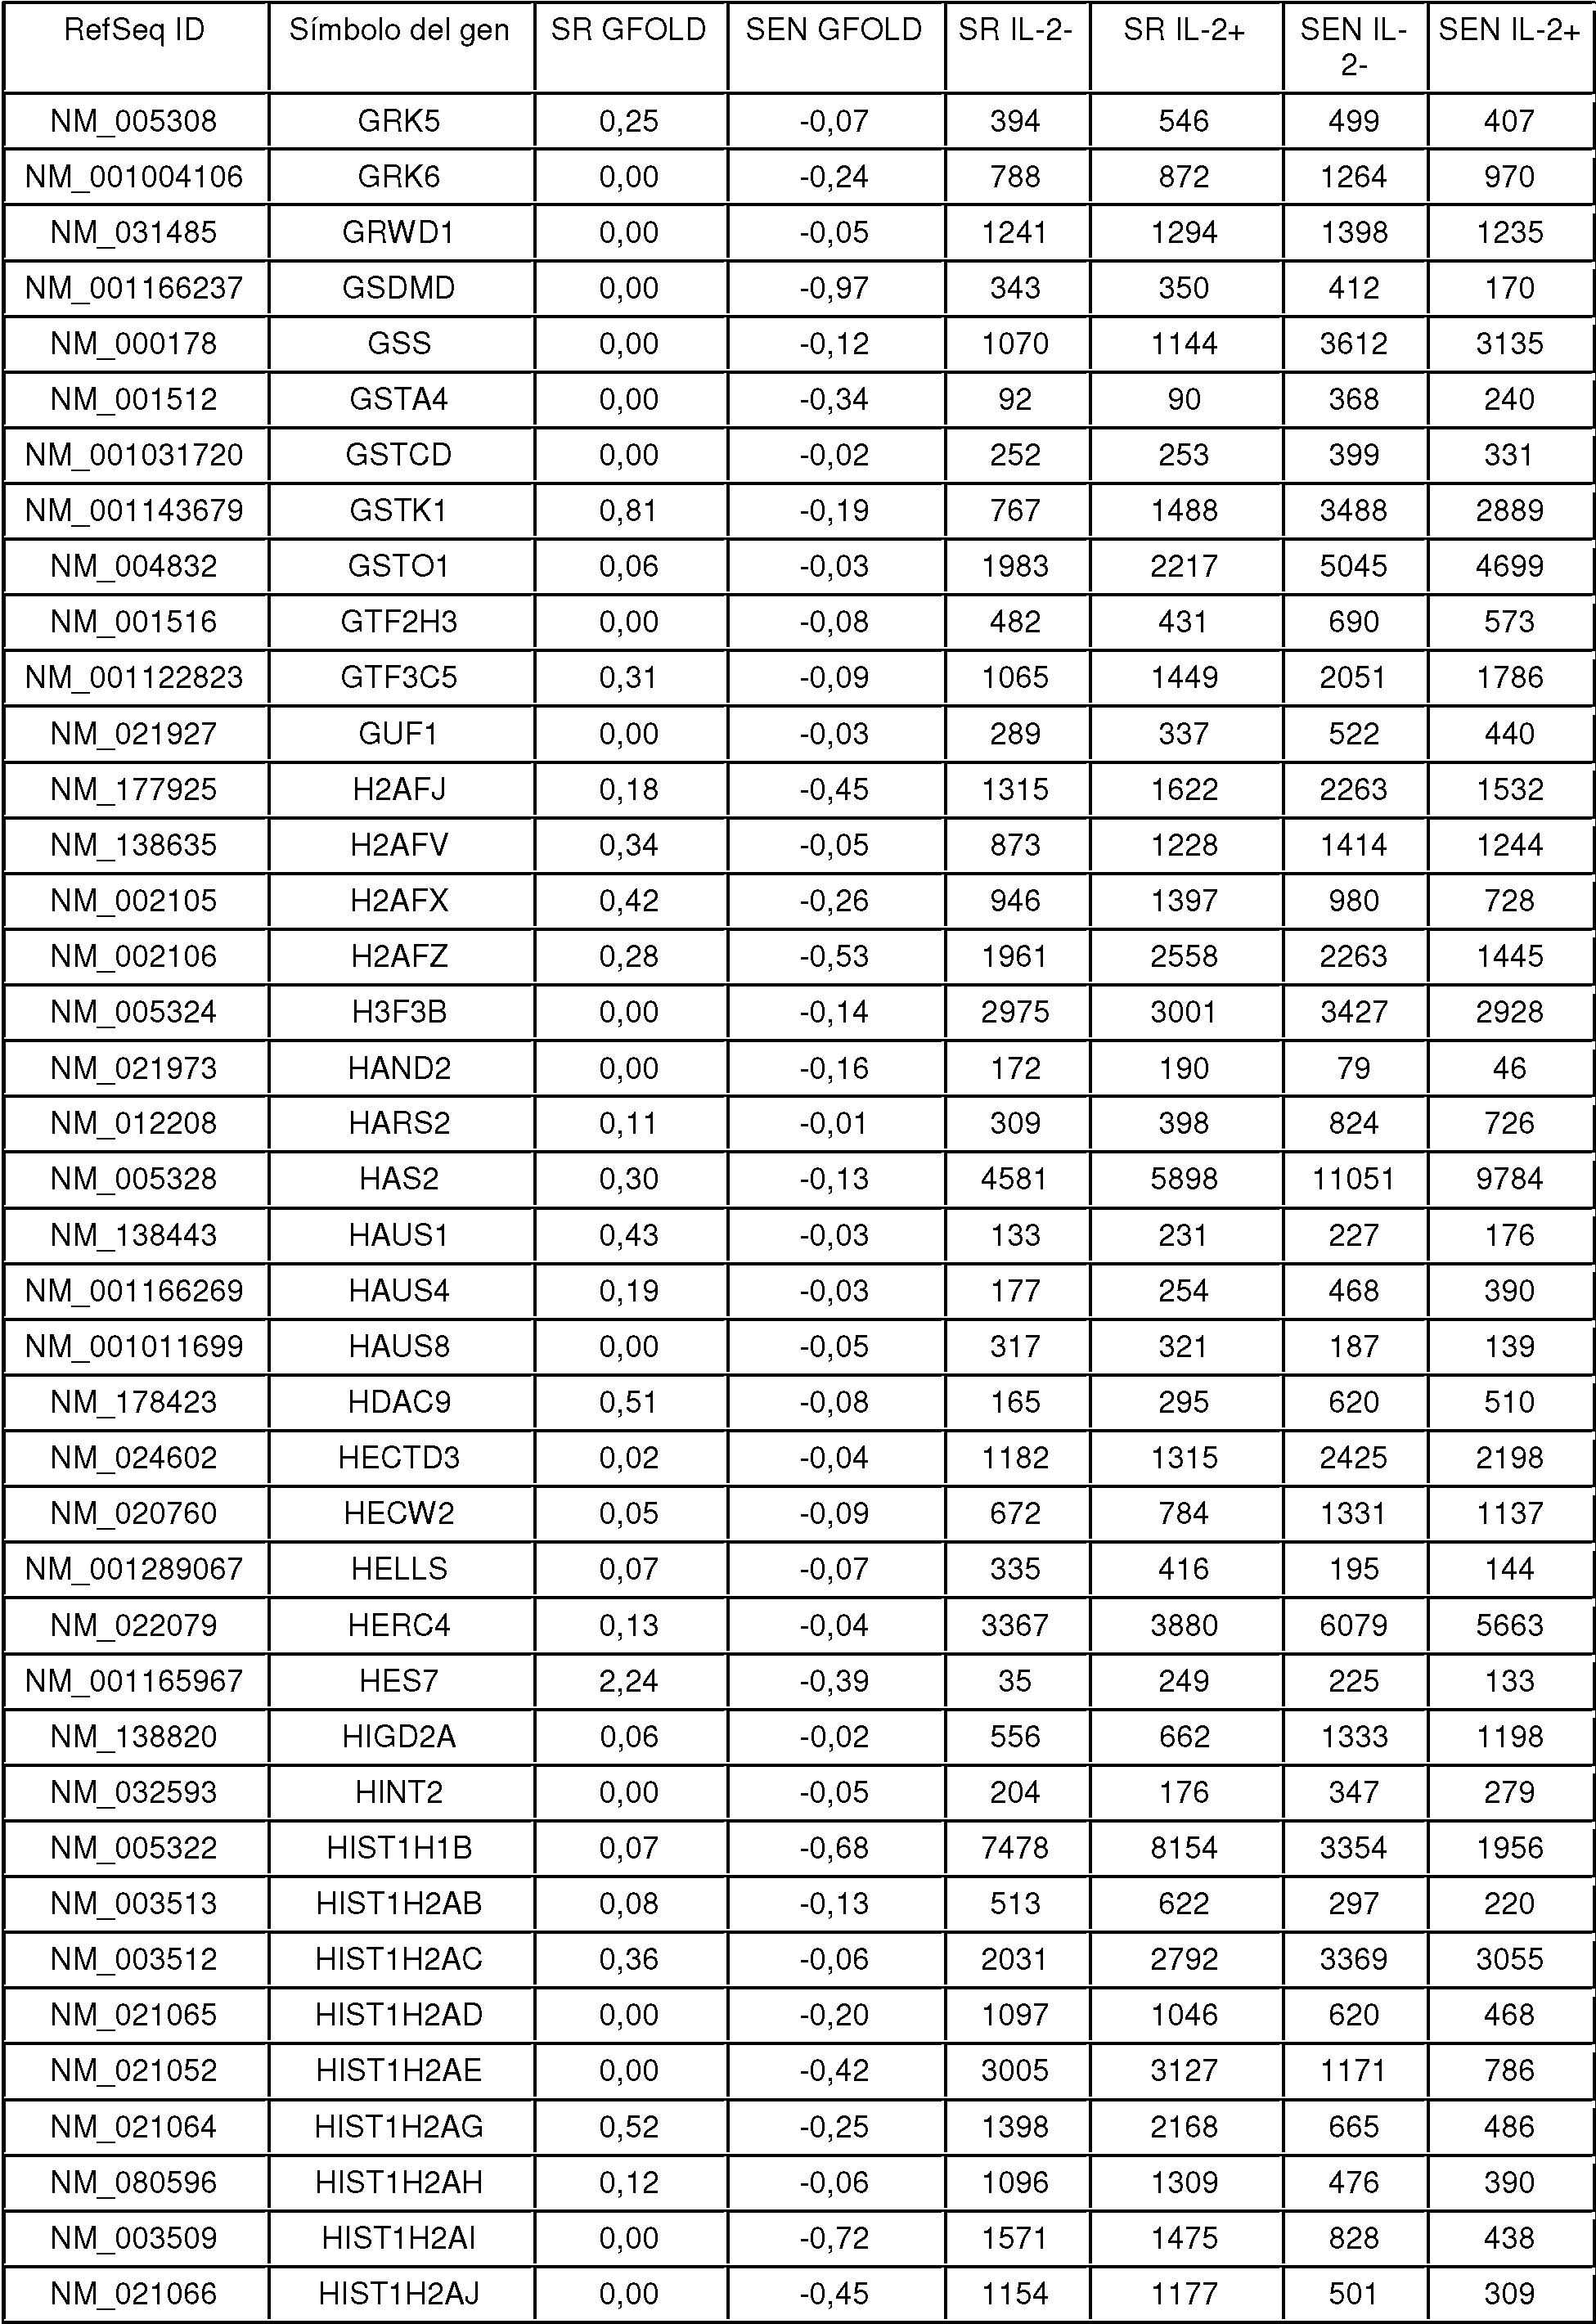
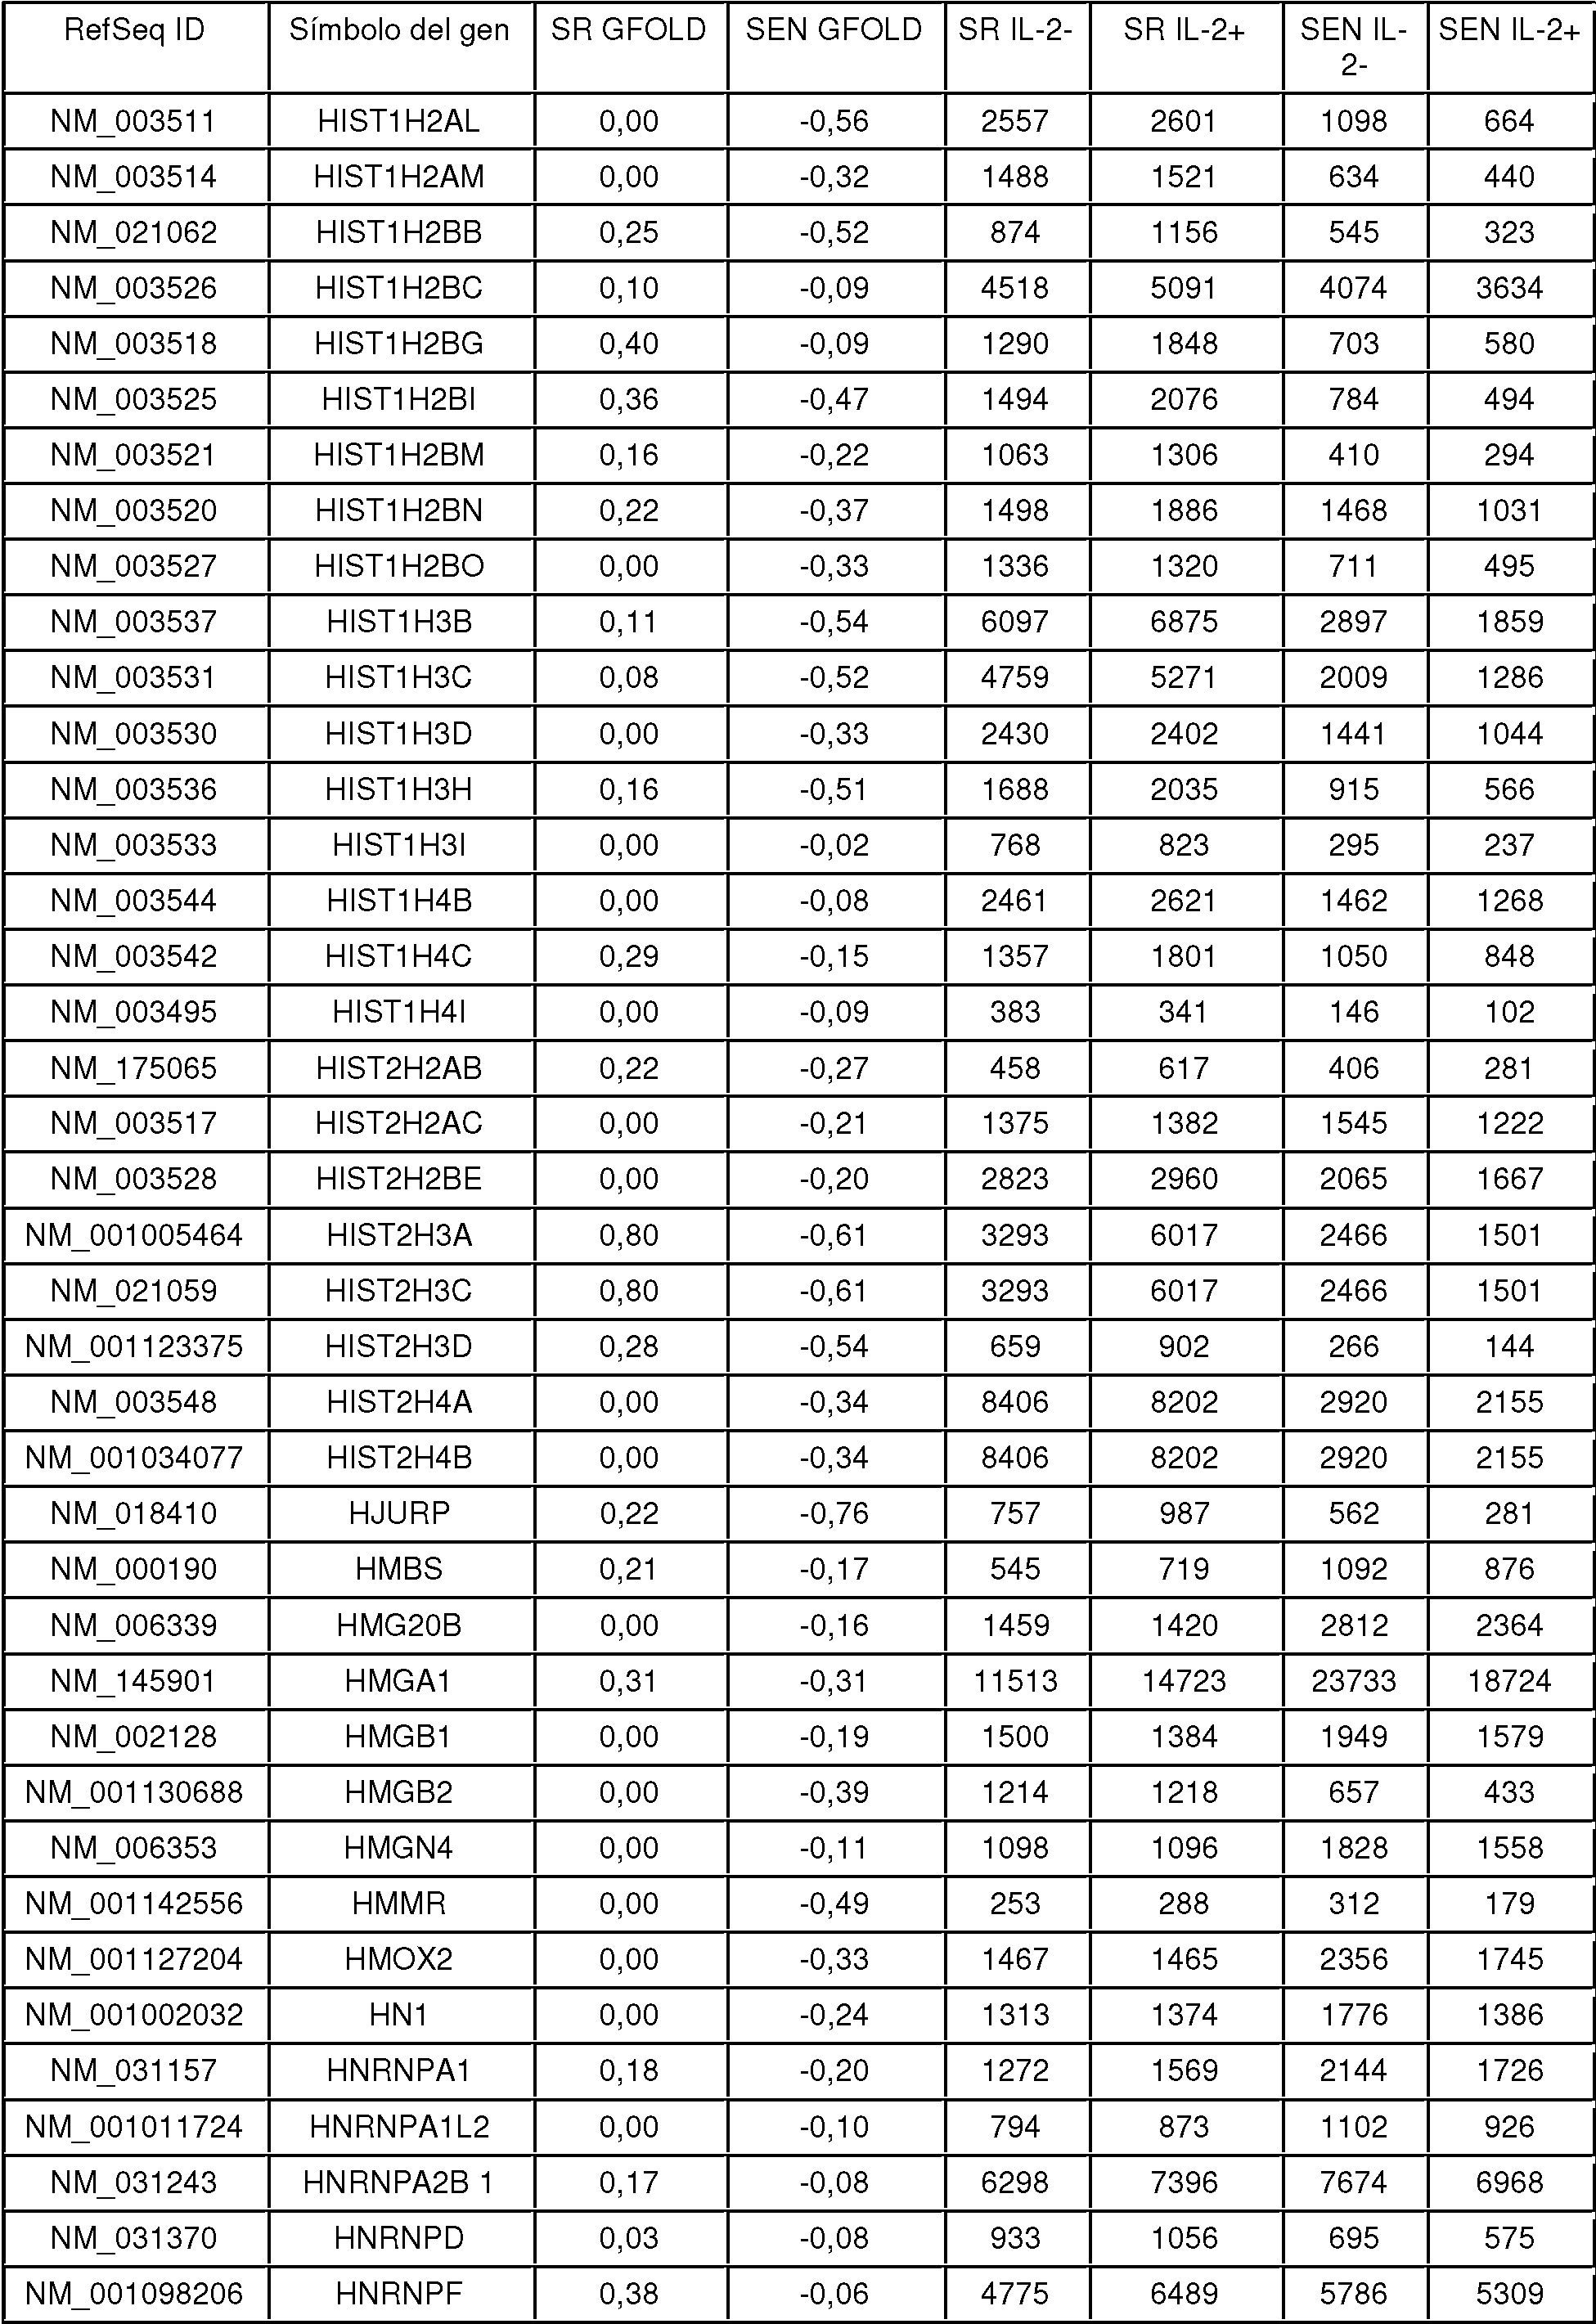


Claims (8)
Applications Claiming Priority (4)
| Application Number | Priority Date | Filing Date | Title |
|---|---|---|---|
| US201562170619P | 2015-06-03 | 2015-06-03 | |
| US201562170604P | 2015-06-03 | 2015-06-03 | |
| US201562175203P | 2015-06-12 | 2015-06-12 | |
| PCT/US2016/035472 WO2016196765A2 (en) | 2015-06-03 | 2016-06-02 | Companion methods and kits for il-2-based therapies and mesenchymal stem cell-based therapies |
Publications (1)
| Publication Number | Publication Date |
|---|---|
| ES2906161T3 true ES2906161T3 (en) | 2022-04-13 |
Family
ID=57441773
Family Applications (1)
| Application Number | Title | Priority Date | Filing Date |
|---|---|---|---|
| ES16804415T Active ES2906161T3 (en) | 2015-06-03 | 2016-06-02 | Complementary Approaches for IL-2-Based Therapies and Mesenchymal Stem Cell-Based Therapies |
Country Status (6)
| Country | Link |
|---|---|
| US (2) | US20180136209A1 (en) |
| EP (3) | EP3302541A4 (en) |
| JP (4) | JP6832349B2 (en) |
| CN (2) | CN108289937A (en) |
| ES (1) | ES2906161T3 (en) |
| WO (2) | WO2016196765A2 (en) |
Families Citing this family (19)
| Publication number | Priority date | Publication date | Assignee | Title |
|---|---|---|---|---|
| WO2017147501A1 (en) | 2016-02-25 | 2017-08-31 | Massachusetts Institute Of Technology | Neuronal axon mimetics for in vitro analysis of neurological diseases, myelination, and drug screening |
| US11293065B2 (en) | 2016-03-14 | 2022-04-05 | Aelan Cell Technologies, Inc. | Compositions and methods for the quality control of stem cell preparations |
| CN105769911A (en) * | 2016-03-23 | 2016-07-20 | 中国人民解放军第二军医大学 | Hair regeneration method for mesenchymal stem cell-induced alopecia areata and application |
| US20200093960A1 (en) | 2017-03-21 | 2020-03-26 | Mayo Foundation For Medical Education And Research | Methods and materials for treating fistulas |
| WO2018175630A1 (en) * | 2017-03-23 | 2018-09-27 | The Regents Of The University Of California | Stimulation of hair growth by senescent cells and senescence associated secretory phenotype |
| CN110678191A (en) * | 2017-04-07 | 2020-01-10 | 洋蓟治疗有限公司 | Methods of treating side effects of Chimeric Antigen Receptor (CAR) T cell therapy |
| WO2018208909A1 (en) | 2017-05-10 | 2018-11-15 | Massachusetts Institute Of Technolgy | Cell-mimetic device |
| CN109777872B (en) * | 2017-11-15 | 2021-04-02 | 北京大学 | T cell subsets in lung cancer and genes characteristic thereof |
| WO2019099800A1 (en) * | 2017-11-17 | 2019-05-23 | Stc.Unm | Genome edited ipsc-derived monocytes expressing trophic factors |
| US11975024B2 (en) | 2017-12-19 | 2024-05-07 | Musc Foundation For Research Development | T regulatory (Treg) cell transplantation in osteogenesis imperfecta (OI) |
| CN109010368B (en) * | 2018-08-01 | 2021-09-03 | 徐妍 | Cell preparation for treating triple sign of female athletes and repairing female athlete ovary function and preparation method thereof |
| CN109468380B (en) * | 2018-10-31 | 2022-05-17 | 复旦大学附属肿瘤医院 | Application of IL1R2 in breast cancer prognosis evaluation and targeted therapy |
| CN109568565B (en) * | 2018-11-08 | 2022-02-22 | 中国医学科学院北京协和医院 | Application of NF90 in preparing biological preparation for regulating and controlling osteogenic differentiation of bone marrow mesenchymal stem cells |
| CN109536440A (en) * | 2018-11-19 | 2019-03-29 | 深圳市第二人民医院 | The extracting method of excretion body |
| CN110358832B (en) * | 2019-07-11 | 2021-01-15 | 江苏医药职业学院 | Application of reagent for detecting expression level of PH domain family A member 6 and kit |
| CN110585243A (en) * | 2019-08-12 | 2019-12-20 | 丰泽康生物医药(深圳)有限公司 | Pluripotent cell active matter and platelet-rich plasma compound for treating glucocorticoid-dependent dermatitis as well as preparation method and application thereof |
| IL272145A (en) * | 2020-01-20 | 2021-07-29 | Stem Cell Medicine Ltd | Cosmetic compositions with protein concentrate from conditioned medium of adipose-derived stem cells |
| CN112430626A (en) * | 2020-11-27 | 2021-03-02 | 成都康景生物科技有限公司 | Genetically modified umbilical mesenchymal stem cell, preparation method and application |
| CN113265372A (en) * | 2021-06-08 | 2021-08-17 | 河南中医药大学 | Model for inducing mucus high secretion in vitro and construction method thereof |
Family Cites Families (15)
| Publication number | Priority date | Publication date | Assignee | Title |
|---|---|---|---|---|
| JPH06505491A (en) * | 1991-03-21 | 1994-06-23 | マウント シナイ スクール オブ メディスン オブ ザ シティー ユニバーシティー オブ ニューヨーク | Methods of treating various diseases using etianate and its agonists and compositions used therein |
| US5595756A (en) * | 1993-12-22 | 1997-01-21 | Inex Pharmaceuticals Corporation | Liposomal compositions for enhanced retention of bioactive agents |
| AU2005227263A1 (en) * | 2004-03-05 | 2005-10-06 | Novartis Vaccines And Diagnostics, Inc. | In vitro test system for predicting patient tolerability of therapeutic agents |
| US20070154482A1 (en) * | 2005-09-12 | 2007-07-05 | Beth Israel Deaconess Medical Center | Methods and compositions for the treatment and diagnosis of diseases characterized by vascular leak, hypotension, or a procoagulant state |
| SG182976A1 (en) * | 2007-06-29 | 2012-08-30 | Ahngook Pharmaceutical Co Ltd | Predictive markers for ovarian cancer |
| PT2254586E (en) * | 2008-02-22 | 2015-05-18 | Agency Science Tech & Res | Mesenchymal stem cell particles |
| ES2351916B8 (en) * | 2009-07-30 | 2012-07-09 | Centro Nacional De Investigaciones Cardiovasculares (Cnic) | METHOD OF IDENTIFICATION OF SENESCENT MOTHER MESENQUIMAL CELLS |
| GB0918615D0 (en) | 2009-10-23 | 2009-12-09 | Cellerix Sa | Cell populations having immunoregulatory activity, methods for the preparation and uses thereof |
| SG10201510086VA (en) * | 2010-12-23 | 2016-01-28 | Nestec Sa | Drug selection for malignant cancer therapy using antibody-based arrays |
| US9446075B2 (en) * | 2011-05-06 | 2016-09-20 | Bioregenerative Sciences | Compositions derived from stem cell released molecules and methods for formulation thereof |
| US20130251670A1 (en) * | 2011-09-13 | 2013-09-26 | Aidan Products, Inc | Treatment of Macular Edema Utilizing Stem Cell and Conditioned Media Thereof |
| CA2850830A1 (en) * | 2011-10-13 | 2013-04-18 | Aerpio Therapeutics, Inc. | Methods for treating vascular leak syndrome and cancer |
| SG11201404313YA (en) * | 2012-01-25 | 2014-10-30 | Dnatrix Inc | Biomarkers and combination therapies using oncolytic virus and immunomodulation |
| ITTO20120859A1 (en) * | 2012-10-02 | 2014-04-03 | Univ Degli Studi Torino | NEW THERAPEUTIC APPLICATION OF A MEANS CONDITIONED BY PLACENTARY STEM CELLS |
| WO2014128634A1 (en) * | 2013-02-20 | 2014-08-28 | Pluristem Ltd. | Gene and protein expression properties of adherent stromal cells cultured in 3d |
-
2016
- 2016-06-02 CN CN201680045662.8A patent/CN108289937A/en active Pending
- 2016-06-02 EP EP16804422.0A patent/EP3302541A4/en active Pending
- 2016-06-02 WO PCT/US2016/035472 patent/WO2016196765A2/en active Application Filing
- 2016-06-02 WO PCT/US2016/035487 patent/WO2016196774A1/en active Application Filing
- 2016-06-02 US US15/579,186 patent/US20180136209A1/en active Pending
- 2016-06-02 CN CN201680045707.1A patent/CN108699605A/en active Pending
- 2016-06-02 ES ES16804415T patent/ES2906161T3/en active Active
- 2016-06-02 JP JP2018515180A patent/JP6832349B2/en active Active
- 2016-06-02 EP EP21207206.0A patent/EP4015652A1/en active Pending
- 2016-06-02 JP JP2018515181A patent/JP7118886B2/en active Active
- 2016-06-02 EP EP16804415.4A patent/EP3303636B1/en active Active
-
2021
- 2021-02-01 JP JP2021014388A patent/JP7186251B2/en active Active
-
2022
- 2022-03-31 US US17/710,539 patent/US20220370503A1/en active Pending
- 2022-08-03 JP JP2022123879A patent/JP7455165B2/en active Active
Also Published As
| Publication number | Publication date |
|---|---|
| US20180136209A1 (en) | 2018-05-17 |
| EP3303636A2 (en) | 2018-04-11 |
| CN108289937A (en) | 2018-07-17 |
| EP3302541A4 (en) | 2018-12-05 |
| WO2016196765A3 (en) | 2017-01-19 |
| US20220370503A1 (en) | 2022-11-24 |
| JP2022140711A (en) | 2022-09-27 |
| WO2016196765A2 (en) | 2016-12-08 |
| CN108699605A (en) | 2018-10-23 |
| EP3303636A4 (en) | 2018-11-21 |
| JP2021089290A (en) | 2021-06-10 |
| JP7186251B2 (en) | 2022-12-08 |
| JP7455165B2 (en) | 2024-03-25 |
| EP3303636B1 (en) | 2021-11-10 |
| JP2018518692A (en) | 2018-07-12 |
| WO2016196774A1 (en) | 2016-12-08 |
| EP4015652A1 (en) | 2022-06-22 |
| JP7118886B2 (en) | 2022-08-16 |
| WO2016196765A9 (en) | 2017-09-21 |
| JP2018516988A (en) | 2018-06-28 |
| JP6832349B2 (en) | 2021-02-24 |
| EP3302541A1 (en) | 2018-04-11 |
Similar Documents
| Publication | Publication Date | Title |
|---|---|---|
| ES2906161T3 (en) | Complementary Approaches for IL-2-Based Therapies and Mesenchymal Stem Cell-Based Therapies | |
| Liubomirski et al. | Tumor-stroma-inflammation networks promote pro-metastatic chemokines and aggressiveness characteristics in triple-negative breast cancer | |
| Manferdini et al. | Adipose stromal cells mediated switching of the pro-inflammatory profile of M1-like macrophages is facilitated by PGE2: in vitro evaluation | |
| Avnet et al. | Cancer‐associated mesenchymal stroma fosters the stemness of osteosarcoma cells in response to intratumoral acidosis via NF‐κB activation | |
| Saeki et al. | Thymus and activation regulated chemokine (TARC)/CCL17 and skin diseases | |
| Takayama et al. | Imbalance of NKp44+ NKp46− and NKp44− NKp46+ natural killer cells in the intestinal mucosa of patients with Crohn's disease | |
| Verginelli et al. | Transcription factors FOXG1 and Groucho/TLE promote glioblastoma growth | |
| Balasubramanian et al. | Comparison of chemokine and receptor gene expression between Wharton's jelly and bone marrow-derived mesenchymal stromal cells | |
| Ma et al. | Th17 cells regulate the production of CXCL1 in breast cancer | |
| Gong et al. | Regulation of the stromal cell–derived factor-1α–CXCR4 axis in human dental pulp cells | |
| Schindler et al. | TH17 cell frequency in peripheral blood is elevated in overweight children without chronic inflammatory diseases | |
| Niu et al. | Transcriptional profiling of interleukin-2-primed human adipose derived mesenchymal stem cells revealed dramatic changes in stem cells response imposed by replicative senescence | |
| Luo et al. | Myeloid-derived suppressor cells recruited by chemokine (CC motif) ligand 3 promote the progression of breast cancer via phosphoinositide 3-kinase-protein kinase B-mammalian target of rapamycin signaling | |
| Jiang et al. | The expression of stromal cell–derived factor 1 (SDF-1) in inflamed human dental pulp | |
| Vasco et al. | Circulating T regulatory cells migration and phenotype in glioblastoma patients: an in vitro study | |
| Nieminen et al. | Dendritic cells from Crohn’s disease patients show aberrant STAT1 and STAT3 signaling | |
| Jung et al. | MCP-1 and MIP-3α secreted from necrotic cell-treated glioblastoma cells promote migration/infiltration of microglia | |
| Jurczyszyn et al. | The analysis of the relationship between multiple myeloma cells and their microenvironment | |
| Frühbeck et al. | Increased levels of interleukin-36 in obesity and type 2 diabetes fuel adipose tissue inflammation by inducing its own expression and release by adipocytes and macrophages | |
| Wang et al. | Periodontal treatment modulates gene expression of endothelial progenitor cells in diabetic patients | |
| Conte et al. | Clearance of defective muscle stem cells by senolytics restores myogenesis in myotonic dystrophy type 1 | |
| Schwartz et al. | Transcriptional and functional consequences of oncostatin M signaling on young Dnmt3a-mutant hematopoietic stem cells | |
| Ishida et al. | Mesenchymal stem cells up-regulate the invasive potential of prostate cancer cells via the eotaxin-3/CCR3 axis | |
| Meng et al. | mTOR signaling promotes rapid m6A mRNA methylation to regulate NK-cell activation and effector functions | |
| Toghi et al. | Pathogenic Th17 cells in autoimmunity with regard to rheumatoid arthritis |