EP4546142A2 - Dediziertes telemetrie-subsystem für telemetriedaten - Google Patents
Dediziertes telemetrie-subsystem für telemetriedaten Download PDFInfo
- Publication number
- EP4546142A2 EP4546142A2 EP25164368.0A EP25164368A EP4546142A2 EP 4546142 A2 EP4546142 A2 EP 4546142A2 EP 25164368 A EP25164368 A EP 25164368A EP 4546142 A2 EP4546142 A2 EP 4546142A2
- Authority
- EP
- European Patent Office
- Prior art keywords
- telemetry
- core
- telemetry data
- data
- histogram
- Prior art date
- Legal status (The legal status is an assumption and is not a legal conclusion. Google has not performed a legal analysis and makes no representation as to the accuracy of the status listed.)
- Pending
Links
Images




Classifications
-
- G—PHYSICS
- G06—COMPUTING OR CALCULATING; COUNTING
- G06F—ELECTRIC DIGITAL DATA PROCESSING
- G06F11/00—Error detection; Error correction; Monitoring
- G06F11/30—Monitoring
- G06F11/3003—Monitoring arrangements specially adapted to the computing system or computing system component being monitored
- G06F11/3024—Monitoring arrangements specially adapted to the computing system or computing system component being monitored where the computing system component is a central processing unit [CPU]
-
- G—PHYSICS
- G06—COMPUTING OR CALCULATING; COUNTING
- G06F—ELECTRIC DIGITAL DATA PROCESSING
- G06F11/00—Error detection; Error correction; Monitoring
- G06F11/30—Monitoring
- G06F11/34—Recording or statistical evaluation of computer activity, e.g. of down time, of input/output operation ; Recording or statistical evaluation of user activity, e.g. usability assessment
- G06F11/3466—Performance evaluation by tracing or monitoring
- G06F11/349—Performance evaluation by tracing or monitoring for interfaces, buses
-
- G—PHYSICS
- G06—COMPUTING OR CALCULATING; COUNTING
- G06F—ELECTRIC DIGITAL DATA PROCESSING
- G06F11/00—Error detection; Error correction; Monitoring
- G06F11/30—Monitoring
- G06F11/3089—Monitoring arrangements determined by the means or processing involved in sensing the monitored data, e.g. interfaces, connectors, sensors, probes, agents
-
- G—PHYSICS
- G06—COMPUTING OR CALCULATING; COUNTING
- G06F—ELECTRIC DIGITAL DATA PROCESSING
- G06F11/00—Error detection; Error correction; Monitoring
- G06F11/30—Monitoring
- G06F11/34—Recording or statistical evaluation of computer activity, e.g. of down time, of input/output operation ; Recording or statistical evaluation of user activity, e.g. usability assessment
- G06F11/3466—Performance evaluation by tracing or monitoring
- G06F11/3476—Data logging
-
- G—PHYSICS
- G06—COMPUTING OR CALCULATING; COUNTING
- G06F—ELECTRIC DIGITAL DATA PROCESSING
- G06F11/00—Error detection; Error correction; Monitoring
- G06F11/30—Monitoring
- G06F11/3065—Monitoring arrangements determined by the means or processing involved in reporting the monitored data
- G06F11/3072—Monitoring arrangements determined by the means or processing involved in reporting the monitored data where the reporting involves data filtering, e.g. pattern matching, time or event triggered, adaptive or policy-based reporting
- G06F11/3082—Monitoring arrangements determined by the means or processing involved in reporting the monitored data where the reporting involves data filtering, e.g. pattern matching, time or event triggered, adaptive or policy-based reporting the data filtering being achieved by aggregating or compressing the monitored data
-
- G—PHYSICS
- G06—COMPUTING OR CALCULATING; COUNTING
- G06F—ELECTRIC DIGITAL DATA PROCESSING
- G06F11/00—Error detection; Error correction; Monitoring
- G06F11/30—Monitoring
- G06F11/34—Recording or statistical evaluation of computer activity, e.g. of down time, of input/output operation ; Recording or statistical evaluation of user activity, e.g. usability assessment
- G06F11/3409—Recording or statistical evaluation of computer activity, e.g. of down time, of input/output operation ; Recording or statistical evaluation of user activity, e.g. usability assessment for performance assessment
-
- G—PHYSICS
- G06—COMPUTING OR CALCULATING; COUNTING
- G06F—ELECTRIC DIGITAL DATA PROCESSING
- G06F11/00—Error detection; Error correction; Monitoring
- G06F11/30—Monitoring
- G06F11/34—Recording or statistical evaluation of computer activity, e.g. of down time, of input/output operation ; Recording or statistical evaluation of user activity, e.g. usability assessment
- G06F11/3452—Performance evaluation by statistical analysis
Definitions
- Telemetry data collected from a system on a chip may be analyzed to assist with scheduling workloads to avoid antagonistic workloads, guide performance optimization efforts, and improve future hardware generations.
- telemetry data is collected by processing cores.
- the processing jobs assigned to each processing core may be interrupted so that the processing cores can handle telemetry data collection and in some instances, processing. Such interruptions may delay the processing of the jobs.
- the present disclosure provides for a telemetry subsystem enabling the telemetry data to be collected and, in some instances, processed without the need to interrupt processing jobs being processed by processing cores.
- the telemetry subsystem may include telemetry cores, telemetry agents, and telemetry memory.
- the telemetry subsystem may collect telemetry data from the processing cores of the SoC.
- the telemetry subsystem may also collect telemetry data from other components of the SoC.
- the collected telemetry data may be analyzed for anomalies.
- the collected telemetry data may also be aggregated in histograms using histogram accelerators for post-processing.
- An aspect of the disclosure provides for a system on a chip (SoC) for telemetry collection.
- SoC comprises one or more processing cores and a telemetry subsystem comprising one or more telemetry cores.
- the one or more telemetry cores are configured to process telemetry data generated by one or more telemetry sources.
- the telemetry subsystem includes a telemetry core random access memory (RAM), wherein the one or more telemetry cores are configured to store the telemetry data in the telemetry core RAM.
- RAM telemetry core random access memory
- the telemetry core is connected to the one or more processing cores via a bus.
- the SoC also comprise one or more additional components, wherein the one or more additional components provide the core or non-core telemetry data.
- the telemetry subsystem further comprises one or more telemetry agents, wherein the one or more telemetry agents are attached to components of the SoC to monitor the components of the SoC for the telemetry data.
- the telemetry subsystem comprises one or more histogram accelerator, wherein the one or more histogram accelerator processes the core telemetry data and the non-core telemetry data.
- the telemetry data is stored in the memory.
- the method includes collecting, by one or more the telemetry agents, telemetry data from one or more device components.
- the method also includes aggregating, by one or more telemetry cores, the collected telemetry data into a histogram.
- the method further includes storing, by the one or more telemetry cores, the aggregated telemetry data in memory.
- the method also includes analyzing, by the one or more processors, the aggregated telemetry data to determine operational changes for the device components.
- the collected telemetry data is stored in a telemetry core random access memory (RAM),
- RAM telemetry core random access memory
- the method further includes configuring one or more telemetry agents to connect to one or more device components for monitoring and collecting telemetry data.
- the telemetry core is connected to the one or more processing cores via a bus.
- the telemetry data includes core telemetry data and non-core telemetry data.
- the telemetry subsystem comprises one or more analysis modules, wherein the telemetry cores configure the one or more analysis modules to generate histograms based on the telemetry data, post-process the generated histograms and detect anomalies from the post-processed histograms.
- a first histogram accelerator of the one or more histogram accelerators processes the core telemetry data and a second histogram accelerator of the one or more histogram accelerators processes the non-core telemetry data.
- the first histogram accelerator is configured to group the core telemetry data into bins according to part identifiers and event identifiers within the core telemetry data.
- the second histogram accelerator is configured to group the non-core telemetry data into bins according to part identifiers and event identifiers within the non-core telemetry data.
- the telemetry subsystem may include one or more telemetry cores dedicated to telemetry data collection. Telemetry cores are configured to receive telemetry data from telemetry agents, processing cores, and other components of a system on chip (SoC).
- SoC system on chip
- the technology generally relates to a telemetry subsystem for a system on a chip (SoC).
- the telemetry subsystem may collect, process, and report telemetry data.
- the telemetry subsystem may include one or more telemetry cores and telemetry agents.
- the telemetry cores may be dedicated to telemetry data collection and processing.
- the telemetry agents may monitor and collect telemetry data from processing cores and other components of the SoC.
- the collected telemetry data may be provided by the telemetry agents to the telemetry cores.
- telemetry cores are configured to receive telemetry data from telemetry agents.
- Non-core telemetry data may include information related to memory utilization and I/O load, bandwidth and latency information, frequency of reliability events, power states, etc., of the components other than the processing cores.
- non-core telemetry data may comprise telemetry data generated by or otherwise obtained from, components other than the processing cores, such as interconnects, common cache hierarchies, die-to-die interfaces, memory controllers, I/O interfaces, current monitors, voltage regulators, aging monitors, temperature sensors, etc.
- FIG. 1 illustrates a system on a chip (SoC) with an integrated telemetry subsystem.
- SoC 101 may include compute complex 102, memory 112, and miscellaneous components (MISC) 110.
- MISC 110 may include components such as interconnects, common cache hierarchies, die-to-die interfaces, memory controllers, I/O interfaces, current monitors, voltage regulators, aging monitors, temperature sensors, and other such components that may be found on or within a typical SoC.
- compute complex 102 may include one or more telemetry cores 104, one or more processing cores 106, telemetry core (TC) random access memory (RAM) 114, and processing RAM (which may be implemented, for example, as L1 cache) 116.
- TC telemetry core
- RAM random access memory
- Telemetry agents may be attached to each processing core 106, MISC 110, and memory 112.
- telemetry agents 108(a) may be connected to processing cores 106
- telemetry agents 108(b) may be connected to memory 112
- telemetry agents 108(c) may be connected to MISC.
- the telemetry subsystem may include telemetry core(s) 104 and TC RAM 114, as well as telemetry agents 108a-c. It is to be understood that the telemetry subsystem may include any number of telemetry cores, TC RAMs, and telemetry agents.
- each processing core 106 may have its own telemetry agent.
- a telemetry agent may be shared by one or more processing cores.
- each MISC or memory may have its own telemetry agent or share a telemetry agent with other MISCs or memory.
- TC RAM may be used to store telemetry data collected by telemetry cores.
- Each TC RAM may be connected to a telemetry core or shared by one or more telemetry cores.
- Each Processing RAM may be connected to a processing core or shared by one or more processing cores.
- MISC 110, memory 112, telemetry core(s) 104, processing core(s) 106, and telemetry agents 108a-c may be connected together via an interconnector.
- MISC 110, memory 112, telemetry core(s) 104, processing core(s) 106, and telemetry agents 108a-c are connected to SoC interconnect 120 that may route transactions between the components.
- the SoC interconnect 120 may carry telemetry data provided by telemetry agents 108a-c to telemetry cores 104.
- telemetry agents 108a-c may send the telemetry data directly to memory 112.
- telemetry agents 108a-c may send the telemetry data in a pre-processed format directly to TC RAM 114.
- the telemetry subsystem may receive telemetry data from MISC 110, memory 112, processing cores 106, etc.
- telemetry agents 108c may monitor or otherwise receive non-core telemetry data from MISC 110 and pass the received non-core telemetry data to the telemetry cores 104 via SoC interconnect 120.
- the telemetry agent108 may query the MISC 110 for telemetry data and send received telemetry data to the telemetry subsystem.
- the telemetry cores 104 may receive core telemetry data from the processing cores 106 through telemetry agent 108a.
- the core and non-core telemetry data may be stored by the telemetry cores 104 in on-die memory, such as TC RAM 114.
- the telemetry cores 104 may store the telemetry data off-die, such as in memory 112.
- FIG. 2 is an illustration of an example interconnection system of SoC 201, which may be compared to SoC 101.
- the components of SoC 201 include TC RAM 215, MISC 211A-D, processing cores 201A-D, and telemetry core 205 on SoC 201.
- Interconnect 220 which may be compared to SoC interconnect 120 as illustrated in FIG. 1 , may facilitate communications between processing cores 201A-D and MISC 211A-D with telemetry core 205 and TC RAM 215.
- Fig. 2 illustrates an interconnection system shared between the processing cores and the telemetry subsystem, the telemetry subsystem may be implemented using a separate telemetry interconnect, which may decouple telemetry data transfer from the rest of the system.
- one or more processing cores 201A-D may be converted to telemetry cores.
- a processor core such as processing core 201A may be converted to a telemetry core to assist telemetry core 205 in handling telemetry data provided by the telemetry agents.
- Telemetry agents 230 A-D may be attached to each processing core 201A-D.
- Telemetry agent 240A-D may be attached to each MISC 211A-D.
- Telemetry subsystem 202 may comprise telemetry core 205, TC RAM 215, and telemetry agents 240 A-D. For clarity, only the telemetry core 205 and TC RAM 215 are shown as being within the dashed-box representing telemetry subsystem 202.
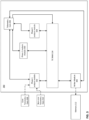
- Figure 3 depicts an architecture of a telemetry subsystem.
- the telemetry subsystem architecture may include telemetry core 301, phase 1 analysis module 302, phase 2 analysis module 303, phase 3 analysis module 304, TC RAM 114, and writer module 305.
- the phase 1-3 analysis modules 302-304 and writer module 305 may be hardware or software components controlled by telemetry core 301.
- telemetry subsystem 300 may receive core telemetry data 308 and non-core telemetry data 310 from telemetry agents.
- the telemetry data including the core and non-core telemetry data, may be provided directly to the telemetry cores without the use of a telemetry agent.
- Core 301 may control the operation of phase 1 analysis module 302, phase 2 analysis module 303, phase 3 analysis module 304, and write module 305, as described herein.
- Phase 1 analysis module 302 may process core telemetry data 308 and non-core telemetry data 310 using histogram accelerators or store core telemetry data 308 and non-core telemetry data 310 as raw data in TC RAM 114.
- phase 1 analysis module 302 may contain histogram accelerators that may read the telemetry data, which may be transmitted in data packets, and group the telemetry data into bins according to the telemetry data's partition identifier and event identifier.
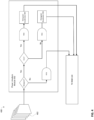
- FIG. 4 depicts an example phase 1 analysis module using histogram accelerators.
- the phase 1 analysis module 302 may include one or more histogram accelerators and FIFOs.
- the phase 1 analysis module 302 may determine if the incoming data received from the telemetry agent(s) 402 (or from a processing core) should be aggregated into histograms by the phase 1 analysis module 302 or not. If the data should not be aggregated into a histogram, the data will be dropped to TC RAM 114 via a FIFO and potentially sub-sampled. Otherwise, phase 1 analysis module 302 may determine whether the data is core telemetry data or non-core telemetry data.
- Histogram accelerator 404 may process the core telemetry data and histogram accelerator 406 may process non-core telemetry data. Processing cores may change the number of bins generated by histogram accelerator 404 and histogram accelerator 406 independently of each other. Processing cores can also change the interval of data sent by telemetry sources independently for each telemetry source. The histogram data may be sent to TC RAM 114.
- the phase 2 analysis module 303 retrieves the histogram data to perform post-processing of the generated histograms.
- the phase 2 analysis module 303 can calculate the distribution and/or other relevant statistical figures associated with each histogram stored in TC RAM 114. These statistical figures are then stored in TC RAM 114.
- the phase 3 analysis module 304 may retrieve the statistical data and/or histograms, and further analyze the data.
- Example analysis may be anomaly/phase detection where anomalies may include any type of inconsistency in the pattern of the data from the rest of the data or excessive redundancy in the same data, etc.
- Such anomalies, and data related to the anomalies may be sent by telemetry core 301 to TC RAM 114. Further, telemetry core 104 (as shown in Fig 1 ) may retrieve the data related to the anomalies for further analysis and corrective measurements.
- Writer module 305 may retrieve any data stored in TC RAM 114 to store in SoC memory 112 (as shown in FIG. 1 ) for processing by and/or review by processing cores 106 (as shown in FIG. 1 .)
- telemetry core 104 may utilize writer module 305 to store the data in memory 112 via SoC interconnect 120.
- writer module 305 may be hardware or software components controlled by telemetry core 301, writer module 305 may also be logically implemented inside telemetry core 104.
- FIG. 5 depicts a flow diagram illustrating a method for processing telemetry data using a telemetry subsystem.
- telemetry agents may be configured to monitor and collect telemetry data from various components of an SoC.
- the telemetry agents may be configured by dedicated telemetry cores to monitor and collect information from various components of the SoC such as processing cores 106, memory 112, and MISC 110 as illustrated in FIG.1 .
- the telemetry agents may monitor and collect telemetry data from various components included in MISC 110 such as I/O interfaces, memory controllers, current and voltage sensors, etc.
- the telemetry agents may start or stop collecting telemetry data.
- Telemetry cores may determine when to start or stop collecting the telemetry data based on a predetermined threshold data volume or predetermined data collection frequency. For example, the telemetry cores may configure the telemetry agent to stop collecting the telemetry data when the volume of the incoming data exceeds the volume of the data that the telemetry cores can process in a given time. The data collection frequency may be adjusted in accordance with the volume of the incoming telemetry data and the processing rate of the telemetry cores. Telemetry cores may filter the collected telemetry data to reduce the volume of the data obtained by the telemetry agents. In some examples, the telemetry cores may stop the telemetry agents when anomalies in the telemetry data, such as inconsistency in the pattern of the telemetry data or excessive redundancy in the same data are discovered.
- core telemetry data and non-core telemetry data may be accumulated and aggregated for post-processing.
- the telemetry agents may collect both core telemetry data and non-core telemetry data and transmit the core and non-core telemetry data to the telemetry core to be accumulated and aggregated in histograms, as described herein with regard to the phase 1 analysis module 302.
- the phase 1 analysis module 302 may also calculate statistical figures such as a sum of the values and a sum of square of the values (or average and standard deviation)
- the aggregated and accumulated data may be stored in the dedicated telemetry RAM. Any inconsistency in the distribution of the telemetry data or excessive amount of data falling into a particular bin of the histogram may be detected from the phase 1 output by the phase 2 analysis module 303.
- the core telemetry data and the non-core telemetry data may be sent to the SoC memory, such as memory 112, as illustrated in FIG. 1 .
- the telemetry core may retrieve the aggregated core telemetry data and non-core telemetry data from the dedicated telemetry RAM and transmit the retrieved data to the SoC memory.
- the core telemetry data and non-core telemetry data sent to the SoC memory at this stage may be post-processed data.
- processing cores may read the data from the SoC memory and actuate changes in the SoC.
- the processing cores may retrieve the aggregated core telemetry data and non-core telemetry data from the SoC memory and determine if any change should be made to components of the SoC. If necessary, the processing cores may reconfigure the components to address any errors discovered. For example, if the processing cores determine from the telemetry data attached to a temperature sensor on an SoC that the temperature within the SoC is too high, the processing core may cause a fan connected to the SoC to operate to lower the temperature or place some components of the SoC in the idle mode until the temperature drops. In another example, if the processing cores determine from telemetry data that a specific process is responsible for memory traffic bursts impacting the performance of other processes in the SoC, the processing cores can impose policies to throttle such a process in hardware or software.
- Figure 6 depicts a flow diagram illustrating a method for generating and changing a histogram.
- the histogram accelerators may read a raw event packet from a FIFO.
- Raw event packets may refer to unaggregated core telemetry data and non-core telemetry data.
- the unaggregated core telemetry data may be processed by histogram accelerator 404 and the non-core telemetry data may be processed by histogram accelerator 406.
- the raw event packet may be analyzed to determine whether the event field in the raw event packet is valid.
- each raw event packet may include an event field value or event identifier that represents unique identifiers of certain events where the telemetry data occurred.
- the telemetry cores may determine whether the incoming telemetry data within a raw event packet is valid by comparing the event identifier attached to the raw event packet against the preprogrammed valid event identifiers.
- the appropriate bins of the histograms may be incremented.
- the telemetry data may be grouped into one of the bins of the histograms and the counter of said one of the bins may be incremented.
- threshold values may be used to compare against the telemetry data for selection of the right bin. Such threshold values may be preprogrammed or configurable.
- the sum of the histograms may be incremented by the event value of each event and the sum square may be incremented by the square of the event value.
- different events may have different identifiers.
- Each sample of the telemetry data may have a value for each of the events monitored and measured. Grouping the telemetry data into one or more bins may be a lossy process. Since calculating average and standard deviation for each sample may be computationally expensive, computing sum/sum square may be beneficial to maintain accuracy for the purpose of calculating a first and second moment (also referred to herein as average and standard deviation, respectively), accurately to better identify the distribution of the values. For example, a first bin has an interval of 0-100 and a second bin has an interval of 101-1000.
- any changes made to the histograms may be written back to the SoC memory.
- Information related to the changes made in the above steps may be stored in the dedicated telemetry RAM first.
- the telemetry core may retrieve the saved information and store it in the SoC memory, such as memory 112 as shown in FIG. 3 .
- Example 1 A system on a chip, SoC, for telemetry collection, the SoC comprising: one or more processing cores; and a telemetry subsystem, comprising one or more telemetry cores, wherein the one or more telemetry cores are configured to process telemetry data generated by one or more telemetry sources.
- Example 2 The SoC of example 1, wherein the telemetry subsystem includes a telemetry core random access memory, RAM, wherein the one or more telemetry cores are configured to store the telemetry data in the telemetry core RAM; and/or wherein the telemetry core RAM is connected to the one or more processing cores via a bus.
- the telemetry subsystem includes a telemetry core random access memory, RAM, wherein the one or more telemetry cores are configured to store the telemetry data in the telemetry core RAM; and/or wherein the telemetry core RAM is connected to the one or more processing cores via a bus.
- Example 3 The SoC of one of examples 1 or 2, wherein the telemetry data includes core telemetry data and non-core telemetry data.
- Example 4 The SoC of example 3, further comprising one or more additional components, wherein the one or more additional components provide the core telemetry data or the non-core telemetry data; or wherein the telemetry subsystem further comprises one or more telemetry agents, wherein the one or more telemetry agents are attached to components of the SoC to monitor the components of the SoC for the telemetry data.
- Example 5 The SoC of one of examples 1 to 4, wherein the telemetry subsystem comprises one or more analysis modules, wherein the one or more telemetry cores configure the one or more analysis modules to generate histograms based on the telemetry data, post-process the generated histograms, and detect anomalies from the post-processed histograms.
- Example 6 The SoC of one of examples 1 to 5, wherein the telemetry subsystem comprises one or more histogram accelerators, wherein the one or more histogram accelerators process the core telemetry data and the non-core telemetry data.
- Example 7 The SoC of example 6, wherein a first histogram accelerator of the one or more histogram accelerators processes the core telemetry data and a second histogram accelerator of the one or more histogram accelerators processes the non-core telemetry data.
- Example 8 The SoC of example 7, wherein the first histogram accelerator is configured to group the core telemetry data into bins according to part identifiers and event identifiers within the core telemetry data; the second histogram accelerator is configured to group the non-core telemetry data into bins according to part identifiers and event identifiers within the non-core telemetry data; and wherein the telemetry data is optionally stored in memory.
- Example 9 A method for telemetry collection, the method comprising: collecting, by one or more the telemetry agents, telemetry data from one or more device components; aggregating, by one or more telemetry cores, the collected telemetry data into a histogram; storing, by the one or more telemetry cores, the aggregated telemetry data in memory; and analyzing, by one or more processing cores, the aggregated telemetry data to determine operational changes for the device components.
- Example 10 The method of example 9, wherein the collected telemetry data is stored in a telemetry core random access memory.
- Example 11 The method of one of examples 9 or 10, wherein the one or more telemetry cores are connected to the one or more processing cores via a bus.
- Example 12 The method of one of examples 9 to 11, wherein the telemetry data includes core telemetry data and non-core telemetry data.
- Example 13 The method of one of examples 9 to 12, wherein the collected telemetry data is aggregated using one or more analysis modules, wherein the one or more analysis modules are configured to generate histograms based on the telemetry data, post-process the generated histograms, and detect anomalies from the post-processed histograms
- Example 14 The method of example 12, wherein the core telemetry data and the non-core telemetry data is processed by one or more histogram accelerators; wherein, optionally, a first histogram accelerator of the one or more histogram accelerators processes the core telemetry data and a second histogram accelerator of the one or more histogram accelerators processes the non-core telemetry data.
- Example 15 The method of one of examples 9 to 14, further comprising: configuring the one or more telemetry agents to connect to the one or more device components for monitoring and collecting telemetry data.
Landscapes
- Engineering & Computer Science (AREA)
- Theoretical Computer Science (AREA)
- General Engineering & Computer Science (AREA)
- Physics & Mathematics (AREA)
- Quality & Reliability (AREA)
- General Physics & Mathematics (AREA)
- Computer Hardware Design (AREA)
- Computing Systems (AREA)
- Mathematical Physics (AREA)
- Arrangements For Transmission Of Measured Signals (AREA)
- Radio Relay Systems (AREA)
Applications Claiming Priority (2)
| Application Number | Priority Date | Filing Date | Title |
|---|---|---|---|
| US18/116,042 US20240296105A1 (en) | 2023-03-01 | 2023-03-01 | Dedicated Telemetry Subsystem For Telemetry Data |
| EP23192292.3A EP4425339A1 (de) | 2023-03-01 | 2023-08-19 | Dediziertes telemetrie-subsystem für telemetriedaten |
Related Parent Applications (1)
| Application Number | Title | Priority Date | Filing Date |
|---|---|---|---|
| EP23192292.3A Division EP4425339A1 (de) | 2023-03-01 | 2023-08-19 | Dediziertes telemetrie-subsystem für telemetriedaten |
Publications (2)
| Publication Number | Publication Date |
|---|---|
| EP4546142A2 true EP4546142A2 (de) | 2025-04-30 |
| EP4546142A3 EP4546142A3 (de) | 2025-07-23 |
Family
ID=87760408
Family Applications (2)
| Application Number | Title | Priority Date | Filing Date |
|---|---|---|---|
| EP23192292.3A Pending EP4425339A1 (de) | 2023-03-01 | 2023-08-19 | Dediziertes telemetrie-subsystem für telemetriedaten |
| EP25164368.0A Pending EP4546142A3 (de) | 2023-03-01 | 2023-08-19 | Dediziertes telemetrie-subsystem für telemetriedaten |
Family Applications Before (1)
| Application Number | Title | Priority Date | Filing Date |
|---|---|---|---|
| EP23192292.3A Pending EP4425339A1 (de) | 2023-03-01 | 2023-08-19 | Dediziertes telemetrie-subsystem für telemetriedaten |
Country Status (2)
| Country | Link |
|---|---|
| US (1) | US20240296105A1 (de) |
| EP (2) | EP4425339A1 (de) |
Families Citing this family (2)
| Publication number | Priority date | Publication date | Assignee | Title |
|---|---|---|---|---|
| CN118796619A (zh) * | 2023-04-13 | 2024-10-18 | 联发科技(新加坡)私人有限公司 | 内核测试方法和内核测试电路 |
| US20250370901A1 (en) * | 2024-06-04 | 2025-12-04 | Mellanox Technologies, Ltd. | Volume-efficient telemerty |
Family Cites Families (8)
| Publication number | Priority date | Publication date | Assignee | Title |
|---|---|---|---|---|
| CN104520806B (zh) * | 2012-08-01 | 2016-09-14 | 英派尔科技开发有限公司 | 用于云监控的异常检测 |
| CN105900092B (zh) * | 2014-03-26 | 2019-05-14 | 株式会社日立制作所 | 时序数据管理方法以及时序数据管理系统 |
| US20160378628A1 (en) * | 2015-06-26 | 2016-12-29 | Intel Corporation | Hardware processors and methods to perform self-monitoring diagnostics to predict and detect failure |
| US20170147422A1 (en) * | 2015-11-23 | 2017-05-25 | Alcatel-Lucent Canada, Inc. | External software fault detection system for distributed multi-cpu architecture |
| WO2017167398A1 (en) * | 2016-04-01 | 2017-10-05 | Intel Corporation | Method and apparatus for time and event aligned multilayer multiagent performance monitoring |
| US12231487B2 (en) * | 2020-02-13 | 2025-02-18 | Intel Corporation | Hardware-assisted tracing schemes for distributed and scale-out applications |
| US12044730B2 (en) * | 2020-12-22 | 2024-07-23 | Intel Corporation | Device, system, and method to concurrently store multiple PMON counts in a single register |
| US11693958B1 (en) * | 2022-09-08 | 2023-07-04 | Radiant Security, Inc. | Processing and storing event data in a knowledge graph format for anomaly detection |
-
2023
- 2023-03-01 US US18/116,042 patent/US20240296105A1/en active Pending
- 2023-08-19 EP EP23192292.3A patent/EP4425339A1/de active Pending
- 2023-08-19 EP EP25164368.0A patent/EP4546142A3/de active Pending
Also Published As
| Publication number | Publication date |
|---|---|
| EP4425339A1 (de) | 2024-09-04 |
| EP4546142A3 (de) | 2025-07-23 |
| US20240296105A1 (en) | 2024-09-05 |
Similar Documents
| Publication | Publication Date | Title |
|---|---|---|
| CN110347116B (zh) | 一种基于运行数据流的机床状态监测系统与监测方法 | |
| EP4425339A1 (de) | Dediziertes telemetrie-subsystem für telemetriedaten | |
| US11140056B2 (en) | Flexible and safe monitoring of computers | |
| CN112463543B (zh) | 业务数据的监控方法、规则数据生成方法、装置及系统 | |
| CN107302466B (zh) | 一种动环监控系统大数据分析平台及方法 | |
| WO2021217630A1 (zh) | 车辆数据上传方法、装置、计算机设备和存储介质 | |
| CN119446009B (zh) | 一种液晶显示屏的烧录装置及烧录方法 | |
| CN114035990A (zh) | 一种面向Linux操作系统时序数据的实时异常检测方法 | |
| CN117592410A (zh) | 一种芯片优化的方法及系统 | |
| CN117155871A (zh) | 一种港口工业互联网点位低时延并发处理方法 | |
| EP1774704B1 (de) | Verbesserte vorrichtung zur verarbeitung von netzwerkstatistiken | |
| CN111857319A (zh) | 一种服务器功耗智能优化方法与系统 | |
| CN114912638A (zh) | 一种有效运行参数上报的数字电缆 | |
| CN112710915B (zh) | 监控电力设备的方法、装置、电子设备和计算机存储介质 | |
| CN119025386B (zh) | 一种通用的芯片采集系统 | |
| CN108494635A (zh) | 一种基于云计算的网络流量探测系统 | |
| CN117827577A (zh) | 基于数据冷热系数的监控频率确定方法及装置 | |
| CN116708219A (zh) | 一种基于dpi平台的数据获取方法及装置 | |
| CN105306279A (zh) | 一种企业级应用系统的数据性能分析平台及方法 | |
| CN116016720B (zh) | 一种多接口多通道在线离线网络协议解析系统及方法 | |
| CN117692302B (zh) | 一种数据收集存储和智能监控告警的方法及系统 | |
| CN111209102A (zh) | 一种分布式任务分发方法与系统 | |
| CN110196366A (zh) | 线路停复电状态识别方法、装置、计算机设备和存储介质 | |
| CN116843178A (zh) | 一种基于流数据处理的变配电系统风险监测方法 | |
| CN121036003A (zh) | 一种配电网馈线自愈控制方法和系统 |
Legal Events
| Date | Code | Title | Description |
|---|---|---|---|
| PUAI | Public reference made under article 153(3) epc to a published international application that has entered the european phase |
Free format text: ORIGINAL CODE: 0009012 |
|
| STAA | Information on the status of an ep patent application or granted ep patent |
Free format text: STATUS: THE APPLICATION HAS BEEN PUBLISHED |
|
| AC | Divisional application: reference to earlier application |
Ref document number: 4425339 Country of ref document: EP Kind code of ref document: P |
|
| AK | Designated contracting states |
Kind code of ref document: A2 Designated state(s): AL AT BE BG CH CY CZ DE DK EE ES FI FR GB GR HR HU IE IS IT LI LT LU LV MC ME MK MT NL NO PL PT RO RS SE SI SK SM TR |
|
| REG | Reference to a national code |
Ref country code: DE Ref legal event code: R079 Free format text: PREVIOUS MAIN CLASS: G06F0011340000 Ipc: G06F0011300000 |
|
| PUAL | Search report despatched |
Free format text: ORIGINAL CODE: 0009013 |
|
| AK | Designated contracting states |
Kind code of ref document: A3 Designated state(s): AL AT BE BG CH CY CZ DE DK EE ES FI FR GB GR HR HU IE IS IT LI LT LU LV MC ME MK MT NL NO PL PT RO RS SE SI SK SM TR |
|
| RIC1 | Information provided on ipc code assigned before grant |
Ipc: G06F 11/30 20060101AFI20250618BHEP Ipc: G06F 11/34 20060101ALI20250618BHEP |
|
| STAA | Information on the status of an ep patent application or granted ep patent |
Free format text: STATUS: REQUEST FOR EXAMINATION WAS MADE |
|
| 17P | Request for examination filed |
Effective date: 20260116 |