EP4545008A1 - Verfahren und vorrichtung zur analyse von hochfrequenz-qrs-wellenformdaten, computervorrichtung und speichermedium - Google Patents
Verfahren und vorrichtung zur analyse von hochfrequenz-qrs-wellenformdaten, computervorrichtung und speichermedium Download PDFInfo
- Publication number
- EP4545008A1 EP4545008A1 EP23826008.7A EP23826008A EP4545008A1 EP 4545008 A1 EP4545008 A1 EP 4545008A1 EP 23826008 A EP23826008 A EP 23826008A EP 4545008 A1 EP4545008 A1 EP 4545008A1
- Authority
- EP
- European Patent Office
- Prior art keywords
- waveform data
- amplitude
- reference point
- relative value
- voltage
- Prior art date
- Legal status (The legal status is an assumption and is not a legal conclusion. Google has not performed a legal analysis and makes no representation as to the accuracy of the status listed.)
- Pending
Links
Images


Classifications
-
- A—HUMAN NECESSITIES
- A61—MEDICAL OR VETERINARY SCIENCE; HYGIENE
- A61B—DIAGNOSIS; SURGERY; IDENTIFICATION
- A61B5/00—Measuring for diagnostic purposes; Identification of persons
- A61B5/24—Detecting, measuring or recording bioelectric or biomagnetic signals of the body or parts thereof
- A61B5/316—Modalities, i.e. specific diagnostic methods
- A61B5/318—Heart-related electrical modalities, e.g. electrocardiography [ECG]
- A61B5/346—Analysis of electrocardiograms
- A61B5/349—Detecting specific parameters of the electrocardiograph cycle
- A61B5/366—Detecting abnormal QRS complex, e.g. widening
-
- A—HUMAN NECESSITIES
- A61—MEDICAL OR VETERINARY SCIENCE; HYGIENE
- A61B—DIAGNOSIS; SURGERY; IDENTIFICATION
- A61B5/00—Measuring for diagnostic purposes; Identification of persons
- A61B5/24—Detecting, measuring or recording bioelectric or biomagnetic signals of the body or parts thereof
- A61B5/316—Modalities, i.e. specific diagnostic methods
- A61B5/318—Heart-related electrical modalities, e.g. electrocardiography [ECG]
- A61B5/346—Analysis of electrocardiograms
- A61B5/349—Detecting specific parameters of the electrocardiograph cycle
- A61B5/352—Detecting R peaks, e.g. for synchronising diagnostic apparatus; Estimating R-R interval
-
- A—HUMAN NECESSITIES
- A61—MEDICAL OR VETERINARY SCIENCE; HYGIENE
- A61B—DIAGNOSIS; SURGERY; IDENTIFICATION
- A61B5/00—Measuring for diagnostic purposes; Identification of persons
- A61B5/72—Signal processing specially adapted for physiological signals or for diagnostic purposes
- A61B5/7235—Details of waveform analysis
- A61B5/7264—Classification of physiological signals or data, e.g. using neural networks, statistical classifiers, expert systems or fuzzy systems
Definitions
- the invention relates to the technical field of medical instruments, and more particularly to a method and an apparatus for analyzing high-frequency QRS waveform data, a computer device and a storage medium.
- Vascular responsiveness of coronary artery can be referred to as coronary artery vascular response capability or vascular response capability. It can be used to characterize the immediate response capacity of blood vessels to rapid expansion of blood supply and can serve as one of indexes to evaluate the viability of cardiomyocytes to provide a doctor for reference, so that the doctor can accurately identify the heart health condition of a subject in combination with clinical signs and symptoms and the like. Therefore, how to accurately evaluate the vascular response capability is an issue worthy of attention.
- a method and an apparatus for analyzing high-frequency QRS waveform data, a computer device, and a storage medium are provided.
- a method for analyzing high-frequency QRS waveform data includes the following steps:
- the screening the high-frequency QRS waveform data with the first amplitude drop relative value greater than or equal to a first preset threshold includes: screening the high-frequency QRS waveform data of corresponding waveform categories as a first category, a second category and a third category.
- Waveform characteristics of the first category include: a first amplitude drop relative value is greater than or equal to a first preset threshold, and a first amplitude rise relative value is greater than or equal to a second preset threshold.
- Waveform characteristics of the second category include: the first amplitude drop relative value is greater than or equal to the first preset threshold, a second amplitude rise relative value is less than a third preset threshold, and a duration of a second reference waveform data is greater than or equal to a preset duration threshold.
- Waveform characteristics of the third category include: the first amplitude drop relative value is greater than or equal to the first preset threshold, the second amplitude rise relative value is greater than or equal to the third preset threshold, and the duration of the second reference waveform data is greater than or equal to the preset duration threshold.
- Steps of determining the first amplitude rise relative value include:
- Steps of determining the second amplitude rise relative value include:
- the screening the high-frequency QRS waveform data with the first amplitude drop relative value greater than or equal to a first preset threshold includes: screening the high-frequency QRS waveform data of a corresponding waveform category as a first category; or screening the high-frequency QRS waveform data of a corresponding waveform category as a second category; or screening the high-frequency QRS waveform data of a corresponding waveform category as a third category.
- Waveform characteristics of the first category include: the first amplitude drop relative value is greater than or equal to the first preset threshold, and a first amplitude rise relative value is greater than or equal to a second preset threshold.
- Waveform characteristics of the second category include: the first amplitude drop relative value is greater than or equal to the first preset threshold, the second amplitude rise relative value is less than a third preset threshold, and a duration of the second reference waveform data is greater than or equal to a preset duration threshold.
- Waveform characteristics of the third category include: the first amplitude drop relative value is greater than or equal to the first preset threshold, the second amplitude rise relative value is greater than or equal to the third preset threshold, and the duration of the second reference waveform data is greater than or equal to the preset duration threshold.
- Steps of determining the first amplitude rise relative value includes:
- Steps of determining the second amplitude rise relative value include:
- the determining vascular response capability according to a ratio of the voltage difference corresponding to the screened high-frequency QRS waveform data to the maximum voltage includes:
- the method further includes: determining a positive number according to the high-frequency QRS waveform data corresponding to the exercise ECG data.
- the determining vascular response capability according to a ratio of the voltage difference corresponding to the screened high-frequency QRS waveform data to the maximum voltage includes:
- an apparatus for analyzing high-frequency QRS waveform data includes:
- the screening module is further configured to further configured to screen the high-frequency QRS waveform data of corresponding waveform categories as a first category, a second category and a third category.
- Waveform characteristics of the first category include: a first amplitude drop relative value is greater than or equal to a first preset threshold, and a first amplitude rise relative value is greater than or equal to a second preset threshold; waveform characteristics of the second category include: the first amplitude drop relative value is greater than or equal to the first preset threshold, a second amplitude rise relative value is less than a third preset threshold, and a duration of a second reference waveform data is greater than or equal to a preset duration threshold; and waveform characteristics of the third category include: the first amplitude drop relative value is greater than or equal to the first preset threshold, the second amplitude rise relative value is greater than or equal to the third preset threshold, and the duration of the second reference waveform data is greater than or equal to the preset duration threshold.
- the selection module is further configured to select a fifth reference point that meets a screening condition from the first reference waveform data; and a time of the fifth reference point is later than that of the first reference point.
- the index determining module is further configured to determine the first amplitude rise relative value based on the root-mean-square voltage of the first reference point and a root-mean-square voltage of the fifth reference point.
- the selection module is further configured to select, from the high-frequency QRS waveform data in the second time period, second reference waveform data whose amplitude fluctuation amplitude is less than or equal to a preset fluctuation amplitude; and select a point with a maximum root-mean-square voltage as a sixth reference point from the high-frequency QRS waveform data in a third time period.
- the index determining module is further configured to determine the second amplitude rise relative value based on a root-mean-square voltage of an end point of the second reference waveform data and the root-mean-square voltage of the sixth reference point.
- the screening module is further configured to screen the high-frequency QRS waveform data of a corresponding waveform category as a first category; or screen the high-frequency QRS waveform data of a corresponding waveform category as a second category; or screen the high-frequency QRS waveform data of a corresponding waveform category as a third category.
- the waveform characteristics of the first category include: a first amplitude drop relative value is greater than or equal to a first preset threshold, and a first amplitude rise relative value is greater than or equal to a second preset threshold; waveform characteristics of the second category include: the first amplitude drop relative value is greater than or equal to the first preset threshold, the second amplitude rise relative value is less than a third preset threshold, and a duration of the second reference waveform data is greater than or equal to a preset duration threshold; and waveform characteristics of the third category include: the first amplitude drop relative value is greater than or equal to the first preset threshold, the second amplitude rise relative value is greater than or equal to the third preset threshold, and the duration of the second reference waveform data is greater than or equal to the preset duration threshold.
- the selection module is further configured to select a fifth reference point that meets a screening condition from the first reference waveform data; and a time of the fifth reference point is later than that of the first reference point.
- the index determining module is further configured to determine the first amplitude rise relative value based on the root-mean-square voltage of the first reference point and a root-mean-square voltage of the fifth reference point.
- the selection module is further configured to select, from the high-frequency QRS waveform data in the second time period, second reference waveform data whose amplitude fluctuation amplitude is less than or equal to a preset fluctuation amplitude; and select a point with a maximum root-mean-square voltage as a sixth reference point from the high-frequency QRS waveform data in a third time period.
- the index determining module is further configured to determine the second amplitude rise relative value based on a root-mean-square voltage of an end point of the second reference waveform data and the root-mean-square voltage of the sixth reference point.
- the index determining module is further configured to determine a reference index according to the screened high-frequency QRS waveform data; where the reference index includes the ratio of the voltage difference to the maximum voltage, and further includes at least one of a target amplitude drop relative value and an area of a target waveform drop region; and determine the vascular response capability according to the reference index.
- the index determining module is further configured to determine a positive number according to the high-frequency QRS waveform data corresponding to the exercise ECG data; determine the vascular response capability according to the ratio of the voltage difference corresponding to the screened high-frequency QRS waveform data to the maximum voltage and the positive number; or, determine a reference index according to the screened high-frequency QRS waveform data, and determine the vascular response capability according to the reference index and the positive number; where the reference index includes the ratio of the voltage difference to the maximum voltage, and further includes at least one of a target amplitude drop relative value and an area of a target waveform drop region.
- a computer device in still another aspect, includes a memory and a processor.
- the memory is stored with computer-readable instructions, and the processor is configured to implement, when the computer-readable instructions executed by the processor, steps in various method embodiments.
- a computer-readable storage medium is stored with computer-readable storage instructions, and the computer-readable storage instructions is configured to be executed by a processor to implement the steps in various method embodiments.
- the method for analyzing high-frequency QRS waveform data provided by the invention can be applied to the terminal, the server, and the interactive system including the terminal and the server, and is realized through the interaction between the terminal and the server, which is not specifically limited herein.
- the terminals can be, but are not limited to, various personal computers, laptops, smartphones, tablet computers, electrocardiographic monitoring devices, and portable wearable devices, and the servers may be implemented with stand-alone servers or server clusters including multiple servers.
- a method for analyzing high-frequency QRS waveform data is provided, as illustrated by an example of the method being applied to a server, and specifically includes the following steps.
- Exercise ECG data refers to ECG data collected during exercise stress ECG testing (also referred to as stress ECG testing).
- the exercise stress ECG testing is an ECG detection method that increases the heart load through a certain amount of exercise to collect the ECG data of the subjects, so as to analyze the heart health of the subjects based on the collected ECG data. It is widely used in the detection of heart diseases and cardiovascular diseases.
- the exercise ECG data includes multiple QRS complexes reflecting changes in left and right ventricular depolarization potentials and time, and each QRS complex is a combination of the Q wave, R wave, and S wave in the ECG.
- the corresponding high-frequency QRS waveform data can be analyzed, which corresponds to the high-frequency QRS waveform curve, and the high-frequency QRS waveform data includes the data of points on the high-frequency QRS waveform curve (e.g., time and root-mean-square voltage).
- the corresponding high-frequency QRS waveform curve can be determined based on the high-frequency QRS waveform data.
- the high-frequency QRS waveform data/high-frequency QRS waveform curve is used to characterize the change trend of root-mean-square voltage of high-frequency components of the subject's QRS complex with time in the whole process of exercise stress ECG testing, that is, to reflect the energy change trend in the whole process of exercise stress ECG testing.
- the high-frequency QRS waveform data is presented by a high-frequency QRS waveform diagram.
- the abscissa is time, which corresponds to the detection time of the exercise stress ECG testing process in minutes (min)
- the ordinate is the root-mean-square voltage (RMS voltage), which can also be interpreted as the intensity or amplitude in microvolts ( ⁇ V).
- the corresponding exercise ECG data of the subject in the whole process of exercise stress ECG testing are obtained, and the high-frequency components of the QRS complex in the exercise ECG data are analyzed to obtain the corresponding high-frequency QRS waveform data.
- Exercise ECG data includes ECG corresponding to each heartbeat of the subject during the whole process of exercise stress ECG testing, and the ECG includes QRS complex.
- the exercise ECG data is divided into multiple ECG data subsets according to the time sequence and a preset moving step size through the window function, and each ECG data subset includes ECG corresponding to multiple heartbeats.
- the ECG or QRS complex corresponding to multiple heartbeats included in the ECG data subset is sequentially aligned, averaged and bandpass screened to obtain the corresponding high-frequency QRS complex (high-frequency band of QRS complex), and the root mean square of the high-frequency QRS complex is obtained to obtain the corresponding root-mean-square voltage, which is used as the root-mean-square voltage/intensity/amplitude corresponding to the ECG data subset.
- the corresponding high-frequency QRS waveform data can be obtained, so as to smooth the curve of each root-mean-square voltages in the high-frequency QRS waveform data according to the time sequence and obtain the corresponding high-frequency QRS waveform curve.
- curve smoothing is performed on the root-mean-square voltage corresponding to each ECG data subset according to the time sequence to obtain the corresponding high-frequency QRS waveform curve, and the corresponding high-frequency QRS waveform data is obtained according to the time and root-mean-square voltage of each point on the high-frequency QRS waveform curve.
- both the window length and the preset moving step size of the window function can be customized according to actual requirements, for example, the window length is set to 10 seconds, the preset moving step size is set to 10 seconds or one heartbeat period, and one heartbeat period refers to the time interval between two adjacent heartbeats, which is not specifically limited here.
- the time sequence refers to the sequence of the acquisition time of the signal/the detection time of the exercise stress ECG testing process advancing.
- the exercise stress ECG testing process includes multiple stages, specifically, it can sequentially include three stages: resting stage, exercise stage and recovery stage.
- the exercise ECG data includes ECG data of each stage. It can be understood that the division of stages is not limited to this, but it can be divided according to the actual situation.
- 10 electrode pads distributed in the chest and limbs of human body can be used to form 12 ECG leads (such as V1, V2, V3, V4, V5, V6, I, II, III, aVL, aVF and aVR), and 12 sets of ECG data can be correspondingly output to obtain the corresponding exercise ECG data in the whole exercise stress ECG testing process.
- 12 ECG leads such as V1, V2, V3, V4, V5, V6, I, II, III, aVL, aVF and aVR
- 12 sets of ECG data can be correspondingly output to obtain the corresponding exercise ECG data in the whole exercise stress ECG testing process.
- 10 electrode pads are only used as an example, and are not used to specifically limit the number of electrode pads, which may be dynamically determined according to actual needs, such as more or less number of electrode pads.
- the exercise ECG data includes ECG data corresponding to at least one ECG lead, and the high-frequency QRS waveform data corresponding to each ECG lead is obtained by analyzing the high-frequency components of QRS complex in the ECG data corresponding to each ECG lead respectively.
- the first time period can be a time interval determined by a preset start time point and an end time point, or a time interval determined by a preset start time point and a preset duration.
- the first time period may include a period before the exercise and a period during the exercise, or a period during the exercise, in which the period before the exercise is in a resting stage and the period during the exercise is in an exercise stage, such as a period after the exercise begins.
- the corresponding time range of the exercise stage is 3 to 9 min in the high-frequency QRS waveform curve
- the first time period is, for example, the time interval characterized by [1 min 20 s, 6 minutes], which includes 100 s before exercise and the first 3 min during exercise; and the first time period is also, for example, characterized by [3 min, 6 min], which includes the first 3 minutes during exercise.
- the first reference waveform data is the data in the high-frequency QRS waveform data whose time is within the first time period, and the time of each point in the first reference waveform data is within the first time period.
- the starting point and ending point of the first reference waveform data are the starting point and ending point of the first time period respectively.
- the starting point of the first reference waveform data refers to the earliest point in the first reference waveform data, that is, the first point in the first reference waveform data when sorted according to time sequence.
- the definition of the end point is similar and will not be repeated here.
- the position of each point in the first reference waveform data is determined by the time and root-mean-square voltage of the point, the root-mean-square voltage of each point in the first reference waveform data is traversed according to time sequence, the point with the minimum root-mean-square voltage is selected from the first reference waveform data based on the traversed root-mean-square voltage, and the first reference point is determined according to the point with the minimum root-mean-square voltage.
- the second reference point is determined according to the point whose time is earlier/less than the time of the first reference point and with the maximum root-mean-square voltage selected from the first reference waveform data.
- the selected point with the minimum root-mean-square voltage is taken as the first reference point, or, the selected point with the minimum root-mean-square voltage is corrected according to a preconfigured first correction coefficient and the corrected point is taken as the first reference point.
- the selected point with the maximum root-mean-square voltage and time earlier than the first reference point is taken as the second reference point, or, the selected point with the maximum root-mean-square voltage is corrected according to a preconfigured second correction coefficient and the corrected point is taken as the second reference point.
- the root-mean-square voltage corresponding to the point with the minimum root-mean-square voltage is corrected by the preconfigured first correction coefficient to obtain the corrected root-mean-square voltage, and the point in the first reference waveform data whose root-mean-square voltage is consistent with the corrected root-mean-square voltage is selected as the first reference point.
- the second reference point is determined based on the point where the preconfigured second correction coefficient and the selected point with the maximum root-mean-square voltage, which will not be described in detail here.
- the first correction coefficient and the second correction coefficient can be customized or dynamically determined according to the user portrait of the subject, and can be specific functions determined based on the user portrait.
- the first correction coefficient is greater than 1 and the second correction coefficient is less than 1.
- the user portrait includes at least one of the subject's age, gender, weight, clinical symptoms, living habits, etc.
- S108 determining a first amplitude drop relative value according to respective root-mean-square voltages of the first reference point and the second reference point.
- the root-mean-square voltages of the first reference point and the second reference point are respectively obtained, and the root-mean-square voltage of the second reference point and the root-mean-square voltage of the first reference point are differentiated to obtain a first amplitude drop absolute value, and a ratio of the first amplitude drop absolute value to the root-mean-square voltage of the second reference point is determined as a first amplitude drop relative value.
- the maximum voltage can be understood as the maximum power, which can be used to reflect the maximum heart pumping function of the subject.
- the maximum root-mean-square voltage is obtained from the high-frequency QRS waveform data as the target voltage, and the corresponding maximum voltage is determined according to the target voltage.
- the target voltage can be determined as the maximum voltage, or the maximum voltage can be obtained by correcting the target voltage through a preconfigured third correction coefficient.
- the third correction coefficient is customized according to the actual situation. For example, if a sum of the third correction coefficient and the target voltage is taken as the maximum voltage, the third correction coefficient can be set to 1 ⁇ V; and if a product of the third correction coefficient and the target voltage is taken as the maximum voltage, the third correction coefficient can be set to 1.2.
- the maximum voltage can also be obtained by rounding up the target voltage or the target voltage corrected by the third correction coefficient.
- the maximum voltage can be determined to be 10 ⁇ V by the rounding up.
- the third correction coefficient and the correction method of the target voltage are not specifically limited here.
- the maximum root-mean-square voltage is obtained from the high-frequency QRS waveform data corresponding to the ECG lead as the target voltage. If there is more than one ECG lead (multiple ECG leads), the maximum value of root-mean-square voltage is obtained from the high-frequency QRS waveform data corresponding to each ECG lead, and the maximum root-mean-square voltage is selected as the target voltage based on the comparison of the maximum values of root-mean-square voltages corresponding to respective ECG leads. In this way, the maximum voltage is determined based on the target voltage.
- the high-frequency QRS waveform data corresponding to each ECG lead includes not only the data of each point on the corresponding high-frequency QRS waveform curve, but also the maximum voltage determined according to one or more embodiments of the invention.
- S112 selecting a point with a maximum root-mean-square voltage as a third reference point and a point with a minimum root-mean-square voltage and time later than the third reference point as a fourth reference point from the high-frequency QRS waveform data in a second time period.
- the second time period can specifically include a period before exercise, a period during exercise and a period after exercise.
- the period before exercise is in the resting stage, the period during exercise includes the whole exercise stage, and the period after exercise is in the recovery stage.
- the period before exercise, the period during exercise and the period after exercise are sequential time periods.
- the corresponding time range of the exercise stage in the high-frequency QRS waveform data is 3 to 9 min
- the second time period is the time interval represented by [1 min 20 s, 9 min 20 s], which starts at 1 min 20 s and ends at 9 min 20 s.
- the second time period includes 100 s before exercise, 6 min during exercise and 20 s after exercise.
- the second time period includes the first time period, and the starting point of the second time period may be the same as the starting point of the first time period.
- the root-mean-square voltage of each point in the high-frequency QRS waveform data in the second time period is traversed, and based on the traversed root-mean-square voltage, the point with the maximum root-mean-square voltage in the high-frequency QRS waveform data in the second time period is selected as the third reference point, and the point with the minimum root-mean-square voltage and time later/longer than the third reference point in the high-frequency QRS waveform data in the second time period is selected as the fourth reference point.
- the third reference point and the second reference point may be the same point, specifically determined by the corresponding high-frequency QRS waveform data. If there are multiple points with the maximum root-mean-square voltage in the high-frequency QRS waveform data in the second time period, the point with the earliest time is selected as the third reference point from the multiple points with the maximum root-mean-square voltage.
- a difference between the root-mean-square voltage of the third reference point and the root-mean-square voltage of the corresponding fourth reference point is used to obtain the voltage difference corresponding to the corresponding high-frequency QRS waveform data.
- the voltage difference can be understood as an amplitude drop absolute value, specifically, it can be a second amplitude drop absolute value in one or more embodiments in the invention.
- FIG. 2 provides a schematic diagram of selecting reference points based on high-frequency QRS waveform data.
- the high-frequency QRS waveform diagram shows the high-frequency QRS waveform curve determined based on the high-frequency QRS waveform data corresponding to ECG lead II, with the abscissa being time in min and the ordinate being root-mean-square voltage/amplitude in ⁇ V.
- the corresponding time range of the exercise stage in the high-frequency QRS waveform data is 0 to 6 min, the first time period is the time interval corresponding to [100 s before 0, 3 min], and the second time period is the time interval corresponding to [100 s before 0, 6 min 20 s].
- the first reference waveform data includes the data in the first time period in the high-frequency QRS waveform data.
- the first reference point is the point with the minimum root-mean-square voltage in the first reference waveform data
- the second reference point is the point with the maximum root-mean-square voltage and time earlier than the first reference point in the first reference waveform data
- the third reference point is the point with the maximum root-mean-square voltage in the second time period
- the fourth reference point is the point with the minimum root-mean-square voltage and time later than the third reference point in the second time period.
- the third reference point and the second reference point are the same point
- the fourth reference point and the first reference point are the same point
- the maximum voltage is 12 ⁇ V (the maximum value of the ordinate presented/displayed in the high-frequency QRS waveform diagram)
- the voltage difference (the second amplitude drop absolute value) determined based on the third reference point and the fourth reference point is 4.8 ⁇ V
- the second amplitude drop relative value is 53%.
- S116 screening the high-frequency QRS waveform data with the first amplitude drop relative value greater than or equal to a first preset threshold.
- the first preset threshold can be customized according to the empirical value, such as 40%, or dynamically determined according to the user portrait of the subject, which includes at least one parameter such as age, weight, gender and load level, and is not specifically limited here.
- high-frequency QRS waveform data with corresponding first amplitude drop relative value greater than or equal to the first preset threshold are screened from each high-frequency QRS waveform data corresponding to exercise ECG data, so as to determine the vascular response capability based on the screened high-frequency QRS waveform data.
- the high-frequency QRS waveform data with the first amplitude drop relative value greater than or equal to the first preset threshold and the time interval between the first reference point and the second reference point less than or equal to the preset time interval are screened, so as to determine the ratio of voltage difference to maximum voltage based on the screened high-frequency QRS waveform data.
- a reference index including the ratio of voltage difference to maximum voltage is used to further determine the vascular response capability.
- the preset time interval can be customized according to the actual situation, such as 3 min.
- each high-frequency QRS waveform data corresponding to the exercise ECG data is less than the first preset threshold, it is not necessary to further determine the corresponding vascular response capability, but output each high-frequency QRS waveform data for the doctor's reference. It can be understood that the high-frequency QRS waveform data can also be output synchronously for doctors' reference under the condition of determining and outputting the vascular response capability.
- S118 determining vascular response capability according to a ratio of the voltage difference corresponding to the screened high-frequency QRS waveform data to the maximum voltage.
- Vascular response capability is used to characterize the difference of coronary artery vascular response capability for doctors' reference, so that doctors can accurately identify the health status of the heart according to the vascular response capability and clinical symptoms, and then give reference suggestions for further diagnosis and treatment or testing.
- the ratio of voltage difference to maximum voltage can be determined based on the corresponding voltage difference and maximum voltage. Further, the vascular response capability is determined according to the ratio of the voltage difference corresponding to each of the screened high-frequency QRS waveform data to the maximum voltage.
- the maximum value of the ratio of the voltage difference to the maximum voltage is screened from the ratio of the voltage difference to the maximum voltage corresponding to the screened high-frequency QRS waveform data, and the vascular response capability is determined according to the screened ratio of the voltage difference to the maximum voltage. For example, if the ratios of the voltage difference to the maximum voltage corresponding to the three of high-frequency QRS waveform data are 16%, 40% and 52% respectively, then the vascular response capability is determined according to 52% (the maximum value of the ratio of the voltage difference to the maximum voltage). It can be understood that the screened maximum value of the ratio of the voltage difference to the maximum voltage can be understood as the target ratio of the voltage difference to the maximum voltage.
- the corresponding voltage difference and maximum voltage can be determined for each of high-frequency QRS waveform data corresponding to the exercise ECG data before screening the high-frequency QRS waveform data with the first amplitude drop relative value greater than or equal to the first preset threshold.
- the corresponding voltage difference and maximum voltage can be determined for each screened high-frequency QRS waveform data.
- the corresponding voltage difference and the maximum voltage can be determined with reference to the methods provided in one or more embodiments of the invention, so as to determine the ratio of the voltage difference to the maximum voltage corresponding to the high-frequency QRS waveform data based on the voltage difference and the maximum voltage.
- the ratio of the voltage difference to the maximum voltage can reflect the coronary artery vascular response capability, which are negatively correlated. Therefore, the corresponding vascular response capability can be determined based on the ratio of the voltage difference to the maximum voltage. For example, the greater the ratio of the voltage difference to the maximum voltage, the lower or smaller the corresponding vascular response capability is (the higher the attention priority is), so as to represent the weaker the coronary artery vascular response capability. Specifically, the corresponding vascular response capability can be determined according to the ratio threshold interval where the ratio of the voltage difference to the maximum voltage is located.
- the ratio of the voltage difference to the maximum voltage is related to the individual difference of the subject. Therefore, the vascular response capability of the subject can be accurately evaluated based on this ratio.
- ratio threshold intervals from the first ratio threshold interval to the fourth ratio threshold interval with decreasing reference priority such as: greater than or equal to 46%, greater than or equal to 40% and less than 46%, greater than or equal to 30% and less than 40%, greater than or equal to 16% and less than 30% respectively. If the ratio of the voltage difference to the maximum voltage is in the first ratio threshold interval, the vascular response capability is marked as the first level with the highest attention priority, and if the ratio of the voltage difference to the maximum voltage is within the second ratio threshold interval, the vascular response capability is marked as the second level with the second highest attention priority, and so on, which will not be enumerated here.
- the vascular response capability can be marked as the level with the lowest attention priority, the related operation of further determining the vascular response capability based on the ratio of the voltage difference to the maximum voltage can be omitted, and the vascular response capability can also be determined based on other reference indexes provided in the invention.
- a reference index is determined according to the screened high-frequency QRS waveform data, and the vascular response capability is determined according to the reference index.
- the reference index includes the ratio of the voltage difference to the maximum voltage, and further includes at least one of the target amplitude drop relative value and an area of a target waveform drop region. It can be understood that the positive number can also be determined according to the high-frequency QRS waveform data corresponding to the exercise ECG data, and the vascular response capability can be determined according to the positive number and the reference index (the ratio of the voltage difference to the maximum voltage).
- the ratio of the voltage difference to the maximum voltage in the reference index refers to the maximum value of the ratio of the voltage difference to the maximum voltage corresponding to each high-frequency QRS waveform data whose corresponding first amplitude drop relative value is greater than or equal to the first preset threshold.
- the target amplitude drop relative value refers to the maximum of the second amplitude drop relative value corresponding to each high-frequency QRS waveform data whose corresponding first amplitude drop relative value is greater than or equal to the first preset threshold.
- the area of the target waveform drop region refers to the sum, average or maximum of the area of the waveform drop region corresponding to each high-frequency QRS waveform data whose corresponding first amplitude drop relative value is greater than or equal to the first preset threshold.
- the method for analyzing high-frequency QRS waveform data by analyzing the high-frequency QRS waveform data corresponding to exercise ECG data, two characteristic points in the first time period are selected as the first reference point and the second reference point respectively, two characteristic points in the second time period are selected as the third reference point and the fourth reference point respectively, and the corresponding maximum voltage is determined.
- the first amplitude drop relative value is obtained by quantifying the waveform change of the high-frequency QRS waveform data in the first time period based on the first reference point and the second reference point, and the voltage difference representing the amplitude drop degree is obtained based on the third reference point and the fourth reference point.
- the waveform change representing the high-frequency QRS waveform data meets the requirements, and the vascular response capability with high accuracy can be obtained according to the ratio of the voltage difference to the maximum voltage. Therefore, the coronary artery vascular response capability of the subject can be accurately evaluated in a non-invasive way, and further, the vascular response capability with high accuracy can be provided to doctors for reference, so that doctors can accurately identify the heart health status of the subject in combination with clinical symptoms.
- S116 includes: screening the high-frequency QRS waveform data of corresponding waveform categories as a first category, a second category and a third category.
- the waveform characteristics of the first category include: a first amplitude drop relative value is greater than or equal to a first preset threshold, and a first amplitude rise relative value is greater than or equal to a second preset threshold.
- the waveform characteristics of the second category include: the first amplitude drop relative value is greater than or equal to the first preset threshold, a second amplitude rise relative value is less than a third preset threshold, and a duration of a second reference waveform data is greater than or equal to a preset duration threshold.
- the waveform characteristics of the third category include: the first amplitude drop relative value is greater than or equal to the first preset threshold, the second amplitude rise relative value is greater than or equal to the third preset threshold, and the duration of the second reference waveform data is greater than or equal to the preset duration threshold.
- the steps of determining the first amplitude rise relative value include: selecting a fifth reference point that meets a screening condition from the first reference waveform data; a time of the fifth reference point is later than that of the first reference point; and determining the first amplitude rise relative value based on the root-mean-square voltage of the first reference point and a root-mean-square voltage of the fifth reference point.
- the steps of determining the second amplitude rise relative value include: selecting, from the high-frequency QRS waveform data in the second time period, second reference waveform data whose amplitude fluctuation amplitude is less than or equal to a preset fluctuation amplitude; selecting a point with a maximum root-mean-square voltage as a sixth reference point from the high-frequency QRS waveform data in a third time period; and determining the second amplitude rise relative value based on a root-mean-square voltage of an end point of the second reference waveform data and the root-mean-square voltage of the sixth reference point.
- the first category includes V-type
- the second category includes L-type
- the third category includes U-type.
- the screening condition is a constraint condition for screening the fifth reference point from the first reference waveform data, which can be the end point of the first reference waveform data or the first inflection point in the first reference waveform data whose time is later/greater than the first reference point.
- the inflection point also known as the point of inflection, refers to the point that changes the upward or downward direction of the curve, that is, the boundary point between the concave arc and the convex arc on the curve corresponding to the first reference waveform data.
- the third time period may specifically include a period of time after the exercise in the recovery stage.
- the third time period may be adjacent to the second time period, for example, the end time point of the second time period is the start time point of the third time period.
- the corresponding time range of the recovery stage in the high-frequency QRS waveform curve is 9 to 12 min, and the third time period is the time interval represented by [9 min, 20 s, 12 min].
- the amplitude fluctuation amplitude is used to characterize the fluctuation degree or change degree of the amplitude, and can be specifically used to characterize the fluctuation degree between the amplitudes (that is, the root-mean-square voltages) of respective points in the second reference waveform data.
- the amplitude fluctuation amplitude of the second reference waveform data can be specifically determined based on the maximum and minimum values of the root-mean-square voltages in the second reference waveform data, for example, the corresponding amplitude fluctuation amplitude can be obtained by the difference between the maximum and minimum values of the root-mean-square voltage.
- the preset fluctuation amplitude can be customized according to requirements, such as 1 ⁇ V, and can also be dynamically determined according to the root-mean-square voltage of the second reference point or the third reference point.
- the preset fluctuation amplitude is positively correlated with the root-mean-square voltage of the second reference point (or the third reference point).
- the preset fluctuation amplitude can be dynamically determined according to the root-mean-square voltage of the second reference point (or the third reference point) and a preset proportional value, for example, 10% of the root-mean-square voltage of the second or third reference point is determined as the preset fluctuation amplitude, and the preset proportional value of 10% is for example only and is not used for specific limitation.
- the duration of the second reference waveform data refers to the difference between the time corresponding to the ending point and the starting point of the second reference waveform data.
- the second preset threshold, the third preset threshold and the preset duration threshold can be customized according to empirical values, for example, the second preset threshold is set to 30%, the third preset threshold is set to 56%, and the preset duration threshold is set to 3 min, which can also be dynamically determined according to the user portrait of the subject, and is not specifically limited here.
- the waveform category of each of high-frequency QRS waveform data corresponding to exercise ECG data is the first category, the second category or the third category is analyzed, and high-frequency QRS waveform data with corresponding waveform categories of the first category, the second category and the third category are screened, so as to screen the high-frequency QRS waveform data with waveform category of the first category, the high-frequency QRS waveform data with waveform category of the second category and the high-frequency QRS waveform data with waveform category of the third category from the high-frequency QRS waveform data corresponding to the exercise ECG data.
- the screened high-frequency QRS waveform data includes high-frequency QRS waveform data of the first category, high-frequency QRS waveform data of the second category and high-frequency QRS waveform data of the third category, so as to determine the vascular response capability according to the ratio of the voltage difference corresponding to the screened high-frequency QRS waveform data to the maximum voltage.
- the step of analyzing whether the waveform category of high-frequency QRS waveform data is the first category includes: selecting the end point of the first reference waveform data as the fifth reference point, or selecting the first inflection point after the first reference point from the first reference waveform data as the fifth reference point; performing the difference between the root-mean-square voltage of the fifth reference point and the root-mean-square voltage of the first reference point to obtain a first amplitude rise absolute value, and determining the ratio of the first amplitude rise absolute value to the root-mean-square voltage of the first reference point as a first amplitude rise relative value.
- the waveform category of the corresponding high-frequency QRS waveform data is determined to be the first category.
- the step of analyzing whether the waveform category of the high-frequency QRS waveform data is the second category includes: traversing the root-mean-square voltage of each point in the high-frequency QRS waveform data in the second time period, and based on the traversed root-mean-square voltage, selecting data whose amplitude fluctuation amplitude is less than or equal to a preset fluctuation amplitude from the high-frequency QRS waveform data in the second time period as the second reference waveform data; selecting data in the third time period from high-frequency QRS waveform data, traversing the root-mean-square voltage of each point in the selected data, and selecting the point with the maximum root-mean-square voltage from the selected data as a sixth reference point based on the traversed root-mean-square voltage; making a difference between the root-mean-square voltage of the sixth reference point and the root-mean-square voltage of the end point of the second reference waveform data to obtain a second amplitude rise absolute value, and determining the ratio of the second
- the waveform category of the corresponding high-frequency QRS waveform data is determined to be the second category.
- the duration of the second reference waveform data is determined based on the respective times of the starting point and the ending point of the second reference waveform data.
- the step of analyzing whether the waveform category of the high-frequency QRS waveform data is the third category including: traversing the root-mean-square voltage of each point in the high-frequency QRS waveform data in the second time period, and based on the traversed root-mean-square voltage, selecting data whose amplitude fluctuation amplitude is less than or equal to the preset fluctuation amplitude from the high-frequency QRS waveform data in the second time period as second reference waveform data; selecting data in the third time period from high-frequency QRS waveform data, traversing the root-mean-square voltage of each point in the selected data, and selecting the point with the maximum root-mean-square voltage from the selected data as a sixth reference point based on the traversed root-mean-square voltage; making a difference between the root-mean-square voltage of the sixth reference point and the root-mean-square voltage of the end point of the second reference waveform data to obtain the second amplitude rise absolute value, and determining the ratio of the second amplitude rise
- the waveform category of the corresponding high-frequency QRS waveform data is determined to be the third category.
- the high-frequency QRS waveform data corresponding to each of the 12 ECG leads there are 12 high-frequency QRS waveform data with the first category, 1 high-frequency QRS waveform data with the second category and 1 high-frequency QRS waveform data with the third category, the corresponding high-frequency QRS waveform data with the first, second and third categories are selected from the 12 high-frequency QRS waveform data, and the vascular response capability is determined based on the selected 4 high-frequency QRS waveform data.
- the high-frequency QRS waveform data in the second time period is taken as the target waveform data
- the second reference waveform data whose amplitude fluctuation amplitude is less than or equal to the preset fluctuation amplitude can be selected from the target waveform data with reference to the related art, which is not repeated here.
- data whose corresponding amplitude fluctuation amplitude meets the requirements are selected from the target waveform data as candidate data.
- the range of the candidate data is expanded based on the points in the target waveform data that are adjacent before and/or after the candidate data. If the amplitude fluctuation amplitude corresponding to the expanded candidate data still meets the requirements, the candidate data continues to be expanded according to the method until the amplitude fluctuation amplitude corresponding to the expanded candidate data does not meet the requirements, the range expansion of the candidate data is stopped, and the candidate data obtained from the previous range expansion is determined as the second reference waveform data.
- the curve determined based on the second reference waveform data is a continuous subsection in the corresponding high-frequency QRS waveform curve.
- whether the waveform category of each of high-frequency QRS waveform data is the first category, the second category or the third category is analyzed in a parallel or serial manner.
- the analysis can be carried out in sequentially according to the waveform analysis function corresponding to each preset category in the preset order.
- the analysis will be continued based on the waveform analysis function corresponding to the next preset category in the preset order until the stop condition is met, the current analysis process will stopped, and the stop condition includes traversing all preset categories in the preset order, or the waveform category of high-frequency QRS waveform data is the corresponding preset category is judged based on the current waveform analysis function.
- the preset order is not specifically limited here. In this embodiment, the preset categories include the first category, the second category and the third category. If the preset categories include more or less categories, similar logic can be used for processing.
- the waveform category of the high-frequency QRS waveform data is any preset category (that is, the waveform category of the high-frequency QRS waveform data is any one of the first category, the second category and the third category), it is determined that the waveform category of the high-frequency QRS waveform data is the preset category.
- the waveform analysis function corresponding to the preset category may include the related steps of analyzing whether the high-frequency QRS waveform data is the corresponding preset category provided in one or more embodiments of the invention, which are not repeated here.
- the waveform category is high-frequency QRS waveform data of the first category, the second category or the third category, which can better reflect the coronary artery vascular response capability. Therefore, the high-frequency QRS waveform data with corresponding waveform categories of the first category, the second category and the third category are screened, so as to obtain more accurate vascular response capability based on the screened high-frequency QRS waveform data.
- high-frequency QRS waveform data with waveform categories of the first and second categories are screened, or high-frequency QRS waveform data with waveform categories of the first and third categories are screened, or high-frequency QRS waveform data with waveform categories of the second and third categories are screened, and the vascular response capability is determined according to the screened high-frequency QRS waveform data.
- the preset category includes the first category and the second category, or the first category and the third category, or the second category and the third category, so as to determine the vascular response capability for the high-frequency QRS waveform data of the preset category based on the waveform category.
- S116 includes: screening high-frequency QRS waveform data whose corresponding waveform category as the first category; or, screening the high-frequency QRS waveform data with the corresponding waveform category as the second category; or, screening the high-frequency QRS waveform data with the corresponding waveform category as the third category.
- the waveform characteristics of the first category include: the first amplitude drop relative value is greater than or equal to the first preset threshold, and a first amplitude rise relative value is greater than or equal to a second preset threshold.
- the waveform characteristics of the second category include: the first amplitude drop relative value is greater than or equal to the first preset threshold, the second amplitude rise relative value is less than a third preset threshold, and a duration of the second reference waveform data is greater than or equal to a preset duration threshold.
- the waveform characteristics of the third category include: the first amplitude drop relative value is greater than or equal to the first preset threshold, the second amplitude rise relative value is greater than or equal to the third preset threshold, and the duration of the second reference waveform data is greater than or equal to the preset duration threshold.
- the steps of determining the first amplitude rise relative value include: selecting a fifth reference point that meets a screening condition from the first reference waveform data; a time of the fifth reference point is later than that of the first reference point; and determining the first amplitude rise relative value based on the root-mean-square voltage of the first reference point and a root-mean-square voltage of the fifth reference point.
- the steps of determining the second amplitude rise relative value include: selecting, from the high-frequency QRS waveform data in the second time period, second reference waveform data whose amplitude fluctuation amplitude is less than or equal to a preset fluctuation amplitude; selecting a point with a maximum root-mean-square voltage as a sixth reference point from the high-frequency QRS waveform data in a third time period; and determining the second amplitude rise relative value based on a root-mean-square voltage of an end point of the second reference waveform data and the root-mean-square voltage of the sixth reference point.
- the vascular response capability is further determined according to each high-frequency QRS waveform data with the corresponding waveform category being V-type. It can be understood that the waveform category of the high-frequency QRS waveform data shown in FIG. 2 is V-type.
- the waveform change of high-frequency QRS waveform data is quantified by the waveform analysis function corresponding to V-type, so as to analyze whether the waveform category of high-frequency QRS waveform data is V-type, so as to accurately determine the vascular response capability based on each high-frequency QRS waveform curve with V-type waveform category.
- the waveform category of the corresponding high-frequency QRS waveform data is determined to be L-shaped, so as to further determine the vascular response capability based on each high-frequency QRS waveform data with L-type waveform category.
- the waveform change of high-frequency QRS waveform data is quantized by the waveform analysis function corresponding to L-type to analyze whether the waveform category of high-frequency QRS waveform data is L-shape, so as to accurately determine the vascular response capability based on each high-frequency QRS waveform data with L-shape waveform category.
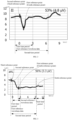
- FIG. 3 provides a schematic diagram of selecting each reference point and reference waveform data based on high-frequency QRS waveform data.
- the high-frequency QRS waveform diagram shows the high-frequency QRS waveform data corresponding to ECG lead aVL, and the corresponding time range of the exercise stage in the high-frequency QRS waveform data is 0 to 9 min.
- the first time period includes the first 3 min during exercise (exercise stage), the high-frequency QRS waveform data in the first time period is the first reference waveform data, the point with the minimum root-mean-square voltage in the first reference waveform data is the first reference point, and the point in the first reference waveform data with time earlier than the first reference point and with maximum root-mean-square voltage is the second reference point.
- the second time period includes 100 s before exercise (at resting stage), 9 min of exercise and 20 s after exercise (at recovery stage).
- the data with amplitude fluctuation amplitude less than or equal to the preset fluctuation amplitude (such as 0.5 ⁇ V) within the second time period is the second reference waveform data.
- the point with the maximum root-mean-square voltage in the second time period is the third reference point, and the point with the minimum root-mean-square voltage and time later the third reference point in the second time period is the fourth reference point.
- the third time period includes the time interval from the 20 th second after the end of the exercise to the end of the exercise stress ECG testing process, such as the time interval characterized by [9 min 20 s, 12 min], and the point with the maximum root-mean-square voltage in the high-frequency QRS waveform data in the third time period is the sixth reference point.
- the second amplitude drop absolute value and the second amplitude drop relative value are 3.3 ⁇ V and 56%, respectively.
- the maximum voltage and voltage difference corresponding to the high-frequency QRS waveform data shown in FIG. 3 are 10 ⁇ V and 3.3 ⁇ V, respectively, and their waveform types are L-type. It can be understood that in the high-frequency QRS waveform curve shown, the first reference point and the fourth reference point are the same point.
- the high-frequency QRS waveform data shown in FIG. 3 , the corresponding selected reference points and reference waveform data, and the selection of the first reference point and the second reference point are only examples, and are not used for specific limitation.
- the waveform category of the corresponding high-frequency QRS waveform data is determined to be U-type, and the vascular response capability is further determined based on each high-frequency QRS waveform curve with the waveform category of U-type.
- the waveform change of high-frequency QRS waveform data is quantized by the waveform analysis function corresponding to the U-type to analyze whether the waveform category of high-frequency QRS waveform data is U-type, so as to accurately determine the vascular response capability based on each high-frequency QRS waveform data with the U-type waveform category.
- FIG. 4 provides a schematic diagram of selecting each reference point and reference waveform data based on high-frequency QRS waveform data.
- the high-frequency QRS waveform diagram shows the high-frequency QRS waveform data corresponding to ECG lead V5, and the corresponding time range of the exercise stage in the high-frequency QRS waveform data is 0 to 9 min.
- the first time period includes 100 s before exercise (at resting stage) and the first 3 min during exercise (at exercise stage), and the high-frequency QRS waveform data in the first time period is the first reference waveform data.
- the point with the minimum root-mean-square voltage in the first reference waveform data is the first reference point
- the point with time earlier than the first reference point and with the maximum root-mean-square voltage in the first reference waveform data is the second reference point.
- the second time period includes 100 s before exercise (at resting stage), 9 min of exercise and 20 s after exercise (at recovery stage).
- the data in the second time period with the amplitude fluctuation amplitude less than or equal to the preset fluctuation amplitude (such as 0.5 ⁇ V) is the second reference waveform data
- the point with the maximum root-mean-square voltage in the second time period is the third reference point
- the point with the minimum root-mean-square voltage after the third reference point is the fourth reference point.
- the third time period includes the time interval from the 20 th second after the end of the exercise to the end of the exercise stress ECG testing process, specifically, the time interval represented by [9 min 20 s, 12 min], the point with the maximum root-mean-square voltage in the high-frequency QRS waveform data in the third time period is the sixth reference point.
- the second amplitude drop absolute value and the second amplitude drop relative value are 3.2 ⁇ V and 63%, respectively.
- the maximum voltage and voltage difference corresponding to the high-frequency QRS waveform data shown in FIG. 4 are 10 ⁇ V and 3.2 ⁇ V, respectively, and its waveform category is U-type.
- the second reference point and the third reference point are the same point.
- the high-frequency QRS waveform data shown in FIG. 4 , the corresponding selected reference points and reference waveform data, and the selection of the first reference point and the second reference point are only examples, and are not used for specific limitation.
- the waveform characteristics of the first category, the second category and the third category respectively further include that the time interval between the first reference point and the second reference point is less than or equal to the preset time interval.
- the waveform characteristics of the first category include: the first amplitude drop relative value is greater than or equal to the first preset threshold, the first amplitude rise relative value is greater than or equal to the second preset threshold, and the time interval between the first reference point and the second reference point is less than or equal to the preset time interval, which are not listed here.
- S118 includes: determining a reference index according to the screened high-frequency QRS waveform data; and determining the vascular response capability according to the reference index.
- the reference index includes the ratio of the voltage difference to the maximum voltage, and further includes at least one of a target amplitude drop relative value and an area of a target waveform drop region.
- the ratio of the voltage difference to the maximum voltage in the reference index refers to the maximum value of the ratio of the voltage difference to the maximum voltage corresponding to the selected high-frequency QRS waveform data, which can be understood as the target ratio of the voltage difference to the maximum voltage.
- the target amplitude drop relative value refers to the maximum value of the second amplitude drop relative value corresponding to the selected high-frequency QRS waveform data
- the area of the target waveform drop region refers to the sum, average or maximum value of the area of the waveform drop region corresponding to the selected high-frequency QRS waveform data.
- the ratio of voltage difference to maximum voltage is determined according to the screened high-frequency QRS waveform data, and at least one of reference indexes such as target amplitude drop relative value and target waveform drop region is also determined.
- the vascular response capability is determined by combining at least one of target amplitude drop relative value and target waveform drop region.
- the ratio of voltage difference to maximum voltage in the reference index refers to the maximum value of the ratio of voltage difference to maximum voltage corresponding to each high-frequency QRS waveform data with the corresponding waveform category as the preset category.
- the target amplitude drop relative value refers to the maximum of the second amplitude drop relative values corresponding to each high-frequency QRS waveform data with the preset category
- the area of the target waveform drop region refers to the sum, average or maximum of the area of the waveform drop region corresponding to each high-frequency QRS waveform data with the preset category.
- the preset category includes at least one of the first category (such as V-type), the second category (such as L-type) and the third category (such as U-type).
- the ratio of the voltage difference to the maximum voltage in the reference index refers to the maximum value of the ratio of the voltage difference to the maximum voltage corresponding to each high-frequency QRS waveform data with the corresponding waveform category of L-type.
- the preset categories including V-type, U-type and L-type as examples, whether the waveform category of each high-frequency QRS waveform data is V-type, U-type, or L-type is analyzed, and the high-frequency QRS waveform data with V-type, U-type, and L-type is screened.
- the reference index is determined according to the 4 high-frequency QRS waveform data screened.
- the method provided in one or more embodiments of the invention to determine each reference index according to the 4 high-frequency QRS waveform data screened, which is not repeated here.
- determining the target amplitude drop relative value according to the screened high-frequency QRS waveform data includes: determining a second amplitude drop relative value according to the root-mean-square voltages of the corresponding third reference point and fourth reference point for each screened high-frequency QRS waveform data; and determining the maximum of the second amplitude drop relative value corresponding to the screened high-frequency QRS waveform data as the target amplitude drop relative value.
- the root-mean-square voltage of the third reference point is differentiated from the root-mean-square voltage of the corresponding fourth reference point to obtain the second amplitude drop absolute value, and the ratio of the second amplitude drop absolute value to the root-mean-square voltage of the third reference point is taken as the second amplitude drop relative value.
- the waveform category of high-frequency QRS waveform data is V-type
- the first reference point is selected as the fourth reference point
- the corresponding determined first amplitude drop relative value is determined as the second amplitude drop relative value.
- the waveform category of high-frequency QRS waveform data is U-type or L-type
- the point with the minimum root-mean-square voltage is selected from the second reference waveform data as the fourth reference point.
- the target amplitude drop relative value can reflect the coronary artery vascular response capability, and the two are negatively correlated.
- the vascular response capability can be determined based on the target amplitude drop relative value. For example, the greater the target amplitude drop relative value, the smaller or lower the corresponding vascular response capability is, which indicates that the coronary artery vascular response capability is weaker. Therefore, according to the ratio of the voltage difference to the maximum voltage and the target amplitude drop relative value, more accurate vascular response capability can be obtained, and the vascular response capability can be determined according to the respective threshold intervals.
- the ratio of the voltage difference to the maximum voltage and the target amplitude drop relative value are compared with their respective threshold intervals, so as to determine the reference priority of the threshold interval as the reference priority of the corresponding reference index, and the reference index or dimension with higher reference priority is screened to determine the vascular response capability.
- the vascular response capability is determined, and the vascular response capability with higher priority is screened as the final vascular response capability. It can be understood that if the ratio of the voltage difference to the maximum voltage and the target amplitude drop relative value have the same reference priority, one of them can be screened to determine the vascular response capability.
- the target amplitude drop relative value For example, for the target amplitude drop relative value, four amplitude threshold intervals from the first amplitude threshold interval to the fourth amplitude threshold interval whose reference priorities decrease in sequence are preconfigured, namely, greater than or equal to 66%, greater than or equal to 60% and less than 66%, greater than or equal to 50% and less than 60%, and greater than or equal to 40% and less than 50%, and the corresponding reference priorities are recorded as the first to fourth levels respectively. For example, if the target amplitude drop relative value is in the first amplitude threshold interval, the reference priority of the target amplitude drop relative value is determined as the first level with the highest reference priority.
- the reference priority of the ratio of the voltage difference to the maximum voltage is determined as the second level with the second highest reference priority.
- the vascular response capability is determined according to the amplitude threshold interval where the target amplitude drop relative value is located.
- the vascular response capability is determined as the first level with the highest attention priority.
- the vascular response capability is determined as the first level with the highest attention priority, and if the ratio of the voltage difference to the maximum voltage is within the second ratio threshold interval, the vascular response capability is determined as the second level with the second highest attention priority, and the second level with the higher attention priority is screened as the final vascular response capability through comparison.
- the ratio of the voltage difference to the maximum voltage it can be known that if the target amplitude drop relative value is within the second amplitude threshold interval, the vascular response capability is determined as the second level with the second highest priority, and so on, which will not be enumerated here.
- determining the target waveform drop region according to the screened high-frequency QRS waveform data includes: selecting a seventh reference point and an eighth reference point from the screened high-frequency QRS waveform data; and determining the area of the waveform drop region according to the seventh reference point, the eighth reference point, and the high-frequency QRS waveform data; and determining the sum, average or maximum value of the waveform drop region corresponding to the screened high-frequency QRS waveform data as the target waveform drop region.
- the point corresponding to the starting point of the exercise stage in the high-frequency QRS waveform data is taken as the seventh reference point, or the second reference point (or the third reference point) is taken as the seventh reference point, and the point corresponding to the ending point of the exercise stage in the high-frequency QRS waveform data is taken as the eighth reference point.
- the root-mean-square voltage of the seventh reference point is determined as the reference amplitude
- the closed region determined by the reference amplitude, the eighth reference point and the high-frequency QRS waveform data and below the reference amplitude is determined as the waveform drop region
- the absolute drop area is obtained by calculating the area of the closed region through the first function, which is taken as the area of the waveform drop region of the corresponding high-frequency QRS waveform data.
- the closed region determined by the seventh reference point, the eighth reference point, the high-frequency QRS waveform data and the reference axis with zero root-mean-square voltage (the horizontal axis of the high-frequency QRS waveform diagram) is taken as the reference region
- the area of the reference region is calculated by the second function to obtain the reference area
- the ratio of the absolute drop area to the reference area is determined as the relative drop area
- the relative drop area is taken as the area of the waveform drop region of the corresponding high-frequency QRS waveform data.
- the absolute drop area and the relative drop area calculated in the above manner are used as the area of the waveform drop region of the corresponding high-frequency QRS waveform data.
- the time of the seventh reference point is earlier than the time of the eighth reference point.
- the area of the target waveform drop region can be used to reflect the coronary artery vascular response capability, and the two are negatively correlated.
- the corresponding vascular response capability can be determined based on the area of the target waveform drop region. For example, the larger the area of the target waveform drop region, the lower or smaller the corresponding vascular response capability (the higher the attention priority), so as to represent the weaker the coronary artery vascular response capability. Therefore, according to the ratio of the voltage difference to the maximum voltage and the area of the target waveform drop region, more accurate vascular response capability can be obtained, and the vascular response capability can be specifically determined according to their respective threshold intervals.
- the vascular response capability is marked as the first level. If the ratio of the voltage difference to the maximum voltage is in the second ratio threshold interval, and the area of the target waveform drop region is in the first area threshold interval, the vascular response capability is marked as the second level, which is not listed here. It can be understood that the higher the reference priority of the area threshold interval, the larger the value in the area threshold interval.
- the area threshold interval preconfigured for the waveform drop region includes absolute area threshold interval preconfigured for the absolute drop area and/or relative area threshold interval preconfigured for the relative drop area. Therefore, if the area of the target waveform drop region is in the first area threshold interval, the included target absolute drop area and/or target relative drop area are respectively in the corresponding area threshold interval in the first area threshold interval, which will not be described in detail herein.
- vascular response capability can be obtained according to various combinations of each reference index, which will not be described in detail herein.
- the vascular response capability is marked as the first level with the highest attention priority.
- the method for analyzing the high-frequency QRS waveform data further includes: determining a positive number according to the high-frequency QRS waveform data corresponding to the exercise ECG data.
- S118 includes: determining the vascular response capability according to the ratio of the voltage difference corresponding to the screened high-frequency QRS waveform data to the maximum voltage and the positive number; or, determining a reference index according to the screened high-frequency QRS waveform data, and determining the vascular response capability according to the reference index and the positive number.
- the reference index includes the ratio of the voltage difference to the maximum voltage, and further includes at least one of the target amplitude drop relative value and the area of the target waveform drop region.
- the corresponding lead positive index is determined according to each of high-frequency QRS waveform data corresponding to the exercise ECG data, the high-frequency QRS waveform data with the lead positive indexes being positive are screened and counted from the high-frequency QRS waveform data corresponding to the exercise ECG data to obtain the positive number corresponding to the exercise ECG data, the ratio of the voltage difference to the maximum voltage is determined according to the screened high-frequency QRS waveform data, and the vascular response capability is determined according to the determined ratio of the voltage difference to the maximum voltage and the positive number.
- the reference index is determined according to the screened high-frequency QRS waveform data, and the vascular response capability is determined according to the reference index and the positive number.
- the second amplitude drop absolute value and the second amplitude drop relative value are determined according to the root-mean-square voltages of the third reference point and the fourth reference point, and the lead positive index of the corresponding high-frequency QRS waveform data is determined according to the second amplitude drop absolute value and the second amplitude drop relative value. If the second amplitude drop absolute value and the second amplitude drop relative value of the high-frequency QRS waveform data meet the preset lead positive condition, the lead positive index indicates that the corresponding ECG lead is positive.
- the preset lead positive condition can be customized according to the actual detection situation, and can be adaptively adjusted according to the age, gender, height, weight and other factors of the subject.
- the second amplitude drop absolute value is greater than 1 ⁇ V and the second amplitude drop relative value is greater than 50%, which is not specifically limited herein.
- the positive number can be used to reflect the coronary artery vascular response capability, and the two are negatively correlated. Based on the positive number, the corresponding vascular response capability can be determined. For example, the greater the positive number, the lower or smaller the corresponding vascular response capability (the higher the attention priority), so as to represent the weaker the coronary artery vascular response capability. Therefore, according to the ratio of the voltage difference to the maximum voltage and the positive number, more accurate vascular response capability can be obtained, specifically, the vascular response capability can be determined according to the respective threshold intervals.
- vascular response capability taking the determination of vascular response capability by combining the positive number and the ratio of the voltage difference to the maximum voltage as an example, four number threshold intervals with decreasing reference priority are preconfigured for the positive number, namely, greater than or equal to 7, greater than or equal to 5 and less than 7, greater than or equal to 3 and less than 5, and greater than or equal to 1 and less than 3. If the ratio of the voltage difference to the maximum voltage is in the first ratio threshold interval, and the positive number is in the first number threshold interval, the vascular response capability is marked as the first level. If the ratio of the voltage difference to the maximum voltage is in the second ratio threshold interval, and the positive number is in the first number threshold interval, the vascular response capability is marked as the second level, which will not be enumerated herein.
- vascular response capability based on the method for determining the vascular response capability based on the reference index provided in one or more embodiments of the invention, it can be known that more accurate vascular response capability can be obtained by combining at least one of the target amplitude drop relative value and the area of target waveform drop region on the basis of the ratio of the voltage difference to the maximum voltage and the positive number.
- the specific combination method and the corresponding vascular response capability determination method can refer to the records of the corresponding embodiments, which will not be described in detail herein.
- the vascular response capability is marked as the first level with the highest attention priority.
- a method for analyzing high-frequency QRS waveform data is provided, which specifically includes the following steps.
- S506 determining a first reference point according to a point with a minimum root-mean-square voltage in the first reference waveform data, and determining a second reference point according to a point with a maximum root-mean-square voltage and time earlier than the first reference point in the first reference waveform data.
- S508 determining a first amplitude drop relative value according to respective root-mean-square voltages of the first reference point and the second reference point.
- S512 selecting a point with a maximum root-mean-square voltage as a third reference point and a point with a minimum root-mean-square voltage and time later than the third reference point as a fourth reference point from the high-frequency QRS waveform data in a second time period.
- S514 determining a voltage difference according to respective root-mean-square voltages of the third reference point and the fourth reference point.
- S516 selecting a fifth reference point that meets a screening condition from the first reference waveform data; a time of the fifth reference point being later than that of the first reference point.
- S518 determining the first amplitude rise relative value based on the root-mean-square voltage of the first reference point and a root-mean-square voltage of the fifth reference point.
- S522 selecting, from the high-frequency QRS waveform data in the second time period, second reference waveform data whose amplitude fluctuation amplitude is less than or equal to a preset fluctuation amplitude.
- S524 selecting a point with a maximum root-mean-square voltage as a sixth reference point from the high-frequency QRS waveform data in a third time period.
- S526 determining the second amplitude rise relative value based on a root-mean-square voltage of an end point of the second reference waveform data and the root-mean-square voltage of the sixth reference point.
- S528 screening the high-frequency QRS waveform data with the first amplitude drop relative value greater than or equal to the first preset threshold, a second amplitude rise relative value less than a third preset threshold, and a duration of second reference waveform data greater than or equal to a preset duration threshold.
- S530 screening the high-frequency QRS waveform data with the first amplitude drop relative value greater than or equal to the first preset threshold, the second amplitude rise relative value greater than or equal to the third preset threshold, and the duration of the second reference waveform data greater than or equal to the preset duration threshold.
- S534 determining a positive number according to the high-frequency QRS waveform data corresponding to the exercise ECG data.
- S536 determining the vascular response capability according to the ratio of the voltage difference corresponding to the screened high-frequency QRS waveform data to the maximum voltage and the positive number.
- the waveform category of each of high-frequency QRS waveform data is the preset category (such as the first category, the second category or the third category) is analyzed, and the high-frequency QRS waveform data with the waveform categories of the first category, the second category and the third category are screened for determining the reference index including the ratio of the voltage difference to the maximum voltage, and at least one of the target amplitude drop relative value and the area of the target waveform drop region, so that the vascular response capability is determined according to the reference index.
- the positive number is determined according to the high-frequency QRS waveform data corresponding to the exercise ECG data
- the vascular response capability is determined according to the positive number and the ratio of the voltage difference to the maximum voltage (or, the reference index), so as to accurately evaluate the vascular response capability in a non-invasive way for the doctor's reference to facilitate the doctor to accurately identify the heart health status of the subject in combination with clinical symptoms.
- steps in the flowcharts of FIG. 1 and FIG. 5 are shown sequentially as indicated by arrows, these steps are not necessarily executed sequentially as indicated by the arrows. Unless explicitly stated herein, the execution of these steps is not strictly limited in order, and these steps can be executed in other orders. Moreover, at least a part of the steps in FIG. 1 and FIG. 5 may include multiple steps or stages, which may not necessarily be completed at the same time, but may be executed at different times, and the execution order of these steps or stages may not necessarily be sequentially executed, but may be alternately or alternatively executed with other steps or at least a part of steps or stages in other steps.
- an apparatus 600 for analyzing high-frequency QRS waveform data which includes an acquisition module 601, a selection module 602, an index determining module 603, and a screening module 604.
- the acquisition module 601 is configured to acquire the high-frequency QRS waveform data corresponding to exercise ECG data.
- the selection module 602 is configured to select the high-frequency QRS waveform data in a first time period as first reference waveform data.
- the selection module 602 is further configured to determine a first reference point according to a point with a minimum root-mean-square voltage in the first reference waveform data, and determining a second reference point according to a point with a maximum root-mean-square voltage and time earlier than the first reference point in the first reference waveform data.
- the index determining module 603 is configured to determine a first amplitude drop relative value according to respective root-mean-square voltages of the first reference point and the second reference point.
- the index determining module 603 is further configured to determine a maximum voltage according to the high-frequency QRS waveform data;
- the selection module 602 is configured to select a point with a maximum root-mean-square voltage as a third reference point and a point with a minimum root-mean-square voltage and time later than the third reference point as a fourth reference point from the high-frequency QRS waveform data in a second time period.
- the index determining module 603 is further configured to determine a voltage difference according to respective root-mean-square voltages of the third reference point and the fourth reference point.
- the screening module 604 is configured to screen high-frequency QRS waveform data with the first amplitude drop relative value greater than or equal to a first preset threshold.
- the index determining module 603 is used to determine vascular response capability according to a ratio of the voltage difference corresponding to the screened high-frequency QRS waveform data to the maximum voltage.
- the screening module 604 is further configured to screen the high-frequency QRS waveform data of corresponding waveform categories as a first category, a second category and a third category.
- Waveform characteristics of the first category include: a first amplitude drop relative value is greater than or equal to a first preset threshold, and a first amplitude rise relative value is greater than or equal to a second preset threshold.
- Waveform characteristics of the second category include: the first amplitude drop relative value is greater than or equal to the first preset threshold, a second amplitude rise relative value is less than a third preset threshold, and a duration of a second reference waveform data is greater than or equal to a preset duration threshold.
- Waveform characteristics of the third category include: the first amplitude drop relative value is greater than or equal to the first preset threshold, the second amplitude rise relative value is greater than or equal to the third preset threshold, and the duration of the second reference waveform data is greater than or equal to the preset duration threshold.
- the selection module 602 is further configured to select a fifth reference point that meets a screening condition from the first reference waveform data. A time of the fifth reference point is later than that of the first reference point.
- the index determining module 603 is further configured to determine the first amplitude rise relative value based on the root-mean-square voltage of the first reference point and a root-mean-square voltage of the fifth reference point.
- the selection module 602 is further configured to select, from the high-frequency QRS waveform data in the second time period, second reference waveform data whose amplitude fluctuation amplitude is less than or equal to a preset fluctuation amplitude; and select a point with a maximum root-mean-square voltage as a sixth reference point from the high-frequency QRS waveform data in a third time period.
- the index determining module 603 is further configured to determine the second amplitude rise relative value based on a root-mean-square voltage of an end point of the second reference waveform data and the root-mean-square voltage of the sixth reference point.
- the screening module 604 is further configured to screen the high-frequency QRS waveform data of a corresponding waveform category as a first category; or screen the high-frequency QRS waveform data of a corresponding waveform category as a second category; or screen the high-frequency QRS waveform data of a corresponding waveform category as a third category.
- the waveform characteristics of the first category include: a first amplitude drop relative value is greater than or equal to a first preset threshold, and a first amplitude rise relative value is greater than or equal to a second preset threshold.
- the waveform characteristics of the second category include: the first amplitude drop relative value is greater than or equal to the first preset threshold, the second amplitude rise relative value is less than a third preset threshold, and a duration of the second reference waveform data is greater than or equal to a preset duration threshold.
- the waveform characteristics of the third category include: the first amplitude drop relative value is greater than or equal to the first preset threshold, the second amplitude rise relative value is greater than or equal to the third preset threshold, and the duration of the second reference waveform data is greater than or equal to the preset duration threshold.
- the selection module 602 is further configured to select a fifth reference point that meets a screening condition from the first reference waveform data; and a time of the fifth reference point is later than that of the first reference point.
- the index determining module 603 is further configured to determine the first amplitude rise relative value based on the root-mean-square voltage of the first reference point and a root-mean-square voltage of the fifth reference point.
- the selection module 602 is further configured to select, from the high-frequency QRS waveform data in the second time period, second reference waveform data whose amplitude fluctuation amplitude is less than or equal to a preset fluctuation amplitude; and select a point with a maximum root-mean-square voltage as a sixth reference point from the high-frequency QRS waveform data in a third time period.
- the index determining module 603 is further configured to determine the second amplitude rise relative value based on a root-mean-square voltage of an end point of the second reference waveform data and the root-mean-square voltage of the sixth reference point.
- the index determining module 603 is further configured to determine a reference index according to the screened high-frequency QRS waveform data; where reference index includes the ratio of the voltage difference to the maximum voltage, and further includes at least one of the target amplitude drop relative value and the area of the target waveform drop region; and determine the vascular response capability according to the reference index.
- the index determining module 603 is further configured to determine a positive number according to the high-frequency QRS waveform data corresponding to the exercise ECG data; determine the vascular response capability according to the ratio of the voltage difference corresponding to the screened high-frequency QRS waveform data to the maximum voltage and the positive number; or, determine a reference index according to the screened high-frequency QRS waveform data, and determine the vascular response capability according to the reference index and the positive number.
- the reference index includes the ratio of the voltage difference to the maximum voltage, and further includes at least one of the target amplitude drop relative value and the area of the target waveform drop region.
- each module in the above-mentioned apparatus for analyzing the high-frequency QRS waveform data can be wholly or partially implemented by software, hardware, or a combination thereof.
- the above modules can be embedded in or independent of the processor in the computer device in the form of hardware, and can also be stored in the memory in the computer device in the form of software, so that the processor can call and execute the corresponding operations of the above modules.
- a computer device which may be a server, and its internal structure diagram may be as shown in FIG. 7 .
- the computer device includes a processor, a memory and a network interface connected through a system bus.
- the processor of the computer device is used to provide computing and control capabilities.
- the memory of the computer device includes a non-transitory storage medium and an internal memory.
- the non-transitory storage medium stores an operating system, computer-readable instructions and a database.
- the internal memory provides an environment for the operation of the operating system and computer-readable instructions in the non-transitory storage medium.
- the database of the computer device is used to store the high-frequency QRS waveform data corresponding to the exercise ECG data.
- the network interface of the computer device is used to communicate with external terminals through network connection.
- the computer-readable instructions when executed by the processor, implement the method for analyzing the high-frequency QRS waveform data.
- FIG. 7 is only a block diagram of a part of the structure related to the scheme of the invention, and does not constitute a limitation on the computer device to which the scheme of the invention is applied.
- the specific computer device may include more or less components than those shown in the figure, or combine some components, or have different component arrangements.
- a computer device which includes a memory and a processor.
- the memory is stored with computer-readable instructions
- the processor is configured to implement, when the computer-readable instructions executed by the processor, steps in various method embodiments.
- a computer-readable storage medium is stored with computer-readable storage instructions, and the computer-readable storage instructions is configured to be executed by a processor to implement the steps in various method embodiments.
- any reference to memory, storage, database or other media used in the embodiments provided in the invention may include at least one of non-transitory and transitory memory.
- the non-transitory memory may include a read-only memory (ROM), a magnetic tape, a floppy disk, a flash memory, or an optical memory, etc.
- the transitory memory may include a random-access memory (RAM) or an external cache.
- RAM can be in various forms, such as a static random-access memory (SRAM) or a dynamic random-access memory (DRAM).
Landscapes
- Health & Medical Sciences (AREA)
- Life Sciences & Earth Sciences (AREA)
- Cardiology (AREA)
- Engineering & Computer Science (AREA)
- Physics & Mathematics (AREA)
- Animal Behavior & Ethology (AREA)
- Public Health (AREA)
- Biomedical Technology (AREA)
- Heart & Thoracic Surgery (AREA)
- Medical Informatics (AREA)
- Molecular Biology (AREA)
- Surgery (AREA)
- Biophysics (AREA)
- General Health & Medical Sciences (AREA)
- Pathology (AREA)
- Veterinary Medicine (AREA)
- Artificial Intelligence (AREA)
- Evolutionary Computation (AREA)
- Fuzzy Systems (AREA)
- Mathematical Physics (AREA)
- Computer Vision & Pattern Recognition (AREA)
- Physiology (AREA)
- Psychiatry (AREA)
- Signal Processing (AREA)
- Measurement And Recording Of Electrical Phenomena And Electrical Characteristics Of The Living Body (AREA)
Applications Claiming Priority (2)
| Application Number | Priority Date | Filing Date | Title |
|---|---|---|---|
| CN202210705685.4A CN114788703B (zh) | 2022-06-21 | 2022-06-21 | 高频qrs波形数据分析方法、装置、计算机设备与存储介质 |
| PCT/CN2023/093453 WO2023246358A1 (zh) | 2022-06-21 | 2023-05-11 | 高频qrs波形数据分析方法、装置、计算机设备与存储介质 |
Publications (2)
| Publication Number | Publication Date |
|---|---|
| EP4545008A1 true EP4545008A1 (de) | 2025-04-30 |
| EP4545008A4 EP4545008A4 (de) | 2025-12-24 |
Family
ID=82463008
Family Applications (1)
| Application Number | Title | Priority Date | Filing Date |
|---|---|---|---|
| EP23826008.7A Pending EP4545008A4 (de) | 2022-06-21 | 2023-05-11 | Verfahren und vorrichtung zur analyse von hochfrequenz-qrs-wellenformdaten, computervorrichtung und speichermedium |
Country Status (5)
| Country | Link |
|---|---|
| US (1) | US12458271B2 (de) |
| EP (1) | EP4545008A4 (de) |
| JP (1) | JP7745987B2 (de) |
| CN (1) | CN114788703B (de) |
| WO (1) | WO2023246358A1 (de) |
Families Citing this family (5)
| Publication number | Priority date | Publication date | Assignee | Title |
|---|---|---|---|---|
| CN114742113B (zh) | 2022-06-09 | 2022-11-29 | 毕胜普生物科技有限公司 | 高频qrs波形曲线分析方法、装置、计算机设备与存储介质 |
| CN114788703B (zh) * | 2022-06-21 | 2022-10-21 | 毕胜普生物科技有限公司 | 高频qrs波形数据分析方法、装置、计算机设备与存储介质 |
| CN115602329B (zh) * | 2022-11-21 | 2023-04-21 | 毕胜普生物科技有限公司 | 心电信号处理方法、装置和相关设备 |
| CN118522460B (zh) * | 2024-07-19 | 2024-10-29 | 毕胜普生物科技有限公司 | 心电信号处理方法、装置、计算机设备与存储介质 |
| CN120354316B (zh) * | 2025-06-20 | 2025-09-26 | 合肥晶合集成电路股份有限公司 | 生产机台的工作参数异常检测方法、装置、计算机设备 |
Family Cites Families (9)
| Publication number | Priority date | Publication date | Assignee | Title |
|---|---|---|---|---|
| US4422459A (en) * | 1980-11-18 | 1983-12-27 | University Patents, Inc. | Electrocardiographic means and method for detecting potential ventricular tachycardia |
| US7113820B2 (en) * | 2001-07-12 | 2006-09-26 | The United States Of America As Represented By The Administration Of The National Aeronautics And Space Administration | Real-time, high frequency QRS electrocardiograph |
| AU2003233437A1 (en) * | 2002-03-26 | 2003-10-13 | National Aeronautics And Space Administration | System for the diagnosis and monitoring of coronary artery disease, acute coronary syndromes, cardiomyopathy and other cardiac conditions |
| CN101014283B (zh) * | 2004-05-01 | 2012-02-08 | Bsp生物信号处理有限公司 | 用于分析高频qrs波群的装置和方法 |
| CN101522099A (zh) * | 2006-08-03 | 2009-09-02 | Bsp生物信号处理有限公司 | 利用高频qrs电位分析识别心肌缺血的装置和方法 |
| US10342445B2 (en) * | 2016-11-03 | 2019-07-09 | Medtronic Monitoring, Inc. | Method and apparatus for detecting electrocardiographic abnormalities based on monitored high frequency QRS potentials |
| CN113712569B (zh) * | 2021-11-01 | 2022-02-08 | 毕胜普生物科技有限公司 | 高频qrs波群数据分析方法及装置 |
| CN114052746A (zh) * | 2022-01-05 | 2022-02-18 | 毕胜普生物科技有限公司 | 运动心电数据处理方法、装置、计算机设备和存储介质 |
| CN114788703B (zh) * | 2022-06-21 | 2022-10-21 | 毕胜普生物科技有限公司 | 高频qrs波形数据分析方法、装置、计算机设备与存储介质 |
-
2022
- 2022-06-21 CN CN202210705685.4A patent/CN114788703B/zh active Active
-
2023
- 2023-05-11 EP EP23826008.7A patent/EP4545008A4/de active Pending
- 2023-05-11 JP JP2024575264A patent/JP7745987B2/ja active Active
- 2023-05-11 WO PCT/CN2023/093453 patent/WO2023246358A1/zh not_active Ceased
-
2024
- 2024-12-20 US US18/989,236 patent/US12458271B2/en active Active
Also Published As
| Publication number | Publication date |
|---|---|
| JP2025520656A (ja) | 2025-07-03 |
| CN114788703B (zh) | 2022-10-21 |
| EP4545008A4 (de) | 2025-12-24 |
| US20250213168A1 (en) | 2025-07-03 |
| US12458271B2 (en) | 2025-11-04 |
| WO2023246358A1 (zh) | 2023-12-28 |
| JP7745987B2 (ja) | 2025-09-30 |
| CN114788703A (zh) | 2022-07-26 |
Similar Documents
| Publication | Publication Date | Title |
|---|---|---|
| EP4545008A1 (de) | Verfahren und vorrichtung zur analyse von hochfrequenz-qrs-wellenformdaten, computervorrichtung und speichermedium | |
| US20240324937A1 (en) | Method and apparatus for analyzing high-frequency qrs-complex data | |
| CN114742114B (zh) | 高频qrs波形曲线分析方法、装置、计算机设备与存储介质 | |
| CN114732419B (zh) | 运动心电数据分析方法、装置、计算机设备与存储介质 | |
| CN116649985B (zh) | 心电数据处理方法、装置、计算机设备与存储介质 | |
| CN116616790A (zh) | 心脏风险评估方法、装置、计算机设备与存储介质 | |
| CN116196013B (zh) | 心电数据处理方法、装置、计算机设备与存储介质 | |
| CN114732418A (zh) | 高频qrs波形曲线分析方法、装置、计算机设备与存储介质 | |
| CN119344747B (zh) | 心肌损伤风险评估方法、装置、计算机设备与存储介质 | |
| CN116725549B (zh) | 心电数据分析方法、装置、计算机设备与存储介质 | |
| CN116807493B (zh) | 心电数据处理方法、装置、计算机设备与存储介质 | |
| CN118522460B (zh) | 心电信号处理方法、装置、计算机设备与存储介质 | |
| US12510576B2 (en) | Analysis method and apparatus for high-frequency QRS waveform curve, computer device and storage medium | |
| CN119008017A (zh) | 心电信号处理方法、装置、计算机设备与存储介质 | |
| HK40118954A (en) | Method and apparatus for analyzing high-frequency qrs waveform data, computer device, and storage medium | |
| CN121421483B (zh) | 心脏性猝死风险预测方法、装置、系统及存储介质 | |
| HK40121114A (en) | Motion electrocardiogram data analysis method and apparatus, computer device and storage medium | |
| Astudillo-Salinas et al. | Characterizing artifacts in RR stress test time series | |
| Jatia et al. | Interpretation and Classification of Phonocardiogram Using Principal Component Analysis | |
| Kazemi et al. | An Adaptive Algorithm for Detection of Arterial Blood Pressure Pulses | |
| HK40113436A (en) | Method and apparatus for analyzing high-frequency qrs-complex data |
Legal Events
| Date | Code | Title | Description |
|---|---|---|---|
| STAA | Information on the status of an ep patent application or granted ep patent |
Free format text: STATUS: THE INTERNATIONAL PUBLICATION HAS BEEN MADE |
|
| PUAI | Public reference made under article 153(3) epc to a published international application that has entered the european phase |
Free format text: ORIGINAL CODE: 0009012 |
|
| STAA | Information on the status of an ep patent application or granted ep patent |
Free format text: STATUS: REQUEST FOR EXAMINATION WAS MADE |
|
| 17P | Request for examination filed |
Effective date: 20241230 |
|
| AK | Designated contracting states |
Kind code of ref document: A1 Designated state(s): AL AT BE BG CH CY CZ DE DK EE ES FI FR GB GR HR HU IE IS IT LI LT LU LV MC ME MK MT NL NO PL PT RO RS SE SI SK SM TR |
|
| REG | Reference to a national code |
Ref country code: HK Ref legal event code: DE Ref document number: 40118954 Country of ref document: HK |
|
| DAV | Request for validation of the european patent (deleted) | ||
| DAX | Request for extension of the european patent (deleted) | ||
| A4 | Supplementary search report drawn up and despatched |
Effective date: 20251124 |
|
| RIC1 | Information provided on ipc code assigned before grant |
Ipc: A61B 5/349 20210101AFI20251118BHEP Ipc: A61B 5/366 20210101ALI20251118BHEP Ipc: A61B 5/00 20060101ALI20251118BHEP |
|
| GRAP | Despatch of communication of intention to grant a patent |
Free format text: ORIGINAL CODE: EPIDOSNIGR1 |
|
| STAA | Information on the status of an ep patent application or granted ep patent |
Free format text: STATUS: GRANT OF PATENT IS INTENDED |