EP4530597A2 - Analysesystem - Google Patents
Analysesystem Download PDFInfo
- Publication number
- EP4530597A2 EP4530597A2 EP25154448.2A EP25154448A EP4530597A2 EP 4530597 A2 EP4530597 A2 EP 4530597A2 EP 25154448 A EP25154448 A EP 25154448A EP 4530597 A2 EP4530597 A2 EP 4530597A2
- Authority
- EP
- European Patent Office
- Prior art keywords
- signal
- value
- fractional
- digital
- frequency
- Prior art date
- Legal status (The legal status is an assumption and is not a legal conclusion. Google has not performed a legal analysis and makes no representation as to the accuracy of the status listed.)
- Pending
Links
Images


Classifications
-
- G—PHYSICS
- G01—MEASURING; TESTING
- G01H—MEASUREMENT OF MECHANICAL VIBRATIONS OR ULTRASONIC, SONIC OR INFRASONIC WAVES
- G01H1/00—Measuring characteristics of vibrations in solids by using direct conduction to the detector
- G01H1/003—Measuring characteristics of vibrations in solids by using direct conduction to the detector of rotating machines
-
- G—PHYSICS
- G01—MEASURING; TESTING
- G01M—TESTING STATIC OR DYNAMIC BALANCE OF MACHINES OR STRUCTURES; TESTING OF STRUCTURES OR APPARATUS, NOT OTHERWISE PROVIDED FOR
- G01M13/00—Testing of machine parts
- G01M13/02—Gearings; Transmission mechanisms
- G01M13/028—Acoustic or vibration analysis
-
- G—PHYSICS
- G01—MEASURING; TESTING
- G01M—TESTING STATIC OR DYNAMIC BALANCE OF MACHINES OR STRUCTURES; TESTING OF STRUCTURES OR APPARATUS, NOT OTHERWISE PROVIDED FOR
- G01M13/00—Testing of machine parts
- G01M13/04—Bearings
- G01M13/045—Acoustic or vibration analysis
-
- G—PHYSICS
- G01—MEASURING; TESTING
- G01M—TESTING STATIC OR DYNAMIC BALANCE OF MACHINES OR STRUCTURES; TESTING OF STRUCTURES OR APPARATUS, NOT OTHERWISE PROVIDED FOR
- G01M99/00—Subject matter not provided for in other groups of this subclass
- G01M99/005—Testing of complete machines, e.g. washing-machines or mobile phones
-
- G—PHYSICS
- G01—MEASURING; TESTING
- G01M—TESTING STATIC OR DYNAMIC BALANCE OF MACHINES OR STRUCTURES; TESTING OF STRUCTURES OR APPARATUS, NOT OTHERWISE PROVIDED FOR
- G01M99/00—Subject matter not provided for in other groups of this subclass
- G01M99/008—Subject matter not provided for in other groups of this subclass by doing functionality tests
Definitions
- the present invention relates to a method for analysing the condition of a machine, and to an apparatus for analysing the condition of a machine.
- the invention also relates to a system including such an apparatus and to a method of operating such an apparatus.
- the invention also relates to a computer program for causing a computer to perform an analysis function.
- Machines with moving parts are subject to wear with the passage of time, which often causes the condition of the machine to deteriorate.
- Examples of such machines with movable parts are motors, pumps, generators, compressors, lathes and CNC-machines.
- the movable parts may comprise a shaft and bearings.
- the operating condition of such a machine is preferably evaluated from time to time.
- the operating condition can be determined by measuring vibrations emanating from a bearing or by measuring temperature on the casing of the machine, which temperatures are dependent on the operating condition of the bearing.
- Such condition checks of machines with rotating or other moving parts are of great significance for safety and also for the length of the life of such machines. It is known to manually perform such measurements on machines. This ordinarily is done by an operator with the help of a measuring instrument performing measurements at measuring points on one or several machines.
- shock pulse measuring apparatus may generate information indicative of the condition of a bearing or a machine.
- WO 03062766 discloses a machine having a measuring point and a shaft with a certain shaft diameter, wherein the shaft can rotate when the machine is in use.
- WO 03062766 also discloses an apparatus for analysing the condition of a machine having a rotating shaft.
- the disclosed apparatus has a sensor for producing a measured value indicating vibration at a measuring point.
- the apparatus disclosed in WO 03062766 has a data processor and a memory.
- the memory may store program code which, when run on the data processor, will cause the analysis apparatus to perform a Machine Condition Monitoring function.
- Such a Machine Condition Monitoring function may include shock pulse measuring.
- US 6,053,047 discloses an accelerometer used as vibration sensor collecting analog vibration data which is delivered to an A/D-converter which provides digital vibration data to a processor 90.
- the processor performs digital bandpass filtering of digital vibration data, rectifying the filtered signal, and low pass filtering the rectified signal to produce a low frequency signal.
- the low frequency signal is passed through a capacitor to produce a demodulated signal.
- An FFT is performed on the demodulated signal 116 to produce a vibration spectrum.
- US 6,053,047 also teaches to calculate the resonant frequency of each physical path from the accelerometer to various vibration sources in the motor and US 6,053,047 teaches to perform this calibration step before the motor leaves the factory. Alternatively such calibration of each physical path from the various vibration sources to the accelerometer must be performed using a calibrated hammer, according to US 6,053,047 .
- An aspect of the invention relates to achieving an improved apparatus for the evaluation of the condition of a machine.
- said digital enveloper (250) includes digital rectifier (270) and a low pass filter (280).
- said enveloper (250) comprises a digital rectifier (270), and said first decimator (310) is adapted to perform low pass filtering of the signal produced by the digital rectifier (270).
- said enveloper (250) does not include any low pass filter.
- said second decimator (470, 470A, 470B) includes an adaptable Finite Impulse Response filter (608) having filter values, said second decimator (470B) being adapted to calculate said filter values by means of interpolation.
- said second decimator (470, 470A, 470B) is configured to receive said first decimated digital signal (S RED1 , S ENV ) as a first sequence of data values (S (j) ), and said second decimator (470, 470A, 470B) is configured to deliver said second digital signal (S RED2 ) as a second sequence of data values (R(q).
- said fractional decimator (470B) is adapted to generate a fractional value (D) dependent on said speed of rotation value (fROT); and wherein said fractional decimator (470B) is adapted to associate input signal data values with a corresponding variable speed of rotation value (f ROT ).
- said fractional decimator (470B) is arranged to adapt said Finite Impulse Response filter in response to said fractional value (D) dependent on said speed of rotation value (f ROT ).
- said finite impulse response filter (608) comprises an input (480) for receiving data values (S (j) ) of said first decimated digital signal (S RED1 , S ENV ) dependent on mechanical vibrations emanating from rotation of a shaft; and
- said fractional decimator (470, 470A, 470B) includes an adaptable finite impulse response filter (608); and wherein said fractional decimator (470B), during a condition monitoring session, is adapted to automatically adjust the fractional value (D) in response to said speed of rotation value (f ROT ) so that said second digital signal (S RED2 ) comprises a substantially constant number of sample values per revolution of the monitored rotating part when the speed of rotation (f ROT ) varies during the condition monitoring session.
- said evaluator (230) is adapted to perform a condition analysis function for detection of whether the condition of the machine is normal or somewhat deteriorated or abnormal.
- said evaluator (230) is adapted to perform a condition analysis function making it possible to establish the nature of, and/or cause for, an abnormal machine condition.
- said condition analysis function includes a Fast Fourier Transform (FFT, 294).
- said first sensor is a shock pulse sensor.
- the invention also elates to a method of operating a finite impulse response filter having an input (480) for receiving detected input data values (S(j)) of a digital measurement data signal (S MD ) dependent on mechanical vibrations emanating from rotation of a shaft, said digital measurement data signal (S MD ) having a sampling frequency (f SR1 );and an input for receiving a signal indicative of a speed of rotation of a monitored rotating part at a time associated said detection of said input data values (S(j));and a memory (604) adapted to receive and store said data values (S(j)) and information indicative of the corresponding speed of rotation (f ROT ); and a value generator (606) adapted to generate a fractional value (D) ; and; a plurality of FIR filter taps having individual filter values; the method comprising the step of interpolating a filter value.
- Fig. 1 shows a schematic block diagram of an embodiment of a condition analyzing system 2 according to an embodiment of the invention.
- Reference numeral 4 relates to a client location with a machine 6 having a movable part 8.
- the movable part may comprise bearings 7 and a shaft 8 which, when the machine is in operation, rotates.
- the operating condition of the shaft 8 or of a bearing 7 can be determined in response to vibrations emanating from the shaft and/or bearing when the shaft rotates.
- the client location 4, which may also be referred to as client part or user part may for example be the premises of a wind farm, i.e. a group of wind turbines at a location, or the premises of a paper mill plant, or some other manufacturing plant having machines with movable parts.
- condition analyzing system 2 is operative when a sensor 10 is attached on or at a measuring point 12 on the body of the machine 6.
- Figure 1 only illustrates two measuring points 12, it to be understood that a location 4 may comprise any number of measuring points 12.
- the condition analysis system 2 shown in Figure 1 comprises an analysis apparatus 14 for analysing the condition of a machine on the basis of measurement values delivered by the sensor 10.
- the analysis apparatus 14 has a communication port 16 for bi-directional data exchange.
- the communication port 16 is connectable to a communications network 18, e.g. via a data interface19.
- the communications network 18 may be the world wide internet, also known as the Internet.
- the communications network 18 may also comprise a public switched telephone network.
- a server computer 20 is connected to the communications network 18.
- the server 20 may comprise a database 22, user input/output interfaces 24 and data processing hardware 26, and a communications port 29.
- the server computer 20 is located on a location 28, which is geographically separate from the client location 4.
- the server location 28 may be in a first city, such as the Swedish capital Swiss, and the client location may be in another city, such as Stuttgart, Germany or Detroit in Michigan, USA.
- the server location 28 may be in a first part of a town and the client location may be in another part of the same town.
- the server location 28 may also be referred to as supplier part 28, or supplier part location 28.
- a central control location 31 comprises a control computer 33 having data processing hardware and software for surveying a plurality of machines at the client location 4.
- the machines 6 may be wind turbines or gear boxes used in wind turbines. Alternatively the machines may include machinery in e.g. a paper mill.
- the control computer 33 may comprise a database 22B, user input/output interfaces 24B and data processing hardware 26B, and a communications port 29B.
- the central control location 31 may be separated from the client location 4 by a geographic distance.
- communications port 29B the control computer 33 can be coupled to communicate with analysis apparatus 14 via port 16.
- the analysis apparatus 14 may deliver measurement data being partly processed so as to allow further signal processing and/or analysis to be performed at the central location 31 by control computer 33.
- a supplier company occupies the supplier part location 28.
- the supplier company may sell and deliver analysis apparatuses 14 and/or software for use in an analysis apparatus 14.
- the supplier company may also sell and deliver analysis software for use in the control computer at the central control location 31.
- Such analysis software 94,105 is discussed in connection with Figure 4 below.
- Such analysis software 94,105 may be delivered by transmission over said communications network 18.
- the apparatus 14 is a portable apparatus which may be connected to the communications network 18 from time to time.
- the apparatus 14 is connected to the communications network 18 substantially continuously.
- the apparatus 14 according to this embodiment may substantially always be "on line" available for communication with the supplier computer 20 and/or with the control computer 33 at control location 31.
- Fig. 2A is a schematic block diagram of an embodiment of a part of the condition analyzing system 2 shown in Fig 1 .
- the condition analyzing system as illustrated in Fig. 2A , comprises a sensor unit 10 for producing a measured value.
- the measured value may be dependent on movement or, more precisely, dependent on vibrations or shock pulses caused by bearings when the shaft rotates.
- An embodiment of the condition analyzing system 2 is operative when a device 30 is firmly mounted on or at a measuring point on a machine 6.
- the device 30 mounted at the measuring point may be referred to as a stud 30.
- a stud 30 can comprise a connection coupling 32 to which the sensor unit 10 is removably attachable.
- the connection coupling 32 can, for example comprise double start threads for enabling the sensor unit to be mechanically engaged with the stud by means of a 1 ⁇ 4 turn rotation.
- a measuring point 12 can comprise a threaded recess in the casing of the machine.
- a stud 30 may have a protruding part with threads corresponding to those of the recess for enabling the stud to be firmly attached to the measuring point by introduction into the recess like a bolt.
- a measuring point can comprise a threaded recess in the casing of the machine, and the sensor unit 10 may comprise corresponding threads so that it can be directly introduced into the recess.
- the measuring point is marked on the casing of the machine only with a painted mark.
- the machine 6 exemplified in Fig. 2A may have a rotating shaft with a certain shaft diameter d1.
- the shaft in the machine 24 may rotate with a speed of rotation V1 when the machine 6 is in use.
- the sensor unit 10 may be coupled to the apparatus 14 for analysing the condition of a machine.
- the analysis apparatus 14 comprises a sensor interface 40 for receiving a measured signal or measurement data, produced by the sensor 10.
- the sensor interface 40 is coupled to a data processing means 50 capable of controlling the operation of the analysis apparatus 14 in accordance with program code.
- the data processing means 50 is also coupled to a memory 60 for storing said program code.
- the sensor interface 40 comprises an input 42 for receiving an analogue signal, the input 42 being connected to an analogue-to-digital (A/D) converter 44, the digital output 48 of which is coupled to the data processing means 50.
- the A/D converter 44 samples the received analogue signal with a certain sampling frequency fs so as to deliver a digital measurement data signal S MD having said certain sampling frequency fs and wherein the amplitude of each sample depends on the amplitude of the received analogue signal at the moment of sampling.
- the sensor interface 40 comprises an input 42 for receiving an analogue signal S EA from a Shock Pulse Measurement Sensor, a conditioning circuit 43 coupled to receive the analogue signal, and an A/D converter 44 coupled to receive the conditioned analogue signal from the conditioning circuit 43.
- the A/D converter 44 samples the received conditioned analogue signal with a certain sampling frequency fs so as to deliver a digital measurement data signal S MD having said certain sampling frequency fs and wherein the amplitude of each sample depends on the amplitude of the received analogue signal at the moment of sampling.
- the sampling theorem guarantees that bandlimited signals (i.e., signals which have a maximum frequency) can be reconstructed perfectly from their sampled version, if the sampling rate fs is more than twice the maximum frequency f SEAmax of the analogue signal S EA to be monitored.
- the frequency equal to one-half of the sampling rate is therefore a theoretical limit on the highest frequency that can be unambiguously represented by the sampled signal S MD .
- This frequency (half the sampling rate) is called the Nyquist frequency of the sampling system. Frequencies above the Nyquist frequency f N can be observed in the sampled signal, but their frequency is ambiguous.
- the factor k may be selected to a value higher than 2,0.
- factor k may be selected to a value between 2,0 and 2,9 in order to provide a good safety margin while avoiding to generate unnecessarily many sample values.
- the factor k is advantageously selected such that 100*k/ 2 renders an integer.
- f SEAmax f S / k wherein f SEAmax is the highest frequency to be analyzed in the sampled signal
- a digital measurement data signal S MD having a certain sampling frequency fs, is generated in response to said received analogue measurement signal S EA .
- the digital output 48 of the A/D converter 44 is coupled to the data processing means 50 via an output 49 of the sensor interface 40 so as to deliver the digital measurement data signal S MD to the data processing means 50.
- the sensor unit 10 may comprise a vibration transducer, the sensor unit being structured to physically engage the connection coupling of the measuring point so that vibrations of the machine at the measuring point are transferred to the vibration transducer.
- the sensor unit comprises a transducer having a piezo-electric element. When the measuring point 12 vibrates, the sensor unit 10, or at least a part of it, also vibrates and the transducer then produces an electrical signal of which the frequency and amplitude depend on the mechanical vibration frequency and the vibration amplitude of the measuring point 12, respectively.
- the sensor unit 10 is a vibration sensor, providing an analogue amplitude signal of e.g. 10 mV/g in the Frequency Range 1.00 to 10000 Hz.
- Such a vibration sensor is designed to deliver substantially the same amplitude of 10 mV irrespective of whether it is exerted to the acceleration of 1 g (9,82 m/s 2 ) at 1 Hz, 3 Hz or 10 Hz.
- a typical vibration sensor has a linear response in a specified frequency range up to around 10 kHz.
- Mechanical vibrations in that frequency range emanating from rotating machine parts are usually caused by imbalance or misalignment.
- the linear response vibration sensor typically also has several different mechanical resonance frequencies dependent on the physical path between sensor and vibration source.
- a damage in a roller bearing causes relatively sharp elastic waves, known as shock pulses, travelling along a physical path in the housing of a machine before reaching the sensor. Such shock pulses often have a broad frequency spectrum.
- the amplitude of a roller bearing shock pulse is typically lower than the amplitude of a vibration caused by imbalance or misalignment.
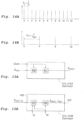
- a typical measuring signal from a vibration sensor may have a wave form as shown in Figure 2C , i.e. a dominant low frequency signal with a superimposed higher frequency lower amplitude resonant "ringing response".
- the low frequency component In order to enable analysis of the shock pulse signature, often emanating from a bearing damage, the low frequency component must be filtered out. This can be achieved by means of a high pass filter or by means of a band pass filter. However, these filters must be adjusted such that the low frequency signal portion is blocked while the high frequency signal portion is passed on.
- An individual vibration sensor will typically have one resonance frequency associated with the physical path from one shock pulse signal source, and a different resonance frequency associated with the physical path from another shock pulse signal source, as mentioned in US 6,053,047 . Hence, filter adjustment aiming to pass high the frequency signal portion requires individual adaptation when a vibration sensor is used.
- the resulting signal will consist of the shock pulse signature(s).
- the analysis of the shock pulse signature(s) emanating from a vibration sensor is somewhat impaired by the fact that the amplitude response as well as resonance frequency inherently varies dependent on the individual physical path from the shock pulse signal sources.
- Shock Pulse Measurement sensor is designed and adapted to provide a pre-determined mechanical resonance frequency, as described in further detail below.
- This feature of the Shock Pulse Measurement sensor advantageously renders repeatable measurement results in that the output signal from a Shock Pulse Measurement sensor has a stable resonance frequency substantially independent on the physical path between the irrespective between the shock pulse signal source and the shock pulse sensor. Moreover, mutually different individual shock pulse sensors provide a very small, if any, deviation in resonance frequency.
- Figure 2D illustrates a measuring signal amplitude generated by a shock pulse sensor
- Figure 2E illustrates a measuring signal amplitude generated by a vibration sensor. Both sensors have been exerted to the same series of mechanical shocks without the typical low frequency signal content. As clearly seen in Figures 2D and 2E , the duration of a resonance response to a shock pulse signature from the Shock Pulse Measurement sensor is shorter than the corresponding resonance response to a shock pulse signature from the vibration sensor.
- This feature of the Shock Pulse Measurement sensor of providing distinct shock pulse signature responses has the advantageous effect of providing a measurement signal from which it is possible to distinguish between different mechanical shock pulses that occur within a short time span.
- the sensor is a Shock Pulse Measurement sensor.
- Figure 3 is a simplified illustration of a Shock Pulse Measurement sensor 10 according to an embodiment of the invention.
- the sensor comprises a part 110 having a certain mass or weight and a piezo-electrical element 120.
- the piezo-electrical element 120 is somewhat flexible so that it can contract and expand when exerted to external force.
- the piezo-electrical element 120 is provided with electrically conducting layers 130 and 140, respectively, on opposing surfaces. As the piezo-electrical element 120 contracts and expands it generates an electric signal which is picked up by the conducting layers 130 and 140.
- the Shock Pulse Measurement sensor 10 has a resonance frequency that depends on the mechanical characteristics for the sensor, such as the mass m of weight part 110 and the resilience of piezo-electrical element 120. Hence, the piezo-electrical element has an elasticity and a spring constant k. The mechanical resonance frequency f RM for the sensor is therefore also dependent on the mass m and the spring constant k.
- the actual mechanical resonance frequency for a Shock Pulse Measurement sensor 10 may also depend on other factors, such as the nature of the attachment of the sensor 10 to the body of the machine 6.
- the analogue electrical measurement signal has an electrical amplitude which may vary over the frequency spectrum.
- the Shock Pulse Measurement sensor 10 were exerted to mechanical vibrations with identical amplitude in all frequencies from e.g. 1 Hz to e.g. 200 000 kHz, then the amplitude of the analogue signal S EA from the Shock Pulse Measurement Sensor will have a maximum at the mechanical resonance frequency f RM , since the sensor will resonate when being "pushed" with that frequency.
- the conditioning circuit 43 receives the analogue signal S EA .
- the conditioning circuit 43 may be designed to be an impedance adaption circuit designed to adapt the input impedance of the A/D-converter as seen from the sensor terminals 145,150 so that an optimum signal transfer will occur.
- the conditioning circuit 43 may operate to adapt the input impedance Z in as seen from the sensor terminals 145,150 so that a maximum electric power is delivered to the A/D-converter 44.
- the analogue signal S EA is fed to the primary winding of a transformer, and a conditioned analogue signal is delivered by a secondary winding of the transformer.
- the A/D converter 44 is coupled to receive the conditioned analogue signal from the conditioning circuit 43.
- the A/D converter 44 has an input impedance Z 44 , and the input impedance of the A/D-converter as seen from the sensor terminals 145,150 will be (n1/n2) 2 * Z 44 , when the conditioning circuit 43 is coupled in between the sensor terminals 145,150 and the input terminals of the A/D converter 44.
- the A/D converter 44 samples the received conditioned analogue signal with a certain sampling frequency fs so as to deliver a digital measurement data signal S MD having said certain sampling frequency fs and wherein the amplitude of each sample depends on the amplitude of the received analogue signal at the moment of sampling.
- the digital measurement data signal S MD is delivered to a means 180 for digital signal processing (See Fig 5 ).
- the means 180 for digital signal processing comprises the data processor 50 and program code for causing the data processor 50 to perform digital signal processing.
- the processor 50 is embodied by a Digital Signal Processor.
- the Digital Signal Processor may also be referred to as a DSP.
- the data processing means 50 is coupled to a memory 60 for storing said program code.
- the program memory 60 is preferably a nonvolatile memory.
- the memory 60 may be a read/write memory, i.e. enabling both reading data from the memory and writing new data onto the memory 60.
- the program memory 60 is embodied by a FLASH memory.
- the program memory 60 may comprise a first memory segment 70 for storing a first set of program code 80 which is executable so as to control the analysis apparatus 14 to perform basic operations ( Figure 2A and Figure 4 ).
- the program memory may also comprise a second memory segment 90 for storing a second set of program code 94.
- the second set of program code 94 in the second memory segment 90 may include program code for causing the analysis apparatus to process the detected signal, or signals, so as to generate a pre-processed signal or a set of pre-processed signals.
- the memory 60 may also include a third memory segment 100 for storing a third set of program code 104.
- the set of program code 104 in the third memory segment 100 may include program code for causing the analysis apparatus to perform a selected analysis function 105. When an analysis function is executed it may cause the analysis apparatus to present a corresponding analysis result on user interface 106 or to deliver the analysis result on port 16 (See Fig 1 and Fig 2A and Fig. 7 and 8 ).
- the data processing means 50 is also coupled to a read/write memory 52 for data storage. Moreover, the data processing means 50 may be coupled to an analysis apparatus communications interface 54.
- the analysis apparatus communications interface 54 provides for bi-directional communication with a measuring point communication interface 56 which is attachable on, at or in the vicinity of the measuring point on the machine.
- the measuring point 12 may comprise a connection coupling 32, a readable and writeable information carrier 58, and a measuring point communication interface 56.
- the writeable information carrier 58, and the measuring point communication interface 56 may be provided in a separate device 59 placed in the vicinity of the stud 30, as illustrated in Figure 2 .
- the writeable information carrier 58, and the measuring point communication interface 56 may be provided within the stud 30. This is described in more detail in WO 98/01831 , the content of which is hereby incorporated by reference.
- the system 2 is arranged to allow bidirectional communication between the measuring point communication interface 56 and the analysis apparatus communication interface 54.
- the measuring point communication interface 56 and the analysis apparatus communication interface 54 are preferably constructed to allow wireless communication.
- the measuring point communication interface and the analysis apparatus communication interface are constructed to communicate with one another by radio frequency (RF) signals.
- RF radio frequency
- This embodiment includes an antenna in the measuring point communication interface 56 and another antenna the analysis apparatus communication interface 54.
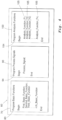
- Figure 4 is a simplified illustration of an embodiment of the memory 60 and its contents.
- the simplified illustration is intended to convey understanding of the general idea of storing different program functions in memory 60, and it is not necessarily a correct technical teaching of the way in which a program would be stored in a real memory circuit.
- the first memory segment 70 stores program code for controlling the analysis apparatus 14 to perform basic operations.
- the simplified illustration of Figure 4 shows pseudo code, it is to be understood that the program code 80 may be constituted by machine code, or any level program code that can be executed or interpreted by the data processing means 50 ( Fig.2A ).
- the second memory segment 90 stores a second set of program code 94.
- the program code 94 in segment 90 when run on the data processing means 50, will cause the analysis apparatus 14 to perform a function, such as a digital signal processing function.
- the function may comprise an advanced mathematical processing of the digital measurement data signal S MD .
- the program code 94 is adapted to cause the processor means 50 to perform signal processing functions described in connection with Figures 5 , 6 , 9 and/or Fig. 16 in this document.
- a computer program for controlling the function of the analysis apparatus may be downloaded from the server computer 20.
- This means that the program-to-be-downloaded is transmitted to over the communications network 18.
- the downloaded program may be loaded into a digital memory, such as memory 60 (See figure 2A and 4 ).
- a signal processing program 94 and or an analysis function program 104, 105 may be received via a communications port, such as port 16 ( Fig 1 & 2A ), so as to load it into memory 60.
- a signal processing program 94 and or an analysis function program 104, 105 may be received via communications port 29B ( Fig 1 ), so as to load it into a program memory location in computer 26B or in database 22B.
- An aspect of the invention relates to a computer program product, such as a program code means 94 and/or program code means 104, 105 loadable into a digital memory of an apparatus.
- the computer program product comprising software code portions for performing signal processing methods and/or analysis functions when said product is run on a data processing unit 50 of an apparatus for analysing the condition of a machine.
- run on a data processing unit means that the computer program plus the data processing unit carries out a method of the kind described in this document.
- a computer program product, loadable into a digital memory of a condition analysing apparatus means that a computer program can be introduced into a digital memory of a condition analysing apparatus so as achieve a condition analysing apparatus programmed to be capable of, or adapted to, carrying out a method of the kind described above.
- loaded into a digital memory of a condition analysing apparatus means that the condition analysing apparatus programmed in this way is capable of, or adapted to, carrying out a method of the kind described above.
- the above mentioned computer program product may also be loadable onto a computer readable medium, such as a compact disc or DVD.
- a computer readable medium may be used for delivery of the program to a client.
- the analysis apparatus 14 comprises a user input interface 102, whereby an operator may interact with the analysis apparatus 14.
- the user input interface 102 comprises a set of buttons 104.
- An embodiment of the analysis apparatus 14 comprises a user output interface 106.
- the user output interface may comprise a display unit 106.
- the data processing means 50 when it runs a basic program function provided in the basic program code 80, provides for user interaction by means of the user input interface 102 and the display unit 106.
- the set of buttons 104 may be limited to a few buttons, such as for example five buttons, as illustrated in Figure 2A .
- a central button 107 may be used for an ENTER or SELECT function, whereas other, more peripheral buttons may be used for moving a cursor on the display 106.
- symbols and text may be entered into the apparatus 14 via the user interface.
- the display unit 106 may, for example, display a number of symbols, such as the letters of alphabet, while the cursor is movable on the display in response to user input so as to allow the user to input information.
- the rotating part may include a shaft and bearings.
- the shaft rotation frequency f ROT is often referred to as "order 1".
- the frequency resolution Z of the FFT analyzer 294 may be settable using the user interface 102, 106 ( Fig 2A ).
- the FFTransformer 294 may be adapted to perform Fast Fourier Transform on a received input signal having a certain number of sample values. It is advantageous when the certain number of sample values is set to an even integer which may be divided by two (2) without rendering a fractional number.
- a data signal representing mechanical vibrations emanating from rotation of a shaft may include repetitive signal patterns.
- a certain signal pattern may thus be repeated a certain number of times per revolution of the shaft being monitored.
- repetitive signals may occur with mutually different repetition frequency.
- the book also provides formulas for calculating these specific frequencies on page 150.
- the content of the book “Machinery Vibration Measurements and Analysis” by Victor Wowk, is hereby incorporated by reference.
- the above mentioned formulas for calculating these specific frequencies are hereby incorporated by reference.
- a table on page 151 of the same book indicates that these frequencies also vary dependent on bearing manufacturer, and that
- the frequency factor is multiplied with the rotational speed of the shaft to obtain the repetition frequency.
- the book indicates that for a shaft having a rotational speed of 1715 rpm, i.e. 28,58 Hz, the repetition frequency for a pulse emanating from the Outer Race (OR) of a bearing of standard type 6311 may be about 86 Hz.; and the FTF repetition frequency may be 10,8 Hz.
- the inventor came up with a method for enabling detection of weak mechanical signals in a noisy environment.
- the repetition frequency f D of vibration signal component S D in measuring signal S EA depends on a mechanical vibration V MD which is indicative of an incipient damage of a rotational part 8 of the monitored machine 6.
- the inventor realized that it may be possible to detect an incipient damage, i.e. a damage that is just starting to develop, if a corresponding weak signal can be discerned.
- the shaft whose bearing is analyzed may rotate at a speed of less than 120 revolutions per minute, i.e. the shaft rotational frequency f ROT is less than 2 revolutions per second (rps).
- the shaft rotational frequency f ROT is less than 2 revolutions per second (rps).
- the shaft to be analyzed rotates at a speed of less than 50 revolutions per minute (rpm), i.e. a shaft rotational frequency f ROT of less than 0,83 rps.
- the speed of rotation may typically be less than 15 rpm.
- a shaft having a rotational speed of 1715 rpm as discussed in the above mentioned book, produces 500 revolutions in just 17,5 seconds; a shaft rotating at 50 revolutions per minute takes ten minutes to produce 500 revolutions.
- a bearing to be analyzed is associated with a slowly rotating shaft, and the bearing is monitored by a detector generating an analogue measurement signal S EA which is sampled using a sampling frequency fs of about 100 Khz
- S EA an analogue measurement signal
- the number of sampled values associated with one full revolution of the shaft becomes very large.
- Figure 9 illustrates another embodiment of the pre-processor 200.
- the Figure 9 embodiment of the pre-processor 200 includes a digital band pass filter 240 and a digital enveloper 250 as described above in connection with Figure 6 .
- the signal S ENV is a digital representation of an enveloped signal which is produced in response to the filtered measurement data signal S F .
- the digital enveloped signal S ENV is delivered to a decimator 310 adapted to produce a digital signal S RED having a reduced sampling frequency f SR1 .
- the decimator 310 operates to produce an output digital signal wherein the temporal duration between two consecutive sample values is longer than the temporal duration between two consecutive sample values in the input signal.
- the decimator is described in more detail in connection with Figure 14 , below.
- the optional low pass filter 280 may be eliminated, as mentioned above.
- the signal produced by the digital rectifier 270 is delivered to decimator 310, which includes low pass filtering, the low pass filter 280 may be eliminated.
- An output 312 of the decimator 310 delivers the digital signal S RED to an input 315 of an enhancer 320.
- the enhancer 320 is capable of receiving the digital signal S RED and in response thereto generating an output signal S MDP .
- the output signal S MDP is delivered to output port 260 of pre-processor 200.
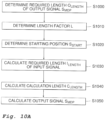
- Figure 10A is a flow chart that illustrates embodiments of a method for enhancing repetitive signal patterns in signals. This method may advantageously be used for enhancing repetitive signal patterns in signals representing the condition of a machine having a rotating shaft.
- An enhancer 320 may be designed to operate according to the method illustrated by Figure 10A .
- Method steps S1000 to S 1040 in Figure 10A represent preparatory actions to be taken in order to make settings before actually generating the output signal values. Once, the preparatory actions have been executed, the output signal values may be calculated, as described with reference to step S 1050.
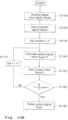
- Figure 10B is a flow chart illustrating a method of generating a digital output signal. More particularly, Figure 10B illustrates an embodiment of a method to generate a digital output signal when preparatory actions described with reference to steps S 1000 to S 1040 in Figure 10A have been performed.
- a desired length O LENGTH of an output signal S MDP is determined.
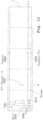
- Figure 11 is a schematic illustration of a first memory having plural memory positions i.
- the memory positions i of the first memory hold an example input signal I comprising a sequence of digital values.
- the example input signal is used for calculating the output signal S MDP according to embodiments of the invention.
- Figure 11 shows some of many consecutive digital values for the input signal I.
- the digital values 2080 in the input signal I only illustrate a few of the digital values that are present in the input signal.
- two neighbouring digital values in the input signal are separated by a duration t delta .
- the value t delta is the inverse of a sampling frequency f SR of the input signal received by the enhancer 320 (See Fig. 9 & Fig 16 ).
- Figure 12 is a schematic illustration of a second memory having plural memory positions t.
- the memory positions t of the second memory hold an example output signal S MDP comprising a sequence of digital values.
- Figure 12 illustrates a portion of a memory having digital values 3090 stored in consecutive memory positions.
- Figure 12 shows consecutive digital values for the output signal S MDP .
- the digital values 3090 in the output signal S MDP only illustrate a few of the digital values that are present in the output signal.
- two neighbouring digital values in the output signal may be temporally separated by the duration t delta .
- the desired length O LENGTH 3010 of the output signal S MDP may be chosen so that it is possible to use the output signal S MDP for analysing certain frequencies in the output signal. If for instance lower frequencies are of interest a longer output signal is required than if higher frequencies are of interest.
- the lowest frequency that can be analysed using the output signal is 1/(O LENGTH * t delta ), where O LENGTH is the number of sample values in the output signal. If f SR is the sampling rate of the input signal I, then the time t delta between each digital sample value will be 1/f SR .
- repetitive signal patterns may occur in a data signal representing mechanical vibrations.
- a measurement signal such as signal S ENV delivered by the envelopper 250 and signal S RED delivered to enhancer 320 may include at least one vibration signal component S D dependent on a vibration movement of the rotationally movable part 8; wherein said vibration signal component S D has a repetition frequency f D which depends on the speed of rotation f ROT of the rotationally movable part 8.
- the user may input a value representing a lowest repetition frequency f REPmin to be detected as well as information about a lowest expected speed of rotation of the shaft to be monitored.
- the analysis system 2 ( Figure 1 ) includes functionality for calculating a suitable value for the variable O LENGTH in response to these values.
- a length factor L is chosen.
- the length factor L determines how well stochastic signals are suppressed in the output signal S MDP .
- a higher value of L gives less stochastic signals in the output signal S MDP than a lower value of L.
- the length factor L may be referred to as a Signal-Noise Ratio improver value.
- the value L can be preset in the enhancer 320.
- the value L is inputted by a user of the method through the user interface 102 ( Fig. 2A ).
- the value of the factor L also has an impact on calculation time required to calculate the output signal. A larger value of L requires longer calculation time than a lower value of L.
- a starting position S START is set.
- the starting position S START is a position in the input signal I.
- a next step S 1030 the required length of the input data signal is calculated.
- a length C LENGTH in the input data signal is calculated.
- the length C LENGTH is the length over which the calculation of the output data signal is performed. This length C LENGTH is calculated according to formula (3) below.
- C LENGTH I LENGTH ⁇ S START ⁇ O LENGTH
- the method described in connection with Figures 10-13 may be performed by the analysis apparatus 14 when the processor 50 executes the corresponding program code 94, as discussed in conjunction with Figure 4 above.
- the data processor 50 may include a central processing unit for controlling the operation of the analysis apparatus 14, as well as a Digital Signal Processor (DSP).
- the DSP may be arranged to actually run the program code 90 for causing the analysis apparatus 14 to execute the program 94 causing the process described above in connections with Figures 10-13 to be executed.
- the Digital Signal Processor may be e.g. of the type TMS320C6722, manufactured by Texas Instruments. In this manner the analysis apparatus 14 may operate to execute all signal processing functions 94, including filtering function 240, enveloping function 250, decimation function 310 & 470 and enhancing function 320.
- Figure 14A illustrates a number of sample values in the signal delivered to the input of the decimator 310
- Figure 14B illustrates output sample values of the corresponding time period.
- the signal being input to decimator 310 may have a sampling frequency fs.
- the output signal is has a reduced sample frequency f SR1 .
- the decimator 310 is adapted to perform a decimation of the digitally enveloped signal S ENV so as to deliver a digital signal S RED having a reduced sample rate f SR1 such that the output sample rate is reduced by an integer factor M as compared to the input sample rate fs.
- the output signal S RED includes only every M:th sample value present in the input signal S ENV .
- Figure 14B illustrates an example where M is 4, but M could be any positive integer.
- the decimator may operate as described in US 5,633,811 , the content of which is hereby incorporated by reference.
- FIG. 15A illustrates a decimator 310 according to an embodiment of the invention.
- FIR finite impulse response
- Figure 15B illustrates another embodiment of the invention, wherein embodiment 310B of the decimator 310 includes a low pass filter 402, followed by a sample selector 403.
- the sample selector 403 is adapted to pick every M:th sample out of the signal received from the low pass filter 402.
- the cutoff frequency of the low pass filter 402 is controlled by the value M.
- the value M is preset to a certain value. According to another embodiment the value M may be settable.
- the decimator 310 may be settable to make a selected decimation M:1, wherein M is a positive integer.
- the value M may be received on a port 404 of decimator 310.
- the cut-off frequency of low pass filter 402 is f SR1 /(G * M) Hertz.
- the factor G may be selected to a value of two (2,0) or a value higher than two (2,0). According to an embodiment the value G is selected to a value between 2,5 and 3. This advantageously enables avoiding aliasing.
- the low pass filter 402 may be embodied by a FIR filter.
- the signal delivered by low pass filter 402 is delivered to sample selector 403.
- the sample selector receives the value M on one port and the signal from low pass filter 402 on another port, and it generates a sequence of sample values in response to these inputs.
- the sample selector is adapted to pick every M:th sample out of the signal received from the low pass filter 402.
- a repetitive signal signature being present in the input signal may advantageously be detected using the above described method, even when the repetitive signal signature is so weak as to generate an amplitude component smaller than that of the stochastic signal components.
- the shaft rotational speed may vary. Performing the method described with reference to Figures 10-13 using an input measurement sequence wherein the speed of shaft rotation varies leads to deteriorated quality of the resulting output signal S MDP .
- an object of an aspect of the invention is to achieve equally high quality of the resulting block Y when the rotational speed of the shaft varies as when the rotational speed of the shaft is constant during the complete measuring sequence.
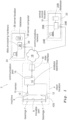
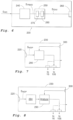
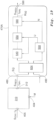
- Figure 16 illustrates an embodiment of the invention including a decimator 310 and an enhancer 320, as described above, and a fractional decimator 470.
- the Figure 16 embodiment includes a fractional decimator 470 for decimating the sampling rate by U/N, wherein both U and N are positive integers.
- the fractional decimator 470 advantageously enables the decimation of the sampling rate by a fractional number.
- the values for U and N may be selected to be in the range from 2 to 2000.
- the values for U and N may be selected to be in the range from 500 to 1500.
- the values for U and N may be selected to be in the range from 900 to 1100.
- the output signal from the decimator 310 is delivered to a selector 460.
- the selector enables a selection of the signal to be input to the enhancer 320.
- the selector 460 may be set in the position to deliver the signal S RED having sample frequency f SR1 to the input 315 of enhancer 320, and fractional decimator 470 may be disabled.
- the fractional decimator 470 may be enabled and the selector 460 is set in the position to deliver the signal S RED2 having sample frequency f SR2 to the input 315 of enhancer 320.
- the fractional decimator 470 has an input 480.
- the input 480 may be coupled to receive the signal output from decimator 310.
- the fractional decimator 470 also has an input 490 for receiving information indicative of the rotational speed of the shaft 8.
- a speed detector 420 may be provided to deliver a signal indicative of the speed of rotation f ROT of the shaft 8.
- the speed signal may be received on a port 430 of the processing means 180, thereby enabling the processing means 180 to deliver that speed signal to input 490 of fractional decimator 470.
- the speed of rotation f ROT of the shaft 8 may be provided in terms of rotations per second, i.e. Hertz (Hz).
- Figure 17 illustrates an embodiment of the fractional decimator 470 enabling the alteration of the sample rate by a fractional number U/N, wherein U and N are positive integers. This enables a very accurate control of the sample rate f SR2 to be delivered to the enhancer 320, thereby enabling a very good detection of weak repetitive signal signatures even when the shaft speed varies.
- the speed signal, received on input 490 of fractional decimator 470, is delivered to a Fractional Number generator 500.
- the Fractional Number generator 500 generates integer number outputs U and N on outputs 510 and 520, respectively.
- the U output is delivered to an upsampler 530.
- the upsampler 530 receives the signal S RED (See Figure 16 ) via input 480.
- the upsampler 530 includes a sample introductor 540 for introducing U-1 sample values between each sample value received on port 480. Each such added sample value is provided with an amplitude value. According to an embodiment each such added sample value is a zero (0) amplitude.
- the resulting signal is delivered to a low pass filter 550 whose cut-off frequency is controlled by the value U delivered by Fractional Number generator 500.
- the cut-off frequency of low pass filter 550 is f SR2 /(K*U) Hertz.
- the factor K may be selected to a value of two (2) or a value higher than two (2).
- the resulting signal is delivered to a Decimator 560.
- the Decimator 560 includes a low pass filter 570 whose cutoff frequency is controlled by the value N delivered by Fractional Number generator 500.
- the cut-off frequency of low pass filter 570 is f SR2 /(K*N) Hertz.
- the factor K may be selected to a value of two (2) or a value higher than two (2).
- the signal delivered by low pass filter 570 is delivered to sample selector 580.
- the sample selector receives the value N on one port and the signal from low pass filter 570 on another port, and it generates a sequence of sample values in response to these inputs.
- the sample selector is adapted to pick every N:th sample out of the signal received from the low pass filter 570.
- the resulting signal S RED2 is delivered on an output port 590.
- the low pass filters 550 and 570 may be embodied by FIR filters. This advantageously eliminates the need to perform multiplications with the zero-amplitude values introduced by sample introductor 540.
- Figure 18 illustrates another embodiment of the fractional decimator 470.
- the figure 18 embodiment advantageously reduces the amount of calculation needed for producing the signal S RED2 .
- the low pass filter 570 has been eliminated, so that the signal delivered by low pass filter 550 is delivered directly to sample selector 580.
- the fractional decimator 470 is embodied by hardware the figure 18 embodiment advantageously reduces an amount of hardware, thereby reducing the cost of production.
- the figure 18 embodiment advantageously reduces an amount of program code that need to be executed, thereby reducing the load on the processor and increasing the execution speed.
- the fractional value U/N is dependent on a rate control signal received on input port 490.
- the rate control signal may be a signal indicative of the speed of rotation of the shaft 8, which may be delivered by speed detector 420 (See Figure 1 and/or Figure 5 ).
- the speed detector 420 may be embodied by an encoder, providing a pulse signal with a suitably selected resolution so as to enable the desired accuracy of the speed signal.
- the encoder 420 delivers a full revolution marker signal once per full revolution of the shaft 8.
- a revolution marker signal may be in the form of an electric pulse having an edge that can be accurately detected and indicative of a certain rotational position of the monitored shaft 8.
- the encoder 420 may deliver many pulse signals per revolution of the monitored shaft, so as to enable detection of speed variations also within one revolution of the shaft.
- the Fractional Number generator 500 controls the values of U and N so that the reduced sample rate F SR2 has such a value as to provide a signal S RED2 wherein the number of samples per revolution of the shaft 8 is substantially constant, irrespective of any speed variations of the shaft 8. Accordingly: The higher the values of U and N, the better the ability of the fractional decimator 470 at keeping the number of sample values per revolution of the shaft 8 at a is substantially constant value.
- the fractional decimation as described with reference to Figures 17 and 18 may be attained by performing the corresponding method steps, and this may be achieved by means of a computer program 94 stored in memory 60, as described above.
- the computer program may be executed by a DSP 50.
- the computer program may be executed by a Field Programmable Gate Array circuit (FPGA).
- FPGA Field Programmable Gate Array circuit
- the method described in connection with Figures 10-13 and the decimation as described with reference to Figures 17 and 18 may be performed by the analysis apparatus 14 when the processor 50 executes the corresponding program code 94, as discussed in conjunction with Figure 4 above.
- the data processor 50 may include a central processing unit 50 for controlling the operation of the analysis apparatus 14, as well as a Digital Signal Processor (DSP) 50B.
- the DSP 50B may be arranged to actually run the program code 90 for causing the analysis apparatus 14 to execute the program 94 causing the process described above in connections with Figures 10-13 to be executed.
- the processor 50B is a Field programmable Gate Array circuit (FPGA).
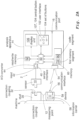
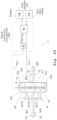
- FIG 19 illustrates decimator 310 and another embodiment of fractional decimator 470.
- Decimator 310 receives the signal S ENV having a sampling frequency fs on a port 405, and an integer M on a port 404, as described above.
- Decimator 310 delivers a signal S RED1 having a sampling frequency f SR1 on output 312, which is coupled to input 480 of fractional decimator 470A.
- Fractional decimator 470A receives the signal S RED1 , having a sampling frequency F SR1 , as a sequence of data values S(j), and it delivers an output signal S RED2 as another sequence of data values R(q) on its output 590.
- Fractional decimator 470A may include a memory 604 adapted to receive and store the data values S(j) as well as information indicative of the corresponding speed of rotation f ROT of the monitored rotating part. Hence the memory 604 may store each data value S(j) so that it is associated with a value indicative of the speed of rotation of the monitored shaft at time of detection of the sensor signal S EA value corresponding to the data value S(j).
- the resulting signal is delivered to the sample selector 580.
- the sample selector receives the value N on one port and the signal from low pass filter 550 on another port, and it generates a sequence of sample values in response to these inputs.
- the sample selector is adapted to pick every N:th sample out of the signal received from the low pass filter 550.
- the resulting signal S RED2 is delivered on output port 590.
- the encoder 420 may deliver a full revolution marker signal once per full revolution of the shaft 8.
- a full revolution marker signal may be in the form of an electric pulse having an edge that can be accurately detected and indicative of a certain rotational position of the monitored shaft 8.
- the full revolution marker signal which may be referred to as an index pulse, can be produced on an output of the encoder 420 in response to detection of a zero angle pattern on an encoding disc that rotates when the monitored shaft rotates. This can be achieved in several ways, as is well known to the person skilled in this art.
- the encoding disc may e.g. be provided with a zero angle pattern which will produce a zero angle signal with each revolution of the disc.
- the speed variations may be detected e.g.
- the memory 604 will store a larger number of samples between two consecutive full revolution markers when the shaft rotates slower, since the A/D converter delivers a constant number of samples fs per second.
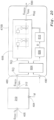
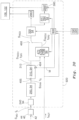
- FIG 20 is a block diagram of decimator 310 and yet another embodiment of fractional decimator 470.
- This fractional decimator embodiment is denoted 470B.
- Fractional decimator 470B may include a memory 604 adapted to receive and store the data values S(j) as well as information indicative of the corresponding speed of rotation f ROT of the monitored rotating part. Hence the memory 604 may store each data value S(j) so that it is associated with a value indicative of the speed of rotation of the monitored shaft at time of detection of the sensor signal S EA value corresponding to the data value S(j).
- Fractional decimator 470B receives the signal S RED1 , having a sampling frequency F SR1 , as a sequence of data values S(j), and it delivers an output signal S RED2 , having a sampling frequency f SR2 , as another sequence of data values R(q) on its output 590.
- Fractional decimator 470B may include a memory 604 adapted to receive and store the data values S(j) as well as information indicative of the corresponding speed of rotation f ROT of the monitored rotating part.
- Memory 604 may store data values S(j) in blocks so that each block is associated with a value indicative of a relevant speed of rotation of the monitored shaft, as described below in connection with Figure 21 .
- Fractional decimator 470B may also include a fractional decimation variable generator 606, which is adapted to generate a fractional value D.
- the fractional value D may be a floating number.
- the fractional number can be controlled to a floating number value in response to a received speed value f ROT so that the floating number value is indicative of the speed value f ROT with a certain inaccuracy.
- the inaccuracy of floating number value may depend on the ability of the DSP to generate floating number values.
- fractional decimator 470B may also include a FIR filter 608.
- the FIR filter 608 is a low pass FIR filter having a certain low pass cut off frequency adapted for decimation by a factor D MAX .
- the factor D MAX may be set to a suitable value, e.g. 20,000.
- fractional decimator 470B may also include a filter parameter generator 610.
- the recorded data values S(j) may be divided into two blocks of data, the first block of data values being associated with the first speed value f ROT1 , and the second block of data values being associated with the second speed value f ROT2 .
- the second block of data would contain fewer data values than the first block of data since the second time period was shorter.
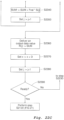
- step S2090 select a first block of data values S(j), and determine a fractional decimation value D corresponding to the associated speed of rotation value f ROT . Associate this fractional decimation value D with the first block of data values S(j). According to an embodiment, when all blocks have been associated with a corresponding fractional decimation value D, then the method proceeds to execute step S2090. Hence, the value of the fractional decimation value D is adapted in dependence on the speed f ROT .
- step S2120 Check if there is any remaining input data values to be processed. If there is another block of input data values to be processed, then repeat step S2100. If there is no remaining block of input data values to be processed then the measurement session is completed.
- the FIR-filter 608 is adapted for the specific fractional decimation value D as received in step S2200, and a set of corresponding output signal values R(q) are generated. This is described more specifically below.
- a position j in the received input data adjacent and subsequent to position x is selected.
- a step S2310 select a position in the FIR filter that corresponds to the selected position j in the received input data.
- the position Fpos may be a fractional number.
- step S2320 check if the determined filter position value Fpos is outside of allowable limit values, i.e. points at a position outside of the filter. If that happens, then proceed with step S2360 below. Otherwise proceed with step S2330.
- a step S2360 deliver an output data value R(j).
- the output data value R(j) may be delivered to a memory so that consecutive output data values are stored in consecutive memory positions.
- step S2390 check if desired number of output data values have been generated. If the desired number of output data values have not been generated, then go to step S2230. If the desired number of output data values have been generated, then go to step S2120 in the method described in relation to Figure 21 .
- step S2390 is designed to ensure that a block of output signal values R(q), corresponding to the block of input data values S received in step S2200, is generated, and that when output signal values R corresponding to the input data values S have been generated, then step S2120 in Fig.21 should be executed.
- the method described with reference to Figure 22 may be implemented as a computer program subroutine, and the steps S2100 and S2110 may be implemented as a main program.
- the compensation for variable shaft speed may be achieved by controlling the clock frequency delivered by the clock 190.
- a speed detector 420 (See Figure 5 ) may be provided to deliver a signal indicative of the speed of rotation f ROT of the shaft 8.
- the speed signal may be received on a port 430 of the processing means 180, thereby enabling the processing means 180 to control the clock 190.
- processing means 180 may have a port 440 for delivering a clock control signal.
- the processing means 180 may be adapted to control the clock frequency in response to the detected speed of rotation f ROT .
- the sampling rate of the A/D-converter is dependent upon a clock frequency.
- the apparatus 14 may be adapted to control the clock frequency in response to the detected speed of rotation f ROT so that the number of sample values per revolution of the monitored rotating part is kept at a substantially constant value even when the speed of rotation varies.
- the enhancer functionality 320, 94 may be achieved by a method for producing autocorrelation data as described in US 7,010,445 , the content of which is hereby incorporated by reference.
- the digital signal processor 50 may include functionality 94 for performing successive Fourier Transform operations on the digitized signals to provide autocorrelation data.
- embodiments of the invention may also be used to survey, monitor and detect the condition of gear systems. Some embodiments provide particularly advantageous effects when monitoring epicyclic gear systems comprising epicyclic transmissions, gears and/or gear boxes. This will be described more in detail below.
- Epicyclic transmissions, gears and/or gear boxes may also be referred to as planetary transmissions, gears and/or gear boxes.
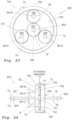
- FIG 23 is a front view illustrating an epicyclic gear system 700.
- the epicyclic gear system 700 comprises at least one or more outer gears 702, 703, 704 revolving around a central gear 701.
- the outer gears 702, 703, 704 are commonly referred to as planet gears, and the central gear 701 is commonly referred to as a sun gear.
- the epicyclic gear system 700 may also incorporate the use of an outer ring gear 705, commonly also referred to as an annulus.
- the planet gears 702, 703, 704 may comprise P number of teeth 707, the sun gear 701 may comprise S number of teeth 708, and the annulus 705 may comprise A number of teeth 706.
- the A number of teeth on the annulus 705 are arranged to mesh with the P number of teeth on the planet gears 702, 703, 704, which in turn are also arranged to mesh with the S number of teeth on the sun gear 701.
- the sun gear 701 is normally larger than the planet gears 702, 703, 704, whereby the illustration shown in Figure 23 should not be construed as limiting in this respect.
- the analysis apparatus 14 may also distinguish between detected conditions of different shafts and gears of the epicyclic gear system 700, as will become apparent from the following.
- one of these three basic components that is, the sun gear 701, the planet gears 702, 703, 704 or the annulus 705, is held stationary.
- One of the two remaining components may then serve as an input and provide power to the epicyclic gear system 700.
- the last remaining component may then serve as an output and receive power from the epicyclic gear system 700.
- the ratio of input rotation to output rotation is dependent upon the number of teeth in each gear, and upon which component is held stationary.
- Figure 24 is a schematic side view of the epicyclic gear system 700 of Figure 23 , as seen in the direction of the arrow SW in Figure 23 .
- An exemplary arrangement 800 including the epicyclic gear system 700, may comprise at least one sensor 10 and at least one analysis apparatus 14 according to the invention as described above.
- the arrangement 800 may, for example, be used as gear box for wind turbines.
- a rotatable shaft 801 has plural movable arms or carriers 801A, 801B, 801C arranged to engage the planet gears 702, 703, 704.
- the rotatable shaft 801 and the movable arms 801A, 801B, 801C and the planet gears 702, 703, 704 may serve as an input and provide power to the epicyclic gear system 700.
- the rotatable shaft 801 and the planet gears 702, 703, 704 may then rotate relative to the sun gear 701.
- the sun gear 701, which may be mounted on a rotary shaft 803, may thus serve as an output and receive power from the epicyclic gear system 700.
- the gear ratio G when used as a gear box in a wind turbine may be arranged such that the output rotation is about 5-6 times the input rotation.
- the planet gears 702, 703, 704 may be mounted, via bearings 7A, 7B and 7C, respectively, on the movable arms or carriers 801A, 801B and 801C (as shown in both Figures 23-24 ).
- the rotatable shaft 801 may be mounted in bearings 7D.
- the rotary shaft 803 may be mounted in bearings 7E
- the sun gear 701 may be mounted, via bearings 7F, on the rotary shaft 803.
- the at least one sensor 10 may be attached on or at a measuring point 12 of the fixed annulus 705 of the epicyclic gear system 700.
- the sensor 10 may also be arranged to communicate with the analysis apparatus 14.
- the analysis apparatus 14 may be arranged to analyse the condition of the epicyclic gear system 700 on the basis of measurement data or signal values delivered by the sensor 10 as described above in this document.
- the analysis apparatus 14 may include an evaluator 230 as above.
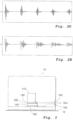
- Figure 25 illustrates an analogue version of an exemplary signal produced by and outputted by the pre-processor 200 (see Figure 5 or Figure 16 ) in response to signals detected by the at least one sensor 10 upon rotation of the epicyclic gear system 700 in the arrangement 800.
- the signal is shown for a duration of T REV , which represents signal values detected during one revolution of the rotatable shaft 801. It is to be understood that the signal delivered by the pre-processor 200 on port 260 (see Figure 5 and Figure 16 ) may be delivered to input 220 of the evaluator 230 (see Figure 8 or Figure 7 ).
- the amplitude or signal output of the signal increases as each of the planet gears 702, 703, 704 passes the measuring point 12 of the sensor 10 in the arrangement 800.
- These portions of the signal are referred to in the following as the high amplitude regions 702A, 703A, 704A, which may comprise high amplitude spikes 901. It can also be shown that the total amount of spikes 901, 902 in the signal over one revolution of the rotatable shaft 801, i.e. during the time period T REV , directly correlates to the amount of teeth on the annulus 705.
Landscapes
- Physics & Mathematics (AREA)
- General Physics & Mathematics (AREA)
- Acoustics & Sound (AREA)
- Measurement Of Mechanical Vibrations Or Ultrasonic Waves (AREA)
- Testing Of Devices, Machine Parts, Or Other Structures Thereof (AREA)
Applications Claiming Priority (6)
| Application Number | Priority Date | Filing Date | Title |
|---|---|---|---|
| SE0850178 | 2008-12-22 | ||
| US17550809P | 2009-05-05 | 2009-05-05 | |
| SE0950311 | 2009-05-05 | ||
| PCT/SE2009/051490 WO2010074645A1 (en) | 2008-12-22 | 2009-12-22 | An analysis system |
| EP17202870.6A EP3306294B1 (de) | 2008-12-22 | 2009-12-22 | Analysesystem |
| EP09799437.0A EP2370801B1 (de) | 2008-12-22 | 2009-12-22 | Analysesystem |
Related Parent Applications (2)
| Application Number | Title | Priority Date | Filing Date |
|---|---|---|---|
| EP09799437.0A Division EP2370801B1 (de) | 2008-12-22 | 2009-12-22 | Analysesystem |
| EP17202870.6A Division EP3306294B1 (de) | 2008-12-22 | 2009-12-22 | Analysesystem |
Publications (2)
| Publication Number | Publication Date |
|---|---|
| EP4530597A2 true EP4530597A2 (de) | 2025-04-02 |
| EP4530597A3 EP4530597A3 (de) | 2025-04-09 |
Family
ID=41821866
Family Applications (3)
| Application Number | Title | Priority Date | Filing Date |
|---|---|---|---|
| EP09799437.0A Active EP2370801B1 (de) | 2008-12-22 | 2009-12-22 | Analysesystem |
| EP17202870.6A Active EP3306294B1 (de) | 2008-12-22 | 2009-12-22 | Analysesystem |
| EP25154448.2A Pending EP4530597A3 (de) | 2008-12-22 | 2009-12-22 | Analysesystem |
Family Applications Before (2)
| Application Number | Title | Priority Date | Filing Date |
|---|---|---|---|
| EP09799437.0A Active EP2370801B1 (de) | 2008-12-22 | 2009-12-22 | Analysesystem |
| EP17202870.6A Active EP3306294B1 (de) | 2008-12-22 | 2009-12-22 | Analysesystem |
Country Status (6)
| Country | Link |
|---|---|
| US (4) | US8812265B2 (de) |
| EP (3) | EP2370801B1 (de) |
| DK (1) | DK2370801T3 (de) |
| ES (1) | ES2656404T3 (de) |
| NO (1) | NO2370801T3 (de) |
| WO (1) | WO2010074645A1 (de) |
Families Citing this family (25)
| Publication number | Priority date | Publication date | Assignee | Title |
|---|---|---|---|---|
| WO2010074643A1 (en) | 2008-12-22 | 2010-07-01 | S.P.M. Instrument Ab | An analysis system |
| DK2370801T3 (en) * | 2008-12-22 | 2018-01-22 | Spm Instr Ab | Analysesystem |
| CN102308190A (zh) | 2008-12-22 | 2012-01-04 | S.P.M.仪器公司 | 分析具有旋转部件的机器的状态的方法和系统 |
| US9964430B2 (en) | 2009-05-05 | 2018-05-08 | S.P.M. Instrument Ab | Apparatus and a method for analyzing the vibration of a machine having a rotating part |
| SE535559C2 (sv) | 2010-01-18 | 2012-09-25 | Spm Instr Ab | Förfarande och anordning för analys av tillståndet hos maskin med roterande del |
| EA027452B1 (ru) | 2011-07-14 | 2017-07-31 | С.П.М. Инструмент Аб | Способ и система для выполнения анализа состояния вращающейся части машины |
| FR2986070B1 (fr) * | 2012-01-24 | 2014-11-28 | Snecma | Systeme d'acquisition d'un signal vibratoire d'un moteur rotatif |
| WO2013115716A1 (en) * | 2012-01-30 | 2013-08-08 | S.P.M. Instrument Ab | Apparatus and method for analysing the condition of a machine having a rotating part |
| US20140052397A1 (en) * | 2012-08-20 | 2014-02-20 | Po Yin CHAO | Inrush current measuring device |
| US9772219B2 (en) | 2012-09-11 | 2017-09-26 | S.P.M. Instrument Ab | Apparatus for monitoring the condition of a machine |
| US10416126B2 (en) * | 2013-07-02 | 2019-09-17 | Computational Systems, Inc. | Machine fault prediction based on analysis of periodic information in a signal |
| ES2690077T3 (es) * | 2015-04-15 | 2018-11-19 | Siemens Aktiengesellschaft | Monitorización de una máquina con un componente de máquina rotatorio |
| DE102015216468B4 (de) * | 2015-08-28 | 2019-07-11 | Aktiebolaget Skf | Verfahren und Anordnung zur Zustandsüberwachung eines Lagers, das ein Planetenrad eines Planetengetriebes auf einem Planetenträger lagert |
| US10317275B2 (en) * | 2016-01-20 | 2019-06-11 | Simmonds Precision Products, Inc. | Vibration monitoring systems |
| CN106052844B (zh) * | 2016-05-19 | 2019-11-05 | 杭州电子科技大学 | 一种基于外部中断的振动信号调理电路 |
| US10914701B2 (en) | 2016-06-21 | 2021-02-09 | General Electric Company | Systems and methods for determining rotor deterioration in a dynamoelectric machine |
| CN106595841B (zh) * | 2016-12-16 | 2019-10-18 | 中国计量科学研究院 | 基于带通采样的外差式激光测振方法 |
| CN106895904B (zh) * | 2016-12-16 | 2020-02-11 | 中国计量科学研究院 | 一种高精度的外差式激光振动校准灵敏度相位测量方法 |
| US10816437B2 (en) * | 2017-03-22 | 2020-10-27 | General Electric Company | Contactless rotor state/speed measurement of x-ray tube |
| GB2566497B (en) * | 2017-09-15 | 2020-07-29 | Illinois Tool Works | Braking system for electromagnetic motors |
| US11460006B2 (en) | 2019-07-31 | 2022-10-04 | General Electric Company | Systems and methods for detecting damage in rotary machines |
| CN110441018B (zh) * | 2019-08-14 | 2021-07-13 | 清华大学 | 火工冲击响应数据时频分析方法 |
| US11243860B2 (en) * | 2019-10-01 | 2022-02-08 | Computational Systems, Inc. | Trend plot with multiple acquisitions |
| CN112414688B (zh) * | 2020-11-13 | 2022-01-04 | 海南电网有限责任公司海南输变电检修分公司 | 一种基于vmd-dtw的断路器振动信号降噪方法 |
| US20250183907A1 (en) * | 2023-11-30 | 2025-06-05 | Analog Devices International Unlimited Company | Signal measurement |
Citations (5)
| Publication number | Priority date | Publication date | Assignee | Title |
|---|---|---|---|---|
| US5633811A (en) | 1994-12-09 | 1997-05-27 | Computational Systems, Inc. | Hand held data collector and analyzer system |
| WO1998001831A1 (en) | 1996-07-05 | 1998-01-15 | Spm Instrument Ab | Condition analyzer |
| US6053047A (en) | 1998-09-29 | 2000-04-25 | Allen-Bradley Company, Llc | Determining faults in multiple bearings using one vibration sensor |
| WO2003062766A1 (en) | 2002-01-18 | 2003-07-31 | Spm Instrument Ab | An apparatus for analysing the condition of a machine |
| US7010445B2 (en) | 2002-01-23 | 2006-03-07 | Csi Technology, Inc. | Automated fault diagnosis device and method |
Family Cites Families (45)
| Publication number | Priority date | Publication date | Assignee | Title |
|---|---|---|---|---|
| US3554012A (en) | 1968-02-29 | 1971-01-12 | Iko Konsultbyron Ab | Method and arrangement for determining the mechanical state of machines |
| US4528852A (en) | 1982-10-21 | 1985-07-16 | Spm Instruments U.S. Inc. | Method and instrument for determining the condition of an operating bearing |
| JPS60195426A (ja) | 1984-03-16 | 1985-10-03 | Komatsu Ltd | 回転機構の故障診断方法 |
| DE3424692A1 (de) | 1984-07-05 | 1986-02-06 | Kletek Controllsysteme GmbH & Co KG, 2820 Bremen | Verfahren und messanordnung zur analyse von periodischen oder quasi periodischen signalen, insbesondere von schallsignalen bei maschinen und anlagen |
| GB2190198A (en) | 1986-04-28 | 1987-11-11 | Vipac Pty Ltd | Vibrational analysis system for a machine |
| US5258923A (en) | 1987-07-22 | 1993-11-02 | General Electric Company | System and method for detecting the occurrence, location and depth of cracks in turbine-generator rotors |
| JPH01127934A (ja) | 1987-11-12 | 1989-05-19 | Hitachi Ltd | 損傷診断装置 |
| US4912661A (en) | 1987-12-01 | 1990-03-27 | Hewlett-Packard Company | Tracking and resampling method and apparatus for monitoring the performance of rotating machines |
| JPH01178814A (ja) | 1988-01-08 | 1989-07-17 | Mitsubishi Heavy Ind Ltd | 信号の大局的構造認識装置 |
| GB2228088B (en) | 1988-12-16 | 1992-09-16 | Nippon Seiko Kk | Method and apparatus for detecting cracks in bearings |
| JPH04279826A (ja) | 1991-03-08 | 1992-10-05 | Nkk Corp | 可変速回転系異常診断方法及びその装置 |
| US5201292A (en) | 1991-08-30 | 1993-04-13 | Loral Aerospace Corp. | Apparatus and method for detecting vibration patterns |
| US5501105A (en) | 1991-10-02 | 1996-03-26 | Monitoring Technology Corp. | Digital signal processing of encoder signals to detect resonances in rotating machines |
| US5365787A (en) | 1991-10-02 | 1994-11-22 | Monitoring Technology Corp. | Noninvasive method and apparatus for determining resonance information for rotating machinery components and for anticipating component failure from changes therein |
| US5445028A (en) | 1992-09-18 | 1995-08-29 | Ametek Aerospace Products Inc. | Dynamic digital tracking filter |
| AU683506B2 (en) | 1993-11-09 | 1997-11-13 | Motorola, Inc. | Method and apparatus for detecting an input signal level |
| US5895857A (en) | 1995-11-08 | 1999-04-20 | Csi Technology, Inc. | Machine fault detection using vibration signal peak detector |
| US5852793A (en) * | 1997-02-18 | 1998-12-22 | Dme Corporation | Method and apparatus for predictive diagnosis of moving machine parts |
| JP3425331B2 (ja) | 1997-06-30 | 2003-07-14 | 株式会社東芝 | 電源装置 |
| US6351714B1 (en) | 1998-03-03 | 2002-02-26 | Entek Ird International Corporation | Order tracking signal sampling process |
| FI112972B (fi) | 1998-07-15 | 2004-02-13 | Abb Research Ltd | Laakerin kunnon arviointi |
| AUPQ152499A0 (en) | 1999-07-09 | 1999-08-05 | Commonwealth Scientific And Industrial Research Organisation | A system for monitoring acoustic emissions from a moving machine |
| US6351713B1 (en) | 1999-12-15 | 2002-02-26 | Swantech, L.L.C. | Distributed stress wave analysis system |
| US6332116B1 (en) | 2000-04-19 | 2001-12-18 | National Instruments Corporation | System and method for analyzing signals of rotating machines |
| US6591682B1 (en) | 2000-08-14 | 2003-07-15 | Pruftechnik Dieter Busch Ag | Device and process for signal analysis |
| US6801864B2 (en) | 2001-03-13 | 2004-10-05 | Ab Skf | System and method for analyzing vibration signals |
| US7136794B1 (en) | 2001-05-24 | 2006-11-14 | Simmonds Precision Products, Inc. | Method and apparatus for estimating values for condition indicators |
| TW579424B (en) | 2001-07-09 | 2004-03-11 | Shell Int Research | Vibration analysis for predictive maintenance in machinery |
| DE60238077D1 (de) | 2001-12-04 | 2010-12-02 | Skf Condition Monitoring Inc | Zyklische zeitmittelung zur maschinenüberwachung |
| US6668234B2 (en) | 2002-03-22 | 2003-12-23 | Abb Inc. | Method and apparatus for calculating the amplitude of a complex waveform associated with a rotating machine shaft after removing the running speed frequency |
| JP3880455B2 (ja) | 2002-05-31 | 2007-02-14 | 中国電力株式会社 | 転がり軸受の余寿命診断方法及びこの余寿命診断装置 |
| US7133801B2 (en) | 2002-06-07 | 2006-11-07 | Exxon Mobil Research And Engineering Company | System and methodology for vibration analysis and condition monitoring |
| US7243064B2 (en) | 2002-11-14 | 2007-07-10 | Verizon Business Global Llc | Signal processing of multi-channel data |
| EP1513254A1 (de) | 2003-08-26 | 2005-03-09 | Mitsubishi Electric Information Technology Centre Europe B.V. | Filter zur Dezimierung digitaler Signale um einen rationalen Faktor |
| JP2006113002A (ja) | 2004-10-18 | 2006-04-27 | Nsk Ltd | 機械設備の異常診断システム |
| US7640139B2 (en) * | 2004-10-18 | 2009-12-29 | Nsk Ltd. | Abnormality diagnosing system for mechanical equipment |
| NZ537244A (en) | 2004-12-16 | 2006-10-27 | Commtest Instr Ltd | Improvements in or relating to vibration analysis |
| EP2021966A4 (de) | 2006-05-17 | 2012-08-01 | Curtiss Wright Flow Control | System und verfahren zur probabilistischen spannungswellenanalyse |
| GB0714379D0 (en) | 2007-07-21 | 2007-09-05 | Monition Ltd | Tamping bank monitoring apparatus and method |
| US7761256B2 (en) * | 2007-12-21 | 2010-07-20 | General Electric Company | Method and system for use in analyzing vibrations of a variable speed rotating body |
| DK2085902T3 (en) | 2008-02-02 | 2018-03-12 | Siemens Ind Software Nv | Order tracking method and system |
| WO2010007645A1 (ja) | 2008-07-15 | 2010-01-21 | グローリー株式会社 | チケット発行装置、チケット処理装置及びチケットシステム |
| DK2370801T3 (en) | 2008-12-22 | 2018-01-22 | Spm Instr Ab | Analysesystem |
| CN102308190A (zh) * | 2008-12-22 | 2012-01-04 | S.P.M.仪器公司 | 分析具有旋转部件的机器的状态的方法和系统 |
| US8810396B2 (en) | 2008-12-22 | 2014-08-19 | S.P.M. Instrument Ab | Analysis system |
-
2009
- 2009-12-22 DK DK09799437.0T patent/DK2370801T3/en active
- 2009-12-22 EP EP09799437.0A patent/EP2370801B1/de active Active
- 2009-12-22 US US13/141,399 patent/US8812265B2/en active Active
- 2009-12-22 ES ES09799437.0T patent/ES2656404T3/es active Active
- 2009-12-22 NO NO09799437A patent/NO2370801T3/no unknown
- 2009-12-22 EP EP17202870.6A patent/EP3306294B1/de active Active
- 2009-12-22 EP EP25154448.2A patent/EP4530597A3/de active Pending
- 2009-12-22 WO PCT/SE2009/051490 patent/WO2010074645A1/en not_active Ceased
-
2014
- 2014-07-16 US US14/332,598 patent/US9200980B2/en active Active
-
2015
- 2015-11-23 US US14/949,472 patent/US9885634B2/en active Active
-
2017
- 2017-12-20 US US15/848,207 patent/US10809152B2/en active Active
Patent Citations (5)
| Publication number | Priority date | Publication date | Assignee | Title |
|---|---|---|---|---|
| US5633811A (en) | 1994-12-09 | 1997-05-27 | Computational Systems, Inc. | Hand held data collector and analyzer system |
| WO1998001831A1 (en) | 1996-07-05 | 1998-01-15 | Spm Instrument Ab | Condition analyzer |
| US6053047A (en) | 1998-09-29 | 2000-04-25 | Allen-Bradley Company, Llc | Determining faults in multiple bearings using one vibration sensor |
| WO2003062766A1 (en) | 2002-01-18 | 2003-07-31 | Spm Instrument Ab | An apparatus for analysing the condition of a machine |
| US7010445B2 (en) | 2002-01-23 | 2006-03-07 | Csi Technology, Inc. | Automated fault diagnosis device and method |
Also Published As
| Publication number | Publication date |
|---|---|
| US20180283987A1 (en) | 2018-10-04 |
| DK2370801T3 (en) | 2018-01-22 |
| US9200980B2 (en) | 2015-12-01 |
| NO2370801T3 (de) | 2018-04-21 |
| EP3306294C0 (de) | 2025-01-29 |
| EP3306294A1 (de) | 2018-04-11 |
| US8812265B2 (en) | 2014-08-19 |
| EP2370801B1 (de) | 2017-11-22 |
| WO2010074645A1 (en) | 2010-07-01 |
| EP2370801A1 (de) | 2011-10-05 |
| US9885634B2 (en) | 2018-02-06 |
| EP3306294B1 (de) | 2025-01-29 |
| US20140372079A1 (en) | 2014-12-18 |
| US10809152B2 (en) | 2020-10-20 |
| US20110295557A1 (en) | 2011-12-01 |
| ES2656404T3 (es) | 2018-02-27 |
| US20160146700A1 (en) | 2016-05-26 |
| EP4530597A3 (de) | 2025-04-09 |
Similar Documents
| Publication | Publication Date | Title |
|---|---|---|
| US12105498B2 (en) | Method and apparatus for analysing the condition of a machine having a rotating part | |
| EP3306294B1 (de) | Analysesystem | |
| EP2373971B1 (de) | Analysesystem | |
| EP2427745B1 (de) | Vorrichtung zur analyse der vibration einer maschine mit einem drehteil | |
| EP2370800B1 (de) | Analysesystem | |
| AU2016277551B2 (en) | Method and Apparatus for Analysing the Condition of a Machine Having a Rotating Part |
Legal Events
| Date | Code | Title | Description |
|---|---|---|---|
| PUAI | Public reference made under article 153(3) epc to a published international application that has entered the european phase |
Free format text: ORIGINAL CODE: 0009012 |
|
| STAA | Information on the status of an ep patent application or granted ep patent |
Free format text: STATUS: THE APPLICATION HAS BEEN PUBLISHED |
|
| REG | Reference to a national code |
Ref country code: DE Ref legal event code: R079 Free format text: PREVIOUS MAIN CLASS: G01M0099000000 Ipc: G01H0001000000 |
|
| PUAL | Search report despatched |
Free format text: ORIGINAL CODE: 0009013 |
|
| AC | Divisional application: reference to earlier application |
Ref document number: 2370801 Country of ref document: EP Kind code of ref document: P Ref document number: 3306294 Country of ref document: EP Kind code of ref document: P |
|
| AK | Designated contracting states |
Kind code of ref document: A2 Designated state(s): AT BE BG CH CY CZ DE DK EE ES FI FR GB GR HR HU IE IS IT LI LT LU LV MC MK MT NL NO PL PT RO SE SI SK SM TR |
|
| AK | Designated contracting states |
Kind code of ref document: A3 Designated state(s): AT BE BG CH CY CZ DE DK EE ES FI FR GB GR HR HU IE IS IT LI LT LU LV MC MK MT NL NO PL PT RO SE SI SK SM TR |
|
| RIC1 | Information provided on ipc code assigned before grant |
Ipc: G01M 13/028 20190101ALI20250306BHEP Ipc: G01M 13/045 20190101ALI20250306BHEP Ipc: G01M 99/00 20110101ALI20250306BHEP Ipc: G01H 1/00 20060101AFI20250306BHEP |
|
| STAA | Information on the status of an ep patent application or granted ep patent |
Free format text: STATUS: REQUEST FOR EXAMINATION WAS MADE |
|
| 17P | Request for examination filed |
Effective date: 20251007 |