EP4521135A2 - Bildverarbeitungsverfahren und magnetresonanzbildgebungssystem - Google Patents
Bildverarbeitungsverfahren und magnetresonanzbildgebungssystem Download PDFInfo
- Publication number
- EP4521135A2 EP4521135A2 EP24194968.4A EP24194968A EP4521135A2 EP 4521135 A2 EP4521135 A2 EP 4521135A2 EP 24194968 A EP24194968 A EP 24194968A EP 4521135 A2 EP4521135 A2 EP 4521135A2
- Authority
- EP
- European Patent Office
- Prior art keywords
- image data
- spatially
- resolved
- image
- transmit
- Prior art date
- Legal status (The legal status is an assumption and is not a legal conclusion. Google has not performed a legal analysis and makes no representation as to the accuracy of the status listed.)
- Pending
Links
Images








Classifications
-
- G—PHYSICS
- G01—MEASURING; TESTING
- G01R—MEASURING ELECTRIC VARIABLES; MEASURING MAGNETIC VARIABLES
- G01R33/00—Arrangements or instruments for measuring magnetic variables
- G01R33/20—Arrangements or instruments for measuring magnetic variables involving magnetic resonance
- G01R33/44—Arrangements or instruments for measuring magnetic variables involving magnetic resonance using nuclear magnetic resonance [NMR]
- G01R33/48—NMR imaging systems
- G01R33/54—Signal processing systems, e.g. using pulse sequences ; Generation or control of pulse sequences; Operator console
- G01R33/56—Image enhancement or correction, e.g. subtraction or averaging techniques, e.g. improvement of signal-to-noise ratio and resolution
- G01R33/5608—Data processing and visualization specially adapted for MR, e.g. for feature analysis and pattern recognition on the basis of measured MR data, segmentation of measured MR data, edge contour detection on the basis of measured MR data, for enhancing measured MR data in terms of signal-to-noise ratio by means of noise filtering or apodization, for enhancing measured MR data in terms of resolution by means for deblurring, windowing, zero filling, or generation of gray-scaled images, colour-coded images or images displaying vectors instead of pixels
-
- G—PHYSICS
- G06—COMPUTING OR CALCULATING; COUNTING
- G06T—IMAGE DATA PROCESSING OR GENERATION, IN GENERAL
- G06T5/00—Image enhancement or restoration
- G06T5/80—Geometric correction
-
- G—PHYSICS
- G01—MEASURING; TESTING
- G01R—MEASURING ELECTRIC VARIABLES; MEASURING MAGNETIC VARIABLES
- G01R33/00—Arrangements or instruments for measuring magnetic variables
- G01R33/20—Arrangements or instruments for measuring magnetic variables involving magnetic resonance
- G01R33/44—Arrangements or instruments for measuring magnetic variables involving magnetic resonance using nuclear magnetic resonance [NMR]
- G01R33/48—NMR imaging systems
- G01R33/54—Signal processing systems, e.g. using pulse sequences ; Generation or control of pulse sequences; Operator console
- G01R33/56—Image enhancement or correction, e.g. subtraction or averaging techniques, e.g. improvement of signal-to-noise ratio and resolution
- G01R33/565—Correction of image distortions, e.g. due to magnetic field inhomogeneities
- G01R33/5659—Correction of image distortions, e.g. due to magnetic field inhomogeneities caused by a distortion of the RF magnetic field, e.g. spatial inhomogeneities of the RF magnetic field
-
- G—PHYSICS
- G06—COMPUTING OR CALCULATING; COUNTING
- G06T—IMAGE DATA PROCESSING OR GENERATION, IN GENERAL
- G06T7/00—Image analysis
- G06T7/30—Determination of transform parameters for the alignment of images, i.e. image registration
- G06T7/32—Determination of transform parameters for the alignment of images, i.e. image registration using correlation-based methods
-
- G—PHYSICS
- G01—MEASURING; TESTING
- G01R—MEASURING ELECTRIC VARIABLES; MEASURING MAGNETIC VARIABLES
- G01R33/00—Arrangements or instruments for measuring magnetic variables
- G01R33/20—Arrangements or instruments for measuring magnetic variables involving magnetic resonance
- G01R33/24—Arrangements or instruments for measuring magnetic variables involving magnetic resonance for measuring direction or magnitude of magnetic fields or magnetic flux
- G01R33/246—Spatial mapping of the RF magnetic field B1
-
- G—PHYSICS
- G01—MEASURING; TESTING
- G01R—MEASURING ELECTRIC VARIABLES; MEASURING MAGNETIC VARIABLES
- G01R33/00—Arrangements or instruments for measuring magnetic variables
- G01R33/20—Arrangements or instruments for measuring magnetic variables involving magnetic resonance
- G01R33/44—Arrangements or instruments for measuring magnetic variables involving magnetic resonance using nuclear magnetic resonance [NMR]
- G01R33/48—NMR imaging systems
- G01R33/58—Calibration of imaging systems, e.g. using test probes, Phantoms; Calibration objects or fiducial markers such as active or passive RF coils surrounding an MR active material
- G01R33/583—Calibration of signal excitation or detection systems, e.g. for optimal RF excitation power or frequency
- G01R33/586—Calibration of signal excitation or detection systems, e.g. for optimal RF excitation power or frequency for optimal flip angle of RF pulses
-
- G—PHYSICS
- G06—COMPUTING OR CALCULATING; COUNTING
- G06T—IMAGE DATA PROCESSING OR GENERATION, IN GENERAL
- G06T2207/00—Indexing scheme for image analysis or image enhancement
- G06T2207/10—Image acquisition modality
- G06T2207/10016—Video; Image sequence
-
- G—PHYSICS
- G06—COMPUTING OR CALCULATING; COUNTING
- G06T—IMAGE DATA PROCESSING OR GENERATION, IN GENERAL
- G06T2207/00—Indexing scheme for image analysis or image enhancement
- G06T2207/10—Image acquisition modality
- G06T2207/10072—Tomographic images
- G06T2207/10088—Magnetic resonance imaging [MRI]
Definitions
- Embodiments described herein relate generally to an image processing method and a magnetic resonance imaging system.
- This disclosure relates to a method, system, and computer program product for obtaining a corrected magnetic resonance imaging (MRI) image, and, in one embodiment, to a method, system, and computer product for obtaining a corrected MRI image by performing a series of MRI sequences using at least two RF different transmit RF parameters to obtain first and second sets of image data in a single MRI examination.
- MRI magnetic resonance imaging
- a patient When using MRI systems to perform imaging on a patient, a patient enters the gantry of an MRI system and is subjected to an examination including a series of scan sequences (shown in FIG. 1 as scan sequence 1 to scan sequencer. Having finished the series of scan sequences in the patient exam, a patient exits the MRI system.
- Known MRI systems perform an optional per-patient calibration to determine a reference RF transmitter gain level (RFL) prior to beginning an examination as shown in the optional pre-scan sequence 102 of FIG. 1 .
- the RFL is calculated during a pre-scan process across the entirety of at least one slice of a set of 2D slices, thereby computing an RFL representative of the average of voxels within the slice.
- the reference RFL value subsequently is used to calculate the transmitter gain values to achieve the intended B1 amplitude for all subsequent RF pulses in the MR scan sequences.
- the B1 amplitude of the RF pulses has a direct relationship with the flip angle of the RF pulse, and the flip angle of the RF pulse is a primary determinant of MR signal intensity and image contrast.
- the RFL value has a known, and direct relationship, to B1 field (transmission magnetic field) and flip angle.
- B1 field transmission magnetic field
- the RFL can be directly and simply calculated.
- RFL is too low, there will be 'undertipping' which is a condition in which the data obtained is obtained when the flip angle is below expectation.
- RFL is too high, there will be 'overtipping' which is a condition in which the data obtained is obtained when the flip angle is above expectation. Both undertipping and overtipping can result in reduced image quality in the resulting MRI images (e.g., dark spots in an image).
- B1 inhomogeneity can result in image signal inhomogeneity.
- ⁇ B1 B1 inhomogeneity
- the transmitter magnetic field is non-uniform, non-uniform flip angles and non-uniform signal variations can occur. This effect is pronounced at higher field strengths (e.g., 3T or higher) where B1 variation is greater due to dielectric effects. Variations in effective B1 levels result in darker or lighter regions in images as compared with regions of the image that had the target B1 level.
- the expected flip angle of the excitation pulse is ⁇ /2 and the expected flip angle of the refocusing pulse is ⁇ .
- an image processing method comprises obtaining a first set of image data and a second set of image data both generated by performing a series of MRI sequences using a first transmit RF parameter and a second transmit RF parameter different from each other; calculating a correlation map representing a correlation between the first set of image data and the second set of image data, from the first set of image data and the second set of image data; and correcting the first set of image data using the correlation map to obtain a corrected image.
- the correlation map may be a ratio map based on a ratio of pixel values in the first set of image data and pixel values in the second set of image data.
- the corrected image may be obtained by correcting the first set of image data using the ratio map.
- Correcting the first set of image data using the ratio map may comprise correcting the first set of image data using the correlation map raised to an exponential correction factor.
- the first transmit RF parameter and the second transmit RF parameter may represent a first RF transmitter gain level and a second RF transmitter gain level different from each other.
- the first transmit RF parameter and the second transmit RF parameter maybe selected by obtaining spatially-resolved B1 amplitude measurements and performing at least two spatially-resolved analyses on the spatially-resolved B1 amplitude measurements.
- Performing the at least two spatially-resolved analyses may comprise using a histogram to obtain a first sub-set and a second sub-set of spatially-resolved B1 amplitude measurements.
- Selecting the first transmit RF parameter and the second transmit RF parameter may comprise selecting the first transmit RF parameter by using the first sub-set of spatially-resolved B1 amplitude measurements and selecting the second transmit RF parameter by using the second sub-set of spatially-resolved B1 amplitude measurements.
- Using the histogram to obtain the first sub-set and the second sub-set of spatially-resolved B1 amplitude measurements may correspond to using the histogram (a) to obtain, as the first sub-set of spatially-resolved B1 amplitude measurements, a lowest first percentage of the spatially-resolved B1 amplitude measurements and (b) to obtain, as the second sub-set of spatially-resolved B1 amplitude measurements, a highest second percentage of the spatially-resolved B1 amplitude measurements.
- the spatially-resolved B1 amplitude measurements may be obtained by a Bloch-Siegert shift sequence or by Actual Flip Angle imaging.
- Correcting the first set of image data using the correlation map may comprise correcting the first set of image data by applying the correlation map to a correlation-based correction function modeling an inverse of a B1 model representing how the first set of image data and the second set of image data were obtained.
- Correcting the first set of image data using the correlation map may comprise correcting the first set of image data using the correlation map when the correlation map is larger than a threshold value.
- the first set of image data may be obtained at a first resolution and the second set of image data may be obtained at a second resolution different than the first resolution.
- the correlation map may be calculated from the first set of image data and the second set of image data at a lower resolution than the first resolution and the second resolution.
- Correcting the first set of image data using the correlation map comprises correcting the first set of image data using a neural network that receives the correlation map calculated at the lower resolution.
- a transmit-RF-parameter determining method comprises obtaining spatially-resolved B1 amplitude measurements; obtaining at least two sub-sets of the spatially-resolved B1 amplitude measurements by performing at least two analyses on the obtained spatially-resolved B1 amplitude measurements; determining at least two transmit RF parameters for use in a series of MRI sequences on the basis of the at least two sub-sets of the spatially-resolved B1 amplitude measurements; and storing the at least two transmit RF parameters.
- a magnetic resonance imaging (MRI) system comprises a gantry, at least one RF transmitter coil, and an RF transmitter coil controller.
- the RF transmitter coil controller is configured to obtain a first set of image data and a second set of image data both generated by performing a series of MRI sequences using a first transmit RF parameter and a second transmit RF parameter different from each other; calculate a correlation map representing a correlation between the first set of image data and the second set of image data, from the first set of image data and the second set of image data; and correct the first set of image data using the correlation map to obtain a corrected image.
- an image processing apparatus comprising processing circuitry.
- the processing circuitry is configured to obtain a first set of image data and a second set of image data both generated by performing a series of MRI sequences using a first transmit RF parameter and a second transmit RF parameter different from each other; calculate a correlation map representing a correlation between the first set of image data and the second set of image data, from the first set of image data and the second set of image data; and correct the first set of image data using the correlation map to obtain a corrected image.
- the embodiments are mainly described in terms of particular processes, systems and computer program products provided in particular implementations. However, the processes, systems, and computer program products will operate effectively in other implementations. Phrases such as ⁇ an embodiment', ⁇ one embodiment', and ⁇ another embodiment' can refer to the same or different embodiments.
- the embodiments will be described with respect to methods and compositions having certain components. However, the methods and compositions can include more or less components than those shown, and variations in the arrangement and type of the components can be made without departing from the scope of the present disclosure.
- FIG. 2 is a block diagram illustrating an overall configuration of an MRI system (MRI apparatus) 1 according to the first embodiment.
- the MRI system 1 of the first embodiment includes a gantry 100, a control cabinet 300, a console 400, and a bed 500.
- the gantry 100 includes a static magnetic field magnet 10, a gradient coil assembly 11, and a whole body (WB) coil 12, and these components are housed in a cylindrical housing.
- the bed 500 includes a bed body 50 and a table 51.
- the MRI apparatus 1 includes at least one RF coil 20 to be disposed close to an object.
- the control cabinet 300 includes three gradient coil power supplies 31 (31 x for an X-axis gradient coil power supply, 31 y for a Y-axis gradient coil power supply, and 31 z for a Z-axis gradient coil power supply), an RF receiver 32, an RF transmitter 33, and a sequence controller 34.
- the static magnetic field magnet 10 of the gantry 100 is substantially in the form of a cylinder, and generates a static magnetic field inside a bore, which is a space formed inside the cylindrical structure and serves as an imaging region of the object (for example, a patient).
- the static magnetic field magnet 10 includes a superconducting coil inside, and the superconducting coil is cooled down to an extremely low temperature by liquid helium.
- the static magnetic field magnet 10 generates a static magnetic field by supplying the superconducting coil with an electric current to be provided from a static magnetic field power supply (not shown) in an excitation mode. Afterward, the static magnetic field magnet 10 shifts to a permanent current mode, and the static magnetic field power supply is separated. Once it enters the permanent current mode, the static magnetic field magnet 10 continues to generate a strong static magnetic field for a long time, for example, over one year.
- the static magnetic field magnet 10 may be configured as a permanent magnet.
- the gradient coil assembly 11 is also substantially in the form of a cylinder and is fixed to the inside of the static magnetic field magnet 10.
- the gradient coil assembly 11 has a three-channel structure and includes an X-axis gradient coil 11 x, a Y-axis gradient coil 11 y, and a Z-axis gradient coil 11 z (not shown individually).
- the X-axis gradient coil 11 x is supplied with electric current from the X-axis gradient magnetic field power supply 31 x so as to generate a gradient magnetic field Gx in the X-axis direction.
- the Y-axis gradient coil 11 y is supplied with electric current from the Y-axis gradient magnetic field power supply 31 y so as to generate a gradient magnetic field Gy in the Y-axis direction.
- the Z-axis gradient coil 11 z is supplied with electric current from the Z-axis gradient magnetic field power supply 31 z so as to generate a gradient magnetic field Gz in the Z-axis direction.
- the bed body 50 of the bed 500 can move the table 51 in the vertical direction and in the horizontal direction.
- the bed body 50 moves the table 51 with an object placed thereon to a predetermined height before imaging. Afterward, when the object is imaged, the bed body 50 moves the table 51 in the horizontal direction so as to move the object to the inside of the bore.
- the WB body coil 12 is shaped substantially in the form of a cylinder so as to surround the object, and is fixed to the inside of the gradient coil assembly 11.
- the WB coil 12 applies RF pulses to be transmitted from the RF transmitter 33 to the object, and receives magnetic resonance (MR) signals emitted from the object due to excitation of hydrogen nuclei.
- the WB body coil 12 may be referred to as a transmitter coil.
- the RF coil 20 receives MR signals emitted from the object at a position close to the object.
- the RF coil 20 includes plural coil elements, for example.
- there are various RF coils 20 such as for the head, for the chest, for the spine, for the lower limbs, and for the whole body.
- FIG. 2 illustrates the RF coil 20 for imaging the chest.
- the RF transmitter 33 transmits an RF pulse to the WB coil 12 on the basis of an instruction from the sequence controller 34.
- the RF receiver 32 detects MR signals received by the WB coil 12 and/or the RF coil 20, and transmits raw data obtained by digitizing the detected MR signals to the sequence controller 34.
- the sequence controller 34 performs a scan of the object by driving the gradient coil power supplies 31, the RF transmitter 33, and the RF receiver 32 under the control of the console 400.
- the sequence controller 34 receives the raw data from the RF receiver 32 by performing the scan, the sequence controller 34 transmits the received raw data to the console 400.
- the sequence controller 34 includes processing circuitry (not shown).
- This processing circuitry is configured as, for example, a processor for executing predetermined programs or configured as hardware such as a field programmable gate array (FPGA) and an application specific integrated circuit (ASIC).
- FPGA field programmable gate array
- ASIC application specific integrated circuit
- the console 400 is configured as a computer that includes processing circuitry 40, a memory 41, a display 42, and an input interface 43.
- the memory 41 is a recording medium including a read-only memory (ROM) and a random access memory (RAM) in addition to an external memory device such as a hard disk drive (HDD) and an optical disc device.
- the memory 41 stores various programs to be executed by a processor of the processing circuitry 40 as well as various data and information.
- the display 42 is a display device such as a liquid crystal display panel, a plasma display panel, and an organic EL panel.
- the input interface 43 includes various devices for an operator to input various data and information, and is configured of, for example, a mouse, a keyboard, a trackball, and/or a touch panel.
- the processing circuitry 40 is, for example, a circuit provided with a central processing unit (CPU) and/or a special-purpose or general-purpose processor.
- the processor implements various functions described below by executing the programs stored in the memory 41.
- the processing circuitry 40 may be configured of hardware such as an FPGA and an ASIC. The various functions described below can also be implemented by such hardware. Additionally, the processing circuitry 40 can implement the various functions by combining hardware processing and software processing based on its processor and programs.
- the processing circuitry 40 may be referred to as an RF transmitter coil controller.
- the console 400 controls the entirety of the MRI apparatus 1 with these components. Specifically, the console 400 accepts imaging conditions such as the type of pulse sequence, various information, and an instruction to start imaging to be inputted by a user such as a medical imaging technologist through the input interface 43 including a mouse and a keyboard.
- the processing circuitry 40 causes the sequence controller 34 to perform a scan on the basis of the inputted imaging conditions and reconstructs an image on the basis of the raw data transmitted from the sequence controller 34, i.e., digitized MR signals.
- the reconstructed image is displayed on the display 42 and is stored in the memory 41.
- control cabinet 300 the gantry 100, and the bed 500 (i.e., all the components except the console 400) constitute an imaging unit or scanner.
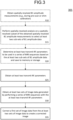
- FIG. 3 illustrates a flowchart showing an exemplary method 305 including exemplary processing steps for obtaining a corrected MRI image by using at least two different transmit RF parameters (e.g., first transmit RF parameter and second transmit RF parameter) to obtain at least two sets of image data (e.g., first set of image data and second set of image data).
- Method 305 includes core steps 325, 330, and 335 and a number of other optional steps (shown in dashed boxes) that will be described in greater detail below.
- At least two transmit RF parameters are obtained (e.g., read from memory or storage (either by themselves or as part of the scan sequences for obtaining series of MRI sequences)) for imaging a same portion of an object to be imaged (e.g., for imaging a same slice of a patient).
- the at least two transmit RF parameters for obtaining respective first and second sets of image data can be, for example, respective first and second RFLs , first and second RF gains, first and second RF phases, and first and second RF shim settings.
- the at least two transmit RF parameters represent a first RF transmitter gain level and a second RF transmitter gain level. The first RF transmitter gain level and the second RF transmitter gain level differ from each other.
- Control passes from step 325 to step 330 so that at least two sets of image data can be obtained that were generated by performing the series of MRI sequences using the at least two transmit RF parameters.
- control passes to step 335, and a first set of the at least two sets of image data is corrected to create a corrected MRI data image, thereby completing the method 305.
- the at least two transmit RF parameters can be obtained using several different techniques.
- the method 305 obtains the at least two transmit RF parameters using illustrated steps 310-320.
- the MRI apparatus 1 (or a remote system communicating with and working in conjunction with the MRI apparatus 1) obtains spatially-resolved B1 amplitude measurements of an object (e.g., a person to be imaged) (e.g., at an initial RFL set in accordance with a set of MRI sequences to be obtained of the object).
- Exemplary processes for obtaining spatially-resolved B1 amplitude data include, but are not limited to, performing Bloch-Siegert Shift (BSS) processing, Actual Flip angle Imaging (AFI), Dual Refocusing Echo Acquisition Mode (DREAM), Double Angle Method (DAM) processing, Phase-sensitive (PS) processing, and Saturation recovery (SR) processing.
- BSS Bloch-Siegert Shift
- AFI Actual Flip angle Imaging
- DREAM Dual Refocusing Echo Acquisition Mode
- DAM Double Angle Method
- PS Phase-sensitive
- SR Saturation recovery
- the spatially-resolved B1 amplitude measurements represent, for example, a B1 map.
- the B1 map include a one-dimensional B1 map representing one-dimensional B1 distribution, a two-dimensional B1 map representing two-dimensional B1 distribution, and a three-dimensional B1 map representing three-dimensional B1 distribution.
- the one-dimensional B1 map corresponds to the 1D projection.
- the two-dimensional B1 map corresponds to the 2D slice.
- the three-dimensional B1 map corresponds to the 3D volume.
- the processing circuitry 40 obtains spatially-resolved B1 amplitude measurements obtained by using at least one RF parameter.
- the at least one RF parameter may be, for example, a flip angle.
- the at least one RF parameter may be a shim setting.
- the at least one RF parameter may be a RF transmitter gain level.
- the sequence controller 34 may obtain the spatially-resolved B1 amplitude measurements, rather than the processing circuitry 40.
- the processing circuitry 40 obtains the spatially-resolved B1 amplitude measurements (B1 values) using a Bloch-Siegert sequence, as described above.
- the processing circuitry 40 may obtain the spatially-resolved B1 amplitude measurements by Actual Flip Angle imaging, as described above.
- the processing circuitry 40 may obtain a 1D projection, a 2D slice, or a 3D volume.
- MRI magnetic resonance imaging
- Obtain is also intended to mean that a portion of the information is obtained from one source and then augmented with additional information or modified such that the combined/modified information is then accessible to the MRI system 1 (e.g., stored in the memory 41 or in a storage system of the MRI system 1).
- the series of MRI sequences may be obtained from one source (memory 41 or an external device) and then augmented with additional information such as spatially-resolved B1 amplitude measurement sequences.
- the series of MRI sequences may be obtained from one source (memory 41 or an external device) and then modified to change the at least one initial RF imaging parameter.
- FIG. 4A is a representation of spatially-resolved B1 amplitude data obtained (e.g., using BSS or AFI methods of B1 mapping) when determining B1 amplitude distributions that would occur when imaging a pair of human thighs at an initial RFL level (i.e., the RFL such that the average B1 value across a region being imaged is expected to be 1.0).
- a complete B1 amplitude map (B1 map) is obtained that corresponds to a particular cross-section of the object (e.g., person) to be imaged, although less than a complete B1 amplitude map for the cross-section also may be obtained.
- the B1 amplitude data may be obtained during a portion of a pre-scan that performs B1 shim calibration and, therefore, does not extend the processing time of the MRI process as a whole.
- a fast projection may be used and may require only a short scan time (e.g., approximately 60-80 ms).
- the B1 amplitude data may be obtained after a portion of a pre-scan that performs B1 shim calibration so that the B1 amplitude data is as consistent as possible prior to obtaining the spatially-resolved B1 amplitude measurements.
- complete or partial B1 amplitude maps also may be obtained for additional cross-sections.
- FIG. 4B is an MRI image of the pair of thighs of FIG. 4A when imaged at the initial RFL.
- FIG. 4B includes an annotation '-' on the top right portion of the thigh shown on the left-hand side ("the left thigh") to accentuate a shadow on the left thigh.
- the shadow corresponds to the blue and green portions of the B1 map of FIG. 4A indicating that the B1 amplitude data is not the B1 target value of 1.0 (shown in yellow in FIG. 4A ) but a value less than the B1 target value that causes signal distortion due to undertipping.
- the green portions correspond to approximately 80% of the target B1, and the blue portions correspond to about 60% of the target B1 with the amplitude values decreasing towards the center of the blue portion and increasing going away from the center of the blue portion.
- the blue and green portions of FIG. 4A correspond to the darker portions of the greyscale B1 amplitude map of FIG. 4I .
- Those regions are highlighted in the annotated B1 map of FIG. 4J where the outer white ovals correspond to the green regions having B1 values of approximately 80% of the target B1, and the inner white ovals correspond to the blue regions having B1 values of approximately 60% of the target B1.
- the amplitude values decrease towards the center of the inner oval and increase going away from the center of the inner oval.
- FIGS. 4C-4H are MRI images of the pair of thighs of FIGS. 4A and 4B when imaged at progressively higher RFLs than the initial RFL (i.e., at 1.05, 1.10, 1.15, 1.20, 1.25, and 1.30 times higher than the initial RFL).
- the portion of the image that has signal distorted by undertipping in FIG. 4B is improved (i.e., has less of a shadow) as compared with FIG. 4B , but a shadow still remains.
- a spatially-resolved analysis is performed on the obtained spatially-resolved B1 amplitude data, at least two sub-sets of B1 data are obtained as described in greater detail below.
- Exemplary sub-sets include, but are not limited to, a first sub-set representing a first B1 parameter range such as locations having low B1 values and a second sub-set representing a first B1 parameter range such as locations having high B1 values.
- the received spatially-resolved B1 amplitude measurements are quantized, optionally filtered, and then subjected to histogram processing in order to produce the at least two sub-sets. For example, through the histogram processing, obtained B1 amplitude data is quantized into different values that are used to calculate the histogram.
- Performing at least two spatially-resolved analyses corresponds to, for example, obtaining the first sub-set and the second sub-set of spatially-resolved B1 amplitude measurements by using the histogram, as described above.
- the histogram represents, for example, a B1-value frequency distribution.
- the B1 amplitude value Prior to calculating the histogram, the B1 amplitude value may be subjected to filtering. For example, values below a particular threshold may be discarded as corresponding to air as opposed to tissue that is the portion that is of interest to the image reviewer (e.g., a medical professional such as a radiologist). Similarly, values that are beyond a statistical threshold amount (e.g., four standard deviations) from the average value of the B1 amplitude values may be discarded as being likely anomalous data. Furthermore, a location-based mask may be applied to the data such that any of the values from outside the mask area are discarded.
- a particular threshold may be discarded as corresponding to air as opposed to tissue that is the portion that is of interest to the image reviewer (e.g., a medical professional such as a radiologist).
- a statistical threshold amount e.g., four standard deviations
- a location-based mask may be applied to the data such that any of the values from outside the mask area are
- the mask area may be obtained via input from the operator of the MRI apparatus 1 or may be selected automatically by the apparatus based on factors, stored in memory 41, such as the type of region being imaged (e.g., thigh, prostate, skull, and pelvis), and/or patient-specific parameters (e.g., a weight of a patient that may affect the size/location of the region being imaged with respect to a center of an imaging area).
- the B1 amplitude data may be filtered and then quantized.
- the number of occurrences of quantized data values across the set of B1 amplitude values being processed are then determined from the histogram, and processing based on the calculated information can be performed in step 320.
- the set of B1 amplitude values being processed may be from at least 1D projection, from a partial or a complete slice (i.e., two-dimensional data), or from a partial or complete three-dimensional volume.
- the set of B1 amplitude values being processed may be obtained from the B1 map.
- step 320 spatially-resolved processing as a spatially-resolved analyzing process is performed to obtain at least two sub-sets of extreme values in the B1 amplitude data.
- the first sub-set is selected to be the lowest X% (e.g., 10% or 15%) of the B1 amplitude data and is used to increase the average B1 value that will be produced during imaging.
- X is considered as a first "extreme" threshold percentage.
- the second subset is selected to be the higher extreme values (e.g., the highest Y%, such as 10% or 15%) and is used to decrease the average B1 value that will be produced during imaging.
- Obtaining the first sub-set and the second sub-set corresponds to, for example, using the histogram to obtain, as the first sub-set, a lowest first percentage of the spatially-resolved B1 amplitude measurements and to obtain, as the second sub-set, a highest second percentage of the spatially-resolved B1 amplitude measurements.
- the image processing method determines the at least two transmit RF parameters to be used when creating a corrected MRI image.
- the first transmit RF parameter is calculated (or otherwise determined) based on the RFL that would result in an average B1 value of a predetermined target amount (B1 target ) (e.g., 1.0) that was obtained in step 310.
- B1 target a predetermined target amount (e.g., 1.0) that was obtained in step 310.
- the B1 target value is modified by dividing the B1 target value by the average value of the first sub-set which, in the exemplary embodiment, is the lowest X% of the B1 amplitude values of the histogram (where that average is referred to as "B1 low region ").
- NewRFL low region RFL initial * B1 target / B1 low region .
- the B1 target value is initially reduced by a reduction factor (RFx) (e.g., 0.85) so that very low B1 values in regions of low B1 values do not unduly modify the resulting image quality.
- RFx reduction factor
- the new low region RFL value is limited by a predetermined maximum percentage (maxfactor) using, for example, a maximum function (max(x,y)), where the result is no greater than "x".
- maxfactor max RFL initial * maxfactor
- RFL initial * B1 target / B1 low region max RFL initial * maxfactor
- the B1 target value is initially increased by a modification factor (MFx) (e.g., 1.2) so that very high B1 values in regions of high B1 values do not unduly modify the resulting image quality.
- MFx modification factor
- the new high region RFL value is limited by a predetermined minimum percentage (minfactor) using, for example, a minimum function (min(x,y)), where the result is at least "x".
- minfactor a predetermined minimum percentage
- min(x,y) a minimum function
- the processing circuitry 40 performs the at least two spatially-resolved analyses on the spatially-resolved B1 amplitude measurements to thereby select the first transmit RF parameter and the second transmit RF parameter. For example, the processing circuitry 40 selects the first transmit RF parameter using the first sub-set and selects the second transmit RF parameter using the second sub-set.
- the determined at least two transmit RF parameters are saved to memory or storage (either by itself or as part of the scan sequences for obtaining series of MRI sequences).
- steps 310-335 are performed in a single MRI apparatus 1.
- some steps e.g., steps 315 and 320
- the MRI apparatus 1 reads the stored at least two RF parameter values from the memory in step 325 (e.g., when obtaining the corresponding series of MRI sequences).
- the analyses on the received spatially-resolved B1 amplitude data is not limited to the processing described above with respect to steps 315 and 320.
- the histogram processing is replaced by a number of alternate processing methods described below.
- the histogram of a full slice is replaced with region of interest processing based on analysis (e.g., visual or automated inspection) of spatially-resolved B1 amplitude data in one-, two-, or three-dimensions.
- FIG. 5A is a spatially-resolved B1 amplitude map showing variations in B1 amplitude across a two-dimensional portion of an object to be imaged that can be obtained through the processing of step 310.
- the MRI operator can, using the input interface 43, select at least one region of interest in the B1 map.
- 5B illustrates an exemplary region of interest which the MRI operator has drawn on the B1 amplitude map to indicate the region(s) of interest (i.e., where the system should select the values to use in statistical processing to determine high and/or low regions to use to modify the initial RFL).
- FIG. 5C is a greyscale spatially-resolved B1 amplitude map showing variations in B1 amplitude across a two-dimensional portion of an object to be imaged that can be obtained through the processing of step 310 and can be used instead of the B1 map of FIG. 5A .
- the MRI operator can, using the input interface 43, select at least one region of interest in the B1 map.
- FIG. 5D illustrates an exemplary region of interest which the MRI operator has drawn on the B1 amplitude map to indicate the region(s) of interest (i.e., where the system should select the values to use in statistical processing to determine high and/or low regions to use to modify the initial RFL).
- FIG. 5B is an annotated version of the color spatially-resolved B1 amplitude map (B1 map) of FIG. 5A showing a circular region of interest drawn or selected by an MRI operator to be used to define the mask of where values are to be selected from to determine an amount of correction to be applied to an initial RF imaging parameter. Shapes other than a circle may be used to specify a two-dimensional region of interest.
- the shapes, the locations of the shapes, and the size of the shapes may be selected automatically by the apparatus based on factors such as the type of region being imaged (e.g., thigh, prostate, skull, and pelvis), and/or patient-specific parameters (e.g., a weight of a patient that may affect the size/location of the region being imaged with respect to a center of an imaging area).
- the two-dimensional region of interest is used like a mask to exclude unwanted data outside of the two-dimensional region of interest, even if it is along the 1D projection.
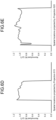
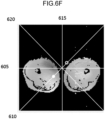
- the horizontal axis represents spatial locations projected by the projection 605.
- the horizontal axis represents spatial locations projected by the projection 610.
- the horizontal axis represents spatial locations projected by the projection 615.
- the horizontal axis represents spatial locations projected by the projection 620.
- the processing described herein can limit the B1 amplitude data to a particular region in a two-dimensional slice or in three-dimensional volume. For example, the processing can determine a smallest (non-air) value with the dataset as a whole and then select only those values that are within a specified distance (in two or three dimensions) of the lowest value to be used in the calculation of the new RFL. Similarly, a region-growing technique can be used on the two-dimensional slice or three-dimensional volume to determine all the values within a threshold amount that correspond to the hole that has the most low-value data values contiguously connected.
- the first set of image data (referred to generally as Image 1 ) is obtained using RFL1
- the second set of image data (referred to generally as Image 2 ) is obtained using RFL2.
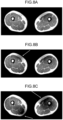
- Image 1 and Images are obtained at a same resolution (as shown in FIG. 8B and 8C ), and they are combined to produce a corrected image using Maximum Intensity Projection (MIP) on a pixel-by-pixel basis across the entirety of the composite image.
- MIP Maximum Intensity Projection
- Other image compositing functions also can be used, such as the average (mean, median, or mode) of pixel values.
- more than two sets of image data can be obtained each using its own respective, different transmit RF parameter(s), and each of the sets of image data can be used in the calculation of the corrected image.
- Image 1 and Images are not obtained at a same resolution.
- Image 1 and Images are obtained higher and lower resolutions, respectively.
- the resolution of Images may be lower than Image 1 (i.e., the spatial voxels used to generate Images are larger than those used to generate Imagei).
- the use of larger voxels reduces the additional scan time to obtain a second image.
- the lower-resolution image is blurrier than the higher-resolution image
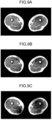
- a MIP combination of the two images results in a blurry image, as shown in FIG. 9A .
- at least one of the images preferably undergoes a resolution adjustment before performing the image combination as shown in FIGS. 7A and 7B .
- the processing circuitry 40 calculates a correlation map representing a correlation between the first set of image data and the second set of image data, from the first set of image data and the second set of image data.
- the correlation represents, for example, a similarity between pixel values, i.e., pixel-based B1 values.
- the correlation map represents, for example, a ratio of the first set of image data and the second set of image data (hereinafter, a ratio map).
- the correlation map may be, for example, a map representing differences between the first set of image data and the second set of image data.
- the correlation map is defined as a ratio map based on the ratio of pixel values in the first set of image data and pixel values in the second set of image data for the sake of specificity.
- a lower-resolution version of Image 1 (as shown in FIG. 10A ) (referred to as Image 1(lowres) ) is generated (e.g., by performing k-space data truncation on the original image data of Imagei). Then, on a pixel-by-pixel basis for all pixels (x,y) using Image 1(lowres) ( FIG. 10A ) and Images ( FIG.
- RatioMap x y Image 2 lowres x y Image 1 lowres x y if Image 2 lowres x y Image 1 lowres x y ⁇ 1.0 1.0 otherwise
- FIG. 10C An image representation of the ratio map generated from FIG. 10A and FIG. 10B is illustrated in FIG. 10C .
- Other non-linear combination of Image 1(lowres) and Image 2(lowres) are possible that avoid including contributions where Image 2(lowres) (x,y) ⁇ Image 1(lowres) (x,y).
- the processing circuitry 40 obtains a corrected image by correcting the first set of image data using the correlation map. Specifically, the processing circuitry 40 obtains a corrected image by correcting the first set of image data using the ratio map. When the correlation map is larger than the threshold value, the processing circuitry 40 corrects the first set of image data using the correlation map, as shown in Eq. 7 and Eq. 8.
- an approximated higher-resolution version of Images is created using at least one trained neural network.
- a first neural network is trained by receiving as an input low-resolution versions of images and as a target output high-resolution versions of the same input low-resolution images. Once trained, the low-resolution Images would be "upsampled" by the first neural network and applied to the same kind of image combining processing as was discussed above with respect to combining two full-resolution images.
- a second neural network is trained to perform a combination of upsampling and image compositing.
- the inputs to train the second neural network are a full-resolution image using a new lower range of RFL values (NewRFL low range ) and a low-resolution image using a new higher range of RFL values (NewRFL high range )
- the target outputs to train the second neural network are a MIP combination of full-resolution versions of the images obtained using NewRFL low range and NewRFL high range .
- the second neural network would directly produce the corrected image from a full-resolution image using NewRFL low range and a low-resolution image using NewRFL high range .
- additional embodiments utilize more than two images (e.g., 3 or more images) in the image correction process.
- the images can be either all full-resolution images or can be at least one higher-resolution image combined with at least one lower-resolution image.
- the three images would be acquired using NewRFL values calculated to bring a particular region close to a target B1 value (e.g., 1.0).
- a target B1 value e.g., 1.0
- one full-resolution image is obtained using RFL1, and two lower-resolution images are obtained using RFL2 and RFL3.
- RFL2 and RFL3 are chosen such that (1) RFL2 ⁇ RFL1, and RFL2 has good tip in regions where RFL1 has overtip and (2) RFL3 > RFL1 and RFL3 has good tip in regions where RFL1 has undertip.
- Corresponding RatioMaps are created for (RFL2/RFL1) and (RFL3/RFL1) as described above where the ratio is always at least 1.0.
- a neural network can be trained to produce a corrected image from three (or more) images where at least one image is a full-resolution image and at least one image is a lower-resolution image.
- the processing circuitry 40 obtains the first set of image data at a first resolution and obtains the second set of image data at a second resolution different from the first resolution.
- the processing circuitry 40 then calculates a correlation map from the first set of image data and the second set of image data at a lower resolution than the first resolution and the second resolution.
- the processing circuitry 40 may correct the first set of image data using a neural network that receives a correlation map calculated at the lower resolution.
- FIG. 11A is a color B1 amplitude map of a human pelvis.
- FIG. 11B is a ratio map illustrating the ratios (greater than one) of the pixels of FIGS. 11F to 11E when RFL2 (of FIG. 11F ) is 1.4 and RFL1 (of FIG. 11E ) is 0.80.
- the corrected pelvic image has more uniform brightness as compared to a conventional image of FIG. 11C where the image has an average B1 value of the target B1 value.
- FIG. 11G is a greyscale version of the color B1 amplitude map of FIG. 11A .
- FIG. 11G is a greyscale version of the color B1 amplitude map of FIG. 11A .
- the greyscale version of the B1 amplitude map has been annotated like the annotated B1 map of FIG. 4J where the outer white ovals correspond to the green regions having B1 values of approximately 80% of the target B1, and the inner white ovals correspond to the blue regions having B1 values of approximately 60% of the target B1.
- the amplitude values decrease towards the center of the inner ovals and increase going away from the center of the inner ovals.
- RFL1 and RFL2 may be obtained from a database of RFL values that are either constant for all imaging procedures or are varying based on run-time parameters such as the type of region being imaged (e.g., thigh, prostate, skull, and pelvis), the type of imaging to be performed on the region, and/or patient-specific parameters (e.g., a weight of a patient that may affect the size/location of the region being imaged with respect to a center of an imaging area).
- the RFL1 and RFL2 values are manually selected and entered by a user.
- the system can use any two values as long as RFL1 and RFL2 are not the same value. Either of the values can be greater than or equal or less than or equal to the RFL that provides an average B1 value of 1.0. In at least one embodiment, the values are selected without performing a pre-scan. As discussed above, the two sets of image data need not be at the same resolution.
- a ratio-map may be computed from the acquired at least two sets of image data as described above with respect to Eq. 7 and used to correct an image using a ratio-based correction function (RBCF) as discussed with respect to Eq. 8.
- the ratio-map may be either the same resolution as one or more of the sets of image data or may be of a lower resolution.
- the processing circuitry 40 corrects the first set of image data using the correlation map raised to the exponential correction factor ECF, as shown in Eq. 9.
- a CorrelationMap produces a pixel-by-pixel correlation of two images obtained using different RF parameters
- a RatioMap is one embodiment of such a CorrelationMap.
- an image is then corrected using a correlation -based correction function (CBCF) (such as an RBCF).
- CBCF correlation -based correction function
- CorrelationMaps can be calculated by a number of different functions, including, but not limited to, (a) a difference of two images and (b) a difference obtained by subtracting a logarithm of each image.
- FIG. 12 is an image of a pair of legs corrected using the ratio-based correction function of Eq. 9 with an ECF value of 1.5.
- ECF value 1.5.
- FIG. 12 can address the effects of undertipping and overtipping in some portions of the image. While image quality is improved, overcorrection may still occur (as highlighted by the upward facing arrows), and under-correction may still occur (as highlighted by the downward facing arrows). Other functions that those based on a unity gain or an exponential correction factor also are possible.
- Eq. 9 provides a first ratio-based correction function
- Another such correction function is based on a signal model based on the physics-based relationship between B1 and an image signal.
- Other effects e.g., T1 relaxation effects
- T1 relaxation effects can be included in the model as well.
- a ratio-based correction function can then be calculated by applying the ratio-to-B1 mapping function to the reciprocal of the B1 signal model (of FIG. 14A ).
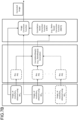
- FIG. 14D illustrates a ratio-based correction function (RBCF) that can be used in the system of FIG. 7B to correct the set of image data for RFL1 on a pixel-by-pixel basis by multiplying the pixel values in the first set of image data (corresponding to RFL1) by the ratio-based correction function having taken the ratio map from the first and second sets of image data.
- RBCF ratio-based correction function
- the processing circuitry 40 corrects the first set of image data by applying the correlation map to a correlation-based correction function (inverse model) modeling an inverse of a B 1 model representing how the first and second sets of image data were obtained.
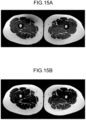
- FIG. 15A illustrates an original uncorrected image of a pair of human thighs.
- a ratio-based correction function on pixel-by-pixel basis (based on the ratio map of Eq. 7 obtained for the image)
- a corrected image can be obtained as shown in FIG. 15B .
- the darkened areas that resulted from undertipping in the original image were lightened and made more consistent with the other portions of the image without adding overtipping.
- FIG. 16A illustrates an original uncorrected image of a human pelvis.
- a ratio-based correction function on pixel-by-pixel basis based on the ratio map of Eq. 7 obtained for the image
- a corrected image can be obtained as shown in FIG. 16B .
- the darkened areas that resulted from undertipping in the original image were lightened and made more consistent with the other portions of the image without adding overtipping.
- the transmit-RF-parameter determining method comprises obtaining spatially-resolved B1 amplitude measurements; obtaining at least two sub-sets of the spatially-resolved B1 amplitude measurements by performing at least two analyses on the obtained spatially-resolved B1 amplitude measurements; determining at least two transmit RF parameters for use in a series of MRI sequences on the basis of the at least two sub-sets of the spatially-resolved B1 amplitude measurements; and storing the at least two transmit RF parameters.
- the procedure and effects of the processes in the transmit-RF-parameter determining method are the same as or similar to those of the embodiments, therefore, a description thereof is omitted.
- the image processing apparatus comprises processing circuitry configured to obtain a first set of image data and a second set of image data both generated by performing a series of MRI sequences using a first transmit RF parameter and a second transmit RF parameter different from each other; calculate a correlation map representing a correlation between the first set of image data and the second set of image data, from the first set of image data and the second set of image data; and correct the first set of image data using the calculated correlation map to obtain a corrected image.
- the image processing apparatus corresponds to, for example, the console 400.
- the procedure and effects of the processes of the image processing apparatus are the same as or similar to those of the embodiments, therefore, a description thereof is omitted.
- the correlation map can be generated at the same resolution from multiple sets of image data individually obtained using multiple preset RFL values, to generate a corrected image by multiplying one of the multiple sets of image data with a highest resolution by the generated ratio map. According to one embodiment, it is thus made possible to generate high-quality images with less overtipping and less undertipping.
Landscapes
- Physics & Mathematics (AREA)
- Engineering & Computer Science (AREA)
- General Physics & Mathematics (AREA)
- Theoretical Computer Science (AREA)
- Computer Vision & Pattern Recognition (AREA)
- General Health & Medical Sciences (AREA)
- Health & Medical Sciences (AREA)
- Nuclear Medicine, Radiotherapy & Molecular Imaging (AREA)
- Radiology & Medical Imaging (AREA)
- Signal Processing (AREA)
- High Energy & Nuclear Physics (AREA)
- Condensed Matter Physics & Semiconductors (AREA)
- Artificial Intelligence (AREA)
- Magnetic Resonance Imaging Apparatus (AREA)
Applications Claiming Priority (1)
| Application Number | Priority Date | Filing Date | Title |
|---|---|---|---|
| US18/462,785 US20250086761A1 (en) | 2023-09-07 | 2023-09-07 | Method, system, and computer program product producing a corrected magnetic resonance image |
Publications (2)
| Publication Number | Publication Date |
|---|---|
| EP4521135A2 true EP4521135A2 (de) | 2025-03-12 |
| EP4521135A3 EP4521135A3 (de) | 2025-06-25 |
Family
ID=92458300
Family Applications (1)
| Application Number | Title | Priority Date | Filing Date |
|---|---|---|---|
| EP24194968.4A Pending EP4521135A3 (de) | 2023-09-07 | 2024-08-16 | Bildverarbeitungsverfahren und magnetresonanzbildgebungssystem |
Country Status (3)
| Country | Link |
|---|---|
| US (1) | US20250086761A1 (de) |
| EP (1) | EP4521135A3 (de) |
| JP (1) | JP2025038869A (de) |
Family Cites Families (3)
| Publication number | Priority date | Publication date | Assignee | Title |
|---|---|---|---|---|
| KR101967745B1 (ko) * | 2012-09-11 | 2019-04-11 | 삼성전자주식회사 | 잡음 추정 장치 및 방법 |
| JP6394462B2 (ja) * | 2015-03-30 | 2018-09-26 | ソニー株式会社 | 情報処理装置、情報処理方法、及び、プログラム |
| US11175367B2 (en) * | 2018-08-10 | 2021-11-16 | General Electric Company | Methods and systems for estimating transmit attenuation for a magnetic resonance imaging scan |
-
2023
- 2023-09-07 US US18/462,785 patent/US20250086761A1/en active Pending
-
2024
- 2024-08-01 JP JP2024125880A patent/JP2025038869A/ja active Pending
- 2024-08-16 EP EP24194968.4A patent/EP4521135A3/de active Pending
Also Published As
| Publication number | Publication date |
|---|---|
| US20250086761A1 (en) | 2025-03-13 |
| JP2025038869A (ja) | 2025-03-19 |
| EP4521135A3 (de) | 2025-06-25 |
Similar Documents
| Publication | Publication Date | Title |
|---|---|---|
| US8693760B2 (en) | Medical imaging apparatus | |
| US8724875B2 (en) | Attenuation correction for PET or SPECT nuclear imaging systems using magnetic resonance spectroscopic image data | |
| JP5481061B2 (ja) | 磁気共鳴イメージング装置および磁気共鳴イメージング方法 | |
| US11147466B2 (en) | Magnetic resonance imaging apparatus and magnetic resonance image processing method | |
| US9709641B2 (en) | Magnetic resonance imaging apparatus, image processing apparatus, and susceptibility map calculation method | |
| US11747424B2 (en) | Magnetic resonance imaging apparatus, image processing apparatus, and image processing method | |
| US10031201B2 (en) | Method and apparatus for magnetic resonance imaging | |
| US9651644B2 (en) | Method and magnetic resonance system to acquire MR data in a predetermined volume segment of an examination subject | |
| US20150168525A1 (en) | Magnetic resonance imaging apparatus | |
| JP4969445B2 (ja) | 磁気共鳴イメージング装置 | |
| JPWO2014076808A1 (ja) | 磁気共鳴イメージング装置および定量的磁化率マッピング法 | |
| US11650281B2 (en) | Excitation region setting method and magnetic resonance imaging apparatus | |
| JP2016093494A (ja) | 磁気共鳴イメージング装置、画像処理装置及び画像処理方法 | |
| JP2015525601A (ja) | 磁気共鳴システム及び磁気共鳴方法 | |
| US9470772B2 (en) | Magnetic resonance image distortion correction with a reference volume | |
| EP4521135A2 (de) | Bildverarbeitungsverfahren und magnetresonanzbildgebungssystem | |
| JP2012029999A (ja) | 磁気共鳴イメージング装置及び輝度不均一補正方法 | |
| US20140028312A1 (en) | Method and apparatus for processing magnetic resonance image data | |
| EP4455710A1 (de) | Shimverfahren und shimvorrichtung | |
| US20250076422A1 (en) | Method, system, and computer program product utilizing spatially-resolved b1 amplitude-based tuning of magnetic resonance images | |
| JP3689509B2 (ja) | 画像補正処理方法 | |
| JP6843706B2 (ja) | 磁気共鳴イメージング装置及び拡散強調画像の補正方法 | |
| US11624796B2 (en) | Correction of TOF MR data | |
| US12450752B2 (en) | Motion correction of images corrupted by multiple motion sources | |
| US12540992B2 (en) | Data processing apparatus and MRI apparatus |
Legal Events
| Date | Code | Title | Description |
|---|---|---|---|
| PUAI | Public reference made under article 153(3) epc to a published international application that has entered the european phase |
Free format text: ORIGINAL CODE: 0009012 |
|
| STAA | Information on the status of an ep patent application or granted ep patent |
Free format text: STATUS: REQUEST FOR EXAMINATION WAS MADE |
|
| 17P | Request for examination filed |
Effective date: 20240816 |
|
| AK | Designated contracting states |
Kind code of ref document: A2 Designated state(s): AL AT BE BG CH CY CZ DE DK EE ES FI FR GB GR HR HU IE IS IT LI LT LU LV MC ME MK MT NL NO PL PT RO RS SE SI SK SM TR |
|
| PUAL | Search report despatched |
Free format text: ORIGINAL CODE: 0009013 |
|
| AK | Designated contracting states |
Kind code of ref document: A3 Designated state(s): AL AT BE BG CH CY CZ DE DK EE ES FI FR GB GR HR HU IE IS IT LI LT LU LV MC ME MK MT NL NO PL PT RO RS SE SI SK SM TR |
|
| RIC1 | Information provided on ipc code assigned before grant |
Ipc: G01R 33/58 20060101ALN20250516BHEP Ipc: G01R 33/24 20060101ALN20250516BHEP Ipc: G01R 33/565 20060101ALI20250516BHEP Ipc: G01R 33/56 20060101AFI20250516BHEP |