EP4431624A1 - Cu-ag alloy wire - Google Patents
Cu-ag alloy wire Download PDFInfo
- Publication number
- EP4431624A1 EP4431624A1 EP22892803.2A EP22892803A EP4431624A1 EP 4431624 A1 EP4431624 A1 EP 4431624A1 EP 22892803 A EP22892803 A EP 22892803A EP 4431624 A1 EP4431624 A1 EP 4431624A1
- Authority
- EP
- European Patent Office
- Prior art keywords
- mass
- alloy wire
- comparative example
- phases
- wire
- Prior art date
- Legal status (The legal status is an assumption and is not a legal conclusion. Google has not performed a legal analysis and makes no representation as to the accuracy of the status listed.)
- Pending
Links
Images

Classifications
-
- H—ELECTRICITY
- H01—ELECTRIC ELEMENTS
- H01B—CABLES; CONDUCTORS; INSULATORS; SELECTION OF MATERIALS FOR THEIR CONDUCTIVE, INSULATING OR DIELECTRIC PROPERTIES
- H01B1/00—Conductors or conductive bodies characterised by the conductive materials; Selection of materials as conductors
- H01B1/02—Conductors or conductive bodies characterised by the conductive materials; Selection of materials as conductors mainly consisting of metals or alloys
-
- C—CHEMISTRY; METALLURGY
- C22—METALLURGY; FERROUS OR NON-FERROUS ALLOYS; TREATMENT OF ALLOYS OR NON-FERROUS METALS
- C22C—ALLOYS
- C22C9/00—Alloys based on copper
-
- C—CHEMISTRY; METALLURGY
- C22—METALLURGY; FERROUS OR NON-FERROUS ALLOYS; TREATMENT OF ALLOYS OR NON-FERROUS METALS
- C22F—CHANGING THE PHYSICAL STRUCTURE OF NON-FERROUS METALS AND NON-FERROUS ALLOYS
- C22F1/00—Changing the physical structure of non-ferrous metals or alloys by heat treatment or by hot or cold working
- C22F1/08—Changing the physical structure of non-ferrous metals or alloys by heat treatment or by hot or cold working of copper or alloys based thereon
-
- H—ELECTRICITY
- H01—ELECTRIC ELEMENTS
- H01B—CABLES; CONDUCTORS; INSULATORS; SELECTION OF MATERIALS FOR THEIR CONDUCTIVE, INSULATING OR DIELECTRIC PROPERTIES
- H01B1/00—Conductors or conductive bodies characterised by the conductive materials; Selection of materials as conductors
- H01B1/02—Conductors or conductive bodies characterised by the conductive materials; Selection of materials as conductors mainly consisting of metals or alloys
- H01B1/026—Alloys based on copper
Definitions
- the present invention relates to Cu-Ag alloy wires.
- Cu alloy wires such as Cu-Sn wires, Cu-Cr wires and Cu-Ag wires tend to be used.
- the diameters of electric wires tend to be much smaller than before due to the miniaturization of electrical and electronic products, the space saving of electric wire installation regions, the increase in the number of signal wiring lines and the like.
- Cu-Ag alloy wires can be mentioned as copper alloy wires which have relatively high tensile strength and relatively high electrical conductivity.
- Patent Document 1 discloses a method for manufacturing a copper alloy which has high strength and high electrical conductivity by stretching the eutectic phase of Cu and Ag into a filament.
- Patent Document 2 discloses a Cu-Ag alloy fine wire in which a recrystallized aggregate structure is developed by heat treatment during a process and its strength is increased by subsequent high processing.
- Patent Document 2 since appropriate wire drawing process conditions are not adopted before heat treatment, embrittlement of a material progresses during the heat treatment, and thus it is difficult to reduce the diameter of the wire, with the result that its poor productivity does not realize a cost-competitive product.
- Patent Document 3 discloses a Cu-Ag alloy wire in which some of Ag crystal precipitates exist as very fine Ag grains, thereby the Cu-Ag alloy can have high tensile strength and high electrical conductivity.
- Patent Document 3 although a predetermined distribution of the Ag crystal precipitates is specified, even when the desired structure is obtained by tracing the presented manufacturing method, it is not always possible to obtain high tensile strength and high electrical conductivity in a well-balanced manner.
- an object of the present invention is to provide a Cu-Ag alloy wire which is excellent in bending fatigue resistance while having high tensile strength and high electrical conductivity.
- the present invention provides configurations as described below.
- the present invention it is possible to provide a Cu-Ag alloy wire which is excellent in bending fatigue resistance while having high tensile strength and high electrical conductivity. In this way, it is possible to achieve the miniaturization of electrical and electronic products, the space saving of electric wire installation regions and the increase in the number of signal wiring lines, which have not so far been realized, with the result that it is possible to contribute to an increase in added value for the miniaturization of electrical and electronic products.
- the Cu-Ag alloy wire according to the embodiment of the present invention includes Ag in a chemical composition of 1.0 to 6.0% by mass, the balance being Cu and an unavoidable impurity.
- the Cu-Ag alloy wire includes a parent phase including a plurality of Ag phases which are connected in a substantially longitudinal direction of the Cu-Ag alloy wire so as to be distributed linearly, and the parent phase has an average crystal grain size in a range of 10 to 60 nm, when measured in a cross section orthogonal to the longitudinal direction of the Cu-Ag alloy wire.
- the Cu-Ag alloy wire of the present invention contains 1.0 to 6.0% by mass of Ag.
- Ag is an essential additive component.
- Ag exists in a solid solution state in Cu serving as the parent phase (first phase) or in a state where Ag is crystallized from liquid and precipitated from solid as an Ag layer serving as a second phase when the Cu-Ag alloy wire is cast, and Ag achieves the action of solid solution strengthening or dispersion strengthening.
- the Ag content is less than 1.0% by mass, the precipitation of the Ag layers does not sufficiently occurs, a desired metal structure is not obtained and thus tensile strength is insufficient, with the result that sufficient bending fatigue resistance is not obtained.
- the Ag content exceeds 6.0% by mass, there is no difference from a case where the Ag content is equal to or less than 6.0% by mass in the effects of tensile strength and bending fatigue resistance, with the result that costs are increased by a cost corresponding to the increase in the amount of Ag added.
- the Ag content is set to 1.0 to 6.0% by mass so that even in an ultrafine Cu-Ag alloy wire in which its diameter is reduced, excellent tensile strength and bending fatigue resistance and satisfactory cost performance are obtained without electrical conductivity being impaired. Furthermore, when in a wide range of applications, more emphasis is placed on the balanced properties of electrical conductivity, the Ag content is more preferably 1.0 to 4.5% by mass.
- the Cu-Ag alloy wire in the embodiment of the present invention contains, as an optional additive component, 0.05 to 0.30% by mass of at least one component selected from the group consisting of Sn, Mg, Zn, In, Ni, Co, Zr and Cr.
- Each of these optional additive components is an element which mainly exists in a solid solution state in Cu serving as the parent phase and achieves the effect of solid solution strengthening or dispersion strengthening as in the case of Ag.
- the optional additive component is contained together with the Ag phases to exist, for example, as the second phase of a ternary or higher system such as a Cu-Ag-Zr system, with the result that the optional additive component contributes to further solid solution strengthening or dispersion strengthening.
- the Sn content When the Sn (tin) content is equal to or greater than 0.05% by mass, the Sn content contributes to enhancement of strength of the copper alloy wire whereas when the Sn content is equal to or less than 0.30% by mass, the electrical conductivity is not significantly impaired.
- the Sn content is equal to or greater than 0.05% by mass, preferably equal to or greater than 0.07% by mass, further preferably equal to or greater than 0.08% by mass and particularly preferably equal to or greater than 0.10% by mass.
- the Sn content is equal to or less than 0.30% by mass, more preferably equal to or less than 0.18% by mass, further preferably equal to or less than 0.15% by mass and particularly preferably equal to or less than 0.12% by mass.
- the Mg (magnesium) content When the Mg (magnesium) content is equal to or greater than 0.05% by mass, the Mg content contributes to enhancement of strength of the copper alloy wire, and the brittleness of the copper alloy wire is alleviated.
- the Mg content When the Mg content is equal to or less than 0.30% by mass, the electrical conductivity of the copper alloy wire and the manufacturability thereof at the time of casting are not significantly impaired.
- the Mg content is equal to or greater than 0.05% by mass, preferably equal to or greater than 0.07% by mass, further preferably equal to or greater than 0.08% by mass and particularly preferably equal to or greater than 0.10% by mass.
- the Mg content is equal to or less than 0.30% by mass, preferably equal to or less than 0.18% by mass, further preferably equal to or less than 0.15% by mass and particularly preferably equal to or less than 0.12% by mass.
- the Zn (zinc) content When the Zn (zinc) content is equal to or greater than 0.05% by mass, the Zn content contributes to enhancement of strength of the copper alloy wire, and the brittleness of the copper alloy wire is alleviated.
- the Zn content When the Zn content is equal to or less than 0.30% by mass, the electrical conductivity of the copper alloy wire is not significantly impaired.
- the Zn content is equal to or greater than 0.05% by mass, preferably equal to or greater than 0.07% by mass, further preferably equal to or greater than 0.08% by mass and particularly preferably equal to or greater than 0.10% by mass.
- the Zn content is equal to or less than 0.30% by mass, more preferably equal to or less than 0.25% by mass, further preferably equal to or less than 0.20% by mass and particularly preferably equal to or less than 0.15% by mass.
- the In content contributes to enhancement of strength of the copper alloy wire whereas when the In content is equal to or less than 0.30% by mass, the electrical conductivity is not significantly impaired.
- the In content is preferably equal to or greater than 0.05% by mass, preferably equal to or greater than 0.07% by mass, further preferably equal to or greater than 0.08% by mass and particularly preferably equal to or greater than 0.10% by mass.
- the In content is equal to or less than 0.30% by mass, preferably equal to or less than 0.18% by mass, further preferably equal to or less than 0.15% by mass and particularly preferably equal to or less than 0.12% by mass.
- the Ni (nickel) content When the Ni (nickel) content is equal to or greater than 0.05% by mass, the Ni content contributes to enhancement of strength of the copper alloy wire. When the Ni content is equal to or less than 0.30% by mass, the electrical conductivity of the copper alloy wire is not significantly impaired.
- the Ni content is equal to or greater than 0.05% by mass, preferably equal to or greater than 0.07% by mass, further preferably equal to or greater than 0.08% by mass and particularly preferably equal to or greater than 0.10% by mass.
- the Ni content is equal to or less than 0.30% by mass, preferably equal to or less than 0.25% by mass, further preferably equal to or less than 0.20% by mass and particularly preferably equal to or less than 0.15% by mass.
- the Co content contributes to enhancement of strength of the copper alloy wire whereas when the Co content is equal to or less than 0.30% by mass, the electrical conductivity is not significantly impaired.
- the Co content is equal to or greater than 0.05% by mass, preferably equal to or greater than 0.07% by mass, further preferably equal to or greater than 0.08% by mass and particularly preferably equal to or greater than 0.10% by mass.
- the Co content is equal to or less than 0.30% by mass, preferably equal to or less than 0.18% by mass, further preferably equal to or less than 0.15% by mass and particularly preferably equal to or less than 0.12% by mass.
- the Zr (zirconium) content When the Zr (zirconium) content is equal to or greater than 0.05% by mass, the Zr content contributes to enhancement of strength of the copper alloy wire, and the brittleness of the copper alloy wire is alleviated.
- the Zr content When the Zr content is equal to or less than 0.30% by mass, the electrical conductivity of the copper alloy wire and the manufacturability thereof at the time of casting are not significantly impaired.
- the Zr content is equal to or greater than 0.05% by mass, preferably equal to or greater than 0.07% by mass, further preferably equal to or greater than 0.08% by mass and particularly preferably equal to or greater than 0.10% by mass.
- the Zr content is equal to or less than 0.30% by mass, preferably equal to or less than 0.20% by mass, further preferably equal to or less than 0.15% by mass and particularly preferably equal to or less than 0.12% by mass.
- the Cr content contributes to enhancement of strength of the copper alloy wire whereas when the Cr content is equal to or less than 0.30% by mass, the electrical conductivity is not significantly impaired.
- the Cr content is equal to or greater than 0.05% by mass, preferably equal to or greater than 0.07% by mass, further preferably equal to or greater than 0.08% by mass and particularly preferably equal to or greater than 0.10% by mass.
- the Cr content is equal to or less than 0.30% by mass, preferably equal to or less than 0.18% by mass, further preferably equal to or less than 0.15% by mass and particularly preferably equal to or less than 0.12% by mass.
- 0.05 to 1.0% by mass of the optional additive components described above in total is contained.
- the content is less than 0.05% by mass, the content causes only a slight decrease in electrical conductivity but does not contribute to high tensile strength.
- the content exceeds 1.0% by mass, the tensile strength is significantly increased but the electrical conductivity is significantly lowered, with the result that it is impossible to maintain high electrical conductivity.
- it is preferable 0.05 to 1.0% by mass of the optional additive components described above in total is contained. 0.1 to 0.5% by mass of the optional additive components described above in total is further preferably contained.
- the remainder other than the components described above is Cu and an unavoidable impurity.
- Cu is the parent phase of the Cu-Ag alloy wire in the present invention, and Ag and the like which are essential additive components exist in a solid solution state or in a state where they precipitate as precipitates.
- the unavoidable impurity refers to an impurity having a content level which can be inevitably contained in the manufacturing process of the Cu-Ag alloy wire of the present invention.
- the unavoidable impurity may cause the electrical conductivity to be reduced depending on the content. Hence, with consideration given to the reduction in the electrical conductivity, it is preferable to suppress the content of the unavoidable impurity.
- Examples of the unavoidable impurity include Pb, S, P.
- the metal structure of the Cu-Ag alloy wire of the present invention will be described below.
- the Cu-Ag alloy wire according to the embodiment of the present invention includes, in the parent phase, a plurality of Ag phases which are connected in a substantially longitudinal direction of the Cu-Ag alloy wire so as to be distributed linearly, and the average crystal grain size of the parent phase when measured in a cross section orthogonal to the longitudinal direction of the Cu-Ag alloy wire is in a range of 10 to 60 nm.
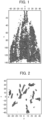
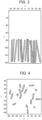
- FIGS. 1 to 4 are diagrams showing, by the 3DAP method, a state where in the Cu-Ag alloy wire according to the embodiment of the present invention, the Ag phases exist in the parent phase.
- the state where Ag exists in the parent phase of the Cu-Ag alloy wire in the metal structure can be observed by the 3DAP method.
- the 3DAP method is an analysis technique which enables three-dimensional composition analysis of nanoprecipitates and clusters in a metal or a semiconductor. The principle is as follows.
- a needle-shaped sample in which a tip portion is formed in a substantially conical shape and which has a diameter of about 100 nm is prepared and is thereafter carried into a three-dimensional atom probe field ion microscope (3DAP device), pulses of high voltage are applied and the needle-shaped sample is field-evaporated from the tip of the sample atom by atom.
- a pulsed laser of a specific wavelength is applied to the tip of the needle to assist the field evaporation, and thus it is possible to reduce the probability of destruction of the sample, improve a mass resolution and measure a semiconductor or an insulator.
- the pulse voltage and the laser are applied, and thus the time-of-flight and the position measurement of field-evaporated ions are detected by a two-dimensional position detector, with the result that two-dimensional coordinate positions of the ions are measured.
- the time from the point of evaporation at the tip of the needle to the point of arrival at the detector is measured, and thus analysis serving as time-of-flight mass spectrometry is also possible, with the result that it is possible to identify ion species which have arrived. Since the laser is repeatedly applied, and thus information on the two-dimensional coordinate positions of the ions and information on the direction of depth of the sample can be obtained, data analysis with consideration given to the shape of the tip of the needle is performed, and thus it is possible to obtain three-dimensional composition information.
- FIG. 1 shows data obtained by measuring, with a 3DAP device, Ag phases in a tip portion from a first position (position of 0 nm) corresponding to a tip to a second position (position of 140 nm) corresponding to the length of 140 nm in a substantially conical sample which was prepared from the Cu-Ag alloy wire (Ag concentration: 2.0 mass%) in the embodiment of the present invention, and shows the isoconcentration surface of the Ag phases having an Ag atomic concentration of 2.0 atomic% when the tip portion of the sample was measured from its side surface side.
- FIG. 2 shows data obtained by the same manner as in FIG.
- FIG. 1 shows the isoconcentration surface of the Ag phases having an Ag atomic concentration of 3.5 atomic% when a lower part of the tip portion of the sample from a third position (position of 80 nm) corresponding to the length of 80 nm from the first position to the second position (position of 140 nm) was measured from its upper surface side.
- FIG. 3 shows a diagram when the directions of extension of and the number of Ag phases were determined graphically from the results of the isoconcentration surface of the Ag phases shown in FIG. 2 .
- FIG. 4 shows a diagram when intervals (and the average diameter) between Ag phases adjacent to each other were determined graphically from the results of the isoconcentration surface of the Ag phases shown in FIG. 2 .
- an Ag threshold value of the same concentration as the Ag concentration was set, and a portion in which a concentration distribution exceeding this threshold value was confirmed was tentatively assumed to be the Ag phase.
- FIG. 1 an image diagram in which Ag phases having an atomic concentration exceeding the predetermined threshold value were viewed in the longitudinal direction was able to be measured.
- FIG. 2 an image diagram in which the Ag phases having the atomic concentration exceeding the predetermined threshold value were viewed in the direction of the cross section was able to be measured.
- the identification of the Ag phases here was performed by assigning Ag confirmed when 3.5 at% of the Ag isoconcentration surface in the cross section of the alloy wire was set to a threshold value as shown in FIG. 2 , and counting the number of phases.
- FIGS. 3 and 4 show the results of the analysis described above, in FIG. 3 , the result obtained by assigning the Ag phases in the longitudinal direction is shown in the longitudinal direction of the wire and in FIG. 4 , the result obtained by assigning the Ag phases is shown from the cross section of the wire.
- the Ag phase was assumed to be a perfect circle from the cross section orthogonal to the longitudinal direction for the selected Ag phase, and the average diameter was calculated by the area thereof.
- IVAS which is software for the 3DAP device provided by CAMECA.
- FIG. 1 shows data obtained by measuring, with the 3DAP device, Ag phases in a tip portion from a first position (position of 0 nm) corresponding to a tip to a second position (position of 140 nm) corresponding to the length of 140 nm in a substantially conical sample which was prepared from the Cu-Ag alloy wire (Ag concentration: 2.0 mass%) in the embodiment of the present invention, and shows the isoconcentration surface of the Ag phases having an Ag atomic concentration of 2.0 atomic% when the tip portion of the sample was measured from its side surface side.
- FIG. 2 shows data obtained by the same manner as in FIG.
- FIG. 1 shows the isoconcentration surface of the Ag phases having an Ag atomic concentration of 3.5 atomic% when a lower part of the tip portion of the sample from a third position (position of 80 nm) corresponding to the length of 80 nm from the first position to the second position (position of 140 nm) was measured from its upper surface side.
- FIG. 3 shows a diagram when the directions of extension of and the number of Ag phases were determined graphically from the results of the isoconcentration surface of the Ag phases shown in FIG. 2 .
- FIG. 4 shows a diagram when the average diameter of the Ag phases was determined graphically from the results of the isoconcentration surface of the Ag phases shown in FIG. 2 .
- the Cu-Ag alloy wire of the present invention includes, in the parent phase, a plurality of Ag phases which are connected in a substantially longitudinal direction of the Cu-Ag alloy wire so as to be distributed linearly. Although it is found in FIGS. 1 and 3 that the Ag phases are not perfectly aligned in the longitudinal direction, the Ag phases extend substantially parallel to each other along the longitudinal direction of the wire.
- the Ag phases are phases in which the Ag atomic concentration is 0.5 to 50.0% and which are connected in the longitudinal direction.
- the "phases connected in the longitudinal direction" mentioned here means that the Ag atom concentration is constant to form a uniform phase in the longitudinal direction but varies from 0.5 to 50.0% to form phases.
- the atomic concentration indicates the existence ratio of Ag, and when the atomic concentration is less than 0.5%, it is impossible to distinguish whether Ag is in a precipitated state or in a solid solution state, with the result that the second phase cannot be determined.
- the atomic concentration exceeds 50.0%, the Ag phases are sufficiently coarse and the phase intervals are more likely to be sparse, with the result that high tensile strength cannot be obtained.
- the Ag atomic concentration needs to be in a range of 0.5 to 50.0 atomic%.
- the Ag phases are not connected in the longitudinal direction, the intervals of the Ag phases are sparse, and thus the tensile strength and the bending fatigue resistance cannot be increased. Therefore, a plurality of Ag phases are formed to be connected in a substantially longitudinal direction of the Cu-Ag alloy wire so as to be distributed linearly.
- the average diameter of the Ag phases when measured in the cross section orthogonal to the longitudinal direction is preferably in a range of 0.5 to 20 nm.
- the average diameter of the Ag phases is less than 0.5 nm, the average diameter is substantially equal to the atomic diameter, and thus it is difficult to determine, with the resolution of an existing analytical device, whether Ag is in a solid solution state or in a precipitated state whereas since a range of 0.5 nm or more is specified and thus a relationship with the properties can be sufficiently clarified, 0.5 nm is set as the lower limit. Since a diameter larger than 20 nm has a low abundance ratio and a wide phase interval, it hardly contributes to densification.
- the enhancement of the tensile strength and the bending fatigue resistance is at a negligible level, and thus the diameter equal to or greater than 20 nm does not need to be targeted. Therefore, in the Cu-Ag alloy wire of the present invention, the phase in which the measurement is performed with the 3DAP device, the analysis is performed with IVAS, the Ag atomic concentration is in a range of 0.5 to 50.0 atomic% and the average diameter is in a range of 0.5 to 20 nm is assumed to be the Ag phase.
- the crystal grain size of the Cu-Ag alloy wire is observed with a scanning transmission electron microscope (STEM).
- STEM is a device which applies an electron beam to a sliced sample, captures electron information transmitted through the sample and performs high-magnification, high-resolution observation at such a level that it is possible to directly observe atomic and molecular images.
- the STEM applies an electron beam focused to the minimum to the sample, and thereby can image an atomic image distribution, a form, a composition image, a crystal structure and the like inside the sample.
- the STEM can also capture an atomic image and the structure of a substance on the order of sub-nanometers.
- the sample to be observed with the STEM was prepared by a focused ion beam (FIB) method.
- SIINT-3050TB was used, and with an acceleration voltage of 30 kV for a Ga ion beam, working was performed.
- Ar ion milling of 2 kV was performed for 5 minutes after FIB thin film working.
- ARM made by JEOL Ltd. with an aberration correction function was used, and an electron beam acceleration voltage was 200 kV.
- bright field (BF) and high-angle annular dark field (HAADF) were shot.
- Energy dispersive X-ray spectroscopy (EDX) attached to the STEM was used for elemental analysis.
- a cutting method JIS H 0501 was used on the obtained bright field image (BF) in the cross section of the wire.
- the number of crystal grains completely cut by a line segment of a known length was counted regardless of its direction on the image, and the average value (nm) of the cut lengths was assumed to be the average crystal grain size.
- FIG. 5 is a photograph of a bright field image (BF) showing a metal structure in a cross section orthogonal to the longitudinal direction of the Cu-Ag alloy wire observed with the STEM.
- the scale shown in FIG. 5 is 20 nm.
- the average crystal grain size of the parent phase when measured in the cross section orthogonal to the longitudinal direction is found to be in a range of 10 to 60 nm.
- the average crystal grain size of the parent phase is on the order of sub-microns (0.1 um or more) and is at least greater than 60 nm.
- the average crystal grain size is in a range of 10 to 60 nm.
- the parent phase is mainly composed of Cu and Ag in a solid solution state, and when the average crystal grain size observed from the cross section is less than 10 nm, the effect on the properties is unknown but the effect was not confirmed in the scope of the present invention.
- the average crystal grain size When the average crystal grain size is in the range, the grain boundary thereof plays a role of suppressing the movement of dislocations and accumulating the dislocations, and can contribute to enhancement of strength (Hall-Fetch rule). When the average crystal grain size exceeds 60 nm, the tensile strength is finally lowered. Although conventionally, the average crystal grain size is significantly coarse, in the Cu-Ag alloy wire of the present invention, the average crystal grain size is controlled to be in a range of 10 to 60 nm, and thus high tensile strength and bending fatigue resistance which have not been conventionally realized are achieved.
- the average crystal grain size needs to be in a range of 10 to 60 nm.
- the average crystal grain size of the parent phase was set in a certain range, and thus the Cu-Ag alloy wire excellent in bending fatigue resistance was obtained. Furthermore, on the other hand, in order to obtain high tensile strength, it is necessary to form an Ag phase in which Ag is sufficiently brought into a solid solution state in the Cu parent phase at high temperature or Ag is finely precipitated in the Cu parent phase. In other words, both the average diameter (nm) of the Ag phases and the average grain size (nm) of the parent phase are controlled, and thus it is possible to achieve both tensile strength and bending fatigue resistance.
- a product of the average diameter (nm) of the Ag phases and the average crystal grain size (nm) of the parent phase measured in the cross section is preferably smaller than 60 times an Ag content (mass%) in the Cu-Ag alloy wire.
- the product is smaller than 60 times the Ag content (mass%) in the Cu-Ag alloy wire, since the average diameter of the Ag phases and the average crystal grain size of the parent phase each are very small, sufficient strength properties and bending fatigue resistance are provided, with the result that in particular, when the average crystal grain size of the parent phase is in a range of 10 to 60 nm, the bending fatigue resistance is more improved.
- the product when the product is equal to or greater than 60 times the Ag content (mass%) in the Cu-Ag alloy wire, the Ag phases are significantly coarse as compared with the crystal grain size of the parent phase, with the result that the tensile strength tends to be lowered.
- the product is set smaller than 60 times the Ag content (mass%) in the Cu-Ag alloy wire.
- Cu-Ag alloy wires tend to have a smaller diameter, and ultrafine wires are often used. Hence, high tensile strength and high bending fatigue resistance are required.
- the metal structure described above is formed, and thus it is possible to obtain at least a tensile strength of 900 MPa or more and more preferably a tensile strength of 1000 MPa or more. Therefore, even when the diameter of the Cu-Ag alloy wire is reduced, the Cu-Ag alloy wire having high strength can be obtained.
- ultrafine wires are used, high electrical conductivity is required.
- the amounts of additive elements and optional additive elements to be added are reduced, and thus it is possible to obtain at least an electrical conductivity of 65% IACS or more and more preferably an electrical conductivity of 75% IACS or more.
- the Cu-Ag alloy wire of the present invention is a round wire which has a diameter of 0.01 to 0.08 mm and in which its cross section is substantially circular. Even in an ultrafine wire (Cu-Ag alloy wire) having a diameter of 0.01 to 0.08 mm, it is desirable that high tensile strength and high electrical conductivity are provided. Cu-Ag alloy wires having a diameter of 0.01 mm or less cannot be said to have the sufficient needs of users. On the other hand, Cu-Ag alloy wires having a diameter exceeding 0.08 mm do not play a role as an ultrafine wire.
- the Cu-Ag alloy wire may be a ribbon wire having a ribbon shape in which its cross section is substantially rectangular instead of being substantially circular.
- the width of the ribbon shape due to the same reasons as the upper and lower limits of the wire diameter, its width is 0.02 to 0.32 mm and its thickness is 0.002 to 0.040 mm.
- a manufacturing method for example, there is a method of rolling the drawn round wire into a desired shape.
- the plate width corresponds to the width direction of rolling rolls, and the plate thickness corresponds to the direction between the rolls and in rolling roll non-contact portions at ends in the direction of the plate width, portions having such a shape that an arc is maintained while being deformed are left.
- a higher value is assumed to be the width, and a lower value is assumed to be the thickness.
- the method for manufacturing the Cu-Ag alloy wire of the present invention includes: a casting step of melting and casting a Cu-Ag alloy material having the chemical composition described above and cooling it to obtain an ingot; a first drawing step of subjecting wire drawing treatment to the Cu-Ag alloy material obtained from the ingot; a first heat treatment step of performing heat treatment on the Cu-Ag alloy material subjected to the wire drawing treatment; a second heat treatment step; and a second drawing step of subsequently performing final wire drawing treatment to obtain the Cu-Ag alloy wire.
- distortion removal annealing treatment can be performed.
- the wire drawing treatment is performed after the casting step and before the heat treatment step.
- the reduction ratio is preferably about 50 to 90% in order to promote sufficient precipitation of Ag during the heat treatment.
- the reduction ratio is less than 50%, sufficient precipitation is not achieved, and the precipitation is decreased according to an increase in strength for the reduction ratio in the second drawing step and the subsequent steps. This is because the Cu-Ag alloy wire tends to be insufficient in strength when the diameter is large, and thus it is difficult to obtain high tensile strength.
- the first heat treatment step while the ingot is being drawn into its final diameter, at least two heat treatment steps are introduced.
- the heat treatment described above is intended to precipitate Ag, and the heat treatment is performed under conditions below: the holding temperature in the first heat treatment step is in a range of 350 to 450°C, the holding temperature in the second heat treatment step is in a range of 250 to 375°C and the total time of the heat treatment is in a range of 10 to 50 hours.
- the second heat treatment step needs to be performed at a temperature lower than the first heat treatment step by 250°C or more.
- the second heat treatment step which is lower in temperature than the first heat treatment step is introduced, and thus a large amount of precipitation of the Ag phases is achieved in the first heat treatment having large driving power, and the final amount of precipitation of the Ag phases is controlled in the second heat treatment step in which the solid solubility limit is narrow and its driving power is lowered due to the low temperature.
- the average crystal grain size of the parent phase after the final step cannot be in a range of 10 to 60 nm, with the result that the product of the average diameter of the Ag phases and the average crystal grain size of the parent phase tends to be equal to or greater than 60 times the Ag concentration.
- the reduction ratio in the second drawing step is preferably in a range of about 95 to 99.9999%.
- the reduction ratio is low, both the crystal grain size of the parent phase and the Ag phases do not satisfy the quantities in the size of the invention, and the tensile strength is not sufficiently increased.
- the upper limit of the reduction ratio is provided by realistic restrictions and is not related to the properties.
- the reduction ratio per pass is set in a range of 15 to 35%. The reduction ratio greater than this rate may cause the wire to break.
- the ribbon-shaped wire was manufactured by rolling the wire manufactured into the circular shape described above to a specified thickness.
- work hardening may be saturated to further reduce the strength.
- the bending fatigue resistance and the like accompanied by twisting may be adversely affected, and thus it is effective to apply an intermediate heat treatment for the purpose of distortion removal without large softening.
- a stripping step can be included in the process to facilitate the wire drawing treatment.
- a finishing heat treatment step is provided in which heat treatment is performed at the end of the manufacturing process, and thus it is possible to obtain the final Cu-Ag alloy wire (product after the heat treatment).
- the conditions of this final heat treatment are not particularly limited, the final heat treatment is preferably performed at a temperature of 450 to 600°C for 10 seconds to 30 minutes.
- the ingots were drawn such that the reduction ratio was 35 to 95%, and thus the wire diameter was set to 1.0 to 9.5 mm (first drawing step).
- aging heat treatment for both precipitation and recrystallization was performed at 350 to 550°C for 3 to 50 hours (first heat treatment step).
- the aging heat treatment was likewise performed at a lower holding temperature of 250 to 375°C for 1 to 60 hours (second heat treatment step).
- cold wire drawing was performed such that the reduction ratio was 99.7 to 99.998% and the wire diameter was 0.02 to 0.08 mm (second drawing step). Distortion removal annealing was performed during the cold wire drawing in the second drawing step.
- a repeated bending test was performed in accordance with JIS H 0500 No. 4100. Considering that the fatigue resistance depends on the wire diameter, the test was performed using all the wires which were manufactured to have an outer diameter of 0.03 mm.
- the electrical conductivity was measured using a four-terminal method based on JIS H0505-1975 in a thermostatic chamber controlled at 20°C ( ⁇ 1°C) twice for each sample, and the average value (%IACS) thereof was used as the measured value.
- the distance between the terminals was set to 100 mm.
- the observation and analysis of the metal structure of the Cu-Ag alloy wire were performed with the 3DAP device and the analysis software. Since the crystal grain size of the parent phase had sub-nano to nano-order sizes, the observation and analysis of the metal structure were performed with the scanning transmission electron microscope (STEM).
- STEM scanning transmission electron microscope
- the 3DAP device evaporates materials, detects the evaporated atoms with a two-dimensional detector and reconstructs data to be able to visualize a three-dimensional structure on the order of nanometers.
- the preparation of a sample for three-dimensional atom probe measurement was performed with FIB.
- SIINT-3050TB and Helios G4 (made by FEI Company Ltd.) were used as the FIB.
- a Ga ion beam of an acceleration voltage of 30 kV was used, and thus the conical sample having a circular bottom surface with a diameter of about 80 nm and a length of about 140 nm was prepared.
- the longitudinal direction of the Cu-Ag alloy wire was assumed to be the length direction of the sample, the diameter direction of a cross section orthogonal to the longitudinal direction of the Cu-Ag alloy wire may be assumed to be the length direction.
- Final finishing was performed with a 5 kV ion beam to reduce a damaged layer as much as possible.
- LEAP4000XSi made by AMETEK
- Vaporization was performed by using ultraviolet light having a wavelength of 355 nm as pulsed laser which was applied.
- a voltage of 1 to 5 kV was applied to the sample.
- the analysis software such as IVAS 3.8.8 (made by CAMECA) or IVAS LT was used to analyze the atomic concentration of the Ag phases and the shortest interval.
- an Ag threshold value of the same concentration as the Ag concentration was set, and a portion in which a concentration distribution exceeding this threshold value was confirmed was tentatively assumed to be the Ag phase.
- profile analysis was performed along the longitudinal direction, and a phase which continuously had an Ag atomic concentration of 0.5 to 50.0% in the length of 60 nm was selected as the Ag phase.
- the Ag phase was assumed to be a perfect circle from the cross section orthogonal to the longitudinal direction for the selected Ag phase, and the average diameter was calculated by the area thereof.
- ARM JEM-ARM200F made by JEOL Ltd.
- HAADF high-angle annular dark field
- EDX energy dispersive X-ray spectroscopy
- the average crystal grain size was calculated by a cutting method using the obtained bright field image (BF).
- the cutting method was based on the provisions of JIS H 0501.
- the results of analysis performed with the 3DAP device were also used to determine the average value. Then, the product of the average diameter of the Ag phases and the average crystal grain size of the parent phase was calculated.
- Example 1-1 to 1-12 and Comparative Examples 1-1 to 1-11 the Cu-Ag alloy wire having the chemical composition of Cu-1.5 mass% Ag was used, and samples were prepared while the rates of working in the first and second drawing steps and manufacturing conditions in the first and second heat treatment steps were being changed.
- Table 1 shows manufacturing conditions in Examples 1-1 to 1-12 and Comparative Examples 1-1 to 1-11.
- Example 1-10 working was performed to provide a circular sample with a final diameter of 0.03 mm, and thus the sample was molded into a ribbon shape having a thickness of 0.008 mm and a width of 0.08 mm. Underlines shown in the table indicate that they were outside the scope of the present invention.
- Table 2 shows metal structures and the results of evaluation of properties in Examples 1-1 to 1-22 and (Cu-1.5 mass% Ag alloy wire) Examples Comparative Examples Final wire diameter (mm ⁇ ) Average crystal grain size of parent phase (nm) Average diameter of Ag phases (nm) Average diameter of Ag phases ⁇ average crystal grain size of parent phase
- Example 1-1 to 1-12 the average crystal grain size of the parent phase, the average diameter of the Ag phases and the product were in the scope of the present invention.
- Each tensile strength had a high strength of 1100 MPa or more. Since in Examples 1-5, 1-6 and 1-11, the product exceeded 90 which was the value of 60 times the Ag content (mass%), the bending fatigue resistance was "o". Since in Examples 1-1 to 1-4, 1-7 to 1-10 and 1-12, the product was equal to or less than 90 which was the value of 60 times the Ag content (mass%), the bending fatigue resistance was " ⁇ ".
- each tensile strength was equal to or greater than 980 MPa which was less than those in Examples 1-1 to 1-12. Since the average crystal grain size of the parent phase was outside the scope of the present invention and the product was also outside the scope of the present invention to be greater than 90, the bending fatigue resistance was "x".
- Examples 2-1 to 2-12 and Comparative Examples 2-1 to 2-11 the Cu-Ag alloy wire having the chemical composition of Cu-2.0 mass% Ag was used, and samples were prepared.
- Table 3 shows manufacturing conditions in Examples 2-1 to 2-12 and Comparative Examples 2-1 to 2-11.
- [Table 3] Cu-2.0 mass% Ag alloy wire) Examples Comparative Examples Casting (cooling rate) (°C/s) First drawing reduction ratio(%) First heat treatment Second heat treatment Second drawing reduction ratio(%) Distortion removal annealing Holding temperature(°C) Holding time(h) Holding temperature(°C) Holding time(h)
- Example2-1 15 65 400 25 375 10 99998 ⁇
- Example2-2 45 65 400 25 350 10 99998 ⁇
- Example2-3 45 50 400 20 350 15 99998 ⁇
- Example2-4 45 65 400 10 300 15 99998 ⁇
- Example2-5 45 65 450 10 300 15 99998 ⁇
- Example2-6 45 65 375 10 350 10 99998 ⁇
- Example2-7 45 65 425 8 350 4 99.998 ⁇
- Example2-8 45 65 450 5 325 15 99998 ⁇
- Example2-10 45 65 400 10 275 15 99.99 ⁇ Example
- Table 4 shows metal structures and the results of evaluations of properties in Examples 2-1 to 2-12 and Comparative Examples 2-1 to 2-11. The value of 60 times the Ag content (mass%) was "120".
- [Table 4] (Cu-2.0 mass% Ag alloy wire) Examples Comparative Examples Final wire diameter (mm ⁇ ) Average crystal grain size of parent phase (nm) Average diameter of Ag phases (nm) Average diameter of Ag phases ⁇ average crystal grain size of parent phase
- Example2-9 0.03 23 5 115 1180 ⁇
- Example2-10 0.03 ⁇ Plate thickness of 0.008 mm Wid
- each of Examples 2-1 to 2-12 the average crystal grain size of the parent phase, the average diameter of the Ag phases and the product were in the scope of the present invention.
- Each tensile strength had a high strength of 1100 MPa or more. Since in Examples 2-5 to 2-8 and 2-10 to 2-12, the product exceeded 120 which was the value of 60 times the Ag content (mass%), the bending fatigue resistance was "o". Since in Examples 2-1 to 2-4 and 2-9, the product was equal to or less than 120 which was the value of 60 times the Ag content (mass%), the bending fatigue resistance was " ⁇ ".
- Examples 3-1 to 3-12 and Comparative Examples 3-1 to 3-11 the Cu-Ag alloy wire having the chemical composition of Cu-4.0 mass% Ag was used, and samples were prepared.
- Table 5 shows manufacturing conditions in Examples 3-1 to 3-12 and Comparative Examples 3-1 to 3-11.
- [Table 5] (Cu-4.0 mass% Ag alloy wire) Examples Comparative Examples Casting (cooling rate) (°C/s) First drawing reduction ratio(%) First heat treatment Second heat treatment Second drawing reduction ratio(%) Distortion removal annealing Holding temperature(°C) Holding time(h) Holding temperature(°C) Holding time(h)
- Example3-1 15 65 400 25 375 10 99998 ⁇ Example3-2 45 65 400 25 350 10 99998 ⁇
- Example3-3 45 50 400 20 350 15 99998 ⁇
- Example3-4 45 65 400 10 300 15 99998 ⁇
- Example3-5 45 65 450 10 300 15 99998 ⁇
- Example3-6 45 65 375 10 350 10 99998 ⁇
- Example3-7 45 65 425 8 350 4 99.998 ⁇
- Example3-8 45 65 450 5 325 15 99998 ⁇
- Example3-10 45 65 400 10 275 15 99.99 ⁇
- Table 6 shows metal structures and the results of evaluation of properties in Examples 3-1 to 3-12 and Comparative Examples 3-1 to 3-11.
- each of Examples 3-1 to 3-12 the average crystal grain size of the parent phase, the average diameter of the Ag phases and the product were in the scope of the present invention.
- Each tensile strenght had a high strenght of 1300 MPa or more. Sincer in Examples 3-2, 3-4, 3-5 and 3-10 to 3-12, the product exceeded 240 which was the value of 60 times the Ag content (mass%), the bending fatigue resistance was "o". Since in Examples 3-1, 3-3 and 3-6 to 3-9, the product was equal to or less than 240 which was the value of 60 times the Ag content (mass%), the bending fatigue resistance was " ⁇ ".
- Examples 4-1 to 4-12 and Comparative Examples 4-1 to 4-11 the Cu-Ag alloy wire having the chemical composition of Cu-6.0 mass% Ag was used, and samples were prepared.
- Table 7 shows manufacturing conditions in Examples 4-1 to 4-12 and Comparative Examples 4-1 to 4-11.
- [Table 7] (Cu-6.0 mass% Ag alloy wire) Examples Comparative Examples Casting (cooling rate) (°C/s) First drawing reduction ratio(%) First heat treatment Second heat treatment Second drawing red uction ratio(%) Distortion removal annealing Holding temperature(°C) Holding time(h) Holding temperature(°C) Holding time(h)
- Example4-2 45 65 400 25 350 10 99998 ⁇
- Example4-3 45 50 400 20 350 15 99998 ⁇
- Example4-4 45 65 400 10 300 15 99998 ⁇
- Example4-5 45 65 450 10 300 15 99998 ⁇
- Example4-6 45 65 375 10 350 10 99998 ⁇
- Example4-7 45 65 425 8 350 4 99.998 ⁇
- Example4-8 45 65 450 5 325 15 99998 ⁇
- Example4-10 45 65 400 10 275 15 99.99
- Table 8 shows metal structures and the results of evaluations of properties in Examples 4-1 to 4-12 and Comparative Examples 4-1 to 4-11.] [Table 8] (Cu-6.0 mass% Ag alloy wire) Examples Comparative Examples Final wire diameter (mm ⁇ ) Average crystal grain size of parent phase (nm) Average diameter of Ag phases (nm) Average diameter of Ag phases ⁇ average crystal grain size of parent phase Tensile strength (MPa) Bending fatigue resistance Example4-1 0.03 15 14 210 1360 ⁇ Example4-2 0.03 25 16 400 1390 ⁇ Example4-3 0.03 18 10 180 1400 ⁇ Example4-4 0.03 16 18 288 1410 ⁇ Example4-5 0.03 27 14 378 1380 ⁇ Example4-6 0.03 18 12 216 1380 ⁇ Example4-7 0.03 16 16 256 1395 ⁇ Example4-8 0.03 14 11 154 1380 ⁇ Example4-9 0.03 17 14 238 1370 ⁇ Example4-10 0.03 ⁇ Plate thickness of 0.008 mm Width of 0.08 mm 18 15 270 1370 ⁇ Example4-11 0.02 15 18
- Table 8 shows metal structures and the results of evaluations of properties in Examples 4-1 to 4-12 and Comparative Examples 4-1 to 4-11. exceeded 360 which was the value of 60 times the Ag content (mass%), the bending fatigue resistance was " ⁇ ". Since in Examples 4-1, 4-3 and 4-6 to 4-11, the product was equal to or less than 360 which was the value of 60 times the Ag content (mass%), the bending fatigue resistance was "0". In Comparative Examples 4-1 to 4-11, the average crystal grain size of the parent phase and the product were outside the scope of the present invention, and each tensile strength was equal to or greater than 1000 MPa which was less than those in Examples 4-1 to 4-12. Since the product was greater than 360, the bending fatigue resistance was "x".
- the Cu-Ag alloy wires contained Ag outside the range of 1.0 to 6.0% by mass of the present invention
- the Cu-Ag alloy wires having the chemical compositions of Cu-0.5 mass% Ag, Cu-0.8 mass% Ag, Cu-6.5 mass% Ag and Cu-8.0 mass% Ag were used and samples were prepared.
- Table 9 shows manufacturing conditions in Comparative Examples 5-1 to 5-4.
- Table 10 shows metal structures and the results of evaluations of properties in Comparative Examples 5-1 to 5-12.
- the tensile strength was less than 900 MPa, and the bending fatigue resistance did not satisfy formula 1 so as to be "x".
- the amount of Ag added was greater than the upper limit thereof which was 6.0 mass%, and thus the tensile strength was greater than 900 MPa. Since the product was equal to or less than 390 which was the value of 60 times the Ag content (mass%), the bending fatigue resistance was "0".
- the amount of Ag added was greater than the upper limit thereof which was 6.0 mass%, and thus the tensile strength was greater than 900 MPa. Since the product was equal to or less than 480 which was the value of 60 times the Ag content (mass%), the bending fatigue resistance was "0".
- Comparative Example 5-3 is compared with Example 4-3, Comparative Example 5-4 and Example 4-4, there is no difference in the effects of the tensile strength and the bending fatigue resistance, and thus it is not advantageous to increase the amount of Ag added because the cost is increased.
- Example 6-1 to 6-8 the Cu-Ag alloy wire having the chemical composition including Cu-2.0 mass% Ag and one selected from the group consisting of Sn, Mg, Zn, In, Ni, Co, Zr and Cr was used, and samples were prepared, and in Comparative Examples 6-1 to 6-3, the Cu-Ag alloy wire having the chemical composition including Cu-2.0 mass% Ag and 0.5% by mass of each of Sn, Mg and Zr was used, and samples were prepared.
- Table 11 shows manufacturing conditions in Examples 6-1 to 6-8 and Comparative Examples 6-1 to 6-3.
- [Table 11] Cu-2.0 mass% Ag alloy wire) Examples Comparative Examples Composition (mass%) Casting (cooling rate) (°C/s) First drawing reduction ratio(%) First heat treatment Second heat treatment Second drawing reduction ratio(%) Distortion removal annealing Holding temperature(°C) Holding time(h) Holding temperature(°C) Holding time(h)
- Example6-1 0.1Sn 15 65 400 25 375 10 99.998 ⁇
- Example6-2 0.1Mg 45 65 400 25 350 10 99.998 ⁇
- Example6-3 0.3Zn 45 50 400 20 350 15 99.998 ⁇
- Example6-4 0.1In 45 65 400 10 300 15 99.998 ⁇
- Example6-5 0.2Ni 45 65 450 10 300 15 99.998 ⁇
- Example6-6 0.1Co 45 65 375 10 350 10 99.998 ⁇
- Example6-7 0.05Zr 45 65 425 8 350 4 99.998 ⁇
- Table 12 shows metal structures and the results of evaluations or properties in Examples 6-1 to 6-8 and Comparative Examples 6-1 and 6-3.
- Example 6-8 the average crystal grain size of the parent phase, the average diameter of the Ag phases and the product were in the scope of the present invention.
- Each tensile strenght had a high strenght of 1100 MPa or more. Since in Examples 6-1 to 6-8, the product was equal to or less than 120 which was the value of 60 times the Ag content (mass%), the bending fatigue resistance was "0".
- Comparative Example 6-1 0.5% by mass of Sn was contained, and in Comparative Example 6-2, 0.5% by mass of Mg was contained, with the result that the electrical conductivity was so low as to cause a problem in practical use.
- Comparative Example 6-3 0.5% by mass of Zr was contained, thus cracking of the ingot occurred during manufacturing and thereby it was difficult to manufacture a round wire and like, with the result that there was a problem in manufacturing.
Landscapes
- Chemical & Material Sciences (AREA)
- Engineering & Computer Science (AREA)
- Materials Engineering (AREA)
- Mechanical Engineering (AREA)
- Metallurgy (AREA)
- Organic Chemistry (AREA)
- Physics & Mathematics (AREA)
- Thermal Sciences (AREA)
- Crystallography & Structural Chemistry (AREA)
- Conductive Materials (AREA)
Abstract
Description
- The present invention relates to Cu-Ag alloy wires.
- At present, diameters of electric wires used in connection cables for electrical and electronic devices are becoming smaller. As electric wires, instead of pure Cu wires which lack strength, Cu alloy wires such as Cu-Sn wires, Cu-Cr wires and Cu-Ag wires tend to be used. However, the diameters of electric wires tend to be much smaller than before due to the miniaturization of electrical and electronic products, the space saving of electric wire installation regions, the increase in the number of signal wiring lines and the like. Among copper alloy wires, Cu-Ag alloy wires can be mentioned as copper alloy wires which have relatively high tensile strength and relatively high electrical conductivity.
- For example, Patent Document 1 discloses a method for manufacturing a copper alloy which has high strength and high electrical conductivity by stretching the eutectic phase of Cu and Ag into a filament. However, in Patent Document 1, in particular, the control of precipitation distribution which contributes to strength after wire drawing is not appropriate, and thus strength properties are not sufficient. Patent Document 2 discloses a Cu-Ag alloy fine wire in which a recrystallized aggregate structure is developed by heat treatment during a process and its strength is increased by subsequent high processing. However, in Patent Document 2, since appropriate wire drawing process conditions are not adopted before heat treatment, embrittlement of a material progresses during the heat treatment, and thus it is difficult to reduce the diameter of the wire, with the result that its poor productivity does not realize a cost-competitive product. Patent Document 3 discloses a Cu-Ag alloy wire in which some of Ag crystal precipitates exist as very fine Ag grains, thereby the Cu-Ag alloy can have high tensile strength and high electrical conductivity. However, in Patent Document 3, although a predetermined distribution of the Ag crystal precipitates is specified, even when the desired structure is obtained by tracing the presented manufacturing method, it is not always possible to obtain high tensile strength and high electrical conductivity in a well-balanced manner.
-
- Patent Document 1:
Japanese Patent No. 3325639 - Patent Document 2:
Japanese Patent No. 5051647 - Patent Document 3:
Japanese Patent No. 5713230 - Hence, in each of Patent Documents 1 to 3, there are problems that the control of a metal structure is insufficient and it has not been sufficiently considered to secure wire drawability necessary to more satisfactorily reduce the diameter of the wire, compared with a conventional Cu-Ag wire, and to manufacture an ultrafine wire (Cu-Ag alloy wire) with a good balance of both high strength and high electrical conductivity. Moreover, there is another problem that it has not been considered at all to enhance the property (bending fatigue resistance) in which a finer Cu-Ag alloy wire is unlikely to be broken by fatigue under repeated bending conditions. Therefore, an object of the present invention is to provide a Cu-Ag alloy wire which is excellent in bending fatigue resistance while having high tensile strength and high electrical conductivity.
- In order to achieve the object described above, the present invention provides configurations as described below.
- (1) A Cu-Ag alloy wire including Ag in a chemical composition of 1.0 to 6.0% by mass, the balance being Cu and an unavoidable impurity, the Cu-Ag alloy wire including a parent phase including a plurality of Ag phases which are connected in a substantially longitudinal direction of the Cu-Ag alloy wire so as to be distributed linearly, the parent phase having an average crystal grain size in a range of 10 to 60 nm, when measured in a cross section orthogonal to the longitudinal direction of the Cu-Ag alloy wire.
- (2) The Cu-Ag alloy wire described in (1), in which the product of the average diameter (nm) of the Ag phases measured in the cross section and the average crystal grain size (nm) of the parent phase is smaller than 60 times an Ag content (mass%) in the Cu-Ag alloy wire.
- (3) The Cu-Ag alloy wire described in (1) or (2), further comprising at least one component selected from the group consisting of Sn, Mg, Zn, In, Ni, Co, Zr and Cr in a chemical composition ranging from 0.05 to 0.30% by mass.
- (4) The Cu-Ag alloy wire described in any one of (1) to (3), where the Cu-Ag alloy wire is a round wire having a diameter of 0.01 to 0.08 mm.
- (5) The Cu-Ag alloy wire described in any one of (1) to (3), in which the Cu-Ag alloy wire is a ribbon wire having a width of 0.02 to 0.32 mm and a thickness of 0.002 to 0.040 mm and the cross section of the ribbon wire is substantially rectangular.
- According to the present invention, it is possible to provide a Cu-Ag alloy wire which is excellent in bending fatigue resistance while having high tensile strength and high electrical conductivity. In this way, it is possible to achieve the miniaturization of electrical and electronic products, the space saving of electric wire installation regions and the increase in the number of signal wiring lines, which have not so far been realized, with the result that it is possible to contribute to an increase in added value for the miniaturization of electrical and electronic products.
-
-
FIG. 1 shows data obtained by measuring, with a 3DAP device, Ag phases in a tip portion from a first position (position of 0 nm) corresponding to a tip to a second position (position of 140 nm) corresponding to the length of 140 nm in a substantially conical sample which was prepared from a Cu-Ag alloy wire in an embodiment of the present invention, and shows the isoconcentration surface of the Ag phases having an Ag atomic concentration of 2.0 atomic% when the tip portion of the sample was measured from its side surface side; -
FIG. 2 shows data obtained by the same manner as inFIG. 1 , and shows the isoconcentration surface of the Ag phases having an Ag atomic concentration of 3.5 atomic% when a lower part of the tip portion of the sample from a third position (position of 80 nm) corresponding to the length of 80 nm from the first position to the second position (position of 140 nm) was measured from its upper surface side; -
FIG. 3 is a diagram when the directions of extension of and the number of Ag phases were determined graphically from the results of the isoconcentration surface of the Ag phases shown inFIG. 1 ; -
FIG. 4 is a diagram when intervals (and the average diameter) between Ag phases adjacent to each other were determined graphically from the results of the isoconcentration surface of the Ag phases shown inFIG. 2 ; and -
FIG. 5 is a photograph of a bright field image (BF) when a metal structure in a cross section orthogonal to the longitudinal direction of the Cu-Ag alloy wire was observed with a scanning transmission electron microscope (STEM). - An embodiment of the present invention will be described below. The following description is an example of the embodiment of the present invention and is not intended to limit the scope of claims.
- A Cu-Ag alloy wire according to the embodiment of the present invention will be described. The Cu-Ag alloy wire according to the embodiment of the present invention includes Ag in a chemical composition of 1.0 to 6.0% by mass, the balance being Cu and an unavoidable impurity. The Cu-Ag alloy wire includes a parent phase including a plurality of Ag phases which are connected in a substantially longitudinal direction of the Cu-Ag alloy wire so as to be distributed linearly, and the parent phase has an average crystal grain size in a range of 10 to 60 nm, when measured in a cross section orthogonal to the longitudinal direction of the Cu-Ag alloy wire.
- The Cu-Ag alloy wire of the present invention contains 1.0 to 6.0% by mass of Ag. Hence, Ag is an essential additive component. Ag exists in a solid solution state in Cu serving as the parent phase (first phase) or in a state where Ag is crystallized from liquid and precipitated from solid as an Ag layer serving as a second phase when the Cu-Ag alloy wire is cast, and Ag achieves the action of solid solution strengthening or dispersion strengthening.
- When the Ag content is less than 1.0% by mass, the precipitation of the Ag layers does not sufficiently occurs, a desired metal structure is not obtained and thus tensile strength is insufficient, with the result that sufficient bending fatigue resistance is not obtained. On the other hand, when the Ag content exceeds 6.0% by mass, there is no difference from a case where the Ag content is equal to or less than 6.0% by mass in the effects of tensile strength and bending fatigue resistance, with the result that costs are increased by a cost corresponding to the increase in the amount of Ag added. Therefore, in the present invention, the Ag content is set to 1.0 to 6.0% by mass so that even in an ultrafine Cu-Ag alloy wire in which its diameter is reduced, excellent tensile strength and bending fatigue resistance and satisfactory cost performance are obtained without electrical conductivity being impaired. Furthermore, when in a wide range of applications, more emphasis is placed on the balanced properties of electrical conductivity, the Ag content is more preferably 1.0 to 4.5% by mass.
- Furthermore, it is preferable that the Cu-Ag alloy wire in the embodiment of the present invention contains, as an optional additive component, 0.05 to 0.30% by mass of at least one component selected from the group consisting of Sn, Mg, Zn, In, Ni, Co, Zr and Cr. Each of these optional additive components is an element which mainly exists in a solid solution state in Cu serving as the parent phase and achieves the effect of solid solution strengthening or dispersion strengthening as in the case of Ag. The optional additive component is contained together with the Ag phases to exist, for example, as the second phase of a ternary or higher system such as a Cu-Ag-Zr system, with the result that the optional additive component contributes to further solid solution strengthening or dispersion strengthening.
- The content of each of the components will be described below.
- When the Sn (tin) content is equal to or greater than 0.05% by mass, the Sn content contributes to enhancement of strength of the copper alloy wire whereas when the Sn content is equal to or less than 0.30% by mass, the electrical conductivity is not significantly impaired. Hence, the Sn content is equal to or greater than 0.05% by mass, preferably equal to or greater than 0.07% by mass, further preferably equal to or greater than 0.08% by mass and particularly preferably equal to or greater than 0.10% by mass. On the other hand, the Sn content is equal to or less than 0.30% by mass, more preferably equal to or less than 0.18% by mass, further preferably equal to or less than 0.15% by mass and particularly preferably equal to or less than 0.12% by mass.
- When the Mg (magnesium) content is equal to or greater than 0.05% by mass, the Mg content contributes to enhancement of strength of the copper alloy wire, and the brittleness of the copper alloy wire is alleviated. When the Mg content is equal to or less than 0.30% by mass, the electrical conductivity of the copper alloy wire and the manufacturability thereof at the time of casting are not significantly impaired. Hence, the Mg content is equal to or greater than 0.05% by mass, preferably equal to or greater than 0.07% by mass, further preferably equal to or greater than 0.08% by mass and particularly preferably equal to or greater than 0.10% by mass. On the other hand, the Mg content is equal to or less than 0.30% by mass, preferably equal to or less than 0.18% by mass, further preferably equal to or less than 0.15% by mass and particularly preferably equal to or less than 0.12% by mass.
- When the Zn (zinc) content is equal to or greater than 0.05% by mass, the Zn content contributes to enhancement of strength of the copper alloy wire, and the brittleness of the copper alloy wire is alleviated. When the Zn content is equal to or less than 0.30% by mass, the electrical conductivity of the copper alloy wire is not significantly impaired. Hence, the Zn content is equal to or greater than 0.05% by mass, preferably equal to or greater than 0.07% by mass, further preferably equal to or greater than 0.08% by mass and particularly preferably equal to or greater than 0.10% by mass. On the other hand, the Zn content is equal to or less than 0.30% by mass, more preferably equal to or less than 0.25% by mass, further preferably equal to or less than 0.20% by mass and particularly preferably equal to or less than 0.15% by mass.
- When the In (indium) content is equal to or greater than 0.05% by mass, the In content contributes to enhancement of strength of the copper alloy wire whereas when the In content is equal to or less than 0.30% by mass, the electrical conductivity is not significantly impaired. Hence, the In content is preferably equal to or greater than 0.05% by mass, preferably equal to or greater than 0.07% by mass, further preferably equal to or greater than 0.08% by mass and particularly preferably equal to or greater than 0.10% by mass. On the other hand, the In content is equal to or less than 0.30% by mass, preferably equal to or less than 0.18% by mass, further preferably equal to or less than 0.15% by mass and particularly preferably equal to or less than 0.12% by mass.
- When the Ni (nickel) content is equal to or greater than 0.05% by mass, the Ni content contributes to enhancement of strength of the copper alloy wire. When the Ni content is equal to or less than 0.30% by mass, the electrical conductivity of the copper alloy wire is not significantly impaired. Hence, the Ni content is equal to or greater than 0.05% by mass, preferably equal to or greater than 0.07% by mass, further preferably equal to or greater than 0.08% by mass and particularly preferably equal to or greater than 0.10% by mass. On the other hand, the Ni content is equal to or less than 0.30% by mass, preferably equal to or less than 0.25% by mass, further preferably equal to or less than 0.20% by mass and particularly preferably equal to or less than 0.15% by mass.
- When the Co (cobalt) content is equal to or greater than 0.05% by mass, the Co content contributes to enhancement of strength of the copper alloy wire whereas when the Co content is equal to or less than 0.30% by mass, the electrical conductivity is not significantly impaired. Hence, the Co content is equal to or greater than 0.05% by mass, preferably equal to or greater than 0.07% by mass, further preferably equal to or greater than 0.08% by mass and particularly preferably equal to or greater than 0.10% by mass. On the other hand, the Co content is equal to or less than 0.30% by mass, preferably equal to or less than 0.18% by mass, further preferably equal to or less than 0.15% by mass and particularly preferably equal to or less than 0.12% by mass.
- When the Zr (zirconium) content is equal to or greater than 0.05% by mass, the Zr content contributes to enhancement of strength of the copper alloy wire, and the brittleness of the copper alloy wire is alleviated. When the Zr content is equal to or less than 0.30% by mass, the electrical conductivity of the copper alloy wire and the manufacturability thereof at the time of casting are not significantly impaired. Hence, the Zr content is equal to or greater than 0.05% by mass, preferably equal to or greater than 0.07% by mass, further preferably equal to or greater than 0.08% by mass and particularly preferably equal to or greater than 0.10% by mass. On the other hand, the Zr content is equal to or less than 0.30% by mass, preferably equal to or less than 0.20% by mass, further preferably equal to or less than 0.15% by mass and particularly preferably equal to or less than 0.12% by mass.
- When the Cr (chromium) content is equal to or greater than 0.05% by mass, the Cr content contributes to enhancement of strength of the copper alloy wire whereas when the Cr content is equal to or less than 0.30% by mass, the electrical conductivity is not significantly impaired. Hence, the Cr content is equal to or greater than 0.05% by mass, preferably equal to or greater than 0.07% by mass, further preferably equal to or greater than 0.08% by mass and particularly preferably equal to or greater than 0.10% by mass. On the other hand, the Cr content is equal to or less than 0.30% by mass, preferably equal to or less than 0.18% by mass, further preferably equal to or less than 0.15% by mass and particularly preferably equal to or less than 0.12% by mass.
- On the other hand, it is preferable that 0.05 to 1.0% by mass of the optional additive components described above in total is contained. When the content is less than 0.05% by mass, the content causes only a slight decrease in electrical conductivity but does not contribute to high tensile strength. When the content exceeds 1.0% by mass, the tensile strength is significantly increased but the electrical conductivity is significantly lowered, with the result that it is impossible to maintain high electrical conductivity. Hence, it is preferable 0.05 to 1.0% by mass of the optional additive components described above in total is contained.
0.1 to 0.5% by mass of the optional additive components described above in total is further preferably contained. - The remainder other than the components described above is Cu and an unavoidable impurity. Cu is the parent phase of the Cu-Ag alloy wire in the present invention, and Ag and the like which are essential additive components exist in a solid solution state or in a state where they precipitate as precipitates. The unavoidable impurity refers to an impurity having a content level which can be inevitably contained in the manufacturing process of the Cu-Ag alloy wire of the present invention. The unavoidable impurity may cause the electrical conductivity to be reduced depending on the content. Hence, with consideration given to the reduction in the electrical conductivity, it is preferable to suppress the content of the unavoidable impurity. Examples of the unavoidable impurity include Pb, S, P.
- The metal structure of the Cu-Ag alloy wire of the present invention will be described below. The Cu-Ag alloy wire according to the embodiment of the present invention includes, in the parent phase, a plurality of Ag phases which are connected in a substantially longitudinal direction of the Cu-Ag alloy wire so as to be distributed linearly, and the average crystal grain size of the parent phase when measured in a cross section orthogonal to the longitudinal direction of the Cu-Ag alloy wire is in a range of 10 to 60 nm.
- The Ag phases are measured by a three-dimensional atom probe method (3DAP method).
FIGS. 1 to 4 are diagrams showing, by the 3DAP method, a state where in the Cu-Ag alloy wire according to the embodiment of the present invention, the Ag phases exist in the parent phase. The state where Ag exists in the parent phase of the Cu-Ag alloy wire in the metal structure can be observed by the 3DAP method. The 3DAP method is an analysis technique which enables three-dimensional composition analysis of nanoprecipitates and clusters in a metal or a semiconductor. The principle is as follows. A needle-shaped sample in which a tip portion is formed in a substantially conical shape and which has a diameter of about 100 nm is prepared and is thereafter carried into a three-dimensional atom probe field ion microscope (3DAP device), pulses of high voltage are applied and the needle-shaped sample is field-evaporated from the tip of the sample atom by atom. A pulsed laser of a specific wavelength is applied to the tip of the needle to assist the field evaporation, and thus it is possible to reduce the probability of destruction of the sample, improve a mass resolution and measure a semiconductor or an insulator. The pulse voltage and the laser are applied, and thus the time-of-flight and the position measurement of field-evaporated ions are detected by a two-dimensional position detector, with the result that two-dimensional coordinate positions of the ions are measured. The time from the point of evaporation at the tip of the needle to the point of arrival at the detector is measured, and thus analysis serving as time-of-flight mass spectrometry is also possible, with the result that it is possible to identify ion species which have arrived. Since the laser is repeatedly applied, and thus information on the two-dimensional coordinate positions of the ions and information on the direction of depth of the sample can be obtained, data analysis with consideration given to the shape of the tip of the needle is performed, and thus it is possible to obtain three-dimensional composition information. - Here, typical results obtained by measurements using the 3DAP method are shown.
FIG. 1 shows data obtained by measuring, with a 3DAP device, Ag phases in a tip portion from a first position (position of 0 nm) corresponding to a tip to a second position (position of 140 nm) corresponding to the length of 140 nm in a substantially conical sample which was prepared from the Cu-Ag alloy wire (Ag concentration: 2.0 mass%) in the embodiment of the present invention, and shows the isoconcentration surface of the Ag phases having an Ag atomic concentration of 2.0 atomic% when the tip portion of the sample was measured from its side surface side.FIG. 2 shows data obtained by the same manner as inFIG. 1 , and shows the isoconcentration surface of the Ag phases having an Ag atomic concentration of 3.5 atomic% when a lower part of the tip portion of the sample from a third position (position of 80 nm) corresponding to the length of 80 nm from the first position to the second position (position of 140 nm) was measured from its upper surface side.FIG. 3 shows a diagram when the directions of extension of and the number of Ag phases were determined graphically from the results of the isoconcentration surface of the Ag phases shown inFIG. 2 .FIG. 4 shows a diagram when intervals (and the average diameter) between Ag phases adjacent to each other were determined graphically from the results of the isoconcentration surface of the Ag phases shown inFIG. 2 . - In the 3DAP method, in the cross section orthogonal to the longitudinal direction of the Cu-Ag alloy wire, an Ag threshold value of the same concentration as the Ag concentration was set, and a portion in which a concentration distribution exceeding this threshold value was confirmed was tentatively assumed to be the Ag phase. In this way, on a plane in the longitudinal direction, as shown in
FIG. 1 , an image diagram in which Ag phases having an atomic concentration exceeding the predetermined threshold value were viewed in the longitudinal direction was able to be measured. As shown inFIG. 2 , an image diagram in which the Ag phases having the atomic concentration exceeding the predetermined threshold value were viewed in the direction of the cross section was able to be measured. - The identification of the Ag phases here was performed by assigning Ag confirmed when 3.5 at% of the Ag isoconcentration surface in the cross section of the alloy wire was set to a threshold value as shown in
FIG. 2 , and counting the number of phases. - In accordance with the previous tentative Ag phase, profile analysis was performed along the longitudinal direction, and a phase which continuously had an Ag atomic concentration of 0.5 to 50.0% in the length of 60 nm was selected as the Ag phase.
FIGS. 3 and 4 show the results of the analysis described above, inFIG. 3 , the result obtained by assigning the Ag phases in the longitudinal direction is shown in the longitudinal direction of the wire and inFIG. 4 , the result obtained by assigning the Ag phases is shown from the cross section of the wire. For the average diameter of the Ag phases, the Ag phase was assumed to be a perfect circle from the cross section orthogonal to the longitudinal direction for the selected Ag phase, and the average diameter was calculated by the area thereof. This series of analyses can be performed using IVAS, which is software for the 3DAP device provided by CAMECA. -
FIG. 1 shows data obtained by measuring, with the 3DAP device, Ag phases in a tip portion from a first position (position of 0 nm) corresponding to a tip to a second position (position of 140 nm) corresponding to the length of 140 nm in a substantially conical sample which was prepared from the Cu-Ag alloy wire (Ag concentration: 2.0 mass%) in the embodiment of the present invention, and shows the isoconcentration surface of the Ag phases having an Ag atomic concentration of 2.0 atomic% when the tip portion of the sample was measured from its side surface side.FIG. 2 shows data obtained by the same manner as inFIG. 1 , and shows the isoconcentration surface of the Ag phases having an Ag atomic concentration of 3.5 atomic% when a lower part of the tip portion of the sample from a third position (position of 80 nm) corresponding to the length of 80 nm from the first position to the second position (position of 140 nm) was measured from its upper surface side.FIG. 3 shows a diagram when the directions of extension of and the number of Ag phases were determined graphically from the results of the isoconcentration surface of the Ag phases shown inFIG. 2 .FIG. 4 shows a diagram when the average diameter of the Ag phases was determined graphically from the results of the isoconcentration surface of the Ag phases shown inFIG. 2 . - The Cu-Ag alloy wire of the present invention includes, in the parent phase, a plurality of Ag phases which are connected in a substantially longitudinal direction of the Cu-Ag alloy wire so as to be distributed linearly. Although it is found in
FIGS. 1 and3 that the Ag phases are not perfectly aligned in the longitudinal direction, the Ag phases extend substantially parallel to each other along the longitudinal direction of the wire. The Ag phases are phases in which the Ag atomic concentration is 0.5 to 50.0% and which are connected in the longitudinal direction. The "phases connected in the longitudinal direction" mentioned here means that the Ag atom concentration is constant to form a uniform phase in the longitudinal direction but varies from 0.5 to 50.0% to form phases. Here, the atomic concentration indicates the existence ratio of Ag, and when the atomic concentration is less than 0.5%, it is impossible to distinguish whether Ag is in a precipitated state or in a solid solution state, with the result that the second phase cannot be determined. When the atomic concentration exceeds 50.0%, the Ag phases are sufficiently coarse and the phase intervals are more likely to be sparse, with the result that high tensile strength cannot be obtained. Hence, in the Ag phases, the Ag atomic concentration needs to be in a range of 0.5 to 50.0 atomic%. When the Ag phases are not connected in the longitudinal direction, the intervals of the Ag phases are sparse, and thus the tensile strength and the bending fatigue resistance cannot be increased. Therefore, a plurality of Ag phases are formed to be connected in a substantially longitudinal direction of the Cu-Ag alloy wire so as to be distributed linearly. - The average diameter of the Ag phases when measured in the cross section orthogonal to the longitudinal direction is preferably in a range of 0.5 to 20 nm. When the average diameter of the Ag phases is less than 0.5 nm, the average diameter is substantially equal to the atomic diameter, and thus it is difficult to determine, with the resolution of an existing analytical device, whether Ag is in a solid solution state or in a precipitated state whereas since a range of 0.5 nm or more is specified and thus a relationship with the properties can be sufficiently clarified, 0.5 nm is set as the lower limit. Since a diameter larger than 20 nm has a low abundance ratio and a wide phase interval, it hardly contributes to densification. Hence, the enhancement of the tensile strength and the bending fatigue resistance is at a negligible level, and thus the diameter equal to or greater than 20 nm does not need to be targeted. Therefore, in the Cu-Ag alloy wire of the present invention, the phase in which the measurement is performed with the 3DAP device, the analysis is performed with IVAS, the Ag atomic concentration is in a range of 0.5 to 50.0 atomic% and the average diameter is in a range of 0.5 to 20 nm is assumed to be the Ag phase.
- In these metal structures, the crystal grain size of the Cu-Ag alloy wire is observed with a scanning transmission electron microscope (STEM). The STEM is a device which applies an electron beam to a sliced sample, captures electron information transmitted through the sample and performs high-magnification, high-resolution observation at such a level that it is possible to directly observe atomic and molecular images. Here, the STEM applies an electron beam focused to the minimum to the sample, and thereby can image an atomic image distribution, a form, a composition image, a crystal structure and the like inside the sample. The STEM can also capture an atomic image and the structure of a substance on the order of sub-nanometers.
- The sample to be observed with the STEM was prepared by a focused ion beam (FIB) method. SIINT-3050TB was used, and with an acceleration voltage of 30 kV for a Ga ion beam, working was performed. In order to remove damage caused by the FIB, Ar ion milling of 2 kV was performed for 5 minutes after FIB thin film working. For the STEM observation, ARM made by JEOL Ltd. with an aberration correction function was used, and an electron beam acceleration voltage was 200 kV. In the STEM observation, bright field (BF) and high-angle annular dark field (HAADF) were shot. Energy dispersive X-ray spectroscopy (EDX) attached to the STEM was used for elemental analysis. For the average crystal grain size of the parent phase, a cutting method (JIS H 0501) was used on the obtained bright field image (BF) in the cross section of the wire. The number of crystal grains completely cut by a line segment of a known length was counted regardless of its direction on the image, and the average value (nm) of the cut lengths was assumed to be the average crystal grain size.
-
FIG. 5 is a photograph of a bright field image (BF) showing a metal structure in a cross section orthogonal to the longitudinal direction of the Cu-Ag alloy wire observed with the STEM. Here, the scale shown inFIG. 5 is 20 nm. As shown inFIG. 5 , in the Cu-Ag alloy wire of the present invention, the average crystal grain size of the parent phase when measured in the cross section orthogonal to the longitudinal direction is found to be in a range of 10 to 60 nm. - Hence, in a conventional Cu-Ag alloy wire, in general, the average crystal grain size of the parent phase is on the order of sub-microns (0.1 um or more) and is at least greater than 60 nm. However, in the Cu-Ag alloy wire of the present invention, the average crystal grain size is in a range of 10 to 60 nm. The parent phase is mainly composed of Cu and Ag in a solid solution state, and when the average crystal grain size observed from the cross section is less than 10 nm, the effect on the properties is unknown but the effect was not confirmed in the scope of the present invention. When the average crystal grain size is in the range, the grain boundary thereof plays a role of suppressing the movement of dislocations and accumulating the dislocations, and can contribute to enhancement of strength (Hall-Fetch rule). When the average crystal grain size exceeds 60 nm, the tensile strength is finally lowered. Although conventionally, the average crystal grain size is significantly coarse, in the Cu-Ag alloy wire of the present invention, the average crystal grain size is controlled to be in a range of 10 to 60 nm, and thus high tensile strength and bending fatigue resistance which have not been conventionally realized are achieved. Specifically, when the crystal grain size is large, the amount of deformation in one crystal grain size is large, and thus shear deformation within the crystal grain progresses, with the result that a shear band develops strongly. A large amount of precipitation remarkably causes stress concentration on brittle grain boundaries to create a situation in which cracks are more likely to occur in the grain boundaries, and cracks in the grain boundaries occur when the crystal grain size is large, with the result that the bending fatigue resistance is degraded. When the strength of the parent phase is high but the crystal grain size is small, deformation in one crystal grain is small, the development of the shear band is suppressed and stress on the grain boundaries are dispersed, with the result that bending fatigue resistance can be satisfactorily maintained. Hence, in order to obtain satisfactory bending fatigue resistance, the average crystal grain size needs to be in a range of 10 to 60 nm.
- As described above, the average crystal grain size of the parent phase was set in a certain range, and thus the Cu-Ag alloy wire excellent in bending fatigue resistance was obtained. Furthermore, on the other hand, in order to obtain high tensile strength, it is necessary to form an Ag phase in which Ag is sufficiently brought into a solid solution state in the Cu parent phase at high temperature or Ag is finely precipitated in the Cu parent phase. In other words, both the average diameter (nm) of the Ag phases and the average grain size (nm) of the parent phase are controlled, and thus it is possible to achieve both tensile strength and bending fatigue resistance. Specifically, in the Cu-Ag alloy wire of the present invention, a product of the average diameter (nm) of the Ag phases and the average crystal grain size (nm) of the parent phase measured in the cross section (hereinafter also simply referred to as the "product") is preferably smaller than 60 times an Ag content (mass%) in the Cu-Ag alloy wire. When the product is smaller than 60 times the Ag content (mass%) in the Cu-Ag alloy wire, since the average diameter of the Ag phases and the average crystal grain size of the parent phase each are very small, sufficient strength properties and bending fatigue resistance are provided, with the result that in particular, when the average crystal grain size of the parent phase is in a range of 10 to 60 nm, the bending fatigue resistance is more improved. On the other hand, when the product is equal to or greater than 60 times the Ag content (mass%) in the Cu-Ag alloy wire, the Ag phases are significantly coarse as compared with the crystal grain size of the parent phase, with the result that the tensile strength tends to be lowered. Hence, in the Cu-Ag alloy wire of the present invention, the product is set smaller than 60 times the Ag content (mass%) in the Cu-Ag alloy wire. Until now, it has been difficult to finely manufacture the crystal grain size of the parent phase, and it has also been difficult to finely precipitate the Ag phases in the parent phase. In the Cu-Ag alloy wire of the present invention, both the average diameter (nm) of the Ag phases and the average crystal grain size (nm) of the parent phase measured in the cross section can be controlled to be small in a well-balanced manner.
- At present, Cu-Ag alloy wires tend to have a smaller diameter, and ultrafine wires are often used. Hence, high tensile strength and high bending fatigue resistance are required. In the Cu-Ag alloy wire of the present invention, the metal structure described above is formed, and thus it is possible to obtain at least a tensile strength of 900 MPa or more and more preferably a tensile strength of 1000 MPa or more. Therefore, even when the diameter of the Cu-Ag alloy wire is reduced, the Cu-Ag alloy wire having high strength can be obtained. When ultrafine wires are used, high electrical conductivity is required. In the Cu-Ag alloy wire of the present invention, the amounts of additive elements and optional additive elements to be added are reduced, and thus it is possible to obtain at least an electrical conductivity of 65% IACS or more and more preferably an electrical conductivity of 75% IACS or more.
- The Cu-Ag alloy wire of the present invention is a round wire which has a diameter of 0.01 to 0.08 mm and in which its cross section is substantially circular. Even in an ultrafine wire (Cu-Ag alloy wire) having a diameter of 0.01 to 0.08 mm, it is desirable that high tensile strength and high electrical conductivity are provided. Cu-Ag alloy wires having a diameter of 0.01 mm or less cannot be said to have the sufficient needs of users. On the other hand, Cu-Ag alloy wires having a diameter exceeding 0.08 mm do not play a role as an ultrafine wire. The Cu-Ag alloy wire may be a ribbon wire having a ribbon shape in which its cross section is substantially rectangular instead of being substantially circular. Preferably, as the dimensions of the ribbon shape, due to the same reasons as the upper and lower limits of the wire diameter, its width is 0.02 to 0.32 mm and its thickness is 0.002 to 0.040 mm. As a manufacturing method, for example, there is a method of rolling the drawn round wire into a desired shape. The plate width corresponds to the width direction of rolling rolls, and the plate thickness corresponds to the direction between the rolls and in rolling roll non-contact portions at ends in the direction of the plate width, portions having such a shape that an arc is maintained while being deformed are left. Here, in the cross section of the ribbon wire, a higher value is assumed to be the width, and a lower value is assumed to be the thickness.
- A method for manufacturing the Cu-Ag alloy wire of the present invention will be described. The manufacturing method described here is an example of the manufacturing method in the present invention, and the manufacturing method in the present invention is not limited to this method. The method for manufacturing the Cu-Ag alloy wire of the present invention includes: a casting step of melting and casting a Cu-Ag alloy material having the chemical composition described above and cooling it to obtain an ingot; a first drawing step of subjecting wire drawing treatment to the Cu-Ag alloy material obtained from the ingot; a first heat treatment step of performing heat treatment on the Cu-Ag alloy material subjected to the wire drawing treatment; a second heat treatment step; and a second drawing step of subsequently performing final wire drawing treatment to obtain the Cu-Ag alloy wire. During the wire drawing treatment in the second drawing step,
distortion removal annealing treatment can be performed. - In the casting step, the cooling rate is set to 10°C/second or more in order to suppress an excessive Ag crystal precipitate in the Cu parent phase during cooling in the casting. When the size of the crystal precipitate in the casting is increased, the Ag phase having an appropriate diameter is not provided even by wire drawing in the subsequent wire drawing treatment, the interval between the Ag phases is increased, with the result that the tensile strength in the final Cu-Ag alloy wire is lowered.
- Then, in the first drawing step, the wire drawing treatment is performed after the casting step and before the heat treatment step. The reduction ratio is preferably about 50 to 90% in order to promote sufficient precipitation of Ag during the heat treatment. When the reduction ratio is less than 50%, sufficient precipitation is not achieved, and the precipitation is decreased according to an increase in strength for the reduction ratio in the second drawing step and the subsequent steps. This is because the Cu-Ag alloy wire tends to be insufficient in strength when the diameter is large, and thus it is difficult to obtain high tensile strength. On the other hand, in the wire drawing treatment in which the reduction ratio is equal to or greater than 90%, the precipitation is promoted but the reduction ratio cannot be set high in the subsequent wire drawing treatment after the heat treatment, and thus it is difficult to obtain high tensile strength, with the result that an upper limit of 90% is preferably provided. When a cross-sectional area before the wire drawing treatment is assumed to be S1 and a cross-sectional area after the wire drawing treatment is assumed to be S2, the reduction ratio is defined by the following formula: reduction ratio = ((S1-S2)/S1) × 100 (%).
- Then, in the first heat treatment step, while the ingot is being drawn into its final diameter, at least two heat treatment steps are introduced. The heat treatment described above is intended to precipitate Ag, and the heat treatment is performed under conditions below: the holding temperature in the first heat treatment step is in a range of 350 to 450°C, the holding temperature in the second heat treatment step is in a range of 250 to 375°C and the total time of the heat treatment is in a range of 10 to 50 hours. The second heat treatment step needs to be performed at a temperature lower than the first heat treatment step by 250°C or more. The second heat treatment step which is lower in temperature than the first heat treatment step is introduced, and thus a large amount of precipitation of the Ag phases is achieved in the first heat treatment having large driving power, and the final amount of precipitation of the Ag phases is controlled in the second heat treatment step in which the solid solubility limit is narrow and its driving power is lowered due to the low temperature. When the heat treatment temperature is low or the treatment time is short, since recrystallization does not proceed at this point, and the growth of the Ag phases does not occur, the average crystal grain size of the parent phase after the final step cannot be in a range of 10 to 60 nm, with the result that the product of the average diameter of the Ag phases and the average crystal grain size of the parent phase tends to be equal to or greater than 60 times the Ag concentration. When the heat treatment temperature is high or the treatment time is long, both recrystallized grains and the Ag phases are coarse, and likewise, in this case, the desired final structure cannot be obtained. For the control of the product of the average diameter of the Ag phases and the average crystal grain size of the parent phase, driving force for the growth of each structure greatly changes depending on the amount of plastic working before the heat treatment, and the optimum heat treatment conditions also change, with the result that in order to obtain the structure in the present invention, it is necessary to perform fine control.
- Then, in the second drawing step, in order to sufficiently realize the strength properties of the present alloy, the reduction ratio in the second drawing step is preferably in a range of about 95 to 99.9999%. When the reduction ratio is low, both the crystal grain size of the parent phase and the Ag phases do not satisfy the quantities in the size of the invention, and the tensile strength is not sufficiently increased. The upper limit of the reduction ratio is provided by realistic restrictions and is not related to the properties. In the second drawing step, the reduction ratio per pass is set in a range of 15 to 35%. The reduction ratio greater than this rate may cause the wire to break. It has been confirmed that depending on the combination of the previous steps, that is, the wire drawing step and the heat treatment step, when the reduction ratio is increased, the tensile strength is saturated or is lowered in some cases. Although the details of this phenomenon are not clear, it is assumed that changes in the structure, such as dislocation distribution and crystal orientation distribution, which contribute to the tensile strength occur. If the wire drawing step is further continued when the tensile strength is saturated, the bending fatigue resistance is often adversely affected, and thus it is necessary to apply heat treatment before that stage to suppress the phenomenon. When high-temperature long-time heating which significantly lowers the tensile strength is applied, the tensile strength at the final wire diameter after the wire drawing is also lowered, and thus heat treatment at 200 to 400°C for 10 minutes to 2 hours is desirable.
- The ribbon-shaped wire was manufactured by rolling the wire manufactured into the circular shape described above to a specified thickness. Depending on the wire drawing before the heat treatment and the combination of heat treatment conditions and final wire drawing conditions, work hardening may be saturated to further reduce the strength. When the work hardening is saturated, the bending fatigue resistance and the like accompanied by twisting may be adversely affected, and thus it is effective to apply an intermediate heat treatment for the purpose of distortion removal without large softening.
- Although it does not contribute to the properties, a stripping step can be included in the process to facilitate the wire drawing treatment. A finishing heat treatment step is provided in which heat treatment is performed at the end of the manufacturing process, and thus it is possible to obtain the final Cu-Ag alloy wire (product after the heat treatment). Although the conditions of this final heat treatment are not particularly limited, the final heat treatment is preferably performed at a temperature of 450 to 600°C for 10 seconds to 30 minutes.
- The present invention will be described in detail based on Examples below. The present invention is not limited to Examples described below.
- In the air, Cu-Ag alloys having chemical compositions below were dissolved, were cast and were cooled at a cooling rate of 8 to 50°C/second and thus ingots with diameters of 4.6 to 11.4 mm were produced (casting step); the chemical compositions were Cu-1.5 mass% Ag (Examples 1-1 to 1-12 and Comparative Examples 1-1 to 1-11), Cu-2.0 mass% Ag (Examples 2-1 to 2-12 and Comparative Examples 2-1 to 2-11), Cu-4.0 mass% Ag (Examples 3-1 to 3-12 and Comparative Examples 3-1 to 3-11), Cu-6.0 mass% Ag (Examples 4-1 to 4-12 and Comparative Examples 4-1 to 4-11), Cu-0.5 mass% Ag, -0.8 mass% Ag, -6.5 mass% Ag and -8.0 mass% Ag (Comparative Examples 5-1, 5-2, 5-3 and 5-4) and Cu-2.0 mass% Ag-(one component of Sn, Mg, Zn, In, Ni, Co, Zr and Cr) (Examples 6-1 to 6-8 and Comparative Examples 6-1 to 6-3).
- Then, the ingots were drawn such that the reduction ratio was 35 to 95%, and thus the wire diameter was set to 1.0 to 9.5 mm (first drawing step). Then, aging heat treatment for both precipitation and recrystallization was performed at 350 to 550°C for 3 to 50 hours (first heat treatment step). Then, the aging heat treatment was likewise performed at a lower holding temperature of 250 to 375°C for 1 to 60 hours (second heat treatment step). Furthermore, after cooling, cold wire drawing was performed such that the reduction ratio was 99.7 to 99.998% and the wire diameter was 0.02 to 0.08 mm (second drawing step). Distortion removal annealing was performed during the cold wire drawing in the second drawing step.
- In the Cu-Ag alloy wires manufactured as described above, tensile strength and bending fatigue resistance were measured and electrical conductivity was measured as necessary, and the metal structure was analyzed with a 3DAP device and analysis software and the metal structure was observed and analyzed with a STEM and accompanying EDX.
- Although the measurement of the tensile strength did not conform to JIS Z2201 because the sample shape was the original wire shape, the test conditions conformed to JIS Z2241, the tensile strength was measured with three samples (n=3) and the average value (MPa) of the measured tensile strength was used as the measured value.
- For the bending fatigue resistance, a repeated bending test was performed in accordance with JIS H 0500 No. 4100. Considering that the fatigue resistance depends on the wire diameter, the test was performed using all the wires which were manufactured to have an outer diameter of 0.03 mm. The radius R of a jig at a bending fulcrum at the time of bending was set to 6 mm, one end was fixed to a grip, a weight of 30 g was suspended such that the other end was not bent, the number of times the bending was performed until disconnection was measured and an evaluation was performed by whether or not the average value thereof (average bending life, n=5) satisfied the relationships of formulae 1 and 2 below. Specifically, it was assumed that when the average bending life satisfied formula 1 below, the bending fatigue resistance was excellent (indicated by "⊙"), when the average bending life did not satisfy formula 1 but satisfied formula 2, the bending fatigue resistance was satisfactory (indicated by "o") and when the bending fatigue resistance satisfied neither formula 1 nor formula 2, the bending fatigue resistance was inferior (indicated by "x").
- Formula 1: average bending life ≥ 5900 × (Ag concentration) + 40000
- Formula 2: average bending life ≥ 5900 × (Ag concentration) + 20000
- The electrical conductivity was measured using a four-terminal method based on JIS H0505-1975 in a thermostatic chamber controlled at 20°C (± 1°C) twice for each sample, and the average value (%IACS) thereof was used as the measured value. Here, the distance between the terminals was set to 100 mm.
- Since the Ag phase of the second phase had sub-nano to nano-order sizes, the observation and analysis of the metal structure of the Cu-Ag alloy wire were performed with the 3DAP device and the analysis software. Since the crystal grain size of the parent phase had sub-nano to nano-order sizes, the observation and analysis of the metal structure were performed with the scanning transmission electron microscope (STEM).
- The 3DAP device evaporates materials, detects the evaporated atoms with a two-dimensional detector and reconstructs data to be able to visualize a three-dimensional structure on the order of nanometers. The preparation of a sample for three-dimensional atom probe measurement was performed with FIB.
- SIINT-3050TB and Helios G4 (made by FEI Company Ltd.) were used as the FIB. A Ga ion beam of an acceleration voltage of 30 kV was used, and thus the conical sample having a circular bottom surface with a diameter of about 80 nm and a length of about 140 nm was prepared. Although as the direction of the analysis, the longitudinal direction of the Cu-Ag alloy wire was assumed to be the length direction of the sample, the diameter direction of a cross section orthogonal to the longitudinal direction of the Cu-Ag alloy wire may be assumed to be the length direction. Final finishing was performed with a 5 kV ion beam to reduce a damaged layer as much as possible.
- As the 3DAP device, LEAP4000XSi (made by AMETEK) was used. Vaporization was performed by using ultraviolet light having a wavelength of 355 nm as pulsed laser which was applied. A voltage of 1 to 5 kV was applied to the sample. The analysis software such as IVAS 3.8.8 (made by CAMECA) or IVAS LT was used to analyze the atomic concentration of the Ag phases and the shortest interval.
- In the 3DAP method, in the cross section orthogonal to the longitudinal direction of the Cu-Ag alloy wire, an Ag threshold value of the same concentration as the Ag concentration was set, and a portion in which a concentration distribution exceeding this threshold value was confirmed was tentatively assumed to be the Ag phase. In accordance with the tentative Ag phase, profile analysis was performed along the longitudinal direction, and a phase which continuously had an Ag atomic concentration of 0.5 to 50.0% in the length of 60 nm was selected as the Ag phase. For the average diameter of the Ag phases, the Ag phase was assumed to be a perfect circle from the cross section orthogonal to the longitudinal direction for the selected Ag phase, and the average diameter was calculated by the area thereof.
- For the STEM observation, an atomic resolution analytical electron microscope (ARM: JEM-ARM200F made by JEOL Ltd.) with an aberration correction function was used. The observation was performed with an electron beam acceleration voltage of 200 kV. The STEM observation was performed on bright field (BF) and high-angle annular dark field (HAADF), and energy dispersive X-ray spectroscopy (EDX) attached to the STEM was used for elemental analysis.
- The average crystal grain size was calculated by a cutting method using the obtained bright field image (BF). The cutting method was based on the provisions of JIS H 0501. When the crystal grains of the parent phase were very fine and it was difficult to make a determination only with the STEM, the results of analysis performed with the 3DAP device were also used to determine the average value. Then, the product of the average diameter of the Ag phases and the average crystal grain size of the parent phase was calculated.
- In Examples 1-1 to 1-12 and Comparative Examples 1-1 to 1-11, the Cu-Ag alloy wire having the chemical composition of Cu-1.5 mass% Ag was used, and samples were prepared while the rates of working in the first and second drawing steps and manufacturing conditions in the first and second heat treatment steps were being changed.
- Table 1 shows manufacturing conditions in Examples 1-1 to 1-12 and Comparative Examples 1-1 to 1-11. In Example 1-10, working was performed to provide a circular sample with a final diameter of 0.03 mm, and thus the sample was molded into a ribbon shape having a thickness of 0.008 mm and a width of 0.08 mm. Underlines shown in the table indicate that they were outside the scope of the present invention.
[Table 1] (Cu-1.5 mass% Ag alloy wire) Examples Comparative Examples Casting (cooling rate) (°C/s) First drawing reduction ratio(%) First heat treatment Second heat treatment Second drawing reduction ratio(%) Distortion removal annealing Holding temperature(°C) Holding time(h) Holding temperature(°C) Holding time(h) Example1-1 15 65 400 25 375 10 99998 ○ Example1-2 45 65 400 25 350 10 99998 ○ Example1-3 45 50 400 20 350 15 99998 ○ Example1-4 45 65 400 10 300 15 99998 ○ Example1-5 45 65 450 10 300 15 99998 ○ Example1-6 45 65 375 10 350 10 99.998 ○ Example1-7 45 65 425 8 350 4 99.998 ○ Example1-8 45 65 450 5 325 15 99.998 ○ Example1-9 45 65 450 5 300 15 99.998 ○ Example1-10 45 65 400 10 275 15 99.99 ○ Example1-11 45 65 400 15 250 15 99.998 ○ Example1-12 45 90 400 10 300 15 99.9 ○ Comparative Example 1-1 5 65 400 15 350 10 99.998 ○ Comparative Example 1-2 45 35 400 15 350 10 99.998 ○ Comparative Example 1-3 45 65 300 10 225 10 99.998 ○ Comparative Example 1-4 45 65 550 10 550 10 99.998 ○ Comparative Example 1-5 45 65 400 1 325 6 99.998 ○ Comparative Example 1-6 45 65 450 60 375 5 99.998 ○ Comparative Example 1-7 45 65 400 20 500 10 99.998 ○ Comparative Example 1-8 65 65 350 10 225 10 99.998 ○ Comparative Example 1-9 45 65 450 40 400 40 99.998 ○ Comparative Example 1-10 45 65 375 10 - - 99.998 ○ Comparative Example 1-11 45 90 450 10 375 15 99.7 ○ - Table 2 shows metal structures and the results of evaluation of properties in Examples 1-1 to 1-22 and
(Cu-1.5 mass% Ag alloy wire) Examples Comparative Examples Final wire diameter (mm φ) Average crystal grain size of parent phase (nm) Average diameter of Ag phases (nm) Average diameter of Ag phases × average crystal grain size of parent phase Tensile strength (MPa) Bending fatigue resistance Example1-1 0.03 45 10 45 1080 ⊚ Example1-2 0.03 35 0.8 28 1120 ⊚ Example1-3 0.03 32 2.2 70 1100 ⊚ Example1-4 0.03 45 1.5 68 1120 ⊚ Example1-5 0.03 48 3.0 144 1090 ○ Example1-6 0.03 40 2.5 100 1110 ○ Example1-7 0.03 53 1.5 80 1115 ⊚ Example1-8 0.03 38 10 38 1130 ⊚ Example1-9 0.03 45 1.6 72 1090 ⊚ Example1-10 0.03→ Plate thickness of 0.008 mm Width of 0.08 mm 38 20 76 1080 ⊚ Example1-11 0.02 42 25 105 1085 ○ Example1-12 0.08 55 1.6 88 1050 ⊚ Comparative Example 1-1 0.03 82 15 1230 1020 × Comparative Example 1-2 0.03 75 13 975 1015 × Comparative Example 1-3 0.03 78 12 936 1050 × Comparative Example 1-4 0.03 90 17 1530 980 × Comparative Example 1-5 0.03 85 15 1275 1020 × Comparative Example 1-6 0.03 80 15 1200 990 × Comparative Example 1-7 0.03 90 16 1440 1035 × Comparative Example 1-8 0.03 100 15 1500 1020 × Comparative Example 1-9 0.03 85 15 1275 1030 × Comparative Example 1-10 0.03 73 16 1168 1030 × Comparative Example 1-11 0.08 95 25 2375 1050 × - As shown in Table 2, in each of Examples 1-1 to 1-12, the average crystal grain size of the parent phase, the average diameter of the Ag phases and the product were in the scope of the present invention. Each tensile strength had a high strength of 1100 MPa or more. Since in Examples 1-5, 1-6 and 1-11, the product exceeded 90 which was the value of 60 times the Ag content (mass%), the bending fatigue resistance was "o". Since in Examples 1-1 to 1-4, 1-7 to 1-10 and 1-12, the product was equal to or less than 90 which was the value of 60 times the Ag content (mass%), the bending fatigue resistance was "⊙". In Comparative Examples 1-1 to 1-11, each tensile strength was equal to or greater than 980 MPa which was less than those in Examples 1-1 to 1-12. Since the average crystal grain size of the parent phase was outside the scope of the present invention and the product was also outside the scope of the present invention to be greater than 90, the bending fatigue resistance was "x".
- In Examples 2-1 to 2-12 and Comparative Examples 2-1 to 2-11, the Cu-Ag alloy wire having the chemical composition of Cu-2.0 mass% Ag was used, and samples were prepared.
- Table 3 shows manufacturing conditions in Examples 2-1 to 2-12 and Comparative Examples 2-1 to 2-11.
[Table 3] (Cu-2.0 mass% Ag alloy wire) Examples Comparative Examples Casting (cooling rate) (°C/s) First drawing reduction ratio(%) First heat treatment Second heat treatment Second drawing reduction ratio(%) Distortion removal annealing Holding temperature(°C) Holding time(h) Holding temperature(°C) Holding time(h) Example2-1 15 65 400 25 375 10 99998 ○ Example2-2 45 65 400 25 350 10 99998 ○ Example2-3 45 50 400 20 350 15 99998 ○ Example2-4 45 65 400 10 300 15 99998 ○ Example2-5 45 65 450 10 300 15 99998 ○ Example2-6 45 65 375 10 350 10 99998 ○ Example2-7 45 65 425 8 350 4 99.998 ○ Example2-8 45 65 450 5 325 15 99998 ○ Example2-9 45 65 450 5 300 15 99998 ○ Example2-10 45 65 400 10 275 15 99.99 ○ Example2-11 45 65 400 15 250 15 99.998 ○ Example2-12 45 90 400 10 300 15 99.9 ○ Comparative Example 2-1 5 65 400 15 350 10 99998 ○ Comparative Example 2-2 45 35 400 15 350 10 99998 ○ Comparative Example 2-3 45 65 300 10 225 10 99998 ○ Comparative Example 2-4 45 65 550 10 550 10 99998 ○ Comparative Example 2-5 45 65 400 1 325 6 99.998 ○ Comparative Example 2-6 45 65 450 60 375 5 99.998 ○ Comparative Example 2-7 45 65 400 20 500 10 99998 ○ Comparative Example 2-8 65 65 350 10 225 10 99998 ○ Comparative Example 2-9 45 65 450 40 400 40 99998 ○ Comparative Example 2-10 45 65 375 10 - - 99998 ○ Comparative Example 2-11 45 90 450 10 375 15 99.7 ○ - Table 4 shows metal structures and the results of evaluations of properties in Examples 2-1 to 2-12 and Comparative Examples 2-1 to 2-11. The value of 60 times the Ag content (mass%) was "120".
[Table 4] (Cu-2.0 mass% Ag alloy wire) Examples Comparative Examples Final wire diameter (mmφ) Average crystal grain size of parent phase (nm) Average diameter of Ag phases (nm) Average diameter of Ag phases × average crystal grain size of parent phase Tensile strength (MPa) Bending fatigue resistance Example2-1 0.03 42 25 105 1150 ⊚ Example2-2 0.03 33 3 99 1200 ⊚ Example2-3 0.03 28 4 112 1190 ⊚ Example2-4 0.03 35 3 105 1190 ⊚ Example2-5 0.03 40 5 200 1180 ○ Example2-6 0.03 35 45 158 1170 ○ Example2-7 0.03 38 4 152 1190 ○ Example2-8 0.03 28 7 196 1200 ○ Example2-9 0.03 23 5 115 1180 ⊚ Example2-10 0.03→ Plate thickness of 0.008 mm Width of 0.08 mm 32 6 192 1160 ○ Example2-11 0.02 30 5 150 1170 ○ Example2-12 0.08 37 7 259 1160 ○ Comparative Example 2-1 0.03 72 15 1080 1090 × Comparative Example 2-2 0.03 69 13 897 1070 × Comparative Example 2-3 0.03 66 12 792 1080 × Comparative Example 2-4 0.03 70 16 1120 1010 × Comparative Example 2-5 0.03 75 15 1125 1100 × Comparative Example 2-6 0.03 72 10 720 1035 × Comparative Example 2-7 0.03 75 10 750 1075 × Comparative Example 2-8 0.03 72 15 1080 1080 × Comparative Example 2-9 0.03 73 15 1095 1070 × Comparative Example 2-10 0.03 68 15 1020 1090 × Comparative Example 2-11 0.08 76 22 1672 1100 × - As shown in Table 4, in each of Examples 2-1 to 2-12, the average crystal grain size of the parent phase, the average diameter of the Ag phases and the product were in the scope of the present invention. Each tensile strength had a high strength of 1100 MPa or more. Since in Examples 2-5 to 2-8 and 2-10 to 2-12, the product exceeded 120 which was the value of 60 times the Ag content (mass%), the bending fatigue resistance was "o". Since in Examples 2-1 to 2-4 and 2-9, the product was equal to or less than 120 which was the value of 60 times the Ag content (mass%), the bending fatigue resistance was "⊙". In Comparative Examples 2-1 to 2-11, the average crystal grain size of the parent phase and the product were outside the scope of the present invention, and each tensile strength was equal to or greater than 1000 MPa which was less than those in Examples 2-1 to 2-12. Since the product was greater than 120, the bending fatigue resistance was "x".
- In Examples 3-1 to 3-12 and Comparative Examples 3-1 to 3-11, the Cu-Ag alloy wire having the chemical composition of Cu-4.0 mass% Ag was used, and samples were prepared.
- Table 5 shows manufacturing conditions in Examples 3-1 to 3-12 and Comparative Examples 3-1 to 3-11.
[Table 5] (Cu-4.0 mass% Ag alloy wire) Examples Comparative Examples Casting (cooling rate) (°C/s) First drawing reduction ratio(%) First heat treatment Second heat treatment Second drawing reduction ratio(%) Distortion removal annealing Holding temperature(°C) Holding time(h) Holding temperature(°C) Holding time(h) Example3-1 15 65 400 25 375 10 99998 ○ Example3-2 45 65 400 25 350 10 99998 ○ Example3-3 45 50 400 20 350 15 99998 ○ Example3-4 45 65 400 10 300 15 99998 ○ Example3-5 45 65 450 10 300 15 99998 ○ Example3-6 45 65 375 10 350 10 99998 ○ Example3-7 45 65 425 8 350 4 99.998 ○ Example3-8 45 65 450 5 325 15 99998 ○ Example3-9 45 65 450 5 300 15 99998 ○ Example3-10 45 65 400 10 275 15 99.99 ○ Example3-11 45 65 400 15 250 15 99998 ○ Example3-12 45 90 400 10 300 15 99.9 ○ Comparative Example 3-1 5 65 400 15 350 10 99998 ○ Comparative Example 3-2 45 35 400 15 350 10 99998 ○ Comparative Example 3-3 45 65 300 10 225 10 99998 ○ Comparative Example 3-4 45 65 550 10 550 10 99998 ○ Comparative Example 3-5 45 65 400 1 325 6 99.998 ○ Comparative Example 3-6 45 65 450 60 375 5 99.998 ○ Comparative Example 3-7 45 65 400 20 500 10 99998 ○ Comparative Example 3-8 45 65 350 10 225 10 99.998 ○ Comparative Example 3-9 45 65 450 40 400 40 99998 ○ Comparative Example 3-10 45 65 375 10 - - 99998 ○ Comparative Example 3-11 45 90 450 10 375 15 99.7 ○ - Table 6 shows metal structures and the results of evaluation of properties in Examples 3-1 to 3-12 and Comparative Examples 3-1 to 3-11.
[Table 6] (Cu-4.0 mass% Ag alloy wire) Examples Comparative Examples Final wire diameter (mmφ) Average crystal grain size of parent phase (nm) Average diameter of Ag phases (nm) Average diameter of Ag phases × average crystal grain size of parent phase Tensile strength (MPa) Bending fatigue resistance Example3-1 0.03 22 10 220 1360 ⊚ Example3-2 0.03 25 12 300 1390 ○ Example3-3 0.03 20 8 160 1400 ⊚ Example3-4 0.03 26 13 338 1410 ○ Example3-5 0.03 24 12 288 1380 ○ Example3-6 0.03 20 8 160 1380 ⊚ Example3-7 0.03 18 12 216 1395 ⊚ Example3-8 0.03 26 9 234 1380 ⊚ Example3-9 0.03 21 11 231 1370 ⊚ Example3-10 0.03→ Plate thickness of 0.008 mm Width of 0.08 mm 22 12 264 1370 ○ Example3-11 0.02 25 14 350 1390 ○ Example3-12 0.08 26 13 338 1360 ○ Comparative Example 3-1 0.03 64 22 1408 1150 × Comparative Example 3-2 0.03 68 17 1156 1180 × Comparative Example 3-3 0.03 73 18 1314 1170 × Comparative Example 3-4 0.03 62 16 992 1190 × Comparative Example 3-5 0.03 68 15 1020 1120 × Comparative Example 3-6 0.03 70 17 1190 1200 × Comparative Example 3-7 0.03 73 13 949 1130 × Comparative Example 3-8 0.03 78 16 1248 1140 × Comparative Example 3-9 0.03 73 14 1022 1100 × Comparative Example 3-10 0.03 70 15 1050 1090 × Comparative Example 3-11 0.08 68 25 1700 1100 × - In each of Examples 3-1 to 3-12, the average crystal grain size of the parent phase, the average diameter of the Ag phases and the product were in the scope of the present invention. Each tensile strenght had a high strenght of 1300 MPa or more. Sincer in Examples 3-2, 3-4, 3-5 and 3-10 to 3-12, the product exceeded 240 which was the value of 60 times the Ag content (mass%), the bending fatigue resistance was "o". Since in Examples 3-1, 3-3 and 3-6 to 3-9, the product was equal to or less than 240 which was the value of 60 times the Ag content (mass%), the bending fatigue resistance was "⊙". In Comparative Examples 3-1 to 3-11, the average crystal grain size of the parent phase and the product were outside the scope of the present invention, and each tensile strength was equal to or greater than 1000 MPa which was less than those in Examples 3-1 and 3-2. Since the product was greater than 240, the bending fatigue resistance was "x".
- In Examples 4-1 to 4-12 and Comparative Examples 4-1 to 4-11, the Cu-Ag alloy wire having the chemical composition of Cu-6.0 mass% Ag was used, and samples were prepared.
- Table 7 shows manufacturing conditions in Examples 4-1 to 4-12 and Comparative Examples 4-1 to 4-11.
[Table 7] (Cu-6.0 mass% Ag alloy wire) Examples Comparative Examples Casting (cooling rate) (°C/s) First drawing reduction ratio(%) First heat treatment Second heat treatment Second drawing red uction ratio(%) Distortion removal annealing Holding temperature(°C) Holding time(h) Holding temperature(°C) Holding time(h) Example4-1 15 65 400 25 375 10 99998 ○ Example4-2 45 65 400 25 350 10 99998 ○ Example4-3 45 50 400 20 350 15 99998 ○ Example4-4 45 65 400 10 300 15 99998 ○ Example4-5 45 65 450 10 300 15 99998 ○ Example4-6 45 65 375 10 350 10 99998 ○ Example4-7 45 65 425 8 350 4 99.998 ○ Example4-8 45 65 450 5 325 15 99998 ○ Example4-9 45 65 450 5 300 15 99998 ○ Example4-10 45 65 400 10 275 15 99.99 ○ Example4-11 45 65 400 15 250 15 99998 ○ Example4-12 45 90 400 10 300 15 99.9 ○ Comparative Example 4-1 5 65 400 15 350 10 99998 ○ Comparative Example 4-2 45 35 400 15 350 10 99998 ○ Comparative Example 4-3 45 65 300 10 225 10 99.998 ○ Comparative Example 4-4 45 65 550 10 550 10 99998 ○ Comparative Example 4-5 45 65 400 1 325 6 99.998 ○ Comparative Example 4-6 45 65 450 60 375 5 99.998 ○ Comparative Example 4-7 45 65 400 20 500 10 99998 ○ Comparative Example 4-8 45 65 350 10 225 10 99998 ○ Comparative Example 4-9 45 65 450 40 400 40 99998 ○ Comparative Example 4-10 45 65 375 10 - - 99998 ○ Comparative Example 4-11 45 90 450 10 375 15 99.7 ○ - Table 8 shows metal structures and the results of evaluations of properties in Examples 4-1 to 4-12 and Comparative Examples 4-1 to 4-11.]
[Table 8] (Cu-6.0 mass% Ag alloy wire) Examples Comparative Examples Final wire diameter (mm φ) Average crystal grain size of parent phase (nm) Average diameter of Ag phases (nm) Average diameter of Ag phases × average crystal grain size of parent phase Tensile strength (MPa) Bending fatigue resistance Example4-1 0.03 15 14 210 1360 ⊚ Example4-2 0.03 25 16 400 1390 ○ Example4-3 0.03 18 10 180 1400 ⊚ Example4-4 0.03 16 18 288 1410 ⊚ Example4-5 0.03 27 14 378 1380 ○ Example4-6 0.03 18 12 216 1380 ⊚ Example4-7 0.03 16 16 256 1395 ⊚ Example4-8 0.03 14 11 154 1380 ⊚ Example4-9 0.03 17 14 238 1370 ⊚ Example4-10 0.03→ Plate thickness of 0.008 mm Width of 0.08 mm 18 15 270 1370 ⊚ Example4-11 0.02 15 18 270 1390 ⊚ Example4-12 0.08 22 19 418 1360 ○ Comparative Example 4-1 0.03 62 25 1550 1150 × Comparative Example 4-2 0.03 66 22 1452 1180 × Comparative Example 4-3 0.03 68 23 1564 1170 × Comparative Example 4-4 0.03 72 28 2016 1190 × Comparative Example 4-5 0.03 65 22 1430 1120 × Comparative Example 4-6 0.03 67 21 1407 1200 × Comparative Example 4-7 0.03 68 26 1768 1130 × Comparative Example 4-8 0.03 63 30 1890 1140 × Comparative Example 4-9 0.03 64 25 1600 1100 × Comparative Example 4-10 0.03 67 32 2144 1090 × Comparative Example 4-11 0.08 66 42 2772 1100 × - Table 8 shows metal structures and the results of evaluations of properties in Examples 4-1 to 4-12 and Comparative Examples 4-1 to 4-11. exceeded 360 which was the value of 60 times the Ag content (mass%), the bending fatigue resistance was "∘". Since in Examples 4-1, 4-3 and 4-6 to 4-11, the product was equal to or less than 360 which was the value of 60 times the Ag content (mass%), the bending fatigue resistance was "0". In Comparative Examples 4-1 to 4-11, the average crystal grain size of the parent phase and the product were outside the scope of the present invention, and each tensile strength was equal to or greater than 1000 MPa which was less than those in Examples 4-1 to 4-12. Since the product was greater than 360, the bending fatigue resistance was "x".
- In Comparative Examples 5-1 to 5-11, the Cu-Ag alloy wires contained Ag outside the range of 1.0 to 6.0% by mass of the present invention, the Cu-Ag alloy wires having the chemical compositions of Cu-0.5 mass% Ag, Cu-0.8 mass% Ag, Cu-6.5 mass% Ag and Cu-8.0 mass% Ag were used and samples were prepared.
- Table 9 shows manufacturing conditions in Comparative Examples 5-1 to 5-4.
[Table 9] (Cu-Ag alloy wire) Examples Comparative Examples Composition (mass%) Casting (cooling rate) (°C/s) First drawing reduction ratio(%) First heat treatment Second heat treatment Second drawing reduction ratio(%) Distortion removal annealing Holding temperature(°C) Holding time(h) Holding temperature(°C) Holdingtime(h) Comparative Example 5-1 Cu-0.5Ag 45 65 400 25 375 10 99.998 ○ Comparative Example 5-2 Cu-0.8Ag 45 65 400 25 350 10 99.998 ○ Comparative Example 5-3 Cu-6.5Ag 45 50 400 20 350 15 99.998 ○ Comparative Example 5-4 Cu-8.0Ag 45 65 400 10 300 15 99.998 ○ - Table 10 shows metal structures and the results of evaluations of properties in Comparative Examples 5-1 to 5-12.
(Cu-Ag alloy wire) Examples Comparative Examples Final wire diameter (mm φ ) Average crystal grain size of parent phase (nm) Average diameter of Ag phases (nm) Average diameter of Ag phases × average crystal grain size of parent phase Tensile strength (MPa) Bending fatigue resistance Comparative Example 5-1 0.03 - - - 750 × Comparative Example 5-2 0.03 - - - 860 × Comparative Example 5-3 0.03 16 13 208 1380 ⊚ Comparative Example 5-4 0.03 24 16 384 1410 ⊚ - In Examples 6-1 to 6-8, the Cu-Ag alloy wire having the chemical composition including Cu-2.0 mass% Ag and one selected from the group consisting of Sn, Mg, Zn, In, Ni, Co, Zr and Cr was used, and samples were prepared, and in Comparative Examples 6-1 to 6-3, the Cu-Ag alloy wire having the chemical composition including Cu-2.0 mass% Ag and 0.5% by mass of each of Sn, Mg and Zr was used, and samples were prepared.
- Table 11 shows manufacturing conditions in Examples 6-1 to 6-8 and Comparative Examples 6-1 to 6-3.
[Table 11] (Cu-2.0 mass% Ag alloy wire) Examples Comparative Examples Composition (mass%) Casting (cooling rate) (°C/s) First drawing reduction ratio(%) First heat treatment Second heat treatment Second drawing reduction ratio(%) Distortion removal annealing Holding temperature(°C) Holding time(h) Holding temperature(°C) Holding time(h) Example6-1 0.1Sn 15 65 400 25 375 10 99.998 ○ Example6-2 0.1Mg 45 65 400 25 350 10 99.998 ○ Example6-3 0.3Zn 45 50 400 20 350 15 99.998 ○ Example6-4 0.1In 45 65 400 10 300 15 99.998 ○ Example6-5 0.2Ni 45 65 450 10 300 15 99.998 ○ Example6-6 0.1Co 45 65 375 10 350 10 99.998 ○ Example6-7 0.05Zr 45 65 425 8 350 4 99.998 ○ Example6-8 0.1Cr 45 65 450 5 325 15 99.998 ○ Comparative Example 6-1 0.5Sn Electrical conductivity degradation(60%IACS) Comparative Example 6-2 0.5Mg Electrical conductivity degradation(61%IACS) Comparative Example 6-3 0.5Zr Ingot cracking - Table 12 shows metal structures and the results of evaluations or properties in Examples 6-1 to 6-8 and Comparative Examples 6-1 and 6-3.
(Cu-2.0 mass% Ag alloy wire) Examples Comparative Examples Final wire diameter (mm φ ) Average crystal grain size of parent phase (nm) Average diameter of Ag phases (nm) Average diameter of Ag phases × average crystal grain size of parent phase Tensile strength (MPa) Bending fatigue resistance Example6-1 0.03 33 2.5 83 1190 ⊚ Example6-2 0.03 32 3 96 1240 ⊚ Example6-3 0.03 28 4 112 1230 ⊚ Example6-4 0.03 35 3 105 1240 ⊚ Example6-5 0.03 26 4 104 1200 ⊚ Example6-6 0.03 32 3 96 1210 ⊚ Example6-7 0.03 22 5 110 1250 ⊚ Example6-8 0.03 25 4 100 1230 ⊚ Comparative Example 6-1 Electrical conductivity degradation (60%IACS) Comparative Example 6-2 Electrical conductivity degradation (61%IACS) Comparative Example 6-3 Ingot cracking - In each of Examples 6-1 to 6-8, the average crystal grain size of the parent phase, the average diameter of the Ag phases and the product were in the scope of the present invention. Each tensile strenght had a high strenght of 1100 MPa or more. Since in Examples 6-1 to 6-8, the product was equal to or less than 120 which was the value of 60 times the Ag content (mass%), the bending fatigue resistance was "0". In Comparative Example 6-1, 0.5% by mass of Sn was contained, and in Comparative Example 6-2, 0.5% by mass of Mg was contained, with the result that the electrical conductivity was so low as to cause a problem in practical use. In Comparative Example 6-3, 0.5% by mass of Zr was contained, thus cracking of the ingot occurred during manufacturing and thereby it was difficult to manufacture a round wire and like, with the result that there was a problem in manufacturing.
Claims (5)
- A Cu-Ag alloy wire comprising Ag in a chemical composition of 1.0 to 6.0% by mass, the balance being Cu and an unavoidable impurity,the Cu-Ag alloy wire comprising a parent phase comprising a plurality of Ag phases which are connected in a substantially longitudinal direction of the Cu-Ag alloy wire so as to be distributed linearly,the parent phase having an average crystal grain size in a range of 10 to 60 nm, when measured in a cross section orthogonal to the longitudinal direction of the Cu-Ag alloy wire.
- The Cu-Ag alloy wire according to claim 1, wherein a product of an average diameter (nm) of the Ag phases measured in the cross section and the average crystal grain size (nm) of the parent phase is smaller than 60 times an Ag content (mass%) in the Cu-Ag alloy wire.
- The Cu-Ag alloy wire according to claim 1 or 2, further comprising at least one component selected from the group consisting of Sn, Mg, Zn, In, Ni, Co, Zr and Cr in a chemical composition of 0.05 to 0.30% by mass.
- The Cu-Ag alloy wire according to any one of claims 1 to 3, wherein the Cu-Ag alloy wire is a round wire having a diameter of 0.01 to 0.08 mm.
- The Cu-Ag alloy wire according to any one of claims 1 to 3, wherein the Cu-Ag alloy wire is a ribbon wire having a width of 0.02 to 0.32 mm and a thickness of 0.002 to 0.040 mm and the cross section of the ribbon wire is substantially rectangular.
Applications Claiming Priority (2)
| Application Number | Priority Date | Filing Date | Title |
|---|---|---|---|
| JP2021184764 | 2021-11-12 | ||
| PCT/JP2022/041680 WO2023085305A1 (en) | 2021-11-12 | 2022-11-09 | Cu-ag alloy wire |
Publications (2)
| Publication Number | Publication Date |
|---|---|
| EP4431624A1 true EP4431624A1 (en) | 2024-09-18 |
| EP4431624A4 EP4431624A4 (en) | 2026-02-18 |
Family
ID=86335742
Family Applications (1)
| Application Number | Title | Priority Date | Filing Date |
|---|---|---|---|
| EP22892803.2A Pending EP4431624A4 (en) | 2021-11-12 | 2022-11-09 | copper-ag alloy wire |
Country Status (5)
| Country | Link |
|---|---|
| EP (1) | EP4431624A4 (en) |
| JP (1) | JP7876545B2 (en) |
| KR (1) | KR102915755B1 (en) |
| CN (1) | CN116670315A (en) |
| WO (1) | WO2023085305A1 (en) |
Families Citing this family (1)
| Publication number | Priority date | Publication date | Assignee | Title |
|---|---|---|---|---|
| JPWO2024219028A1 (en) * | 2023-04-21 | 2024-10-24 |
Family Cites Families (13)
| Publication number | Priority date | Publication date | Assignee | Title |
|---|---|---|---|---|
| JP3325639B2 (en) | 1993-03-31 | 2002-09-17 | 株式会社フジクラ | Manufacturing method of high strength and high conductivity copper alloy |
| JP4311277B2 (en) * | 2004-05-24 | 2009-08-12 | 日立電線株式会社 | Manufacturing method of extra fine copper alloy wire |
| JP2006299287A (en) * | 2005-04-15 | 2006-11-02 | Nikko Kinzoku Kk | Dual phase copper alloy, spring material and foil body, and method for producing dual phase copper alloy |
| JP5051647B2 (en) | 2005-10-17 | 2012-10-17 | 独立行政法人物質・材料研究機構 | High-strength and high-conductivity Cu-Ag alloy wire and method for producing the same |
| JP2008081834A (en) * | 2006-09-29 | 2008-04-10 | Nikko Kinzoku Kk | High-strength, high-conductivity dual phase copper alloy |
| JP2011146352A (en) * | 2010-01-18 | 2011-07-28 | Sumitomo Electric Ind Ltd | Cu-Ag ALLOY WIRE |
| JP5713230B2 (en) * | 2010-04-28 | 2015-05-07 | 住友電気工業株式会社 | Cu-Ag alloy wire and method for producing Cu-Ag alloy wire |
| WO2015152166A1 (en) | 2014-03-31 | 2015-10-08 | 古河電気工業株式会社 | Copper alloy wire material and manufacturing method thereof |
| JP6529346B2 (en) * | 2015-06-04 | 2019-06-12 | 古河電気工業株式会社 | High bending fatigue resistance copper based alloy wire |
| WO2018100916A1 (en) | 2016-12-01 | 2018-06-07 | 古河電気工業株式会社 | Copper alloy wire rod |
| KR102119552B1 (en) * | 2016-12-02 | 2020-06-05 | 후루카와 덴키 고교 가부시키가이샤 | Copper alloy wire and method for manufacturing copper alloy wire |
| EP3770287A4 (en) * | 2018-03-20 | 2021-11-24 | Furukawa Electric Co., Ltd. | COPPER ALLOY WIRE ROD AND PROCESS FOR PRODUCING A COPPER ALLOY WIRE ROD |
| JP7547056B2 (en) * | 2020-03-04 | 2024-09-09 | 古河電気工業株式会社 | Copper alloy material and its manufacturing method |
-
2022
- 2022-11-09 JP JP2023559663A patent/JP7876545B2/en active Active
- 2022-11-09 EP EP22892803.2A patent/EP4431624A4/en active Pending
- 2022-11-09 CN CN202280008450.8A patent/CN116670315A/en active Pending
- 2022-11-09 KR KR1020237022255A patent/KR102915755B1/en active Active
- 2022-11-09 WO PCT/JP2022/041680 patent/WO2023085305A1/en not_active Ceased
Also Published As
| Publication number | Publication date |
|---|---|
| KR20230138448A (en) | 2023-10-05 |
| WO2023085305A1 (en) | 2023-05-19 |
| KR102915755B1 (en) | 2026-01-20 |
| EP4431624A4 (en) | 2026-02-18 |
| CN116670315A (en) | 2023-08-29 |
| JP7876545B2 (en) | 2026-06-19 |
| JPWO2023085305A1 (en) | 2023-05-19 |
Similar Documents
| Publication | Publication Date | Title |
|---|---|---|
| EP2426224B1 (en) | Copper alloy with high strength, high electrical conductivity, and excellent bendability | |
| KR102590058B1 (en) | Copper alloy sheet and its manufacturing method | |
| EP2221391B1 (en) | Copper alloy sheet | |
| EP2940166B1 (en) | Copper alloy for electrical and electronic equipment, copper alloy thin sheet for electrical and electronic equipment, and conductive part and terminal for electrical and electronic equipment | |
| JP5983589B2 (en) | Rolled copper alloy for electronic and electrical equipment, electronic and electrical equipment parts and terminals | |
| KR20090122303A (en) | Cu-Ni-Si-CO-based copper alloys for electronic materials and manufacturing method thereof | |
| WO2009123136A1 (en) | Cu-ni-si alloy for electronic materials | |
| KR20120130342A (en) | Cu-ni-si alloy for electronic material | |
| TWI429764B (en) | Cu-Co-Si alloy for electronic materials | |
| US10418142B2 (en) | Aluminum alloy wire, aluminum alloy stranded wire, covered electric wire, and wire harness | |
| EP3020838A1 (en) | Copper alloy for electronic and electrical equipment, copper alloy thin sheet for electronic and electrical equipment, and conductive component for electronic and electrical equipment, terminal | |
| JP2012193408A (en) | Cu-Ni-Si ALLOY HAVING EXCELLENT BENDABILITY | |
| KR20170138391A (en) | Copper alloy sheet and manufacturing method thereof | |
| CN104870672B (en) | Electronic electric equipment copper alloy, electronic electric equipment copper alloy thin plate, electronic electric equipment conducting element and terminal | |
| JP5468798B2 (en) | Copper alloy sheet | |
| KR102915759B1 (en) | Cu-Ag alloy wire | |
| EP2944703A1 (en) | Copper alloy for electronic or electrical device, copper alloy thin sheet for electronic or electrical device, process for manufacturing copper alloy for electronic or electrical device, conductive component for electronic or electrical device, and terminal | |
| EP2977476A1 (en) | Copper alloy for electrical and electronic equipment, copper alloy thin sheet for electrical and electronic equipment, and conductive component and terminal for electrical and electronic equipment | |
| KR102915755B1 (en) | Cu-Ag alloy wire | |
| JP2009263690A (en) | Copper alloy sheet for electrical/electronic component excellent in heat resistance | |
| JP5572753B2 (en) | Copper alloy for electronic and electrical equipment, copper alloy sheet for electronic and electrical equipment, conductive parts and terminals for electronic and electrical equipment | |
| JP2008081834A (en) | High-strength, high-conductivity dual phase copper alloy | |
| JP6304864B2 (en) | Copper alloy for electronic and electrical equipment, copper alloy sheet for electronic and electrical equipment, conductive parts and terminals for electronic and electrical equipment | |
| KR102345805B1 (en) | Cu-Ni-Si-BASED ALLOY STRIP EXCELLENT IN STRENGTH AND BENDING WORKABILITY IN ROLLING PARALLEL DIRECTION AND ROLLING ORTHOGONAL DIRECTION | |
| EP4317493A1 (en) | Copper alloy wire |
Legal Events
| Date | Code | Title | Description |
|---|---|---|---|
| STAA | Information on the status of an ep patent application or granted ep patent |
Free format text: STATUS: THE INTERNATIONAL PUBLICATION HAS BEEN MADE |
|
| PUAI | Public reference made under article 153(3) epc to a published international application that has entered the european phase |
Free format text: ORIGINAL CODE: 0009012 |
|
| STAA | Information on the status of an ep patent application or granted ep patent |
Free format text: STATUS: REQUEST FOR EXAMINATION WAS MADE |
|
| 17P | Request for examination filed |
Effective date: 20230704 |
|
| AK | Designated contracting states |
Kind code of ref document: A1 Designated state(s): AL AT BE BG CH CY CZ DE DK EE ES FI FR GB GR HR HU IE IS IT LI LT LU LV MC ME MK MT NL NO PL PT RO RS SE SI SK SM TR |
|
| DAV | Request for validation of the european patent (deleted) | ||
| DAX | Request for extension of the european patent (deleted) | ||
| A4 | Supplementary search report drawn up and despatched |
Effective date: 20260115 |
|
| RIC1 | Information provided on ipc code assigned before grant |
Ipc: C22C 9/00 20060101AFI20260109BHEP Ipc: C22F 1/00 20060101ALI20260109BHEP Ipc: C22F 1/08 20060101ALI20260109BHEP Ipc: H01B 1/02 20060101ALI20260109BHEP |