EP4332631A1 - Procédés d'optimisation globale pour scanners de coordonnées mobiles - Google Patents
Procédés d'optimisation globale pour scanners de coordonnées mobiles Download PDFInfo
- Publication number
- EP4332631A1 EP4332631A1 EP23193908.3A EP23193908A EP4332631A1 EP 4332631 A1 EP4332631 A1 EP 4332631A1 EP 23193908 A EP23193908 A EP 23193908A EP 4332631 A1 EP4332631 A1 EP 4332631A1
- Authority
- EP
- European Patent Office
- Prior art keywords
- level
- level index
- data
- captured
- aspects
- Prior art date
- Legal status (The legal status is an assumption and is not a legal conclusion. Google has not performed a legal analysis and makes no representation as to the accuracy of the status listed.)
- Pending
Links
- 238000000034 method Methods 0.000 title claims abstract description 62
- 238000005457 optimization Methods 0.000 title description 5
- 238000012545 processing Methods 0.000 claims abstract description 30
- 230000009466 transformation Effects 0.000 claims description 28
- 238000004891 communication Methods 0.000 claims description 14
- 230000004044 response Effects 0.000 claims description 10
- 230000003247 decreasing effect Effects 0.000 claims description 4
- 238000012544 monitoring process Methods 0.000 claims description 4
- 230000001131 transforming effect Effects 0.000 claims description 4
- 238000005259 measurement Methods 0.000 description 86
- 238000013507 mapping Methods 0.000 description 53
- 238000003860 storage Methods 0.000 description 28
- 238000004422 calculation algorithm Methods 0.000 description 19
- 238000004590 computer program Methods 0.000 description 10
- 230000008859 change Effects 0.000 description 9
- 238000010586 diagram Methods 0.000 description 9
- 230000006870 function Effects 0.000 description 6
- 230000008569 process Effects 0.000 description 6
- 230000008901 benefit Effects 0.000 description 4
- 230000000694 effects Effects 0.000 description 4
- 230000004807 localization Effects 0.000 description 4
- 238000001514 detection method Methods 0.000 description 3
- 239000011159 matrix material Substances 0.000 description 3
- 230000007246 mechanism Effects 0.000 description 3
- 230000003287 optical effect Effects 0.000 description 3
- 230000010363 phase shift Effects 0.000 description 3
- 238000000844 transformation Methods 0.000 description 3
- 230000007423 decrease Effects 0.000 description 2
- 238000005516 engineering process Methods 0.000 description 2
- 230000006872 improvement Effects 0.000 description 2
- 239000013307 optical fiber Substances 0.000 description 2
- 230000002093 peripheral effect Effects 0.000 description 2
- 238000012805 post-processing Methods 0.000 description 2
- 230000000644 propagated effect Effects 0.000 description 2
- 238000012546 transfer Methods 0.000 description 2
- 230000004075 alteration Effects 0.000 description 1
- 238000004458 analytical method Methods 0.000 description 1
- 238000013459 approach Methods 0.000 description 1
- 238000004364 calculation method Methods 0.000 description 1
- 230000001413 cellular effect Effects 0.000 description 1
- 238000010276 construction Methods 0.000 description 1
- 230000008878 coupling Effects 0.000 description 1
- 238000010168 coupling process Methods 0.000 description 1
- 238000005859 coupling reaction Methods 0.000 description 1
- 238000013144 data compression Methods 0.000 description 1
- 238000013500 data storage Methods 0.000 description 1
- 238000006073 displacement reaction Methods 0.000 description 1
- VJYFKVYYMZPMAB-UHFFFAOYSA-N ethoprophos Chemical compound CCCSP(=O)(OCC)SCCC VJYFKVYYMZPMAB-UHFFFAOYSA-N 0.000 description 1
- 230000005484 gravity Effects 0.000 description 1
- 238000009434 installation Methods 0.000 description 1
- 238000004519 manufacturing process Methods 0.000 description 1
- 230000005055 memory storage Effects 0.000 description 1
- 238000009877 rendering Methods 0.000 description 1
- 239000004065 semiconductor Substances 0.000 description 1
- 238000006467 substitution reaction Methods 0.000 description 1
- 230000008685 targeting Effects 0.000 description 1
- 238000002366 time-of-flight method Methods 0.000 description 1
- 238000013519 translation Methods 0.000 description 1
- 230000000007 visual effect Effects 0.000 description 1
Images


Classifications
-
- G—PHYSICS
- G01—MEASURING; TESTING
- G01S—RADIO DIRECTION-FINDING; RADIO NAVIGATION; DETERMINING DISTANCE OR VELOCITY BY USE OF RADIO WAVES; LOCATING OR PRESENCE-DETECTING BY USE OF THE REFLECTION OR RERADIATION OF RADIO WAVES; ANALOGOUS ARRANGEMENTS USING OTHER WAVES
- G01S17/00—Systems using the reflection or reradiation of electromagnetic waves other than radio waves, e.g. lidar systems
- G01S17/86—Combinations of lidar systems with systems other than lidar, radar or sonar, e.g. with direction finders
-
- G—PHYSICS
- G01—MEASURING; TESTING
- G01S—RADIO DIRECTION-FINDING; RADIO NAVIGATION; DETERMINING DISTANCE OR VELOCITY BY USE OF RADIO WAVES; LOCATING OR PRESENCE-DETECTING BY USE OF THE REFLECTION OR RERADIATION OF RADIO WAVES; ANALOGOUS ARRANGEMENTS USING OTHER WAVES
- G01S17/00—Systems using the reflection or reradiation of electromagnetic waves other than radio waves, e.g. lidar systems
- G01S17/88—Lidar systems specially adapted for specific applications
- G01S17/89—Lidar systems specially adapted for specific applications for mapping or imaging
Definitions
- the present disclosure relates to a system and method that can facilitate measuring, capturing, and storing a three-dimensional (3D) representation of a surrounding environment using a mobile/portable coordinate measurement device, particularly to optimization techniques to improve data capturing by such a measurement device.
- 3D three-dimensional
- a 3D coordinate measurement device sometimes also referred to as a 3D scanner, a 3D laser scanner, a laser scanner, a scanner, or equivalent terms thereof.
- a scanner can be a time-of-flight (TOF) or a phase shift coordinate measurement device.
- TOF laser scanner steers a beam of light to a non-cooperative target, such as a diffusely scattering surface of an object.
- a distance meter in the device measures the distance to the object, and angular encoders measure the angles of the emitted light. The measured distance and angles enable a processor in the device to determine the 3D coordinates of the target.
- a TOF laser scanner (or simply TOF scanner) is a scanner in which the distance to a target point is determined based on the speed of light in the air between the scanner and a target point.
- Phase shift laser scanners determine the distance to the object by the phase shift between the outgoing and returning signal (i.e., calculating the "shift” or "displacement” of the reflective wave compared to the outgoing wave).
- Laser scanners are typically used for scanning closed or open spaces such as interior areas of buildings, industrial installations, and tunnels. They may be used, for example, in industrial applications and accident reconstruction applications.
- a laser scanner optically scans and measures objects in a volume around the scanner by acquiring data points representing object surfaces within the volume. Such data points are obtained by transmitting a beam of light onto the objects and collecting the reflected or scattered light to determine the distance, two angles (i.e., azimuth and a zenith angle), and optionally a gray-scale value.
- This raw scan data is collected, stored, and sent to a processor or processors to generate a 3D image representing the scanned area or object.
- an image requires at least three values for each data point. These three values may include the distance and two angles or maybe transformed values, such as the x, y, z coordinates.
- an image is also based on a fourth gray-scale value, which is a value related to the irradiance of scattered light returning to the scanner.
- the beam steering mechanism includes a first motor that steers the beam of light about a first axis by a first angle that is measured by a first angular encoder (or another angle transducer).
- the beam steering mechanism also includes a second motor that steers the beam of light about a second axis by a second angle that is measured by a second angular encoder (or another angle transducer).
- Many contemporary laser scanners include a camera mounted on the laser scanner for gathering digital images of the environment and presenting the digital camera images to an operator of the laser scanner. By viewing the camera images, the operator of the scanner can determine the field of view of the measured volume and adjust settings on the laser scanner to measure over a larger or smaller region of space.
- the camera's digital images may be transmitted to a processor to add color to the scanner image.
- To generate a color scanner image at least three positional coordinates (such as x, y, z) and three color values (such as red, green, blue "RGB”) are collected for each data point.
- a 3D image of a scene may require multiple scans from different registration stationary positions.
- the overlapping scans are registered in a joint coordinate system, for example, as described in U.S. Published Patent Application No. 2012/0069352 ( ⁇ 352), the contents of which are incorporated herein by reference.
- Such registration is performed by matching targets in overlapping regions of the multiple scans.
- the targets may be artificial targets such as spheres, checkerboards, or natural features such as corners or edges of walls.
- Some registration procedures involve relatively time-consuming manual procedures such as identifying by a user each target and matching the targets obtained by the scanner in each of the different registration positions.
- Some registration procedures also require establishing an external "control network" of registration targets measured by an external device such as a total station.
- the registration method disclosed in ⁇ 352 eliminates the need for user matching of registration targets and establishing a control network.
- a laser scanner is usually mounted on a tripod or instrument stand while measuring the 3D coordinates of its surroundings. An operator is required to move the tripod from location to location as measurements are taken.
- a scanner can be a portable device having a projector that projects light patterns on the surface of an object to be scanned.
- One (or more) cameras having a predetermined positions and alignment relative to the projector, records images of the light pattern on the surface of an object.
- the three-dimensional coordinates of elements in the light pattern can be determined by trigonometric methods, such as by using triangulation.
- Other types of 3D measuring devices may also be used to measure 3D coordinates, such as those that use time of flight techniques (e.g., laser trackers, laser scanners or time of flight cameras) for measuring the amount of time it takes for light to travel to the surface and return to the device.
- a mobile three-dimensional (3D) measuring system includes a 3D measuring device configured to capture 3D data in a multi-level architecture.
- the mobile 3D measuring system further includes an orientation sensor configured to estimate an altitude of the 3D measuring system.
- the mobile 3D measuring system further includes one or more processing units coupled with the 3D measuring device and the orientation sensor.
- the one or more processing units configured to perform a method that includes receiving a first portion of the 3D data captured by the 3D measuring device.
- the method further includes determining a level index based on the altitude estimated by the orientation sensor, the level index indicates a level of the multi-level architecture at which the first portion of the 3D data is captured.
- the method further includes associating the level index with the first portion.
- the method further includes generating a map of the multi-level architecture using the first portion, the generating comprises registering the first portion with a second portion of the 3D data responsive to the level index of the first portion being equal to the level index of the second portion.
- the 3D measuring device comprises a LIDAR sensor to capture a digital representation of the multi-level architecture as the 3D measuring system is transported in the multi-level architecture.
- the 3D measuring device continuously transmits a captured data to a computing system as the 3D measuring device is moved in the multi-level architecture, the computing system comprising the one or more processing units.
- the computing system generates a 3D point cloud representing the multi-level architecture based on the captured data and stores the 3D point cloud.
- the 3D measuring device is configured for wireless communication with the computing system.
- the orientation sensor comprises a gyroscope, an accelerometer, and magnetometer.
- determining the level index for the first portion includes monitoring the altitude estimated by the orientation sensor, and incrementing a previous level index in response to the altitude estimated by the orientation sensor increasing at least by a predetermined threshold. In one or more aspects, determining the level index also includes decrementing the previous level index in response to the altitude estimated by the orientation sensor decreasing at least by the predetermined threshold.
- the previous level index is an initial level index that is configured prior to scanning the multi-level architecture and according to the level at which the scanning is initiated.
- determining the level index for the first portion comprises an operator entering the level index.
- the level index is associated with the first portion in response to the level index being changed to a second level index.
- the level index is associated with the first portion captured by the 3D measuring device in a continuous manner.
- associating the level index with the first portion comprises storing the level index in a metadata of a digital representation of the first portion.
- registering the first portion with the second portion includes determining a transformation to be applied to the first portion to compensate for a drifting error, and limiting the transformation to only a horizontal plane. Further, transforming the first portion based on the transformation that is limited.
- the transformation is determined based on one or more constraints.
- the one or more constraints are based on one or more corresponding features of the first portion and the second portion.
- a computer-implemented method includes receiving a first portion of 3D data captured by a 3D measuring device, the 3D data captured in a multi-level architecture.
- the method further includes determining a level index based on an altitude of the 3D measuring device estimated by an orientation sensor, the level index indicating a level of the multi-level architecture at which the first portion of the 3D data is captured.
- the method further includes associating the level index with the first portion.
- the method further includes generating a map of the multi-level architecture using the first portion, the generating comprises registering the first portion with a second portion of the 3D data responsive to the level index of the first portion being equal to the level index of the second portion.
- the 3D measuring device comprises a LIDAR sensor to capture a digital representation of the multi-level architecture as the 3D measuring system is transported in the multi-level architecture.
- the orientation sensor comprises a gyroscope, an accelerometer, and magnetometer.
- determining the level index for the first portion comprises: monitoring the altitude estimated by the orientation sensor; incrementing a previous level index in response to the altitude estimated by the orientation sensor increasing at least by a predetermined threshold; and decrementing the previous level index in response to the altitude estimated by the orientation sensor decreasing at least by the predetermined threshold, wherein the previous level index is an initial level index that is configured prior to scanning the multi-level architecture and according to the level at which the scanning is initiated.
- registering the first portion with the second portion comprises: determining a transformation to be applied to the first portion to compensate for a drifting error; limiting the transformation to only a horizontal plane; and transforming the first portion based on the transformation that is limited, wherein the transformation is determined based on one or more constraints, and wherein the one or more constraints are based on one or more corresponding features of the first portion and the second portion.
- a mobile 3D scanner that can include one or more sensors, such as light detection and ranging (LIDAR) sensors (“LIDAR”), Time-of-Flight (TOF) sensors, or structured light sensors.
- LIDAR light detection and ranging
- TOF Time-of-Flight
- the sensors can be commercially available components, for example, devices manufactured by VELODYNE ® or any other manufacturer.
- the 3D scanner uses the sensors to capture a surrounding environment's digital three-dimensional (3D) representation.
- the 3D scanner can be carried, for example, as a handheld device that facilitates measuring, capturing, and storing the 3D representation of the surrounding environment.
- the 3D scanner can be carried, for example, mounted to an autonomous/semi-autonomous moveable platform/vehicle, such as a robot, a vehicle, on an operator, etc.
- the 3D scanner can include additional sensors, such as a camera, an inertial measurement unit (IMU), an accelerometer, a global positioning system (GPS), etc.
- IMU inertial measurement unit
- GPS global positioning system
- the "portability" or the “mobility” of the 3D scanner facilitates continuously capturing the digital representation of the surrounding environment as the 3D scanner is moved in an environment (for example, as the operator walks, vehicle drives, etc.). Instead, in existing solutions, the 3D scanner would be placed at a first position in the environment to capture a first portion of the surrounding environment, then moved to a second position in the environment to capture a second portion, and so on. The two or more digital representations captured from the respective positions, are then registered with each other to generate a map of the surrounding environment in the existing solutions.
- the technical solutions described herein improve the speed at which the map (i.e., the 3D digital representation) is generated. For example, the time and effort required to move and place the 3D scanner from one position to another are reduced. Further, the continuous capturing reduces skipped or uncaptured areas because the 3D scanner could not be placed at a suitable position to capture an area. For example, areas behind an obstacle (e.g., column, wall, etc.), inside a cabinet/closet, maybe unreachable for stationary 3D scanners because of limited positions where a tripod or fixture can be placed.
- an obstacle e.g., column, wall, etc.
- mapping i.e., capturing the digital representation
- the source of the drift includes one or more noisy sensors, such as the LIDAR and IMU sensors in the 3D scanner.
- a technical solution to address such a challenge is to compensate for the drift by mapping in a way that "constraints” and “loop closures” are generated. "Loop closures" are areas/locations/positions in the environment that are revisited during mapping.
- the "loop closure” is typically performed by capturing measurements from the 3D scanner at the same position/location (say P) at two different timepoints (say T1 and T2), and determining a difference (delta) between the two measurements. Such a difference is considered the “drift” or error that is accumulated by the 3D scanner in the duration T1-T2 during which the 3D scanner was transported in the environment.
- a “constraint” refers to a part/point in the environment that is scanned multiple times, and hence can be used as a reference. It is important for a mapping algorithm to reliably detect the constraints and loop closures because, an incorrect or inconsistent constraint/loop closure can lead to an inaccurate and/or unusable representation of the environment. For example, the captured data from the 3D scanner can cause a noisy point cloud with potentially doubling effect on walls, objects, etc. technical solutions described herein facilitate techniques for optimizing the data captured during mapping to reliably detect constraints that are accurate.
- the techniques described herein can be performed in real-time while the 3D scanner is capturing data.
- the techniques described herein can be performed in an offline manner (e.g. post-processing), for example, after the data is captured, and while the data is being rendered.
- the techniques described herein are applicable to 3D scanners that are used for "portable/mobile mapping" as described herein, although, the techniques are not limited to such applications.
- techniques described herein can be used by the 3D scanner by performing the analysis and methods described herein locally (e.g., by the 3D scanner itself, or by a computing system that is co-located with the 3D scanner) or remotely (e.g., by a computing device/server that is remotely located from the 3D scanner/data).
- the techniques described herein can be accessed as an application programming interface (API) in one or more aspects.
- API application programming interface
- mapping With mobile mapping it is possible to capture many environments due to the flexibility while mapping compared to stationary scanning.
- Many of the mapping algorithms implement straight forward global optimization for detecting loop closures. Basically, the algorithms look for similar areas and assume both parts have to connected by a constraint and thus overlayed on top of each other. In many situations this naive implementation will lead to an inconsistent trajectory and causing incorrect point cloud. With our approach we are able to address following situations and generate consistent point clouds for those scenarios.
- the technical solutions described herein provide a practical application by optimizing data that is captured by a 3D scanner.
- the technical solutions described herein facilitate optimizing the data in real-time, as the 3D scanner is capturing it.
- Technical solutions herein improve a 3D scanner to improve the data captured by the 3D scanner while being transported in the environment.
- the technical solutions described herein improve 3D scanning/mapping by improving the quality of the 3D maps that are generated by the 3D scanner.
- the technical solutions described herein are rooted in computing technology, and particularly provides improvements to fields of computer vision, 3D modeling, 3D/digital scanning/mapping, using one or more sensors, and other such application areas.
- FIG. 1 depicts an example 3D measurement device/apparatus according to one or more aspects.
- an operator carries a 3D measurement device 120 ("scanner"), which includes two sensors 122, 126.
- the sensors 122, 126 can include LIDAR devices or any other type of sensor.
- the sensor 122 such as a LIDAR device, facilitates determining the distance (ranges) of a point of an object in the sensor's field of view (FOV) by targeting the object with a light pulse (e.g., laser) and measuring the time for the reflected light to return to a receiver.
- the sensor 122 facilitates emitting and receiving the light pulses and measuring the time between emission and reception.
- the measurement device 120 can further include an IMU device 126, which facilitates calculating a force, angular rate, as well as the direction of the of the 3D scanner 120.
- the IMU device 126 can include a combination of sensors like gyroscope, magnetometer, and accelerometer.
- the sensor 126 can include an orientation sensor that is a combination of gyroscope, accelerometer, and magnetometer. The orientation sensor can estimate an orientation of the scanning system 100, and particularly the scanner 120 in one or more aspects by fusing the measurements from gyroscope, accelerometer, and magnetometer.
- the sensors 122, 126 can be mounted on supporting mounts 2 in some examples. The mounting and positioning of the sensors with respect to the operator and/or each other can be different from that shown in the example of FIG. 1 .
- Each device 122, 126 has a respective FOV 12. It should be noted that although an operator is depicted to be carrying the measurement device 120 manually (on the back/hand) in FIG. 1 , in other examples, the measurement device 120 can be carried by the operator in a different manner. Further, in some examples, the measurement device 120 can be carried by a robotic/automated/semi-automated or manually moved platform.
- FIG. 2 depicts a scanning system for capturing measurements in an environment according to one or more aspects.
- the scanning system 100 includes a computing system 110 coupled with a measurement device 120.
- the coupling facilitates electronic communication of data and instructions between the computing system 110 and the measurement device 120.
- the communication can be performed in a wired or wireless manner.
- the measurement device 120 can be a 3D scanner.
- the computing system 110 can be a computer server or any other type of computing device that facilitates remote storage and processing of the captured data 125.
- the captured data 125 from the measurement device 120 includes measurements of a portion of the environment.
- the captured data 125 is transmitted to the computing system 110 for processing and/or storage.
- the computing device 110 can store the captured data 125 locally, i.e., in a storage device in the computing device 110 itself, or remotely, i.e., in a storage device that is part of another computing device 150.
- the computing device 150 can be a computer server or any other type of computing device that facilitates remote storage and processing of the captured data 125.
- the captured data 125 from the measurement device 120 can include 2D images, 3D point clouds, a distance of each point in the point cloud(s) from the measurement device 120, color information at each point, radiance information at each point, and other such sensor data captured by the set of sensors 122 of the measurement device 120.
- sensors 122 can include a LIDAR 122A, a depth camera 122B, a camera 122C, etc.
- the sensors 122 may further include projectors that emit a line or a pattern of light.
- the sensors 122 may further include a projector and sensor that determine distance based on the time of flight of the emitted light.
- the 2D images can be panorama images (e.g., wide-angle images, ultra-wide-angle images, etc.).
- the measurement device 120 can also include an inertial measurement unit (IMU) 126 to keep track of a pose, including a 3D orientation, of the measurement device 120.
- IMU inertial measurement unit
- the pose can be extrapolated by using the sensor data from sensors 122, the IMU 126, and/or from sensors besides the range finders.
- the measurement device 120 can also include a global positioning sensor (GPS) (not shown) or another such location-sensing module that facilitates identifying a global position of the measurement device 120.
- GPS global positioning sensor
- the measurement device 120 can also include a global positioning sensor (GPS) (not shown) or another such location-sensing module that facilitates identifying a global position of the measurement device 120.
- GPS global positioning sensor
- multiple measurement devices 120 can transmit respective captured data 125 to the computing system 110.
- Each of the measurement devices 120 transmits captured data 125 to the computing system 110 concurrently in some aspects.
- the distributed processing comprises running a subset of the operations for generating the map 130 on the measurement devices 120 and another subset of the operations on the computing system 110 (i.e., a distributed or cloud platform), which can process data from the different measurement devices 120. Accordingly, the technical challenge of the limited processing power available at the measurement devices 120 (for example, necessitated by the portability) can be overcome. Further, the distributed processing facilitates updating the computing system 110 (for example, to correct errors, add features, etc.) faster than updating the (local) measurement devices 120.
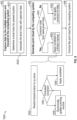
- FIG. 3 depicts a block diagram of a structure of the processing performed by the scanning system 100 to generate map 130 according to one or more aspects.
- An example distributed computing structure is depicted; however, it is understood that the components/modules that are depicted can be structured differently in other aspects. In some aspects, one or more of the components/modules can be separated/combined.
- the measurement device 120 transmits the captured data 125 to the computing system 110, i.e., a "cloud computing system.”
- the computing system 110 processes the captured data 125 to generate an output 215.
- the output 215 includes at least a portion of the map 130.
- the measurement device 120 may include one or more processing units to facilitate some computing.
- the measurement device 120 may generate a preview of mapping results in real-time using the one or more processing unit.
- the preview may be generated at a lower resolution (below a predetermined threshold), to budget available computing resources on the measurement device 120.
- the computing system 110 during post-processing, may use the scanned data to generate a high resolution result. It is understood that the components of the system 100 can be combined or separated in other aspects.
- one or more applications 192 receive the output 215.
- the one or more applications 190 can be software or computer programs in some aspects.
- the applications 192 may be executing on a computing device 190.
- the computing device 190 can be different from the computing system 110 in some aspects.
- the computing device 190 can be a mobile phone, a tablet computer, a laptop computer, or any other type of portable computing device that may have limited computing resources.
- the computing device 190 communicates with the computing system 110 in a wired or wireless manner, for example, using a computer network, such as the Internet.
- the computing device 190 is the computing system 110 itself, or part of the computing system 110.
- the computing device 190 can be the measurement device 120 itself or associated with the measurement device 120.
- the applications 192 facilitate downloading processed outputs like trajectory, point cloud and enriches such processed outputs with additional data.
- the scanning system uses the output to localize in a prerecorded data and extends it with previously not recorded data. The output is then uploaded back to the computing system 110. As a result two models from previous time points can be obtained. Other use cases and operations are possible in other aspects.
- the computing device 190 can transmit to the computing system 190, one or more requests 216 to change one or more portions of the map 130.
- the changes can be based on, for example, localization of a portion of the map 130 included in the output 215.
- the computing system 110 can provide an application programming interface (API) 201 to facilitate communication with external components such as the measurement device 120 and the computing device 190.
- the API 201 can be accessed by the external components to provide the captured data 215, the requests 216, and to receive the output 215, the time-lapse of the 3D model 217, and other communications.
- Predetermined communication protocols and data structures are used to communicate the electronic data between the computing system 110 and the measurement device 120, and the computing device 190.
- standards associated with the robot operating system (ROS) can be used for transferring the data using *.BAG file protocols.
- Other types of predetermined data standards can be used, such as gRPC, in other examples, and the data structures and protocols used for the communication do not limit the technical solutions described herein.
- the computing system 110 can include a mapping module 210 that generates a trajectory of the measurement device 120 in the map 130 based on the captured data 125.
- the mapping module 210 can also be responsible for generating a point cloud representing the surrounding environment. In some examples, the point cloud is part of the map 130.
- FIG. 4 depicts an example point cloud.
- a "point cloud” 300 is a collection of individual 3D data points 301, with each data point 301 having a set coordinate on the X, Y, and Z-axis.
- a 3D model can be visually represented by rendering each of the data points 301 in the point cloud 300 together.
- the data compiled to create the point cloud 300 is taken from a room to depict the location of each door, window, and any other object (e.g., bed, rug, etc.) or surface in the room.
- the clarity (or quality) of details and specific types of features and structures will vary.
- the mapping module 210 is responsible for executing one or more simultaneous localization and mapping (SLAM) algorithms, such as LIDAR SLAM 202, visual SLAM 204, etc.
- SLAM simultaneous localization and mapping
- the mapping module 210 uses the captured data 215. Further, the mapping module 210 uses information about the actual measurement device 120 that captured the data, i.e., which sensors were used, calibrations (e.g., sensor calibration 221), etc. With such information, the mapping module 210 performs mapping for the different types of sensors 122, i.e., LIDARs, cameras, IMUs 126, etc.
- the "mapping” includes aligning the measurements from the several sensors 122, 126 into a common coordinate frame of reference system as well as ensuring timestamp synchronization across the sensors.
- the mapping module 210 generates a 3D point cloud 300 in this manner.
- the measurement device 120 has a mapping module 210 incorporated for the generation of live preview without any assistance from the computing system 110. In such cases, the computing system 110 is used for generation of higher resolution output.
- the computing system 110 further includes a colorization module 220, which, in some aspects, colorizes the 3D point cloud 300 that is generated by the mapping module 210.
- Colorization includes assigning a color to each data point 301 in the point cloud 300.
- the colorization can be performed using known techniques such as applying a "texture" using a color image captured by a camera.
- the color image can be a panoramic or fish-eye image in one or more examples.
- the color image can be aligned with the 3D point cloud 300 using photogrammetry 222 in one or more examples. Other techniques can also be used to colorize the 3D point cloud 300 in other examples.
- the 3D point cloud 300 with and/or without colorization is stored by the computing system 110 in a model storage 230.
- the 3D point cloud 300 is provided to the computing device 190 as part of the output 215.
- the computing device 190 also includes an instance of the mapping module 210.
- two different instances of the same mapping module 210 are executed.
- a first instance can be on the measurement device 120, and a second instance on the computing system 110.
- the first instance can be on the computing system 110, and the second instance on the computing device 190.
- the second instance has different (relaxed) settings from the first instance of the mapping module 210.
- the second instance performs a live mapping of the 3D point clouds in the output(s) 215 generated by the computing system 110.
- the second instance generates a preview of the map 130 using the outputs from the computing system 110.
- the generated preview can be 2D or 2.5D map (2.5D means a 2D image/map with depth information). Alternatively, the preview visualizes the 3D point cloud 300 with a lower predetermined resolution.
- three instance of the mapping module 210 may be used, one instance on the measurement device 120, a second on the computing system 110, and a third instance on the computing device 190.
- the third instance may provide the localization workflow.
- the scanning system 100 downloads the data from the computing system 110 uses the sensor data on board the measurement device 120 to localize in that (i.e., finding a common reference, a transformation) and extending the mapped area.
- the downloaded data (point cloud) in the computing device 190 includes additional data: downloaded data + newly recorded one in the same coordinate system.
- the computing device 190 includes a diagnostics and logging module 195 that saves information about the settings and calibration of the computing device 190.
- FIG. 5 depicts a flowchart of a method for generating the map of a surrounding environment as the measurement device is transported in the surrounding environment according to one or more aspects.
- the scanning system 100 provides, as feedback, a real-time preview of the map that is being generated.
- the method 400 includes, at block 402, calibrating the sensors 122 of the one or more measurement devices 120.
- the multiple sensors are calibrated to generate measurements on a single trajectory and a common coordinate system of a point cloud. When multiple sensors are used, the coordinate systems of the multiple sensors have to be aligned to a single common coordinate frame of reference system.
- the measurements from both LIDAR sensors are aligned to a common (single) coordinate system.
- the common coordinate frame of reference system can be that of one of the two LIDAR sensors or a third coordinate system independent of the two LIDAR sensors.
- calibrating the sensors further includes, at block 402B, synchronizing timing across the multiple sensors 122. Timestamping the captured data from the sensors is crucial for the quality of the mapping. If the timestamps of the sensors are different in relation to each other, the processing places the captured data at positions away from each other. Several known or future developed techniques of timing synchronization can be implemented in one or more aspects.
- sensor measurements of the surrounding environment are captured by the measurement devices 120 and transmitted to the computing system 110.
- the measured sensor data is the captured data 125.
- the sensors usually run at 20 Hz and produce a complete point cloud per sweep/measurement-cycle. This leads to a large amount of data per sweep.
- the data has to be transmitted to the computing system 110 for further processing. If the data is too large (multiple megabytes), data transfer can limit the speed at which the map 130 is generated. Accordingly, to address the technical challenge of the amount of data being generated by the sensors, technical solutions described herein only record the raw data of the LIDAR device, which does not contain a 3D point measurement but only distance and angle information.
- the recorded data can be compressed in some aspects, for example, using LZ77/Huffman coding, or other data compression algorithms/techniques. This reduces the amount of data by a factor ⁇ 5.
- an external storage device (not shown) is plugged into the measurement device 120 where the captured data is stored.
- the external storage is plugged and read into the computing system 110.
- the data that is stored in the external storage is uploaded to the computing system 110 via WIFIO, 4G/5G, or any other type of communication network.
- the measurement device 120 transmits pose-information of the measurement device 120 to the computing system.
- the mapping module 210 of the computing system 120 performs mapping to generate a 3D point cloud 300 of the surrounding using the captured data 125, calibration data, and pose information based on one or more SLAM algorithms.
- the 3D point cloud 300 may be colorized.
- the 3D point cloud 300 is stored in the model storage 230.
- the storage can include updating the map 300 of the surrounding environment 500 that is stored in the model storage 230 by appending the 3D point cloud 300 in the stored map 300.
- the scanning system 100 can facilitate mobile mapping, and in turn, to capture several environments given the flexibility of mapping compared to stationary scanning.
- Mobile mapping can be used to generate point clouds by scanning an environment from the outside (e.g., exterior of a structure, like a building) or from the inside (e.g., interior of the structure). Further, mobile mapping enables to scan nonplanar trajectories like staircases, multiple levels (i.e., floors, e.g., in a multi-storied structure).
- state-of-the-art mapping algorithms implement a global optimization for detecting loop closures, in which similar areas (i.e., portions of the point clouds) are identified and assumed to be connected by a constraint.
- the mapping algorithm overlays the portions (which are deemed to be of the same/similar areas) on top of each other.
- portions which are deemed to be of the same/similar areas
- the mapping algorithm overlays the portions (which are deemed to be of the same/similar areas) on top of each other.
- the two (distinct, but similar in appearance) portions can be overlayed by the mapping algorithm, because the two scanned portions are (erroneously) deemed to be of the same area/section of the environment.
- a similar situation can arise in the case of a multi-storied/multi-level architecture/structure, like a building where two or more floors have a similar structure, and a first scanned portion of a first section of a first level is deemed to be the same as a second scanned portion of a second section of a second level.
- Another situation where such (erroneous) overlaying of scanned portions can occur is with staircases, where two or more scanned staircases are deemed to be the same portion by the mapping algorithm.
- FIGS. 6A and 6B depict an example scenario that illustrates the technical challenge described with present mapping algorithms.
- view 802A shows a point cloud 806 of a building that is composed of several portions 804.
- Each portion 804 represents a floor or level of the building.
- each portion 804 i.e., floor
- a portion 804 is connected to next portion 804 by a staircase 810.
- each portion 804 can be a submap, each including one or more portions captured by the scanning system 100.
- the staircases 810 can be separate portions (804).
- each staircase 810 can be a part of a corresponding portion 804. The staircase 810 is used to register one portion 804 (floor) with the next portion 804, in some aspects.
- the view 802B shows a point cloud 808 of the same building that is depicted in the view 802A.
- the point cloud 808 is composed of the same portions 804 that are used to generate the point cloud 806.
- the portions 804 are not registered correctly; rather, the staircases 810 are overlayed (i.e., overlapped) on each other.
- the staircases 810 are overlayed on each other because of their (geometric) similarity.
- the mapping algorithm (erroneously) deems the staircases 810 to be the same portion and adds a constraint that the staircases 810 are the same region/area, and in turn, overlays the staircases 810 onto each other.
- the resulting point cloud 808 is an incorrect depiction of the environment being scanned.
- the technical solutions described herein address such technical challenge by identifying and removing such erroneous constraint(s).
- the technical solutions described herein facilitate identify the inconsistent constraints, e.g., connecting multiple staircases 810, using measurements from the IMU 126.
- the "implosion effect" as seen in the view 802B is prevented by one or more aspects of the technical solutions herein in this manner. It is understood that although some examples herein are described using a "building,” aspects of the technical solutions herein are not limited to any particular architecture/structure of the environment, and can be used for measuring/scanning/capturing any of
- a technical challenge with using the IMU measurements is that the IMU 126 experiences drifting. Such drifting error can result in misalignment of the portions 804. For example, as can be seen in the view 802A, the portions 804 representing the floors in the point cloud 806 are individually rotated by a few degrees relative to each other. Such misalignment is the result of the drifting experienced by the IMU 126.
- aspects of the technical solutions described herein address not only the "implosion effect,” but also the IMU drifting related technical challenges. Aspects of the technical solutions described herein facilitate differentiating between single-level constraints (i.e., constraints to be applied on a single level/floor) and multi-level constraints (i.e., constraints to be applied among two or more separate layers, and not on the same layer).
- a single-level constraint can include actual similarities that are physically located on the same floor. If similar portions are found and captured on the same floor, such similar portions are connected, i.e., registered with each other.
- Multi-level constraints can include similarities among portions of physically different floors (e.g., staircase at floor 1 and floor 2 are almost identical).
- mapping algorithm a condition: Try to optimize the relative rotation of both similar parts so that both parts have eventually a relative rotation of 0 as well as are located exactly on top of each other (x-y translation is 0 as well). The z-Coordinates of both similar portions are left as is.
- FIG. 7 depicts a resulting point cloud 906 that is created using the same portions 804 as those in FIGS. 6A and 6B , but by applying aspects of the technical solutions described herein.
- the point cloud 906 all levels/floors are aligned on the x-y plane correctly and the height of individual levels is correct as well.
- the resulting point cloud 906 is an improved quality compared to the point clouds 806 and 808. Accordingly, aspects of the technical solutions described herein enable to address the technical challenges described herein and to generate an improved point cloud.
- FIG. 8 depicts a flowchart of a method to create single-level and multi-level constraints according to one or more aspects.
- the depicted method 1000 builds on the operations described in the context of method 400, which are not repeated here for conciseness.
- the scanning system 100 captures data of the environment using the one or more sensors.
- a level index is determined for the present location of the scanning system 100 in the environment being scanned (e.g., building). The level index is used to keep track of the data at each level in the building.
- the level index is generated automatically, based on a measurement from the IMU 126.
- an initial level index may be set for the data being captured.
- the level index can be 0 or 1 (or any other whole number).
- the initial level index can be set to 1 by default in some examples, under the assumption that typically, the first level (level 1) will be scanned first by an operator.
- the level index value can be configured by the operator if s/he starts scanning the environment at a different level. For example, if the operator starts scanning at a second level, s/he can change the initial level index to 2.
- the altitude of the scanning system 100 is estimated and associated with the initial level index, in some aspects.
- the IMU measurement can be used to calculate an estimated altitude of the scanning system 100.
- the scanning system 100 may include an orientation sensor that may fuse data from a 3-axis accelerometer, 3-axis gyroscope, 3-axis magnetometer (e.g., a MARG sensor for Magnetic, Angular Rate, and Gravity), and 1-axis altimeter to estimate orientation and altitude (i.e., height) of the scanning system 100.
- the estimated altitude is monitored. If the estimated altitude changes by at least a threshold, the level index is updated accordingly.
- the threshold is an estimated height of a floor/level of the building.
- the threshold P is configurable.
- the scanning system 100 can detect that a staircase (810) is being traversed by the operator based on the data being captured, for example, by the LIDAR and/or the camera.
- the staircase can be detected using computer vision techniques, such as image detection and recognition, using algorithms that are known or developed in the future.
- the z-coordinate (height) change in the trajectory as well as expected z-coordinate drift caused by the LIDAR sensors is monitored to determine if the operator has changed levels. For example, if during a predetermined duration (e.g., 10 seconds, 5 seconds, etc.) the z-coordinate continuously increases (or decreases) above a threshold that is typically expected, the scanning system 100 can deem that the operator is traversing from one level to another.
- a predetermined duration e.g. 10 seconds, 5 seconds, etc.
- the operator can update the level index every time s/he moves from one level to another.
- the level index is determined automatically, and a prompt is generated for the operator to confirm the level index every time the level index is changed.
- the level index is associated with the captured data.
- the captured data includes the point cloud captured by the LIDAR, along with one or more images (e.g., texture), and any other data used to create the point cloud and the map 130. Additionally the IMU data is associated with each single captured data.
- Associating the level index with the captured data can include storing the level index in the header, or any other part of the metadata associated with the captured data. For example, if the captured data, e.g, point cloud is stored as part of a digital file, the level index is stored as part of the metadata of the digital file.
- the level index and the captured data are linked to each other using another file, database, folder, or other such mapping techniques in data storage. In some aspects, the linking is performed in the memory (RAM) during the mapping before even writing out the output. Further, in some other aspects, the level index is transmitted with the captured data in the case of a distributed computing being used to analyze the captured data (as described herein).
- the level index is associated with captured data at the time a change in the level index is observed. For example, once the level index changes, the previous level index value is associated with the captured data that has not yet been associated with a level index. The new (changed) level index value is noted and further data is captured. In other aspects, the level index is stored with every LIDAR measurement, as the data is captured.
- generating the point cloud includes applying the one or more constraints to similar looking portions, as described herein.
- the similar looking portions from the captured data can be identified using several techniques, such as feature detection and matching. In aspects of the technical solutions herein, the constraints are applied selectively.
- it is determined whether two portions that have been deemed to be similar looking e.g., based on feature matching) are from the same level. The determination about the same level is based on the level index associated with the two portions.
- the constraint is applied.
- the constraint is applied in a limited manner so that the two portions are adjusted only on the XY plane, and not on the Z plane (i.e., no changes made to height) (1002).
- the transformation calculation based on the constraint is limited to the XY plane only (1002).
- the two portions can be rotated relative to each other on the XY plane (around Y axis), but cannot be tilted (i.e., rotated around X axis, or Y axis).
- a right hand coordinate system is assumed, and the axes can change if a different coordinate system is used.
- the constraint can change the two portions on a level, but not change the height information between two portions. Accordingly, the implosion effect (802B) is prevented, however, the IMU drift is compensated for by applying the constraint, albeit in a limited manner.
- applying the constraint can further include identifying and restricting inconsistent constraints based on a neighborhood constraint (1004). Because several portions of the map 130 that is generated during the mapping cover similar looking areas (e.g., around the columns, walls, cubicles, storage spaces, cabinets, etc.) even on the same level, in some cases, the constraints may not be applicable to two (or more portions) that look similar, but are not for the same area in the environment. In such cases, a part of the map 130 can be incorrectly moved almost to the other (similar looking) part. Aspects of the technical solutions herein also address this technical challenge by recognizing consistent constraints across neighboring portions. According to the aspects herein, if a constraint is connecting two portions of the map 130, a neighboring constraint is identified and the relative transformations of the present constraint and the neighboring constraint are compared.
- mapping generates a transformation AtoB that is similar to inverse (BtoCtoA) it can be deemed that there is a consistent constraint.
- the algorithm has to identify a similarity from A to B by connecting both parts together, but walking from B over C to A would show that this transformation would differ from the AtoB transformation.
- it is considered an inconsistent constraint, i.e., the AtoB constraint is inconsistent, and hence, to be dropped.
- a transformation includes a transformation matrix or vector. Comparing the transformation includes comparing the transformation matrix or vector, and determining if the difference exceeds a predetermined threshold.
- the predetermined threshold is also a matrix or a vector, in some aspects. If the constraint is deemed consistent, i.e., the difference does not exceed the predetermined threshold, the constraint is applied to cause the corresponding portion to be adjusted for IMU drift (1006). Alternatively, if the difference exceeds or is equal to the predetermined threshold, the constraint is deemed to be inconsistent with the neighboring constraint, and hence, the constraint is not applied.
- the scanning window of the scanning system 100 is dynamically updated, and the search for new constraint conducted on a larger area.
- the larger the area higher the chance to find consistent constraint.
- the scanning system 100 scans an area of dimensions W2xH2.
- W1xH1 may be changed; or only H1 may be changed. The change increases the size of the window.
- the density of LIDAR points captured by the scanning system 100 is dynamically changed.
- the same constraint consistency check (1004) is repeated for the newly captured data for the portion being scanned. If the newly captured data continues to result in an inconsistent constraint, the above steps are repeated, i.e., scanning window changed and constraint consistency checked again. Such a loop is iterated for a predetermined number of times, or until consistent constraint is obtained, in some aspects.
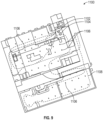
- FIG. 9 depicts an example scenario where constraints are filtered based on being consistent or inconsistent according to one or more aspects.
- a point cloud 1100 is depicted of an environment, such as a parking garage, in which multiple levels/floors have similar structure, and hence, look similar. Further, in the environment, each level includes areas/portions/sections, such as columns 1106, which have similar structure. The areas, like the columns 1106, therefore, look similar to each other.
- an operator may start from the starting point 1102, follow a path 1108, and circle back to an ending point 1104. The operator scans and captures data along the path 1108. As can be seen, several portions of the environment, such as the columns 1106, may be result in inconsistent constraints.
- the aspects of the technical solutions described herein prevents the mapping algorithm from connecting such similar portions, which are on the same level (i.e., same index level).
- the method can continue with further steps, such as colorization (406), in some aspects.
- processor controller, computer, DSP, FPGA are understood in this document to mean a computing device that may be located within an instrument/scanner, distributed in multiple elements throughout an instrument/scanner, or placed external to an instrument/scanner.
- the captured data 125 can be used to generate a map 130 of the environment in which the measurement device 120 is being moved.
- the computing device 110 and/or the computing device 150 can generate map 130.
- Map 130 can be generated by combining several instances of the captured data 125, for example, submaps.
- Each submap can be generated using SLAM, which includes generating one or more submaps corresponding to one or more portions of the environment.
- the submaps are generated using the one or more sets of measurements from the sets of sensors 122.
- the submaps are further combined by the SLAM algorithm to generate map 130.
- a "submap” is a representation of a portion of the environment and that map 130 of the environment includes several such submaps "stitched” together. Stitching the maps together includes determining one or more landmarks on each submap that is captured, and aligning and registering the submaps with each other to generate map 130. In turn, generating each submap includes combining or stitching one or more sets of captured data 125 from the measurement device 120. Combining two or more captured data 125 requires matching or registering one or more landmarks in the captured data 125 being combined.
- a "landmark” is a feature in the environment that can be detected in the captured data 125, and which can be used to register a point from a first captured data 125 with a point from a second captured data 125 being combined.
- the landmark can facilitate registering a 3D point cloud with another 3D point cloud or registering an image with another image.
- the registration can be done by detecting the same landmark in the two captured data 125 (images, point clouds, etc.) that are to be registered with each other.
- a landmark can include but is not limited to features such as an edge, a corner, a doorknob, a door, a lamp, a fire extinguisher, or any other such identification mark that is not moved during the scanning of the environment.
- landmarks can also include stairs, windows, decorative items (e.g., plants, picture-frames, etc.), furniture, or any other such structural or stationary objects.
- landmarks can also include "artificial" landmarks added by the operator of the measurement device 120.
- Such artificial landmarks can include identification marks reliably captured and used by the measurement device 120.
- Examples of artificial landmarks can include predetermined markers or targets, such as labels of known dimensions and patterns, e.g., a checkerboard pattern, a target sign, spheres, or other such preconfigured markers.
- the computing device 110, 150 can implement SLAM while building the scan to localize the device and prevent the measurement device 120 from losing track of where it is in 3D space by virtue of its motion uncertainty because there is no presence of an existing map of the environment (the map is being generated simultaneously).
- SLAM is not performed.
- the captured data 125 from the measurement device 120 is stored without performing SLAM.
- the computer system 2100 can be used as the computing device 110 and/or the computing device 150.
- the computer system 2100 can be an electronic, computer framework comprising and/or employing any number and combination of computing devices and networks utilizing various communication technologies, as described herein.
- the computer system 2100 can be easily scalable, extensible, and modular, with the ability to change to different services or reconfigure some features independently of others.
- the computer system 2100 may be, for example, a server, desktop computer, laptop computer, tablet computer, or smartphone.
- computer system 2100 may be a cloud computing node.
- Computer system 2100 may be described in the general context of computer system executable instructions, such as program modules, being executed by a computer system.
- program modules may include routines, programs, objects, components, logic, data structures, and so on that perform particular tasks or implement particular abstract data types.
- Computer system 2100 may be practiced in distributed cloud computing environments where tasks are performed by remote processing devices that are linked through a communications network.
- program modules may be located in both local and remote computer system storage media, including memory storage devices.
- the computer system 2100 has one or more central processing units (CPU(s)) 2101a, 2101b, 2101c, etc. (collectively or generically referred to as processor(s) 2101).
- the processors 2101 can be a single-core processor, multi-core processor, computing cluster, or any number of other configurations.
- the processors 2101 also referred to as processing circuits, are coupled via a system bus 2102 to a system memory 2103 and various other components.
- the system memory 2103 can include a read-only memory (ROM) 2104 and a random access memory (RAM) 2105.
- ROM read-only memory
- RAM random access memory
- the ROM 2104 is coupled to the system bus 2102 and may include a basic input/output system (BIOS), which controls certain basic functions of the computer system 2100.
- BIOS basic input/output system
- the RAM is read-write memory coupled to the system bus 2102 for use by the processors 2101.
- the system memory 2103 provides temporary memory space for operations of said instructions during operation.
- the system memory 2103 can include random access memory (RAM), read-only memory, flash memory, or any other suitable memory system.
- the computer system 2100 comprises a graphics processing unit (GPU) 2130 that can include one or more processing cores and memory devices.
- the GPU can be used as a co-processor by the processors 2101 to perform one or more operations described herein.
- the computer system 2100 comprises an input/output (I/O) adapter 2106 and a communications adapter 2107 coupled to the system bus 2102.
- the I/O adapter 2106 may be a small computer system interface (SCSI) adapter that communicates with a hard disk 2108 and/or any other similar component.
- SCSI small computer system interface
- the I/O adapter 2106 and the hard disk 2108 are collectively referred to herein as mass storage 2110.
- the mass storage 2110 is an example of a tangible storage medium readable by the processors 2101, where the software 2111 is stored as instructions for execution by the processors 2101 to cause the computer system 2100 to operate, such as is described hereinbelow with respect to the various Figures. Examples of computer program product and the execution of such instruction is discussed herein in more detail.
- the communications adapter 2107 interconnects the system bus 2102 with a network 2112, which may be an outside network, enabling the computer system 2100 to communicate with other such systems.
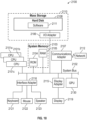
- a portion of the system memory 2103 and the mass storage 2110 collectively store an operating system, which may be any appropriate operating system to coordinate the functions of the various components shown in FIG. 10 .
- Additional input/output devices are shown as connected to the system bus 2102 via a display adapter 2115 and an interface adapter 2116.
- the adapters 2106, 2107, 2115, and 2116 may be connected to one or more I/O buses that are connected to the system bus 2102 via an intermediate bus bridge (not shown).
- a display 2119 e.g., a screen or a display monitor
- a display adapter 2115 which may include a graphics controller to improve the performance of graphics-intensive applications and a video controller.
- a keyboard 2121, a mouse 2122, a speaker 2123, etc. can be interconnected to the system bus 2102 via the interface adapter 2116, which may include, for example, a Super I/O chip integrating multiple device adapters into a single integrated circuit.
- Suitable I/O buses for connecting peripheral devices such as hard disk controllers, network adapters, and graphics adapters typically include common protocols, such as the Peripheral Component Interconnect (PCI).
- PCI Peripheral Component Interconnect
- the computer system 2100 includes processing capability in the form of the processors 2101, and storage capability including the system memory 2103 and the mass storage 2110, input means such as the keyboard 2121 and the mouse 2122, and output capability including the speaker 2123 and the display 2119.
- the communications adapter 2107 can transmit data using any suitable interface or protocol, such as the internet small computer system interface, among others.
- the network 2112 may be a cellular network, a radio network, a wide area network (WAN), a local area network (LAN), or the Internet, among others.
- An external computing device may connect to the computer system 2100 through network 2112.
- an external computing device may be an external web server or a cloud computing node.
- FIG. 10 the block diagram of FIG. 10 is not intended to indicate that the computer system 2100 is to include all of the components shown. Rather, the computer system 2100 can include any appropriate fewer or additional components not illustrated in FIG. 10 (e.g., additional memory components, embedded controllers, modules, additional network interfaces, etc.). Further, the aspects described herein with respect to computer system 2100 may be implemented with any appropriate logic, wherein the logic, as referred to herein, can include any suitable hardware (e.g., a processor, an embedded controller, or an application specific integrated circuit, among others), software (e.g., an application, among others), firmware, or any suitable combination of hardware, software, and firmware, in various aspects.
- suitable hardware e.g., a processor, an embedded controller, or an application specific integrated circuit, among others
- software e.g., an application, among others
- firmware e.g., any suitable combination of hardware, software, and firmware, in various aspects.
- aspects of the present disclosure may be embodied as a system, method, or computer program product and may take the form of a hardware aspect, a software aspect (including firmware, resident software, microcode, etc.), or a combination thereof. Furthermore, aspects of the present disclosure may take the form of a computer program product embodied in one or more computer-readable medium(s) having computer-readable program code embodied thereon. Methods herein can be computer-implemented methods.
- the computer-readable medium may be a computer-readable signal medium or a computer-readable storage medium.
- a computer-readable storage medium may be, for example, but not limited to, an electronic, magnetic, optical, electromagnetic, infrared, or semiconductor system, apparatus, or device, or any suitable combination of the foregoing.
- the computer-readable storage medium may be a tangible medium containing or storing a program for use by or in connection with an instruction execution system, apparatus, or device.
- a computer-readable signal medium may include a propagated data signal with computer-readable program code embodied therein, for example, in baseband or as part of a carrier wave. Such a propagated signal may take any of a variety of forms, including, but not limited to, electromagnetic, optical, or any suitable combination thereof.
- a computer-readable signal medium may be any computer-readable medium that is not a computer-readable storage medium and that can communicate, propagate, or transport a program for use by or in connection with an instruction execution system, apparatus, or device.
- the computer-readable medium may contain program code embodied thereon, which may be transmitted using any appropriate medium, including but not limited to wireless, wireline, optical fiber cable, RF, etc., or any suitable combination of the foregoing.
- computer program code for carrying out operations for implementing aspects of the present disclosure may be written in any combination of one or more programming languages, including an object oriented programming language such as Java, Smalltalk, C++, or the like and conventional procedural programming languages, such as the "C" programming language or similar programming languages.
- the program code may execute entirely on the user's computer, partly on the user's computer, as a stand-alone software package, partly on the user's computer, and partly on a remote computer, or entirely on the remote computer or server.
- These computer program instructions may also be stored in a computer-readable medium that can direct a computer, other programmable data processing apparatus, or other devices to function in a particular manner, such that the instructions stored in the computer-readable medium produce an article of manufacture, including instructions which implement the function/act specified in the flowchart and/or block diagram block or blocks.
- the computer program instructions may also be loaded onto a computer, other programmable data processing apparatus, or other devices to cause a series of operational steps to be performed on the computer, other programmable apparatus, or other devices to produce a computer-implemented process such that the instructions which execute on the computer or other programmable apparatus provide processes for implementing the functions/acts specified in the flowchart and/or block diagram block or blocks.
- mobile mapping is the process of measuring and collecting geospatial data by a portable or mobile 3D scanning system.
- the 3D scanning system can use a backpack, a trolley, a handheld device, an autonomous robot, or any other mobile form capable of being carried or moved by an operator.
- the 3D scanning system uses remote sensing systems like LIDAR, TOF sensors, triangulation sensors, structured light sensors, and/or cameras in combination with inertial and navigation sensors, e.g., an inertial measurement unit (IMU), for mobile mapping.
- IMU inertial measurement unit
- simultaneous localization and mapping is a technique/algorithm that a mobile 3D scanning system uses to incrementally build a map of the surrounding environment while the 3D scanning system is moving or has been moved, simultaneously localizing itself on the map.
- a "map" is a 2D or 3D representation of the environment measured through the various sensors of the 3D scanning system.
- the map is represented internally as a grid map.
- the grid map is a 2D or 3D arranged collection of cells representing an area of the environment.
- the grid map stores, for every cell, a probability indicating if the cell area is occupied or not based on the measurement(s) from the 3D scanning system.
- the 3D scanning system can include LIDAR sensors which produce a 3D point cloud as output.
- Technical solutions are not restricted or limited to specific LIDAR sensors and can include LIDAR sensors from VELODYNE ® , OUSTER ® , or any other manufacturer.
Applications Claiming Priority (2)
| Application Number | Priority Date | Filing Date | Title |
|---|---|---|---|
| US202263402496P | 2022-08-31 | 2022-08-31 | |
| US18/356,871 US20240069203A1 (en) | 2022-08-31 | 2023-07-21 | Global optimization methods for mobile coordinate scanners |
Publications (1)
| Publication Number | Publication Date |
|---|---|
| EP4332631A1 true EP4332631A1 (fr) | 2024-03-06 |
Family
ID=87863095
Family Applications (1)
| Application Number | Title | Priority Date | Filing Date |
|---|---|---|---|
| EP23193908.3A Pending EP4332631A1 (fr) | 2022-08-31 | 2023-08-29 | Procédés d'optimisation globale pour scanners de coordonnées mobiles |
Country Status (2)
| Country | Link |
|---|---|
| US (1) | US20240069203A1 (fr) |
| EP (1) | EP4332631A1 (fr) |
Citations (3)
| Publication number | Priority date | Publication date | Assignee | Title |
|---|---|---|---|---|
| US20060188143A1 (en) * | 2002-07-10 | 2006-08-24 | Marek Strassenburg-Kleciak | Scanning system for three-dimensional objects |
| US20120069352A1 (en) | 2009-03-25 | 2012-03-22 | Faro Technologies, Inc. | Method for optically scanning and measuring a scene |
| EP3792593A1 (fr) * | 2019-09-13 | 2021-03-17 | Topcon Corporation | Appareil d'arpentage tridimensionnel, procédé d'arpentage tridimensionnel et programme d'arpentage tridimensionnel |
-
2023
- 2023-07-21 US US18/356,871 patent/US20240069203A1/en active Pending
- 2023-08-29 EP EP23193908.3A patent/EP4332631A1/fr active Pending
Patent Citations (3)
| Publication number | Priority date | Publication date | Assignee | Title |
|---|---|---|---|---|
| US20060188143A1 (en) * | 2002-07-10 | 2006-08-24 | Marek Strassenburg-Kleciak | Scanning system for three-dimensional objects |
| US20120069352A1 (en) | 2009-03-25 | 2012-03-22 | Faro Technologies, Inc. | Method for optically scanning and measuring a scene |
| EP3792593A1 (fr) * | 2019-09-13 | 2021-03-17 | Topcon Corporation | Appareil d'arpentage tridimensionnel, procédé d'arpentage tridimensionnel et programme d'arpentage tridimensionnel |
Also Published As
| Publication number | Publication date |
|---|---|
| US20240069203A1 (en) | 2024-02-29 |
Similar Documents
| Publication | Publication Date | Title |
|---|---|---|
| CN108171733B (zh) | 使两个或更多个三维3d点云配准的方法 | |
| Li et al. | NRLI-UAV: Non-rigid registration of sequential raw laser scans and images for low-cost UAV LiDAR point cloud quality improvement | |
| US8699005B2 (en) | Indoor surveying apparatus | |
| Acharya et al. | BIM-Tracker: A model-based visual tracking approach for indoor localisation using a 3D building model | |
| EP3550513B1 (fr) | Procédé de génération de vues panoramiques sur un système mobile de cartographie | |
| US20160260250A1 (en) | Method and system for 3d capture based on structure from motion with pose detection tool | |
| US20190096089A1 (en) | Enabling use of three-dimensonal locations of features with two-dimensional images | |
| US20100098328A1 (en) | 3D imaging system | |
| WO2015134795A2 (fr) | Procédé et système de capture 3d sur la base d'une structure à partir d'un mouvement avec outil de détection de pose | |
| TW201337306A (zh) | 用於建築工地之資訊擷取 | |
| US11847741B2 (en) | System and method of scanning an environment and generating two dimensional images of the environment | |
| EP4109137A1 (fr) | Capture de balayages environnementaux à l'aide d'un robot de transporteur automatisé | |
| Blaser et al. | Development of a portable high performance mobile mapping system using the robot operating system | |
| Chen et al. | Real-time 3D mobile mapping for the built environment | |
| Karam et al. | Integrating a low-cost mems imu into a laser-based slam for indoor mobile mapping | |
| US20240004080A1 (en) | Capturing environmental scans using landmarks based on semantic features | |
| US10447991B1 (en) | System and method of mapping elements inside walls | |
| EP4258015A1 (fr) | Système de support pour un appareil de balayage de coordonnées mobile | |
| US20220365217A1 (en) | Generating environmental map by aligning captured scans | |
| Nocerino et al. | Introduction to mobile mapping with portable systems | |
| US20220406005A1 (en) | Targetless tracking of measurement device during capture of surrounding data | |
| EP4332631A1 (fr) | Procédés d'optimisation globale pour scanners de coordonnées mobiles | |
| Hasler et al. | Implementation and first evaluation of an indoor mapping application using smartphones and AR frameworks | |
| Rydell et al. | Chameleon v2: Improved imaging-inertial indoor navigation | |
| US20230324558A1 (en) | Sensor field-of-view manipulation |
Legal Events
| Date | Code | Title | Description |
|---|---|---|---|
| PUAI | Public reference made under article 153(3) epc to a published international application that has entered the european phase |
Free format text: ORIGINAL CODE: 0009012 |
|
| STAA | Information on the status of an ep patent application or granted ep patent |
Free format text: STATUS: THE APPLICATION HAS BEEN PUBLISHED |
|
| AK | Designated contracting states |
Kind code of ref document: A1 Designated state(s): AL AT BE BG CH CY CZ DE DK EE ES FI FR GB GR HR HU IE IS IT LI LT LU LV MC ME MK MT NL NO PL PT RO RS SE SI SK SM TR |