EP4290412A2 - Computer-implemented method, computer program product and system for data analysis - Google Patents
Computer-implemented method, computer program product and system for data analysis Download PDFInfo
- Publication number
- EP4290412A2 EP4290412A2 EP23204765.4A EP23204765A EP4290412A2 EP 4290412 A2 EP4290412 A2 EP 4290412A2 EP 23204765 A EP23204765 A EP 23204765A EP 4290412 A2 EP4290412 A2 EP 4290412A2
- Authority
- EP
- European Patent Office
- Prior art keywords
- sets
- variable model
- latent variable
- neural network
- output values
- Prior art date
- Legal status (The legal status is an assumption and is not a legal conclusion. Google has not performed a legal analysis and makes no representation as to the accuracy of the status listed.)
- Pending
Links
- 238000000034 method Methods 0.000 title claims abstract description 97
- 238000007405 data analysis Methods 0.000 title claims abstract description 11
- 238000004590 computer program Methods 0.000 title claims description 8
- 238000013528 artificial neural network Methods 0.000 claims abstract description 138
- 238000012549 training Methods 0.000 claims abstract description 122
- 238000013507 mapping Methods 0.000 claims abstract description 27
- 238000012545 processing Methods 0.000 claims abstract description 18
- 238000003860 storage Methods 0.000 claims abstract description 16
- 238000000513 principal component analysis Methods 0.000 claims description 37
- 238000009826 distribution Methods 0.000 claims description 35
- 238000004519 manufacturing process Methods 0.000 claims description 11
- 230000002787 reinforcement Effects 0.000 claims description 6
- 229960000074 biopharmaceutical Drugs 0.000 claims description 5
- 238000004458 analytical method Methods 0.000 claims description 4
- 238000004611 spectroscopical analysis Methods 0.000 claims description 2
- 239000000126 substance Substances 0.000 claims description 2
- 238000013450 outlier detection Methods 0.000 description 59
- 238000001994 activation Methods 0.000 description 48
- 230000004913 activation Effects 0.000 description 47
- 238000002474 experimental method Methods 0.000 description 34
- 238000013527 convolutional neural network Methods 0.000 description 32
- 239000011159 matrix material Substances 0.000 description 22
- 238000012360 testing method Methods 0.000 description 21
- 230000000875 corresponding effect Effects 0.000 description 20
- 230000006870 function Effects 0.000 description 19
- 230000015654 memory Effects 0.000 description 18
- 230000008569 process Effects 0.000 description 18
- 238000013135 deep learning Methods 0.000 description 14
- 238000012423 maintenance Methods 0.000 description 14
- 210000004027 cell Anatomy 0.000 description 13
- 239000013598 vector Substances 0.000 description 13
- 230000009466 transformation Effects 0.000 description 12
- 238000011156 evaluation Methods 0.000 description 10
- 238000013500 data storage Methods 0.000 description 7
- 238000010200 validation analysis Methods 0.000 description 7
- 238000011068 loading method Methods 0.000 description 6
- 238000010238 partial least squares regression Methods 0.000 description 6
- 238000011176 pooling Methods 0.000 description 6
- 238000000844 transformation Methods 0.000 description 6
- 238000013136 deep learning model Methods 0.000 description 5
- 230000001537 neural effect Effects 0.000 description 5
- 230000000306 recurrent effect Effects 0.000 description 5
- 230000015556 catabolic process Effects 0.000 description 4
- 238000007418 data mining Methods 0.000 description 4
- 238000001514 detection method Methods 0.000 description 4
- 241000282326 Felis catus Species 0.000 description 3
- 238000013459 approach Methods 0.000 description 3
- 238000006731 degradation reaction Methods 0.000 description 3
- 230000010354 integration Effects 0.000 description 3
- 238000010801 machine learning Methods 0.000 description 3
- 238000007726 management method Methods 0.000 description 3
- 239000000463 material Substances 0.000 description 3
- 238000012544 monitoring process Methods 0.000 description 3
- 230000003287 optical effect Effects 0.000 description 3
- 238000005457 optimization Methods 0.000 description 3
- 238000003909 pattern recognition Methods 0.000 description 3
- 230000004044 response Effects 0.000 description 3
- 238000005070 sampling Methods 0.000 description 3
- 238000004088 simulation Methods 0.000 description 3
- 238000012546 transfer Methods 0.000 description 3
- 230000000007 visual effect Effects 0.000 description 3
- ORILYTVJVMAKLC-UHFFFAOYSA-N Adamantane Natural products C1C(C2)CC3CC1CC2C3 ORILYTVJVMAKLC-UHFFFAOYSA-N 0.000 description 2
- 241000282472 Canis lupus familiaris Species 0.000 description 2
- 238000013473 artificial intelligence Methods 0.000 description 2
- 230000000052 comparative effect Effects 0.000 description 2
- 238000013499 data model Methods 0.000 description 2
- 238000003384 imaging method Methods 0.000 description 2
- 230000010365 information processing Effects 0.000 description 2
- 238000012886 linear function Methods 0.000 description 2
- 238000005259 measurement Methods 0.000 description 2
- 238000001000 micrograph Methods 0.000 description 2
- 210000002569 neuron Anatomy 0.000 description 2
- 230000001131 transforming effect Effects 0.000 description 2
- 238000012614 Monte-Carlo sampling Methods 0.000 description 1
- 230000001133 acceleration Effects 0.000 description 1
- 210000003423 ankle Anatomy 0.000 description 1
- 239000000969 carrier Substances 0.000 description 1
- 238000012512 characterization method Methods 0.000 description 1
- 239000002826 coolant Substances 0.000 description 1
- 238000001816 cooling Methods 0.000 description 1
- 230000002596 correlated effect Effects 0.000 description 1
- 230000001186 cumulative effect Effects 0.000 description 1
- 230000001419 dependent effect Effects 0.000 description 1
- 210000005069 ears Anatomy 0.000 description 1
- 238000005516 engineering process Methods 0.000 description 1
- 230000002349 favourable effect Effects 0.000 description 1
- 230000004907 flux Effects 0.000 description 1
- 230000036541 health Effects 0.000 description 1
- 238000010191 image analysis Methods 0.000 description 1
- 230000003993 interaction Effects 0.000 description 1
- 239000004973 liquid crystal related substance Substances 0.000 description 1
- 238000012986 modification Methods 0.000 description 1
- 230000004048 modification Effects 0.000 description 1
- 238000003062 neural network model Methods 0.000 description 1
- 238000010606 normalization Methods 0.000 description 1
- 230000002093 peripheral effect Effects 0.000 description 1
- 239000000047 product Substances 0.000 description 1
- 238000000746 purification Methods 0.000 description 1
- 239000004065 semiconductor Substances 0.000 description 1
- 238000000926 separation method Methods 0.000 description 1
- 230000006403 short-term memory Effects 0.000 description 1
- 230000003595 spectral effect Effects 0.000 description 1
- 238000013179 statistical model Methods 0.000 description 1
- 238000012109 statistical procedure Methods 0.000 description 1
- 238000003756 stirring Methods 0.000 description 1
- 239000013589 supplement Substances 0.000 description 1
- XLYOFNOQVPJJNP-UHFFFAOYSA-N water Substances O XLYOFNOQVPJJNP-UHFFFAOYSA-N 0.000 description 1
Images


Classifications
-
- G—PHYSICS
- G06—COMPUTING; CALCULATING OR COUNTING
- G06N—COMPUTING ARRANGEMENTS BASED ON SPECIFIC COMPUTATIONAL MODELS
- G06N3/00—Computing arrangements based on biological models
- G06N3/02—Neural networks
- G06N3/04—Architecture, e.g. interconnection topology
-
- G—PHYSICS
- G05—CONTROLLING; REGULATING
- G05B—CONTROL OR REGULATING SYSTEMS IN GENERAL; FUNCTIONAL ELEMENTS OF SUCH SYSTEMS; MONITORING OR TESTING ARRANGEMENTS FOR SUCH SYSTEMS OR ELEMENTS
- G05B23/00—Testing or monitoring of control systems or parts thereof
- G05B23/02—Electric testing or monitoring
- G05B23/0205—Electric testing or monitoring by means of a monitoring system capable of detecting and responding to faults
- G05B23/0218—Electric testing or monitoring by means of a monitoring system capable of detecting and responding to faults characterised by the fault detection method dealing with either existing or incipient faults
- G05B23/0224—Process history based detection method, e.g. whereby history implies the availability of large amounts of data
- G05B23/024—Quantitative history assessment, e.g. mathematical relationships between available data; Functions therefor; Principal component analysis [PCA]; Partial least square [PLS]; Statistical classifiers, e.g. Bayesian networks, linear regression or correlation analysis; Neural networks
-
- G—PHYSICS
- G06—COMPUTING; CALCULATING OR COUNTING
- G06F—ELECTRIC DIGITAL DATA PROCESSING
- G06F18/00—Pattern recognition
- G06F18/20—Analysing
- G06F18/21—Design or setup of recognition systems or techniques; Extraction of features in feature space; Blind source separation
- G06F18/213—Feature extraction, e.g. by transforming the feature space; Summarisation; Mappings, e.g. subspace methods
-
- G—PHYSICS
- G06—COMPUTING; CALCULATING OR COUNTING
- G06F—ELECTRIC DIGITAL DATA PROCESSING
- G06F18/00—Pattern recognition
- G06F18/20—Analysing
- G06F18/22—Matching criteria, e.g. proximity measures
-
- G—PHYSICS
- G06—COMPUTING; CALCULATING OR COUNTING
- G06N—COMPUTING ARRANGEMENTS BASED ON SPECIFIC COMPUTATIONAL MODELS
- G06N3/00—Computing arrangements based on biological models
- G06N3/02—Neural networks
- G06N3/04—Architecture, e.g. interconnection topology
- G06N3/044—Recurrent networks, e.g. Hopfield networks
- G06N3/0442—Recurrent networks, e.g. Hopfield networks characterised by memory or gating, e.g. long short-term memory [LSTM] or gated recurrent units [GRU]
-
- G—PHYSICS
- G06—COMPUTING; CALCULATING OR COUNTING
- G06N—COMPUTING ARRANGEMENTS BASED ON SPECIFIC COMPUTATIONAL MODELS
- G06N3/00—Computing arrangements based on biological models
- G06N3/02—Neural networks
- G06N3/04—Architecture, e.g. interconnection topology
- G06N3/045—Combinations of networks
- G06N3/0455—Auto-encoder networks; Encoder-decoder networks
-
- G—PHYSICS
- G06—COMPUTING; CALCULATING OR COUNTING
- G06N—COMPUTING ARRANGEMENTS BASED ON SPECIFIC COMPUTATIONAL MODELS
- G06N3/00—Computing arrangements based on biological models
- G06N3/02—Neural networks
- G06N3/04—Architecture, e.g. interconnection topology
- G06N3/0464—Convolutional networks [CNN, ConvNet]
-
- G—PHYSICS
- G06—COMPUTING; CALCULATING OR COUNTING
- G06N—COMPUTING ARRANGEMENTS BASED ON SPECIFIC COMPUTATIONAL MODELS
- G06N3/00—Computing arrangements based on biological models
- G06N3/02—Neural networks
- G06N3/04—Architecture, e.g. interconnection topology
- G06N3/048—Activation functions
-
- G—PHYSICS
- G06—COMPUTING; CALCULATING OR COUNTING
- G06N—COMPUTING ARRANGEMENTS BASED ON SPECIFIC COMPUTATIONAL MODELS
- G06N3/00—Computing arrangements based on biological models
- G06N3/02—Neural networks
- G06N3/08—Learning methods
-
- G—PHYSICS
- G06—COMPUTING; CALCULATING OR COUNTING
- G06N—COMPUTING ARRANGEMENTS BASED ON SPECIFIC COMPUTATIONAL MODELS
- G06N3/00—Computing arrangements based on biological models
- G06N3/02—Neural networks
- G06N3/08—Learning methods
- G06N3/092—Reinforcement learning
-
- G—PHYSICS
- G06—COMPUTING; CALCULATING OR COUNTING
- G06V—IMAGE OR VIDEO RECOGNITION OR UNDERSTANDING
- G06V20/00—Scenes; Scene-specific elements
- G06V20/60—Type of objects
- G06V20/69—Microscopic objects, e.g. biological cells or cellular parts
- G06V20/698—Matching; Classification
-
- G—PHYSICS
- G06—COMPUTING; CALCULATING OR COUNTING
- G06N—COMPUTING ARRANGEMENTS BASED ON SPECIFIC COMPUTATIONAL MODELS
- G06N3/00—Computing arrangements based on biological models
- G06N3/02—Neural networks
- G06N3/08—Learning methods
- G06N3/088—Non-supervised learning, e.g. competitive learning
Abstract
Description
- The application relates to a computer-implemented method, a computer program product and a system for data analysis, in particular, outlier detection in unstructured data.
- A deep neural network may be an artificial neural network having an input layer, an output layer and a plurality of hidden layers between the input and output layers. Deep learning using deep neural networks has become very popular in many applications thanks to powerful transformations learned by deep neural networks. When adopting deep learning in critical systems such as autonomous cars, diagnostic applications or in power plant control systems, however, it may be crucial to understand when predictions provided by the deep learning system should not be trusted. In other words, it may be important to know not only whether or not a prediction provided by the deep learning system is accurate, but also whether the deep learning system should predict at all. Autonomous decisions can be improved by understanding the limits of the learned representations and by recognizing when data not recognized by the deep learning system is encountered.
- Many different methods have been proposed to allow deep neural networks to describe uncertainty in predictions. Many of these methods are based on training deep neural networks to perform Bayesian inference rather than point inferences during prediction. This means that rather than predicting a single point, the networks are trained to predict a distribution of possible points. The intuition is that observations the model cannot explain will have a broad distribution, or large uncertainty. One popular solution to perform Bayesian prediction is so called Monte-Carlo dropout (MC-dropout), disclosed in Y. Gal and Z.Gharamani, "Dropout as a Bayesian approximation: Representing model uncertainty in deep learning," in International Conference on Machine Learning, 2016, pp. 1050-1059. MC-dropout can be applied to neural networks that are trained using "dropout", a regularization technique for reducing overfitting in neural networks by dropping out (or in other words, ignoring) some units (e.g. neurons, nodes) in a neural network during the training phase. MC-dropout makes multiple inferences for each prediction, using so called Monte-Carlo sampling for prediction, while eliminating, or dropping out, network neurons randomly during prediction time. The different predictions vary due to dropout and describe a prediction distribution. The prediction uncertainty can then be quantified by calculating the entropy or variance of the resulting distribution.
- Other methods for using dropout producing Monte-Carlo samples include: sampling based on batch-normalization parameters (M. Teye, H. Azizpour, and K. Smith, "Bayesian Uncertainty Estimation for Batch Normalized Deep Networks," ArXiv180206455 Stat, Feb. 2018), prediction from different models in an ensemble (B. Lakshminarayanan, A. Pritzel, and C. Blundell, "Simple and scalable predictive uncertainty estimation using deep ensembles," in Advances in Neural Information Processing Systems, 2017, pp. 6405-6416), multiple "prediction heads" in a shared base network (I. Osband, C. Blundell, A. Pritzel, and B. Van Roy, "Deep exploration via bootstrapped DQN," in Advances in Neural Information Processing Systems, 2016, pp. 4026-4034; E. Ilg et al., "Uncertainty Estimates for Optical Flow with Multi-Hypotheses Networks," ArXiv180207095 Cs, Feb. 2018), variational inference of weight distribution instead of regular point weights (C. Blundell, J. Cornebise, K. Kavukcuoglu, and D. Wierstra, "Weight uncertainty in neural networks," ArXiv Prepr. ArXiv150505424, 2015) and Laplace approximation of distribution from existing weights (H. Ritter, A. Botev, and D. Barber, "A Scalable Laplace Approximation for Neural Networks," Feb. 2018).
- However, these methods may constrain how the network is constructed or trained, and/or rely on multiple inferences per prediction. This may limit their general applicability for real-time systems where making multiple inferences is impractical and/or for existing systems that do not fit into the constraints.
- According to an aspect, the problem relates to efficiently evaluating reliability of a prediction given by a deep neural network for an observation input to the deep neural network.
- This problem is solved by the features disclosed by the independent claims. Further exemplary embodiments are defined by the dependent claims.
- According to an aspect, a computer-implemented method for data analysis is provided. The method includes:
- obtaining a deep neural network for processing data and at least a part of a training dataset used for training the deep neural network, the deep neural network comprising a plurality of hidden layers, the training dataset including possible observations that can be input to the deep neural network;
- obtaining first sets of intermediate output values that are output from at least one of the plurality of hidden layers, each of the first sets of intermediate output values obtained by inputting a different one of the possible observations included in said at least the part of the training dataset;
- constructing a latent variable model using the first sets of intermediate output values, the latent variable model providing a mapping of the first sets of intermediate output values to first sets of projected values in a sub-space that has a dimension lower than a dimension of the sets of the intermediate outputs;
- receiving an observation to be input to the deep neural network;
- obtaining a second set of intermediate output values that are output from said at least one of the plurality of hidden layers by inputting the received observation to the deep neural network;
- mapping, using the latent variable model, the second set of intermediate output values to a second set of projected values; and
- determining whether or not the received observation is an outlier with respect to the training dataset based on the latent variable model and the second set of projected values.
- When the received observation is determined to be an outlier, it may be assumed that a prediction (e.g. an output) given by the deep neural network for the received observation is less reliable than in case the received observation is determined to be a non-outlier.
- In various embodiments and examples described herein, the data to be processed by the deep neural network may be unstructured data. Unstructured data may be understood as data that either does not have a pre-defined data model or is not organized in a pre-defined manner. Unstructured data may have internal structure but is not structured via pre-defined data models or schema. Examples of unstructured data may include, but are not limited to, images, audio, videos, sensor data and texts.
- In some specific examples, the data to be processed by the deep neural network may be sensor data obtained from one or more sensors, such as, temperature sensor, acceleration sensor, pressure sensor, strain gauge, force sensor, microphone, image sensor, etc. Each of the possible observations included in the test dataset and the received observation may contain sensor data obtained by the one or more sensors at a point in time or during a period of time.
- In case the sensor data is obtained by image sensors, the data to be processed by the deep neural network may be images. In the present disclosure, an image may include a 2D array of pixels. Each of the pixels may include at least one value. For example, a pixel in a greyscale image may include one value indicating an intensity of the pixel. A pixel in a color image may include multiple values, for example three values, that indicate coordinates in a color space such as RGB color space. In case images are processed by the deep neural network, each of the observations included in the test dataset and the received observation may contain an image.
- In the present disclosure, the term "deep neural network" may be understood as an artificial neural network having an input layer, an output layer and a plurality of hidden layers provided between the input layer and the output layer. A hidden layer of a neural network may also be referred to as an "intermediate layer". Thus, an output from the hidden layer may be referred to as an "intermediate output". Further, an output from the hidden layer may include a plurality of values, each of which corresponds to a node included in the hidden layer. Accordingly, the term "set of intermediate output values" as used herein may indicate an output of a hidden layer, including a plurality of values that are output from respective nodes of the hidden layer.
- In some examples, the "deep neural network" in the present disclosure may be a feedforward neural network having a plurality of hidden layers. In a feedforward neural network, connections between nodes do not form a cycle. A specific example of a feedforward deep neural network may be a convolutional neural network (CNN) that is commonly applied to analyzing visual imagery.
- In some other examples, the "deep neural network" in the present disclosure may be a recurrent neural network where connections between nodes form a directed graph along a sequence. A specific example of a recurrent deep neural network may be Long-Short Term Memory (LSTM) which can process sequential data.
- In the present disclosure, the term "latent variable model" may be a statistical model that relates a set of observable variables to a set of latent variables. In various embodiments and examples described herein, a (first or second) "set of intermediate output values" may be considered as the set of observable variables for the latent variable model. Further, in various embodiments and examples described herein, a "set of projected values" may be considered as the set of latent variables for the latent variable model.
- In some examples, in the method according to the above-stated aspect, the latent variable model may be constructed according to principal component analysis.
- In the present disclosure, the term "principal component analysis", also referred to as PCA, may be understood as indicating a statistical procedure that uses an orthogonal transformation to convert a set of observations of possibly correlated variables into a set of values of linearly uncorrelated variables called principal components.
- Variants of PCA include but are not limited to: sparse PCA (Jenatton, R., Obozinski, G., & Bach, F. (2010, March). Structured sparse principal component analysis. In Proceedings of the Thirteenth International Conference on Artificial Intelligence and Statistics (pp. 366-373)). Alternatives to PCA include but are not limited to: random projections (Dasgupta, S. (2000, June). Experiments with random projection. In Proceedings of the Sixteenth Conference on Uncertainty in Artificial Intelligence (pp. 143-151). Morgan Kaufmann Publishers Inc.); sparse random projections (Achlioptas, D. (2003). Database-friendly random projections: Johnson-Lindenstrauss with binary coins. Journal of Computer and System Sciences, 66(4), 671-687.); very sparse random projections (Li, P., Hastie, T. J., & Church, K. W. (2006, August). Very sparse random projections. In Proceedings of the 12th ACM SIGKDD International Conference on Knowledge Discovery and Data Mining (pp. 287-296). ACM); and self-organizing maps (Kohonen, T. (1998). The self-organizing map. Neurocomputing, 21(1-3), 1-6.)
- In some other examples, in the method according to the above-stated aspect, the latent variable model may be constructed using an autoencoder. An "autoencoder" may be a type of artificial neural network used to learn efficient data codings in an unsupervised manner. One form of an autoencoder may be a feedforward, non-recurrent neural network having an input layer, an output layer and one or more hidden layers connecting them, with the output layer having the same number of nodes as the input layer, and with the purpose of reconstructing its own inputs. Different types of autoencoders include but are not limited to variational autoencoders (Kingma, D. P., & Welling, M. (2013). Auto-encoding variational bayes. arXiv preprint arXiv:1312.6114.); and sparse autoencoders (Makhzani, A., & Frey, B. (2013). K-sparse autoencoders. arXiv preprint arXiv: 1312.5663.).
- Further, in the method according to the above-stated aspect, said step of determining whether or not the received observation is an outlier may comprise:
- calculating a Mahalanobis distance of the second set of projected values with respect to a distribution of the first sets of projected values; and
- determining that the received observation is an outlier with respect to the training dataset if the calculated Mahalanobis distance is larger than a threshold value for the Mahalanobis distance.
- The threshold value for the Mahalanobis distance may be determined based on Mahalanobis distances, each of which may be calculated for a different one of the first sets of projected values with respect to the distribution of the first sets of projected values.
- In the present disclosure, the term "Mahalanobis distance" may be understood as indicating a known measure of the distance between a point P (e.g., corresponding to an observation) and a distribution D. More specifically, the "Mahalanobis distance" measures how many standard deviations away an observation is from the origin in a multivariate probability distribution.
- Further, in the method according to the above-stated aspect, wherein said step of determining whether or not the received observation is an outlier may comprise:
- determining an approximate set of intermediate output values corresponding to the second set of intermediate output values, using the latent variable model and the second set of projected values;
- calculating a squared approximation residual for the second set of intermediate output values and the approximate set of intermediate output values; and
- determining that the received observation is an outlier with respect to the training dataset if the calculated squared approximation residual is larger than a threshold value for the squared approximation residual.
- The threshold value for the squared approximation residual may be determined based on squared approximation residuals, each of which may be calculated for a different one of the first sets of intermediate output values and an approximate set of intermediate output values corresponding to said one of the first sets of intermediate output values.
- In the present disclosure, the term "squared approximation residual" may be understood as indicating a sum of squares of residuals, where a residual is a difference between an observed value and an approximated value provided by the latent variable model.
- Further, in the method according to the above-stated aspect, the steps of obtaining the first sets of intermediate output values and constructing the latent variable model may be performed for two or more of the plurality of hidden layers;
- wherein the steps of obtaining the second set of intermediate output values and mapping the second set of intermediate output values to the second set of projected values may be performed concerning said two or more of the plurality of hidden layers; and
- wherein, the step of determining whether or not the received observation is an outlier may be performed based on the latent variable model and the second sets of projected values obtained concerning said two or more of the plurality of hidden layers.
- How well the method according to the above-stated aspect can distinguish outliers and non-outliers may be evaluated using, for example, the Receiver-Operating Characteristic Area-Under-Curve (ROC-AUC) metric. For instance, when the Mahalanobis distance and/or the squared approximation residual is/are calculated for determining whether or not the received observation is an outlier, the ROC curves may be calculated by comparing how well the Mahalanobis distances and/or the squared approximation residuals separate outliers from non-outliers. Other metrics which may be used to evaluate the method include but are not limited to: (1) precision, which is a fraction of observations identified as outliers by the system that actually are outliers; (2) recall, which is a fraction of all outliers that are successfully identified as outliers by the system; (3) F1-score, which is a harmonic mean of precision and recall; and (4) accuracy, which is a fraction of correct identifications by the system out of all identifications.
- According to another aspect, a further computer implemented method is provided. The method comprises:
- obtaining a deep neural network for processing data and at least a part of a training dataset used for training the deep neural network, the deep neural network comprising a plurality of hidden layers, the training dataset including possible observations that can be input to the deep neural network;
- obtaining first sets of intermediate output values that are output from at least one of the plurality of hidden layers, each of the first sets of intermediate output values obtained by inputting a different one of the possible observations included in said at least the part of the training dataset;
- constructing a latent variable model using the first sets of intermediate output values, the latent variable model providing a mapping of the first sets of intermediate output values to first sets of projected values in a sub-space that has a dimension lower than a dimension of the sets of the intermediate outputs; and
- storing the latent variable model and the first sets of projected values in a storage medium.
- The further computer implemented method according to the other aspect as stated above may further comprise:
- receiving an observation to be input to the deep neural network;
- obtaining a second set of intermediate output values that are output from at least one of the plurality of hidden layers by inputting the received observation to the deep neural network;
- mapping, using the latent variable model, the second set of intermediate output values to a second set of projected values; and
- determining whether or not the received observation is an outlier with respect to the training dataset based on the latent variable model and the second set of projected values.
- According to yet another aspect, a yet further computer-implemented method is provided. The method comprises:
- receiving an observation to be input to a deep neural network for processing data, the deep neural network having a plurality of hidden layers and trained using a training data set that includes possible observations that can be input to the deep neural network;
- obtaining a second set of intermediate output values that are output at least from one of the plurality of hidden layers by inputting the received observation to the deep neural network;
- mapping, using a latent variable model stored in a storage medium, the second set of intermediate output values to a second set of projected values; and
- determining whether or not the received observation is an outlier with respect to the training dataset based on the latent variable model and the second set of projected values,
- wherein the latent variable model stored in the storage medium is constructed by:
- obtaining first sets of intermediate output values that are output from said one of the plurality of hidden layers, each of the first sets of intermediate output values obtained by inputting a different one of the possible observations included in said at least the part of the training dataset; and
- constructing the latent variable model using the first sets of intermediate output values, the latent variable model providing a mapping of the first sets of intermediate output values to first sets of projected values in a sub-space that has a dimension lower than a dimension of the sets of the intermediate outputs.
- According to yet another aspect, a computer program product is provided. The computer program product comprises computer-readable instructions that, when loaded and run on a computer, cause the computer to perform the method according to any one of the above-stated aspects.
- According to yet another aspect, a system for data analysis is provided. The system comprises:
- a storage medium storing a training dataset used for training a deep neural network, the deep neural network comprising a plurality of hidden layers, the training dataset including possible observations that can be input to the deep neural network; and
- a processor configured to:
- obtain the deep neural network trained using the training dataset;
- obtain at least a part of the training dataset stored in the storage medium;
- obtain first sets of intermediate output values that are output from at least one of the plurality of hidden layers, each of the first sets of intermediate output values obtained by inputting a different one of the possible observations included in said at least the part of the training dataset;
- construct a latent variable model using the first sets of intermediate output values, the latent variable model providing a mapping of the first sets of intermediate output values to first sets of projected values in a sub-space that has a dimension lower than a dimension of the sets of the intermediate outputs;
- receive an observation to be input to the deep neural network;
- obtain a second set of intermediate output values that are output from said at least one of the plurality of hidden layers by inputting the received observation to the deep neural network;
- map, using the latent variable model, the second set of intermediate output values to a second set of projected values; and
- determine whether or not the received observation is an outlier with respect to the training dataset based on the latent variable model and the second set of projected values.
- In the system according to the above-stated aspect, the latent variable model may be constructed according to principal component analysis.
- In the system according to the above-stated aspect, for determining whether or not the received observation is an outlier, the processor may be further configured to:
- calculate a Mahalanobis distance of the second set of projected values with respect to a distribution of the first sets of projected values; and
- determine that the received observation is an outlier with respect to the training dataset if the calculated Mahalanobis distance is larger than a threshold value for the Mahalanobis distance.
- In the system according to the above-stated aspect, for determining whether or not the received observation is an outlier, the processor may be further configured to:
- determine an approximate set of intermediate output values corresponding to the second set of intermediate output values, using the latent variable model and the second set of projected values;
- calculate a squared approximation residual for the second set of intermediate output values and the approximate set of intermediate output values; and
- determine that the received observation is an outlier with respect to the training dataset if the calculated squared approximation residual is larger than a threshold value for the squared approximation residual.
- In the system according to the above-stated aspect, the processor may be further configured to:
- perform the steps of obtaining the first sets of intermediate output values and constructing the latent variable model for two or more of the plurality of hidden layers;
- perform the steps of obtaining the second set of intermediate output values and mapping the second set of intermediate output values to the second set of projected values concerning said two or more of the plurality of hidden layers; and
- perform the step of determining whether or not the received observation is an outlier based on the latent variable model and the second sets of projected values obtained concerning said two or more of the plurality of hidden layers.
- According to various aspects and examples stated above, outliers in input images with respect to the training dataset can be efficiently detected, as less assumptions of how the deep neural network is constructed may be necessary and sampling may not be required. Further, according to various aspects and examples stated above, an already learned data representation may be used for outlier detection. In contrast to separate outlier detection models, the same representation used for prediction can be used for detection of outliers.
- The subject matter described in the application can be implemented as a method or as a system, possibly in the form of one or more computer program products. The subject matter described in the application can be implemented in a data signal or on a machine readable medium, where the medium is embodied in one or more information carriers, such as a CD-ROM, a DVD-ROM, a semiconductor memory, or a hard disk. Such computer program products may cause a data processing apparatus to perform one or more operations described in the application.
- In addition, subject matter described in the application can also be implemented as a system including a processor, and a memory coupled to the processor. The memory may encode one or more programs to cause the processor to perform one or more of the methods described in the application. In some examples, the system may be a general purpose computer system. In other examples, the system may be a special purpose computer system including an embedded system.
- Details of one or more implementations are set forth in the exemplary drawings and description below. Other features will be apparent from the description, the drawings, and from the claims. It should be understood, however, that even though embodiments are separately described, single features of different embodiments may be combined to further embodiments.
-
Fig. 1 shows an example of a system including the system according to the present disclosure. -
Fig. 2 shows an exemplary configuration of a convolutional neural network (CNN) for processing images. -
Fig. 3 shows a flowchart of exemplary processes performed by the system according to the present disclosure. -
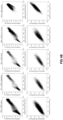
Figs. 4A and4B show distances calculated in an exemplary experiment using Fashion-MNIST. -
Fig. 5 shows ROC-curves from evaluation of outlier detection performance in the Fashion-MNIST experiment. -
Fig. 6 shows Kullback-Leibler divergence between validation set, test set and outlier sets distribution compared to the training set distribution in the Fashion-MNIST experiment. -
Fig. 7 shows violin plots of maximal predictive entropy when using MC-dropout for different datasets of the Fashion-MNIST experiment. -
Fig. 8 shows violin plots of log-transformed Mahalanobis distances from all inception-modules (mixed 0-10) in an exemplary experiment using the ImageNet. -
Fig. 9 shows ROC-AOC evaluation of outlier detection performance using Mahalanobis distance for each inception-module in the ImageNet experiment. -
Fig. 10 shows violin-plots of log-transformed residual sum of squares from all inception-modules (mixed 0-10) in the ImageNet experiment. -
Fig. 11 shows ROC_AUC evaluation of outlier detection performance using residual sum of square for each inception-module in the ImageNet experiment. -
Fig. 12 shows an exemplary network architecture used for a predictive maintenance model and exemplary features extracted for outlier detection. -
Fig. 13 shows outlier detection on test set sequences for predictive maintenance. -
Fig. 14 shows evaluation of outlier detection performance for predictive maintenance depending on number of PCA components and cutoff-percentile. -
Fig. 15 shows probabilities of different data sets under probability distributions estimated using Gaussian Kernel Densities with different bandwidths merging Mahalanobis distances from all inception outputs from the ImageNet experiment. -
Fig. 16 shows probabilities of different data sets under probability distributions estimated using Gaussian Kernel Densities with different bandwidths merging residual sum of squares from all inception outputs from the ImageNet experiment. -
Fig. 17 shows evaluation of the outlier detection performance for weak (Horse) and strong (Cars) outliers from the ImageNet dataset. -
Fig. 18 shows an exemplary hardware configuration of a computer that may be used to implement at least a part of the system described herein. - In the following text, a detailed description of examples will be given with reference to the drawings. It should be understood that various modifications to the examples may be made. In particular, one or more elements of one example may be combined and used in other examples to form new examples.
-
Fig. 1 shows an example of a system including the system according to the present disclosure. - The system shown in
Fig. 1 may comprise acomputing system 1, auser client 20, acontrol system 30 and athird party system 40. - The
computing system 1 may provide the system for data analysis, according to the present disclosure. Thecomputing system 1 may be implemented using one or more general purpose computers, for example. As shown inFig. 1 , thecomputing system 1 may comprise anapplication 10 and adata storage device 12. - The
application 10 may be implemented by a software application including instructions that cause a computer to perform exemplary processes of the computing system as will be described later in more detail. As shown inFig. 1 , theapplication 10 may comprise a deepneural network 100,predictions 110,outlier metrics 112 and aninterface 114. - The deep neural network (hereinafter, also referred to as "DNN") 100 may be an artificial neural network having an input layer, an output layer and a plurality of hidden layers in between the input and output layers. The deep
neural network 100 may be trained for processing images, using a training dataset including possible input images to the deepneural network 100. The training dataset may be stored in thedata storage device 12 accessible by theapplication 10. In the example ofFig. 1 , the deepneural network 100 may includelayers 102 and anoutlier detection module 104. - The
layers 102 may include an input layer (not shown), an output layer (not shown) and a plurality of hidden layers (not shown) provided between the input layer and the output layer. - The
outlier detection module 104 may be connected to at least one of the plurality of hidden layers of the deepneural network 100 and be configured to determine whether or not an observation is an outlier with respect to the training dataset used for training the deepneural network 100. The details of the process performed by theoutlier detection module 104 will be described later. -
Fig. 2 shows a specific example of the deepneural network 100. The exemplary deep neural network shown inFig. 2 is a convolutional neural network (CNN) for classifying images. For example, the exemplary CNN shown inFig. 2 may classify input images into a number of different categories. In another example, the exemplary CNN shown inFig. 2 may determine whether or not an input image belongs to a particular category. In any case, the exemplary CNN shown inFig. 2 may be configured to receive a greyscale image of 28 × 28 pixels as an input image. Each pixel of the input image may include a value indicating an intensity of the pixel. The intensity value of each pixel of the input image may be considered as an input value to an input node of an input layer of the exemplary CNN. The exemplary CNN shown inFig. 2 comprises four convolutional layers C1, C2, C3, C4, two max pool layers MP1, MP2 and an output layer with a softmax function as the activation function of nodes included in the output layer. - While the above example uses a 28 × 28 pixel image, from a theoretical perspective, there is no upper limit on the size of the image. However, increasing the image size may also increase computational demands. In general, the image size selected for the application of interest may reflect a trade-off between a desired level of detail and computational demands. In typical classification applications, images may range from 200 × 200 pixels to 300 × 300 pixels. However, applications are not limited to this range, and may be smaller than 200 × 200 pixels or greater than 300 × 300 pixels.
- Each node included in the convolutional layer C1 of the exemplary CNN may correspond to a filter of
size 3 × 3 (pixels), applied to a particular part of the input image and may output a value resulting from applying the filter to the particular part of the input image. In the example ofFig. 2 , 32 filters are applied to the input image at the convolutional layer C1. Each of the 32 filters may be applied to the whole area of the input image by sliding the filter with a stride of S pixel(s) in both width and height directions of the input image. For each location of the 32 filters on the input image, 32 nodes corresponding to the 32 filters may be present in the convolutional layer C1. In the example ofFig. 2 , the stride S may be set to 1 pixel. The output of the convolutional layer C1 may thus include 28 × 28 × 32 values, which may be considered as 32 images of 28 × 28 pixels. The output of the convolutional layer C1 may be input to the convolutional layer C2. The convolutional layer C2 may have a configuration analogous to the convolutional layer C1 with 32 filters ofsize 3 × 3. Accordingly, the output of the convolutional layer C2 may also include 28 × 28× 32 values, which may be considered as 32 images of 28 × 28 pixels. - The output of the convolutional layer C2 may be subject to 20 % of dropout (see D1 of
Fig. 2 ). In other words, 20 % of the values (corresponding to nodes) in the output of the convolutional layer C2 may be randomly selected and disregarded. - After the dropout operation D1, the output of the convolutional layer C2 may be further subject to down-sampling by a max-pooling operation at the first max pool layer MP1. The max pooling operation may select the maximum value among a plurality of input values. In the example of
Fig. 2 , the max pool layer MP1 may apply filters having a size of 2 × 2 may be applied, with a stride of 2 pixels, to each of the 32 images with 28 × 28 pixels output from the convolutional layer C2. This may result in 32 output images including 14 × 14 pixels each of which has the maximum intensity value among the pixels of the corresponding image (output from the convolutional layer C2) within the corresponding filter. Each filter used in the max pooling operation may be considered as a node of the max pool layer MP1. - The output from the max pool layer MP1 may be provided to the convolutional layer C3, having a configuration analogous to that of the convolutional layers C1, C2, but applying 64 filters. The output of the convolutional layer C3 may be provided to the convolutional layer C4, having an analogous configuration as the convolutional layer C3, with 64 filters of
size 3 × 3. Further, the output of the convolutional layer C4 may be subject to 20 % of dropout (see D2 ofFig. 2 ) and then subject to the max-pooling operation at the max pool layer MP2 in a manner analogous to that at the max pool layer MP1 as stated above. The output of the max pool layer MP2 may include 7 × 7 × 64 values. - Finally, the output of the max pool layer MP2 may be provided to the output layer with a softmax function. The output layer may include one or more output nodes corresponding to one or more groups (or categories) into which the input image may be classified. While this example refers to specific parameters (e.g., a number of filters, a dropout percentage, number of convolutional layers, stride, etc.), the methods and systems are not limited to these embodiments, as a range of values for each parameter is contemplated herein.
- In some examples, concerning the exemplary CNN shown in
Fig. 2 , the outputs from the max pool layers MP1 and MP2 may be provided to the outlier detection module 104 (Fig. 1 ) for detecting whether or not the input image is an outlier with respect to the training dataset used for training the exemplary CNN shown inFig. 2 . For instance, theoutlier detection module 104 may construct, for each of the max pool layers MP1 and MP2, a latent variable model using the outputs from the respective max pool layers MP1 and MP2 for possible input images in the training dataset. The latent variable model may provide a mapping of the outputs of the max pool layer MP1 or MP2 to sets of projected values in a sub-space that has a dimension lower than a dimension of the outputs of the max pool layer MP1 or MP2. The constructed latent variable model may be used for determining whether or not an input image (e.g., a newly obtained input image that is not included in the training dataset) is an outlier with respect to the training dataset. In more general terms, theoutlier detection module 104 may be configured to obtain outputs from one (or more) of the hidden layers of the deepneural network 100 and construct the latent variable model using the obtained outputs. - Referring again to
Fig. 1 , thepredictions 110 may be outputs from the deepneural network 100. In some examples, thepredictions 110 may indicate which category the input image is classified into by the deepneural network 100. - The
outlier metrics 112 may include metrics for determining whether an input image is an outlier with respect to the training dataset used for training the deepneural network 100. The details of theoutlier metrics 112 will be described later below. - The
interface 114 may be an interface for theapplication 10 to communicate with various devices that may be provided outside thecomputing system 1. For example, theinterface 114 may be configured to communicate information generated by theapplication 10 to those devices. Further, for example, theinterface 114 may be configured to receive information directed to theapplication 10 from those devices. - The
data storage device 12 may be configured to store data that is used by theapplication 100. AlthoughFig. 1 shows thedata storage device 12 to be a part of thecomputing system 1, in some examples, thedata storage device 12 may be provided outside the computing system, as long as the data stored in thedata storage device 12 is accessible by theapplication 10. - The
user client 20 may be a client device connected to thecomputing system 1. Theuser client 20 may include auser application 22 that may use the predictions and the results of outlier detection performed at thecomputing system 1. A specific example of theuser client 20 may be a work-station remotely connected to a computational server, for instance using SSH (Secure Shell) or HTTP (Hypertext Transfer Protocol) requests. The DNN (deep neural network) can then be applied to user-provided input on the computational server and the resulting predictions and outlier metrics can be returned to theuser client 20. Theuser client 20 may be part of the same physical device as thecomputing system 1 running theapplication 10, for instance on a work-station configured to perform DNN predictions. - The
control system 30 may control a device using the predictions and the results of outlier detection performed at thecomputing system 1. A specific example of thecontrol system 30 may be a control system of an autonomous vehicle, in which the control system may receive the prediction and the results of outlier detection to control the steering of the vehicle. The control system may comprise aprogrammatic client 32. In the specific example of the autonomous vehicle control system, the programmatic client is the software running in the control system receiving input and making decisions to how to control the vehicle. Another specific example of the present techniques relates to characterization of input material to the control system of a biopharmaceutical manufacturing process. To ensure desired output quality of such manufacturing processes, control parameters of the process are adjusted according to properties of the input material. A heterogeneous combination of data sources may be used to characterize the input material including both structured and unstructured data. - Example data sources may include text, such as event reports, images, chromatograms, spectroscopic data, chemical analysis, etc. Deep learning is well suited to analyze such heterogeneous combination of data due to deep learning's ability to find useful mappings from both structured and unstructured data to a given output. To avoid poor output quality or catastrophic failure when input data does not match the data used to train the deep learning model, it may be important to detect outliers after model training. If input data are identified as an outlier, the input data may not be used as input to the manufacturing process since the output quality cannot be guaranteed.
- Another specific example of the present techniques is in control systems learned from data using deep reinforcement learning, rather than programmed by a human controller. In a biopharmaceutical manufacturing process there may be a large number of possible control parameters and it may be challenging to find all interactions and feedback loops existing in the system due to high complexity. Instead deep reinforcement learning may be used to learn control policies from data and simulation. To detect when the process enters a state that is different from states encountered during model training, outlier detection may be important. If such state is identified as an outlier, the deep learning based control system may warn the user (e.g., by sending a notification to the user) and/or may perform safety routines to avoid poor output quality or catastrophic failure. Examples of the use of deep reinforcement learning may be found in the art (e.g., Li, Y., Wen, Y., Guan, K., & Tao, D. (2017). Transforming Cooling Optimization for Green Data Center via Deep Reinforcement Learning. arXiv preprint arXiv:1709.05077; and Nguyen, P. & Takashi, E. (2018). Automating Water Purification Plant Operations Using Deep Deterministic Policy Gradient. In Proceedings of Workshop (Published at ICML Workshop for Deep Learning for Safety-Critical in Engineering Systems)).
- Unlike prior art methods for outlier detection in deep learning models, the present methods do not constrain how the model is designed and/or trained, allowing these methods to be added to models in production. Additionally, as the present techniques are used after model training, the present techniques may be used with real-time applications and/or models implemented in a live application. In contrast, prior art methods that use multiple forward-passes/inferences per prediction (e.g., wherein the prediction is used as the average and the standard deviation or entropy is used as the uncertainty measure), may lead to increases in latency, which is problematic for real-time applications.
- The
third party system 40 may be implemented by a computer and may include athird party application 42. Thethird party system 40 may belong to an entity that is different from an entity to which thecomputing system 1 belongs to. Thethird party application 42 may use the predictions and the results of outlier detection performed at thecomputing system 1. A specific example of thethird party application 42 may be a software relying on DNN predictions and results of outlier detection purchased from a DNN prediction provider. - The
computing system 1 may be connected with theuser client 20, thecontrol system 30 and thethird party system 40 via a network such as the Internet. In some examples, one or more of theuser client 20, thecontrol system 30 and thethird party system 40 may be connected to thecomputing system 1 via an intranet. - As mentioned above, the
outlier detection module 104 in thecomputing system 1 shown inFig. 1 may be configured to construct a latent variable model using intermediate output values that are output from at least one of the plurality of hidden layers of the deep neural network 100 (e.g., the max pool layer MP1 or MP2 ofFig. 2 ), in order to determine whether or not an input image is an outlier with respect to the training dataset used for training the deepneural network 100. - The following provides an exemplary technique for outlier detection using partial least squares regression, which may facilitate understanding of how the
outlier detection module 104 can detect outliers. - The concept of model uncertainty is related to that of prediction time outlier detection. In both cases, the main objective may be to find observations that do not correspond to observations with which the model has been trained. Predictive models have long been used to detect out-of-distribution observations during prediction in manufacturing process monitoring. In this field, linear latent variable models such as partial least squares (PLS) regression are widely used (see e.g., P. Geladi and B. R. Kowalski, "Partial least-squares regression: a tutorial," Anal. Chim. Acta, vol. 185, no. Supplement C, pp. 1-17, Jan. 1986). A PLS model can find a sub-space approximating the training data similarto Principal Component Analysis (PCA) (S. Wold, K. Esbensen, and P. Geladi, "Principal component analysis," Chemom. Intell. Lab. Syst., vol. 2, no. 1, pp. 37-52, Aug. 1987), which is used for predictions. New observations may then be projected onto the sub-space found by the PLS model. Accordingly, both distance within the sub-space and distance from the sub-space can be used to find outliers during prediction-time.
- Prediction time refers to the time after the model has been fitted and the model is used for prediction in an application (and does not include time for model fitting/training, when the model is generated).
- It is noted that, although simple and effective, the principles for the PLS model as mentioned above may not be directly applied to a deep learning system. Specifically, the basis for prediction of PLS is a sub-space of the input data space, making it straight-forward to compare the sub-space approximation of new observations to those used for training. Deep learning models, on the other hand, typically depend on multiple layers of non-linear transformations, where each transformation contributes to the final output. This may mean that seemingly different observations are transformed through a sequence of spaces and mapped to an output. This ability to find useful transformation of input to output may be the reason why deep learning models work well for unstructured data. However, a consequence of these transformations may be that the transformations make it difficult to determine whether or not new observations belong to the same data distribution that the model was trained on. There may be no obvious point of comparison to determine the limits of the deep learning model's knowledge and no obvious way to decide if a new observation is within those limits.
- PLS regression is a widely used regression model within, for example, manufacturing process monitoring. Given an training data matrix with n rows of observations and p columns of features, denoted X = [x 1 ... xn ] T , with corresponding target matrix with q columns of responses, denoted Y, a PLS model may summarize both data-matrices. Similar to PCA, PLS may find full-rank sub-spaces, of equal dimension k, called "latent variable spaces" that approximate X and Y. In contrast to PCA, the PLS may maximize the covariance between the sub-spaces found, instead of maximizing the variance of a single sub-space. In short, PLS may approximates the input data as:

- Where T = [t1, ... , tk ] may be an n × k latent variable matrix spanning a full-rank sub-space of the column-space of X and maximizing the covariance with Y, P may be p × k matrix of PLS loadings, and E may be an n × p matrix of approximation residuals. The loadings may contain the linear combination weights used to approximate X from T. The response matrix for Y may be approximated in a similar way. More details on how to calculate the PLS model and use it for regression can be found in S. Wold, M. Sjöström, and L. Eriksson, "PLS-regression: a basic tool of chemometrics," Chemom. Intell. Lab. Syst., vol. 58, no. 2, pp. 109-130, Oct. 2001.
- The approximation of the input data provided by PLS can be used to detect outliers encountered during prediction. After model fitting, new observations may be projected onto the sub-space found using PLS by:


- Both the sub-space projection, Tnew, and the approximation may be used to detect outliers. Two exemplary measures used to detect outliers during prediction-time are Mahalanobis distance in the latent variable space and approximation residuals in the input column space.
- One way to detect outliers during prediction-time when using PLS may be to use Mahalanobis distance. The Mahalanobis distance is a known statistical distance measuring how many standard deviations away an observation is from the origin in a multivariate probability distribution. The intuition may be that observations with large Mahalanobis distances are unlikely under the given probability distribution. A latent variable probability distribution may be parametrized using a covariance matrix, CT, of the latent variables in T, assuming that the latent variables have zero mean. Then the Mahalanobis distance di of an observation xi with projection ti in latent variable space may be calculated as:

- While the Mahalanobis distance can measure how unlikely an observation is under the given distribution, the Mahalanobis distance may provide no information whether or not the observation belongs to that distribution. In contrast, the approximation residuals can provide a simple measure of how far from the distribution a new observation is. Given a fitted PLS model, an observation xi may be approximated as x̂i . The squared approximation residual may then be simply given by:

- The
outlier detection module 104 may perform an add-on method based on the principles for prediction time outliers in, e.g. manufacturing process monitoring, as stated above, for finding observations that the deepneural network 100 may not be able to explain. - The method performed by the
outlier detection module 104 to detect prediction-time outliers in a deep learning system may be based on the fact that a neural network may function by transforming input data. When input data is fed through a deep neural network, multiple intermediate representations of the data may exist, where the intermediate representations may be used for prediction (e.g., of a group into which the input data is classified in case of the deep neural network is configured to solve a classification problem). One or more of these intermediate representations may be used for detecting outliers during prediction, as well as for performing the prediction. - In order to provide a possibility to detect outliers during prediction in a similar way as PLS, a feed-forward neural network may be considered as a series of non-linear transformations. In other words, an activation vector ai of an observation x (input data) from layer i (= 1, 2, 3, 4, ....) of the given network may be given by the nested series of transformations as follows:

- To explain the transformation in more detail, observation x may be an n-dimensional row vector x = [x1 x2 ... xn ] wherein n depends on the application. In the case of x which is a single channel image, n may be the image's length in pixels multiplied with the image's width in pixels and the values x1, x2, ... , xn are the pixel values of the image. In the first layer, x is matrix multiplied with the first weight matrix W 1 to form the linear projection x̂ which is n 1-dimensional. The dimension of W 1 is n × n 1. After linear projection, an activation function f 1 is applied to x̂ to form activation a 1. The activation function f 1 may be a non-linear function. Common choices of activation functions include the rectified linear function f(x) = max (0, x), the sigmoid function f(x) = (1 + e-x )-1 , the softmax function

- Using these intermediate representations, a plug-and-play method for detecting outliers in any feed-forward neural network may be provided. Given a trained network, the training data can be represented using the activation matrix Ai = [a 1,i ... an,i ] T from layer i, where n may be the number of observations. Since Ai may not be full-rank, it may be desirable to find a full-rank sub-space that can be used to approximate Ai . In some examples, PCA may be used to obtain the sub-space using linear projections, for mapping the data to a low-dimensional sub-space. In some other examples, other methods such as autoencoders, random projections, sparse principal components analysis, and/or self-organizing maps may be used for mapping the data to a low-dimensional sub-space.
- In the examples of using PCA, the dimensionality of the training data activations can be reduced to m dimensions to obtain:

- Similar to PLS, TA may denote the latent-variable matrix spanning a sub-space of the training set activations and PA may denote the PCA loadings. For example, PCA in matrix form may provide the following least squares model:

- In the same manner as PLS, the covariance matrix of the latent variables and loading matrices may be used to detect prediction-time outliers based on Mahalanobis distance and approximation residual.
- When new observations are predicted using the trained neural network, the activations Ai,new may also be extracted. The new activations may be projected to the sub-space found from the training data activations in the same way as when using PLS:

- And the Mahalobis distances of the new observations may be calculated according to the equation (4).
- The new activations may also be approximated using the PCA loadings as:

- The approximation residual calculated according to the following equation (11) (analogous to equation (5)) may also be used to detect outliers in the same way as when using PLS:

- The left hand part of
Fig. 3 shows a flowchart of an exemplary process for setting up thecomputing system 1. The exemplary process shown inFig. 3 may be performed by theapplication 10 of thecomputing system 1. - At step S10, the
application 10 may acquire data from thedata storage device 12. The data may be at least a part of a training dataset for training the deepneural network 100. The training dataset may include possible observations input to the deepneural network 100. In case the deepneural network 100 is a CNN as shown inFig. 2 , for example, the training dataset may include possible input images to the CNN as the possible observations. - At step S12, the
application 10 may determine whether or not the deepneural network 100 has already been trained. Step S12 may be performed before, after, or in parallel with step S10. - If it is determined that the deep
neural network 100 has not yet been trained (No at step S12), the process may proceed to step S14. If it is determined that the deepneural network 100 has already been trained (Yes at step S12), the process may proceed to step S16. - At step S14, the
application 10 may train the deepneural network 100 using the data acquired at step S10. - At step S16, the
application 10 may transform data using the deepneural network 100. Specifically, for example, theapplication 10 may obtain the activation vectors from at least one layer of the deepneural network 100 according to equation (6) stated above, of the possible input images in the training dataset. An activation refers to the result of a sequence of matrix multiplications and transformation using an activation function by an observation as described by equation (6). - At step S18, the
application 10 may fit a latent variable model. In other words, theapplication 10 may construct the latent variable model. For example, theapplication 10 may obtain the latent-variable matrix TA and the PCA loadings PA using PCA as stated above (see e.g., equations (7) and (8)). Alternatively, the application may train an autoencoder using the activation vectors as inputs. - At step S20, the
application 10 may project activations using the latent variable model. For example, theapplication 10 may obtain, from the activation vectors obtained at step S16, corresponding sets of projected values (e.g., T) in the sub-space found by constructing the latent variable model. - At step S22, the
application 10 may calculate distances of activations of data. For example, theapplication 10 may calculate the Mahalonobis distance for each of the activation vectors obtained at step S16, with respect to the latent variable model constructed at step S18, according to equation (4) stated above. Additionally or alternatively, for example, theapplication 10 may calculate the squared approximation residual for each of the activation vectors obtained at step S16 according to equation (11) stated above. - At step S24, the
application 10 may determine a threshold value for the distance. Additionally or alternatively, a threshold value for the squared approximation residual may be determined. The threshold value(s) may later be used for determining whether a new observation (e.g. input image) is an outlier with respect to the training dataset. For obtaining the threshold value(s), the distances and/or the squared approximation residuals calculated at step S22 may be used. For instance, the threshold value may be a percentile, e.g. the 95th percentile, of the distances (or the squared approximation residuals) calculated at step S22. It is noted that the "95th percentile" is merely an example and a value greater or lower than 95 may also be used as the percentile to determine the threshold. - The process for system setup may end after step S24.
- The right hand side of
Fig. 3 shows an exemplary process performed by thecomputing system 1 for detecting outliers. - At step S30, the
application 10 may receive a new observation. For example, in case the deepneural network 100 is a CNN as shown inFig. 2 , an image to be input to the CNN may be received as the new observation. - At step S32, the
application 10 may transform the new observation. For example, theapplication 10 may obtain the activation vector from at least one layer of the deepneural network 100 according to equation (6) stated above, of the new observation. - At step S34, the
application 10 may project activation using the latent variable model constructed at step S18 as stated above. For example, theapplication 10 may obtain, from the activation vector obtained at step S32, a corresponding set of projected values (e.g., TA,new ) in the sub-space found by constructing the latent variable model (see equation (9)). - At step S36, the
application 10 may calculate a distance of the new observation. For example, theapplication 10 may calculate the Mahalanobis distance for the activation vector of the new observation obtained at step S32, with respect to the latent variable model constructed at step S18, according to equation (4) stated above. Additionally or alternatively, for example, theapplication 10 may calculate the squared approximation residual for the activation vector of the new observation obtained at step S32 according to equation (11) stated above. - At step S38, the
application 10 may determine whether or not the distance calculated at step S36 is larger than the threshold determined at step S24. - If yes at step S38, the process may proceed to step S40 and the
application 10 may determine that the new observation is an outlier. In this case, the system may report the model prediction as an unreliable prediction, since the new observation is determined to be an outlier. The process may end after step S40. - If no at step S38, the process may proceed to step S42 and the
application 10 may determine that the prediction made by the deepneural network 100 for the new observation can be trusted. In this case, the system may report the model prediction as a reliable prediction, since the new observation is determined to be a non-outlier. The process may end after step S42. - In this section, results of experiments for outlier detection performed by the
exemplary computing system 1 will be described. In the following experiments, the deepneural network 100 are directed to solve image classification tasks. - The first experiment involves the Fashion-MNIST classification dataset (H. Xiao, K. Rasul, and R. Vollgraf, "Fashion-MNIST: a Novel Image Dataset for Benchmarking Machine Learning Algorithms," ArXiv170807747 Cs Stat, Aug. 2017, Available: https://arxiv.org/abs/1708.07747 [Accessed: 21-June-2018]), consisting of 70 000 greyscale 28x28 pixel images of ten categories of fashion products. The training data set has 60 000 images and the test set 10 000 images. The Fashion-MNIST dataset is used as a drop-in replacement for the original MNIST dataset (Y. LeCun, C. Cortes, and C. Burges, "MNIST handwritten digit database, Yann LeCun, Corinna Cortes and Chris Burges." [Online]. Available: http://yann.lecun.com/exdb/mnist/. [Accessed: 21-Jun-2018]).
- In this experiment, images from five out of the ten Fashion-MNIST categories were excluded from model fitting in order to use them as outliers later on. All shoe categories (e.g. sandals, ankle boots and sneakers) were excluded to eliminate all information on how shoes look. Two classes of clothes were also excluded (pullover and shirts) in order to provide more difficult-to-detect outliers since the training data contain other upper body garments (T-shirts, dresses and coats). A CNN as shown in
Fig. 2 was trained using rmsprop (see e.g., T. Tieleman and G. Hinton, "Lecture 6.5-rmsprop: Divide the gradient by a running average of its recent magnitude," COURSERA Neural Netw. Mach. Learn., vol. 4, no. 2, pp. 26-31, 2012) optimization, categorical cross entropy loss function, batch size 128 for 10 epochs keeping 10 % of the images as validation set and achieved a test set accuracy of 97.06 %. - To compare which layer to use for the outlier detection, image activations were extracted from both the first and second max-pooling layers MP1, MP2 (see
Fig. 2 ) and training set activations were used to fit PCA models with 150 components. A robust estimate of the covariance of the latent variable matrix was adopted using the minimum covariance determinant method (see e.g., P. J. Rousseeuw, "Least Median of Squares Regression," J. Am. Stat. Assoc., vol. 79, no. 388, pp. 871-880, Dec. 1984; P. J. Rousseeuw, "Multivariate estimation with high breakdown point," Math. Stat. Appl., vol. 8, pp. 283-297, 1985). How many components to use separately was evaluated, as shown inFig. 6. Fig. 6 shows Kullback-Leibler divergence between validation set, test set and outlier sets Mahalanobis distance (left) and residual sum-of-squares (Residual SS) (right) distribution compared to the training set distribution in the Fashion-MNIST example for different number of PCA components used. The Kullback-Leibler divergence is a measure of how dissimilar two probability distributions are. It is found to be favorable to use as many principal components as possible while being able to calculate the robust covariance estimate. Image features from all datasets were projected onto the PCA models. It is noted that, inFig. 6 , the solid line for the validation set and the broken line for the test set are plotted very close to each other, which makes it difficult to distinguish these two lines in the graphs. - To evaluate how well the
exemplary computing system 1 works for outlier detection during prediction, the observation-wise log-transformed residual sum-of-squares and Mahalanobis-distance for all data were calculated, as shown inFigs. 4A and4B .Figs. 4A and4B show summary of distances calculated for Fashion-MNIST experiment, log-transformed Mahalanobis distances in top row and log-transformed residual sum of squares in bottom row. Specifically,Fig. 4A shows, from left to right; violin-plots of distances calculated from first (left column) and second (right column) max-pool layer outputs, andFig. 4B shows scatter plots of distance from both max-pool layer outputs against each other. The Mahalanobis distance and residual sum-of-squares of two types of outliers were compared with the test-set to see how well this method distinguishes outliers and non-outliers. The Receiver-Operating-Characteristic Area-Under-Curve (ROC-AUC) metric is used to measure performance, as shown inFig. 5 . The model can be considered more accurate as the value of the ROC-AUC metric is larger.Fig. 5 shows ROC-curves from evaluation of outlier detection performance in the Fashion-MNIST example. The curves are calculated by comparing how well the distances separate the outlier-classes from the test set. - Referring to
Fig. 5 , the strong outliers (shoe categories) are indefinitely separated from non-outliers, and the weak outliers (upper body garments) are successfully separated as well. The strong outliers are separated from non-outlier images using both residuals (ROC-AUC of 0.938 and 0.914 for max pool layers MP1 and MP2 features respectively) and Mahalanobis-distances (ROC-AUC of 0.817 and 0.833 respectively). As expected, the weak outliers are harder to distinguish as outliers since they share more visual features with the images used for model training. Nevertheless, using Mahalanobis-distance as outlier detection measure does separate them successfully, but not as strongly as the shoe-outliers (ROC-AUC 0.687 and 0.661 for MaxPool-1 and -2 features respectively). Residuals only weakly detect the non-shoe outliers in this case (ROC-AUC 0.577 and 0.600). - As a comparative example, MC-dropout was used to calculate the maximal image-wise Shannon entropy from 50 Monte Carlo samples for the same images (see e.g.,
Fig. 7 showing violin plots of maximal predictive entropy when using MC-dropout for the different datasets of the Fashion-MNIST). Surprisingly, the dropout-based approach failed to detect the shoe outlier (ROC-AUC 0.495) and detected non-shoe outliers to a weaker extent than using PCA-based Mahalanobis-distances (ROC-AUC 0.631 for dropout-based uncertainty). - In the second experiment, a different CNN architecture, as compared to previous examples, is used. The CNN architecture in the second experiment has more layers, complex connectivity, and multiple sizes of convolution kernels as compared to previous examples. In the second experiment, a pre-trained CNN was used on image synsets from the ImageNet-database (see e.g., J. Deng, W. Dong, R. Socher, L. J. Li, K. Li, and L. Fei-Fei, "ImageNet: A large-scale hierarchical image database," in 2009 IEEE Conference on Computer Vision and Pattern Recognition, 2009, pp. 248-255.). The term "synset" is used in WordNet which is a lexical database for the English language. The WordNet groups English words into sets of synonyms called synsets, provides short definitions and usage examples, and records a number of relations among these synonym sets or their members. ImageNet uses the hierarchical structure of WordNet and each "synset" may correspond to a concept in WordNet, possibly described by multiple words or word phrases. In ImageNet, it is aimed to provide on average 500 to 1000 images to illustrate each synset. In order to evaluate the methodology applied in the
exemplary computing system 1 in a more complex experiment, Inception v3-network (see e.g., C. Szegedy, V. Vanhoucke, S. Ioffe, J. Shlens, and Z. Wojna, "Rethinking the inception architecture for computer vision," in Proceedings of the IEEE Conference on Computer Vision and Pattern Recognition, 2016, pp. 2818-2826) already trained on the ImageNet was used to demonstrate how to detect outliers in a cat vs dog-classifier. Images from the ImageNet cat and dog synsets were used as non-outlier data, with 80 % of the images as training data, 10 % for validation data and 10 % as test data. To provide outliers, images from the ImageNet horse-synset were used as weak outliers and images from the car-synset as strong outliers. The intuition is that horse images share more visual features, such as eyes, ears and fur, with cats and dogs than they do with cars. - To compare detection performance at different depths in Inception, activations were extracted from all inception module (e.g., hidden layer or intermediate layer) filter concatenations which were pooled using global average pooling (see e.g., M. Lin, Q. Chen, and S. Yan, "Network In Network," ArXiv13124400 Cs, Dec. 2013). In the same manner as in the Fashion-MNIST example, a separate PCA model and latent variable covariance matrix were calculated for each blocked of pooled inception activations from cat- and dog-images. Again, the Mahalanobis-distances and residual sum-of-squares were used to detect outliers and performance was evaluated using ROC-AUC of the difference between test set and outliers.
-
Fig. 8 shows violin-plots of log-transformed Mahalanobis distances from all inception-modules (mixed0-10) in the ImageNet experiment. Further,Fig. 10 shows violin-plots of log-transformed residual sum of squares from all inception-modules (mixed0-10) in the ImageNet experiment. - Outliers are better detected deep into the Inception-network, as can be seen from
Figs. 9 and11 .Fig. 9 shows ROC-AUC evaluation of outlier detection performance using Mahalanobis distance for each inception-module (mixed0-10) for both weak outliers (Horse) and strong outliers (Cars).Fig. 11 shows ROC-AUC evaluation of outlier detection performance using residual sum of square for each inception-module (mixed0-10) for both weak outliers (Horse) and strong outliers (Cars). Referring toFigs. 9 and11 , the ROC-AUC metric peaks at the eighth layer, the inception module mixed7. The car-images are detected successfully as outliers with ROC-AUC of 0.961 using Mahalanobis distances and 0.946 using residual sum of squares. The less obvious are also detected as outliers with ROC-AUC of 0.712 using Mahalanobis distance and 0.750 using residual sum-of-squares. - Again, MC-dropout is used in a comparative example. The top-layer of the Inception v3-network is replaced with a layer of 128 hidden units with ReLu (rectified linear unit) -activations and a single output is replaced with sigmoid activation with 50 % dropout before and after the ReLu-layer. The initial Inception weights were frozen and only the top-layers were trained achieving a test set accuracy of 93%. All sets of images were Monte Carlo sampled 100 times using prediction time dropout and the Shannon entropy for each prediction was recorded. Using this methodology, both types of outliers were detected but less reliably compared to the method applied in the exemplary computing system 1 (ROC-AUC of 0.873 for car-images and 0.631 for horse-images).
- The performance of outlier detection in the ImageNet experiment is summarized in the following Table 1.
Table 1. Summary of performance of outlier detection in the ImageNet experiment. ROC-AUC (Horse) ROC-AUC (Car) Residual SS (mixed7) 0.763 0.946 Mahalanobis distance (mixed7) 0.703 0.959 KDE + Residual SS 0.617 0.865 KDE + Mahalanobis distance 0.567 0.799 MC-Dropout 0.631 0.873 - In the above-stated two experiments, Fashion-MNIST and ImageNet, a CNN was used as the deep
neural network 100 for image analysis. Theexemplary computing system 1, however, can also perform outlier detection in analyzing types of data other than images. For example, outlier detection by theexemplary computing system 1 may be performed for a predictive maintenance task in which conditions of in-service equipment are determined in order to predict when maintenance should be performed. This section provides experimental results of outlier detection for predictive maintenance of turbofan engines. - In this experiment, the Turbofan Engine Degradation dataset provided by the Prognostics CoE at NASA Ames (Saxena, A. and Goebel, K. "Turbofan Engine Degradation Simulation Data Set", NASA Ames Prognostics Data Repository (http://ti.arc.nasa.gov/project/prognostic-data-repository), 2008, NASA Ames Research Center, Moffett Field, CA) was used. The dataset consists of simulated turbofan engines running to failure under different operational conditions and fault modes. The engines were monitored over time using 21 sensors. The sensors used included temperature sensors, pressure sensors, fan and core speed sensors, coolant bleed measurements and burner fuel-air ratio measurements. The details of the dataset can be found in, for example, Saxena, A., Goebel, K., Simon, D., & Eklund, N., "Damage propagation modeling for aircraft engine run-to-failure simulation", In Prognostics and Health Management, 2008, PHM 2008, International Conference on (pp. 1-9), IEEE, October 2008. Further, 3 control settings were recorded for 100 engines in the training dataset and 100 in the test dataset. The challenge is to predict
failure 15 sensor cycles before the failure happens to avoid catastrophic failure. - To predict failure, a neural network model based on Long-Short Term Memory (LSTM)-block (Hochreiter, Sepp, and Jürgen Schmidhuber. "Long Short-Term Memory." ; Gers, Felix A., Jürgen Schmidhuber, and Fred Cummins. "Learning to Forget: Continual Prediction with LSTM." ) was trained. An LSTM block may be understood as a unit in a recurrent neural network and may comprise a cell, an input gate, an output gate and a forget gate. The cell may "remember" values over arbitrary time intervals, e.g. implementing an internal "memory". Each of the input, output and forget gates may be considered as a node in a neural network, which computes an activation of a weighted sum using an activation function. The input, output and forget gates may be connected to the cell and may be considered as regulators of the flow of values that goes through the connections of the LSTM block. The LSTM model was used as the deep
neural network 100 of thecomputing system 1 in this experiment. -
Fig. 12 shows an exemplary configuration of the LSTM-model (an example of the deep neural network 100) trained for predicting failure using the Turbofan Engine Degradation dataset in this experiment. The LSTM-model shown inFig. 12 comprises three LSTM-layers L1, L2, L3 and an output layer with a sigmoid function as the activation function. The LSTM-layers L1 and L2 respectively comprise 64 LSTM blocks and the LSTM layer L3 comprises 50 LSTM blocks. The LSTM-layers L1, L2, L3 may be considered as the hidden layers of the deepneural network 100. To train the LSTM-model shown inFig. 12 , sliding windows that were 50 cycles long was used as input and a binary response indicating whether or not the last cycle of the sliding window is within 15 cycles away from a failure. The 21 sensor outputs, the 3 control settings and the current cycle from the beginning were used as variables for failure prediction. All variables were scaled to range 0-1, and the scaling parameters for the training data were used for scaling the test data. - To monitor training progression, 10 % of the training dataset was used for validation. The LSTM model was trained until binary cross entropy for the validation set stopped increasing (eight epochs) using the Adam optimizer (Kingma, Diederik P., and Jimmy Ba. "Adam: A Method for Stochastic Optimization." ArXiv:1412.6980 [Cs], December 22, 2014, Available: http://arxiv.orq/abs/1412.6980 [Accessed: 25-July-2018]). The resulting model achieved a test-set F1-score of 94.1 % at sliding window classification. The test-set performance of the predictive maintenance model is summarized in the following Table 2.
Table 2. Summary of test-set performance of the predictive maintenance model Metric Test set score Accuracy 0.968 Precision 0.923 Recall 0.96 F1-score 0.941 - To simulate prediction time outliers where a sensor stops working, half of the test set engines were randomly chosen to serve as outliers. For each of these engines, a sensor was randomly chosen and its output was set to zero starting at the middle of the full time sequence. To provide a latent variable model for detecting these outliers, features (e.g., intermediate outputs) were extracted from the LSTM-layers L1, L2, L3 of the predictive maintenance model (see
Fig. 12 ). For the first two LSTM-layers L1, L2, the average across time for each LSTM-node was used to summarize each sliding window. For the last LSTM-layer L3, simply the last cycle in the time sequence was used. The output from the three LSTM-layers L1, L2, L3 were then concatenated into a single matrix. - An outlier detection module was set up based on PCA, where a 100-component PCA-model was fit on all the training data LSTM-features. The approximation residual sum-of-squares was calculated for all training set sliding windows, and the 99.9th percentile of training residual sum-of-squares was set as cutoff for outliers. Then the outlier and remaining test-set LSTM-features were projected on the PCA-model and the approximation residual sum-of-squares was calculated for all sliding windows, as can be seen from
Fig. 13 . Thus, the methods and systems as described herein may be used in addition to the predictive maintenance model to handle detection and management of outliers. While the predictive maintenance model is accurate at the task it has been trained for, this model cannot handle unexpected events such as sensor breakage (which is not engine breakage). -
Fig. 13 shows results of outlier detection on test set sequences for predictive maintenance. The left side ofFig. 13 shows sequences where one random sensor breaks aligned at sensor breakage (vertical dashed line indicating when sensor broke) and the right side ofFig. 13 shows test set without sensor breakage aligned at middle time point. Top row figures inFig. 13 show residual sum-of-squares for outlier detection, horizontal dashed line indicating the 99.9th percentile based on training set distances. Middle row figures inFig. 13 show the model's prediction if the turbine is going to break within 15 cycles, where 1 means that the engine is predicted to fail. Bottom row figures inFig. 13 show the labels indicating if the turbine is going to break within 15 cycles, where 1 means that the engine is going to fail. Outliers were successfully distinguished from normal variation (precision = recall = 1 for this experiment). Following sensor breakage, the LSTM-model predict that many of the engines are going to break but the residual sum-of-squares increase simultaneously. For the test set, the model predicts engine failure correctly while the residual sum-of-squares does not increase. This shows that by using the present method it is possible to distinguish between predictions that should not be trusted and those that should be. It also shows that the present method is applicable not only to feed-forward networks, but also to recurrent networks. - Further, how the number of components and residual sum-of-squares influence the results was explored. The number of components was varied from 1 to 150 and the precision and recall for outlier detection were reported using the 95th, 99th and 99.9th percentiles of training set residual sum-of-squares as cutoff, as can be seen from
Fig. 14. Fig. 14 shows evaluation of outlier detection performance for predictive maintenance depending on number of PCA components and cutoff-percentile. Interestingly, precision and recall of 1 was achieved for all cutoffs but the number of components required to do so increase with stricter cutoffs. For all cutoffs, components with very small explained variation is required to achieve high precision and recall (99.99 % cumulative R2 is reached after only 36 components). This shows that the variation that differ between outliers and normal test set sequences are small nuances that require very small PCA components to be captured. At all cutoffs, over-fitting was observed with reduced precision when the number of components becomes too large. At stricter cutoffs, however, a larger number of components is tolerated before over-fitting occurs. In this experiment, a PCA model explaining 99.999 % of the training LSTM-feature variation provides a good basis for outlier detection with precision and recall of 1 at both 99th and 99.9th percentile cutoff. - In the
exemplary computing system 1 as described above, activations from a single hidden layer may be used for performing the outlier detection. - In some other examples, activations from two or more hidden layers may be used for performing the outlier detection. For instance, in order to avoid the difficulty in selecting which layer to use for outlier detection, the measures from all (hidden) layers may be combined using Gaussian Kernel Density estimation, which have been used to detect outliers (see e.g., L. J. Latecki, A. Lazarevic, and D. Pokrajac, "Outlier Detection with Kernel Density Functions," in Machine Learning and Data Mining in Pattern Recognition, 2007, pp. 61-75; E. Schubert, A. Zimek, and H. Kriegel, "Generalized Outlier Detection with Flexible Kernel Density Estimates," in Proceedings of the 2014 SIAM International Conference on Data Mining, 0 vols., Society for Industrial and Applied Mathematics, 2014, pp. 542-550). Kernel density estimations can be calculated separately for training set Mahalanobis-distances and residual sum of squares, but combining all layers. The probabilities of each image can be approximated under the resulting kernel density functions using Monte Carlo integration. The outlier detection performance can be evaluated in the same manner as in the experiments described above.
-
Figs. 15 to 17 show experimental results of combining the measures of all the hidden layers using Gaussian Kernel Density estimation. More specifically,Fig. 15 shows probabilities of the different data sets under the probability distributions estimated using Gaussian Kernel Densities with different bandwidths merging Mahalanobis distances from all inception outputs from the ImageNet experiment.Fig. 16 shows Probabilities of the different data sets under the probability distributions estimated using Gaussian Kernel Densities with different bandwidths merging residual sum of squares from all inception outputs from the ImageNet experiment. Further,Fig. 17 shows evaluation of the outlier detection performance for weak (Horse) and strong (Cars) outliers from the ImageNet dataset. The ROC-curves are calculated distinguishing the test set to the outlier sets using either residual sum of squares or Mahalanobis distances from inception outputs merged using Kernel Density, or prediction entropy when using MC-dropout. - From
Figs. 15 to 17 , it can be seen that both strong and weak outliers are successfully detected. The results using residual sum-of-squares are comparable to using the dropout-based approach. - In further examples, when integrating several embeddings (e.g., activations from several layers) a bagging approach (see e.g., A. Lazarevic and V. Kumar, "Feature Bagging for Outlier Detection," in Proceedings of the Eleventh ACM SIGKDD International Conference on Knowledge Discovery in Data Mining, New York, NY, USA, 2005, pp. 157-166) may be used instead of direct kernel density.
- Further, it may be possible to use other methodologies on learned representations, GMM one-class SMV, clustering, etc.
- Further, in various embodiments and examples described herein, instead of using simple measure such as Mahalanobis distance, a more localized measures such as Local Outlier Factor (see e.g., M. M. Breunig, H.-P. Kriegel, R. T. Ng, and J. Sander, "LOF: Identifying Density-based Local Outliers," in Proceedings of the 2000 ACM SIGMOD International Conference on Management of Data, New York, NY, USA, 2000, pp. 93-104) may be applied directly in PCA space.
- The methods and systems as described herein may be applied to phase microscopy image analysis. The task of identifying nuclei from phase contrast images is challenging and typically relies on fluorescent markers binding to nuclei to provide an extra image channel highlighting locations of nuclei. By applying deep CNN:s, a model may be generated and trained that segments background from cells as well as identifies nuclei of cells from phase contrast images without using fluorescence labels. If the CNN is trained on phase contrast images from multiple cell types, the CNN may also identify new previously unseen cell types. In order to determine when unseen cell types are too different from the cell types used for CNN training, prediction time outlier detection may be applied. If phase microscopy images from new cell types are detected as outliers, the user may receive a warning that the CNN:s separation of cell and background as well as detection of nuclei are unreliable. In this case, the CNN system provided may send a signal that the CNN model needs to be re-trained in order to reliably separate cells from background and identify nuclei from phase contrast images for the new cell type.
-
Fig. 18 shows an exemplary hardware configuration of a computer that may be used to implement at least a part of thecomputing system 1 as described above. Thecomputer 7 shown inFig. 16 includes a central processing unit (CPU) 70, a graphics processing unit (GPU) 88, asystem memory 72, anetwork interface 74, a hard disk drive (HDD)interface 76, an externaldisk drive interface 78 and input/output (I/O) interfaces 80. These components of the computer are coupled to each other via asystem bus 82. TheCPU 70 may perform arithmetic, logic and/or control operations by accessing thesystem memory 72. TheGPU 88 may perform processing concerning graphic images and/or matrix operations required for deep learning. TheGPU 88 may comprise a plurality of processors (e.g. cores) that can perform parallel processing, which may lead to higher performance of thecomputing system 1. TheCPU 70 and/orGPU 88 may implement the processors of the exemplary devices and/or system described above. In some examples, however, thecomputer 7 does not necessarily comprise theGPU 88. Thesystem memory 72 may store information and/or instructions for use in combination with theCPU 70. Thesystem memory 72 may include volatile and non-volatile memory, such as a random access memory (RAM) 720 and a read only memory (ROM) 722. A basic input/output system (BIOS) containing the basic routines that helps to transfer information between elements within thecomputer 7, such as during start-up, may be stored in theROM 722. Thesystem bus 82 may be any of several types of bus structures including a memory bus or memory controller, a peripheral bus, and a local bus using any of a variety of bus architectures. TheCPU 70 may be further connected to one or more sensors (not shown) via one or more corresponding interfaces (not shown) and thebus 82. The sensors may measure physical conditions or states including but not limited to: temperature, pH, pressure, etc. Additionally, the sensors may include other types of measuring or detecting devices including but not limited to imaging devices, microphones, spectral sensors, etc. Controllers may control a physical condition or state including but not limited to: temperature, flux, stirring, etc. - The computer may include a
network interface 74 for communicating with other computers and/or devices via a network. - Further, the computer may include a hard disk drive (HDD) 84 for reading from and writing to a hard disk (not shown), and an
external disk drive 86 for reading from or writing to a removable disk (not shown). The removable disk may be a magnetic disk for a magnetic disk drive or an optical disk such as a CD ROM for an optical disk drive. TheHDD 84 and theexternal disk drive 86 are connected to thesystem bus 82 by aHDD interface 76 and an externaldisk drive interface 78, respectively. The drives and their associated computer-readable media provide non-volatile storage of computer-readable instructions, data structures, program modules and other data for the general purpose computer. The data structures may include relevant data for the implementation of the exemplary method and its variations as described herein. The relevant data may be organized in a database, for example a relational or object database. - Although the exemplary environment described herein employs a hard disk (not shown) and an external disk (not shown), it should be appreciated by those skilled in the art that other types of computer readable media which can store data that is accessible by a computer, such as magnetic cassettes, flash memory cards, digital video disks, random access memories, read only memories, and the like, may also be used in the exemplary operating environment.
- A number of program modules may be stored on the hard disk, external disk,
ROM 722 orRAM 720, including an operating system (not shown), one ormore application programs 7202, other program modules (not shown), andprogram data 7204. The application programs may include at least a part of the functionality as described above. - The
computer 7 may be connected to aninput device 92 such as mouse and/or keyboard and adisplay device 94 such as liquid crystal display, via corresponding I/O interfaces system bus 82. In case thecomputer 7 is implemented as a tablet computer, for example, a touch panel that displays information and that receives input may be connected to thecomputer 7 via a corresponding I/O interface and thesystem bus 82. Further, in some examples, although not shown inFig. 18 , thecomputer 7 may further be connected to a printer and/or an imaging device such as a camera, via corresponding I/O interfaces and thesystem bus 82. - In addition or as an alternative to an implementation using a
computer 7 as shown inFig. 18 , a part or all of the functionality of the exemplary embodiments described herein may be implemented as one or more hardware circuits. Examples of such hardware circuits may include but are not limited to: Large Scale Integration (LSI), Reduced Instruction Set Circuits (RISC), Application Specific Integrated Circuit (ASIC) and Field Programmable Gate Array (FPGA). -
- ASIC
- Application Specific Integrated Circuit
- BIOS
- basic input/output system
- CD ROM
- Compact Disc Read-Only Memory
- CNN
- convolutional neural network
- CPU
- central processing unit
- DNN
- deep neural network
- GPU
- graphics processing unit
- FPGA
- Field Programmable Gate Array
- HDD
- hard disk drive
- HTTP
- hypertext transfer protocol
- I/O
- input/output
- KBE LSI
- Large Scale Integration
- MC-dropout
- Monte Carlo dropout
- MNIST
- Modified National Institute of Standards and Technology
- PCA
- Principal Component Analysis
- RAM
- random access memory
- ReLu
- rectified linear unit
- RISC
- Reduced Instruction Set Circuits
- ROC-AUC
- Receiver-Operating-Characteristic Area-Under-Curve
- ROM
- read only memory
- SSH
- Secure Shell
- The following items provide aspects of the present disclosure.
-
Item 1. A computer-implemented method for data analysis, comprising:- obtaining a deep neural network (100) for processing data and at least a part of a training dataset used for training the deep neural network, the deep neural network comprising a plurality of hidden layers, the training dataset including possible observations that can be input to the deep neural network;
- obtaining first sets of intermediate output values that are output from at least one of the plurality of hidden layers, each of the first sets of intermediate output values obtained by inputting a different one of the possible observations included in said at least the part of the training dataset;
- constructing a latent variable model using the first sets of intermediate output values, the latent variable model providing a mapping of the first sets of intermediate output values to first sets of projected values in a sub-space that has a dimension lower than a dimension of the sets of the intermediate outputs;
- receiving an observation to be input to the deep neural network;
- obtaining a second set of intermediate output values that are output from said at least one of the plurality of hidden layers by inputting the received observation to the deep neural network;
- mapping, using the latent variable model, the second set of intermediate output values to a second set of projected values; and
- determining whether or not the received observation is an outlier with respect to the training dataset based on the latent variable model and the second set of projected values.
-
Item 2. The method according toitem 1, wherein the latent variable model is constructed according to principal component analysis. -
Item 3. The method according toitem - calculating a Mahalanobis distance of the second set of projected values with respect to a distribution of the first sets of projected values; and
- determining that the received observation is an outlier with respect to the training dataset if the calculated Mahalanobis distance is larger than a threshold value for the Mahalanobis distance.
-
Item 4. The method according toitem 3, wherein the threshold value for the Mahalanobis distance is determined based on Mahalanobis distances, each of which being calculated for a different one of the first sets of projected values with respect to the distribution of the first sets of projected values. -
Item 5. The method according to any one ofitems 1 to 4, wherein said step of determining whether or not the received observation is an outlier comprises:- determining an approximate set of intermediate output values corresponding to the second set of intermediate output values, using the latent variable model and the second set of projected values;
- calculating a squared approximation residual for the second set of intermediate output values and the approximate set of intermediate output values; and
- determining that the received observation is an outlier with respect to the training dataset if the calculated squared approximation residual is larger than a threshold value for the squared approximation residual.
-
Item 6. The method according toitem 5, wherein the threshold value for the squared approximation residual is determined based on squared approximation residuals, each of which is calculated for a different one of the first sets of intermediate output values and an approximate set of intermediate output values corresponding to said one of the first sets of intermediate output values. -
Item 7. The method according to any one ofitems 1 to 6, wherein the steps of obtaining the first sets of intermediate output values and constructing the latent variable model are performed for two or more of the plurality of hidden layers;- wherein the steps of obtaining the second set of intermediate output values and mapping the second set of intermediate output values to the second set of projected values are performed concerning said two or more of the plurality of hidden layers; and
- wherein, the step of determining whether or not the received observation is an outlier is performed based on the latent variable model and the second sets of projected values obtained concerning said two or more of the plurality of hidden layers.
-
Item 8. A computer-implemented method comprising:- obtaining a deep neural network (100) for processing data and at least a part of a training dataset used for training the deep neural network, the deep neural network comprising a plurality of hidden layers, the training dataset including possible observations that can be input to the deep neural network;
- obtaining first sets of intermediate output values that are output from at least one of the plurality of hidden layers, each of the first sets of intermediate output values obtained by inputting a different one of the possible observations included in said at least the part of the training dataset;
- constructing a latent variable model using the first sets of intermediate output values, the latent variable model providing a mapping of the first sets of intermediate output values to first sets of projected values in a sub-space that has a dimension lower than a dimension of the sets of the intermediate outputs; and
- storing the latent variable model and the first sets of projected values in a storage medium.
-
Item 9. A computer-implemented method comprising:- receiving an observation to be input to a deep neural network (100) for processing data, the deep neural network having a plurality of hidden layers and trained using a training data set that includes possible observations that can be input to the deep neural network;
- obtaining a second set of intermediate output values that are output from at least one of the plurality of hidden layers by inputting the received observation to the deep neural network;
- mapping, using a latent variable model stored in a storage medium, the second set of intermediate output values to a second set of projected values; and
- determining whether or not the received observation is an outlier with respect to the training dataset based on the latent variable model and the second set of projected values,
- wherein the latent variable model stored in the storage medium is constructed by:
- obtaining first sets of intermediate output values that are output from said one of the plurality of hidden layers, each of the first sets of intermediate output values obtained by inputting a different one of the possible observations included in said at least the part of the training dataset; and
- constructing the latent variable model using the first sets of intermediate output values, the latent variable model providing a mapping of the first sets of intermediate output values to first sets of projected values in a sub-space that has a dimension lower than a dimension of the sets of the intermediate outputs.
-
Item 10. A computer program product comprising computer-readable instructions that, when loaded and run on a computer, cause the computer to perform the method according to any one ofitems 1 to 9. -
Item 11. A system for data analysis, the system comprising:- a storage medium (12) storing a training dataset used for training a deep neural network (100), the deep neural network comprising a plurality of hidden layers, the training dataset including possible observations that can be input to the deep neural network; and
- a processor configured to:
- obtain the deep neural network being trained using the training dataset;
- obtain at least a part of the training dataset stored in the storage medium;
- obtain first sets of intermediate output values that are output from at least one of the plurality of hidden layers, each of the first sets of intermediate output values obtained by inputting a different one of the possible observations included in said at least the part of the training dataset;
- construct a latent variable model using the first sets of intermediate output values, the latent variable model providing a mapping of the first sets of intermediate output values to first sets of projected values in a sub-space that has a dimension lower than a dimension of the sets of the intermediate outputs;
- receive an observation to be input to the deep neural network;
- obtain a second set of intermediate output values that are output from said at least one of the plurality of hidden layers by inputting the received observation to the deep neural network;
- map, using the latent variable model, the second set of intermediate output values to a second set of projected values; and
- determine whether or not the received observation is an outlier with respect to the training dataset based on the latent variable model and the second set of projected values.
-
Item 12. The system according toitem 11, wherein the latent variable model is constructed according to principal component analysis. -
Item 13. The system according toitem - calculate a Mahalanobis distance of the second set of projected values with respect to a distribution of the first sets of projected values; and
- determine that the received observation is an outlier with respect to the training dataset if the calculated Mahalanobis distance is larger than a threshold value for the Mahalanobis distance.
-
Item 14. The system according to any one ofitems 11 to 13, wherein, for determining whether or not the received observation is an outlier, the processor is further configured to:- determine an approximate set of intermediate output values corresponding to the second set of intermediate output values, using the latent variable model and the second set of projected values;
- calculate a squared approximation residual for the second set of intermediate output values and the approximate set of intermediate output values; and
- determine that the received observation is an outlier with respect to the training dataset if the calculated squared approximation residual is larger than a threshold value for the squared approximation residual.
-
Item 15. The system according to any one ofitems 11 to 14, wherein the processor is further configured to:- perform the steps of obtaining the first sets of intermediate output values and constructing the latent variable model for two or more of the plurality of hidden layers;
- perform the steps of obtaining the second set of intermediate output values and mapping the second set of intermediate output values to the second set of projected values concerning said two or more of the plurality of hidden layers; and
- perform the step of determining whether or not the received observation is an outlier based on the latent variable model and the second sets of projected values obtained concerning said two or more of the plurality of hidden layers.
Claims (15)
- A computer-implemented method for data analysis comprising:obtaining a deep neural network (100) for processing data and at least a part of a training dataset used for training the deep neural network, the deep neural network comprising a plurality of hidden layers, the training dataset including possible observations that can be input to the deep neural network, the deep neural network being trained using the training dataset;obtaining first sets of intermediate output values that are output from at least one of the plurality of hidden layers, each of the first sets of intermediate output values obtained by inputting a different one of the possible observations included in said at least the part of the training dataset;constructing a latent variable model using the first sets of intermediate output values, the latent variable model providing a mapping of the first sets of intermediate output values to first sets of latent variables for the latent variable model in a sub-space that has a dimension lower than a dimension of the sets of the intermediate outputs; andstoring the latent variable model and the first sets of latent variables for the latent variable model in a storage medium.
- A computer-implemented method for data analysis comprising:receiving a new observation to be input to a deep neural network (100) for processing data, the deep neural network having a plurality of hidden layers and trained using a training data set that includes possible observations that can be input to the deep neural network;obtaining a second set of intermediate output values that are output from at least one of the plurality of hidden layers by inputting the received new observation to the deep neural network;mapping, using a latent variable model stored in a storage medium, the second set of intermediate output values to a second set of latent variables for the latent variable model; anddetermining whether or not the received new observation is an outlier with respect to the training dataset based on the latent variable model and the second set of latent variables for the latent variable model,wherein the latent variable model stored in the storage medium is constructed by:obtaining first sets of intermediate output values that are output from said one of the plurality of hidden layers, each of the first sets of intermediate output values obtained by inputting a different one of the possible observations included in said at least the part of the training dataset; andconstructing the latent variable model using the first sets of intermediate output values, the latent variable model providing a mapping of the first sets of intermediate output values to first sets of latent variables for the latent variable model in a sub-space that has a dimension lower than a dimension of the sets of the intermediate outputs.
- The method according to claim 1, further comprising:receiving a new observation to be input to the deep neural network;obtaining a second set of intermediate output values that are output from said at least one of the plurality of hidden layers by inputting the received new observation to the deep neural network;mapping, using the latent variable model, the second set of intermediate output values to a second set of latent variables for the latent variable model; anddetermining whether or not the received new observation is an outlier with respect to the training dataset based on the latent variable model and the second set of latent variables for the latent variable model.
- The method according to claim 2 or 3, wherein said step of determining whether or not the received new observation is an outlier comprises:calculating a distance of the second set of latent variables for the latent variable model with respect to a distribution of the first sets of latent variables for the latent variable model; anddetermining that the received new observation is an outlier with respect to the training dataset if the calculated distance is larger than a threshold value for the distance.
- The method according to claim 4, wherein the threshold value for the distance is determined based on distances, each of which being calculated for a different one of the first sets of latent variables for the latent variable model with respect to the distribution of the first sets of latent variables for the latent variable model.
- The method according to claim 4 or 5, wherein the distance is residual sum of squares, Mahalanobis distance or Local Outlier Factor.
- The method according to any one of claims 2 to 5, wherein said step of determining whether or not the received new observation is an outlier comprises:determining an approximate set of intermediate output values corresponding to the second set of intermediate output values, using the latent variable model and the second set of latent variables for the latent variable model;calculating a squared approximation residual for the second set of intermediate output values and the approximate set of intermediate output values; anddetermining that the received new observation is an outlier with respect to the training dataset if the calculated squared approximation residual is larger than a threshold value for the squared approximation residual.
- The method according to claim 7, wherein the threshold value for the squared approximation residual is determined based on squared approximation residuals, each of which is calculated for a different one of the first sets of intermediate output values and an approximate set of intermediate output values corresponding to said one of the first sets of intermediate output values.
- The method according to any one of claims 2 to 8, wherein the steps of obtaining the first sets of intermediate output values and constructing the latent variable model are performed for two or more of the plurality of hidden layers;wherein the steps of obtaining the second set of intermediate output values and mapping the second set of intermediate output values to the second set of latent variables for the latent variable model are performed concerning said two or more of the plurality of hidden layers; andwherein, the step of determining whether or not the received new observation is an outlier is performed based on the latent variable model and the second sets of latent variables for the latent variable model obtained concerning said two or more of the plurality of hidden layers.
- The method according to any one of claims 2 to 9, further comprising:controlling a device for performing a biopharmaceutical manufacturing process using the predictions and the results of the outlier determination,wherein the possible observations included in said at least the part of the training dataset and the received new observation comprise data from one or more of the following data sources:text,images,chromatograms,spectroscopic data,chemical analysis.
- The method according to claim 10, wherein, in case the received new observation is determined to be an outlier, the received new observation is not used as input to the biopharmaceutical manufacturing process.
- The method according to claim 10, wherein, the controlling of the device for performing the biopharmaceutical manufacturing process is performed using deep reinforcement learning,wherein the possible observations included in said at least the part of the training dataset and the received new observation are states in the deep reinforcement learning, andwherein the method further comprises:
in case the received new observation is determined to be an outlier,sending a notification to a user; and/orperforming safety routines. - The method according to any one of claims 1 to 12, wherein the latent variable model is constructed according to principal component analysis.
- A computer program product comprising computer-readable instructions that, when loaded and run on a computer, cause the computer to perform the method according to any one of claims 1 to 13.
- A system for data analysis, the system comprising:a storage medium (12) storing a training dataset used for training a deep neural network (100), the deep neural network comprising a plurality of hidden layers, the training dataset including possible observations that can be input to the deep neural network; anda processor configured to perform the method according to any one of claims 1 to 13.
Priority Applications (1)
| Application Number | Priority Date | Filing Date | Title |
|---|---|---|---|
| EP23204765.4A EP4290412A3 (en) | 2018-09-05 | 2018-09-05 | Computer-implemented method, computer program product and system for data analysis |
Applications Claiming Priority (2)
| Application Number | Priority Date | Filing Date | Title |
|---|---|---|---|
| EP23204765.4A EP4290412A3 (en) | 2018-09-05 | 2018-09-05 | Computer-implemented method, computer program product and system for data analysis |
| EP18192649.4A EP3620983B1 (en) | 2018-09-05 | 2018-09-05 | Computer-implemented method, computer program product and system for data analysis |
Related Parent Applications (1)
| Application Number | Title | Priority Date | Filing Date |
|---|---|---|---|
| EP18192649.4A Division EP3620983B1 (en) | 2018-09-05 | 2018-09-05 | Computer-implemented method, computer program product and system for data analysis |
Publications (2)
| Publication Number | Publication Date |
|---|---|
| EP4290412A2 true EP4290412A2 (en) | 2023-12-13 |
| EP4290412A3 EP4290412A3 (en) | 2024-01-03 |
Family
ID=63517723
Family Applications (4)
| Application Number | Title | Priority Date | Filing Date |
|---|---|---|---|
| EP23204765.4A Pending EP4290412A3 (en) | 2018-09-05 | 2018-09-05 | Computer-implemented method, computer program product and system for data analysis |
| EP18192649.4A Active EP3620983B1 (en) | 2018-09-05 | 2018-09-05 | Computer-implemented method, computer program product and system for data analysis |
| EP19180972.2A Pending EP3620986A1 (en) | 2018-09-05 | 2019-06-18 | Computer-implemented method, computer program product and system for analysis of cell images |
| EP19762167.5A Pending EP3847586A1 (en) | 2018-09-05 | 2019-09-05 | Computer-implemented method, computer program product and system for anomaly detection and/or predictive maintenance |
Family Applications After (3)
| Application Number | Title | Priority Date | Filing Date |
|---|---|---|---|
| EP18192649.4A Active EP3620983B1 (en) | 2018-09-05 | 2018-09-05 | Computer-implemented method, computer program product and system for data analysis |
| EP19180972.2A Pending EP3620986A1 (en) | 2018-09-05 | 2019-06-18 | Computer-implemented method, computer program product and system for analysis of cell images |
| EP19762167.5A Pending EP3847586A1 (en) | 2018-09-05 | 2019-09-05 | Computer-implemented method, computer program product and system for anomaly detection and/or predictive maintenance |
Country Status (5)
| Country | Link |
|---|---|
| US (2) | US20210350113A1 (en) |
| EP (4) | EP4290412A3 (en) |
| JP (2) | JP7223839B2 (en) |
| CN (3) | CN112655004B (en) |
| WO (3) | WO2020049094A1 (en) |
Families Citing this family (92)
| Publication number | Priority date | Publication date | Assignee | Title |
|---|---|---|---|---|
| US11132529B2 (en) * | 2016-11-16 | 2021-09-28 | Ventana Medical Systems, Inc. | Convolutional neural networks for locating objects of interest in images of biological samples |
| US10923141B2 (en) | 2018-08-06 | 2021-02-16 | Spotify Ab | Singing voice separation with deep u-net convolutional networks |
| US10977555B2 (en) * | 2018-08-06 | 2021-04-13 | Spotify Ab | Automatic isolation of multiple instruments from musical mixtures |
| EP4290412A3 (en) * | 2018-09-05 | 2024-01-03 | Sartorius Stedim Data Analytics AB | Computer-implemented method, computer program product and system for data analysis |
| EP3628564A1 (en) * | 2018-09-26 | 2020-04-01 | Siemens Mobility GmbH | Method for analysing conditions of technical components |
| KR102608470B1 (en) * | 2018-10-23 | 2023-12-01 | 삼성전자주식회사 | Data recognition device and method and training device and method |
| CN112912854A (en) * | 2018-11-07 | 2021-06-04 | 惠普发展公司,有限责任合伙企业 | Receiving thermal data and generating system thermal levels |
| US10885631B2 (en) | 2019-02-01 | 2021-01-05 | Essen Instruments, Inc. | Label-free cell segmentation using phase contrast and brightfield imaging |
| US11682069B2 (en) * | 2019-08-05 | 2023-06-20 | Intuit, Inc. | Extending finite rank deep kernel learning to forecasting over long time horizons |
| US20220253052A1 (en) * | 2019-08-23 | 2022-08-11 | Landmark Graphics Corporation | Anomaly Detection using Hybrid Autoencoder and Gaussian Process Regression |
| US11409995B2 (en) * | 2019-08-28 | 2022-08-09 | Nxp B.V. | Anomaly detection by classifying past behavior |
| US20210141355A1 (en) * | 2019-11-07 | 2021-05-13 | Global Energy Interconnection Research Institute Co. Ltd | Systems and methods of autonomous line flow control in electric power systems |
| US20210182386A1 (en) * | 2019-12-11 | 2021-06-17 | Samsung Electronics Co., Ltd. | Electronic apparatus that monitors a safety function and a controlling method thereof |
| JP7433876B2 (en) * | 2019-12-12 | 2024-02-20 | 株式会社メガチップス | Self-organizing map learning device, method and program, and state determination device |
| US11423365B2 (en) * | 2020-02-17 | 2022-08-23 | Mo Tecnologias, Llc | Transaction card system having overdraft capability |
| WO2021171090A1 (en) * | 2020-02-28 | 2021-09-02 | Darktrace, Inc. | An artificial intelligence adversary red team |
| US11494496B2 (en) * | 2020-03-30 | 2022-11-08 | International Business Machines Corporation | Measuring overfitting of machine learning computer model and susceptibility to security threats |
| EP4173292A4 (en) * | 2020-06-25 | 2024-03-27 | Ericsson Telefon Ab L M | Method and system for image compressing and coding with deep learning |
| CN111814653B (en) * | 2020-07-02 | 2024-04-05 | 苏州交驰人工智能研究院有限公司 | Method, device, equipment and storage medium for detecting abnormal behavior in video |
| US11475332B2 (en) * | 2020-07-12 | 2022-10-18 | International Business Machines Corporation | Selecting forecasting models by machine learning based on analysis of model robustness |
| CN111970489B (en) * | 2020-08-05 | 2022-05-24 | 北京必可测科技股份有限公司 | Intelligent monitoring management method and system based on man-machine two-way |
| CN112001482A (en) * | 2020-08-14 | 2020-11-27 | 佳都新太科技股份有限公司 | Vibration prediction and model training method and device, computer equipment and storage medium |
| EP3957712A1 (en) | 2020-08-21 | 2022-02-23 | Sartorius Stedim Data Analytics AB | Automated foam detection |
| JP7318612B2 (en) * | 2020-08-27 | 2023-08-01 | 横河電機株式会社 | MONITORING DEVICE, MONITORING METHOD, AND MONITORING PROGRAM |
| SG10202008469RA (en) * | 2020-09-01 | 2020-10-29 | Ensign Infosecurity Pte Ltd | A deep embedded self-taught learning system and method for detecting suspicious network behaviours |
| US11360155B2 (en) * | 2020-09-03 | 2022-06-14 | Volkswagen Aktiengesellschaft | Battery state of health estimator |
| IL277424B1 (en) * | 2020-09-16 | 2024-03-01 | Israel Aerospace Ind Ltd | Event prediction based on machine learning and engineering analysis tools |
| CN112541558A (en) * | 2020-09-18 | 2021-03-23 | 江苏师范大学 | Bayesian semi-supervised robust PPLS soft measurement method based on incomplete data |
| CN112149912A (en) * | 2020-09-30 | 2020-12-29 | 中煤能源研究院有限责任公司 | Coal mine working face mine pressure data prediction method based on reverse propagation neural network |
| US20220101068A1 (en) * | 2020-09-30 | 2022-03-31 | International Business Machines Corporation | Outlier detection in a deep neural network using t-way feature combinations |
| US20220108097A1 (en) * | 2020-10-05 | 2022-04-07 | Rakuten, Inc. | Dual encoder attention u-net |
| US20220121691A1 (en) * | 2020-10-20 | 2022-04-21 | Here Global B.V. | Method, apparatus, and system for machine learning-based persistence filtering |
| CN112348839B (en) * | 2020-10-27 | 2024-03-15 | 重庆大学 | Image segmentation method and system based on deep learning |
| CN112015749B (en) * | 2020-10-27 | 2021-02-19 | 支付宝(杭州)信息技术有限公司 | Method, device and system for updating business model based on privacy protection |
| CN112953924B (en) * | 2021-02-04 | 2022-10-21 | 西安电子科技大学 | Network abnormal flow detection method, system, storage medium, terminal and application |
| CN113256507B (en) * | 2021-04-01 | 2023-11-21 | 南京信息工程大学 | Attention enhancement method for generating image aiming at binary flow data |
| CN112967816B (en) * | 2021-04-26 | 2023-08-15 | 四川大学华西医院 | Acute pancreatitis organ failure prediction method, computer equipment and system |
| CN113255209B (en) * | 2021-04-27 | 2022-06-07 | 燕山大学 | Method for predicting residual life of bearing of gearbox |
| US11893085B2 (en) | 2021-05-04 | 2024-02-06 | Ford Global Technologies, Llc | Anomaly detection for deep neural networks |
| CN112987675B (en) * | 2021-05-06 | 2021-07-23 | 北京瑞莱智慧科技有限公司 | Method, device, computer equipment and medium for anomaly detection |
| CN113159225B (en) * | 2021-05-17 | 2022-04-19 | 中国石油大学(华东) | Multivariable industrial process fault classification method |
| WO2022248935A1 (en) * | 2021-05-27 | 2022-12-01 | Lynceus Sas | Machine learning-based quality control of a culture for bioproduction |
| EP4347784A1 (en) * | 2021-05-27 | 2024-04-10 | Lynceus SAS | Machine learning-based quality control of a culture for bioproduction |
| CN113297677B (en) * | 2021-06-15 | 2023-09-22 | 中国航发沈阳发动机研究所 | Aircraft engine air system probability analysis method based on Kriging model |
| CN113762333B (en) * | 2021-07-20 | 2023-02-28 | 广东省科学院智能制造研究所 | Unsupervised anomaly detection method and system based on double-flow joint density estimation |
| CN114740159B (en) * | 2022-04-14 | 2023-09-19 | 成都秦川物联网科技股份有限公司 | Natural gas energy metering component acquisition method and Internet of things system |
| CN113596012A (en) * | 2021-07-26 | 2021-11-02 | 工银科技有限公司 | Method, device, equipment, medium and program product for identifying attack behavior |
| US11979697B2 (en) | 2021-07-26 | 2024-05-07 | Chengdu Qinchuan Iot Technology Co., Ltd. | Methods and internet of things systems for obtaining natural gas energy metering component |
| US11630428B2 (en) * | 2021-08-06 | 2023-04-18 | Trimble Inc. | Real-time analysis of vibration samples for operating environment classification and anomaly detection |
| CN113689040B (en) * | 2021-08-25 | 2024-03-15 | 长江存储科技有限责任公司 | Control method and control system for measurement model and computer readable medium |
| CN113836673A (en) * | 2021-09-06 | 2021-12-24 | 西安理工大学 | Drainage pipe network monitoring point arrangement method based on information entropy |
| CN113510234B (en) * | 2021-09-14 | 2022-01-07 | 深圳市信润富联数字科技有限公司 | Quality monitoring method and device for low-pressure casting of hub and electronic equipment |
| US20230086049A1 (en) * | 2021-09-21 | 2023-03-23 | Abb Schweiz Ag | Systems and methods of predicting the remaining useful life of industrial mechanical power transmission equipment using a machine learning model |
| US20230136726A1 (en) * | 2021-10-29 | 2023-05-04 | Peter A. Chew | Identifying Fringe Beliefs from Text |
| US20230133652A1 (en) * | 2021-10-29 | 2023-05-04 | GE Grid GmbH | Systems and methods for uncertainty prediction using machine learning |
| TWI809592B (en) * | 2021-12-08 | 2023-07-21 | 財團法人工業技術研究院 | Model prediction control system and method thereof |
| JP7188821B1 (en) | 2021-12-17 | 2022-12-13 | バイスリープロジェクツ株式会社 | inspection system |
| CN114237128A (en) * | 2021-12-21 | 2022-03-25 | 华能澜沧江水电股份有限公司 | Hydropower station equipment real-time monitoring data monitoring system and monitoring method based on trend alarm |
| EP4206838A1 (en) * | 2021-12-29 | 2023-07-05 | Petkim Petrokimya Holding A.S. | Forecasting and anomaly detection method for low density polyethylene autoclave reactor |
| CN114354534A (en) * | 2021-12-30 | 2022-04-15 | 中国航空油料有限责任公司 | Method for establishing aviation kerosene property prediction model by utilizing binary linear classifier |
| TWI829076B (en) * | 2022-01-22 | 2024-01-11 | 國立高雄科技大學 | Virtual and real correction and learning method of simulated pressure values assisted by machine learning |
| DE102022103844B3 (en) | 2022-02-17 | 2023-06-22 | Synsor.ai GmbH | Method for optimizing a production process based on visual information and device for carrying out the method |
| CN114925196A (en) * | 2022-03-01 | 2022-08-19 | 健康云(上海)数字科技有限公司 | Diabetes blood test abnormal value auxiliary removing method under multilayer perception network |
| JP7444186B2 (en) * | 2022-03-22 | 2024-03-06 | 横河電機株式会社 | Model verification device, model verification method, and model verification program |
| CN114726614B (en) * | 2022-04-06 | 2023-05-23 | 广东工业大学 | XSS attack detection method based on conditional variation self-encoder and SENet |
| CN114692694B (en) * | 2022-04-11 | 2024-02-13 | 合肥工业大学 | Equipment fault diagnosis method based on feature fusion and integrated clustering |
| CN114978586B (en) * | 2022-04-12 | 2023-07-04 | 东北电力大学 | Power grid attack detection method and system based on attack genes and electronic equipment |
| CN114818904B (en) * | 2022-04-21 | 2024-03-15 | 桂林电子科技大学 | Fan fault detection method and storage medium based on Stack-GANs model |
| DE102022205534A1 (en) * | 2022-05-31 | 2023-11-30 | Kuka Deutschland Gmbh | Monitoring a multi-axis machine using interpretable time series classification |
| CN115147203B (en) * | 2022-06-08 | 2024-03-15 | 阿尔法时刻科技(深圳)有限公司 | Financial risk analysis method based on big data |
| CN115051864B (en) * | 2022-06-21 | 2024-02-27 | 郑州轻工业大学 | PCA-MF-WNN-based network security situation element extraction method and system |
| US20240005132A1 (en) * | 2022-06-30 | 2024-01-04 | Maplebear Inc. (Dba Instacart) | Machine-learned neural network architectures for incremental lift predictions |
| CN115454781B (en) * | 2022-10-08 | 2023-05-16 | 杭银消费金融股份有限公司 | Data visualization display method and system based on enterprise architecture system |
| WO2024086143A1 (en) * | 2022-10-17 | 2024-04-25 | Proteinea Inc. | Native expansion of a sparse training dataset into a dense training dataset for supervised training of a synonymous variant sequence generator |
| CN116112193B (en) * | 2022-10-18 | 2023-07-28 | 贵州师范大学 | Lightweight vehicle-mounted network intrusion detection method based on deep learning |
| EP4362029A1 (en) | 2022-10-24 | 2024-05-01 | Sartorius Stedim Data Analytics AB | Modelling of biological and biochemical assays |
| CN115859202B (en) * | 2022-11-24 | 2023-10-10 | 浙江邦盛科技股份有限公司 | Abnormality detection method and device under non-stationary time sequence data stream scene |
| CN116187540B (en) * | 2023-01-03 | 2023-09-12 | 国网江西省电力有限公司电力科学研究院 | Wind power station ultra-short-term power prediction method based on space-time deviation correction |
| CN116089611B (en) * | 2023-01-13 | 2023-07-18 | 北京控制工程研究所 | Spacecraft fault diagnosis method and device based on performance-fault relation map |
| CN116048031B (en) * | 2023-03-31 | 2023-08-04 | 克拉玛依市蓝润环保科技有限责任公司 | Control system and method for petroleum auxiliary production |
| CN116258579B (en) * | 2023-04-28 | 2023-08-04 | 成都新希望金融信息有限公司 | Training method of user credit scoring model and user credit scoring method |
| CN116382223B (en) * | 2023-06-02 | 2023-08-01 | 山东鲁能控制工程有限公司 | Thermal power generating unit monitoring system based on DCS |
| CN117077062A (en) * | 2023-08-31 | 2023-11-17 | 木卫四(北京)科技有限公司 | Method and device for detecting abnormality of automobile instruction |
| CN116862908B (en) * | 2023-09-01 | 2023-11-24 | 菏泽学院 | Metal gear meshing defect detection method based on image processing |
| CN116908808B (en) * | 2023-09-13 | 2023-12-01 | 南京国睿防务系统有限公司 | RTN-based high-resolution one-dimensional image target recognition method |
| CN117151196B (en) * | 2023-10-26 | 2024-01-30 | 湘江实验室 | Layer-by-layer increment expected propagation-based interpretable fault diagnosis attribution method |
| CN117192063B (en) * | 2023-11-06 | 2024-03-15 | 山东大学 | Water quality prediction method and system based on coupled Kalman filtering data assimilation |
| CN117436024B (en) * | 2023-12-19 | 2024-03-08 | 湖南翰文云机电设备有限公司 | Fault diagnosis method and system based on drilling machine operation data analysis |
| CN117435511B (en) * | 2023-12-20 | 2024-03-19 | 厦门市唯云网络科技有限公司 | Flow monitoring software testing method and device based on graphic neural network and storage medium |
| CN117557256B (en) * | 2024-01-12 | 2024-03-22 | 西南交通大学 | High-speed railway track smoothness multitask coordination maintenance method |
| CN117579400B (en) * | 2024-01-17 | 2024-03-29 | 国网四川省电力公司电力科学研究院 | Industrial control system network safety monitoring method and system based on neural network |
| CN117786467B (en) * | 2024-02-28 | 2024-04-30 | 上海交通大学四川研究院 | Classification model construction method for aircraft landing risk prediction based on self-adaptive dotting |
Family Cites Families (50)
| Publication number | Priority date | Publication date | Assignee | Title |
|---|---|---|---|---|
| JPS55128591A (en) | 1979-03-29 | 1980-10-04 | Oouchi Shinko Kagaku Kogyo Kk | Manufacture of phosphorothiolate |
| FR2698704B1 (en) | 1992-11-30 | 1995-03-10 | Didier Heckmann | Method and device for predictive maintenance. |
| EP0633536A1 (en) | 1993-07-09 | 1995-01-11 | International Business Machines Corporation | Diagnosis method and system for predictive machine maintenance |
| US5539638A (en) | 1993-08-05 | 1996-07-23 | Pavilion Technologies, Inc. | Virtual emissions monitor for automobile |
| US5566092A (en) | 1993-12-30 | 1996-10-15 | Caterpillar Inc. | Machine fault diagnostics system and method |
| EP0846253A4 (en) * | 1995-08-07 | 2009-11-11 | Roche Diagnostics Operations | Biological fluid analysis using distance outlier detection |
| US6298308B1 (en) | 1999-05-20 | 2001-10-02 | Reid Asset Management Company | Diagnostic network with automated proactive local experts |
| US7457785B1 (en) | 2000-08-25 | 2008-11-25 | Battelle Memorial Institute | Method and apparatus to predict the remaining service life of an operating system |
| DE10161633A1 (en) | 2000-12-14 | 2002-08-08 | Siemens Corp Res Inc | Neural network-based method for virtual age estimation for predicting remaining lifetime of a device of a given type for predicting optimum maintenance intervals in preventative maintenance systems |
| US7958063B2 (en) | 2004-11-11 | 2011-06-07 | Trustees Of Columbia University In The City Of New York | Methods and systems for identifying and localizing objects based on features of the objects that are mapped to a vector |
| US7882394B2 (en) | 2005-07-11 | 2011-02-01 | Brooks Automation, Inc. | Intelligent condition-monitoring and fault diagnostic system for predictive maintenance |
| US8275642B2 (en) | 2007-01-19 | 2012-09-25 | International Business Machines Corporation | System to improve predictive maintenance and warranty cost/price estimation |
| US8676721B2 (en) | 2009-09-18 | 2014-03-18 | Apo Offshore, Inc. | Method, system and apparatus for intelligent management of oil and gas platform surface equipment |
| US8781982B1 (en) | 2011-09-23 | 2014-07-15 | Lockheed Martin Corporation | System and method for estimating remaining useful life |
| US11074495B2 (en) * | 2013-02-28 | 2021-07-27 | Z Advanced Computing, Inc. (Zac) | System and method for extremely efficient image and pattern recognition and artificial intelligence platform |
| US9785983B2 (en) * | 2012-06-13 | 2017-10-10 | Opera Solutions U.S.A., Llc | System and method for detecting billing errors using predictive modeling |
| JP2013257251A (en) * | 2012-06-14 | 2013-12-26 | Internatl Business Mach Corp <Ibm> | Anomaly detection method, program, and system |
| US9263036B1 (en) * | 2012-11-29 | 2016-02-16 | Google Inc. | System and method for speech recognition using deep recurrent neural networks |
| TWI648609B (en) * | 2013-06-07 | 2019-01-21 | 美商科學設計股份有限公司 | Program monitoring system and method |
| CA2870080C (en) | 2013-11-08 | 2017-12-19 | Accenture Global Services Limited | Network node failure predictive system |
| US10824958B2 (en) * | 2014-08-26 | 2020-11-03 | Google Llc | Localized learning from a global model |
| GB2532075A (en) * | 2014-11-10 | 2016-05-11 | Lego As | System and method for toy recognition and detection based on convolutional neural networks |
| US10229356B1 (en) * | 2014-12-23 | 2019-03-12 | Amazon Technologies, Inc. | Error tolerant neural network model compression |
| KR101677358B1 (en) | 2015-01-28 | 2016-11-18 | 주식회사 엑센솔루션 | System and method of failure prognostic as to die casting facilities using neural network algorithm |
| WO2016132468A1 (en) | 2015-02-18 | 2016-08-25 | 株式会社日立製作所 | Data evaluation method and device, and breakdown diagnosis method and device |
| CN104881684A (en) * | 2015-05-27 | 2015-09-02 | 天津大学 | Stereo image quality objective evaluate method |
| EP3314541A1 (en) * | 2015-06-26 | 2018-05-02 | Sentiance NV | Deriving movement behaviour from sensor data |
| US20170091615A1 (en) * | 2015-09-28 | 2017-03-30 | Siemens Aktiengesellschaft | System and method for predicting power plant operational parameters utilizing artificial neural network deep learning methodologies |
| US20160071004A1 (en) | 2015-10-23 | 2016-03-10 | Sarkhoon and Qeshm LLC | Method and system for predictive maintenance of control valves |
| WO2017094267A1 (en) * | 2015-12-01 | 2017-06-08 | 株式会社Preferred Networks | Abnormality detection system, abnormality detection method, abnormality detection program, and method for generating learned model |
| EP3179326B1 (en) | 2015-12-10 | 2024-04-10 | KNORR-BREMSE Systeme für Schienenfahrzeuge GmbH | Railway vehicle maintenance system with modular recurrent neural networks for performing time series prediction |
| US11507064B2 (en) | 2016-05-09 | 2022-11-22 | Strong Force Iot Portfolio 2016, Llc | Methods and systems for industrial internet of things data collection in downstream oil and gas environment |
| CN106168799B (en) | 2016-06-30 | 2019-05-03 | 常伟 | A method of batteries of electric automobile predictive maintenance is carried out based on big data machine learning |
| CN107655850A (en) * | 2016-07-25 | 2018-02-02 | 上海创和亿电子科技发展有限公司 | Non-linear modeling method and system based near infrared spectrum |
| US11042811B2 (en) * | 2016-10-05 | 2021-06-22 | D-Wave Systems Inc. | Discrete variational auto-encoder systems and methods for machine learning using adiabatic quantum computers |
| US11321609B2 (en) * | 2016-10-19 | 2022-05-03 | Samsung Electronics Co., Ltd | Method and apparatus for neural network quantization |
| US10303979B2 (en) | 2016-11-16 | 2019-05-28 | Phenomic Ai Inc. | System and method for classifying and segmenting microscopy images with deep multiple instance learning |
| KR101988956B1 (en) * | 2016-12-06 | 2019-06-12 | 한국과학기술원 | Structural Health Monitoring Method Using Adaptive Multivariate Statistical Process Monitoring Under Environmental Variability |
| US10140574B2 (en) * | 2016-12-31 | 2018-11-27 | Via Alliance Semiconductor Co., Ltd | Neural network unit with segmentable array width rotator and re-shapeable weight memory to match segment width to provide common weights to multiple rotator segments |
| US10997499B1 (en) * | 2017-05-12 | 2021-05-04 | Veritas Technologies Llc | Systems and methods for file system metadata analytics |
| CN109255440B (en) | 2017-07-11 | 2020-08-04 | 上海有孚网络股份有限公司 | Method for predictive maintenance of power production equipment based on Recurrent Neural Networks (RNN) |
| CN107844795B (en) * | 2017-11-18 | 2018-09-04 | 中国人民解放军陆军工程大学 | Convolutional neural networks feature extracting method based on principal component analysis |
| WO2019102043A1 (en) | 2017-11-27 | 2019-05-31 | Deciphex | Automated screening of histopathology tissue samples via analysis of a normal model |
| CN108445752B (en) * | 2018-03-02 | 2021-08-17 | 北京工业大学 | Random weight neural network integrated modeling method for self-adaptively selecting depth features |
| US10789703B2 (en) * | 2018-03-19 | 2020-09-29 | Kla-Tencor Corporation | Semi-supervised anomaly detection in scanning electron microscope images |
| CN108921303A (en) | 2018-05-29 | 2018-11-30 | 青岛鹏海软件有限公司 | The Fault diagnosis and forecast maintaining method of industrial motor |
| US20200074269A1 (en) * | 2018-09-05 | 2020-03-05 | Sartorius Stedim Data Analytics Ab | Computer-implemented method, computer program product and system for data analysis |
| EP4290412A3 (en) * | 2018-09-05 | 2024-01-03 | Sartorius Stedim Data Analytics AB | Computer-implemented method, computer program product and system for data analysis |
| EP4009870A4 (en) * | 2019-08-06 | 2024-01-24 | Neuroenhancement Lab Llc | System and method for communicating brain activity to an imaging device |
| EP3926420B1 (en) * | 2020-06-16 | 2023-11-01 | Robert Bosch GmbH | Making time-series predictions of a computer-controlled system |
-
2018
- 2018-09-05 EP EP23204765.4A patent/EP4290412A3/en active Pending
- 2018-09-05 EP EP18192649.4A patent/EP3620983B1/en active Active
-
2019
- 2019-06-18 EP EP19180972.2A patent/EP3620986A1/en active Pending
- 2019-09-05 US US17/273,712 patent/US20210350113A1/en active Pending
- 2019-09-05 EP EP19762167.5A patent/EP3847586A1/en active Pending
- 2019-09-05 JP JP2021512922A patent/JP7223839B2/en active Active
- 2019-09-05 WO PCT/EP2019/073688 patent/WO2020049094A1/en active Application Filing
- 2019-09-05 WO PCT/EP2019/073695 patent/WO2020049098A1/en active Application Filing
- 2019-09-05 JP JP2021512919A patent/JP7187681B2/en active Active
- 2019-09-05 WO PCT/EP2019/073670 patent/WO2020049087A1/en unknown
- 2019-09-05 CN CN201980058094.9A patent/CN112655004B/en active Active
- 2019-09-05 CN CN201980058085.XA patent/CN112655003A/en active Pending
- 2019-09-05 CN CN201980058056.3A patent/CN112639834A/en active Pending
- 2019-09-05 US US17/273,709 patent/US20210334656A1/en active Pending
Non-Patent Citations (35)
| Title |
|---|
| A. LAZAREVICV. KUMAR: "Feature Bagging for Outlier Detection", PROCEEDINGS OF THE ELEVENTH ACM SIGKDD INTERNATIONAL CONFERENCE ON KNOWLEDGE DISCOVERY IN DATA MINING, NEW YORK, NY, USA, 2005, pages 157 - 166, XP058100200, DOI: 10.1145/1081870.1081891 |
| ACHLIOPTAS, D.: "Database-friendly random projections: Johnson-Lindenstrauss with binary coins", JOURNAL OF COMPUTER AND SYSTEM SCIENCES, vol. 66, no. 4, 2003, pages 671 - 687, XP007911119, DOI: 10.1016/S0022-0000(03)00025-4 |
| B. LAKSHMINARAYANANA. PRITZELC. BLUNDELL: "Simple and scalable predictive uncertainty estimation using deep ensembles", ADVANCES IN NEURAL INFORMATION PROCESSING SYSTEMS, 2017, pages 6405 - 6416 |
| C. BLUNDELLJ. CORNEBISEK. KAVUKCUOGLUD. WIERSTRA: "Weight uncertainty in neural networks", ARXIV PREPR. ARXIV150505424, 2015 |
| C. SZEGEDYV. VANHOUCKES. LOFFEJ. SHLENSZ. WOJNA: "Rethinking the inception architecture for computer vision", PROCEEDINGS OF THE IEEE CONFERENCE ON COMPUTER VISION AND PATTERN RECOGNITION, 2016, pages 2818 - 2826 |
| DASGUPTA, S.: "Proceedings of the Sixteenth Conference on Uncertainty in Artificial Intelligence", June 2000, MORGAN KAUFMANN PUBLISHERS INC., article "Experiments with random projection", pages: 143 - 151 |
| E. ILG ET AL.: "Uncertainty Estimates for Optical Flow with Multi-Hypotheses Networks", ARXIV180207095 CS, February 2018 (2018-02-01) |
| E. SCHUBERTA. ZIMEKH. KRIEGEL: "Generalized Outlier Detection with Flexible Kernel Density Estimates", PROCEEDINGS OF THE 2014 SIAM INTERNATIONAL CONFERENCE ON DATA MINING, 2014, pages 542 - 550 |
| GERS, FELIX A.JURGEN SCHMIDHUBERFRED CUMMINS: "Learning to Forget: Continual Prediction with LSTM", NEURAL COMPUTATION, vol. 12, 1999, pages 2451 - 2471 |
| H. RITTERA. BOTEVD. BARBER, A SCALABLE LAPLACE APPROXIMATION FOR NEURAL NETWORKS, February 2018 (2018-02-01) |
| HOCHREITERSEPPJURGEN SCHMIDHUBER: "Long Short-Term Memory", NEURAL COMPUTATION, vol. 9, no. 8, 1997, pages 1735 - 1780 |
| I. OSBANDC. BLUNDELLA. PRITZELB. VAN ROY: "Deep exploration via bootstrapped DQN", ADVANCES IN NEURAL INFORMATION PROCESSING SYSTEMS, 2016, pages 4026 - 4034 |
| J. DENGW. DONGR. SOCHERL. J. LIK. LIL. FEI-FEI: "ImageNet: A large-scale hierarchical image database", 2009 IEEE CONFERENCE ON COMPUTER VISION AND PATTERN RECOGNITION, 2009, pages 248 - 255 |
| JENATTON, R.OBOZINSKI, G.BACH, F.: "Structured sparse principal component analysis", PROCEEDINGS OF THE THIRTEENTH INTERNATIONAL CONFERENCE ON ARTIFICIAL INTELLIGENCE AND STATISTICS, March 2010 (2010-03-01), pages 366 - 373 |
| KINGMA, D. P.WELLING, M.: "Auto-encoding variational bayes", ARXIV PREPRINT ARXIV: 1312.6114, 2013 |
| KINGMA, DIEDERIK P.JIMMY BA: "Adam: A Method for Stochastic Optimization", ARXIV:1412.6980 [CS, 22 December 2014 (2014-12-22), Retrieved from the Internet <URL:http://arxiv.orq/absZ1412.6980> |
| KOHONEN, T.: "The self-organizing map", NEUROCOMPUTING, vol. 21, no. 1-3, 1998, pages 1 - 6 |
| L. J. LATECKIA. LAZAREVICD. POKRAJAC: "Outlier Detection with Kernel Density Functions", MACHINE LEARNING AND DATA MINING IN PATTERN RECOGNITION, 2007, pages 61 - 75 |
| LI, P.HASTIE, T. J.CHURCH, K. W.: "Very sparse random projections", PROCEEDINGS OF THE 12TH ACM SIGKDD INTERNATIONAL CONFERENCE ON KNOWLEDGE DISCOVERY AND DATA MINING, August 2006 (2006-08-01), pages 287 - 296, XP055033759, DOI: 10.1145/1150402.1150436 |
| LI, Y.WEN, Y.GUAN, K.TAO, D.: "Transforming Cooling Optimization for Green Data Center via Deep Reinforcement Learning", ARXIV PREPRINT ARXIV:1709.05077, 2017 |
| M. LINQ. CHENS. YAN: "Network In Network", ARXIV13124400 CS, December 2013 (2013-12-01) |
| M. M. BREUNIGH.-P. KRIEGELR. T. NGJ. SANDER: "LOF: Identifying Density-based Local Outliers", PROCEEDINGS OF THE 2000 ACM SIGMOD INTERNATIONAL CONFERENCE ON MANAGEMENT OF DATA, NEW YORK, NY, USA, 2000, pages 93 - 104 |
| M. TEYEH. AZIZPOURK. SMITH: "Bayesian Uncertainty Estimation for Batch Normalized Deep Networks", ARXIV180206455 STAT, February 2018 (2018-02-01) |
| MAKHZANI, A.FREY, B.: "K-sparse autoencoders", ARXIV PREPRINT ARXIV: 1312.5663, 2013 |
| NGUYEN, P.TAKASHI, E: "Automating Water Purification Plant Operations Using Deep Deterministic Policy Gradient", PROCEEDINGS OF WORKSHOP (PUBLISHED AT ICML WORKSHOP FOR DEEP LEARNING FOR SAFETY-CRITICAL IN ENGINEERING SYSTEMS, 2018 |
| P. GELADIB. R. KOWALSKI: "Partial least-squares regression: a tutorial", ANAL. CHIM. ACTA, vol. 185, January 1986 (1986-01-01), pages 1 - 17, XP000578888, DOI: 10.1016/0003-2670(86)80028-9 |
| P. J. ROUSSEEUW: "Least Median of Squares Regression", J. AM. STAT. ASSOC., vol. 79, no. 388, December 1984 (1984-12-01), pages 871 - 880, XP008024952 |
| P. J. ROUSSEEUW: "Multivariate estimation with high breakdown point", MATH. STAT. APPL., vol. 8, 1985, pages 283 - 297 |
| RASULR. VOLLGRAF: "Fashion-MNIST: a Novel Image Dataset for Benchmarking Machine Learning Algorithms", ARXIV170807747 CS STAT, 21 June 2018 (2018-06-21), Retrieved from the Internet <URL:https://arxiv.org/abs/1708.07747> |
| S. WOLDK. ESBENSENP. GELADI: "Principal component analysis", CHEMOM. INTELL. LAB. SYST., vol. 2, no. 1, August 1987 (1987-08-01), pages 37 - 52 |
| S. WOLDM. SJOSTROML. ERIKSSON: "PLS-regression: a basic tool of chemometrics", CHEMOM. INTELL. LAB. SYST., vol. 58, no. 2, October 2001 (2001-10-01), pages 109 - 130, XP004320297, DOI: 10.1016/S0169-7439(01)00155-1 |
| SAXENA, A.GOEBEL, K.SIMON, D.EKLUND, N.: "Prognostics and Health Management, 2008, PHM 2008, International Conference", October 2008, IEEE, article "Damage propagation modeling for aircraft engine run-to-failure simulation", pages: 1 - 9 |
| T. TIELEMANG. HINTON: "Lecture 6.5-rmsprop: Divide the gradient by a running average of its recent magnitude", COURSERA NEURAL NETW. MACH. LEARN., vol. 4, no. 2, 2012, pages 26 - 31 |
| Y. GALZ.GHARAMANI: "Dropout as a Bayesian approximation: Representing model uncertainty in deep learning", INTERNATIONAL CONFERENCE ON MACHINE LEARNING, 2016, pages 1050 - 1059 |
| Y. LECUNC. CORTESC. BURGES, MNIST HANDWRITTEN DIGIT DATABASE, YANN LECUN, CORINNA CORTES AND CHRIS BURGES, 21 June 2018 (2018-06-21), Retrieved from the Internet <URL:http://yann.lecun.com/exdb/mnist> |
Also Published As
| Publication number | Publication date |
|---|---|
| US20210350113A1 (en) | 2021-11-11 |
| EP4290412A3 (en) | 2024-01-03 |
| JP2022500744A (en) | 2022-01-04 |
| JP7187681B2 (en) | 2022-12-12 |
| JP7223839B2 (en) | 2023-02-16 |
| EP3620986A1 (en) | 2020-03-11 |
| WO2020049087A1 (en) | 2020-03-12 |
| WO2020049098A1 (en) | 2020-03-12 |
| CN112655004B (en) | 2024-03-26 |
| CN112655004A (en) | 2021-04-13 |
| CN112639834A (en) | 2021-04-09 |
| WO2020049094A1 (en) | 2020-03-12 |
| JP2022500745A (en) | 2022-01-04 |
| US20210334656A1 (en) | 2021-10-28 |
| EP3620983B1 (en) | 2023-10-25 |
| EP3620983A1 (en) | 2020-03-11 |
| CN112655003A (en) | 2021-04-13 |
| EP3847586A1 (en) | 2021-07-14 |
Similar Documents
| Publication | Publication Date | Title |
|---|---|---|
| EP3620983B1 (en) | Computer-implemented method, computer program product and system for data analysis | |
| US20200074269A1 (en) | Computer-implemented method, computer program product and system for data analysis | |
| Sun et al. | Machine learning applications for building structural design and performance assessment: State-of-the-art review | |
| Mangan et al. | Model selection for dynamical systems via sparse regression and information criteria | |
| Fanaee-T et al. | Tensor-based anomaly detection: An interdisciplinary survey | |
| Xu et al. | Data cleaning in the process industries | |
| Chamroukhi et al. | Model‐based clustering and classification of functional data | |
| Yu et al. | Control chart recognition based on the parallel model of CNN and LSTM with GA optimization | |
| Guo et al. | A just-in-time modeling approach for multimode soft sensor based on Gaussian mixture variational autoencoder | |
| Schlegel et al. | Multivariate time series analysis for driving style classification using neural networks and hyperdimensional computing | |
| Yang et al. | Granger causality for multivariate time series classification | |
| Md Nor et al. | Multi-scale kernel Fisher discriminant analysis with adaptive neuro-fuzzy inference system (ANFIS) in fault detection and diagnosis framework for chemical process systems | |
| Hranisavljevic et al. | Discretization of hybrid CPPS data into timed automaton using restricted Boltzmann machines | |
| Gong et al. | Causal discovery from temporal data: An overview and new perspectives | |
| Ramos et al. | Multivariate statistical process control methods for batch production: A review focused on applications | |
| Kang | Machine learning: Diagnostics and prognostics | |
| Cui et al. | Informative Bayesian neural network priors for weak signals | |
| Tyrovolas et al. | Information flow-based fuzzy cognitive maps with enhanced interpretability | |
| Liu et al. | Residual useful life prognosis of equipment based on modified hidden semi-Markov model with a co-evolutional optimization method | |
| JP2018181052A (en) | Model identification apparatus, prediction apparatus, monitoring system, model identification method, and prediction method | |
| Idowu et al. | Machine learning in pervasive computing | |
| Fisch et al. | Towards automation of knowledge understanding: An approach for probabilistic generative classifiers | |
| US20240135159A1 (en) | System and method for a visual analytics framework for slice-based machine learn models | |
| US20240135160A1 (en) | System and method for efficient analyzing and comparing slice-based machine learn models | |
| Rendall et al. | FOPAM process data analytics workshop |
Legal Events
| Date | Code | Title | Description |
|---|---|---|---|
| PUAI | Public reference made under article 153(3) epc to a published international application that has entered the european phase |
Free format text: ORIGINAL CODE: 0009012 |
|
| STAA | Information on the status of an ep patent application or granted ep patent |
Free format text: STATUS: THE APPLICATION HAS BEEN PUBLISHED |
|
| REG | Reference to a national code |
Ref country code: DE Ref legal event code: R079 Free format text: PREVIOUS MAIN CLASS: G06N0003044200 Ipc: G06N0003040000 |
|
| PUAL | Search report despatched |
Free format text: ORIGINAL CODE: 0009013 |
|
| AC | Divisional application: reference to earlier application |
Ref document number: 3620983 Country of ref document: EP Kind code of ref document: P |
|
| AK | Designated contracting states |
Kind code of ref document: A2 Designated state(s): AL AT BE BG CH CY CZ DE DK EE ES FI FR GB GR HR HU IE IS IT LI LT LU LV MC MK MT NL NO PL PT RO RS SE SI SK SM TR |
|
| AK | Designated contracting states |
Kind code of ref document: A3 Designated state(s): AL AT BE BG CH CY CZ DE DK EE ES FI FR GB GR HR HU IE IS IT LI LT LU LV MC MK MT NL NO PL PT RO RS SE SI SK SM TR |
|
| RIC1 | Information provided on ipc code assigned before grant |
Ipc: G06N 3/088 20230101ALI20231127BHEP Ipc: G06N 3/092 20230101ALI20231127BHEP Ipc: G06N 3/048 20230101ALI20231127BHEP Ipc: G06N 3/0464 20230101ALI20231127BHEP Ipc: G06N 3/0455 20230101ALI20231127BHEP Ipc: G06N 3/0442 20230101ALI20231127BHEP Ipc: G05B 23/02 20060101ALI20231127BHEP Ipc: G06N 3/04 20230101AFI20231127BHEP |