EP4215974A1 - Method to estimate phase and amplitude for control of a resonant mems mirror - Google Patents

Method to estimate phase and amplitude for control of a resonant mems mirror Download PDF

Info

Publication number
EP4215974A1
EP4215974A1 EP23152162.6A EP23152162A EP4215974A1 EP 4215974 A1 EP4215974 A1 EP 4215974A1 EP 23152162 A EP23152162 A EP 23152162A EP 4215974 A1 EP4215974 A1 EP 4215974A1
Authority
EP
European Patent Office
Prior art keywords
signal
phase
amplitude
sense
cos
Prior art date
Legal status (The legal status is an assumption and is not a legal conclusion. Google has not performed a legal analysis and makes no representation as to the accuracy of the status listed.)
Pending
Application number
EP23152162.6A
Other languages
German (de)
French (fr)
Inventor
Raffaele Enrico FURCERI
Luca Molinari
Current Assignee (The listed assignees may be inaccurate. Google has not performed a legal analysis and makes no representation or warranty as to the accuracy of the list.)
STMicroelectronics SRL
Original Assignee
STMicroelectronics SRL
Priority date (The priority date is an assumption and is not a legal conclusion. Google has not performed a legal analysis and makes no representation as to the accuracy of the date listed.)
Filing date
Publication date
Application filed by STMicroelectronics SRL filed Critical STMicroelectronics SRL
Publication of EP4215974A1 publication Critical patent/EP4215974A1/en
Pending legal-status Critical Current

Links

Images

Classifications

    • GPHYSICS
    • G02OPTICS
    • G02BOPTICAL ELEMENTS, SYSTEMS OR APPARATUS
    • G02B26/00Optical devices or arrangements for the control of light using movable or deformable optical elements
    • G02B26/08Optical devices or arrangements for the control of light using movable or deformable optical elements for controlling the direction of light
    • G02B26/10Scanning systems
    • G02B26/101Scanning systems with both horizontal and vertical deflecting means, e.g. raster or XY scanners
    • BPERFORMING OPERATIONS; TRANSPORTING
    • B81MICROSTRUCTURAL TECHNOLOGY
    • B81BMICROSTRUCTURAL DEVICES OR SYSTEMS, e.g. MICROMECHANICAL DEVICES
    • B81B7/00Microstructural systems; Auxiliary parts of microstructural devices or systems
    • B81B7/008MEMS characterised by an electronic circuit specially adapted for controlling or driving the same
    • BPERFORMING OPERATIONS; TRANSPORTING
    • B81MICROSTRUCTURAL TECHNOLOGY
    • B81BMICROSTRUCTURAL DEVICES OR SYSTEMS, e.g. MICROMECHANICAL DEVICES
    • B81B3/00Devices comprising flexible or deformable elements, e.g. comprising elastic tongues or membranes
    • B81B3/0035Constitution or structural means for controlling the movement of the flexible or deformable elements
    • B81B3/004Angular deflection
    • B81B3/0043Increasing angular deflection
    • GPHYSICS
    • G02OPTICS
    • G02BOPTICAL ELEMENTS, SYSTEMS OR APPARATUS
    • G02B26/00Optical devices or arrangements for the control of light using movable or deformable optical elements
    • G02B26/08Optical devices or arrangements for the control of light using movable or deformable optical elements for controlling the direction of light
    • G02B26/0816Optical devices or arrangements for the control of light using movable or deformable optical elements for controlling the direction of light by means of one or more reflecting elements
    • G02B26/0833Optical devices or arrangements for the control of light using movable or deformable optical elements for controlling the direction of light by means of one or more reflecting elements the reflecting element being a micromechanical device, e.g. a MEMS mirror, DMD
    • GPHYSICS
    • G02OPTICS
    • G02BOPTICAL ELEMENTS, SYSTEMS OR APPARATUS
    • G02B26/00Optical devices or arrangements for the control of light using movable or deformable optical elements
    • G02B26/08Optical devices or arrangements for the control of light using movable or deformable optical elements for controlling the direction of light
    • G02B26/10Scanning systems
    • G02B26/105Scanning systems with one or more pivoting mirrors or galvano-mirrors
    • HELECTRICITY
    • H04ELECTRIC COMMUNICATION TECHNIQUE
    • H04NPICTORIAL COMMUNICATION, e.g. TELEVISION
    • H04N9/00Details of colour television systems
    • H04N9/12Picture reproducers
    • H04N9/31Projection devices for colour picture display, e.g. using electronic spatial light modulators [ESLM]
    • H04N9/3141Constructional details thereof
    • BPERFORMING OPERATIONS; TRANSPORTING
    • B81MICROSTRUCTURAL TECHNOLOGY
    • B81BMICROSTRUCTURAL DEVICES OR SYSTEMS, e.g. MICROMECHANICAL DEVICES
    • B81B2201/00Specific applications of microelectromechanical systems
    • B81B2201/04Optical MEMS
    • B81B2201/042Micromirrors, not used as optical switches
    • BPERFORMING OPERATIONS; TRANSPORTING
    • B81MICROSTRUCTURAL TECHNOLOGY
    • B81BMICROSTRUCTURAL DEVICES OR SYSTEMS, e.g. MICROMECHANICAL DEVICES
    • B81B2207/00Microstructural systems or auxiliary parts thereof
    • B81B2207/03Electronic circuits for micromechanical devices which are not application specific, e.g. for controlling, power supplying, testing, protecting

Definitions

  • This disclosure is related to the field of resonant MEMS device control and, in particular, is related to techniques for estimating the phase and amplitude of a sense signal containing information about the movement of a resonant MEMS device, said techniques being performable using computationally simple operations.
  • a laser scanning projector is a small, portable electronic device.
  • Laser scanning projectors are typically paired to, or incorporated within, user devices such as smart glasses, smartphones, tablets, laptops, depth sensing cameras, or LIDAR, and used to project virtual and augmented reality, documents, images, or video stored on those user devices onto a projection surface, such as a wall, holographic surface, or inner display surface of virtual or augmented reality glasses (for example, a wave guide in a coupling window).
  • Laser scanning projectors are also incorporated within distance determination systems within vehicles to determine information about the vehicles relative to their surroundings, permitting the creation of advanced driver assistance systems.
  • Such laser scanning projectors typically include a projection subsystem and an optical module.
  • the paired user device serves an image stream (e.g., a video stream, or a pattern projected into an area used for distance determination) to the projection subsystem.
  • the projection subsystem properly drives the optical module to project the image stream onto the projection surface or environment for viewing.
  • typical optical modules are comprised of a laser source and one or more microelectromechanical (briefly, MEMS) mirrors that scan the laser beam produced by the laser source across the projection surface in a projection pattern.
  • MEMS microelectromechanical
  • the projection subsystem controls the driving of the laser source and the driving of the movement of the one or more MEMS mirrors.
  • the driving of movement of one of the MEMS mirrors is performed at, or close to, the resonance frequency of that MEMS mirror.
  • Monitoring of the mirror movement of the one or more MEMS mirrors is performed by the projection subsystem to provide feedback about the operation of the mirror movement so that the driving of the movement of the one or more MEMS mirrors may be adjusted accordingly to maintain the movement as desired.
  • feedback may be used to maintain the one or more MEMS mirrors operating at a given opening angle.
  • a sample prior art laser scanning projector 10 is now described with reference to Figure 1A .
  • the MEMS mirror 11 (also referred to as a micromirror) is driven at resonance by a drive signal Drv generated by drive circuitry 12.
  • a sensor 13 such as a piezoresistive-based sensor, is used to generate a sense signal Sns in response to the movements of the MEMS mirror 11.
  • Phase feedback circuitry 20 receives the drive signal Drv and sense signal Sns as input, and generates therefrom a frequency signal Fdrive instructing the drive circuitry 12 regarding at what frequency and phase to generate the drive signal Drv.
  • Amplitude feedback circuitry 30 receives the sense signal Sns as input and from it generates a drive voltage signal Vdrive instructing the drive circuitry 12 at what voltage to generate the drive signal Drv.
  • phase feedback circuitry 20 and amplitude feedback circuitry 30 Details of the phase feedback circuitry 20 and amplitude feedback circuitry 30 will be given below, but first a mathematical discussion of operation of MEMS mirrors at resonance is presented.
  • ⁇ 0 represents the natural frequency of the mirror
  • Q is the quality factor of the mirror
  • H 0 is the DC gain.
  • represents the current frequency of the resonant MEMS mirror (as determined from a sense signal generated by a mirror sensor associated with the mirror).
  • a resonant MEMS mirror as indicated by the sense signal responds with a specific phase value with respect to the driving signal, and the drive signal and sense signal are in phase quadrature.
  • the resonant MEMS mirror When a resonant MEMS mirror is operated at resonance, for a given voltage of the drive signal, the resonant MEMS mirror is opened to a wider opening angle and, for a specific opening angle, requires a lower voltage drive signal.
  • the frequency of the drive signal is therefore to be set to maintain the drive signal and the sense signal as being in phase quadrature to maintain resonance, and the voltage of the drive signal is to be set to maintain the drive signal at a specific voltage to maintain a desired opening angle of the resonant MEMS mirror.
  • the phase feedback circuitry 20 generates the frequency signal Fdrive based upon the feedback of the drive signal Drv and the sense signal Sns so as to maintain the drive signal Drv and sense signal Sns in phase quadrature, and the amplitude feedback circuitry 30 generates the drive voltage signal Vdrive so as to maintain the voltage of the drive signal at a desired voltage to achieve a desired opening angle of the MEMS mirror 11.
  • the phase feedback circuitry 20 includes a phase estimator 21 that receives the drive signal Drv and sense signal Sns, and generates therefrom a phase ⁇ , indicative of a phase shift between Drv and Sns.
  • An error amplifier 22 compares the phase ⁇ to a target phase ⁇ target, and generates a phase error ⁇ error as an indication of the difference between ⁇ and ⁇ target.
  • a phase controller 23 generates a tuning signal PLLfrac to adjust the output frequency generated by a fractional phase locked loop (briefly, PLL) 24 from which the frequency signal Fdrive is adjusted to bring ⁇ error to zero.
  • the frequency of the drive signal Drv as generated by the drive circuitry 12 is set to match the frequency of Fdrive. It is understood that even though reference to PLL circuitry 24 is made herein, the driving frequency could also be generated by any programmable oscillator, and that the use of a PLL is simply a non-limiting example.
  • the amplitude feedback circuitry 30 includes an amplitude estimator 31 that receives the sense signal Sns as input and generates an amplitude A as being representative of the amplitude of the sense signal Sns.
  • An error amplifier 32 compares the amplitude A to a target amplitude Atarget and generates an amplitude error signal Aerror as an indication of the difference between A and Atarget.
  • An amplitude controller 33 generates a voltage signal Vdrive that drives Aerror to zero.
  • the amplitude of the drive signal Drv as generated by the drive circuitry 12 is set to match the amplitude of Vdrive.
  • Figure 1B represents a squarewave (whose data points are marked as black dots) vs a sinewave (whose data points are marked as empty circles) with a 60 degrees phase shift.
  • a sample drive signal and sense signal are shown in Figure 1B , with the drive signal being a square wave and the sense signal being a sinusoid.
  • Asense is the amplitude of the sense signal
  • ⁇ sense is the frequency of the sense signal
  • ⁇ sense is the phase of the sense signal with respect to the driver.
  • a first known technique for estimating the phase shift ⁇ between the drive signal and the sense signal is described with reference to Figure 1C .
  • zero crosses of the drive signal and sense signal have been estimated and are represented as the rectangular signals ZC sense and ZCd rive , and a number of cycles of the system clock SYS clk between a rising edge of the zero crossing sense signal ZC sense and a rising edge of the zero crossing drive signal ZC drive is calculated. From this, the phase shift between the drive signal and the sense signal can be estimated.
  • this estimation may be too coarse for high frequency MEMS mirrors (which have high frequency drive signals), and the zero cross estimation of the sense signal itself may be insufficiently accurate depending upon the sampling rate.
  • the insufficient accuracy of the zero cross estimation is generally due to the need for extra processing techniques (for accurate zero cross event detections) and faster clock frequencies (for higher time resolutions).
  • a first known technique for estimation of the amplitude of the sense signal is shown in Figure 1E .
  • Figure 1E shows 16 and 8192 sample-per-cycle samples sinewaves.
  • the sense signal has been sampled at two different sampling rates.
  • the outer illustrated curve 1 represents the sense signal as sampled at a rate of 8192 samples per mirror cycle
  • the inner illustrated curve 2 represents the sense signal as samples at a rate of 16 samples per mirror cycle. This illustrates the issue with using a low sampling rate.
  • the highest sample has a value of 0.9859 when the true amplitude of the sense signal is 1, which represent a 1.41% error that may be unacceptable for many applications.
  • Utilizing a high sampling rate consumes excess power and requires a high frequency analog-to-digital converter.
  • FIG. 1F A second known technique for estimation of the amplitude of the sense signal is shown in Figure 1F .
  • interpolation is used to determine the maximum value of the sense signal, said interpolation being based upon samples of the sense signal and user-specified phase coordinates.
  • the phase coordinates must be accurately determined, otherwise the interpolated peak value may not be accurate. This employs an undesirable amount of computational resources.
  • the tuning of the interpolation point locations makes the system calibration stages more time consuming and more burdensome to address.
  • bandpass filtering is performed to clear noise, such bandpass filtering requiring a high amount of computational resources in order to provide the needed performance, adding a further challenge and drawback to the usage of such techniques.
  • some of the above examples require that the MEMS mirror be locked at resonance prior to opening angle determination, which involves obtaining additional samples placed at sense peaks, adding even more complexity.
  • phase shift and amplitude estimation are less than ideal, and further development is needed. Indeed, the challenge to be addressed is essentially how to perform such estimations accurately enough when few hardware resources are available.
  • the method includes: driving the MEMS device with a drive signal; sensing movement of the MEMS device caused by the drive signal, and generating a sense signal indicative of the movement; using a rotation-matrix approach to generate a reference cosine wave and a reference sine wave, the reference cosine wave and reference sine wave each having an amplitude of 1 and a same frequency as that of the sense signal; multiplying the sense signal by the reference sine wave to produce a first product; multiplying the sense signal by the reference cosine wave to produce a second product; low-pass filtering the first product to produce a first intermediate output; low-pass filtering the second product to produce a second intermediate output; performing a 4-quadrant coordinate rotation digital computer (briefly, CORDIC) technique on the first and second intermediate outputs to thereby determine a phase shift between the sense signal and the drive signal as well as an amplitude of the sense signal; comparing the phase shift
  • CORDIC 4-quadrant coordinate rotation digital computer
  • the method may include digitizing the sense signal prior to multiplication by the reference sine and cosine waves, and the reference sine and cosine waves may be generated in digital form.
  • the low-pass filtering of the first product may serves to remove intermodulation components from the reference sine wave
  • the low-pass filtering of the second product may serve to remove intermodulation components from the reference cosine wave
  • the low-pass filtering of the first product may be performed using a first decimation SINC filter, and the low-pass filtering of the second product may be performed using a second decimation SINC filter.
  • Performing the 4-quadrant CORDIC technique may be accomplished by:
  • the rotation-matrix approach may be performed by:
  • a system for driving micro-electro mechanical systems (MEMS) device includes: a driver generating a drive signal for the MEMS device; a sensor associated with the MEMS device and generating an output indicative of movement of the MEMS device; an analog to digital converter digitizing the output of the sensor to produce a sense signal indicative of movement of the MEMS device; a reference generator using a rotation-matrix approach to generate a reference cosine wave and a reference sine wave based upon a frequency drive signal, the reference cosine wave and reference sine wave each having an amplitude of 1 and a same frequency as that of the sense signal; and a processing circuit.
  • An amplitude of 1 is also currently referred to as a unit or unitary amplitude.
  • the processing circuit is configured to: multiply the sense signal by the reference sine wave to produce a first product; multiply the sense signal by the reference cosine wave to produce a second product; low-pass filter the first product to produce a first intermediate output; low-pass filter the second product to produce a second intermediate output; and perform a 4-quadrant CORDIC technique on the first and second intermediate outputs to thereby determine a phase shift between the sense signal and the drive signal as well as an amplitude of the sense signal.
  • the system also includes: a first error amplifier comparing the amplitude of the sense signal to a target amplitude to thereby produce an amplitude error as a difference therebetween; a second error amplifier comparing the phase shift to a target phase shift to produce a phase error as a difference therebetween; and controller circuitry causing modifying of the drive signal based upon the phase error and the amplitude error so that the phase error and amplitude error are eliminated.
  • the controller circuitry may include: a phase controller generating a PLL control signal based upon the phase error; a phase locked loop (briefly, PLL) generating the frequency drive signal based upon the PLL control signal, the driver modifying phase of the drive signal based upon the frequency drive signal such that the phase error is eliminated; and an amplitude controller generating a voltage drive signal to the driver based upon the amplitude error, the driver modifying amplitude of the drive signal based upon the voltage drive signal such that the amplitude error is eliminated.
  • a phase controller generating a PLL control signal based upon the phase error
  • PLL phase locked loop
  • the processing circuit may be an application specific integrated circuit (briefly, ASIC).
  • the low-pass filtering of the first product may be performed by the processing circuit serves to remove intermodulation components from the reference sine wave
  • the low-pass filtering of the second product may be performed by the processing circuit serves to remove intermodulation components from the reference cosine wave
  • the low-pass filtering of the first product may be performed by the processing circuit using a first decimation SINC filter, and the low-pass filtering of the second product may be performed by the processing circuit using a second decimation SINC filter.
  • the processing circuit may perform the 4-quadrant CORDIC technique by:
  • the processing circuit may perform the rotation-matrix by:
  • Techniques to be described herein are based upon the combination of a digital lock-in amplifier (briefly, LIA) approach with a numerical method to yield accurate estimations of the amplitude and phase of a sense signal obtained from a movement sensor associated with a resonant MEMS device, such as a MEMS mirror.
  • the techniques described herein are efficient from a computational point of view, in a manner which is suitable for applications in which the implementing hardware is to follow size and power consumption constraints.
  • Figure 2A shows the MEAN VALUE exemplified by a horizontal line drawn onto the plot of the evolution over time of a resulting wave OUTPUT based on the SENSE SIGNAL and the REFERENCE SIGNAL.
  • Figure 2B shows the MEAN VALUE exemplified as overlapping to the line of the horizontal axis drawn onto the plot of the evolution over time of a resulting wave OUTPUT based on the SENSE SIGNAL and the REFERENCE SIGNAL.
  • Asense is the amplitude of the sense signal
  • ⁇ sense is the frequency of the sense signal
  • ⁇ sense is the phase of the sense signal
  • Aref is the amplitude of the reference signal
  • ⁇ ref is the frequency of the reference signal
  • ⁇ ref is the phase of the reference signal
  • Aref is the amplitude of the reference signal
  • Asense is the amplitude of the sense signal
  • ⁇ ref is the frequency of the reference signal
  • ⁇ sense is the phase of the sense signal
  • ⁇ ref is the phase of the reference signal
  • ⁇ ⁇ is the difference between ⁇ sense and ⁇ ref .
  • the result includes expressions proportional to amplitude, as well as the phase shift, and an intermodulation product ( ⁇ ref ⁇ t ).
  • the intermodulation product represents the oscillations seen in the product (demodulator output) shown in Figures 2A and 2B , and it is desired to remove these oscillations from the output.
  • the laser scanning projector 100 includes a laser source 99 operated and driven by a laser driver 98 to emit a modulated laser beam towards a resonant MEMS mirror 11 (e.g., micromirror).
  • the MEMS mirror 11 is driven at resonance by a drive signal Drv generated by drive circuitry 12.
  • a sensor 13 such as a piezoresistive-based sensor, is used to generate a sense signal Sns in response to the movements of the MEMS mirror 11.
  • a reference generator 97 generates reference signals for use by feedback circuitry 101.
  • the feedback circuitry 101 receives the reference signals from the reference generator 97 and the sense signal Sns as input, and therefrom estimates the amplitude Asense of the sense signal and the phase shift ⁇ ⁇ of the sense signal.
  • a first error amplifier 22 compares the phase shift ⁇ ⁇ to a target phase shift ⁇ target to determine a phase error ⁇ error.
  • a phase controller 23 generates a new frequency setpoint to be used for tuning the driving frequency which may be generated from a fractional phase locked loop 24, in which case such tuning is achieved by changing the fractional input PLLfrac.
  • the driving frequency could also be generated by any controllable oscillator (such as a voltage-controlled oscillator, briefly VCO).
  • the reference generator 97 receives the frequency signal Fdrive from the PLL 24 so that the frequency of the reference signals generated by the reference generator 97 matches the frequency of the drive signal Drv.
  • a second error amplifier 32 compares the amplitude Asense to an amplitude target Atarget to determine an amplitude error Aerror.
  • An amplitude controller 33 generates a voltage signal Vdrive instructing the drive circuitry 12 regarding at what amplitude to generate the drive signal Drv.
  • An analog-to-digital converter (briefly, ADC) circuit 96 digitizes the sense signal Sns.
  • X and Y are passed to an amplitude and phase estimation block 106 within the feedback circuit 101.
  • a sine wave over time is depicted on a trigonometric circle.
  • P 0 there is an initial reference phase ⁇ ref with respect to the x-axis, this initial phase being a use-defined entry such that this initial reference phase is chosen to suit the present application.
  • point P 1 there is point P 1 , then point P 2 , and so on, accomplished using a rotation of the vector.
  • a rotation can be performed using trigonometric relationships, knowing the amount of rotation to be performed and the actual phase values at the current step.
  • Figure 5 shows rotation-matrix generated reference signal(s) using a phase angle of 60 degrees and a reference frequency Fref of 20kHz.
  • the spectrum of the generated reference sine wave may be observed in Figure 6 .
  • Figure 6 shows a comparison between the spectra of the sinewave reference for a phase angle of 60 degrees and a number of bits Nbits equal to 12.
  • the frequency of the drive signal Drv (shown as Fref) is 20 kHz, and therefore the frequency of the reference sine wave is 20 kHz.
  • harmonics occur due to the quantization of the reference sine wave, with the amplitude of the harmonics being dependent upon the number of bits available for the calculations The effect of these harmonics and how to handle them will be explained in detail later herein.
  • Figure 7 shows low-pass filter (briefly, LPF) output for different references with phase sweep, specifically using a number of samples of 16 samples per cycle (top portion of the figure) or a number of samples of 160 samples per cycle (bottom portion of the figure).
  • LPF low-pass filter
  • Shown in Figure 7 is a comparison of the output of the low-pass filters 103 and 105 when using sinusoidal reference waves as compared to square or triangular reference waves for the case of ODR being 16, as well as for the case of ODR being 160.
  • the theoretical scaling factor for the reference sine wave is Aref/2
  • for the square wave is 2 ⁇ Aref/ ⁇
  • for the triangular wave is 2 ⁇ Aref/ ⁇ 2 .
  • both the square wave and the triangular wave cannot be perfectly reproduced because they are not band-limited.
  • all the infinite harmonics within the bandwidth cannot be included due to the Nyquist limit.
  • Sine waves are band-limited and so can be perfectly reproduced even when low sampling frequencies are available.
  • the result of using either square or triangular wave as reference instead of sinusoids is that the scaling factor would be different than its theoretical value, with this effect being even more pronounced for the square wave since the harmonics decrease as 1/n for the square wave but 1/n 2 for the triangular wave. This would ultimately lead to increased error in the estimation of the phase shift and amplitude of the sense signal Sns.
  • harmonics carried by the sense signal Sns would also be demodulated, adding more information to the output that is not information about the fundamental components of the sense signal Sns. Therefore, the generation of reference sinusoidal waves is used herein.
  • OS sense is the offset that might appear as an additive term in the sense signal Sns.
  • the generation of the reference cosine and sine reference signals undesirably includes harmonics due to both quantization and limited ODR.
  • Figures 8 and 9 show power spectral density (briefly, PSD) plots for the product signals.
  • results of the multiplications may be seen for the sample of the cosine reference wave in Figure 8 , where the desired data (that is the DC component) can be observed together with the intermodulation products (starting shortly before a frequency of 10 4 Hz), and for the sample of the sine reference wave in Figure 9 , wherein the desired data (again, the DC component) can be observed together with the intermodulation products (also starting shortly before a frequency of 10 4 Hz).
  • the low-pass filters 103 and 105 should have zeroes at harmonics in the reference signals, as shown in Figure 10 , to thereby filter out the intermodulation components.
  • Figure 10 shows a frequency response of a by-16 decimating SINC filter for the lock-in amplifier (briefly, LIA).
  • the filters 103 and 105 may therefore be suitable ODR-decimation SINC filters.
  • Figures 11A shows a PSD diagram for the product signals (input x reference).
  • the inputs x(t) and y(t) to the filters 103 and 105 can be observed in Figure 11A , and the outputs of X and Y can be observed in Figure 11B .
  • Figure 11B shows the signals output of the filters of the lock-in amplifier (briefly, LIA).
  • the technique has started with a vector that is ⁇ ⁇ degrees away from the x-axis, and at each iteration ( ⁇ ⁇ i , ⁇ ⁇ i +1 , ⁇ ⁇ i +2 , ⁇ ⁇ i +3 , etc), the resulting phase becomes closer to 0.
  • ⁇ ⁇ is approximated by summation of ⁇ i ⁇ i from 0 to N-1, with ⁇ i being +1 or -1 dependent upon the y i -1 component of the rotation vector at the previous iteration, and with ⁇ i being the rotation angle at each iteration. So, ⁇ i is the angle whose tangent is 2 - i .
  • ⁇ ⁇ is recomposed by as the series of smaller angles that when combined together with the appropriate sign, with the rotations being performed with the tangents of those angles, which are powers of 2 as explained. Therefore, this becomes multiplications by powers of 2, which are implemented as shifts, and shifts as explained above are efficient in terms of computational complexity and are capable of being performed by simple ASICS.
  • phase contributions of the partial angles ⁇ ⁇ are recorded in a lookup table.
  • the lookup table is used together with the starting point X, Y and the described operations are performed at each iteration. After an infinite number of iterations, the phase will be exactly at 0. It has been found that 12 to 18 iterations provide sufficient accuracy for the laser scanning projector 100.
  • phase and amplitude which is indicative of the opening angle of the MEMS mirror
  • proper settings for Fdrive and Vdrive are quickly determined, making calibration quick and easy.
  • lock time is decreased due to the quick determination of proper settings for Fdrive and Vdrive.
  • the amplitude and phase estimation are run in parallel and so are both control loops.
  • the phase estimation is not limited by the resolution of the PLL counts, the above techniques are usable even with mirrors having a high resonance frequency, and in fact, are usable with any resonance MEMS device and are not limited to MEMS mirrors.
  • the stability of the output provided here is more stable than would be provided by any analog control because analog lock-in amplifiers, though still implemented, suffer from technological and physical limitations (e.g., temperature deviation from the transistors used for demodulation, non-linearities, etc) which digital implementations are insensitive to.
  • the reference signal generation is reliable as it is based on using the same clock source as other components within the device.
  • the described functions and blocks of the feedback circuit 101 may be performed by a field programmable gate array (briefly, FPGA) or application specific integrated circuit (briefly, ASIC), for example.
  • FPGA field programmable gate array
  • ASIC application specific integrated circuit
  • the above scheme permits precise control of the MEMS mirror 11 through the described hardware performing the described functions, and that the above scheme reduces the computational resources utilized to obtain precise control of the MEMS mirror 11 (e.g., reduces computational intensity of the functions performed that are used to precisely control the MEMS mirror 11).

Abstract

Techniques to be described herein are based upon the combination of a digital lockin amplifier approach with a numerical method to yield accurate estimations of the amplitude (Asense) and phase (ϕsense) of a sense signal (Sns) obtained from a movement sensor (13) associated with a resonant MEMS device (11), such as a MEMS mirror.The techniques described herein are efficient from a computational point of view, in a manner which is suitable for applications in which the implementing hardware is to follow size and power consumption constraints.

Description

    TECHNICAL FIELD
  • This disclosure is related to the field of resonant MEMS device control and, in particular, is related to techniques for estimating the phase and amplitude of a sense signal containing information about the movement of a resonant MEMS device, said techniques being performable using computationally simple operations.
  • BACKGROUND
  • A laser scanning projector is a small, portable electronic device. Laser scanning projectors are typically paired to, or incorporated within, user devices such as smart glasses, smartphones, tablets, laptops, depth sensing cameras, or LIDAR, and used to project virtual and augmented reality, documents, images, or video stored on those user devices onto a projection surface, such as a wall, holographic surface, or inner display surface of virtual or augmented reality glasses (for example, a wave guide in a coupling window).
  • Laser scanning projectors are also incorporated within distance determination systems within vehicles to determine information about the vehicles relative to their surroundings, permitting the creation of advanced driver assistance systems.
  • Such laser scanning projectors typically include a projection subsystem and an optical module. The paired user device serves an image stream (e.g., a video stream, or a pattern projected into an area used for distance determination) to the projection subsystem. The projection subsystem properly drives the optical module to project the image stream onto the projection surface or environment for viewing.
  • In greater detail, typical optical modules are comprised of a laser source and one or more microelectromechanical (briefly, MEMS) mirrors that scan the laser beam produced by the laser source across the projection surface in a projection pattern. By modulating the laser beam (in the case of an image projection system) according to its position on the projection surface, while the laser beam is scanned in the projection pattern, the image stream is displayed.
  • The projection subsystem controls the driving of the laser source and the driving of the movement of the one or more MEMS mirrors. Typically, the driving of movement of one of the MEMS mirrors is performed at, or close to, the resonance frequency of that MEMS mirror.
  • Monitoring of the mirror movement of the one or more MEMS mirrors is performed by the projection subsystem to provide feedback about the operation of the mirror movement so that the driving of the movement of the one or more MEMS mirrors may be adjusted accordingly to maintain the movement as desired. For example, feedback may be used to maintain the one or more MEMS mirrors operating at a given opening angle.
  • A sample prior art laser scanning projector 10 is now described with reference to Figure 1A. Here, the laser source and its associated control circuitry are not shown but are understood to be present. The MEMS mirror 11 (also referred to as a micromirror) is driven at resonance by a drive signal Drv generated by drive circuitry 12. A sensor 13, such as a piezoresistive-based sensor, is used to generate a sense signal Sns in response to the movements of the MEMS mirror 11.
  • Phase feedback circuitry 20 receives the drive signal Drv and sense signal Sns as input, and generates therefrom a frequency signal Fdrive instructing the drive circuitry 12 regarding at what frequency and phase to generate the drive signal Drv.
  • Amplitude feedback circuitry 30 receives the sense signal Sns as input and from it generates a drive voltage signal Vdrive instructing the drive circuitry 12 at what voltage to generate the drive signal Drv.
  • Details of the phase feedback circuitry 20 and amplitude feedback circuitry 30 will be given below, but first a mathematical discussion of operation of MEMS mirrors at resonance is presented.
  • A resonant MEMS mirror can be considered to behave as a second-order filter, mathematically represented as: H s = H 0 ω 0 2 s 2 + ω 0 Q s + ω 0 2
    Figure imgb0001
    Here, ω 0 represents the natural frequency of the mirror, Q is the quality factor of the mirror and H0 is the DC gain.
  • The magnitude response of a resonant MEMS mirror represents its opening angle and can be mathematically represented as: M ω = H 0 ω 0 2 ω ω 0 2 + ω 0 Q ω 2
    Figure imgb0002
    Here, ω represents the current frequency of the resonant MEMS mirror (as determined from a sense signal generated by a mirror sensor associated with the mirror).
  • The phase response ϕ of a resonant MEMS mirror represents the delay between the drive signal and the mirror, and can be mathematically represented as: ϕ ω = atan 2 Q ω 0 ω + 4 Q 2 1 atan 2 Q ω 0 ω 4 Q 2 1
    Figure imgb0003
  • At resonance, a resonant MEMS mirror as indicated by the sense signal responds with a specific phase value with respect to the driving signal, and the drive signal and sense signal are in phase quadrature.
  • When a resonant MEMS mirror is operated at resonance, for a given voltage of the drive signal, the resonant MEMS mirror is opened to a wider opening angle and, for a specific opening angle, requires a lower voltage drive signal. During operation, the frequency of the drive signal is therefore to be set to maintain the drive signal and the sense signal as being in phase quadrature to maintain resonance, and the voltage of the drive signal is to be set to maintain the drive signal at a specific voltage to maintain a desired opening angle of the resonant MEMS mirror.
  • Therefore, during operation of the laser scanning projector 10, the phase feedback circuitry 20 generates the frequency signal Fdrive based upon the feedback of the drive signal Drv and the sense signal Sns so as to maintain the drive signal Drv and sense signal Sns in phase quadrature, and the amplitude feedback circuitry 30 generates the drive voltage signal Vdrive so as to maintain the voltage of the drive signal at a desired voltage to achieve a desired opening angle of the MEMS mirror 11.
  • The phase feedback circuitry 20 includes a phase estimator 21 that receives the drive signal Drv and sense signal Sns, and generates therefrom a phase ϕ, indicative of a phase shift between Drv and Sns. An error amplifier 22 compares the phase ϕ to a target phase ϕtarget, and generates a phase error ϕerror as an indication of the difference between ϕ and ϕtarget. A phase controller 23 generates a tuning signal PLLfrac to adjust the output frequency generated by a fractional phase locked loop (briefly, PLL) 24 from which the frequency signal Fdrive is adjusted to bring ϕerror to zero. The frequency of the drive signal Drv as generated by the drive circuitry 12 is set to match the frequency of Fdrive. It is understood that even though reference to PLL circuitry 24 is made herein, the driving frequency could also be generated by any programmable oscillator, and that the use of a PLL is simply a non-limiting example.
  • The amplitude feedback circuitry 30 includes an amplitude estimator 31 that receives the sense signal Sns as input and generates an amplitude A as being representative of the amplitude of the sense signal Sns. An error amplifier 32 compares the amplitude A to a target amplitude Atarget and generates an amplitude error signal Aerror as an indication of the difference between A and Atarget. An amplitude controller 33 generates a voltage signal Vdrive that drives Aerror to zero. The amplitude of the drive signal Drv as generated by the drive circuitry 12 is set to match the amplitude of Vdrive.
  • The estimation of the phase shift between the drive signal Drv and sense signal Sns is now described.
  • Figure 1B represents a squarewave (whose data points are marked as black dots) vs a sinewave (whose data points are marked as empty circles) with a 60 degrees phase shift.
  • A sample drive signal and sense signal are shown in Figure 1B, with the drive signal being a square wave and the sense signal being a sinusoid. The drive signal can be mathematically represented as a square-wave voltage whose amplitude is Vdrive and fundamental frequency is ωdrive : drive t = Vdrive square ω drive t
    Figure imgb0004
  • The sense signal can be mathematically represented as: sense t = A sense sin ω sense t + ϕ sense
    Figure imgb0005
    Here, Asense is the amplitude of the sense signal, ωsense is the frequency of the sense signal, and ϕsense is the phase of the sense signal with respect to the driver.
  • A first known technique for estimating the phase shift Φ between the drive signal and the sense signal is described with reference to Figure 1C. In this graph, zero crosses of the drive signal and sense signal have been estimated and are represented as the rectangular signals ZCsense and ZCdrive, and a number of cycles of the system clock SYSclk between a rising edge of the zero crossing sense signal ZCsense and a rising edge of the zero crossing drive signal ZCdrive is calculated. From this, the phase shift between the drive signal and the sense signal can be estimated. However, this estimation may be too coarse for high frequency MEMS mirrors (which have high frequency drive signals), and the zero cross estimation of the sense signal itself may be insufficiently accurate depending upon the sampling rate. The insufficient accuracy of the zero cross estimation is generally due to the need for extra processing techniques (for accurate zero cross event detections) and faster clock frequencies (for higher time resolutions).
  • A second known technique for estimating the phase shift between the drive signal and the sense signal is described with reference to Figure 1D. Keep in mind that the following is not a direct computation of a phase shift in the strict sense thereof, but instead is an indirect estimation of the phase shift, which is useful when, as explained, the sense signal is sampled at two constant (and potentially symmetrical) locations. Here, the sense signal is sampled at two constant locations per cycle - in the illustrated example, the samples are taken at π 2
    Figure imgb0006
    and 3 π 2
    Figure imgb0007
    of the cycle of the sense signal. The phase shift Φ may then be calculated as: Phase Shift Φ = Sample 2 Sample 1 Asense
    Figure imgb0008
  • The limitations here are that an accurate estimation of the amplitude Asense of the sense signal is required for normalization, and that the samples themselves and the timing thereof must be accurate in order to yield an accurate estimation of the phase shift.
  • A first known technique for estimation of the amplitude of the sense signal is shown in Figure 1E.
  • Figure 1E shows 16 and 8192 sample-per-cycle samples sinewaves.
  • Here, the sense signal has been sampled at two different sampling rates. The outer illustrated curve 1 represents the sense signal as sampled at a rate of 8192 samples per mirror cycle, and the inner illustrated curve 2 represents the sense signal as samples at a rate of 16 samples per mirror cycle. This illustrates the issue with using a low sampling rate. In the case where 16 samples per mirror cycle is used, the highest sample has a value of 0.9859 when the true amplitude of the sense signal is 1, which represent a 1.41% error that may be unacceptable for many applications. Utilizing a high sampling rate, however, consumes excess power and requires a high frequency analog-to-digital converter.
  • A second known technique for estimation of the amplitude of the sense signal is shown in Figure 1F. Here, interpolation is used to determine the maximum value of the sense signal, said interpolation being based upon samples of the sense signal and user-specified phase coordinates. However, the phase coordinates must be accurately determined, otherwise the interpolated peak value may not be accurate. This employs an undesirable amount of computational resources. In addition, the tuning of the interpolation point locations makes the system calibration stages more time consuming and more burdensome to address.
  • In the above examples of phase shift and amplitude estimation that rely upon samples, bandpass filtering is performed to clear noise, such bandpass filtering requiring a high amount of computational resources in order to provide the needed performance, adding a further challenge and drawback to the usage of such techniques. Also, some of the above examples require that the MEMS mirror be locked at resonance prior to opening angle determination, which involves obtaining additional samples placed at sense peaks, adding even more complexity.
  • Prior solutions have been found to yield poor results when estimations (and control loops are implemented directly on hardware like application specific integrated circuits (briefly, ASICs), where few computational resources are available, and both area and power consumption are challenging aspects (meaning high clock frequencies and sampling rates cannot be afforded, for instance).
  • As such, current techniques for phase shift and amplitude estimation (e.g., current implementations of the phase estimator 21 and amplitude estimator 31 described above with reference to Figure 1) are less than ideal, and further development is needed. Indeed, the challenge to be addressed is essentially how to perform such estimations accurately enough when few hardware resources are available.
  • SUMMARY
  • Disclosed herein is a method of operating a micro-electro mechanical systems (briefly, MEMS) device. The method includes: driving the MEMS device with a drive signal; sensing movement of the MEMS device caused by the drive signal, and generating a sense signal indicative of the movement; using a rotation-matrix approach to generate a reference cosine wave and a reference sine wave, the reference cosine wave and reference sine wave each having an amplitude of 1 and a same frequency as that of the sense signal; multiplying the sense signal by the reference sine wave to produce a first product; multiplying the sense signal by the reference cosine wave to produce a second product; low-pass filtering the first product to produce a first intermediate output; low-pass filtering the second product to produce a second intermediate output; performing a 4-quadrant coordinate rotation digital computer (briefly, CORDIC) technique on the first and second intermediate outputs to thereby determine a phase shift between the sense signal and the drive signal as well as an amplitude of the sense signal; comparing the phase shift to a target phase shift to produce a phase error as a difference therebetween; comparing the amplitude of the sense signal to a target amplitude to thereby produce an amplitude error as a difference therebetween; and modifying the drive signal based upon the phase error and the amplitude error so that the phase error and amplitude error are eliminated.
  • The method may include digitizing the sense signal prior to multiplication by the reference sine and cosine waves, and the reference sine and cosine waves may be generated in digital form.
  • The low-pass filtering of the first product may serves to remove intermodulation components from the reference sine wave, and the low-pass filtering of the second product may serve to remove intermodulation components from the reference cosine wave.
  • The low-pass filtering of the first product may be performed using a first decimation SINC filter, and the low-pass filtering of the second product may be performed using a second decimation SINC filter.
  • Performing the 4-quadrant CORDIC technique may be accomplished by:
    1. a) defining an index i having integer values ranging from 0 to N-1, with N being the total amount of CORDIC iterations;
    2. b) pre-calculating N angles θi such that for each of the N angles, tan (θi ) = 2-i .
    3. c) determining a starting coordinate set X0, Y0 from the two SINC outputs (i.e. Y and X);
    4. d) If X>=0, setting Δθ=0 as a starting point, else if X<0, then if Y>0 setting Δθ = +180, else setting Δθ = -180; also, rotating the starting X,Y coordinates by 180° by setting X=-X and Y=-Y;
    5. e) for a first number i=0 in the index, setting a next coordinate set X1, Y1 to be such that X1=X0-(Y0 >> 0) and Y1=Y0+(X0 >> 0) and determine a phase Δθ = Δθ - θi if Y0 ≤ 0, but setting the next coordinate set X1,Y1 to be such that X1=X0+(Y0 >>0) and Y1=Y0-(X0 >>0)and determine the phase Δθ = Δθ + θi , if Y0 > 0;
    6. f) incrementing i by one;
    7. g) for an i-th number i in the index, setting a next coordinate set Xi, Yi to be such that Xi+1=Xi-(Yi >> i) and Yi+1=Yi+(Xi >> i) and determine a phase Δθ = Δθ - θi if Yi ≤ 0, but setting the next coordinate set Xi+1,Yi+2 to be such that Xi+1=Xi+(Yi >>i) and Yi+i=Yi-(Xi >>i) and determine the phase Δθ = Δθ + θi , if Yi > 0;
    8. h) if i<N-1, return to f); and
    9. i) if i=N-1:
      • determine the phase shift as being equal to the phase Δθ and
      • determine the amplitude of the sense signal as being equal to K·XN-1, being K = 2 i = 0 N 1 cos θ i
        Figure imgb0009
        .
  • The rotation-matrix approach may be performed by:
    1. a) defining an index i having integer values ranging from 0 to N-1, with N being the number of samples per reference cycle;
    2. b) determining a rotation amount as being equal to 360°/N and pre-calculating the (x_rot; y_rot)=(cos(360/N); sin(360/N)) rotation coordinates;
    3. c) determining a starting coordinate set X0, Y0, where x 0 = cos (ϕref ), y 0 = sin (ϕref ), with ϕref being equal to the initial phase shift for the reference waves;
    4. d) rotating the start coordinate set X0, Y0 by the rotation amount to produce a next coordinate set X1, Y1as X1 = X 0 · xrot - Y 0 · yrot and Y 1 = X 0 · yrot + Y 0 · xrot ;
    5. e) incrementing i by 1;
    6. f) rotate the coordinate set X1, Y1 by the rotation amount to produce an i-th coordinate set Xi, Yi as X i+1 = Xi · xrot - Yi · yrot and Y i+1 = Xi · yrot + Yi · xrot ;
    7. g) if i<N-1, return to e); and
    8. h) if i=N-1, reset the index to 0, and start over from c).
  • Also disclosed herein is a system for driving micro-electro mechanical systems (MEMS) device. The system includes: a driver generating a drive signal for the MEMS device; a sensor associated with the MEMS device and generating an output indicative of movement of the MEMS device; an analog to digital converter digitizing the output of the sensor to produce a sense signal indicative of movement of the MEMS device; a reference generator using a rotation-matrix approach to generate a reference cosine wave and a reference sine wave based upon a frequency drive signal, the reference cosine wave and reference sine wave each having an amplitude of 1 and a same frequency as that of the sense signal; and a processing circuit. An amplitude of 1 is also currently referred to as a unit or unitary amplitude. The processing circuit is configured to: multiply the sense signal by the reference sine wave to produce a first product; multiply the sense signal by the reference cosine wave to produce a second product; low-pass filter the first product to produce a first intermediate output; low-pass filter the second product to produce a second intermediate output; and perform a 4-quadrant CORDIC technique on the first and second intermediate outputs to thereby determine a phase shift between the sense signal and the drive signal as well as an amplitude of the sense signal. The system also includes: a first error amplifier comparing the amplitude of the sense signal to a target amplitude to thereby produce an amplitude error as a difference therebetween; a second error amplifier comparing the phase shift to a target phase shift to produce a phase error as a difference therebetween; and controller circuitry causing modifying of the drive signal based upon the phase error and the amplitude error so that the phase error and amplitude error are eliminated.
  • The controller circuitry may include: a phase controller generating a PLL control signal based upon the phase error; a phase locked loop (briefly, PLL) generating the frequency drive signal based upon the PLL control signal, the driver modifying phase of the drive signal based upon the frequency drive signal such that the phase error is eliminated; and an amplitude controller generating a voltage drive signal to the driver based upon the amplitude error, the driver modifying amplitude of the drive signal based upon the voltage drive signal such that the amplitude error is eliminated.
  • The processing circuit may be an application specific integrated circuit (briefly, ASIC).
  • The low-pass filtering of the first product may be performed by the processing circuit serves to remove intermodulation components from the reference sine wave, and the low-pass filtering of the second product may be performed by the processing circuit serves to remove intermodulation components from the reference cosine wave.
  • The low-pass filtering of the first product may be performed by the processing circuit using a first decimation SINC filter, and the low-pass filtering of the second product may be performed by the processing circuit using a second decimation SINC filter.
  • The processing circuit may perform the 4-quadrant CORDIC technique by:
    1. a) defining an index i having integer values ranging from 0 to N-1, with N being the total amount of CORDIC iterations;
    2. b) pre-calculating N angles θi such that for each of the N angles, tan (θi ) = 2-i ;
    3. c) determining a starting coordinate set X0, Y0 from the two SINC outputs (i.e. Y and X);
    4. d) If X>=0, setting Δθ=0 as a starting point, else if X<0, then if Y>0 setting Δθ = +180, else setting Δθ = -180; also, rotating the starting X,Y coordinates by 180° by setting X=-X and Y=-Y;
    5. e) for a first number i=0 in the index, setting a next coordinate set X1, Y1 to be such that X1=X0-(Y0 >> 0) and Y1=Y0+(X0 >> 0) and determine a phase Δθ = Δθ - θi if Y0 ≤ 0, but setting the next coordinate set X1,Y1 to be such that X1=X0+(Y0 >>0) and Y1=Y0-(X0 >>0)and determine the phase Δθ = Δθ + θi , if Y0 > 0;
    6. f) incrementing i by one;
    7. g) for an i-th number i in the index, setting a next coordinate set Xi, Yi to be such that Xi+1=Xi-(Yi >> i) and Yi+1=Yi+(Xi >> i) and determine a phase Δθ = Δθ - θi if Yi ≤ 0, but setting the next coordinate set Xi+1,Yi+2 to be such that Xi+1=Xi+(Yi >>i) and Yi+1=Yi-(Xi >>i) and determine the phase Δθ = Δθ + θi , if Yi > 0;
    8. h) if i<N-1, return to f); and
    9. i) if i=N-1:
      • determine the phase shift as being equal to the phase Δθ and
      • determine the amplitude of the sense signal as being equal to K·XN-1, being K = 2 i = 0 N 1 cos θ i
        Figure imgb0010
        .
  • The processing circuit may perform the rotation-matrix by:
    1. a) defining an index i having integer values ranging from 0 to N-1, with N being the number of samples per reference cycle;
    2. b) determining a rotation amount as being equal to 360°/N and precalculating the rotation coordinates (x_rot; y_rot)=(cos(360/N); sin(360/N));
    3. c) determining a starting coordinate set X0, Y0, where x 0 = cos (ϕref ), y 0 = sin (ϕref ), with ϕref being equal to the initial phase shift for the reference waves;
    4. d) rotating the start coordinate set X0, Y0 by the rotation amount to produce a next coordinate set X1, Y1as X1 = X 0 · xrot - Y 0 · yrot and Y 1 = X 0 · yrot + Y 0 · xrot ;
    5. e) incrementing i by 1;
    6. f) rotate the coordinate set X1, Y1 by the rotation amount to produce an i-th coordinate set Xi, Yi as X i+1 = Xi · xrot - Yi · yrot and Y i+1 = Xi · yrot + Y1 · xrot ;
    7. g) if i<N-1, return to e); and
    8. h) if i=N-1, reset the index to 0, and start over from c).
    BRIEF DESCRIPTION OF THE DRAWINGS
    • Figure 1A is a block diagram of a laser scanning projector utilizing prior art control loops;
    • Figure 1B is a graph showing the drive signal and sense signal of Figure 1A and the phase shift therebetween;
    • Figure 1C is a graph used in explaining a first known technique for estimating the phase shift between the drive signal and the sense signal of Figure 1A;
    • Figure 1D is a graph used in explaining a second known technique for estimating the phase shift between the drive signal and the sense signal of Figure 1A;
    • Figure 1E is a graph used in explaining a first known technique for estimation of the amplitude of the sense signal of Figure 1A;
    • Figure 1F is a graph used in explaining a second known technique for estimation of the amplitude of the sense signal of Figure 1A;
    • Figures 2A-2B are graphs used in explaining a digital lock-in amplifier approach disclosed herein for use in determining the phase shift between drive and sense signals in a resonant MEMS device;
    • Figure 3 is a schematic block diagram of a laser scanning projector disclosed herein utilizing computationally less intensive control loops;
    • Figure 4 is a trigonometric circle used in explaining the generation of the reference cosine and sine waves by the reference generator of Figure 3;
    • Figure 5 is a graph showing the generated reference sine and cosine waves as generated using the technique described with reference to Figure 4;
    • Figure 6 is a graph showing the spectra of the generated reference sine wave;
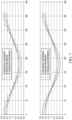
    • Figure 7 contains graphs showing the output provided by the low-pass filter of Figure 3 when the reference waves are generated by the reference generator as being sinusoidal, square, and triangular, for different sampling rates;
    • Figure 8 is a graph showing the frequency response of the signal(s) generated by the first demodulator of Figure 3;
    • Figure 9 is a graph showing the frequency response of the signal(s) generated by the second demodulator of Figure 3;
    • Figure 10 is a graph illustrating the frequency response of a decimating SINC filter such as may be used for the low-pass filters of Figure 3;
    • Figure 11A is a graph showing the signals x(t) and y(t) generated by the demodulators of Figure 3;
    • Figure 11B is a graph showing the outputs X and Y of the filters of Figure 3; and
    • Figures 12A-12D are trigonometric circles used to describe the CORDIC technique used to recover the phase shift and amplitude values from the outputs X and Y of the filters of Figure 3.
    DETAILED DESCRIPTION
  • The following disclosure enables a person skilled in the art to make and use the subject matter disclosed herein. The general principles described herein may be applied to embodiments and applications other than those detailed above without departing from the spirit and scope of this disclosure. This disclosure is not intended to be limited to the embodiments shown, but is to be accorded the widest scope consistent with the principles and features disclosed or suggested herein.
  • Techniques to be described herein are based upon the combination of a digital lock-in amplifier (briefly, LIA) approach with a numerical method to yield accurate estimations of the amplitude and phase of a sense signal obtained from a movement sensor associated with a resonant MEMS device, such as a MEMS mirror. The techniques described herein are efficient from a computational point of view, in a manner which is suitable for applications in which the implementing hardware is to follow size and power consumption constraints.
  • First, the mathematical underpinnings of the techniques described herein will be discussed, and then the practical application and realization of those techniques will be discussed together with the uses thereof in real world applications, to provide for accurate control of resonant MEMS mirrors using these techniques.
  • Illustrated in Figures 2A-2B is the digital lock-in amplifier approach. Shown in Figure 2A are a digitized version of the sense signal as well as a reference signal, both at the same frequency. If these two signals are multiplied, the result is a signal with a mean value that is proportional to their amplitudes as well as the phase shift between the signals. Thus, notice that the result of this multiplication is equal to the two estimations (amplitude and phase of a sense signal) that it is desired to accurately and quickly perform. In the example of Figure 2A, there is no phase shift between the sense signal and reference signal, so the mean value of the resulting wave can be calculated as: Mean = A sense A ref 2
    Figure imgb0011
  • Figure 2A shows the MEAN VALUE exemplified by a horizontal line drawn onto the plot of the evolution over time of a resulting wave OUTPUT based on the SENSE SIGNAL and the REFERENCE SIGNAL.
  • Turn now to the example of Figure 2B, where the sense signal and reference signal are in phase quadrature (e.g., phase shifted by 90°). Notice that in this example, the mean value of the product of the sense signal and reference signal is zero.
  • Figure 2B shows the MEAN VALUE exemplified as overlapping to the line of the horizontal axis drawn onto the plot of the evolution over time of a resulting wave OUTPUT based on the SENSE SIGNAL and the REFERENCE SIGNAL.
  • The mathematics yielding this result are now explained. The sense signal can be mathematically represented as: sense t = A sense sin ω sense t + ϕ sense
    Figure imgb0012
  • Here, Asense is the amplitude of the sense signal, ωsense is the frequency of the sense signal, and ϕsense is the phase of the sense signal.
  • The reference signal can be mathematically represented using the following two equations: cos ref t = A ref cos ω ref t + ϕ ref
    Figure imgb0013
    sin ref t = A ref sin ω ref t + ϕ ref
    Figure imgb0014
  • Here, Aref is the amplitude of the reference signal, ωref is the frequency of the reference signal, and ωref is the phase of the reference signal.
  • The results of multiplication of the sense signal by the reference signal yields x and y values, which can be mathematically represented as: y t = sense t cos ref t = A ref A sense 2 sin Δϕ + sin 2 ω ref t + ϕ sense + ϕ ref
    Figure imgb0015
    x t = sense t sin ref t = A ref A sense 2 cos Δϕ cos 2 ω ref t + ϕ sense + ϕ ref
    Figure imgb0016
  • Here, Aref is the amplitude of the reference signal, Asense is the amplitude of the sense signal, ωref is the frequency of the reference signal, ϕsense is the phase of the sense signal, ϕref is the phase of the reference signal, and Δϕ is the difference between ϕsense and ϕref.
  • Therefore, as can be seen, the result includes expressions proportional to amplitude, as well as the phase shift, and an intermodulation product (ωref · t). The intermodulation product represents the oscillations seen in the product (demodulator output) shown in Figures 2A and 2B, and it is desired to remove these oscillations from the output.
  • Assuming that ωref = ωsense and that Aref = 1, the average of y(t), denoted Y, as obtained using suitable low-pass filtering can be mathematically represented as: Y = < y t > = A sense 2 sin Δϕ
    Figure imgb0017
  • Likewise, assuming that ωref = ωsense and that Aref = 1, the average of x(t), denoted X, as obtained using suitable low-pass filtering can be mathematically represented as: X = < x t > = A sense 2 cos Δϕ
    Figure imgb0018
  • From this, using simple math, the amplitude of the sense signal can be recovered as: A sense = 2 X 2 + Y 2
    Figure imgb0019
  • Similarly, the phase shift between the sense signal and reference signal can be recovered as: Δϕ = tan 1 Y X
    Figure imgb0020
  • Hardware for use in implementing the estimation of the phase and amplitude of the sense signal, and then using that estimation in operating a laser scanning projector 100, is now described with additional reference to Figure 3.
  • The laser scanning projector 100 includes a laser source 99 operated and driven by a laser driver 98 to emit a modulated laser beam towards a resonant MEMS mirror 11 (e.g., micromirror). The MEMS mirror 11 is driven at resonance by a drive signal Drv generated by drive circuitry 12. A sensor 13, such as a piezoresistive-based sensor, is used to generate a sense signal Sns in response to the movements of the MEMS mirror 11. A reference generator 97 generates reference signals for use by feedback circuitry 101. The feedback circuitry 101 receives the reference signals from the reference generator 97 and the sense signal Sns as input, and therefrom estimates the amplitude Asense of the sense signal and the phase shift Δϕ of the sense signal.
  • A first error amplifier 22 compares the phase shift Δϕ to a target phase shift ϕtarget to determine a phase error ϕerror. A phase controller 23 generates a new frequency setpoint to be used for tuning the driving frequency which may be generated from a fractional phase locked loop 24, in which case such tuning is achieved by changing the fractional input PLLfrac.
  • It is understood anyway that, even though PLL circuitry is referred to herein, the driving frequency could also be generated by any controllable oscillator (such as a voltage-controlled oscillator, briefly VCO).
  • The reference generator 97 receives the frequency signal Fdrive from the PLL 24 so that the frequency of the reference signals generated by the reference generator 97 matches the frequency of the drive signal Drv.
  • A second error amplifier 32 compares the amplitude Asense to an amplitude target Atarget to determine an amplitude error Aerror. An amplitude controller 33 generates a voltage signal Vdrive instructing the drive circuitry 12 regarding at what amplitude to generate the drive signal Drv.
  • An analog-to-digital converter (briefly, ADC) circuit 96 digitizes the sense signal Sns. The feedback circuitry 101 includes a first multiplication circuit 102 (e.g., a modulator) that receives the digitized sense signal Sns, which is mathematically represented as: sense t = A sense sin ω sense t + ϕ sense
    Figure imgb0021
  • Here, with sense(t) and below with the following equations and expressions, since the operations are performed in the digital domain, t = nT, with T being the sampling period and n being the index of the n-th sample. The first multiplication circuit 102 also receives a digital reference sine wave from the reference generator 97, which is mathematically represented as: y ref = sin ω ref t + ϕ ref
    Figure imgb0022
  • The first multiplication circuit 12 multiplies these two signals to yield: x t = sense t sin ref t = 1 A sense 2 cos Δϕ cos 2 ω ref t + ϕ sense + ϕ ref
    Figure imgb0023
  • The signal expression x(t) is filtered by low-pass filter 103 within the feedback circuit 101 to produce X, mathematically represented as: X = < x t > = A sense 2 cos Δϕ
    Figure imgb0024
  • The feedback circuit 101 includes a second multiplication circuit 104 (e.g., a modulator) that receives the digitized sense signal sense(t), and also receives a digital reference cosine wave, the reference cosine wave being mathematically represented as: x ref = cos ω ref t + ϕ ref
    Figure imgb0025
  • The second multiplication circuit 104 multiplies these two signals to yield: y t = sense t cos ref t = 1 A sense 2 sin Δϕ + sin 2 ω ref t + ϕ sense + ϕ ref
    Figure imgb0026
  • The signal expression y(t) is filtered by low-pass filter 105 within the feedback circuit 101 to produce Y, mathematically represented as: Y = < y t > = A sense 2 sin Δϕ
    Figure imgb0027
  • X and Y are passed to an amplitude and phase estimation block 106 within the feedback circuit 101. The amplitude and phase estimation block 106 calculates the amplitude Asense and phase Δϕ of the sense signal sense(t) as: A sense = 2 X 2 + Y 2
    Figure imgb0028
    Δϕ = tan 1 Y X
    Figure imgb0029
  • Generation of the reference signals xref and yref by the reference generator 97 is now described with initial reference to Figure 4. Typically, when sinusoidal signals are generated, a summation approximation, such as the Taylor Series, may be used. However, these approximations are not precise enough for use in performing the techniques described herein. Furthermore, producing these approximations utilizes excessive processing power, which is particularly detrimental for applications where more limited processing capabilities are available. Indeed, using the Taylor series or polynomial approximations has too many drawbacks. As such, a new method for generating sinusoidal signals for use as reference signals has been developed. The new method relies upon trigonometric relationships to yield accurate results without the use of approximation, and precision being the function of fixed point implementations (e.g., no algorithmic error is introduced).
  • Referring to Figure 4, a sine wave over time is depicted on a trigonometric circle. Starting from a generic point, here P 0, there is an initial reference phase ϕref with respect to the x-axis, this initial phase being a use-defined entry such that this initial reference phase is chosen to suit the present application. Then, in the next iteration, there is point P 1, then point P 2, and so on, accomplished using a rotation of the vector. A rotation can be performed using trigonometric relationships, knowing the amount of rotation to be performed and the actual phase values at the current step. For example, assume there will be 16 samples of the sense signal Sns per mirror cycle, meaning that the output data rate (briefly, ODR) is 16, and that 16 data points for a reference sine wave are therefore to be generated so that the conditions of ωref = ωsense and Aref = 1 are fulfilled, enabling the calculation of x(t) and y(t) as described above to be performed.
  • The amount of rotation to be performed at each step can be calculated as: ϕ rot = 360 ° ODR = 360 ° 16 = 22.5 °
    Figure imgb0030
  • Therefore, knowing the amount of rotation per step and the initial phase-point P 0 calculated as: P 0 x 0 y 0 ,
    Figure imgb0031
    where x 0 = cos (ϕref ), y 0 = sin (ϕref )
  • This allows the calculation of the phase shift at each rotation and its use to calculate the sine and cosine waves as: ϕ i + 1 = ϕ i + Δϕ { cos ϕ i + 1 = cos ϕ i cos ϕ rot sin ϕ i sin ϕ rot sin ϕ i + 1 = cos ϕ i sin ϕ rot + sin ϕ i cos ϕ rot ,
    Figure imgb0032
    with i = 0, ..., ODR - 1.
  • It is to be understood that cos(ϕrot ) = xrot and sin(ϕrot ) = yrot, keeping in mind that ϕrot is known as being ϕrot = 360°/ODR, with ODR being 16 in this example. Therefore, using the known values of cos(ϕrot ) and sin(ϕrot ), and the known initial point P 0 (x 0; y 0), the data points used to form the sine and cosine waves shown in Figure 5 can be determined.
  • Figure 5 shows rotation-matrix generated reference signal(s) using a phase angle of 60 degrees and a reference frequency Fref of 20kHz.
  • The advantage of this technique is that the generation of sine and cosine wave is performed without approximations and is performed simply (that is, using only multiplicative terms which are already precalculated as xrot, yrot and the initial phase-point P 0 whose coordinates may be expressed as (x 0; y 0) = (cos(ϕref ); sin(ϕref )). Therefore, the values of the reference cosine wave xref and reference sine wave yref, as used by the multiplication circuits 102 and 104 described above, have been determined through this technique, using simple and computationally less intensive trigonometry, allowing the performance of the estimation techniques discussed above by fixed-point calculation hardware that does not consume much area. Stated another way, using this technique to calculate the values of the reference cosine wave and reference sine wave, the physical area of the circuitry required to generate the reference cosine and sine waves is reduced as compared to the prior art.
  • Additionally, the precision of this technique for calculating the values of the reference sine and cosine waves is high. Consider that if the output data rate ODR were to be infinite, there would be an infinite number of values produced for the reference cosine and sine waves, and therefore such waves would precisely mathematically match actual-continuous waves. On the other hand, if a prior art technique such as the Taylor series were to be used, such precision could never be achieved, as Taylor series always produces an approximation.
  • The spectrum of the generated reference sine wave may be observed in Figure 6.
  • Figure 6 shows a comparison between the spectra of the sinewave reference for a phase angle of 60 degrees and a number of bits Nbits equal to 12.
  • Here, the frequency of the drive signal Drv (shown as Fref) is 20 kHz, and therefore the frequency of the reference sine wave is 20 kHz. However, harmonics occur due to the quantization of the reference sine wave, with the amplitude of the harmonics being dependent upon the number of bits available for the calculations The effect of these harmonics and how to handle them will be explained in detail later herein.
  • Figure 7 shows low-pass filter (briefly, LPF) output for different references with phase sweep, specifically using a number of samples of 16 samples per cycle (top portion of the figure) or a number of samples of 160 samples per cycle (bottom portion of the figure).
  • Shown in Figure 7 is a comparison of the output of the low- pass filters 103 and 105 when using sinusoidal reference waves as compared to square or triangular reference waves for the case of ODR being 16, as well as for the case of ODR being 160. The theoretical scaling factor for the reference sine wave is Aref/2, for the square wave is 2·Aref/π, and for the triangular wave is 2·Aref/π2. As can be observed in Figure 7, with a low sampling frequency (e.g., ODR=16), both the square wave and the triangular wave cannot be perfectly reproduced because they are not band-limited. As such, in the digital domain, all the infinite harmonics within the bandwidth cannot be included due to the Nyquist limit. Sine waves, on the other hand, are band-limited and so can be perfectly reproduced even when low sampling frequencies are available. The result of using either square or triangular wave as reference instead of sinusoids is that the scaling factor would be different than its theoretical value, with this effect being even more pronounced for the square wave since the harmonics decrease as 1/n for the square wave but 1/n2 for the triangular wave. This would ultimately lead to increased error in the estimation of the phase shift and amplitude of the sense signal Sns. Furthermore, if a square wave or triangular wave were used as the reference wave, harmonics carried by the sense signal Sns would also be demodulated, adding more information to the output that is not information about the fundamental components of the sense signal Sns. Therefore, the generation of reference sinusoidal waves is used herein.
  • Estimation of the phase Δϕ by the feedback circuitry 101 is now described. As a reminder, the sense signal Sns can be mathematically represented as: sense t = A sense sin ω sense t + ϕ sense + OS sense
    Figure imgb0033
  • Here, OSsense is the offset that might appear as an additive term in the sense signal Sns.
  • As explained above, the generation of the reference cosine and sine reference signals undesirably includes harmonics due to both quantization and limited ODR. As a result, for example, the cosine reference signal can be mathematically represented as: cos ref t = cos ω ref t + ϕ ref + A ref cos 2 ω ref t + ϕ ref +
    Figure imgb0034
  • Here, the A'ref · cos(2ωref · t + ϕ'ref ) term and those following represent the harmonics present due to quantization. The calculation of y(t) then yields: y t = sense t cos ref t = A sense 2 sin Δϕ + sin 2 ω ref t + ϕ sense + ϕ ref + A ref A sense 2 sin 3 ω ref t + ϕ sense + ϕ ref + sin ω ref t + ϕ sense + ϕ ref + + OS sense 2 cos ω ref t + ϕ ref +
    Figure imgb0035
  • This yields the desired fundamental components of the sense signal Sns, namely the A ref 2
    Figure imgb0036
    and sin(Δϕ) terms, but also undesired intermodulation products (the other terms) that arise due to the difference between ωsense and ωref, 2ωref, etc.
  • Similarly, the sine reference signal can be mathematically represented as: sin ref t = sin ω ref t + ϕ ref + A ref sin ω ref t + ϕ ref +
    Figure imgb0037
  • The calculation of x(t) then yields: x t = sense t sin ref t = A sense 2 cos Δϕ cos 2 ω ref t + ϕ sense + ϕ ref + A ref A sense 2 cos 3 ω ref t + ϕ sense + ϕ ref + cos ω ref t + ϕ sense + ϕ ref + + OS sense 2 sin ω ref t + ϕ ref +
    Figure imgb0038
  • Here too, this yields the desired fundamental components of the sense signal Sns, namely the A ref 2
    Figure imgb0039
    and cos(Δϕ) terms, but also undesired intermodulation products (the other terms) that arise due to the difference between ωsense and ωref , 2ωref , etc.
  • Figures 8 and 9 show power spectral density (briefly, PSD) plots for the product signals.
  • The results of the multiplications may be seen for the sample of the cosine reference wave in Figure 8, where the desired data (that is the DC component) can be observed together with the intermodulation products (starting shortly before a frequency of 104 Hz), and for the sample of the sine reference wave in Figure 9, wherein the desired data (again, the DC component) can be observed together with the intermodulation products (also starting shortly before a frequency of 104 Hz).
  • It is desired to cancel out these resulting intermodulation components in x(t) and y(t). To do this, the low- pass filters 103 and 105 should have zeroes at harmonics in the reference signals, as shown in Figure 10, to thereby filter out the intermodulation components.
  • Figure 10 shows a frequency response of a by-16 decimating SINC filter for the lock-in amplifier (briefly, LIA).
  • Since the reference sine and cosine signals are internally generated, their spectrum is known, and therefore the proper placement of the zeroes can easily be determined. For example, the zeroes are placed at ωref, 2ωref, 3ωref , etc., because those are the expected location of the harmonics given that ωref is known. The filters 103 and 105 may therefore be suitable ODR-decimation SINC filters.
  • Figures 11A shows a PSD diagram for the product signals (input x reference).
  • The inputs x(t) and y(t) to the filters 103 and 105 can be observed in Figure 11A, and the outputs of X and Y can be observed in Figure 11B.
  • Figure 11B shows the signals output of the filters of the lock-in amplifier (briefly, LIA).
  • After filtering, X thus becomes: X = < x t > = A sense 2 cos Δϕ
    Figure imgb0040
  • After filtering, Y thus becomes: Y = < y t > = A sense 2 sin Δϕ
    Figure imgb0041
  • From X and Y, Asense and Δϕ can be recovered. For instance, this could be computed in the digital domain. This could be performed mathematically in the digital domain as: A sense = 2 X 2 + Y 2 ;
    Figure imgb0042
    and Δϕ = tan 1 Y X
    Figure imgb0043
  • This would be easily performable in the case where the amplitude and phase estimation block 106 are implemented in a microprocessor. However, consider the case where the amplitude and phase estimation block 106 is to be implemented in a small application specific integrated circuit (briefly, ASIC) with low-power consumption and small area constraints, with poor computational abilities. In such a case, the above calculations of Asense and Δϕ cannot be easily performed without modifying the constraints of the ASIC.
  • The implementation of the functions of the amplitude and phase estimation block 106 utilizing techniques easily performable by a small ASIC with low-power consumption and small area constraints is now described.
  • Consider the COordinate Rotation DIgital Computer (briefly, CORDIC) technique, a simple and efficient technique that can be used to calculate trigonometric functions, hyperbolic functions, square roots, multiplications, divisions, exponentials, and logarithms, using only computationally un-intensive subtraction and shift operations of the implementing ASIC. The starting point for the application of CORDIC to amplitude and phase estimation is the rotation matrix M, which is mathematically equivalent to X and Y described above, and can be represented as: M = cos Δϕ sin Δϕ sin Δϕ cos Δϕ
    Figure imgb0044
  • Starting from the rotation matrix M, factorization by cos (Δϕ) can be performed to yield: M = cos Δϕ 1 tan Δϕ tan Δϕ 1
    Figure imgb0045
  • The idea is to achieve Δϕ through successive approximations obtained by a linear combination of N precalculated angles θi , with the angles θi being chosen such that their tangent values are powers of 2, such that tan (θi ) = 2-i . This reduces the matrix to a form where iterations can be calculated using shifts rather than multiplications.
  • Through this technique, Δϕ is ultimately computed as: Δϕ i = 0 N 1 σ i θ i
    Figure imgb0046
    , where σi is +1 or -1 depending upon the sign of the y i-1 component of the rotation vector at the previous iteration.
  • This would work well if: Δϕ π 2 , π 2
    Figure imgb0047
  • However, for a 4-quadrant application, modifications are to be made.
  • Refer now to the trigonometric circle shown in Figure 12A, where a first point or vector P 0 having the cosine, sine coordinates of (x 0, y 0) is shown, as is a second point or vector P 1 having the cosine, sine coordinates of (x 1, y 1) is shown. These points are the output of the filters 103 and 105 at the beginning and after the first CORDIC iteration respectively - note that P 0 is therefore calculated as A sense 2 cos Δϕ , A sense 2 sin Δϕ
    Figure imgb0048
    . The angular distance between the vector P 0 and the x-axis is the Δϕ that it is desired to recover.
  • This is performed by successive approximation using the rotation matrix M. For example, for iteration i=1, P 0 can be rotated by θ 1 to reach P 1, as shown in FIG. 12A. For the next iteration, i=2, P 1 can be rotated by θ 2 to reach P 2, having the cosine, sine coordinates of (x 2, y 2), as shown in Figure 12B. For the next iteration, i=3, P 2 can be rotated by θ 3 to reach P 3, having the cosine, sine coordinates of (x 3, y 3), as shown in Figure 12C. This can be extended to subsequent iterations i=4,...,N-1. For the Nth and last iteration, i=N, PN is on the x-axis and has coordinates of (xn, 0).
  • This has been a series of approximated rotations by ±θi , ±θ i+1, ±θ i+2, ±θ i+3, etc (with the actual signs of each rotation depending on the starting point as well as being decided at each iteration), up until the last point which will have approximately a 0 phase with an accuracy that depends on the number of iterations N (algorithmic error) and the fixed-point implementation. If these rotations are summed, the result will be a composition of angles that yield Δϕ.
  • Thus, the technique has started with a vector that is Δϕ degrees away from the x-axis, and at each iteration (±θi , ±θ i+1, ±θ i+2, ±θ i+3, etc), the resulting phase becomes closer to 0. Thus, Δϕ is approximated by summation of σiθi from 0 to N-1, with σi being +1 or -1 dependent upon the y i-1 component of the rotation vector at the previous iteration, and with θi being the rotation angle at each iteration. So, θi is the angle whose tangent is 2-i . Thus, Δϕ is recomposed by as the series of smaller angles that when combined together with the appropriate sign, with the rotations being performed with the tangents of those angles, which are powers of 2 as explained. Therefore, this becomes multiplications by powers of 2, which are implemented as shifts, and shifts as explained above are efficient in terms of computational complexity and are capable of being performed by simple ASICS.
  • The successive approximation can be summed up as follows:
    1. 1. The starting point is the X, Y coordinates from the outputs of the filters 103 and 105, mathematically represented as A sense 2 cos Δϕ , A sense 2 sin Δϕ
      Figure imgb0049
      , as explained above
    2. 2. If X>=0, set Δθ=0 and go to the next step. Instead, If X<0, then if Y>0 set Δθ = +180, else set Δθ = -180. Also, rotate the starting X,Y coordinates by 180° by setting X=-X and Y=-Y.
    3. 3. Start from Δθi from step 2., and repeat from i=0 to N-1: If Y 0 , { X = X Y i Y = Y + X i Δθ = Δθ θ i
      Figure imgb0050
      If Y > 0 , { X = X + Y i Y = Y X i Δθ = Δθ + θ i
      Figure imgb0051
  • The phase contributions of the partial angles Δθ are recorded in a lookup table. The lookup table is used together with the starting point X, Y and the described operations are performed at each iteration. After an infinite number of iterations, the phase will be exactly at 0. It has been found that 12 to 18 iterations provide sufficient accuracy for the laser scanning projector 100.
  • After the last iteration, Δϕ and Asense are determined as: Δϕ Δθ ,
    Figure imgb0052
    Asense = K · X, where K depends on N and is known a priori as: 2 · i = 0 N 1 cos θ i
    Figure imgb0053
    .
  • Using the above techniques, because the phase and amplitude (which is indicative of the opening angle of the MEMS mirror) are known upon commencement of operation, proper settings for Fdrive and Vdrive are quickly determined, making calibration quick and easy. Thus, in addition to reducing the computational complexity utilized for proper control of the MEMS mirror 11, lock time is decreased due to the quick determination of proper settings for Fdrive and Vdrive. Moreover, the amplitude and phase estimation are run in parallel and so are both control loops. Additionally, since the phase estimation is not limited by the resolution of the PLL counts, the above techniques are usable even with mirrors having a high resonance frequency, and in fact, are usable with any resonance MEMS device and are not limited to MEMS mirrors. Still further, the stability of the output provided here is more stable than would be provided by any analog control because analog lock-in amplifiers, though still implemented, suffer from technological and physical limitations (e.g., temperature deviation from the transistors used for demodulation, non-linearities, etc) which digital implementations are insensitive to. In addition, the reference signal generation is reliable as it is based on using the same clock source as other components within the device.
  • The described functions and blocks of the feedback circuit 101 may be performed by a field programmable gate array (briefly, FPGA) or application specific integrated circuit (briefly, ASIC), for example.
  • Note that the above scheme permits precise control of the MEMS mirror 11 through the described hardware performing the described functions, and that the above scheme reduces the computational resources utilized to obtain precise control of the MEMS mirror 11 (e.g., reduces computational intensity of the functions performed that are used to precisely control the MEMS mirror 11).
  • Finally, it is clear that modifications and variations may be made to what has been described and illustrated herein, without thereby departing from the scope of this disclosure, as defined in the annexed claims.
  • While the disclosure has been described with respect to a limited number of embodiments, those skilled in the art, having benefit of this disclosure, will appreciate that other embodiments can be envisioned that do not depart from the scope of the disclosure as disclosed herein. Accordingly, the scope of the disclosure shall be limited only by the attached claims.

Claims (15)

  1. A method of operating a micro-electro mechanical systems, MEMS device (11), the method comprising:
    generating (97) a reference cosine wave (cos) and a reference sine wave (sin), the reference cosine wave (cos) and reference sine wave (sin) each having an unitary amplitude and a same frequency as that of a sense signal (Sns) indicative of movement of the MEMS device (11);
    multiplying (102) the sense signal (Sns) by the reference sine wave, producing a first product signal (x(t)) as a result;
    multiplying (104) the sense signal (Sns) by the reference cosine wave (cos), producing a second product signal (y(t)) as a result;
    filtering (103) the first product signal (x(t)), producing a first intermediate output signal (X) as a result;
    filtering (105) the second product signal (y(t)), producing a second intermediate output signal (Y) as a result; and
    performing a processing technique (106) on the first (X) and second (Y) intermediate output signals, thereby determining a phase shift (Δcp) between the sense signal (Sns) and the drive signal (Drv) as well as an amplitude (Asense) of the sense signal (Sns);
    comparing (22) the phase shift (Δcp) to a target phase shift (ϕtarget), producing a phase error (ϕerror) as a difference therebetween;
    comparing (32) the amplitude (Asense) of the sense signal (Sns) to a target amplitude (Atarget), thereby producing an amplitude error (Aerror) as a difference therebetween; and
    modifying (Fdrive, Vdrive) a drive signal (Drv) for the MEMS device (11) based upon the phase error (ϕerror) and the amplitude error (Aerror) so that the phase error (ϕerror) and amplitude error (Aerror) are eliminated as a result.
  2. The method of claim 1, further comprising digitizing (96) the sense signal (Sns) prior to multiplication (102, 104) by the reference sine and cosine waves (sin, cos), wherein the reference sine and cosine waves (sin, cos) are generated (97) in digital form.
  3. The method of claim 1, wherein:
    - filtering (103) the first product signal (x(t)) is configured to remove intermodulation components from the reference sine wave (sin); and
    - filtering (105) the second product signal (y(t)) is configured to remove intermodulation components from the reference cosine wave (cos).
  4. The method of claim 1, wherein:
    - filtering (103) the first product signal (x(t)) is performed using a first decimation filter, and
    - filtering (105) the second product signal (y(t)) is performed using a second decimation filter.
  5. The method of any of the previous claims, comprising:
    driving (12) the MEMS device (11) with a drive signal (Drv);
    sensing (13) movement of the MEMS device (11) caused by the drive signal (Drv) and generating the sense signal (Sns) indicative of the sensed movement of the MEMS device (11);
    using a rotation-matrix approach (97) to generate the reference cosine wave (cos) and the reference sine wave (cos);
    low-pass filtering (103) the first product signal (x(t)) to produce a first intermediate output signal (X);
    low-pass filtering (105) the second product signal (y(t)), to produce a second intermediate output signal (Y);
    performing a 4-quadrant CORDIC processing technique (106) on the first (X) and second (Y) intermediate output signals, thereby determining the phase shift (Δcp) between the sense signal (Sns) and the drive signal (Drv) as well as the amplitude (Asense) of the sense signal (Sns).
  6. The method of claim 5, wherein: the low-pass filtering (103) of the first product signal (x(t)) is performed using a first decimation SINC filter, and- the second low-pass filtering (105) of the second product signal (y(t)) is performed using a second decimation SINC filter.
  7. The method of claim 5, wherein performing the 4-quadrant CORDIC processing technique (106) comprises:
    a) defining an index i having integer values ranging from 0 to N-1, with N being a total amount of CORDIC iterations of performing the 4-quadrant CORDIC processing technique (106);
    b) pre-calculating N angles θi such that for each of the N angles tan (θi ) = 2-i ;
    c) determining a starting coordinate set X0, Y0 from the first and second intermediate output signals X, Y;
    d) if X>=0, setting Δθ=0 as a starting point, else if X<0, then if Y>0 setting Δθ = +180, else setting Δθ = -180 also, rotating the starting coordinates X0, Y0 by 180° by setting X0=-X0 and Y0=-Y0;
    e) for a first number i=0 in the index, setting a next coordinate set X1, Y1 to be such that X1=X0-(Y0 >> 0) and Y1=Y0+(X0 >> 0) and determining a phase Δθ = Δθ - θi if Y0 ≤ 0, while setting the next coordinate set X1,Y1 to be such that X1=X0+(Y0 >>0) and Y1=Y0-(X0 >>0)and determining the phase Δθ = Δθ + θi , if Y0 > 0;
    f) incrementing the index i by one;
    g) for an i-th number i in the index, setting a next coordinate set Xi, Yi to be such that Xi+1=Xi-(Yi >> i) and Yi+1=Yi+(Xi >> i) and determining a phase Δθ = Δθ - θi if Yi ≤ 0, while setting the next coordinate set Xi+1,Yi+2 to be such that Xi+1=Xi+(Yi >>i) and Yi+1=Yi-(Xi >>i) and determining the phase Δθ = Δθ + θi , if Yi > 0;
    h) if i<N-1, return to f); and
    i) if i=N-1:
    determining the phase shift (Δcp) as being equal to the phase Δθ and
    determining the amplitude (Asense) of the sense signal (Sns) as being equal to K·XN-1, where K = 2 i = 0 N 1 cos θ i
    Figure imgb0054
    .
  8. The method of claim 5, wherein the rotation-matrix approach (97) comprises:
    a) defining an index i having integer values ranging from 0 to N-1, with N being a number of samples per reference cycle;
    b) determining a rotation amount as being equal to 360°/N and pre-calculating the rotation coordinates (x_rot; y_rot)=(cos(360/N); sin(360/N));
    c) determining a starting coordinate set X0, Y0, where x 0 = cos (ϕref ), y 0 = sin (ϕref ), with ϕref being equal to the initial phase shift for the reference waves (sin, cos);
    d) rotating the start coordinate set X0, Y0 by the rotation amount to produce a next coordinate set X1, Yias X1 = X 0 · xrot - Y 0 · yrot and Y 1 = X 0 · yrot + Y 0 · xrot ;
    e) incrementing i by 1;
    f) rotating the coordinate set X1, Y1 by the rotation amount to produce an i-th coordinate set Xi, Yi as X i+1 = Xi · xrot - Yi · yrot and Y i+1 = Xi · yrot + Yi · xrot ;
    g) if i<N-1, returning to e); and
    h) if i=N-1, resetting the index i to 0, and starting over from c).
  9. A system (100) for driving micro-electro mechanical systems, MEMS device (11), the system (100) comprising:
    a driver (12) generating a drive signal (Drv) for the MEMS device (11);
    a sensor (13) associated with the MEMS device (11) and generating an output (Sns) indicative of movement of the MEMS device (11);
    an analog-to-digital converter (96) digitizing the output of the sensor (13) to produce a sense signal (Sns) indicative of movement of the MEMS device (11);
    a reference generator (97) using a rotation-matrix approach to generate a reference cosine wave (cos) and a reference sine wave (sin) based upon a frequency drive signal (Fdrive), the reference cosine wave (cos) and reference sine wave (sin) each having an unitary amplitude and a same frequency as that of the sense signal (Sns);
    a processing circuit (101) configured to:
    multiply (102) the sense signal (Sns) by the reference sine wave, producing a first product signal (x(t)) as a result;
    multiply (104) the sense signal (Sns) by the reference cosine wave, producing a second product signal (y(t)) as a result;
    low-pass filter (103) the first product signal (x(t)), producing a first intermediate output signal (X) as a result;
    low-pass filter (105) the second product signal (y(t)) producing a second intermediate output signal (Y) as a result; and
    perform a 4-quadrant coordinate rotation digital computer, CORDIC processing technique (106) on the first and second intermediate output signals, thereby determining a phase shift (Δcp) between the sense signal (Sns) and the drive signal (Drv) as well as determining thereby an amplitude (Asense) of the sense signal (Sns);
    a first error amplifier (22) comparing the amplitude (Asense) of the sense signal (Sns) to a target amplitude (Atarget), thereby producing an amplitude error (Aerror) as a difference therebetween;
    a second error amplifier (32) comparing the phase shift (Δcp) to a target phase shift (ϕtarget) to produce a phase error (cperror) as a difference therebetween; and
    controller circuitry (23, 33, 24) causing modifying of the drive signal (Drv) based upon the phase error (ϕerror) and the amplitude error (Aerror) so that the phase error (ϕerror) and amplitude error (Aerror) are eliminated as a result.
  10. The system (100) of claim 9, wherein the controller circuitry (23, 33, 24) comprises:
    a phase controller (23) generating a control signal (PLLfrac) based upon the phase error (ϕerror);
    a programmable oscillator (24), generating the frequency drive signal (Fdrive) based upon the control signal (PLLfrac), the driver (12) modifying a phase of the drive signal (Drv) based upon the frequency drive signal (Fdrive) such that the phase error (cperror) is eliminated; and
    an amplitude controller (33) generating a voltage drive signal (Vdrive) and providing it to the driver (12), the voltage drive signal (Vdrive) based upon the amplitude error (Aerror), the driver (12) modifying an amplitude of the drive signal (Drv) based upon the voltage drive signal (Vdrive) such that the amplitude error (Aerror) is eliminated.
  11. The system (100) of claim 9 or claim 10, wherein:
    - the programmable oscillator (24) comprises a phase locked loop, PLL, and/or
    - the processing circuit (101) comprises an application specific integrated circuit, ASIC.
  12. The system (100) of claim 9, wherein:
    - the low-pass filtering (103) of the first product signal (x(t)) performed by the processing circuit (101) is configured to remove intermodulation components from the reference sine wave (sin); and
    - the low-pass filtering (105) of the second product signal (y(t)) performed by the processing circuit (101) is configured to remove intermodulation components from the reference cosine wave (cos).
  13. The system (100) of claim 9, wherein:
    - the low-pass filtering (103) of the first product signal (x(t)) is performed by the processing circuit (101) using a first decimation SINC filter, and
    - the low-pass filtering (105) of the second product signal (y(t)) is performed by the processing circuit (101) using a second decimation SINC filter.
  14. The system (100) of claim 9, wherein the processing circuit (101) performs the 4-quadrant CORDIC processing technique (106) by:
    a) defining an index i having integer values ranging from 0 to N-1, with N being the total amount of CORDIC iterations;
    b) pre-calculating N angles θi such that for each of the N angles, tan (θi ) = 2-i ;
    c) determining a starting coordinate set X0, Y0 from the first and second intermediate output signals X, Y;
    d) If X>=0, setting Δθ=0 as a starting point, else if X<0, then if Y>0 setting Δθ = +180, else setting Δθ = -180, and rotating the starting X,Y coordinates by 180° by setting X=-X and Y=-Y;
    e) for a first number i=0 in the index, setting a next coordinate set X1, Y1 to be such that X1=X0-(Y0 >> 0) and Y1=Y0+(X0 >> 0) and determining a phase Δθ = Δθ - θi if Y0 ≤ 0, while setting the next coordinate set X1,Y1 to be such that X1=X0+(Y0 >>0) and Y1=Y0-(X0 >>0) and determining the phase Δθ = Δθ + θi , if Y0 > 0;
    f) incrementing the index i by one;
    g) for an i-th number i in the index, setting a next coordinate set Xi, Yi to be such that Xi+1=Xi-(Yi >> i) and Yi+1=Yi+(Xi >> i) and determining a phase Δθ = Δθ - θi if Yi ≤ 0, while setting the next coordinate set Xi+1,Yi+2 to be such that Xi+1=Xi+(Yi >>i) and Yi+1=Yi-(Xi >>i) and determining the phase Δθ = Δθ + θi , if Yi > 0;
    h) if i<N-1, returning to f); and
    i) if i=N-1:
    determining the phase shift (Δcp) as being equal to the phase Δθ and
    determining the amplitude (Asense) of the sense signal (Sns) as being equal to K·XN-1, being K = 2 i = 0 N 1 cos θ i
    Figure imgb0055
    .
  15. The system (100) of claim 9, wherein the processing circuit (101) performs the rotation-matrix approach (97) by:
    a) defining an index i having integer values ranging from 0 to N-1, with N being the number of samples per reference cycle;
    b) determining a rotation amount as being equal to 360°/N and pre-calculating the rotation coordinates (x_rot; y_rot)=(cos(360/N); sin(360/N));
    c) determining a starting coordinate set X0, Y0, where x 0 = cos (ϕref ), y 0 = sin (ϕref ), with ϕref being equal to the initial phase shift for the reference waves (cos, sin);
    d) rotating the start coordinate set X0, Y0 by the rotation amount to produce a next coordinate set X1, Yias X 1 = X 0 · xrot - Y 0 · yrot and Y 1 = X 0 · yrot + Y 0 · xrot ;
    e) incrementing the index i by 1;
    f) rotate the coordinate set X1, Y1 by the rotation amount to produce an i-th coordinate set Xi, Yi as X i+1 = Xi · xrot - Yi · yrot and Y i+1 = Xi · yrot + Yi · xrot ;
    g) if i<N-1, returning to e); and
    h) if i=N-1, resetting the index to 0, and starting over from c).
EP23152162.6A 2022-01-25 2023-01-18 Method to estimate phase and amplitude for control of a resonant mems mirror Pending EP4215974A1 (en)

Applications Claiming Priority (1)

Application Number Priority Date Filing Date Title
US17/583,896 US20230234836A1 (en) 2022-01-25 2022-01-25 Method to estimate phase and amplitude for control of a resonant mems mirror

Publications (1)

Publication Number Publication Date
EP4215974A1 true EP4215974A1 (en) 2023-07-26

Family

ID=84982463

Family Applications (1)

Application Number Title Priority Date Filing Date
EP23152162.6A Pending EP4215974A1 (en) 2022-01-25 2023-01-18 Method to estimate phase and amplitude for control of a resonant mems mirror

Country Status (3)

Country Link
US (1) US20230234836A1 (en)
EP (1) EP4215974A1 (en)
CN (1) CN116506581A (en)

Citations (6)

* Cited by examiner, † Cited by third party
Publication number Priority date Publication date Assignee Title
CN101626220A (en) * 2009-08-03 2010-01-13 浙江大学 Digital lock-in amplifier based on CORDIC algorithm
DE102009058762A1 (en) * 2009-12-14 2011-06-16 Fraunhofer-Gesellschaft zur Förderung der angewandten Forschung e.V. A deflection apparatus for a projection apparatus, a projection apparatus for projecting an image and a method for controlling a deflection apparatus for a projection apparatus
US20130120819A1 (en) * 2011-11-14 2013-05-16 Microvision, Inc. Scanning Projector with Non-Rectangular Display
WO2015155044A1 (en) * 2014-04-09 2015-10-15 Eth Zurich Method and device for multiple-frequency tracking of oscillating systems
EP3121709A1 (en) * 2015-07-24 2017-01-25 Universität Basel Algorithm for phase computation in lock-in technique
JP2017203840A (en) * 2016-05-10 2017-11-16 株式会社ディスコ Laser processing device

Patent Citations (6)

* Cited by examiner, † Cited by third party
Publication number Priority date Publication date Assignee Title
CN101626220A (en) * 2009-08-03 2010-01-13 浙江大学 Digital lock-in amplifier based on CORDIC algorithm
DE102009058762A1 (en) * 2009-12-14 2011-06-16 Fraunhofer-Gesellschaft zur Förderung der angewandten Forschung e.V. A deflection apparatus for a projection apparatus, a projection apparatus for projecting an image and a method for controlling a deflection apparatus for a projection apparatus
US20130120819A1 (en) * 2011-11-14 2013-05-16 Microvision, Inc. Scanning Projector with Non-Rectangular Display
WO2015155044A1 (en) * 2014-04-09 2015-10-15 Eth Zurich Method and device for multiple-frequency tracking of oscillating systems
EP3121709A1 (en) * 2015-07-24 2017-01-25 Universität Basel Algorithm for phase computation in lock-in technique
JP2017203840A (en) * 2016-05-10 2017-11-16 株式会社ディスコ Laser processing device

Non-Patent Citations (2)

* Cited by examiner, † Cited by third party
Title
HOFMANN M ET AL: "Implementation of a dual-phase lock-in amplifier on a TMS320C5515 digital signal processor", EDUCATION AND RESEARCH CONFERENCE (EDERC), 2012 5TH EUROPEAN DSP, IEEE, 13 September 2012 (2012-09-13), pages 20 - 24, XP032777768, ISBN: 978-1-4673-4595-8, [retrieved on 20130613], DOI: 10.1109/EDERC.2012.6532217 *
POIK MATHIAS ET AL: "A Mechatronic Lock-In Amplifier: Integrating Demodulation in Sensor Electronics for Measuring Mechanical Oscillations", IEEE TRANSACTIONS ON INSTRUMENTATION AND MEASUREMENT, IEEE, USA, vol. 70, 24 December 2020 (2020-12-24), pages 1 - 8, XP011833088, ISSN: 0018-9456, [retrieved on 20210121], DOI: 10.1109/TIM.2020.3047208 *

Also Published As

Publication number Publication date
CN116506581A (en) 2023-07-28
US20230234836A1 (en) 2023-07-27

Similar Documents

Publication Publication Date Title
US7843627B2 (en) Coherent demodulation with reduced latency adapted for use in scanning probe microscopes
US7061276B2 (en) Digital phase detector
US8416121B2 (en) Narrow-band wide-range frequency modulation continuous wave (FMCW) radar system
US10649095B2 (en) Method and apparatus for joint data-pilot tracking of navigation signal
US7760128B1 (en) Decreasing range resolution of a SAR image to permit correction of motion measurement errors beyond the SAR range resolution
JPH10133619A (en) Method and device for adjusting dot clock signal
EP4215974A1 (en) Method to estimate phase and amplitude for control of a resonant mems mirror
US4125817A (en) Method for stabilizing the mean-frequency and modulation slope of a phase-keyed oscillator
WO2021073461A1 (en) Modulator, demodulator, and wireless communication system
JP2016161530A (en) Resolver device
US6804042B2 (en) Method for producing highly accurate frequency and FM of a laser
JPH03128550A (en) Method and device for orthogonal detection
JP7408786B2 (en) laser measurement system
US9715741B2 (en) Method for evaluating spline parameters for smooth curve sampling
CN109147059A (en) A kind of determination method and apparatus for the numerical value that is delayed
CN100433799C (en) Apparatus and method for camera shake correction and recording medium recording camera shake correcting program
US5004344A (en) Apparatus and method for correcting ring laser gyroscope phase errors at turnaround
EP2414916B1 (en) System for demodulating a signal
Ye et al. Resolving time-varying attitude jitter of an optical remote sensing satellite based on a time-frequency analysis
WO2007114523A1 (en) Digital processing apparatus
CN114111797B (en) Kalman filter, IP core and navigation chip based on FPGA
US6647080B1 (en) Carrier phase initialization with sub-LSB accuracy
Alexiadis et al. PLL powered, real-time visual motion tracking
KR102051820B1 (en) Apparatus for detecting rotation angle of a asynchronous resolver and Method thereof
Mandal et al. Implementation of coordinate rotation algorithm for Digital Phase Locked Loop system in in-phase and quadrature channel signal processing

Legal Events

Date Code Title Description
PUAI Public reference made under article 153(3) epc to a published international application that has entered the european phase

Free format text: ORIGINAL CODE: 0009012

STAA Information on the status of an ep patent application or granted ep patent

Free format text: STATUS: THE APPLICATION HAS BEEN PUBLISHED

AK Designated contracting states

Kind code of ref document: A1

Designated state(s): AL AT BE BG CH CY CZ DE DK EE ES FI FR GB GR HR HU IE IS IT LI LT LU LV MC ME MK MT NL NO PL PT RO RS SE SI SK SM TR

STAA Information on the status of an ep patent application or granted ep patent

Free format text: STATUS: REQUEST FOR EXAMINATION WAS MADE

17P Request for examination filed

Effective date: 20240118

RBV Designated contracting states (corrected)

Designated state(s): AL AT BE BG CH CY CZ DE DK EE ES FI FR GB GR HR HU IE IS IT LI LT LU LV MC ME MK MT NL NO PL PT RO RS SE SI SK SM TR