EP4208085B1 - Verfahren und vorrichtung zur erkennung von schlafstörungsereignissen aus einem signal, das einen peripheren arteriellen ton einer person anzeigt - Google Patents
Verfahren und vorrichtung zur erkennung von schlafstörungsereignissen aus einem signal, das einen peripheren arteriellen ton einer person anzeigt Download PDFInfo
- Publication number
- EP4208085B1 EP4208085B1 EP21765586.9A EP21765586A EP4208085B1 EP 4208085 B1 EP4208085 B1 EP 4208085B1 EP 21765586 A EP21765586 A EP 21765586A EP 4208085 B1 EP4208085 B1 EP 4208085B1
- Authority
- EP
- European Patent Office
- Prior art keywords
- amplitude
- event
- signal
- vasoconstriction
- baseline
- Prior art date
- Legal status (The legal status is an assumption and is not a legal conclusion. Google has not performed a legal analysis and makes no representation as to the accuracy of the status listed.)
- Active
Links
Images


Classifications
-
- A—HUMAN NECESSITIES
- A61—MEDICAL OR VETERINARY SCIENCE; HYGIENE
- A61B—DIAGNOSIS; SURGERY; IDENTIFICATION
- A61B5/00—Measuring for diagnostic purposes; Identification of persons
- A61B5/145—Measuring characteristics of blood in vivo, e.g. gas concentration or pH-value ; Measuring characteristics of body fluids or tissues, e.g. interstitial fluid or cerebral tissue
- A61B5/1455—Measuring characteristics of blood in vivo, e.g. gas concentration or pH-value ; Measuring characteristics of body fluids or tissues, e.g. interstitial fluid or cerebral tissue using optical sensors, e.g. spectral photometrical oximeters
- A61B5/14551—Measuring characteristics of blood in vivo, e.g. gas concentration or pH-value ; Measuring characteristics of body fluids or tissues, e.g. interstitial fluid or cerebral tissue using optical sensors, e.g. spectral photometrical oximeters for measuring blood gases
-
- A—HUMAN NECESSITIES
- A61—MEDICAL OR VETERINARY SCIENCE; HYGIENE
- A61B—DIAGNOSIS; SURGERY; IDENTIFICATION
- A61B5/00—Measuring for diagnostic purposes; Identification of persons
- A61B5/02—Detecting, measuring or recording for evaluating the cardiovascular system, e.g. pulse, heart rate, blood pressure or blood flow
- A61B5/02007—Evaluating blood vessel condition, e.g. elasticity, compliance
-
- A—HUMAN NECESSITIES
- A61—MEDICAL OR VETERINARY SCIENCE; HYGIENE
- A61B—DIAGNOSIS; SURGERY; IDENTIFICATION
- A61B5/00—Measuring for diagnostic purposes; Identification of persons
- A61B5/02—Detecting, measuring or recording for evaluating the cardiovascular system, e.g. pulse, heart rate, blood pressure or blood flow
- A61B5/026—Measuring blood flow
- A61B5/029—Measuring blood output from the heart, e.g. minute volume
-
- A—HUMAN NECESSITIES
- A61—MEDICAL OR VETERINARY SCIENCE; HYGIENE
- A61B—DIAGNOSIS; SURGERY; IDENTIFICATION
- A61B5/00—Measuring for diagnostic purposes; Identification of persons
- A61B5/02—Detecting, measuring or recording for evaluating the cardiovascular system, e.g. pulse, heart rate, blood pressure or blood flow
- A61B5/026—Measuring blood flow
- A61B5/0295—Measuring blood flow using plethysmography, i.e. measuring the variations in the volume of a body part as modified by the circulation of blood therethrough, e.g. impedance plethysmography
-
- A—HUMAN NECESSITIES
- A61—MEDICAL OR VETERINARY SCIENCE; HYGIENE
- A61B—DIAGNOSIS; SURGERY; IDENTIFICATION
- A61B5/00—Measuring for diagnostic purposes; Identification of persons
- A61B5/48—Other medical applications
- A61B5/4806—Sleep evaluation
- A61B5/4818—Sleep apnoea
-
- A—HUMAN NECESSITIES
- A61—MEDICAL OR VETERINARY SCIENCE; HYGIENE
- A61B—DIAGNOSIS; SURGERY; IDENTIFICATION
- A61B5/00—Measuring for diagnostic purposes; Identification of persons
- A61B5/68—Arrangements of detecting, measuring or recording means, e.g. sensors, in relation to patient
- A61B5/6801—Arrangements of detecting, measuring or recording means, e.g. sensors, in relation to patient specially adapted to be attached to or worn on the body surface
- A61B5/6813—Specially adapted to be attached to a specific body part
- A61B5/6825—Hand
- A61B5/6826—Finger
-
- A—HUMAN NECESSITIES
- A61—MEDICAL OR VETERINARY SCIENCE; HYGIENE
- A61B—DIAGNOSIS; SURGERY; IDENTIFICATION
- A61B5/00—Measuring for diagnostic purposes; Identification of persons
- A61B5/72—Signal processing specially adapted for physiological signals or for diagnostic purposes
- A61B5/7235—Details of waveform analysis
- A61B5/7239—Details of waveform analysis using differentiation including higher order derivatives
-
- A—HUMAN NECESSITIES
- A61—MEDICAL OR VETERINARY SCIENCE; HYGIENE
- A61B—DIAGNOSIS; SURGERY; IDENTIFICATION
- A61B5/00—Measuring for diagnostic purposes; Identification of persons
- A61B5/72—Signal processing specially adapted for physiological signals or for diagnostic purposes
- A61B5/7235—Details of waveform analysis
- A61B5/7246—Details of waveform analysis using correlation, e.g. template matching or determination of similarity
-
- A—HUMAN NECESSITIES
- A61—MEDICAL OR VETERINARY SCIENCE; HYGIENE
- A61B—DIAGNOSIS; SURGERY; IDENTIFICATION
- A61B5/00—Measuring for diagnostic purposes; Identification of persons
- A61B5/72—Signal processing specially adapted for physiological signals or for diagnostic purposes
- A61B5/7271—Specific aspects of physiological measurement analysis
- A61B5/7282—Event detection, e.g. detecting unique waveforms indicative of a medical condition
Definitions
- Plethysmography is a measurement technique commonly used to monitor changes in blood volume in the macrovascular and the microvascular system of an individual and, more specifically, to monitor changes in the blood volume comprised in the arteries or arterioles.
- the changes in the arterial blood volume are further affected by the contractions of the muscular walls of the arteries or arterioles.
- Monitoring the changes in the arterial blood volume with plethysmography therefore empirically provides information on relative changes in muscle tension or 'tone' of the smooth muscle tissue of the arterioles, also referred to as peripheral arterial tone, PAT.
- VAR venoarteriolar reflex
- the computer-implemented method is capable of detecting sleep-disturbing events from a signal indicative of a peripheral arterial tone, PAT, of an individual affected by a venoarteriolar reflex, VAR.
- the signal may be obtained by conventional, off-the-shelf medical equipment, as long as the obtained signal provides information indicative of the PAT and the effects on the signal caused by the venoarteriolar reflex, VAR.
- Such medical equipment include standard probes employing pneumatic-plethysmography or photo-plethysmography, PPG, probes capable of obtaining a PAT signal affected by VAR.
- the method thus, comprises processing that signal obtained from the PPG probe to derive therefrom sleep-disturbing events. More specifically, the method comprises determining one or more vasoconstriction events from changes in the signal. The method further comprises deriving a reference amplitude value and a baseline amplitude value for the determined vasoconstriction event. The reference amplitude value and the baseline amplitude value are different from each other.
- Relating the reference amplitude value to a baseline amplitude value allows for adequately reducing the effects of more slowly varying, i.e., steady-state changes, observed in the signal.
- Steady-state changes are effects observed in the signal that are varying at a slower rate than the changes of the signal resulting from the vasoconstriction events.
- steady-state changes may, for example, be caused by a venoarteriolar reflex.
- the reference and baseline amplitude values are related to each other such that the steady-changes in the signal are taken into account and, thus, the venoarteriolar reflex, when determining the magnitude of a vasoconstriction event.
- the reference and baseline amplitude values for the vasoconstriction event are preferably derived from a baseline-invariant version of the signal.
- This baseline-invariant signal may be calculated specifically for the vasoconstriction event or for the complete signal. That is, a partial baseline-invariant signal for the vasoconstriction event or a baseline-invariant signal for the complete signal can be calculated.
- the reference amplitude value and the baseline value for the vasoconstriction event are then selected.
- the reference and baseline amplitude values correspond to the amplitude values of characteristics points in the signal for the vasoconstriction event which allow characterization of the vasoconstriction event.
- the selection of the reference and baseline amplitude values is thus preferably done in a way that allows the calculation of the magnitude measure for the vasoconstriction event.
- the baseline-invariant signal is preferably calculated by dividing the obtained signal with a baseline. The dividing can be performed with respect to the portion of the signal corresponding to the vasoconstriction event or the complete signal.
- the baseline-invariant signal for the vasoconstriction event is calculated by dividing the portion of the signal corresponding to the vasoconstriction event with the baseline for the event.
- the baseline is a baseline level which may be a baseline value or a signal portion for the corresponding vasoconstriction event.
- the baseline-invariant signal is obtained by dividing the complete signal with a baseline for the complete signal.
- the baseline is a baseline signal.
- the reference amplitude value and baseline amplitude value are then be derived from the baseline-invariant signal. For example, the maximum amplitude value observed in the portion of the baseline-invariant signal corresponding to the vasoconstriction event can be selected as the reference amplitude value and the mean amplitude value observed in the portion of the baseline-invariant signal corresponding to the vasoconstriction event can be selected as the baseline amplitude value.
- the thus selected reference amplitude value and baseline amplitude value are related to each other to obtain the magnitude measure for the vasoconstriction event.
- the reference amplitude value is related to the baseline amplitude value by calculating, from the reference amplitude value and the baseline amplitude value, an absolute magnitude for the vasoconstriction event.
- the magnitude for the vasoconstriction event can be derived, for example, as the difference between them.
- the thus calculated magnitude measure is an absolute value that allows quantifying the intensity of the vasoconstriction event on an absolute scale.
- the baseline for the vasoconstriction event is preferably derived by calculating an envelope of the signal. Calculating the envelope of the signal allows extracting the venoarteriolar reflex observed in the signal. In other words, the calculated signal's envelope characterizes the venoarteriolar reflex throughout the complete signal. A peak envelope, a troughs envelope, a peak-to-troughs average envelope, a percentile value-based envelope, or a smoothed version of the signal can, for example, be calculated and used as the envelope of the signal.
- an amplitude value for the vasoconstriction event may be calculated which can be used as a baseline for the vasoconstriction event. For example, a peak amplitude, a through amplitude, a peak-to-trough average amplitude, or a percentile value for the vasoconstriction event can be calculated and used as the baseline for the vasoconstriction event.
- the reference amplitude value and the baseline amplitude value for the vasoconstriction event can be directly derived from the obtained signal. This can be done by, for example, calculating a peak amplitude, a through amplitude, a peak-to-trough average amplitude, or a percentile value for the vasoconstriction event directly from the obtained signal.
- These amplitude values may serve as a baseline amplitude value or a reference amplitude value for the vasoconstriction event as long as the baseline and reference amplitude values are selected to differ from one another.
- the peak amplitude for the vasoconstriction event can be selected as the reference amplitude value and any of other amplitude values characterizing the vasoconstriction event, i.e., through amplitude, peak-to-though average amplitude, or average amplitude, as the baseline amplitude value.
- the reference amplitude value and baseline amplitude values are then related to each other to obtain the magnitude measure for the vasoconstriction event.
- the reference amplitude value is related to the baseline amplitude value by calculating, from the reference amplitude value and the baseline amplitude value for the vasoconstriction event, a relative magnitude for the vasoconstriction event.
- the relative magnitude for the vasoconstriction event can be derived, for example, as their relative difference or relative change or any other substantially relative magnitude measure.
- The, thus calculated magnitude measure is a relative value that allows quantifying the intensity of the vasoconstriction event on a relative scale.
- the detecting of the sleep-disturbing event preferably comprises identifying a vasoconstriction event characterized by a magnitude measure above a pre-determined value.
- vasoconstriction events with a certain magnitude measure are considered as sleep disturbing events.
- the pre-determined value can be determined based on, for example, measurements obtained during clinical trials. It is preferred that the step of detecting sleep-disturbing events includes using a classifier trained or developed for said detecting. Any conventional classifier, such as a neural network, a decision tree, or a support vector machine, may be trained.
- the step of identifying further takes into account at least one of a duration of the vasoconstriction event, a duration of an amplitude drop period and/or a duration amplitude rise period of the vasoconstriction event, steepness of the amplitude drop period, and/or steepness of the amplitude rise period of the vasoconstriction event.
- the duration of the vasoconstriction event, the duration of the amplitude drop period, and/or the duration of the amplitude rise period are additional measures that can be used to improve the quantification of the intensity of the vasoconstriction event.
- the steepness of the amplitude drop and/or the steepness of the amplitude rise are other additional measures that can be also used to improve the quantification of the intensity of the vasoconstriction event. Taking any of these additional measures in combination with the magnitude measure allows quantification of the intensity of the vasoconstriction event in terms of various signal properties and, thus, improving the detection of the sleep-disturbing events and as well as their better characterization.
- the determining of a vasoconstriction event preferably comprises identifying a portion of the signal characterized by an amplitude drop followed by an amplitude increase.
- the method searches for changes in the signal characterized by an amplitude drop followed by an amplitude increase.
- the determining can be performed by any suitable for the purpose signal processing technique.
- the determining further takes into account at least one of a duration of the amplitude drop period and the amplitude rise period of the signal portion, a duration of an amplitude drop period and/or a duration amplitude rise period of the signal portion, steepness of the amplitude drop period, and/or steepness of the amplitude rise period of the signal portion. Taking into account the duration of the amplitude drop and/or rise period, and the steepness of these respective periods allows quantification of the amplitude in terms of various signal properties and, thus, improving the determination of vasoconstriction events from the obtained signal.
- the signal indicative of the peripheral arterial tone of the individual affected by a venoarteriolar reflex is preferably obtained by means of plethysmography.
- Plethysmography allows to obtain a signal, i.e., a plethysmography signal or plethysmogram, which is indicative of the changes in blood volume such as pulsatile blood volume changes, at a selected anatomical location of the patient, for example, a finger, a nostril, an ear, a forehead, the inside of a mouth, a toe, a wrist, an ankle, etc.
- a plethysmography signal can be obtained by so-called plethysmography probes which can employ pneumatic-based or optics-based plethysmography.
- this plethysmography signal empirically provides information on relative changes in the muscle tension or 'tone' of the muscle tissue of the arterioles as well as information on the venoarteriolar reflex, the plethysmography signal allows deriving, therefrom, the signal indicative of changes in peripheral arterial tone which is affected by a venoarteriolar reflex.
- the signal indicative of the peripheral arterial tone is derived from an optical plethysmography signal measured at an investigated volume of the individual and light intensities acquired by means of optical plethysmography at two or more points in time along the optical plethysmography signal.
- changes in arterial blood volume in the investigated volume between the two or more points in time are derived by determining a logarithm or a function approximation thereof of a function of the light intensities, thereby assessing the peripheral arterial tone, PAT, of the individual.
- the logarithm or the function approximation of the function of the light intensities is herein referred to as an evaluation function.
- this evaluation function corresponds to the logarithm of the ratio of the light intensities and the evaluation function depends on one or more of the following: an optical path length; a function of the oxygen saturation estimate or SpO2; and the changes in arterial blood volume in the investigated volume.
- at least one of the points in time corresponds to the diastole in a cardiac cycle of the individual and/or wherein at least one of the points in time corresponds to the systole in a cardiac cycle of the individual.
- an apparatus configured to detect sleep-disturbing events from a signal indicative of a peripheral arterial tone of an individual affected by a venoarteriolar reflex is disclosed characterized by the features of claim 13.
- the apparatus comprises at least one processor and at least one memory including computer program code, where the at least one memory and computer program code are configured to, with the at least one processor, cause the apparatus to perform the steps of the first example aspect.
- a system comprising the apparatus according to the second example aspect.
- the system further comprises a plethysmography probe.
- the plethysmography probe is an optical plethysmography probe which comprises a light source configured to emit light and a sensor configured to collect by optical plethysmography propagated light corresponding to the light being transmitted or reflected when propagating in the investigated volume of the individual at the two or more points in time.
- the sensor is further configured to determine the light intensities of the propagated light at the two or more points in time.
- the probe is further provided with an accelerometer to detect the position of the investigated volume.
- the system can further comprise a wireless transmitter comprising a wireless communication interface, wherein the wireless transmitter is configured to transmit the determined peripheral arterial tone wirelessly for further processing by the apparatus.
- the wireless communication interface is preferably a low-power communication interface, e.g., a Bluetooth Low Energy, BLE, wireless interface.
- BLE Bluetooth Low Energy
- a use of a logarithm or a function approximation thereof for assessing a signal indicative of the peripheral arterial tone, PAT, of an individual monitored by optical plethysmography comprises: obtaining an optical plethysmography signal measured at an investigated volume of the individual and light intensities acquired by optical plethysmography at two or more points in time along the optical plethysmography signal; and determining changes in arterial blood volume in the investigated volume between the two or more points in time by determining a logarithm or a function approximation thereof of a function of the light intensities, thereby assessing PAT of the individual.
- the use of the logarithm or the function approximation allows obtaining a signal indicative of the PAT of an individual based on light intensities measured by means of optical plethysmography.
- a computer program product comprising computer-executable instructions for causing a computer to perform the method according to the first example aspect.
- a computer readable storage medium comprising computer-executable instructions for causing a computer to perform the method according to the first example aspect.
- Such a computer program product and a computer readable storage medium can provide one or more of the advantages with respect to the first example aspect.
- the present disclosure generally relates, amongst others, to a method and an apparatus for assessing a signal indicative of the peripheral arterial tone, PAT, of an individual for detecting sleep-related or, better, sleep-disturbing events. More particularly, the assessment of the signal is performed in such a way as to ensure substantial invariance to any steady-state changes observed in the signal, which may for example be caused by physiological phenomena such as a venoarteriolar reflex, thus ensuring accurate and robust detection of the sleep-disturbing events.
- an investigated volume of an individual is for example a volume defined in an investigated tissue of the individual which is monitored by pneumatic-based or optics-based plethysmography.
- Optical plethysmography is a measurement technique in which emitted light is collected on a sensor by optical plethysmography.
- an investigated volume of an individual is for example a volume defined in an investigated tissue of the individual for which an optical plethysmography signal is acquired.
- the investigated volume is a peripheral tissue volume of the individual.
- the investigated volume is a volume defined in finger, a tip of a finger, a distal end of a digit of the individual, a nostril, an ear, a forehead, the inside of a mouth, a toe, a tip of a toe, a wrist, an ankle of the individual.
- the investigated volume of an individual comprises the skin of the individual comprised in the investigated volume and further comprises the blood volume present in the investigated volume.
- arterial blood volume is to be understood as the arterial blood volume in the investigated volume.
- peripheral arterial tone or PAT is understood as arterial tone changes in investigated arterial beds in the investigated volume of an individual.
- determining pulsatile volume changes in the vascular beds of the investigated volume of the individual allows determining or assessing information indicative for muscle tension or 'tone' of the smooth muscle tissue of the arterioles in the investigated volume and therefore allows determining or assessing peripheral arterial tone which is modulated by the sympathetic nervous system.
- Determining peripheral arterial tone is non-invasive and can for example be used to detect heart diseases, erectile dysfunction, sleep apnea, obstructive sleep apnea, cardiovascular conditions, etc.
- the oxygen saturation estimate or SpO2 or hemoglobin composition corresponds to a fraction of oxygenated hemoglobin related to a total amount of hemoglobin in the arterial blood volume in the investigated volume.
- the oxygen saturation estimate or SpO2 or hemoglobin composition corresponds to a ratio of the concentration of oxygenated hemoglobin on the sum of the concentrations of oxygenated and deoxygenated hemoglobin in the arterial blood volume being monitored in the investigated volume.
- the oxygen saturation estimate or SpO2 or hemoglobin composition corresponds to a ratio of the volume fraction of oxygenated hemoglobin on the sum of the volume fractions of oxygenated and deoxygenated hemoglobin in the arterial blood volume being monitored in the investigated volume.
- deoxygenated hemoglobin is defined as the form of hemoglobin without the bound oxygen, and without any other bound molecule such as for example carbon monoxide, carbon dioxide, or iron.
- oxygenated hemoglobin is defined as the form of hemoglobin with the bound oxygen.
- light emitted by the light sources of an optical plethysmography setup comprises photons that reach the sensor through a probabilistic path of one or multiple scattering events. This optical path is not straight and is often assumed to follow a curved spatial probability distribution. The investigated volume along this curved optical path forms the volume which is sampled or investigated by optical plethysmography.
- one or more changes in arterial blood volume in the investigated volume between the two or more points in time are evaluated, thus assessing PAT of the individual.
- a change in arterial blood volume in the investigated volume between two points in time corresponds to a relative change between the volume of arterial blood present in the investigated volume at a first point in time and the volume of arterial blood present in the investigated volume at a second point in time different from the first point in time.
- a chromophore is a molecular unit that absorbs or scatters light in the investigated volume.
- examples of chromophores are melanin molecules, oxygenated hemoglobin, deoxygenated hemoglobin, etc.
- Equation (3') is equal to Equation (3) up to the constant 1 ln b .
- Equation (4) From Equation (4), it can be seen that the logarithm of the fraction of light intensities at the first point in time and at the second point in time is linearly related to the difference in either volume fraction or concentration of chromophore i between the first point in time and the second point in time.
- Some chromophores remain attached to the epidermis of the individual between the two points in time along the optical plethysmography signal.
- melanin molecules remain fixed to the investigated volume between the two points in time along the optical plethysmography signal.
- the difference in either volume fraction or concentration of such chromophores, such as for example melanin molecules, between the two points in time is therefore null.
- the contribution to the righthand side of Equation (4) of such chromophores is also null.
- the main chromophores of which either the volume fraction or the concentration fluctuates between the two points in time along the optical plethysmography signal are the oxygenated and deoxygenated hemoglobin in the arterial blood volume.
- Equation (10) highlights a term on the left-hand side, referred to as the evaluation function, which shows a linear relationship with:
- ⁇ V bood is a linear proxy for arterial blood volume fluctuations within the investigated volume, and hence corresponds to a measurement of peripheral arterial tone.
- the PAT channel is a signal indicative of the peripheral arterial tone of the investigated volume of the individual.
- the PAT channel signal is thus a signal which can be obtained from the light intensities measured with optical plethysmography and the optical plethysmography signal by determining a logarithm or a function approximation thereof of a function of the light intensities which may be optionally divided by a function which depends on the SpO2, where the function of the light intensities corresponds to a ratio of the light intensities.
- the evaluation function corresponds to the natural logarithm of a function of the light intensities.
- any other evaluation function defined as a function of the light intensities could be used, for example, a linear approximation of the logarithm of a function of the light intensities, or for example a Taylor series approximation of a function of the light intensities, or for example a linear approximation of other base logarithms of a function of the light intensities.
- the evaluation function thus corresponds to a logarithm of a ratio of the light intensities; and the evaluation function depends on one or more of the following:
- At least one of the points in time corresponds to the diastole in a cardiac cycle of the individual and/or wherein at least one of the points in time corresponds to the systole in a cardiac cycle of the individual.
- the volume of arterial blood in the investigated volume of the individual is maximum, resulting in the largest absorption and scattering of light of any point in time within a cardiac cycle, i.e., the period between two heart beats, since hemoglobin is one of the main absorbers and scatters of photons in the investigated volume, hence resulting in the lowest measured light intensity on the sensor of the optical plethysmography setup.
- the volume of arterial blood in the investigated volume of the individual is minimum, resulting in the lowest absorption and scattering of light of any point in time within a cardiac cycle and hence highest measured light intensity on the sensor of the optical plethysmography setup.
- At least one first point in time corresponds for example to the diastole in a first cardiac cycle and/or at least one second point in time corresponds for example to the systole in a second cardiac cycle different from the first cardiac cycle.
- at least one first point in time corresponds for example to the systole in a first cardiac cycle and/or at least one second point in time corresponds for example to the diastole in a second cardiac cycle different from the first cardiac cycle.
- at least one first point in time corresponds for example to the systole or to the diastole in a cardiac cycle and at least one second point in time corresponds to any point in time within the same cardiac cycle or within a different cardiac cycle.
- Optical plethysmography technology uses a simple and non-invasive setup probe or biosensor.
- the optical plethysmography biosensor non-invasively measures pulsatile volume changes in the investigated volume, and thereby assesses PAT, by collecting the optical plethysmography signal.
- the light source is for example a LED or any other suitable light source which can be miniaturized to fit in the optical plethysmography biosensor.
- the wavelength is for example comprised in the red spectrum. Alternatively, the wavelength is comprised in the infra-red spectrum.
- a physical distance between the light sources and the sensor is for example a few millimeters, such as for example less than 3mm.
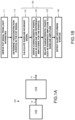
- FIG.1A shows a simplified block scheme of a system according to an example embodiment of the present disclosure.
- the system 100 comprises a device 102 configured to measure fluctuations in arterial blood volume of an investigated volume of an individual by means of optical plethysmography and an apparatus 104 configured to obtain the light intensities measured by the device 102 and to process the obtained light intensities to detect, therefrom, sleep-disturbing events 14.
- the device 102 is for example placed on the finger of an individual.
- the device 102 thus measures the light intensity of the light propagated through the finger of the individual over time.
- the measured light intensities reflect the fluctuations in the arterial blood volume of the individual.
- the measured light intensities empirically provide information on the peripheral arterial tone of the individual.
- the device 102 thus outputs light intensities 12 measured over time reflecting the peripheral arterial tone of the individual.
- the measured light intensities are fed to the apparatus 104.
- the apparatus 104 comprises at least one processor and at least one memory configured to store algorithms to operate the apparatus stored in the form of software or program instructions in the at least one memory.
- the at least one memory may further store any data generated by the apparatus and any other data required for its proper operation. This data may however be stored in another memory external to the apparatus.
- the at least one processor can execute the program instructions stored in the at least one memory and thus controls the operation of the apparatus.
- the apparatus 104 comprises a computing system that comprises hardware and software components for processing the obtained measured light intensities 12 and for determining therefrom sleep-disturbing events 14.
- FIG.1B shows various steps performed by the apparatus 104 to detect sleep-disturbing events 14.
- the peripheral arterial tone signal i.e., the PAT channel signal
- the apparatus 104 obtains the light intensities 12 acquired over time by the device 102 by means of optical plethysmography, for example, at two or more points in time. From the obtained light intensities 12 the apparatus 104 then determines the changes in arterial blood volume in the investigated volume between the two or more points in time.
- vasoconstriction events are determined from the PAT channel signal.
- vasoconstriction events are characterized by fluctuation in the PAT channel signal's amplitude. More specifically, a vasoconstriction event in the PAT channel signal is characterized with an amplitude drop followed by an amplitude increase.
- Vasoconstriction events in the PAT channel signal may be determined by means of any suitable for the purpose signal processing algorithms. Summarized, in this step, the PAT channel signal is segmented into event segments characterized by a drop, followed by an increase in the signal's amplitude.
- Each of these event segments reflects a vasoconstriction, i.e., constriction of the arteries in the investigated volume.
- the event segments correspond to the vasoconstriction events observed in the PAT channel signal.
- These vasoconstriction events may for example be related to sleep-disturbing events such as a respiratory event such as apnea or hypopnea, respiratory-related-arousal event or RERA event, periodic or non-periodic limb movement, bruxism event, or snore.
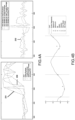
- FIG.2 shows an example of the signal indicative of the peripheral arterial tone, PAT, of the individual with highlighted episodes of sudden arterial tone changes characterized by amplitude decreases followed by amplitude increases. As it can be seen, each of the detected event segments is characterized with an amplitude drop followed by an amplitude increase. The figure further shows that the fluctuations in the peripheral arterial tone of the respective event segments somewhat correlate to the fluctuations in oxygen saturation estimate and the SpO2 of the individual.
- the apparatus proceeds to characterize the respective event segments, i.e., the vasoconstriction events, in terms of characterizing features.
- the characterizing features comprise features such as for example: a magnitude of the event segment, i.e., the difference between the minimum and maximum amplitude values of the event segment; a duration of the event segment; a duration of the amplitude drop period and/or a duration of the amplitude rise period of the event segment; a steepness of the amplitude drop period and/or a steepness of the amplitude rise period of the event segment; the full width at half maximum of the event segment; and so on.
- the characterizing features of the respective event segments need to be calculated so that the effect of the VAR episode on the amplitude in the event segments is substantially reduced.
- the baseline signal is any one of the smoothed signals mentioned above, it is important to ensure that the time-variation, for example, characterized by a time constant, of the smoothed signal is slow enough such that the resulting smoothed signal does not follow the shape of the event segment to such extent that the event segment's or PAT channel signal division by this smoothed signal results in a baseline-invariant signal with significant loss of information pertaining to the morphology of the original event segment.
- the fluctuations in the derived baseline-invariant signal caused by the peripheral arterial tone should be substantially preserved while the fluctuations caused by the VAR episode should be substantially reduced.
- FIG.3 shows an example of the signal indicative of the peripheral arterial tone, PAT, of the individual affected by a VAR episode caused by venous blood pooling triggered by the lowering of the arm of the finger at which the optical plethysmography, PPG, signal is measured below the heart level, and highlights how the PAT channel amplitude is depressed during the VAR. More specifically, the top two plots show how the amplitude of the PPG signal 210 and the amplitude of its filtered and normalized version 220 become depressed during the VAR episode. The third plot shows how the amplitude of the PAT channel 230 derived as illustrated in Equations (11) or (12) drops during the VAR episode.
- the fourth plot shows how dividing each sample of the PAT channel by a baseline value results in a baseline-invariant version of the PAT channel 240 for which the effect of the VAR amplitude modulation is substantially eliminated. From the figure, it can be seen that the amplitude variations caused by the peripheral arterial tone in the event segments 110_1 to 110_3 and 110_n in the original PAT channel 220 and the baseline-invariant version of the PAT channel 240 are preserved while the amplitude modulation caused by the VAR episode is substantially eliminated in the baseline-invariant version of the PAT channel 240.
- FIG.4A illustrates a detailed view of the effect of dividing each sample of the PAT channel signal 230 with the samples of the extracted peak envelope 231, throughs envelope, peaks-throughs average envelope, and a smoothed version of the PAT channel signal.
- the peak or troughs envelope corresponds to the local maxima and local minima amplitude values in the PAT channel signal, while the peak-troughs average envelope corresponds to the mean of the peak and troughs envelope.
- the baseline-invariant signal 232 resulting from dividing the samples of the original PAT channel signal 230 with the upper or lower amplitude, the mean of the upper and lower amplitude, or the amplitude of the smoothed version of the signal substantially eliminates the amplitude depression caused by the VAR, while it maintains the integrity of the morphology and the relative amplitude variations of the respective event segments.
- the apparatus proceeds to characterize the event segments. To do so, the apparatus derives various features characterizing the event segments from the baseline-invariant version of the signal.
- the characterizing features comprise features such as for example: a maximum and/or a minimum amplitude of the event segment, a magnitude of the event segment; a median and/or a mean amplitude of the event segment; a quartile amplitude of the event segment; a duration of the vasoconstriction event; a duration of the amplitude drop period; a duration of the amplitude rise period of the vasoconstriction event; a steepness of the amplitude drop period; a steepness of the amplitude rise period of the vasoconstriction event; the full width at half maximum of the event segment, and so on.
- the apparatus calculates in step 122 various characteristics points from the portion of the baseline-invariant signal corresponding to the event segment.
- the characteristic points are described in terms of amplitude and/or time.
- characteristics points could be the sample of the event segment with the maximum amplitude value, the sample of the event segment with a minimum amplitude value, the first and last samples of the event segment, and so on.
- the apparatus uses the information obtained from the derived characteristic points to derive the various features characterising the event segment.
- the apparatus relates the obtained information to derive the various features.
- the magnitude of the event segment can be calculated as the difference between the maximum and the minimum amplitude values observed in the event segment.
- the magnitude of the amplitude drop of the event segment can be calculated as the difference between the amplitude value of the first sample or the sample with the maximum amplitude value and the amplitude value of the sample with the minimum amplitude value.
- the first sample coincides or substantially coincides with the sample with the maximum amplitude value.
- the first sample or the sample with maximum amplitude value acts as a reference point
- the sample with minimum amplitude value acts as a baseline point
- their respective amplitude values as a reference amplitude value and a baseline amplitude value.
- the duration of the event segment can be calculated as the difference in time between the first and the last samples of the event segment.
- the steepness of the amplitude drop of the event segment can be calculated as the ratio of the amplitude difference and the time difference of the first sample or the sample with the maximum amplitude value and the sample with the minimum amplitude value, and so on.
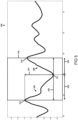
- FIG.5 shows an example of event segment 310 of the baseline-invariant signal 240 illustrating various characteristic points allowing the calculation of various features characterizing the event segment.
- the reference amplitude value and the baseline amplitude values correspond to the signal's samples 313 and 311 with a maximum and minimum amplitude values, respectively.
- the duration 322 of the event segment is identified by the samples 313 and 312 corresponding to the first and the last samples in the event segment.
- the amplitude drop portion of the event segment and the amplitude rise portion of the event segment correspond to the slopes 325 and 326 with respective duration 323 and 324.
- the steepness of the amplitude drop is simplistically illustrated as the absolute magnitude 321 of the amplitude drop.
- the steepness of the amplitude rise period is herein illustrated as the absolute magnitude between the samples 312 and 311.
- the features characterising the event segment on an absolute scale can be derived by relating the amplitude of the signal portion corresponding to the event segment to a baseline level. For example, this can be done by dividing PAT channel signal portion corresponding to an event segment, by a baseline level for the event segment.
- the baseline level for the event segment can be:
- the baseline level for the event segments can be a baseline value or a baseline signal.
- FIG.4B illustrates an example of possible baseline values for two event segments which can be used to relate the amplitude of the event segment to a baseline level, e.g., by dividing the portion of the PAT channel signal by the baseline level corresponding to the event segment.
- each event segment is indicated by a pair of dashed lines.
- the amplitude values indicating the maximum amplitude value, the minimum amplitude value, the mean amplitude value, the median amplitude value, as well as the lower quartile amplitude value, Iqr, and the amplitude values at the maximum and the minimum slope of the event segments, are illustrated.
- step 121 Dividing the portion of the PAT channel signal corresponding to the event segment by the baseline amplitude value for the event segment results in obtaining a baseline-invariant portion for the respective event segment.
- the output in step 121 is the baseline-invariant signal portion for the respective event segments.
- the magnitude of the event segment can be calculated as the difference between the maximum and the minimum amplitude values.
- the magnitude of the amplitude drop of the event segment can be calculated as the difference between the amplitude value of the first sample or the sample with the maximum amplitude value and the amplitude value of the sample with the minimum amplitude value, and so on.
- any magnitude-related characteristic features such as features calculated using one or more amplitude values of the signal portion corresponding to the event segment can be obtained on a relative scale rather than on an absolute scale.
- step 121 is omitted and the apparatus derives the various characteristics features from the original, unmodified PAT channel signal 230 as shown in the third plot of FIG.3 .
- the characteristics features affected by the VAR such as the magnitude and the steepness features, are calculated on a relative scale.
- the characteristic amplitude points for the event segment such as the peak amplitude, the trough amplitude, the peak-to-trough average amplitude, or the percentile value are derived as detailed above with reference to FIG.5 .
- the magnitude of the event segment is derived by, for example, calculating a relative difference between the reference and baseline amplitude values.
- other amplitude-related features characterising the event segment which are derived based on one or more amplitude values derived from the signal portion corresponding to the event segment such as the steepness features can be derived on a relative scale.
- the output of step 120 is, thus, one or more features characterizing the event segments by means of at least a magnitude measure characterizing the intensity of the event segment, and, possibly, one or more additional features such as a duration of the event segment, a duration of the amplitude drop period of the event segment; a duration of the amplitude rise period of the event segment, a steepness of the amplitude drop period of the event segment, a steepness of the amplitude rise period of the event segment, and a full width at half maximum of the event segment.
- the method proceeds to detect sleep-disturbing events 14 based on the determined one or more features characterizing the vasoconstriction events.
- a sleep-disturbing event can be detected for example based on at least the magnitude measure of the vasoconstriction event. If the magnitude measure is above a predetermined threshold value, the vasoconstriction event is considered to be a sleep-disturbing event.
- other features characterizing the vasoconstriction event can be also taken into account. These additional features can further characterize the vasoconstriction event in terms of its morphological profile. A morphological profile may for example be linked to the shape of the vasoconstriction event.
- At least one or a combination of the duration of the event segment, the duration of the amplitude drop period of the event segment; a duration of the amplitude rise period of the event segment, a steepness of the amplitude drop period of the event segment, a steepness of the amplitude rise period of the event segment, and a full width at half maximum of the event segment may be further taken into account.
- a parameterized cost function can be evaluated which takes the considered features into account to evaluate whether a vasoconstriction event is a sleep-disturbing event.
- This step of detecting sleep-disturbing events can be implemented by means of a classifier that has been developed to perform the step for detecting a sleep-disturbing event.
- the classifier thus implements the parameterized cost function by designing and inputting a set of rules for the detection.
- These rules can, as detailed above, be based on threshold values for the respective one or more features or for a respective combination of features that examine how well the features of an event comply with the criteria defined by the rules.
- the threshold values for the respective features can for example be derived based on measurements obtained during a clinical trial. From these measurements, first sleep-disturbing events are identified by means of manual or computer-aided scoring and then threshold values for the respective features are determined from the identified sleep-disturbing events.
- the features can be ordered according to their accuracy in detecting a certain sleep-disturbing event, and then one or more most optimal features can be selected for the detection of a respective sleep-disturbing event. Using only the most optimal features for the detection of the sleep-disturbing events allows simplifying the classifier implementation without sacrificing detection accuracy. The thus developed classifier can then evaluate the parameterized cost function implementing these rules to determine whether an event is a sleep-disturbing event or not.
- the apparatus 104 can further provide an indication of certain medical conditions and physiological states based upon the concurrence of sleep-disturbing events characterized with specific features. For example, by analyzing the concurrence of vasoconstriction events with certain features such as a certain minimum event duration and a certain minimum distance between the minimum and maximum sample value, i.e., the duration of the amplitude drop of the event, and/or features observed in other physiological signals, such as an increase in pulse rate or heart rate and/or a decrease in blood oxygen saturation and/or a limb movement during the event.
- the limb movement can be voluntary or involuntary movement and can for example be picked up by an accelerometer.
- This concurrence of the sleep-disturbing events and the additional physiological features can further aid the medical personnel in determining certain medical conditions and physiological states of the individual.
- FIG.6 illustrates an example of a respiratory event, in this example an apnea event.
- the end-stage of the apnea event coincides with a decrease in the PAT channel signal amplitude and/or an increase in pulse rate, PR, and/or a decrease in SpO 2 .
- the present solution can improve the accuracy of determining various characterizing features from the physiological signal indicative of the peripheral arterial tone and, thus, can improve the accuracy of detecting sleep-disturbing events from such a physiological signal.
- the method can provide an indication of the concurrence of the sleep-disturbing events and, possibly, features observed in other physiological signals to provide additional information which can aid the medical personnel in determining certain medical conditions and physiological states of the individual.
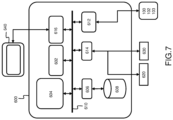
- FIG.7 shows a suitable computing system 600 enabling to implement embodiments of the method for detecting sleep-disturbing events according to the invention.
- Computing system 600 may, in general, be formed as a suitable general-purpose computer and comprise a bus 610, a processor 602, a local memory 604, one or more optional input interfaces 614, one or more optional output interfaces 616, a communication interface 612, a storage element interface 606, and one or more storage elements 608.
- Bus 610 may comprise one or more conductors that permit communication among the components of the computing system 600.
- Processor 602 may include any type of conventional processor or microprocessor that interprets and executes programming instructions.
- Local memory 604 may include a random-access memory, RAM, or another type of dynamic storage device that stores information and instructions for execution by processor 602 and/or a read-only memory, ROM, or another type of static storage device that stores static information and instructions for use by processor 602.
- the processor may thus execute the instructions stored in the local memory to perform various steps of the method described above.
- Input interface 614 may comprise one or more conventional mechanisms that permit an operator or user to input information to the computing device 600, such as a keyboard 620, a mouse 630, a pen, voice recognition, etc. and/or one or more PPG sensors.
- Output interface 616 may comprise one or more conventional mechanisms that output information to the operator or user, such as a display 640, etc.
- Communication interface 612 may comprise any transceiver-like mechanism such as for example one or more Ethernet interfaces that enables computing system 600 to communicate with other devices and/or systems, for example with other computing devices 701, 702, 703. The processing of the signal obtained from the one or more PPG sensors may thus be processed remotely by the other computing devices.
- the communication interface 612 of computing system 600 may be connected to such another computing system by means of a local area network, LAN, or a wide area network, WAN, such as for example the internet.
- Storage element interface 606 may comprise a storage interface such as for example a Serial Advanced Technology Attachment, SATA, interface or a Small Computer System Interface, SCSI, for connecting bus 610 to one or more storage elements 608, such as one or more local disks, for example, SATA disk drives, and control the reading and writing of data to and/or from these storage elements 608.
- storage element(s) 608 above is/are described as a local disk, in general, any other suitable computer-readable media such as a removable magnetic disk, optical storage media such as a CD or DVD, -ROM disk, solid state drives, flash memory cards, ... could be used.
- Computing system 600 could thus correspond to a circuitry for processing the signal obtained from one or more PPG sensors to detect, therefrom, sleep-disturbing events as described above with reference to FIG.1 .
- circuitry may refer to one or more or all of the following:
- circuitry also covers an implementation of merely a hardware circuit or processor (or multiple processors) or portion of a hardware circuit or processor and its (or their) accompanying software and/or firmware.
- circuitry also covers, for example, and if applicable to the particular claim element, a baseband integrated circuit or processor integrated circuit for a mobile device or a similar integrated circuit in a server, a cellular network device, or other computing or network device.
- top, bottom, over, under, and the like are introduced for descriptive purposes and not necessarily to denote relative positions. It is to be understood that the terms so used are interchangeable under appropriate circumstances and embodiments of the invention are capable of operating according to the present invention in other sequences, or in orientations different from the one(s) described or illustrated above.
Landscapes
- Health & Medical Sciences (AREA)
- Life Sciences & Earth Sciences (AREA)
- Engineering & Computer Science (AREA)
- Physics & Mathematics (AREA)
- Public Health (AREA)
- Surgery (AREA)
- Veterinary Medicine (AREA)
- General Health & Medical Sciences (AREA)
- Animal Behavior & Ethology (AREA)
- Biophysics (AREA)
- Pathology (AREA)
- Biomedical Technology (AREA)
- Heart & Thoracic Surgery (AREA)
- Medical Informatics (AREA)
- Molecular Biology (AREA)
- Physiology (AREA)
- Psychiatry (AREA)
- Computer Vision & Pattern Recognition (AREA)
- Artificial Intelligence (AREA)
- Signal Processing (AREA)
- Cardiology (AREA)
- Hematology (AREA)
- Vascular Medicine (AREA)
- Spectroscopy & Molecular Physics (AREA)
- Optics & Photonics (AREA)
- Measurement Of The Respiration, Hearing Ability, Form, And Blood Characteristics Of Living Organisms (AREA)
- Measuring Pulse, Heart Rate, Blood Pressure Or Blood Flow (AREA)
Claims (15)
- Computer-implementiertes Verfahren zum Erfassen von schlafstörenden Ereignissen aus einem Signal (230), das einen peripheren arteriellen Tonus eines Individuums angibt, wobei das Signal durch einen venoarteriellen Reflex beeinflusst wird, wobei das Verfahren umfasst:- Bestimmen (110) eines vasokonstriktorischen Ereignisses (310, 110_1 - 110_n) aus Veränderungen in dem Signal (230, 240);- Ableiten (122) eines Referenz-Amplitudenwerts (313) und eines Basislinien-Amplitudenwerts (311) für das vasokonstriktorische Ereignis (310, 110_1 - 110_n), wobei sich der Referenz-Amplitudenwert von dem Basislinien-Amplitudenwert unterscheidet;- Korrelieren (123) des Referenz-Amplitudenwerts (311) für das vasokonstriktorische Ereignis mit dem Basislinien-Amplitudenwert (313) für das vasokonstriktorische Ereignis, wodurch ein Maß der Größe (321) für das vasokonstriktorische Ereignis erhalten wird; und- Erfassen (130) eines schlafstörenden Ereignisses daraus.
- Computer-implementiertes Verfahren nach Anspruch 1, wobei das Ableiten (122) umfasst: Berechnen eines basislinien-invarianten Signals (232) für das vasokonstriktorische Ereignis, Auswählen des Referenz-Amplitudenwerts (313) und des Basislinien-Amplitudenwerts (311) für das vasokonstriktorische Ereignis daraus, wobei die Referenz- und die Basislinien-Amplitudenwerte Amplitudenwerten für das vasokonstriktorische Ereignis entsprechen, welche die Berechnung des Maßes der Größe für das vasokonstriktorische Ereignis ermöglichen.
- Computer-implementiertes Verfahren nach Anspruch 2, wobei das Berechnen das Dividieren eines Signalabschnitts (310) entsprechend dem vasokonstriktorischen Ereignis durch eine Basislinie (231, 313) für das vasokonstriktorische Ereignis umfasst.
- Computer-implementiertes Verfahren nach den Ansprüchen 2 oder 3, wobei das Korrelieren (123) das Berechnen einer absoluten Größenordnung (321) für das vasokonstriktorische Ereignis aus dem Referenz-Amplitudenwert (311) und dem Basislinien-Amplitudenwert (313) umfasst.
- Computer-implementiertes Verfahren nach einem der Ansprüche 2 bis 4, wobei die Basislinie (231, 313) für das vasokonstriktorische Ereignis durch Berechnen einer Hüllkurve des Signals abgeleitet wird, die den venoarteriellen Reflex in dem Signal kennzeichnet, wie etwa eine Spitzenhüllkurve (231), eine Tiefstwert-Hüllkurve, eine Durchschnittshüllkurve von Spitzenwert zu Tiefstwert, eine Hüllkurve auf der Grundlage von Perzentilwerten oder eine geglättete Version des Signals, oder durch Berechnen eines Amplitudenwerts für das vasokonstriktorische Ereignis, der den venoarteriellen Reflex für das vasokonstriktorische Ereignis kennzeichnet, wie etwa eines Spitzen-Amplitudenwerts (311), eines Tiefst-Amplitudenwerts, eines Durchschnitts-Amplitudenwerts von Spitzenwert zu Tiefstwert oder eines Perzentilwerts für das vasokonstriktorische Ereignis.
- Computer-implementiertes Verfahren nach Anspruch 1, wobei der Referenz-Amplitudenwert und der Basislinien-Amplitudenwert für das vasokonstriktorische Ereignis jeweils durch Berechnen einer Spitzenwert-Amplitude, einer Tiefstwert-Amplitude, einer Durchschnittsamplitude von Spitzenwert zu Tiefstwert, oder eines Perzentilwerts für das vasokonstriktorische Ereignis abgeleitet werden.
- Computer-implementiertes Verfahren nach Anspruch 6, wobei das Korrelieren (123) das Berechnen einer relativen Größenordnung für das vasokonstriktorische Ereignis aus dem Referenz-Amplitudenwert und dem Basislinien-Amplitudenwert für das vasokonstriktorische Ereignis umfasst.
- Computer-implementiertes Verfahren nach einem der Ansprüche 1 bis 7, wobei das Erfassen (130) das Identifizieren eines vasokonstriktorischen Ereignisses (310, 110_1 - 110_n) umfasst, das durch ein Maß der Größe (321) über einem vorbestimmten Wert gekennzeichnet ist.
- Computer-implementiertes Verfahren nach Anspruch 8, wobei das Identifizieren ferner zumindest eine von einer Dauer (322) des vasokonstriktorischen Ereignisses, einer Dauer (323) einer abfallenden Amplitudenperiode und/oder einer Dauer (324) einer ansteigenden Amplitudenperiode des vasokonstriktorischen Ereignisses, einer Steilheit (325) der abfallenden Amplitudenperiode und/oder einer Steilheit (326) der ansteigenden Amplitudenperiode des vasokonstriktorischen Ereignisses berücksichtigt.
- Computer-implementiertes Verfahren nach einem der Ansprüche 1 bis 9, wobei das Bestimmen (110) das Identifizieren eines Abschnitts des Signals (230, 240) umfasst, das durch einen Abfall der Amplitude (311) gefolgt von einem Anstieg der Amplitude (312) gekennzeichnet ist.
- Computer-implementiertes Verfahren nach Anspruch 10, wobei das Bestimmen (110) ferner zumindest eine von einer Dauer (322) einer Periode des Amplitudenabfalls und einer Periode des Amplitudenanstiegs des Abschnitts des Signals, einer Dauer (323) einer Periode des Amplitudenabfalls und/oder einer Dauer (324) einer Periode des Amplitudenanstiegs des Abschnitts des Signals, einer Steilheit (325) einer Periode des Amplitudenabfalls und/oder einer Steilheit (326) einer Periode des Amplitudenanstiegs des Abschnitts des Signals berücksichtigt.
- Vorrichtung, die dazu ausgestaltet ist, schlafstörende Ereignisse aus einem Signal (230) zu erfassen, das einen peripheren arteriellen Tonus eines Individuums angibt, wobei das Signal durch einen venoarteriellen Reflex beeinflusst wird, wobei die Vorrichtung Mittel umfasst zum:- Bestimmen (110) eines vasokonstriktorischen Ereignisses (310, 110_1 - 110_n) aus Veränderungen in dem Signal (230, 240);- Ableiten (122) eines Referenz-Amplitudenwerts (313) und eines Basislinien-Amplitudenwerts (311) für das vasokonstriktorische Ereignis (310, 110_1 - 110_n), wobei sich der Referenz-Amplitudenwert von dem Basislinien-Amplitudenwert unterscheidet;- Korrelieren (123) des Referenz-Amplitudenwerts (311) für das vasokonstriktorische Ereignis mit dem Basislinien-Amplitudenwert (313) für das vasokonstriktorische Ereignis, wodurch ein Maß der Größe (321) für das vasokonstriktorische Ereignis erhalten wird; und- Erfassen (130) eines schlafstörenden Ereignisses daraus.
- Computerprogrammprodukt, umfassend computerausführbare Anweisungen, um einen Computer zu veranlassen, das computer-implementierte Verfahren nach einem der Ansprüche 1 bis 11 auszuführen.
- Computerlesbares Speichermedium, umfassend computerausführbare Anweisungen zum Durchführen des computer-implementierten Verfahrens nach einem der Ansprüche 1 bis 11, wenn das computer-implementierte Verfahren als Programm auf einem Computer ausgeführt wird.
- Computerlesbares Speichermedium nach Anspruch 14, wobei das computer-implementierte Verfahren ferner das Erhalten eines Signals, das Veränderungen im pulsatilen Blutvolumen angibt, die mittels Plethysmographie an einer ausgewählten anatomischen Position des Individuums erhalten werden, und das Ableiten des Signals (230), das Veränderungen im peripheren arteriellen Tonus angibt, aus diesem umfasst.
Priority Applications (1)
| Application Number | Priority Date | Filing Date | Title |
|---|---|---|---|
| EP25187744.5A EP4656131A1 (de) | 2020-09-04 | 2021-08-11 | Verfahren und vorrichtung zur erkennung von schlafstörungsereignissen aus einem signal, das einen peripheren arteriellen ton einer person anzeigt |
Applications Claiming Priority (2)
| Application Number | Priority Date | Filing Date | Title |
|---|---|---|---|
| US202063074960P | 2020-09-04 | 2020-09-04 | |
| PCT/EP2021/072349 WO2022048871A1 (en) | 2020-09-04 | 2021-08-11 | Method and apparatus for detecting sleep-disturbing events from a signal indicative of a peripheral arterial tone of an individual |
Related Child Applications (1)
| Application Number | Title | Priority Date | Filing Date |
|---|---|---|---|
| EP25187744.5A Division EP4656131A1 (de) | 2020-09-04 | 2021-08-11 | Verfahren und vorrichtung zur erkennung von schlafstörungsereignissen aus einem signal, das einen peripheren arteriellen ton einer person anzeigt |
Publications (2)
| Publication Number | Publication Date |
|---|---|
| EP4208085A1 EP4208085A1 (de) | 2023-07-12 |
| EP4208085B1 true EP4208085B1 (de) | 2025-07-09 |
Family
ID=77627095
Family Applications (2)
| Application Number | Title | Priority Date | Filing Date |
|---|---|---|---|
| EP25187744.5A Pending EP4656131A1 (de) | 2020-09-04 | 2021-08-11 | Verfahren und vorrichtung zur erkennung von schlafstörungsereignissen aus einem signal, das einen peripheren arteriellen ton einer person anzeigt |
| EP21765586.9A Active EP4208085B1 (de) | 2020-09-04 | 2021-08-11 | Verfahren und vorrichtung zur erkennung von schlafstörungsereignissen aus einem signal, das einen peripheren arteriellen ton einer person anzeigt |
Family Applications Before (1)
| Application Number | Title | Priority Date | Filing Date |
|---|---|---|---|
| EP25187744.5A Pending EP4656131A1 (de) | 2020-09-04 | 2021-08-11 | Verfahren und vorrichtung zur erkennung von schlafstörungsereignissen aus einem signal, das einen peripheren arteriellen ton einer person anzeigt |
Country Status (7)
| Country | Link |
|---|---|
| US (1) | US20230346322A1 (de) |
| EP (2) | EP4656131A1 (de) |
| JP (1) | JP7808094B2 (de) |
| CN (2) | CN121264962A (de) |
| AU (1) | AU2021336040A1 (de) |
| IL (1) | IL300878A (de) |
| WO (1) | WO2022048871A1 (de) |
Families Citing this family (3)
| Publication number | Priority date | Publication date | Assignee | Title |
|---|---|---|---|---|
| US12059266B2 (en) * | 2020-12-30 | 2024-08-13 | Itamar Medical Ltd. | System and method for arrhythmia detection during an at home sleep test |
| CN118546112B (zh) * | 2024-07-26 | 2024-10-22 | 洛阳太平洋联合石油化工有限公司 | 一种低粘度润滑油的合成工艺 |
| CN120815265B (zh) * | 2025-09-17 | 2025-12-05 | 山东第一医科大学(山东省医学科学院) | 基于神经递质与血管动力双向耦合的睡眠调控系统及方法 |
Family Cites Families (15)
| Publication number | Priority date | Publication date | Assignee | Title |
|---|---|---|---|---|
| IL120881A (en) * | 1996-07-30 | 2002-09-12 | It M R Medic L Cm 1997 Ltd | Method and device for continuous and non-invasive monitoring of peripheral arterial tone |
| IL151437A (en) | 2000-03-02 | 2007-03-08 | Itamar Medical Ltd | Method and apparatus for the non-invasive detection of particular sleep-state conditions by monitoring the peripheral vascular system |
| BR0109026A (pt) * | 2000-03-02 | 2003-06-03 | Itamar Medical Ltd | Método de monitoramento de um indivìduo quanto à ocorrência de uma condição particular do estado de sono do indivìduo e aparelho para monitoramento de um indivìduo para detectar a ocorrência de uma condição particular durante o estado de sono do indivìduo |
| US7374540B2 (en) | 2001-04-05 | 2008-05-20 | Itamar Medical Ltd. | Non-invasive probe for detecting medical conditions |
| US7024234B2 (en) * | 2002-09-20 | 2006-04-04 | Lyle Aaron Margulies | Method and apparatus for monitoring the autonomic nervous system |
| US7442169B2 (en) | 2004-03-05 | 2008-10-28 | Atcor Medical Pty Limited | Methods of distinguishing between vasoconstriction and vasodilation as a cause of hypotension |
| JP2007181628A (ja) * | 2006-01-10 | 2007-07-19 | Nippon Telegr & Teleph Corp <Ntt> | 脈拍間隔算出装置及び脈拍間隔算出方法 |
| US10354135B2 (en) * | 2008-04-14 | 2019-07-16 | Itamar Medical Ltd. | Non invasive method and apparatus for determining light-sleep and deep-sleep stages |
| US8740806B2 (en) * | 2012-11-07 | 2014-06-03 | Somnarus Inc. | Methods for detection of respiratory effort and sleep apnea monitoring devices |
| US20150173672A1 (en) * | 2013-11-08 | 2015-06-25 | David Brian Goldstein | Device to detect, assess and treat Snoring, Sleep Apneas and Hypopneas |
| CN104257368A (zh) * | 2014-10-13 | 2015-01-07 | 天津工业大学 | 一种睡眠监测及筛查阻塞性睡眠呼吸暂停综合症的装置 |
| EP4403099B1 (de) * | 2016-06-08 | 2026-03-18 | Itamar Medical Ltd. | System zur nichtinvasiven detektion von physiologischen und pathophysiologischen schlafzuständen |
| WO2018181851A1 (ja) * | 2017-03-30 | 2018-10-04 | 北海道公立大学法人札幌医科大学 | 圧反射性血管交感神経活動検出装置、圧反射性血管交感神経活動検出プログラムおよび圧反射性血管交感神経活動検出方法 |
| EP4360546B1 (de) * | 2018-07-11 | 2025-02-19 | Ectosense NV | System zur schlafdiagnose |
| CN211131027U (zh) * | 2019-05-14 | 2020-07-31 | 周常安 | 指戴式生理装置及系统 |
-
2021
- 2021-08-11 WO PCT/EP2021/072349 patent/WO2022048871A1/en not_active Ceased
- 2021-08-11 JP JP2023514967A patent/JP7808094B2/ja active Active
- 2021-08-11 IL IL300878A patent/IL300878A/en unknown
- 2021-08-11 US US18/016,907 patent/US20230346322A1/en active Pending
- 2021-08-11 CN CN202511540501.3A patent/CN121264962A/zh active Pending
- 2021-08-11 EP EP25187744.5A patent/EP4656131A1/de active Pending
- 2021-08-11 CN CN202180054408.5A patent/CN116033867B/zh active Active
- 2021-08-11 EP EP21765586.9A patent/EP4208085B1/de active Active
- 2021-08-11 AU AU2021336040A patent/AU2021336040A1/en active Pending
Also Published As
| Publication number | Publication date |
|---|---|
| US20230346322A1 (en) | 2023-11-02 |
| CN116033867A (zh) | 2023-04-28 |
| EP4656131A1 (de) | 2025-12-03 |
| EP4208085A1 (de) | 2023-07-12 |
| AU2021336040A1 (en) | 2023-02-23 |
| IL300878A (en) | 2023-04-01 |
| CN116033867B (zh) | 2025-11-11 |
| JP2023540539A (ja) | 2023-09-25 |
| JP7808094B2 (ja) | 2026-01-28 |
| WO2022048871A1 (en) | 2022-03-10 |
| CN121264962A (zh) | 2026-01-06 |
Similar Documents
| Publication | Publication Date | Title |
|---|---|---|
| JP7811186B2 (ja) | 末梢動脈緊張の評価を補償する装置、方法及びコンピュータ可読記憶媒体 | |
| Venkat et al. | Machine learning based spo 2 computation using reflectance pulse oximetry | |
| US10278595B2 (en) | Analysis and characterization of patient signals | |
| EP4208085B1 (de) | Verfahren und vorrichtung zur erkennung von schlafstörungsereignissen aus einem signal, das einen peripheren arteriellen ton einer person anzeigt | |
| EP3928690B1 (de) | Verfahren und vorrichtung zur beurteilung des peripheren arteriellen tonus | |
| Byfield et al. | Towards robust blood pressure estimation from pulse wave velocity measured by photoplethysmography sensors | |
| US20110054279A1 (en) | Diagnosis of periodic breathing | |
| JP2011521702A (ja) | Co2評価のための方法および装置 | |
| JP7195323B2 (ja) | 組織オキシメトリと血圧を用いた自己調節能システムと方法 | |
| US9402571B2 (en) | Biological tissue function analysis | |
| Molinari et al. | Empirical mode decomposition analysis of near-infrared spectroscopy muscular signals to assess the effect of physical activity in type 2 diabetic patients | |
| Clarke | Signal quality analysis in pulse oximetry: Modelling and detection of motion artifact | |
| Sood et al. | Feature extraction for photoplethysmographic signals using pwa: Ppg waveform analyzer | |
| Olenczak et al. | Tissue Monitoring with Three-Wavelength Light Emitting Diode–Based Near-Infrared Spectroscopy | |
| DORIZZA | Deep convolutional networks for concurrent photoplethysmographic and phonocardiographic signal processing | |
| Maddi et al. | Skin Color-Corrected Cardiovascular Diagnostics | |
| CN118574571A (zh) | 脉搏波速度检测装置以及hba1c、动脉年龄和钙化评分的血流动力学确定 |
Legal Events
| Date | Code | Title | Description |
|---|---|---|---|
| STAA | Information on the status of an ep patent application or granted ep patent |
Free format text: STATUS: UNKNOWN |
|
| STAA | Information on the status of an ep patent application or granted ep patent |
Free format text: STATUS: THE INTERNATIONAL PUBLICATION HAS BEEN MADE |
|
| PUAI | Public reference made under article 153(3) epc to a published international application that has entered the european phase |
Free format text: ORIGINAL CODE: 0009012 |
|
| STAA | Information on the status of an ep patent application or granted ep patent |
Free format text: STATUS: REQUEST FOR EXAMINATION WAS MADE |
|
| 17P | Request for examination filed |
Effective date: 20230321 |
|
| AK | Designated contracting states |
Kind code of ref document: A1 Designated state(s): AL AT BE BG CH CY CZ DE DK EE ES FI FR GB GR HR HU IE IS IT LI LT LU LV MC MK MT NL NO PL PT RO RS SE SI SK SM TR |
|
| DAV | Request for validation of the european patent (deleted) | ||
| DAX | Request for extension of the european patent (deleted) | ||
| GRAP | Despatch of communication of intention to grant a patent |
Free format text: ORIGINAL CODE: EPIDOSNIGR1 |
|
| STAA | Information on the status of an ep patent application or granted ep patent |
Free format text: STATUS: GRANT OF PATENT IS INTENDED |
|
| INTG | Intention to grant announced |
Effective date: 20250218 |
|
| GRAS | Grant fee paid |
Free format text: ORIGINAL CODE: EPIDOSNIGR3 |
|
| GRAA | (expected) grant |
Free format text: ORIGINAL CODE: 0009210 |
|
| STAA | Information on the status of an ep patent application or granted ep patent |
Free format text: STATUS: THE PATENT HAS BEEN GRANTED |
|
| RIN1 | Information on inventor provided before grant (corrected) |
Inventor name: MASSIE, FREDERIK Inventor name: VITS, STEVEN |
|
| AK | Designated contracting states |
Kind code of ref document: B1 Designated state(s): AL AT BE BG CH CY CZ DE DK EE ES FI FR GB GR HR HU IE IS IT LI LT LU LV MC MK MT NL NO PL PT RO RS SE SI SK SM TR |
|
| REG | Reference to a national code |
Ref country code: GB Ref legal event code: FG4D |
|
| REG | Reference to a national code |
Ref country code: CH Ref legal event code: EP |
|
| REG | Reference to a national code |
Ref country code: IE Ref legal event code: FG4D |
|
| REG | Reference to a national code |
Ref country code: DE Ref legal event code: R096 Ref document number: 602021033836 Country of ref document: DE |
|
| PGFP | Annual fee paid to national office [announced via postgrant information from national office to epo] |
Ref country code: DE Payment date: 20250724 Year of fee payment: 5 |
|
| PGFP | Annual fee paid to national office [announced via postgrant information from national office to epo] |
Ref country code: GB Payment date: 20250820 Year of fee payment: 5 |
|
| PGFP | Annual fee paid to national office [announced via postgrant information from national office to epo] |
Ref country code: FR Payment date: 20250820 Year of fee payment: 5 Ref country code: AT Payment date: 20251020 Year of fee payment: 5 |
|
| REG | Reference to a national code |
Ref country code: NL Ref legal event code: MP Effective date: 20250709 |
|
| PG25 | Lapsed in a contracting state [announced via postgrant information from national office to epo] |
Ref country code: PT Free format text: LAPSE BECAUSE OF FAILURE TO SUBMIT A TRANSLATION OF THE DESCRIPTION OR TO PAY THE FEE WITHIN THE PRESCRIBED TIME-LIMIT Effective date: 20251110 |
|
| PG25 | Lapsed in a contracting state [announced via postgrant information from national office to epo] |
Ref country code: NL Free format text: LAPSE BECAUSE OF FAILURE TO SUBMIT A TRANSLATION OF THE DESCRIPTION OR TO PAY THE FEE WITHIN THE PRESCRIBED TIME-LIMIT Effective date: 20250709 |
|
| REG | Reference to a national code |
Ref country code: AT Ref legal event code: MK05 Ref document number: 1811028 Country of ref document: AT Kind code of ref document: T Effective date: 20250709 |
|
| PG25 | Lapsed in a contracting state [announced via postgrant information from national office to epo] |
Ref country code: IS Free format text: LAPSE BECAUSE OF FAILURE TO SUBMIT A TRANSLATION OF THE DESCRIPTION OR TO PAY THE FEE WITHIN THE PRESCRIBED TIME-LIMIT Effective date: 20251109 |
|
| PG25 | Lapsed in a contracting state [announced via postgrant information from national office to epo] |
Ref country code: NO Free format text: LAPSE BECAUSE OF FAILURE TO SUBMIT A TRANSLATION OF THE DESCRIPTION OR TO PAY THE FEE WITHIN THE PRESCRIBED TIME-LIMIT Effective date: 20251009 |
|
| REG | Reference to a national code |
Ref country code: LT Ref legal event code: MG9D |
|
| PG25 | Lapsed in a contracting state [announced via postgrant information from national office to epo] |
Ref country code: AT Free format text: LAPSE BECAUSE OF FAILURE TO SUBMIT A TRANSLATION OF THE DESCRIPTION OR TO PAY THE FEE WITHIN THE PRESCRIBED TIME-LIMIT Effective date: 20250709 |
|
| PG25 | Lapsed in a contracting state [announced via postgrant information from national office to epo] |
Ref country code: FI Free format text: LAPSE BECAUSE OF FAILURE TO SUBMIT A TRANSLATION OF THE DESCRIPTION OR TO PAY THE FEE WITHIN THE PRESCRIBED TIME-LIMIT Effective date: 20250709 |
|
| PG25 | Lapsed in a contracting state [announced via postgrant information from national office to epo] |
Ref country code: HR Free format text: LAPSE BECAUSE OF FAILURE TO SUBMIT A TRANSLATION OF THE DESCRIPTION OR TO PAY THE FEE WITHIN THE PRESCRIBED TIME-LIMIT Effective date: 20250709 |
|
| PG25 | Lapsed in a contracting state [announced via postgrant information from national office to epo] |
Ref country code: GR Free format text: LAPSE BECAUSE OF FAILURE TO SUBMIT A TRANSLATION OF THE DESCRIPTION OR TO PAY THE FEE WITHIN THE PRESCRIBED TIME-LIMIT Effective date: 20251010 |
|
| PG25 | Lapsed in a contracting state [announced via postgrant information from national office to epo] |
Ref country code: SE Free format text: LAPSE BECAUSE OF FAILURE TO SUBMIT A TRANSLATION OF THE DESCRIPTION OR TO PAY THE FEE WITHIN THE PRESCRIBED TIME-LIMIT Effective date: 20250709 |
|
| PG25 | Lapsed in a contracting state [announced via postgrant information from national office to epo] |
Ref country code: LV Free format text: LAPSE BECAUSE OF FAILURE TO SUBMIT A TRANSLATION OF THE DESCRIPTION OR TO PAY THE FEE WITHIN THE PRESCRIBED TIME-LIMIT Effective date: 20250709 |
|
| PG25 | Lapsed in a contracting state [announced via postgrant information from national office to epo] |
Ref country code: BG Free format text: LAPSE BECAUSE OF FAILURE TO SUBMIT A TRANSLATION OF THE DESCRIPTION OR TO PAY THE FEE WITHIN THE PRESCRIBED TIME-LIMIT Effective date: 20250709 Ref country code: PL Free format text: LAPSE BECAUSE OF FAILURE TO SUBMIT A TRANSLATION OF THE DESCRIPTION OR TO PAY THE FEE WITHIN THE PRESCRIBED TIME-LIMIT Effective date: 20250709 |
|
| PG25 | Lapsed in a contracting state [announced via postgrant information from national office to epo] |
Ref country code: RS Free format text: LAPSE BECAUSE OF FAILURE TO SUBMIT A TRANSLATION OF THE DESCRIPTION OR TO PAY THE FEE WITHIN THE PRESCRIBED TIME-LIMIT Effective date: 20251009 |
|
| PG25 | Lapsed in a contracting state [announced via postgrant information from national office to epo] |
Ref country code: ES Free format text: LAPSE BECAUSE OF FAILURE TO SUBMIT A TRANSLATION OF THE DESCRIPTION OR TO PAY THE FEE WITHIN THE PRESCRIBED TIME-LIMIT Effective date: 20250709 |
|
| PG25 | Lapsed in a contracting state [announced via postgrant information from national office to epo] |
Ref country code: RO Free format text: LAPSE BECAUSE OF FAILURE TO SUBMIT A TRANSLATION OF THE DESCRIPTION OR TO PAY THE FEE WITHIN THE PRESCRIBED TIME-LIMIT Effective date: 20250709 |
|
| REG | Reference to a national code |
Ref country code: CH Ref legal event code: H13 Free format text: ST27 STATUS EVENT CODE: U-0-0-H10-H13 (AS PROVIDED BY THE NATIONAL OFFICE) Effective date: 20260324 |
|
| PG25 | Lapsed in a contracting state [announced via postgrant information from national office to epo] |
Ref country code: SM Free format text: LAPSE BECAUSE OF FAILURE TO SUBMIT A TRANSLATION OF THE DESCRIPTION OR TO PAY THE FEE WITHIN THE PRESCRIBED TIME-LIMIT Effective date: 20250709 |
|
| PG25 | Lapsed in a contracting state [announced via postgrant information from national office to epo] |
Ref country code: DK Free format text: LAPSE BECAUSE OF FAILURE TO SUBMIT A TRANSLATION OF THE DESCRIPTION OR TO PAY THE FEE WITHIN THE PRESCRIBED TIME-LIMIT Effective date: 20250709 |
|
| PG25 | Lapsed in a contracting state [announced via postgrant information from national office to epo] |
Ref country code: LU Free format text: LAPSE BECAUSE OF NON-PAYMENT OF DUE FEES Effective date: 20250811 Ref country code: IT Free format text: LAPSE BECAUSE OF FAILURE TO SUBMIT A TRANSLATION OF THE DESCRIPTION OR TO PAY THE FEE WITHIN THE PRESCRIBED TIME-LIMIT Effective date: 20250709 |