EP4183333A1 - Hirnfunktionskonnektivitätskorrelationswertclusteringsystem, hirnfunktionskonnektivitätskorrelationswertclusteringverfahren - Google Patents
Hirnfunktionskonnektivitätskorrelationswertclusteringsystem, hirnfunktionskonnektivitätskorrelationswertclusteringverfahren Download PDFInfo
- Publication number
- EP4183333A1 EP4183333A1 EP21842607.0A EP21842607A EP4183333A1 EP 4183333 A1 EP4183333 A1 EP 4183333A1 EP 21842607 A EP21842607 A EP 21842607A EP 4183333 A1 EP4183333 A1 EP 4183333A1
- Authority
- EP
- European Patent Office
- Prior art keywords
- clustering
- brain
- therapy
- features
- subject
- Prior art date
- Legal status (The legal status is an assumption and is not a legal conclusion. Google has not performed a legal analysis and makes no representation as to the accuracy of the status listed.)
- Pending
Links
Images




















Classifications
-
- A—HUMAN NECESSITIES
- A61—MEDICAL OR VETERINARY SCIENCE; HYGIENE
- A61B—DIAGNOSIS; SURGERY; IDENTIFICATION
- A61B5/00—Measuring for diagnostic purposes; Identification of persons
- A61B5/72—Signal processing specially adapted for physiological signals or for diagnostic purposes
- A61B5/7235—Details of waveform analysis
- A61B5/7264—Classification of physiological signals or data, e.g. using neural networks, statistical classifiers, expert systems or fuzzy systems
- A61B5/7267—Classification of physiological signals or data, e.g. using neural networks, statistical classifiers, expert systems or fuzzy systems involving training the classification device
-
- G—PHYSICS
- G06—COMPUTING OR CALCULATING; COUNTING
- G06T—IMAGE DATA PROCESSING OR GENERATION, IN GENERAL
- G06T7/00—Image analysis
- G06T7/0002—Inspection of images, e.g. flaw detection
- G06T7/0012—Biomedical image inspection
-
- G—PHYSICS
- G06—COMPUTING OR CALCULATING; COUNTING
- G06N—COMPUTING ARRANGEMENTS BASED ON SPECIFIC COMPUTATIONAL MODELS
- G06N20/00—Machine learning
-
- G—PHYSICS
- G16—INFORMATION AND COMMUNICATION TECHNOLOGY [ICT] SPECIALLY ADAPTED FOR SPECIFIC APPLICATION FIELDS
- G16H—HEALTHCARE INFORMATICS, i.e. INFORMATION AND COMMUNICATION TECHNOLOGY [ICT] SPECIALLY ADAPTED FOR THE HANDLING OR PROCESSING OF MEDICAL OR HEALTHCARE DATA
- G16H20/00—ICT specially adapted for therapies or health-improving plans, e.g. for handling prescriptions, for steering therapy or for monitoring patient compliance
- G16H20/10—ICT specially adapted for therapies or health-improving plans, e.g. for handling prescriptions, for steering therapy or for monitoring patient compliance relating to drugs or medications, e.g. for ensuring correct administration to patients
-
- G—PHYSICS
- G16—INFORMATION AND COMMUNICATION TECHNOLOGY [ICT] SPECIALLY ADAPTED FOR SPECIFIC APPLICATION FIELDS
- G16H—HEALTHCARE INFORMATICS, i.e. INFORMATION AND COMMUNICATION TECHNOLOGY [ICT] SPECIALLY ADAPTED FOR THE HANDLING OR PROCESSING OF MEDICAL OR HEALTHCARE DATA
- G16H20/00—ICT specially adapted for therapies or health-improving plans, e.g. for handling prescriptions, for steering therapy or for monitoring patient compliance
- G16H20/70—ICT specially adapted for therapies or health-improving plans, e.g. for handling prescriptions, for steering therapy or for monitoring patient compliance relating to mental therapies, e.g. psychological therapy or autogenous training
-
- G—PHYSICS
- G16—INFORMATION AND COMMUNICATION TECHNOLOGY [ICT] SPECIALLY ADAPTED FOR SPECIFIC APPLICATION FIELDS
- G16H—HEALTHCARE INFORMATICS, i.e. INFORMATION AND COMMUNICATION TECHNOLOGY [ICT] SPECIALLY ADAPTED FOR THE HANDLING OR PROCESSING OF MEDICAL OR HEALTHCARE DATA
- G16H50/00—ICT specially adapted for medical diagnosis, medical simulation or medical data mining; ICT specially adapted for detecting, monitoring or modelling epidemics or pandemics
- G16H50/20—ICT specially adapted for medical diagnosis, medical simulation or medical data mining; ICT specially adapted for detecting, monitoring or modelling epidemics or pandemics for computer-aided diagnosis, e.g. based on medical expert systems
-
- A—HUMAN NECESSITIES
- A61—MEDICAL OR VETERINARY SCIENCE; HYGIENE
- A61B—DIAGNOSIS; SURGERY; IDENTIFICATION
- A61B5/00—Measuring for diagnostic purposes; Identification of persons
- A61B5/0033—Features or image-related aspects of imaging apparatus, e.g. for MRI, optical tomography or impedance tomography apparatus; Arrangements of imaging apparatus in a room
- A61B5/004—Features or image-related aspects of imaging apparatus, e.g. for MRI, optical tomography or impedance tomography apparatus; Arrangements of imaging apparatus in a room adapted for image acquisition of a particular organ or body part
- A61B5/0042—Features or image-related aspects of imaging apparatus, e.g. for MRI, optical tomography or impedance tomography apparatus; Arrangements of imaging apparatus in a room adapted for image acquisition of a particular organ or body part for the brain
-
- A—HUMAN NECESSITIES
- A61—MEDICAL OR VETERINARY SCIENCE; HYGIENE
- A61B—DIAGNOSIS; SURGERY; IDENTIFICATION
- A61B5/00—Measuring for diagnostic purposes; Identification of persons
- A61B5/05—Detecting, measuring or recording for diagnosis by means of electric currents or magnetic fields; Measuring using microwaves or radio waves
- A61B5/055—Detecting, measuring or recording for diagnosis by means of electric currents or magnetic fields; Measuring using microwaves or radio waves involving electronic [EMR] or nuclear [NMR] magnetic resonance, e.g. magnetic resonance imaging
-
- A—HUMAN NECESSITIES
- A61—MEDICAL OR VETERINARY SCIENCE; HYGIENE
- A61B—DIAGNOSIS; SURGERY; IDENTIFICATION
- A61B5/00—Measuring for diagnostic purposes; Identification of persons
- A61B5/16—Devices for psychotechnics; Testing reaction times ; Devices for evaluating the psychological state
- A61B5/165—Evaluating the state of mind, e.g. depression, anxiety
-
- G—PHYSICS
- G06—COMPUTING OR CALCULATING; COUNTING
- G06T—IMAGE DATA PROCESSING OR GENERATION, IN GENERAL
- G06T2207/00—Indexing scheme for image analysis or image enhancement
- G06T2207/10—Image acquisition modality
- G06T2207/10072—Tomographic images
- G06T2207/10088—Magnetic resonance imaging [MRI]
-
- G—PHYSICS
- G06—COMPUTING OR CALCULATING; COUNTING
- G06T—IMAGE DATA PROCESSING OR GENERATION, IN GENERAL
- G06T2207/00—Indexing scheme for image analysis or image enhancement
- G06T2207/20—Special algorithmic details
- G06T2207/20081—Training; Learning
-
- G—PHYSICS
- G06—COMPUTING OR CALCULATING; COUNTING
- G06T—IMAGE DATA PROCESSING OR GENERATION, IN GENERAL
- G06T2207/00—Indexing scheme for image analysis or image enhancement
- G06T2207/30—Subject of image; Context of image processing
- G06T2207/30004—Biomedical image processing
- G06T2207/30016—Brain
-
- G—PHYSICS
- G16—INFORMATION AND COMMUNICATION TECHNOLOGY [ICT] SPECIALLY ADAPTED FOR SPECIFIC APPLICATION FIELDS
- G16H—HEALTHCARE INFORMATICS, i.e. INFORMATION AND COMMUNICATION TECHNOLOGY [ICT] SPECIALLY ADAPTED FOR THE HANDLING OR PROCESSING OF MEDICAL OR HEALTHCARE DATA
- G16H20/00—ICT specially adapted for therapies or health-improving plans, e.g. for handling prescriptions, for steering therapy or for monitoring patient compliance
-
- G—PHYSICS
- G16—INFORMATION AND COMMUNICATION TECHNOLOGY [ICT] SPECIALLY ADAPTED FOR SPECIFIC APPLICATION FIELDS
- G16H—HEALTHCARE INFORMATICS, i.e. INFORMATION AND COMMUNICATION TECHNOLOGY [ICT] SPECIALLY ADAPTED FOR THE HANDLING OR PROCESSING OF MEDICAL OR HEALTHCARE DATA
- G16H50/00—ICT specially adapted for medical diagnosis, medical simulation or medical data mining; ICT specially adapted for detecting, monitoring or modelling epidemics or pandemics
- G16H50/70—ICT specially adapted for medical diagnosis, medical simulation or medical data mining; ICT specially adapted for detecting, monitoring or modelling epidemics or pandemics for mining of medical data, e.g. analysing previous cases of other patients
Definitions
- the present invention relates to a technique for clustering brain functional connectivity correlation values measured by functional brain imaging by a plurality of devices and, more specifically, to a brain functional connectivity correlation value clustering device, a brain functional connectivity correlation value clustering system, a brain functional connectivity correlation value clustering method, a brain functional connectivity correlation value classifier program, and a brain activity marker classification system.
- Deep learning refers to machine learning using multi-layered neural networks and, in the field of image recognition, it is known that a method of learning using Convolutional Neural Network (hereinafter referred to as "CNN"), which is a type of deep learning, shows a performance significantly higher than conventional methods (for example, see Patent Literature 2).
- CNN Convolutional Neural Network
- Non-Patent Literature 1 In the fields of endoscopic diagnostic imaging for colorectal cancer and the like, diagnostic devices are now used in practical services which show accuracy of diagnosis higher than those of humans (Non-Patent Literature 1).
- data-driven artificial intelligence may be applied to performance of tasks of classifying given data into a number of clusters based on their features.
- unsupervised learning is known for which correct data is not available, as well as “semi-supervised learning” combining learning with a small amount of "correct-labeled training data” with a large amount of "correct-label-less training data” (for example, Patent Literature 3).
- “semi-supervised learning” refers to a method of learning based on a relatively small amount of labeled data and label-less data, and it includes, by way of example, a bootstrap method in which learning model for classification is generated using labeled data (teacher data T including state data S and label data L), and the learning model is additionally trained to improve the precision of learning by using the learning model and label-less data (state data S), and a graph base algorithm in which a learning model as a classifier is generated by grouping based on labeled and label-less data distributions.”
- teacher data T including state data S and label data L
- state data S state data
- a graph base algorithm in which a learning model as a classifier is generated by grouping based on labeled and label-less data distributions.
- a “biomarker” refers to biological information converted into a numerical value or quantified as an index for quantitatively comprehending any biological changes in a living body.
- Biomarkers representative of a state of or a change in a disease, or a degree of healing are used as surrogate markers (substitute markers) to monitor efficacy in clinical tests of new drugs.
- the blood sugar level, the cholesterol level, and the like are representative biomarkers used as indexes of lifestyle diseases.
- Biomarkers include not only substances of biological origin contained in urine or blood but also electrocardiogram, blood pressure, PET (positron emission tomography) images, bone density, lung function, and the like. Developments in genomic analysis and proteome analysis have led to the discovery of various biomarkers related to DNA, RNA, or biological protein.
- Biomarkers are promising for measuring therapeutic efficacy after the onset of a disease and, in addition, as routine preventive indexes, promising for disease prevention. Further, biomarkers are expected to be applied to individualized medicine for selecting effective treatment avoiding side effects.
- Patent Literature 4 a biomarker for determining possibility of having a disease using genetic information is disclosed (Patent Literature 4).
- a “biomarker” or a “marker” is “biological molecules that can be objectively measured as representing features of physiological state of the biological system.”
- Patent Literature 4 describes the biomarkers as "typically, biomarker measurements represent information related to quantitative measurement of expression product, which typically is protein or polypeptide.
- Patent Literature 4 shows examples of classifiers to be used as the "classification system" of such biomarker measurements, including a decision tree, a Bayesian classifier, a Bayesian belief network, k-nearest neighbor method, case-based reasoning, and a support vector machine.
- NIRS Near-InfraRed Spectroscopy
- MRI nuclear Magnetic Resonance Imaging
- fMRI functional MRI
- An fMRI uses a common MRI apparatus with additional hardware and software necessary for fMRI measurement.
- Oxygenated hemoglobin is diamagnetic and does not have any influence on relaxation time of hydrogen atoms in the surrounding water whereas deoxygenated hemoglobin is paramagnetic and changes surrounding magnetic field. Therefore, when the brain is stimulated and local blood stream increases, any resulting changes in oxygenated hemoglobin can be detected by MRI signals.
- Commonly used stimuli to a subject may include, for example, visual stimulus, audio stimulus, or performance of a prescribed task.
- brain activities are measured by measuring increase in the nuclear magnetic resonance signal (MRI signal) of hydrogen atoms representing a phenomenon where the deoxygenated hemoglobin level in red blood cells decrease in minute veins or capillary vessels (BOLD effect).
- MRI signal nuclear magnetic resonance signal
- the blood oxygen level dependent signal that reflects a brain activity measured by fMRI devices is referred to as a BOLD signal (Blood Oxygen Level Dependent Signal).
- brain activities are measured by the fMRI as described above while a subject is performing some physical activity.
- a decoding technique has been developed to extract more detailed information from fMRI data.
- a voxel-by-voxel (voxel: volumetric pixel) brain activity analysis of the brain by the fMRI enables the estimation of stimulus input or the state of recognition from spatial patterns of the brain activities.
- Patent Literature 6 discloses a method of brain function analysis for realizing "diagnostic biomarkers" based on functional brain imaging for a neurological/mental disorder.
- a correlation matrix (brain functional connectivity parameters) of degrees of activities between prescribed brain regions is derived for each subject.
- Feature extraction is performed by regularized canonical correlation analysis on the correlation matrix and on the attributes of subjects including diseased/healthy labels of the subjects.
- a discriminator that functions as a biomarker is generated from discriminant analysis by sparse logistic regression (SLR).
- SLR sparse logistic regression
- results of neurological disease diagnosis can be predicted based on connections among brain regions derived from fMRI data in the resting state. Further, verification of the prediction performance indicated that the prediction is not only applicable to the brain activities measured in a certain facility but also generalizable, to some extent, to the brain activities measured in a different facility.
- Non-Patent Literature 2 obtaining and sharing large scale brain image data come to be recognized as having a significant meaning in filling in the gaps between basic neuro-scientific research and clinical applications such as diagnosis and therapy of mental diseases or psychiatric disorder.
- diagnosis of a healthy cohort and a patient cohort have attained some positive results.
- some patient cohorts e.g. a group of patients generally diagnosed as having "depression,” may actually be divided into several subtypes.
- common “antidepressant” works so well to achieve remission for some patients while not so well to other patients who are "treatment-resistant.”
- Non-Patent Literatures 3 and 4 There has been an attempt to classify such patients of “depression” by applying clustering using data-driven artificial intelligence to the above-described “brain functional connectivity parameters,” and some references report that a certain tendency is observed (Non-Patent Literatures 3 and 4).
- Non-Patent Literature 4 notes that the "generalization" of clustering of a huge amount of measurement data from many facilities is a problem to be solved in the future.
- Non-Patent Literature 3 indicated that patients of depression were stratified with four subtypes having different therapeutic responses to TMS (transcranial magnetic stimulation). It is pointed out, however, in a different reference (Non-Patent Literature 5) that in the process of finding brain functional connectivity indexes, data of depression symptoms are used twice, and because of the overtraining, the statistical significance of the relation with depression symptoms could not be confirmed and stratification stability was not satisfactory.
- Non-Patent Literatures 6 and 7 for evaluating the site-to-site differences of measurement data when MRI measurements are done at a plurality of measurement sites, adoption of a so-called "traveling subject" is proposed, wherein a large number of participants travel to and are measured at the plurality of sites, in order to evaluate an effect on measurement bias on the resting state functional connectivity (Non-Patent Literatures 6 and 7).
- Machine learning on a small amount of data is highly prone to overtraining because of noises or specific tendencies of training data derived from fMRI devices of specific facilities, or methods of measurement, experimenters or participant groups.
- a classifier discriminating autism spectrum disorder from anatomic brain images shows sensitivity and specificity of 90 % or higher when used for training data of United Kingdom that was used for development, while its performance is as low as 50% when applied to data of Japanese people. From the foregoing, we assume that a classifier not validated using an independent validation cohort consisting of a group of subjects and a facility that are totally different from the training data does not bear either scientific or practical significance.
- Non-Patent Literature 8 The applicant of the present application reports a "method of harmonization" in order to compensate for the above-described site-to-site differences among measurement sites.
- the present invention was made to solve the above-described problem and its object is to provide a therapy selection support system, a therapy selection support device, a therapy selection support method, and a therapy selection support program that generate a discriminator (identifier) as a diagnostic marker or a classifier as a stratification marker through machine learning on the basis of measurement data on brain activities and that provide information related to selection of a therapy for a subject with depression symptoms on the basis of the results of measurement of brain activities of the subject using the discriminator (identifier) or the classifier as a biomarker.
- a discriminator identifier
- Another object of the present invention is to provide a screening support system, a screening support device, a screening support method, and a screening support program for supporting screening for a subject on the basis of the results of measurement of the brain activities of the subject in a clinical test for a therapeutic agent candidate substance for depression symptoms.
- an embodiment of the present invention is directed to a therapy selection support system that provides information related to selection of a therapy for a first subject with depression symptoms on the basis of results of measurement of brain activities of the first subject.
- the therapy selection support system includes a clustering device that executes stratification in which results of measurement of brain functional connectivity correlation values acquired from a plurality of second subjects are divided into a plurality of clusters through a clustering process.
- the plurality of second subjects include a first cohort having a diagnosis label of a depression and a second cohort not having the diagnosis label of the depression.
- the clustering device includes a processor and a storage device, the processor being configured to execute the clustering process for the plurality of second subjects.
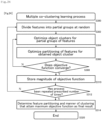
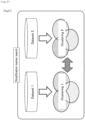
- the processor is configured to, in a process of generating a clustering classifier, i) store, in the storage device, features based on a plurality of brain functional connectivity correlation values that represent time correlation of brain activities among a plurality of predetermined brain area pairs for each of the plurality of second subjects, ii) execute machine learning, through supervised learning, to generate an identifier model for discriminating presence or absence of the diagnosis label on the basis of the features stored in the storage device, iii) select features for clustering in accordance with a degree of importance of features that are used to generate an identifier through the machine learning in the machine learning to generate the identifier model, and iv) generate a clustering classifier by clustering the first cohort through a multiple co-clustering method as unsupervised learning on the basis of the selected features for the clustering.
- the therapy selection support system further includes a database device that stores the clusters obtained as a result of the stratification by the clustering classifier and corresponding predetermined therapy information in association with each other, and a support information providing device that receives an input of the results of the measurement of the brain activities of the first subject and that outputs corresponding therapy information in accordance with results of classification by the clustering classifier for the measurement results.
- the processor is configured to, in the machine learning to generate the identifier model, generate a plurality of training sub-samples by executing under-sampling and sub-sampling from the first cohort and the second cohort, select features for clustering from a sum-set of features that are used to generate the identifier through the machine learning in accordance with a degree of importance of features that belong to the sum-set for each of the training sub-samples, and generate the clustering classifier by the multiple co-clustering method on the basis of the selected features for the clustering.
- the support information providing device includes a clustering processor and an interface device; the clustering processor calculates a probability at which the first subject is classified as belonging to each of the clusters by the clustering classifier, and reads at least two pieces of the therapy information selected in accordance with the probability from the database device; and the interface device outputs data for displaying the selected clusters and the corresponding pieces of the therapy information in association with each other.
- the therapy information is information that indicates a response to a specific therapeutic agent.
- the therapy information is information that indicates a response to a specific physical therapy.
- a process of generating the identifier through the machine learning involves ensemble learning in which a plurality of identifier sub-models are generated for the plurality of training sub-samples and the plurality of identifier sub-models are integrated with each other to generate the identifier model.
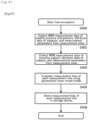
- the clustering device receives, from a plurality of brain activity measurement devices provided at a plurality of measurement sites, information that represents time correlation of brain activities among a plurality of predetermined brain area pairs for each of the plurality of second subjects.
- the processor includes harmonization calculation means for correcting the plurality of brain functional connectivity correlation values for each of the plurality of second subjects so as to remove a measurement bias of the measurement sites and storing corrected adjustment values in the storage device as the features.
- the predetermined therapy information is information related to a response to a therapy with a selective serotonin reuptake inhibitor.
- an embodiment of the present invention is directed to a therapy selection support device that provides information related to selection of a therapy for a first subject with depression symptoms on the basis of results of measurement of brain activities of the first subject.
- the therapy selection support device includes: a database device that stores clusters obtained as a result of stratification of subjects having a diagnosis label of a depression, among a plurality of second subjects, and corresponding predetermined therapy information in association with each other; and a support information providing device that receives an input of the results of measuring the brain activities of the first subject and that outputs corresponding therapy information in accordance with the result of the stratification based on the measurement results.
- the plurality of second subjects include a first cohort having a diagnosis label of a depression and a second cohort not having the diagnosis label of the depression.
- the clusters obtained as a result of the stratification are obtained by a clustering classifier obtained through a clustering process for results of measurement of brain functional connectivity correlation values by a clustering device.
- the clustering device includes a processor that executes the clustering process for the first cohort and a storage device.
- the processor is configured to, in a process of generating the clustering classifier, i) store, in the storage device, features based on a plurality of brain functional connectivity correlation values that represent time correlation of brain activities among a plurality of predetermined brain area pairs for each of the plurality of second subjects, ii) execute machine learning, through supervised learning, to generate an identifier model for discriminating presence or absence of the diagnosis label on the basis of the features stored in the storage device, iii) select features for clustering in accordance with a degree of importance of features that are used to generate an identifier through the machine learning in the machine learning to generate the identifier model, and iv) generate the clustering classifier by clustering the first cohort through a multiple co-clustering method as unsupervised learning on the basis of the selected features for the clustering.
- the processor is configured to, in the machine learning to generate the identifier model, generate a plurality of training sub-samples by executing under-sampling and sub-sampling from the first control cohort and the second control cohort, select features for clustering from a sum-set of features that are used to generate the identifier through the machine learning in accordance with a degree of importance of features that belong to the sum-set for each of the training sub-samples, and generate the clustering classifier by the multiple co-clustering method on the basis of the selected features for the clustering.
- the support information providing device includes a clustering processor and an interface device.
- the clustering processor calculates a probability at which the first subject is classified as belonging to each of the clusters by the clustering classifier, and reads at least two pieces of the therapy information selected in accordance with the probability from the database device.
- the interface device outputs data for displaying the selected clusters and the corresponding pieces of the therapy information in association with each other.
- the therapy information is information that indicates a response to a specific therapeutic agent.
- the therapy information is information that indicates a response to a specific physical therapy.
- a process of generating the identifier through the machine learning involves ensemble learning in which a plurality of identifier sub-models are generated for the plurality of training sub-samples and the plurality of identifier sub-models are integrated with each other to generate the identifier model.
- the clustering device receives, from a plurality of brain activity measurement devices provided at a plurality of measurement sites, information that represents time correlation of brain activities among a plurality of predetermined brain area pairs for each of the plurality of subjects; and the processor includes harmonization calculation means for correcting the plurality of brain functional connectivity correlation values for each of the plurality of subjects so as to remove a measurement bias of the measurement sites and storing corrected adjustment values in the storage device as the features.
- the predetermined therapy information is information related to a response to a therapy with a selective serotonin reuptake inhibitor.
- an embodiment of the present invention is directed to a therapy selection support method that provides information related to selection of a therapy for a first subject with depression symptoms on the basis of results of measurement of brain activities of the first subject.
- the therapy selection support method includes a preparing step of generating a clustering classifier that executes stratification in which results of measurement of brain functional connectivity correlation values acquired from a plurality of second subjects are divided into a plurality of clusters through a clustering process.
- the plurality of second subjects include a first cohort having a diagnosis label of a depression and a second cohort not having the diagnosis label of the depression.
- the preparing step includes a processing step of executing the clustering process for the plurality of second subjects.
- the processing step includes i) a step of acquiring features based on a plurality of brain functional connectivity correlation values that represent time correlation of brain activities among a plurality of predetermined brain area pairs for each of the plurality of second subjects, ii) a step of executing machine learning, through supervised learning, to generate an identifier model for discriminating presence or absence of the diagnosis label on the basis of the acquired features, iii) a step of selecting features for clustering in accordance with a degree of importance of features that are used to generate an identifier through the machine learning in the machine learning to generate the identifier model, and iv) a step of generating the clustering classifier by clustering the first cohort through a multiple co-clustering method as unsupervised learning on the basis of the selected features for the clustering.
- the therapy selection support method further includes a support information providing step of acquiring, from a database that stores the clusters obtained as a result of the stratification by the clustering classifier and corresponding predetermined therapy information in association with each other, and outputting corresponding therapy information in accordance with results of classification by the clustering classifier for the results of the measurement of the brain activities of the first subject.
- the predetermined therapy information is information related to a response to a therapy with a selective serotonin reuptake inhibitor.
- an embodiment of the present invention is directed to a therapy selection support method that provides information related to selection of a therapy for a first subject with depression symptoms on the basis of results of measurement of brain activities of the first subject.
- the therapy selection support method includes a support information providing step of acquiring, from a database that stores results of stratification of subjects having a diagnosis label of a depression, among a plurality of second subjects, and corresponding predetermined therapy information in association with each other, and outputting corresponding therapy information in accordance with clusters obtained as a result of stratification based on the results of the measurement of the brain activities of the first subject.
- the plurality of second subjects include a first cohort having a diagnosis label of a depression and a second cohort not having the diagnosis label of the depression.
- the clusters obtained as a result of the stratification are obtained by a clustering classifier obtained through a clustering process for results of measurement of brain functional connectivity correlation values.
- the clustering classifier is generated through a processing step of executing the clustering process for the plurality of second subjects.
- the processing step includes i) a step of acquiring features based on a plurality of brain functional connectivity correlation values that represent time correlation of brain activities among a plurality of predetermined brain area pairs for each of the plurality of second subjects, ii) a step of executing machine learning, through supervised learning, to generate an identifier model for discriminating presence or absence of the diagnosis label on the basis of the acquired features, iii) a step of selecting features for clustering in accordance with a degree of importance of features that are used to generate an identifier through the machine learning in the machine learning to generate the identifier model, and iv) generate the clustering classifier by clustering the first cohort through a multiple co-clustering method as unsupervised learning on the basis of the selected features for the clustering.
- the predetermined therapy information is information related to a response to a therapy with a selective serotonin reuptake inhibitor.
- an embodiment of the present invention is directed to a therapy selection support program that provides information related to selection of a therapy for a first subject with depression symptoms on the basis of results of measurement of brain activities of the first subject.
- the therapy selection support program causes a computer, when executed by the computer, to execute: a step of generating a clustering classifier that executes stratification in which results of measurement of brain functional connectivity correlation values acquired from a plurality of second subjects are divided into a plurality of clusters through a clustering process; and a step of receiving an input of the results of the measurement of the brain activities of the first subject and acquiring, from a database device that stores the clusters obtained as a result of the stratification by the clustering classifier and corresponding predetermined therapy information in association with each other, and outputting corresponding therapy information in accordance with results of classification by the clustering classifier for the measurement results.
- the plurality of second subjects include a first cohort having a diagnosis label of a depression and a second cohort not having the diagnosis label of the depression.
- the clustering process includes a processing step of executing the clustering process for the plurality of second subjects.
- the processing step includes i) a step of storing, in a storage device, features based on a plurality of brain functional connectivity correlation values that represent time correlation of brain activities among a plurality of predetermined brain area pairs for each of the plurality of second subjects, ii) a step of executing machine learning, through supervised learning, to generate an identifier model for discriminating presence or absence of the diagnosis label on the basis of the features stored in the storage device, iii) a step of selecting features for clustering in accordance with a degree of importance of features that are used to generate an identifier through the machine learning in the machine learning to generate the identifier model, and iv) a step of generating the clustering classifier by clustering the first cohort through a multiple co-clustering method as
- the predetermined therapy information is information related to a response to a therapy with a selective serotonin reuptake inhibitor.
- an embodiment of the present invention is directed to a therapy selection support program that provides information related to selection of a therapy for a first subject with depression symptoms on the basis of results of measurement of brain activities of the first subject.
- the therapy selection support program causes a computer, when executed by the computer, to execute a support information providing step of acquiring, from a database that stores results of stratification of subjects having a diagnosis label of a depression, among a plurality of second subjects, and corresponding predetermined therapy information in association with each other, and outputting corresponding therapy information in accordance with clusters obtained as a result of stratification based on the results of the measurement of the brain activities of the first subject.
- the clusters obtained as a result of the stratification are obtained by a clustering classifier obtained through a clustering process for results of measurement of brain functional connectivity correlation values.
- the plurality of second subjects include a first cohort having a diagnosis label of a depression and a second cohort not having the diagnosis label of the depression.
- the clustering classifier is generated through a processing step of executing the clustering process for the plurality of second subjects.
- the processing step includes i) a step of acquiring features based on a plurality of brain functional connectivity correlation values that represent time correlation of brain activities among a plurality of predetermined brain area pairs for each of the plurality of second subjects, ii) a step of executing machine learning, through supervised learning, to generate an identifier model for discriminating presence or absence of the diagnosis label on the basis of the acquired features, iii) a step of selecting features for clustering in accordance with a degree of importance of features that are used to generate an identifier through the machine learning in the machine learning to generate the identifier model, and iv) a step of generating the clustering classifier by clustering the first cohort through a multiple co-clustering method as unsupervised learning on the basis of the selected features for the clustering.
- the predetermined therapy information is information related to a response to a therapy with a selective serotonin reuptake inhibitor.
- an embodiment of the present invention is directed to a screening support system that supports screening of a first subject on the basis of results of measurement of brain activities of the first subject in a clinical test for a therapeutic means candidate for depression symptoms.
- the screening support system includes a clustering device that executes stratification in which results of measurement of brain functional connectivity correlation values acquired from a plurality of second subjects are divided into a plurality of clusters through a clustering process.
- the plurality of second subjects include a first cohort having a diagnosis label of a depression and a second cohort not having the diagnosis label of the depression.
- the clustering device includes a processor and a storage device, the processor being configured to execute the clustering process for the plurality of second subjects.
- the processor is configured to i) store, in the storage device, features based on a plurality of brain functional connectivity correlation values that represent time correlation of brain activities among a plurality of predetermined brain area pairs for each of the plurality of second subjects, ii) execute machine learning, through supervised learning, to generate an identifier model for discriminating presence or absence of the diagnosis label on the basis of the features stored in the storage device, iii) select features for clustering in accordance with a degree of importance of features that are used to generate an identifier through the machine learning in the machine learning to generate the identifier model, and iv) generate a clustering classifier by clustering the first cohort through a multiple co-clustering method as unsupervised learning on the basis of the selected features for the clustering.
- the screening support system further includes a support information providing device that receives an input of the results of the measurement of the brain activities of the first subject, that records results of classification by the clustering classifier for the measurement results in association with the first subject, and that outputs information for supporting the screening of the first subject based on the classification results.
- the processor is configured to, in the machine learning to generate the identifier model, generate a plurality of training sub-samples by executing under-sampling and sub-sampling from the first cohort and the second cohort, select features for clustering from a sum-set of features that are used to generate the identifier through the machine learning in accordance with a degree of importance of features that belong to the sum-set for each of the training sub-samples, and generate the clustering classifier by the multiple co-clustering method on the basis of the selected features for the clustering.
- the therapeutic means candidate is a therapy in which a selective serotonin reuptake inhibitor is used.
- an embodiment of the present invention is directed to a screening support device that supports screening of a first subject on the basis of results of measurement of brain activities of the first subject in a clinical test for a therapeutic means candidate for depression symptoms.
- the screening support device includes a support information providing device that includes a storage device that stores information for specifying a clustering classifier, that receives an input of the results of the measurement of the brain activities of the first subject, that records results of classification based on the clustering classifier for the measurement results in association with the first subject, and that outputs information for supporting the screening of the first subject based on the classification results.
- the clusters obtained as a result of the stratification are obtained by the clustering classifier obtained through a clustering process for results of measurement of brain functional connectivity correlation values by a clustering device.
- the clustering device includes a processor and a storage device, the processor being configured to execute the clustering process for a plurality of second subjects including a first cohort having a diagnosis label of a depression and a second cohort not having the diagnosis label of the depression.
- the processor is configured to, in a process of generating the clustering classifier, i) store, in the storage device, features based on a plurality of brain functional connectivity correlation values that represent time correlation of brain activities among a plurality of predetermined brain area pairs for each of the plurality of second subjects, ii) execute machine learning, through supervised learning, to generate an identifier model for discriminating presence or absence of the diagnosis label on the basis of the features stored in the storage device, iii) select features for clustering in accordance with a degree of importance of features that are used to generate an identifier through the machine learning in the machine learning to generate the identifier model, and iv) generate the clustering classifier by clustering the first cohort through a multiple co-clustering method as unsupervised learning on the basis of the selected features for the clustering.
- the therapeutic means candidate is a therapy in which a selective serotonin reuptake inhibitor is used.
- an embodiment of the present invention is directed to a screening support method that supports screening of a first subject on the basis of results of measurement of brain activities of the first subject in a clinical test for a therapeutic means candidate for depression symptoms.
- the screening support method includes: a step of a processor executing classification of the first subject in accordance with the results of the measurement of the brain activities on the basis of a clustering classifier specified by information stored in a storage device; and a step of recording results of the classification in association with the first subject and outputting information for supporting the screening of the first subject based on the classification results.
- a process of generating the clustering classifier includes a processing step of executing the clustering process for a plurality of second subjects including a first cohort having a diagnosis label of a depression and a second cohort not having the diagnosis label of the depression.
- the processing step includes i) a step of acquiring features based on a plurality of brain functional connectivity correlation values that represent time correlation of brain activities among a plurality of predetermined brain area pairs for each of the plurality of second subjects, ii) a step of executing machine learning, through supervised learning, to generate an identifier model for discriminating presence or absence of the diagnosis label on the basis of the acquired features, iii) a step of selecting features for clustering in accordance with a degree of importance of features that are used to generate an identifier through the machine learning in the machine learning to generate the identifier model, and iv) a step of generating the clustering classifier by clustering the first cohort through a multiple co-clustering method as unsupervised learning on the basis of the selected features for the cluster
- the therapeutic means candidate is a therapy in which a selective serotonin reuptake inhibitor is used.
- an embodiment of the present invention is directed to a screening support program that supports screening of a first subject on the basis of results of measurement of brain activities of the first subject in a clinical test for a therapeutic means candidate for depression symptoms.
- the screening support program causes a computer, when executed by the computer, to execute: a step of a processor executing classification of the first subject in accordance with the results of the measurement of the brain activities on the basis of a clustering classifier specified by information stored in a storage device; and a step of recording results of the classification in association with the first subject and outputting information for supporting the screening of the first subject based on the classification results.
- a process of generating the clustering classifier includes a processing step of executing the clustering process for a plurality of second subjects including a first cohort having a diagnosis label of a depression and a second cohort not having the diagnosis label of the depression.
- the processing step includes i) a step of storing, in a storage device, features based on a plurality of brain functional connectivity correlation values that represent time correlation of brain activities among a plurality of predetermined brain area pairs for each of the plurality of second subjects, ii) a step of executing machine learning, through supervised learning, to generate an identifier model for discriminating presence or absence of the diagnosis label on the basis of the features stored in the storage device, iii) a step of selecting features for clustering in accordance with a degree of importance of features that are used to generate an identifier through the machine learning in the machine learning to generate the identifier model, and iv) a step of generating the clustering classifier by clustering the first cohort through a multiple co-clustering method as unsupervised
- the therapeutic means candidate is a therapy in which a selective serotonin reuptake inhibitor is used.
- the brain functional connectivity correlation value clustering device directed to "the brain functional connectivity correlation value clustering device," “the brain functional connectivity correlation value clustering method,” and so on, “clustering" by artificial intelligence technique on brain functional connectivity image data of subjects (including patients of mental disease/psychiatric disorders) measured by a measurement system including a plurality of brain activity measuring devices will be taken as an example.
- the present invention is applied for time-sequentially measuring brain activities between a plurality of brain regions using "brain activity measuring devices” or, more specifically, "MRI devices” installed at a plurality of facilities and for classifying subjects having a specific disorder into a plurality of groups (sub-groups) in a manner allowing generalization at a plurality of facilities, based on time-correlation patterns (referred to as "brain functional connectivity") of these regions.
- major depressive disorder will be taken as an example of the “specific disorder.”
- the disease of subjects is not limited to "major depressive disorder,” and it may be any other disorder or disease, as the present invention relates to a technique of classifying "brain functional connectivity correlation values" of subjects in a data-driven manner. Further, any attribute of subjects that can be classified in accordance with the patterns of "brain functional connectivity correlation values" of subjects may be used, other than the disorder.
- MRI measurement systems a plurality of “MRI devices” are installed at a plurality of different facilities and inherently involve the site-to-site differences in measurements at the measurement facilities (measurement sites) including measurement bias derived from differences in measuring devices and differences between populations of subjects (sampling bias), which are independently evaluated as will be described later. Then, for each measurement value of each measurement site, a process is applied for correcting the site-to-site differences by removing the effects of measurement biases. Thus, the process of harmonizing the measurement results among the measurement sites (harmonization) is realized.
- brain functional connectivity values after harmonization are subjected to "feature selection" by ensemble learning using diagnosis labels of a specific disorder as teacher data, followed by clustering through unsupervised learning, so as to classify subjects' attributes (such as subtypes of psychiatric disorder).
- Fig. 1 is a schematic diagram illustrating a clustering (stratification) process of data measured by MRI measurement systems installed at a plurality of measurement sites.
- MRI devices 100.1 to 100.Ns are installed at measurement sites MS.1 to MS.Ns (Ns: number of sites), respectively.
- the subject cohorts PA.1 to PA.Ns are also referred to as second subject cohorts. People that belong to the second subject cohorts are also referred to second subjects. That is, the second subject cohorts include a plurality of second subjects.
- Each of the subject cohorts PA.1 to PA.Ns includes at least two cohorts to be classified, for example, a patient cohort and a healthy person cohort.
- the patient cohort is referred to as a first cohort herein when it is necessary to particularly differentiate the patient cohort from the healthy person cohort.
- Subjects that belong to the first cohort are subjects that have a diagnosis label of a depression on the basis of a diagnosis according to a diagnosis method such as the DSM-5, for example.
- the healthy person cohort is referred to as a second cohort herein when it is necessary to particularly differentiate the healthy person cohort from the patient cohort.
- Subjects that belong to the second cohort are subjects that do not have a diagnosis label of a depression.
- a patient cohort includes patients of mental disease and, more specifically, a cohort of "patients of major depressive disorder.”
- the "diagnosis label” determination method is not limited to the "symptom diagnosis method based on the DSM-5" according to the related art discussed above, and may be a determination method in which the results of analysis of measurement data on brain activities are determined as assistive information as described later, for example.
- the measurement protocols define, by way of example, the following.
- Default scanning direction may differ from MRI device to device. In some devices, it is impossible to freely set or change the scanning direction.
- the scanning direction possibly defines how an image is "distorted” and, hence, condition is set as a protocol, for example.
- Conditions are set for taking either "T1 weighted image” or “T2 weighted image” or both by a so-called spin echo.
- Conditions are set for imaging brain functional images of subjects in the "resting state” by fMRI (functional Magnetic Resonance Imaging).
- DWI diffusion (Weighted) Image
- the diffusion weighted image is one type of MRI sequence, imaging diffusion of water molecules.
- signal attenuation caused by diffusion is negligible.
- phase shift caused by the movement of each magnetizing vector during that time becomes considerable and a region of more vigorous diffusion comes to appear as having lower signals.
- the diffusion weighted image utilizes this phenomenon.
- EPI images are collected by multiple echo times, and the amount of EPI distortion is calculated based on these EPI images.
- field mapping it is possible to correct EPI distortion included in a new image.
- EPI distortion can be calculated and image distortion can be corrected.
- Measurement protocols may include excerpts of necessary sequence portions of the conditions described above as appropriate, or may have other sequences or conditions added as needed.
- sampling subjects picking up subjects to be measured at respective measurement sites MS.1 to MS.Ns
- the cause of the site-to-site differences of measurement values resulting from the bias in the sampling at various measurement sites will be referred to as a “sampling bias.”
- Typical subtypes include “melancholic,” “atypical,” “seasonal” and “postnatal” depressions. Depression in which "clinically meaningful improvement was not observed following thorough treatment with the use of two or more antidepressants with different action mechanisms and middle or severe symptoms continue” is referred to as “treatment resistant depression,” and, according to a report, this type may account for 10% to 20% of depressions. Specifically, a patient cohort generally diagnosed as having "major depression” is known to be far from homogeneous. To date, methods of classifying such subtypes based on objective measurement data have not been practically successful yet.
- the distribution of subtypes among patients having "major depressive disorder” is not always uniform due to various factors such as bias in nature caused by the locality of patients visiting hospitals of the measurement sites and the tendency of diagnosis at the hospitals. As a result, it is common that the subtype distribution among patients of the various measurement sites is biased, and hence, the "sampling bias" mentioned above arises.
- MRI devices 100.1 to 100.Ns it is not always the case that MRI devices having the same measurement characteristics are used at respective measurement sites.
- the site-to-site differences among measurement data may be generated depending on the conditions of the MRI devices and the measurement conditions of the MRI devices, such as the manufacturers of the MRI devices, the model numbers of the MRI devices, the static magnetic field strength in the MRI devices, and the number of coils (number of channels) of (transmitting) receiving coils of the MRI devices. Site-to-site differences resulting from such measurement conditions are referred to as "measurement biases.”
- the (transmitting) receiving coil generally, a “multi-array coil” is used in order to improve the signal-to-noise ratio of measured signals.
- the "number of receiving coils” means the number of "element coils” forming the multi-array coil.
- the receiving sensitivity is improved by improving the sensitivity of each element coil and by bundling the outputs.
- measurement-related data DA100.1 to DA100.Ns obtained from respective measurement sites MS.1 to MS.Ns are accumulated and stored in a storage device 210 in a data center 200.
- measured-related data includes “measurement parameters” of respective measurement sites, as well as “patient cohort data” and “healthy person cohort data” measured at respective measurement sites.
- patient cohort data and “healthy person cohort data” include, for each subject, “patient MRI measurement data” and “healthy person MRI measurement data,” respectively.
- Fig. 2 is a schematic illustration showing a procedure for extracting a correlation matrix representing the correlation of functional connectivity in a resting state of Regions of Interest (ROIs) of a subject's brain.
- ROIs Regions of Interest
- the "patient MRI measurement data” and the “healthy person MRI measurement data” in the “patient cohort data” and the “healthy person cohort data” include at least the following data.
- the data mentioned above is used as base data when computing system 300 shown in Fig. 1 calculates the brain activity biomarker as will be described later based on data stored in storage device 210.
- the correlation matrix data may be calculated at each measurement site based on time-sequential "brain function image data," and stored in storage device 210, and the computing system 300 may calculate the brain activity biomarker based on the data of the correlation matrix stored in storage device 210.
- time-sequential "brain function image data” may be stored in storage device 210, and computing system 300 may calculate the correlation matrix data and further calculate the brain activity biomarker on the basis of the "brain function image data" stored in storage device 210.
- each of the "patient MRI measurement data" and the “healthy person MRI measurement data” at least includes either the time-sequential "brain function image data” for calculating the correlation matrix data, or the correlation matrix data itself.
- the process for correcting EPI distortion through image processing may be done after the operation is done at each measurement site and the resulting data is stored in storage device 210.
- an anonymization process may be performed at each measurement site before storing data in the storage device 210.
- the anonymization process may be performed by computing system 300 if the operator of computing system 300 is legally authorized to handle personal information.
- an average "degree of activity" of each region of interest is calculated from fMRI data of n (n: a natural number) time points in the resting state measured on a real-time basis, and as shown in Fig. 2(b) , the correlation matrix of functional connectivity ("correlation value of activities") among the brain regions (among the regions of interest) is calculated.
- Functional connectivity is calculated as the time-wise correlation of blood oxygen level dependent (BOLD) signal of the resting state functional MRI between two brain regions of each participant.
- BOLD blood oxygen level dependent
- Nr regions as mentioned above and, hence, the number of independent non-diagonal components in the correlation matrix will be Nr ⁇ (Nr - 1) /2, considering the symmetry.
- the regions of interest may be set by the following methods.
- regions are picked up as regions of interest.
- ROIs the cerebellums (left and right) and the vermis of the Automated Anatomical Labeling Atlas are used, in addition to 137 ROIs included in the Brain Sulci Atlas (BAL).
- BAL Brain Sulci Atlas
- FC functional connectivity
- BAL Brain Sulci Atlas
- Automated Anatomical Labeling Atlas are disclosed in the following references.
- brain regions used may not be limited to those above.
- the regions to be selected may be changed in accordance with the neurological/mental disorder to be studied.
- Method 2 "Functional connectivity is defined based on brain regions of a functional brain map covering the entire brain.”
- brain regions of such a functional brain map are disclosed in the references listed below and, though not limiting, configuration formed of 268 nodes (brain regions) may be adopted.
- Reference 7 Shen X, Tokoglu F, Papademetris X, Constable RT. Groupwise whole-brain parcellation from resting-state fMRI data for network node identification. Neuroimage 82, 403-415 (2013 ).
- HCP human connectome project
- the toolbox disclosed at the site below may be used (ciftify toolbox version 2.0.2). https://edickie.github.io/ciftify/#/
- This toolbox enables the analysis of used data (even when T2 enhanced images necessary for the HCP pipeline are lacking) in a surface-based pipeline similar to the HCP.
- 379 surface-based areas 360 cortex areas + 19 subcortical areas
- ROIs regions of interest
- anatomical names of important ROIs and the names of intrinsic brain networks including the ROIs are specified by the automated anatomical labeling (AAL) as disclosed in the reference below and by the use of Neurosynth (http://neurosynth.org/locations/).
- this is a method of newly identifying a network from in-phase voxels without previous knowledge (brain map), referred to as “Canonical ICA” or “dictionary learning.”
- Fig. 3 is a schematic illustration showing examples of "measurement parameters" and "subject attribute data.”
- subject attribute data is stored associated with the "patient MRI measurement data” and the “healthy person MRI measurement data,” respectively, in the “patient cohort data” and the “healthy person cohort data” of Fig. 1 .
- the examples include a site ID for identifying the measurement site, a site name, a condition ID for identifying the measurement parameters, information related to the measuring device, and information related to the measurement conditions.
- the “measurement parameters” include "information related to the measuring device” and "information related to measurement conditions.”
- the "information related to the measuring device” includes the name of the manufacturer, the model number, and the number of (transmitting) receiving coils of the MRI device for measuring brain activities of subjects at each measurement site.
- the "information related to the measuring device” is not limited to these, and it may include static magnetic field strength, uniformity of magnetic field after shimming, and other indexes indicating performance of the measuring device, for example.
- the "information related to measurement conditions” includes the direction of phase encoding when an image is re-constructed (P -> A or A -> P), type of image (T1 weighted, T2 weighted, diffusion weighted, etc.), imaging sequence (spin echo or the like), whether the subject's eyes are open/closed during imaging, and so on.
- the "information related to measurement conditions” is not limited to these, either.
- the "subject attribute data" includes the subject's tentative ID as a pseudonym to prevent identification of the subject, condition ID indicating the measurement conditions when the subject was measured, and the attribute information of the subject.
- the "subject attribute information" includes sex and age of the subject, a label indicating either healthy or sick, the disease name of the subject as diagnosed by a doctor, medication profile and diagnosis history of the subject, and so on.
- the "subject attribute information" may be anonymized as needed at, for example, the measurement site.
- the subject's attribute information may be processed to maintain "k-anonymity" that reduces the probability of identifying an individual to 1/k or smaller by transforming data such that at least k data of "quasi-identifier" (same attribute) exist.
- "quasi-identifier” refers to an attribute such as "age,” “sex,” and “place of residence” that cannot identify an individual by itself but allows identification of an individual when combined.
- Medication profile and diagnosis history may be subjected to anonymization as needed, by randomizing or shifting (relativizing) the dates.
- the functional connectivity calculated by the above-described method as the correlation of temporal activities between each of the brain regions of each subject will be generally referred to as “functional connectivity” (or “FC” for short) between each brain region. If it is necessary to distinguish one functional connectivity from another for each brain region, a suffix will be added, as will be described later.
- Fig. 4 is a schematic diagram showing an overall configuration of an MRI device 100.i (1 ⁇ i ⁇ Ns) installed at respective measurement sites.
- MRI device 100.1 at the first measurement site is shown in detail as an example.
- Other MRI devices 100.2 to 100.Ns also have similar basic configurations.
- MRI device 100.1 includes: a magnetic field applying mechanism 11 for applying a controlled magnetic field to, and irradiating with RF wave, a region of interest of a subject 2 (which may be a first subject or a second subject); a receiving coil 20 for receiving a response wave (NMR signal) from subject 2 and outputting an analog signal; a driving unit 21 for controlling the magnetic field applied to subject 2 and controlling the transmission/reception of RF wave; and a data processing unit 32 for configuring a control sequence of driving unit 21 and processing various data signals to generate an image.
- a magnetic field applying mechanism 11 for applying a controlled magnetic field to, and irradiating with RF wave, a region of interest of a subject 2 (which may be a first subject or a second subject); a receiving coil 20 for receiving a response wave (NMR signal) from subject 2 and outputting an analog signal; a driving unit 21 for controlling the magnetic field applied to subject 2 and controlling the transmission/reception of RF wave; and a data processing unit 32 for configuring
- the central axis of a cylindrical bore in which subject 2 is placed is regarded as a Z-axis
- a horizontal direction orthogonal to the Z-axis and the vertical direction orthogonal to the Z-axis are defined as X-axis and Y-axis, respectively.
- nuclear spins of atomic nuclei forming subject 2 are oriented in the direction of magnetic field (Z-axis) and precess about the direction of magnetic field, with the Larmor frequency unique to the atomic nuclei.
- the atoms When irradiated with an RF pulse of the same Larmor frequency, the atoms resonate, absorb energy, and are excited, resulting in nuclear magnetic resonance (NMR). When the irradiation with RF pulse is stopped after the resonance, the atoms discharge energy and return to the original, steady state in a relaxation process. In the relaxation process, the atoms output electromagnetic wave (NMR signal) having the same frequency as the Larmor frequency.
- NMR signal electromagnetic wave
- the output NMR signal is received by receiving coil 20 as a response wave from subject 2, and the regions of interest of subject 2 are imaged by data processing unit 32.
- Magnetic field applying mechanism 11 includes a static magnetic field generating coil 12, a magnetic field gradient generating coil 14, an RF irradiating unit 16, and a bed 18 for placing subject 2 in the bore.
- subject 2 lies on his/her back on bed 18.
- subject 2 may view a screen displayed on a display 6 mounted perpendicular to the Z-axis using prism glasses 4, for example.
- Visual stimulus may be applied to subject 2 by an image on display 6 as needed.
- visual stimulus to subject 2 may be applied by projecting an image in front of subject 2 using a projector.
- Such a visual stimulus corresponds to the presentation of feedback information when neurofeedback is given to the subject.
- Driving unit 21 includes a static magnetic field power source 22, a magnetic field gradient power source 24, a signal transmitting unit 26, a signal receiving unit 28, and a bed driving unit 30 for moving bed 18 to any position along the Z-axis.
- Data processing unit 32 includes: an input unit 40 for receiving various operations and information input from an operator (not shown); a display unit 38 for displaying various images and various pieces of information related to the regions of interest of subject 2; a storage unit 36 for storing programs, control parameters, image data (structural images and the like), and other electronic data to cause execution of various processes; a control unit 42 for controlling operations of various functional units, including generating a control sequence for driving the driving unit 21; an interface unit 44 for performing transmission/reception of various signals to/from driving unit 21; a data collecting unit 46 for collecting data consisting of a group of NMR signals derived from the regions of interest; an image processing unit 48 for forming an image based on the data of NMR signals; and a network interface 50 for performing communication with a network.
- an input unit 40 for receiving various operations and information input from an operator (not shown); a display unit 38 for displaying various images and various pieces of information related to the regions of interest of subject 2; a storage unit 36 for storing programs, control parameters, image data (structural
- Data processing unit 32 may be a dedicated computer, or it may be a general-purpose computer programmed to perform functions causing operations of various functional units, in which designated operations, data processing, and generation of control sequence may be realized by a program or programs installed in storage unit 36. In the following, description will be given assuming that data processing unit 32 is implemented by a general-purpose computer.
- Static magnetic field generating coil 12 causes a current supplied from a static magnetic field power source 22 to flow through a helical coil wound around the Z-axis to generate an induction magnetic field, and thereby generates a static magnetic field in the Z-direction in the bore.
- the regions of interest of subject 2 are placed in the region of highly uniform static magnetic field formed in the bore.
- static magnetic field generating coil 12 is comprised of four air core coils, forms a uniform magnetic field inside by the combination of the coils, and attains orientation of the spins of prescribed atomic nuclei in the body of subject 2, or more specifically, the spins of hydrogen atomic nuclei.
- Magnetic field gradient generating coil 14 is formed of X-, Y-, and Z-coils (not shown), and provided on an inner peripheral surface of cylindrical static magnetic field generating coil 12.
- a shim coil (not shown) is used and "shimming" is performed.
- X-, Y-, and Z- coils superpose magnetic field gradients on the uniform magnetic field in the bore with the X-axis, Y-axis, and Z-axis directions switched in turn, whereby creating intensity gradient in the static magnetic field.
- the Z-coil When excited, the Z-coil tilts the magnetic field intensity to the Z-direction and thereby defines a resonance surface; the Y-coil applies a tilt for a short period of time immediately after application of the magnetic field in the Z-direction, and thereby adds phase modulation in proportion to the Y-coordinate, to the detected signal (phase encoding); and thereafter the X-coil applies a tilt when data is collected, and thereby adds frequency modulation in proportion to the X-coordinate, to the detected signal (frequency encoding).
- the switching of superposed magnetic field gradients is realized as different pulse signals are output to the X-, Y-, and Z-coils from the transmitting unit 24 in accordance with a control sequence.
- the position of subject 2 expressed by the NMR can be specified, and positional information in three-dimensional coordinates necessary to form an image of subject 2 are provided.
- images can be taken from various angles using the orthogonally crossing three sets of magnetic field gradients as described above, by allocating slice direction, phase encoding direction, and frequency encoding direction to the magnetic fields respectively and combining these.
- sagittal and coronal slices orthogonal thereto, as well as an oblique slice, of which direction perpendicular to its plane is not parallel to any of the axes of three orthogonally crossing magnetic field gradients can be imaged.
- RF irradiating unit 16 irradiates regions of interest of subject 2 with RF (Radio Frequency) pulses based on a high-frequency signal transmitted from signal transmitting unit 26 in accordance with a control sequence.
- RF Radio Frequency
- RF irradiating unit 16 is built in magnetic field applying mechanism 11 in Fig. 1 , it may be mounted on bed 18 or integrated with receiving coil 20 as a transmitting/receiving coil 20.
- Receiving coil 20 detects a response wave (NMR signal) from subject 2, and in order to detect the NMR signal with high sensitivity, it is arranged close to subject 2.
- NMR signal response wave
- an electromagnetic wave of NMR signal crosses a coil strand of receiving coil 20
- a weak current is generated by electromagnetic induction.
- the weak current is amplified by signal receiving unit 28 and converted from an analog signal to a digital signal, and then transmitted to data processing unit 32.
- a multi-array coil is used for improving the SN ratio, as described above.
- the mechanism here is as follows.
- a high-frequency electromagnetic field of resonance frequency is applied through RF irradiating unit 16 to a subject 2 in a state of static magnetic field with Z-axis magnetic field gradient added.
- Prescribed atomic nuclei for example, hydrogen atomic nuclei, at a portion where magnetic field intensity satisfies the condition of resonance are selectively excited and start resonating.
- Prescribed atomic nuclei at a portion satisfying the condition of resonance for example, a slice of prescribed thickness of subject 2 are excited, and (in a classic image drawing) spin axes concurrently start rotation.
- electromagnetic waves irradiated by the spin axes in rotation induce a signal in receiving coil 20 and, for some time, this signal is continuously detected.
- a tissue containing the prescribed atoms in the body of subject 2 is monitored in accordance with this signal. In order to know the position where the signal comes from, X- and Y-magnetic field gradients are added and the signal is detected.
- image processing unit 48 Based on the data built in storage unit 36, image processing unit 48 measures detected signals while repeatedly applying excitation signals, reduces resonance frequency to X-coordinate by a first Fourier transform, restores Y-coordinate by a second Fourier transform to obtain an image, and thus, displays the corresponding image on display unit 38.
- measurement data, measurement parameters, and subject attribute data from MRI device 100.1 as well as from MRI devices 100.2 to 100.Ns at other measurement sites are accumulated and stored in storage device 210 through a communication interface 202 in data center 200. Further, computing system 300 is configured to access data in storage device 210 through communication interface 204.
- Fig. 5 is a hardware block diagram of data processing unit 32.
- data processing unit 32 is not specifically limited as described above, a general-purpose computer may be used.
- a computer main body 2010 of data processing unit 32 includes, in addition to a memory drive 2020 and a disk drive 2030, a processor (CPU) 2040, a bus 2050 connected to disk drive 2030 and memory drive 2020, a ROM 2060 for storing programs such as a boot-up program, a RAM 2070 for temporarily storing instructions of an application program and providing a temporary memory space, a non-volatile storage device 2080 for storing application programs, system programs, and data, and a communication interface 2090.
- Communication interface 2090 corresponds to an interface unit 44 for transmitting/receiving signals to/from driving unit 21 and the like and a network interface 50 for communicating with another computer through a network (not shown).
- non-volatile storage device 2080 a hard disk (HDD), a solid-state drive (SSD), or the like may be used.
- Non-volatile storage device 2080 corresponds to storage unit 36.
- data processing unit 32 including, for example, functions of control unit 42, data collecting unit 46, and image processing unit 48 are realized by operation processes performed by CPU 2040 in accordance with a program.
- a program or programs causing data processing unit 32 to perform the functions of the present embodiment as described above may be stored in a DVD-ROM 2200 or a memory medium 2210 and inserted to disk drive 2030 or memory drive 2020 and may be further transferred to non-volatile storage device 2080.
- the program or programs will be loaded to RAM 2070 when to be performed.
- Data processing unit 32 further includes a keyboard 2100 and a mouse 2110 as input devices, and a display 2120 as an output device.
- Keyboard 2100 and mouse 2110 correspond to input unit 40
- display 2120 corresponds to display unit 38.
- the program or programs realizing the functions as data processing unit 32 as described above may not necessarily include an operating system (OS) for causing computer main body 2010 to perform the functions of information processing apparatus and the like.
- the program or programs may only include those portions of instructions which can call appropriate functions (modules) in a controlled manner to attain a desired result.
- OS operating system
- modules modules
- program or programs may be performed by one computer or by a plurality of computers. In other words, both centralized processing and distributed processing are possible.
- Hardware of computing system 300 has basically the same configuration as that shown in Fig. 5 , though there may be some difference such as use of parallel processing units or use of GPGPU (General-Purpose computing on graphic processing units). (Diseased/Healthy Discriminator Generating Process and Clustering Process Based on Brain Functional Connectivity)
- Fig. 6 is an illustration showing a process of generating a discriminator to serve as a diagnostic marker from correlation matrixes as described with reference to Fig. 2 and a clustering process.
- each of the resulting clusters represents a group of patients obtained in data-driven manner. If the patients are divided to subtypes, the results serve as a basis for "stratification of patients” having brain functional connectivity as a feature.
- fMRI image data in the resting state of healthy person cohorts and patient cohorts are taken by a plurality of MRI devices, and computing system 300 performs "pre-processing" as described below on the fMRI image data thus obtained. Thereafter, from the measured data of functional connectivity MRI data in the resting state, computing system 300 performs parcellation of brain regions of each subject, and derives correlation matrix of activities between brain regions (regions of interest).
- the computing system 300 subtracts the measurement bias from component values of the correlation matrix and, thus, realizes harmonization.
- computing system 300 performs generation of an identifier with feature selection while preventing overtraining as "identifier generating process through ensemble learning" as will be described later.
- a disease identifier capable of predicting whether a subject is healthy or has a disease is generated.
- computing system 300 performs feature selection for clustering as will be described later from the features (brain functional connectivity) specified in the process of generating the identifier and then, performs multiple co-clustering by "unsupervised learning.”
- the first 10 seconds of measured fMRI data are discarded to take the T1 equilibrium into consideration.
- the computing system 300 performs the calibration of slice timing, the re-alignment process for correcting body motion artifacts observed at one's head, co-registration of the brain functional image (EPI image) and the morphological image, the distortion correction, segmentation of the T1 enhanced structural image, the normalization to the MNI (Montreal Neurological Institute) space, and spatial smoothing using the isotropic Gaussian kernel of 6 mm full-width at half maximum, for example.
- the "surface-based method” may be utilized in accordance with "Method 3" described above, though not limiting.
- Physiological noise regression is performed by applying the CompCor disclosed in the reference below.
- the linear regression with regression parameters such as six kinematic parameters, whole brain, etc. is used.
- Computing system 300 applies a temporal bandpass filter to the time-sequential data using Butterworth filter having pass bands between 0.01 Hz and 0.08 Hz, for example, so that the analysis is limited to low-frequency fluctuation characteristic of the BOLD behavior.
- Frame-wise displacement is calculated in each functional session, and in order to reduce variation in spurious of the functional connectivity FC caused by head movement, any volume having FD > 0.5 mm is removed, for example.
- FD represents head movement between two temporally continuous volumes as a scalar quantity (that is, the sum of absolute displacements in translation and rotation).
- the functional connectivity FC is calculated as a temporal correlation of the BOLD signals over 379 regions of interest (ROIs) for each participant.
- the Pearson's correlation coefficient is used for calculating functional connectivity.
- disease factors tend to be confounded with site factors and, therefore, when disease factors are to be extracted by applying machine learning to data obtained under different conditions, the site-to-site differences pose the biggest barrier.
- One site tends to sample only a few types of mental diseases (for example, mainly schizophrenia at site A, mainly autism at site B, and mainly major depressive disorder at site C), leading to confounding.
- mental diseases for example, mainly schizophrenia at site A, mainly autism at site B, and mainly major depressive disorder at site C, leading to confounding.
- the site-to-site differences essentially include two types of biases.
- a technical bias or measurement bias
- a biological bias or sampling bias
- the measurement bias involves differences in imaging parameters, electric field strength, and the characteristics of MRI scanners such as the MRI manufacturers and the scanner models.
- the sampling bias relates to differences of subject cohorts from one site to another.
- Non-Patent Literature 8 Alumu Yamashita et al.
- the "ensemble learning” refers to a process of preparing K sets of training data by sampling with replacement from original training data, generating K identifiers independently for respective training data through machine learning, integrating these K identifiers, and thereby generating a discriminator.
- each identifier will be an identifier that serves to solve the problem of identifying two classes.
- identifier realized through learning with feature selection such as an identifier using LASSO (least absolute shrinkage and selection operator) by L1 regularization, or regularization learning such as Ridge regularization (L2 regularization) may be applicable.
- LASSO least absolute shrinkage and selection operator
- regularization learning such as Ridge regularization (L2 regularization) may be applicable.
- regularization learning refers to a method of learning that, while using all the features of original training data, assigns a penalty, in a learning algorithm, to increased model complexity during learning, and determines the training model having the minimum sum of training error and the penalty, thereby improving generalization performance.
- L1 regularization uses sum of absolute values of training model parameters (corresponding to the features) as the penalty, while L2 regularization uses sum of squares of training model parameters as the penalty.
- L0 regularization is also possible, in which the number of features themselves used for the model is used as the penalty.
- LASSO method (L1 regularization) allows for a so-called sparse estimation, and its derivatives include Elastic Net method, Group Lasso method, Fused Lasso method, Adaptive Lasso method, and Graphical Lasso method.
- identifier trained with feature selection it is possible to use a method such as “random forest method” which not only selects features but also specifies their respective importance in generating an identifier.
- the parcellation method may be such an ensemble learning wherein Dictionary Learning method is used in configuring brain regions as the object of analysis in a data-dependent manner, tangent-space covariance is used as values of functional brain connectivity, ComBat method, which will be described later, is used in realizing facility-to-facility correction of brain functional connectivity FC in a dataset, and Ridge regularization is used to generate an identifier.
- Dictionary Learning method is used in configuring brain regions as the object of analysis in a data-dependent manner
- tangent-space covariance is used as values of functional brain connectivity
- ComBat method which will be described later, is used in realizing facility-to-facility correction of brain functional connectivity FC in a dataset
- Ridge regularization is used to generate an identifier.
- Other combinations may be adopted as the parcellation method, the method of calculating brain functional connectivity, the harmonization method, and the method of generating an identifier.
- the ensemble training specifies the "importance" of each feature for achieving the function of identification during the identifier training.
- the "importance" is determined in the following manner.
- the condition for specifying the "second feature" is not limited to the prescribed number from the top of the ranking list.
- a feature that has a prescribed frequency or higher in the ranking list may be used as a condition.
- clustering is performed through “multiple co-clustering" which is an unsupervised learning, as will be described later, based on the selected feature(s).
- the process for generating a classifier for classifying two classes or more specifically, a process of forming a biomarker for MDD using training dataset as the training data for a disease identifier (two-class classifier for "healthy” and "sick") will be described as an example.
- the process of generating a classifier will be described concerning major depressive disorders as an example among mental diseases or psychiatric disorders, i.e., concerning a group of patients diagnosed as having major depressive disorder by doctors in accordance with the conventional method of symptom-based diagnosis approach. Then, an example will be given in the following concerning the process performed by the disease identifier generator 3008 shown in Fig. 8 to generate a classifier that outputs assisting information for discriminating a patient cohort from a healthy person cohort.
- features used for clustering are selected in accordance with the "importance" to the construction of disease identifier of each functional connectivity FC.
- Figs. 7 and 8 are functional block diagrams showing configurations of a computing system 300 performing a harmonization process, a disease identifier generating process, a clustering classifier generating process, and a discriminating process based on the data stored in storage device 210 of data center 200.
- the "discriminating process” includes discrimination of disease (whether the subject has a disease or is healthy) and a classifying process of determining to which "cluster” (subtype) the subject of interest belongs.
- computing system 300 includes: a storage device 2080 for storing data from storage device 210 as well as data generated during the course of the calculation; and a processor 2040 performing operation on data in storage device 2080.
- Processor 2040 may be a CPU, for example.
- Processor 2040 includes: a correlation matrix calculating unit 3002 for calculating elements of the correlation matrix for the MRI measurement data 3102 of patient cohort and healthy person cohort by performing a program and storing the results as correlation matrix data 3106 in storage device 2080; a harmonization calculating unit 3020 for performing the harmonization process; and a learning and discriminating unit 3000 for performing the disease identifier generating process, the clustering classifier generating process, and the discriminating process using the generated disease identifier or clustering classifier, based on the result of harmonization process.
- Fig. 8 is a functional block diagram showing the configuration of Fig. 7 in greater detail.
- Fig. 9 is a flowchart illustrating the procedure of machine learning for generating the disease identifier through ensemble learning.
- fMRI measurement data of subjects healthy persons and patients
- attribute data of subjects and measurement parameters are collected from respective measurement sites and stored as "training dataset" in storage device 210 of data center 200.
- a biomarker for the MDD discrimination is built using the above-described training dataset as the training data for the disease identifier (two-class classifier for "healthy” and "sick").
- the marker identifies a healthy person cohort (a group of samples having a diagnosis label of healthy control (HC)) and an MDD patient cohort (a group of samples having a diagnosis label of Major Depressive Disorder) based on 71,631 values of functional connectivity FC.
- an optimal subset of the functional connectivity FC is selected from 71,631 functional connectivity FC using the logistic regression analysis (one of sparse modeling methods) by the L1 regularization (LASSO: least absolute shrinkage and selection operator).
- the method of sparse modeling is not limited to the LASSO method, and other methods such as the sparse logistic regression (SLR) which applies the variational Bayesian method to the logistic regression, as will be described later, may be used.
- SLR sparse logistic regression
- correlation matrix calculating unit 3002 calculates elements of the connectivity matrix using prepared (i.e., stored in storage device 2080) training dataset (S102).
- harmonization calculating unit 3020 performs the harmonization process using calculated measurement biases (S104).
- disease identifier generator 3008 generates the MDD identifier by applying a method which is a so-called “ensemble learning method,” that is, a modification of "Nested Cross Validation" on the training data.
- disease identifier generator 3008 sets K to 10, for example, and divides the training data into 10 subsets.
- disease identifier generator 3008 uses one of the subsets of the K-fold (10-divided) data as a "test dataset” for validation, and assigns the remaining (K-1) (nine) data subsets as training dataset (S108, S110).
- disease identifier generator 3008 performs an "under-sampling process” and a "sub-sampling process” on the training dataset (S112).
- the "under-sampling process” means a process performed to even out the numbers of data in the training dataset corresponding to the specific, different (two or more) attributes that are the targets of the classification, when their numbers are different. Namely, it is a process of removing some data from a larger group of data having an attribute, so that the numbers of the data of different attributes will be equal.
- the number of subjects of the MDD patient cohort is not equal to the number of subjects of healthy person cohort and, therefore, the process to equalize is performed.
- the "sub-sampling process” means a process of extracting a prescribed number of random samples from the training dataset.
- disease identifier generator 3008 performs a process for adjusting hyper parameters for each of the sub-samples 1 to 10 that have been sub-sampled (S1 14.1 to S114.10).
- an identifier sub-model is generated by using the following logistic function on each sub-sample.
- c sub ; w 1 1 + exp ⁇ w T c sub .
- the weight vector w is determined to minimize the following evaluation function (cost function) (LASSO calculation).
- ⁇ represents a hyper parameter and it controls the amount of shrinkage used for the evaluation.
- the hyper parameter ⁇ is in the range of 0 ⁇ ⁇ ⁇ 1.0
- disease identifier generator 3008 divides this range into equal P intervals (P: natural number), for example, 25 intervals, and using each of the resulting ⁇ values, determines the weight vector w by the LASSO calculation mentioned above.
- disease identifier generator 3008 compares the discrimination performance (for example, accuracy) for the hyper parameter adjusting data using a logistic function corresponding to each generated ⁇ value, and selects the logistic function that corresponds to the parameter ⁇ that attains the highest discrimination performance (hyper parameter adjustment process).
- disease identifier generator 3008 configures an "identifier sub-model" to output an average of output values of the logistic function corresponding to the sub-samples generated in the current loop of cross validation (S116). Because the identification performance is determined based on an average of identifier output values calculated for each sub-sample, this can be regarded as one type of "ensemble learning.”
- disease identifier generator 3008 uses the test dataset prepared at step S110 as an input to perform the validation of the identifier sub-model generated in the current loop of cross validation (S118).
- sparse modeling methods may be used other than the methods of using the LASSO method together with the hyper parameter adjustment described above.
- disease identifier generator 3008 selects a sub-dataset of the K-divided data which is different from those used in past loops as the test dataset, assigns the remaining sub-datasets as the training dataset (S108, S110), and repeats the process.
- the MDD identifier can be regarded as an "identifier" obtained as a result of "ensemble learning” in that it provides an average of outputs from K ⁇ M identifiers as its identifying output.
- the output of the MDD identifier (probability of diagnosis) exceeds 0.5, it can be regarded as an index pointing to an MDD patient.
- the method of generating an identifier of an object disease (for example, MDD) by using a feature (here, components of the correlation matrix after the harmonization of the measurement biases) selected at each sub-sample is not limited to the process of averaging outputs of a plurality of identifier sub-models as described above.
- a classifier may be generated by majority voting or by using other modeling methods, particularly other sparse modeling methods, on the selected features.
- Fig. 10 shows the demographic characteristics of the training dataset (Dataset 1).
- Dataset 1 is the data in the above-described SRPBS dataset.
- Fig. 11 shows the demographic characteristics of the independent validation dataset (Dataset 2).
- Dataset 2 is also, basically, the data in the SRPBS above.
- Dataset 1 is a "training dataset” and used for building MDD identifiers and clustering classifiers.
- the “demographic characteristics” in the dataset are the characteristics used in the so-called “demographics,” and include the age, sex, and attributes such as the diagnosis listed in the table.
- the number of persons in the parentheses indicates the number of participants having the BDI score data.
- the demographic distributions do not have statistically significant differences between the MDD and the HC sample groups in every training dataset (p > 0.05).
- Dataset 2 is the "independent validation dataset,” which is used for testing the MDD classifiers and the clustering classifiers.
- the sites used for the imaging of Dataset 2 are not included in Dataset 1.
- the demographic distribution of age matches between the MDD and the HC sample groups (p > 0.05) in the independent validation dataset, while the demographic distribution of sex does not match between the MDD and the HC sample groups in the independent validation dataset (p ⁇ 0.05).
- harmonization method is not limited to this, and other methods, such as the ComBat method, may be used, for example.
- the ComBat method is disclosed, for example, in the reference below.
- the traveling subject harmonization method makes it possible to remove the pure site-to-site differences (measurement biases).
- Fig. 12 shows the prediction performance (output probability distribution) of MDD on the training dataset for all imaging sites.
- the identifier model separates the MDD patients from the HC cohort with the accuracy of 66%.
- the corresponding AUC is 0.77, showing a high identifying ability.
- the MCC is about 0.33.
- Fig. 13 shows the prediction performance (identifier output probability distribution) of MDD on the training dataset for each imaging site.
- Fig. 14 shows the identifier output probability distribution of the MDD on the independent validation dataset.
- the generalization performance of the identifier models is tested using an independent validation dataset.
- the generated identifier models separate the MDD sample group from the HC sample group with the precision of about 70%.
- the corresponding AUC is 0.75, indicating a performance attaining a high identifying ability (permutation test p ⁇ 0.01).
- the probability distribution of outputs from the identifier models are clearly separated into two diagnoses corresponding to the groups of the MDD patients and the healthy persons, that is, to the right (MDD) and to the left (HC), by the threshold value of 0.5.
- Sensitivity is 68%, and specificity is 71%. This leads to a high MCC value of 0.38 (permutation test p ⁇ 0.01).
- Fig. 15 shows the identifier output probability distribution of the MDD with respect to the independent validation dataset for each imaging site.
- Fig. 6 the process referred to as “feature selection” and “clustering” in Fig. 6 will be described as processes performed by disease identifier generator 3008 and a clustering classifier generator 3010 shown in Fig. 8 .
- Fig. 16 is a flowchart representing a process of clustering by unsupervised learning by selecting features.
- brain functional connectivity comes to have as high as 70000 dimensions or higher depending on the method of brain parcellation, and hence, it is difficult to perform clustering through unsupervised learning in a common manner.
- features are ranked in accordance with their importance, and “clustering through unsupervised learning” using the features selected in accordance with the ranking is combined to enable such clustering process.
- the clustering process is described as a process different from the process for generating a disease identifier. It is noted, however, that steps S200 to S210 of Fig. 16 are the same as steps S100 to S 120 of Fig. 9 , and the process for generating a disease identifier and the clustering process can be performed as a series of processes.
- disease identifier generator 3008 prepares subject data of a healthy person cohort of Nh persons and a depression disorder cohort of Nm persons (S202). With the functional brain activity data of the subjects, disease identifier generator 3008 performs division of brain regions (parcellation), calculates brain functional connectivity values, and performs harmonization (S204).
- disease identifier generator 3008 performs data division for Ncv-fold cross validation (Ncv: natural number and Ncv ⁇ 2) and prepares a training dataset and a test dataset for each divided data. For each training dataset, under-sampling and sub-sampling are performed to generate Ns test data subsets (S206).
- disease identifier generator 3008 generates an identifier through learning with feature selection, for each of the sub-samples thus sub-sampled (S208).
- steps S206 to S208 as described above is repeated on the Ncv-divided training data set while successively changing combinations of training dataset ((Ncv-1) of the divided dataset) and the test dataset (one of the divided data sets), until cross-validation is done Ncv times.
- An integrated identifier having the average of (Ns ⁇ Ncv) identifiers generated in this manner as an output is generated as a disease identifier (diagnosis marker) (S210).
- clustering classifier generator 3010 performs ranking of the features in the sum set in accordance with the number of times each feature is selected (S220).
- the "number of times each feature is selected" will be referred to as the importance of the feature in this ranking.
- identifiers are generated by LASSO method, and the number of selections of any brain functional connectivity of having non-zero weight in each identifier is incremented by 1.
- the connectivity having a larger count is ranked as one having higher importance.
- clustering classifier generator 3010 selects a prescribed number of features, for example, in accordance with the importance, from the sum set (S222).
- clustering classifier generator 3010 performs clustering, using multiple co-clustering as will be described later as the method of unsupervised learning (S224).
- clustering classifier generator 3010 generates a clustering classifier for the patient cohort of depression disorder (S226).
- clustering classifier generator 3010 specifies, from monitored data of each cluster, a probability distribution model that generates such monitored data, and information of each model is stored in storage device 2080 in disease identifier data. Then, a discrimination value calculator 3012 as the clustering classifier calculates, for any input data other than the training data, posterior probability at which the input data belongs to each cluster based on each probability distribution model and outputs, to the cluster which has the highest posterior probability, the result of classification that the input data belongs to that cluster (MAP: Maximum A posteriori Probability estimation method).
- MAP Maximum A posteriori Probability estimation method
- the clustering process has been described as being based on the process of generating identifiers performed by disease identifier generator 3008 on the data of a healthy person cohort of Nh persons and a depression disorder cohort of Nm persons.
- the clustering method in accordance with the present invention is not limited to such an example. It is applicable to a patient cohort of diseases other than "depression disorder.”
- the method can be used for clustering patient cohort of other mental disorders such as "patient cohort of schizophrenia," “patient cohort of autism,” or "patient cohort of obsessive-compulsive disorder.”
- any attribute label classified empirically by humans for example, one's personality, one's specialty, and so on
- a certain attribute has a prescribed relation with a pattern of correlation between brain regions of time-change in brain activities, it is possible to use the method for "clustering of subject cohort belonging to the certain attribute" (classification to subtypes) in a data-driven manner, for the subjects classified in accordance with the attribute label.
- the importance is determined in accordance with the degree of contribution of each feature to the identification. For example, what matters in the "learning with feature selection” is the fact that the feature is selected, and what matters in the “learning without feature selection” is the weight of the feature on the calculated identification.
- the "learning with feature selection” may be a so-called “sparse modeling” such as the LASSO method described above, for example.
- features are selected sparsely. Specifically, specific features will have non-zero weights while other features have zero weight, and thus, features are selected.
- One reason why such sparse feature selection can be realized is as follows. When a "group of features contributing in a similar manner" to a “discrimination (identification) process" exists, there is a “penalty term corresponding to the number of features" to allow the learning process to proceed such that one feature of the group is selected and other features of the group come to have the weights of zero. This tendency is particularly dominant in the LASSO method.
- Fig. 17 shows a concept of performing feature selection when a plurality (for example, Nch) of features exist, by "learning with feature selection.”
- the subject cohort as the target for learning includes a healthy person cohort and a patient cohort.
- Subjects of the healthy person cohort are labeled H, and the healthy person cohort includes subtypes h1 and h2.
- Subjects of the patient cohort are labeled M, and the patient cohort includes subtypes m1, m2, and m3.
- the identification labels of subtypes are latent labels that are not explicitly given to the subjects.
- the object of "clustering" is to perform data-driven clustering to the subtypes from the observables.
- Under-sampling and “sub-sampling” are performed on the subjects from the healthy person cohort and the patient cohort as such at random.
- subjects in the circles surrounded by dotted lines, for example are selected respectively from the healthy person cohort and the patient cohort.
- features (brain functional connectivity correlation values) usable for identifying label M and label H are those in the area surrounded by a chain-dotted line in Fig. 17 ("sum-set of brain functional connectivity links" at step S220 of Fig. 16 ), among the brain functional connectivity links as the features (Nch features in total) characterizing each subject.
- Fig. 18 is an illustration showing the features finally selected after under-sampling and sub-sampling, when one identifier is generated by learning with feature selection.
- one feature is selected from each group of the dotted frames, and thus, the features are made sparse.
- Fig. 19 is an illustration showing how features are selected when an identifier is generated by performing under-sampling and sub-sampling processes a number of times.
- a sum-set of features usable for identifying label M and label H is selected by executing the under-sampling and sub-sampling processes a number of times.
- the features selected for each sub-sample by the learning of identifiers with feature selection in accordance with the LASSO method are ranked in the order of frequency of selection.
- Clustering through unsupervised learning is performed using a prescribed number of features starting from the highest of the rank, for example, the highest one hundred features, by "multiple co-clustering" as will be described later at step S224 of Fig. 16 .
- the LASSO method has been described as an example, and feature selection for clustering is performed in accordance with the rank in accordance with the frequency of selection.
- "learning of identifiers with feature selection” is not limited to such a method, and a method such as random forest method may be used, and feature selection for clustering may be done in accordance with prescribed importance.
- identifier learning process through ensemble learning it is possible to use Ridge regularization or the like, and features may be ranked in accordance with the importance that corresponds to the median of the sum of absolute values of weight coefficients as described above.
- the feature selection for clustering may be performed using a prescribed number of features from the highest one of the ranks prepared in this manner.
- clustering refers to a method of data classification through unsupervised learning performed by a computer and, more specifically, to a method of automatically classifying given data without any external criterion.
- class separation generally refers to a method of classification through "supervised learning.”
- a “cluster” is defined to be a subset of data having the properties of internal cohesion and external isolation.
- external isolation refers to the property that objects belonging to different clusters are dissimilar
- the internal cohesion refers to the property that objects in the same cluster are similar to each other.
- distance between components in the set is defined as the measure of "similarity.”
- a distance is defined to satisfy the so-called “axioms of distance” and Euclidian distance, Mahalanobis' distance, city block distance, or Minkowski distance is sometimes used as the distance.
- partitional optimization clustering which is a method of searching for partitioning that optimizes objective function defining goodness of a cluster
- k-means clustering which is one of the non-hierarchical methods
- aggregative hierarchical clustering and “divisive hierarchical clustering,” which are hierarchical clustering methods.
- clustering is not limited to the above. There is also an algorithm that, assuming that a plurality of objects to be clustered arise in accordance with a certain probability distribution in each cluster, performs clustering to estimate the "probability distribution.” "Clustering with Gaussian mixture distribution,” for example, is known as this type of clustering method, and is known to realize more flexible clustering.
- each object is characterized by a plurality of features.
- Fig. 20 is an illustration showing a plurality of different manners of clustering depending on features.
- data items to be clustered are six letters “A,” “B,” “C,” “D,” “E,” and “F.”
- one same set of letters can be divided to different clusters depending on which feature is used for clustering.
- the letters can be clustered to three clusters, that is, ⁇ A, D ⁇ , ⁇ B, E ⁇ , and ⁇ C, F ⁇ , when "background pattern” is used; two clusters of ⁇ A, B, C ⁇ and ⁇ D, E, F ⁇ when “style” is used; and three clusters of ⁇ C, E, F ⁇ , ⁇ A, D ⁇ , and ⁇ B ⁇ as having zero, one, and two closed portions when "number of closed portions" is used.
- Fig. 20 shows an example in which one cluster is characterized by one feature, generally, one cluster is characterized by a plurality of features.
- Fig. 21 shows a concept of clustering when a plurality of objects is characterized by a plurality of features.
- a method of clustering objects partitioning the objects to a plurality of object clusters) and simultaneously clustering features to be related to each cluster as shown in Fig. 21(a) is referred to as "co-clustering," which is disclosed, for example, in the reference below.
- a generative model for the objects included in each cluster is assumed and parameters of each probability model are determined such that observed data will have higher likelihood.
- Fig. 22 is an illustration showing a concept of multiple clustering and a concept of multiple co-clustering.
- each feature cluster is specifically referred to as a "view (viewpoint)."
- Clustering different objects for different viewpoints of features in the manner as described above is referred to as “multiple clustering,” as shown in Fig. 22(b) .
- clustering with feature columns and object rows interchanged in each viewpoint may realize inference of a probability model having higher likelihood for the observed data, and this manner of clustering is referred to as "multiple co-clustering" as shown in Fig. 22(c) .
- multiple co-clustering is used even when there is only one view or there is only one type of feature cluster in at least one view when a plurality of views exist, and the terms “co-clustering” and “multiple clustering” are used as terms referring to subordinate concepts of “multiple co-clustering.”
- clustering refers to a generation of a set of clusters in one view.
- partitioning of features to views is performed simultaneously with clustering of objects as shown in Fig. 22(b)
- it is referred to as “multiple clustering”
- multiple co-clustering in which partitioning to views is performed simultaneously with co-clustering as shown in Fig. 22(c) .
- Fig. 23 is an illustration showing a concept in which probability models of different types of probability distributions are assumed in one view in "multiple co-clustering.”
- white blocks may have a probability distribution of continuous random variable and the hatched portions may have a probability distribution of discrete random variable.
- Fig. 24 is a flowchart outlining a method of learning of multiple co-clustering.
- clustering classifier generator 3010 divides features of a data matrix to partial groups at random, and thereby generates feature views and feature clusters in the views (S302; corresponding to generation of Y (initialization of Y) described later).
- clustering classifier generator 3010 generates partition of object clusters and optimizes the same in accordance with the feature views and the feature clusters generated at step S302 (step S304: corresponding to generation of Z described later).
- clustering classifier generator 3010 optimizes partitioning of features for the obtained object cluster (S306: corresponding to the Y generation process as described later, in which Y is optimized using the generated Z).
- clustering classifier generator 3010 determines whether or not the objective function satisfies a prescribed condition and converges (S308).
- This objective function corresponds to a function L(q( ⁇ )), which will be described later.
- the function L(q( ⁇ )) monotonically increases as Y and Z, which will be described later, are updated, and is determined to be converged if it is determined that the rate of this increase has come to be sufficiently small. If it does not converge (NO at step S308), clustering classifier generator 3010 returns the process to step S304 and if it converges (YES at step 308), the process proceeds to the next step.
- clustering classifier generator 3010 stores the magnitude of objective function in a storage device 2080 (S310).
- clustering classifier generator 3010 determines whether or not the process of steps S302 to S310 has been repeated a prescribed number of times. Clustering classifier generator 3010 returns the process to step S302 if repetition has not reached the prescribed number (NO at step S312), and the process proceeds to the next step if the number is reached (YES at S312).
- clustering classifier generator 3010 ends learning of multiple co-clustering, and thus generates a clustering classifier.
- Fig. 25 shows a graph expression of Bayesian inference in the method of learning multiple co-clustering shown in Fig. 24 .
- the multiple co-clustering model is summarized in the graphical model of Fig. 25 , which clarifies causality links between related parameters and data matrix.
- Data matrix X is assumed to be formed of a distribution family consisting of known M distributions.
- Probability distributions belonging to the distribution family may include Gaussian distribution, Poisson distribution, and category distribution/multinominal distribution.
- V common to all distribution families
- G v (m) the number of feature clusters for view v
- K v common to all distribution families
- a hierarchical structure of views and feature clusters is considered: views are first generated, followed by generation of feature clusters.
- features are partitioned in terms of pairs of view and feature cluster memberships, which implies that the allocation of partitioning of feature is jointly determined by its view and feature cluster.
- Y j.. (m) denotes view/feature cluster membership vector for feature j of distribution family m, which is generated by a hierarchical stick-breaking process
- the number of views with sufficient large V and the number of feature clusters with G are truncated in accordance with a prescribed condition. See the following reference, for example, for this process.
- concentration parameters ⁇ 1 and ⁇ 2, which are hyper parameters, are set to 1.
- a subject cluster membership vector of object i in view v is generated by the following expressions.
- Concentration parameter ⁇ is set to 1.
- each instance X i,j (m) independently follows a certain distribution, conditional on Y and Z.
- Parameters of distribution family m in the cluster block of view v, feature cluster g, and object cluster k are denoted as ⁇ v,g,k (m) .
- I(x) is an indicator function, which returns 1 when x is true and returns 0 otherwise.
- Variational Bayesian EM algorithm is used for MAP (maximum a posteriori) estimation of Y and Z.
- Variational Bayesian EM algorithm is disclosed in the reference below.
- q( ⁇ ) is an arbitrary distribution of parameter ⁇ . It can be proved that the difference between the left and right sides is given by the Kullback-Leibler divergence between q( ⁇ ) and p( ⁇ ), that is, KL(q( ⁇ ), p( ⁇
- q( ⁇ ) is selected so that it is factorized over different parameters (mean-field approximation).
- q ⁇ q w w q w ′ w q Y Y q u u q Z Z q ⁇ ⁇ ,
- each q( ⁇ ) is further factorized over subsets of parameters w v , w' g,v (m) , Y j.. (m) , u k, v , Z i,v , and ⁇ v,g,k (m) .
- ⁇ j,g,v (m) is normalized over pairs (g, v) for each pair (j, m).
- ⁇ i, v,k is normalized over k for each pair of (i, v).
- ⁇ (m) ⁇ m and ⁇ v ⁇ v are randomly initialized, and then hyper parameters are updated until the lower bound L(q( ⁇ )) of Equation (1) converges. This yields a locally optimal distribution q( ⁇ ) in terms of L(q( ⁇ )). This procedure is repeated a number of times and the best solution with the largest lower bound as the approximated posterior distribution q ⁇ ( ⁇ ) is selected.
- MAP estimates of Y and Z are then evaluated as argmax ⁇ q ⁇ ⁇ (Y) and argmaxz q*z(Z), respectively.
- Both terms on the right side can be derived in closed forms. It can be shown that this monotonically increases as q( ⁇ ) is optimized. Specifically, as already described, the function L(q( ⁇ )) has a property of monotonous increase as Y and Z are updated, and it is determined to be converged if the rate of increase is determined to be sufficiently small (for example, though not limiting, when a condition that the increment attains to a prescribed value or smaller is satisfied).
- a distribution family for each feature is identified, generating a data matrix for the corresponding distribution family.
- MAP estimates of Y and Z are generated for a set of these data matrices, and object/feature clusters in each view are analyzed using the estimates of Y and Z.
- the multiple co-clustering model is sufficiently flexible to represent different clustering models because the number of views and the number of feature/object clusters are derived in a data-driven approach. For example, when the number of views is one, the model coincides with a co-clustering model. When the number of feature clusters is one for all views, it matches the multiple-clustering model. Furthermore, when the number of views is one and the number of feature clusters is the same as the number of features, it matches conventional mixture models with independent features. Moreover, the model can detect non-informative features that do not discriminate between object clusters. In such a case, the model yields a view in which the number of object clusters is one. The advantage of this model is to automatically detect such underlying data structures.
- Fig. 26 shows Dataset 1 and Dataset 2 of a dataset divided into two.
- Dataset 1 includes data of 545 healthy persons and 138 patients of depression disorder obtained at Facilities 1 to 4
- Dataset 2 includes data of 263 healthy persons and 181 patients of depression disorder obtained at Facilities 5 to 8. Basically, these correspond to the datasets shown in Figs. 10 and 11 .
- Fig. 27 is an illustration showing a concept of clustering performed on each dataset.
- Dataset 1 is clustered by multiple co-clustering in accordance with the flow shown in Fig. 24 independently.
- clustering of Datasets 1 and 2 results in classification (forming groups) to clusters having the same or similar characteristics (groups of subjects), it means that such a data-driven clustering is performed with high generalization performance, independent of facilities or measuring devices.
- what matters is how to quantitatively evaluate the attained degree of the "classification to clusters having the same or similar characteristics.”
- Fig. 28 is an illustration showing an example of multiple co-clustering of subject data.
- an input data matrix has subjects arranged along the row direction and features along the column direction.
- multiple co-clustering on the input data matrix results in features divided into two views, and the subjects are clustered in each view, as shown in Fig. 28(b) .
- Fig. 29 shows results of multiple co-clustering actually performed on Datasets 1 and 2.
- Dataset 1 the features are partitioned into two views, that is, View 1 and View 2.
- View 1 the features are further co-clustered into two feature clusters, and the subjects are partitioned into five subject clusters.
- View 2 also, the subjects are partitioned into five clusters.
- Dataset 2 also, the features are partitioned into two views, that is, View 1 and View 2.
- View 1 the features are further co-clustered into two feature clusters, and the subjects are partitioned into four subject clusters.
- View 2 the subjects are partitioned into five clusters.
- Fig. 30 shows, in the form of a table, counts of brain functional connectivity links (FCs) allocated to respective views of Datasets 1 and 2.
- FCs brain functional connectivity links
- FCs are allocated to View 1 and 7 FCs to View 2 as features.
- the numbers of allocated brain functional connectivity links that match in Datasets 1 and 2 are plotted on the diagonal of the table. It can be seen that the brain functional connectivity links allocated to View 1 and View 2 are substantially the same in Datasets 1 and 2.
- Fig. 31 illustrates methods of evaluating similarity of clustering (generalization performance of stratification).
- Clustering 1 the result of classification of subjects in Dataset 1 using a classifier 1 formed by Dataset 1 is denoted as Clustering 1.
- Clustering 2 the result of classification of subjects in Dataset 2 using a classifier 2 formed by Dataset 2 is denoted as Clustering 2.
- Clustering 1' the result of classification of subjects in Dataset 2 using a classifier 1 formed by Dataset 1 is denoted as Clustering 1'.
- Clustering 2' the result of classification of subjects in Dataset 1 using a classifier 2 formed by Dataset 2 is denoted as Clustering 2'.
- clustering process is data-driven and the values of cluster indexes (order of index values) of Fig. 29 are of no significance. Therefore, the problem is how to evaluate the degree of similarity when one same dataset is subjected to different clustering processes.
- Rand index is known as a metric for evaluating the similarity (external validity index) between the two results of clustering.
- Rand index is defined as follows. a 11 + a 00 M .
- the Rand index may sometimes have high value even when random clustering is done" if, for example, the numbers of components in clusters in a dataset are biased. Therefore, more strictly, the following Adjusted Rand Index (ARI) is used.
- Fig. 32 illustrates concepts of ARI.
- ARI is disclosed, for example, in the reference below.
- the dataset when the results of two clustering tests are to be applied to the same dataset, the dataset may be classified into the same clusters in both tests, or the dataset may be classified into different clusters in both tests as shown in Fig. 32(a) . Meanwhile, the dataset may be classified into one same cluster once but to different clusters the next time, as shown in Fig. 32(b) .
- A represents the number of subject pairs that are [(classified to the same cluster twice over) + (classified to different clusters twice over)] through two different clustering processes
- max (A) represents the total number of pairs
- E represents the number of subject pairs having the same results of allocation even though the two clustering processes are independent from each other.
- Fig. 33 shows results of similarity evaluation between Clustering 1 and Clustering 1' and between Clustering 2 and Clustering 2', respectively.
- Fig. 33(a) shows, in the form of a table, ARIs calculated for respective views of Datasets 1 and 2.
- Fig. 33(b) shows results of Permutation Test corresponding to Fig. 33(a) .
- ARI values represented by solid lines
- Permutation Test represents the results of ARI value calculations while cluster attribute labels of subjects are exchanged at random, and the drawing shows the distributions thereof as histograms when such exchange was conducted a number of times. If similarity between clustering processes is statistically significant, the ARI value between the clustering processes as the object of comparison will have a value higher than when the components are exchanged at random with significance.
- Fig. 34 shows, in the form of a table, distribution of subjects allocated to respective clusters of View 1 in Clustering 1 and Clustering 1'.
- the following describes a method used for generating a "disease identifier" and a “clustering process” for stratification as described above, for evaluating a measurement bias and harmonizing measurement data independent of a sampling bias.
- Fig. 35 is an illustration showing a method of evaluating the site-to-site differences of subjects (hereinafter referred to as "traveling subjects"), who travel to be subjected to measurements at sites by rs-fcMRI in accordance with the present embodiment.
- a dataset of travelling subjects TS1 (number of subjects: Nts) is obtained.
- the resting state brain activities of Nts healthy participants are imaged at each of the Ns sites, and the Ns sites include all sites where patients' data are imaged.
- the obtained dataset of the traveling subjects is stored as the traveling subject data in storage device 210 of data center 200.
- the traveling subject dataset includes only the healthy person cohort. Further, it is assumed that the participants are the same in every site. Therefore, the site-to-site differences in traveling subjects consist only of the "measurement bias.”
- the "measurement bias” and the “sampling bias” are evaluated using "GLMM (Generalized Linear Mixed Model),” which is one of the methods of “statistical modeling.”
- GLM Generalized Linear Model
- GLM incorporates the "explanatory variable” explaining the probability distribution of the "response variable.”
- GLM mainly has three elements, that is, the “probability distribution,” the "link function,” and the “linear predictor.” It is possible to represent various different types of data by designating how to combine these three elements.
- GLMM Generalized Linear Mixed Model
- GLM Generalized Linear Mixed Model
- GLMM allows incorporation of the differences in sites in the model.
- it is a (mixture) model having a plurality of probability distributions as elements.
- Reference 8 Takuya KUBO, "Data kaiseki no tameno toukei modeling nyu'mon” (Introduction to statistical modeling for data analysis), Iwanami Shoten, 1st edition 2012, 14th edition, 2017 .
- bias will be used in the terms “measurement bias” and “sampling bias”
- factor will be used in other factors (subject factor or disease factor).
- Generalized Linear Mixed Model is applied in the following manner to the dataset including patients and to traveling subjects' dataset.
- Nsh represents the number of sites where the measurement of healthy persons was done
- Nsd represents the number of sites where the measurement of patients of a certain disease (here, represented by a suffix "dis”) was done.
- Participant factor (p), measurement bias (m), sampling biases (Shc, Sdis) and mental disease factor (d) are evaluated by fitting a regression model to the correlation values of the functional connectivity of all participants, from the measurement result dataset of patients and the traveling subjects' dataset.
- a vector is denoted by a small letter (for example, m), and it is assumed that every vector is a column vector.
- a vector element is denoted by a suffix such as m k .
- every target vector for example, x m
- every measurement bias m belonging to a site k has elements all equal to zero except for the element k that is equal to one.
- the target vector will be a vector of which elements are all equal to zero.
- Upper suffix T represents transpose of matrix or vector, and x T represents a row vector.
- m represents the measurement bias (column vector of Ns ⁇ 1)
- shc represents the sampling bias of healthy person cohort (column vector of Nsh ⁇ 1)
- sdis represents the sampling bias of a patient (column vector of Nsd ⁇ 1)
- d represents the disease factor (column vector of 2 ⁇ 1, having healthy and disease as elements)
- p represents the participant factor (column vector of Nts ⁇ 1)
- const represents an average of functional connectivity of all participants (including healthy persons, patients, and traveling subjects) at all measurement sites
- e ⁇ N (0, ⁇ -1 ) represents noise.
- the design matrix of the regression model does not have sufficient rank and, therefore, respective parameters are evaluated using the least square regression by L2 normalization.
- a different method of evaluation such as Bayesian estimation may be used, for example.
- Fig. 36 is an illustration showing how to express b-th functional connectivity of a subject a.
- Fig. 36 shows the meanings of target vectors of the first term and the second term as well as the measurement bias vector and the sampling bias vector of a healthy person.
- Fig. 37 is a flowchart showing a process of calculating a measurement bias for harmonization.
- fMRI measurement data of subjects healthy persons and patients
- attribute data of subjects and measurement parameters are collected from respective measurement sites to storage device 210 of data center 200 ( Fig. 37 S402).
- brain activities of traveling subject TS1 are measured while the subject travels from measurement site to measurement site, though not limiting, in a prescribed period (for example, in a one-year period) and the fMRI measurement data of the traveling subject, attribute data of the subject, and measurement parameters are collected from respective measurement sites to storage device 210 of data center 200 ( Fig. 37 S404).
- the harmonization calculating unit 3020 evaluates the measurement bias of each measurement site with respect to the functional connectivity ( Fig. 37 S406).
- the harmonization calculating unit 3020 stores the measurement bias of each measurement site calculated in this manner in storage device 2080, as measurement bias data 3108 ( Fig. 37 S408).
- Such a disease identifier provides assisting information (support information) for diagnosing a subject.
- a correlation value correcting unit 3004 reads measurement bias data 3108 of each measurement site stored in storage device 2080, and performs the harmonization process for the off-diagonal components of the correlation matrix of each subject as the object of training for machine learning to generate a disease identifier in accordance with the equation below.
- C sub Connectivity ⁇ x m T m ⁇ .
- m (hat) (a character x with “ ⁇ ” above will be referred to as "x (hat)"
- x (hat) represents the measurement bias at a measurement site evaluated by the least square regression by L2 normalization as described above.
- the method of removing a bias between measurement sites is not limited to the method based on the traveling subjects discussed above.
- other methods such as the ComBat method may also be used.
- the brain activity measuring devices measure data of brain activities obtained at a plurality of measuring sites, and generation of biomarkers and estimation (prediction) of diagnosis labels by the biomarkers are realized based on the brain activity data by distributed processing.
- the following process steps may be performed in a distributed manner at different facilities: i) the measurement (data collection) of brain activity data for training a biomarker through machine learning; ii) the process of generating a biomarker through machine learning and the process (estimation process) of estimating (predicting) diagnosis labels by the biomarker for a specific subject (object for estimation; hereinafter referred to as a "first subject”); and iii) the measurement of brain activity data of the specific subject above (measurement of brain activities of the first subject).
- Fig. 38 is a functional block diagram showing an example in which the data collection, the estimating process, and the measurement of brain activities of the object are processed in a distributed manner.
- sites 100.1 to 100.N represent facilities at which data of patient cohort and healthy person cohort (i.e. second subject cohort) are measured by brain activity measuring devices, and a management server 200 manages measurement data from sites 100.1. to 100.Ns.
- Computing system 300 generates an identifier from the data stored in server 200.
- Harmonization calculating unit 3020 of computing system 300 is assumed to perform the harmonization process including sites 100.1 to 100.Ns and the site of MRI measuring device 410.
- An MRI device 410 is provided at a separate site that utilizes the results from the identifier on computing system 300, and measures data of the brain activities of a specific subj ect.
- a computer 400 is provided on a separate site where MRI device 410 is installed, and calculates the correlation data of the brain functional connectivity of the specific subject from the measurement data of MRI device 410, sends the correlation data of functional connectivity to computing system 300, and utilizes the results from the identifier that are sent back.
- Server 200 stores the MRI measurement data 3102 of patient cohort and healthy person cohort transmitted from sites 100.1 to 100.Ns as well as the human attribute information 3104 of the subject associated with the MRI measurement data 3102, and transmits these data to computing system 300 in accordance with an access from computing system 300.
- Computing system 300 receives MRI measurement data 3102 and human attribute information 3104 of the subject from server 200 through a communication interface 2090.
- Hardware configurations of server 200, computing system 300, and computer 400 are basically the same as the configuration of "data processing unit 32" described with reference to Fig. 5 and, therefore, description thereof will not be repeated here.
- a correlation matrix calculating unit 3002 correlation value correcting unit 3004, disease identifier generator 3008, clustering classifier generator 3010, and discrimination value calculator 3012, as well as correlation matrix data 3106 of functional connectivity, measurement bias data 3108, corrected correlation value data 3110, and identifier data 3112 are the same as those described in the first embodiment and, therefore, description thereof will not be repeated here.
- MRI device 410 measures the brain activity data of a subject whose diagnosis label is to be estimated, while processor 4040 of computer 400 stores the measured MRI measurement data 4102 in a non-volatile storage device 4100.
- a processor 4040 of computer 400 calculates functional connectivity correlation matrix data 4106 in the similar manner as correlation matrix calculating unit 3002, based on MRI measurement data 4102, and stores the calculated data in non-volatile storage device 4100.
- a disease as an object of diagnosis is designated by a user of computer 400, and computer 400 transmits the functional connectivity correlation matrix data 4106 to computing system 300 in accordance with an instruction of transmission by the user.
- computing system 300 performs the harmonization process corresponding to the site where the MRI device 410 is installed.
- Discrimination value calculator 3012 calculates the result of discrimination on the designated diagnosis label and evaluation result on subtypes, and computing system 300 transmits the results to computer 400 through communication interface 2090.
- Computer 400 informs the user of the result of the discrimination using a display device (not shown) or the like.
- server 200 and computing system 300 may be managed by separate administrators. In that case, it becomes possible to improve the security of subject information stored in server 200 by limiting the computers that can access server 200.
- the "service of providing result of the discrimination" becomes possible while not providing any information at all of the identifier or information related to the "measurement biases" to the "side (computer 400) receiving the service of discrimination by the identifier.”
- fMRI real-time fMRI
- NIRS near-infrared spectroscopy
- electroencephalography any combination of these may be used as the brain activity detecting apparatus.
- fMRI and NIRS detect signals related to change in blood stream in the brain, and have a high spatial resolution.
- magnetoencephalography and electroencephalography are characterized in that they have a high temporal resolution, for detecting changes in an electromagnetic field associated with the brain activities.
- brain activities can be measured with both spatially and temporally high resolutions.
- a system for measuring the brain activities with both spatially and temporally high resolutions can also be implemented in a small, portable size.
- a "diagnosis label" is included as an attribute of a subject and, by generating an identifier through machine learning, the identifier is caused to function as a biomarker.
- the present invention is not necessarily limited to such an example.
- a group of subjects whose results of measurements are to be obtained as the object of machine learning is classified into a plurality of classes in advance by an objective method, the correlation of degrees of activities (connection) among brain regions (regions of interest) of the subjects are measured, and an identifier for classification can be generated by machine learning using the measured results, the present invention may be used for other discrimination.
- such a discrimination may indicate probability of the subject having a certain attribute.
- the apparatus in accordance with the embodiment of the present invention can be used as an apparatus for health management of users, besides diagnosis assistance.
- An embodiment of the present invention relates to a therapy selection support system 1000 that provides information related to selection of a therapy for a subject with depression symptoms on the basis of the results of measurement of brain activities of the subject.
- Fig. 39 shows the functional configuration of the therapy selection support system 1000.
- the therapy selection support system 1000 includes a computer 400 provided in a medical institution 4 and connected so as to be able to receive data from an MRI device 410 that measures brain activity data of a subject whose diagnosis label is to be estimated, a support information providing device 300a, a classifier generation device 300b that performs a process of generating a clustering classifier, a data server 200', and a therapy information providing server 500.
- a healthy person/patient database in a storage device 210 in the data server 200' manages MRI measurement data 3102 collected from sites at which MRI devices 100.1 to 100.N (not shown) are set and human attribute information 3104 of the subj ect.
- the support information providing device 300a corresponds in configuration to the computing system 300 shown in Fig. 38 except that: i) the support information providing device 300a receives an input of the results of measurement of brain activities of the subject transmitted from the computer 400 in the medical institution 4, and a processor 2040a executes a process of a therapy information generator 3200 to output corresponding therapy information in accordance with the results of classification by a clustering classifier executed as a discrimination value calculator 3012 for the measurement results; and ii) the processes of a disease identifier generator 3008 and a clustering classifier generator 3010 are executed by a processor 2040b in the classifier generation device 300b which is a computing system that is different from the support information providing device 300a.
- the support information providing device 300a and the classifier generation device 300b may be implemented as functions on an identical computer system.
- the classifier generation device 300b generates a disease identifier and a clustering classifier using data stored in the server 200' as "training data” (or “discovery cohort data”). Data stored in the server 200' (other than the training data) can also be used as validation data (or “validation cohort data") for the disease identifier and the clustering classifier.
- the healthy person/patient database in the storage device 210 of the server 200' does not only store the MRI measurement data 3102 and the human attribute information/measurement parameters 3104 of the subject, but also stores functional connectivity correlation matrix data calculated on the basis of the MRI measurement data 3102 and data on correlation values corrected through a harmonization process calculated in advance, although this is not particularly limiting.
- the disease identifier generator 3008 and the clustering classifier generator 3010 execute a learning process and a validation process on the basis of the corrected correlation values.
- the classifier generation device 300b itself may execute the processes of calculating functional connectivity correlation matrix data and correcting the correlation values through a harmonization process.
- Data acquired by the MRI device 410 may be added to the healthy person/patient database in the storage device 210 to re-train the disease identifier and the clustering classifier, although this is not particularly limiting.
- a harmonization calculating unit 3020 of the support information providing device 300a executes a harmonization process for the MRI measurement device 410 for the MRI devices 100.1 to 100.Ns (not shown).
- the MRI device 410 is provided in the medical institution 4 which uses the results from the clustering classifier of the support information providing device 300a, and measures brain activity data for a specific subject.
- Image data including brain structure image data and brain function image data
- Image data measured for the specific subject are subjected to an anonymization process in an anonymization processing unit 4042 of the computer 400, and thereafter transmitted to the support information providing device 300a.
- a so-called cloud computer may be used for the support information providing device 300a, although this is not particularly limiting.
- the computer 400 may be configured to calculate functional connectivity correlation data for the brain of a specific subject from measurement data from the MRI device 410, and to transmit the functional connectivity correlation data to the support information providing device 300a, although this is also not particularly limiting. In this case, conversion of image data into functional connectivity correlation data itself is equivalent to anonymization.
- the therapy information generator 3200 receives data in a therapy information DB 5100 in the therapy information providing server 500 from a therapy information providing system 5200, and returns corresponding therapy selection support data to an information presentation unit 4044 in accordance with the results of classification by the clustering classifier.
- the therapy information generator 3200 may be configured to receive from the therapy information providing system 5200 and store in advance information on the correlation between the classification results and therapy selection support data.
- the therapy information generator 3200 may be configured to transmit information on the classification results to the therapy information providing system 5200 as inquiry information as occasion requires, and to receive therapy selection support data returned from the therapy information providing system 5200 as an answer to the inquiry.
- the therapy information providing server 500 may be managed by a pharmaceutical company that develops therapeutic agents for diseases or a medical device manufacturer that develops therapy devices, for example, although this is not particularly limiting.
- the hardware configuration of the server 200', the support information providing device 300a, the classifier generation device 300b, and the computer 400 is basically the same as the configuration of the "data processing unit 32" described with reference to Fig. 5 , and thus description thereof will not be repeated here.
- the correlation matrix calculating unit 3002, the correlation value correcting unit 3004, the disease identifier generator 3008, the clustering classifier generator 3010, and the discrimination value calculator 3012 and the functional connectivity correlation matrix data 3106, the measurement bias data 3108, the corrected correlation value data 3110, and the identifier data 3112 are the same as those described in relation to the first embodiment, and thus description thereof will not be repeated here.
- the disease identifier generator 3008, the clustering classifier generator 3010, and the storage device 210 constitute a clustering device.
- the disease identifier generator 3008 and the clustering classifier generator 3010 are functions executed by the processor 2040b of the clustering device.
- the MRI device 410 measures brain activity data of a subject to be subjected to stratification by the clustering classifier.
- the computer 400 stores the measured MRI measurement data in a non-volatile storage device 4100.
- the computer 400 transmits the measurement data on the subject anonymized by the anonymization processing unit 4042 to the support information providing device 300a as the brain activity measurement result in accordance with an instruction for transmission from a user (e.g. a doctor).
- the measurement data to be transmitted are provided with a temporary ID for specifying the subject.
- a table of correspondence between the temporary ID and personal information such as a patient name, for example, can be managed so as to be inaccessible from the computer 400.
- the content of the table of correspondence is configured to be not accessible at all at least in the support information providing device 300a.
- a harmonization process corresponding to the site at which the MRI device 410 is installed is preferably executed, as necessary, in the support information providing device 300a.
- the discrimination value calculator 3012 outputs the classification results, which is the results of stratification by the clustering classifier, for the input measurement results of brain activities of the subject.
- the therapy information generator 3200 transmits the classification results and corresponding therapy selection support information to the computer 400 via a communication interface in accordance with the classification results.
- the information presentation unit 4044 of the computer 400 presents the therapy selection support information and the classification results for the specific subject returned from the therapy information generator 3200 of the support information providing device 300a to a doctor through a display device such as a display (not shown).
- Fig. 40 shows an example of the therapy information database 5100.
- the discrimination value calculator 3012 can classify the subject into Clusters 1 to 5, for example, using the clustering classifier.
- the therapy information database 5100 stores predetermined therapy information associated with therapies in accordance with the clusters.
- the therapy information may store information related to a past therapy history of the subjects classified into the clusters (in particular, subjects that belong to a patient cohort whose data are used to generate the clustering classifier) and therapy information (reference therapy information) to be referenced on the basis of effects and/or side effects reported in references and the like.
- the therapy information may store information that indicates the response of the subjects in the clusters to a specific therapeutic agent, information that indicates the response thereof to a specific physical therapy, etc.
- Fig. 40 recommended therapies based on the information related to the therapy history are stored for the clusters, from a first candidate to a third candidate in the descending order of effectiveness. Unrecommended therapies that may cause side effects or the like are also stored for the clusters as the reference therapy information.
- Therapeutic agents for depression include, but are not particularly limited to: tricyclic antidepressants such as amitriptyline hydrochloride, amoxapine, and imipramine hydrochloride; tetracyclic antidepressants such as setiptiline maleate, maprotiline hydrochloride, and mianserin hydrochloride; selective serotonin reuptake inhibitors such as escitalopram oxalate, sertraline hydrochloride, paroxetine hydrochloride hydrate, and fluvoxamine maleate; serotonin-noradrenaline reuptake inhibitors such as duloxetine hydrochloride, venlafaxine hydrochloride, and milnacipran hydrochloride; and noradrenergic and specific serotonergic antidepressants such as mirtazapine.
- tricyclic antidepressants such as amitriptyline hydrochloride, amoxapine, and imipramine hydrochloride
- Physical therapies for depression include transcranial magnetic stimulation, neurofeedback, electroconvulsive therapy, cognitive behavioral therapy, etc.
- the therapy selection support process is performed by a computer executing a therapy selection support program as a process of the therapy information generator 3200.
- Fig. 41 is a flowchart illustrating the flow of a process of supporting the selection of a therapy for a subject.
- the support information providing device 300a receives the results of measurement of brain activities of the subject from the computer 400.
- the results of measurement of brain activities of the subject include image data (brain structure image data and brain function image data) anonymized by the computer 400.
- the support information providing device 300a executes the processes of calculating functional connectivity correlation matrix data and executes a process of correcting correlation values through a harmonization process for the results of measurement of brain activities of the subject, and thereafter inputs the measurement results to the clustering classifier generated by the classifier generation device 300b and acquires a belonging cluster probability which is the results of stratification of the subject.
- the belonging cluster probability is output as a probability at which the subject belongs to each cluster for all the clusters into which the clustering classifier can perform stratification.
- the support information providing device 300a can determine a cluster with the highest probability as a cluster to which the subject belongs. Alternatively, the support information providing device 300a may determine two clusters with the highest probabilities as clusters to which the subject can possibly belong. At this time, the support information providing device 300a functions as a clustering processor.
- the support information providing device 300a acquires therapy information corresponding to the cluster of the subject from the therapy information database 5100 on the basis of the cluster as a result of stratification of the subject acquired in step S504. At this time, the support information providing device 300a may acquire at least two pieces of therapy information, that is, a first candidate and a second candidate, as the therapy information corresponding to the cluster of the subject. This makes it possible to increase the option of therapies.
- step S508 shown in Fig. 41 the support information providing device 300a outputs the therapy information acquired in step S506 to the computer 400 via a communication interface.
- the support information providing device 300a can provide a doctor with therapy selection support information for a subject on the basis of measurement data on brain activities of the subject.
- the term “therapy” means that a doctor "prescribes a specific medical agent and administers a specific dose of the medical agent to a subject to be taken in accordance with specific usage", or that a doctor "selects a specific therapeutic process and applies the therapy", and the term “therapy candidate” means a “candidate for a therapy” that has not been approved or certified by the competent authorities on the basis of a specific clinical test and the like.
- the term “therapeutic process” means cognitive behavioral therapy, for example.
- Fig. 42 shows a common drug discovery process.
- the process includes: searching for a target in accordance with the purpose of drug discovery; screening candidate substances; optimizing such substances; and discussing effectiveness, safety, and pharmacokinetics through animal experiments, in vitro experiments (non-clinical tests) in which drug discovery candidate substances are administered to cells cultured in test tubes to measure reaction, etc. and discussing commercialization.
- the "clinical trial” refers to a clinical test performed in order to obtain approval in accordance with the Pharmaceutical Affairs Law for production and sales of medical products.
- the clinical trial is performed in three stages, namely I-phase to III-phase, in many cases.
- I-phase test is directed to healthy adults that volunteer on the basis of their free will.
- II-phase test is conducted for a small number of patients with relatively minor symptoms, in consideration of the result of the I-phase test, to discuss effectiveness, safety, pharmacokinetics, etc.
- a III-phase test is conducted on a greater scale for patients expected to actually use the compound after being placed on the market mainly for the purpose of verifying effectiveness and discussing safety.
- the problems with drug discovery for the psychoneurotic system are that it is difficult at present to estimate the effectiveness of therapeutic agent candidate substances on humans using animal models, and that the probability that a therapeutic agent candidate substance will be finally placed on the market after being subjected to the I-phase test is low compared to therapeutic agent candidate substances for other diseases.
- one solution to such problems is to identify an appropriate group of subjects so that candidate compounds that can possibly exhibit effectiveness can efficiently proceed to the III phase after the I-phase test (or the II-phase test), for example.
- the support information providing device 300a is used as a device that supports identification of such a group of subjects (screening of subjects) will be described below.
- information related to the clusters obtained through classification is returned as screening support data from the support information providing device 300a to the computer 400.
- therapies for diseases of the psychoneurotic system are known to include physical therapies such as rTMS, for example, rather than medication.
- Medical devices and medical device programs that are used for such physical therapies also take the procedure of being subjected to a clinical trial to be approved as medical devices by the competent authorities, as with drug discovery candidate substances. It is assumed that screening of subjects to be discussed later is effective also for this clinical trial.
- the screening support process described in relation to the present embodiment is not only applicable to clinical tests for "therapy candidates” discussed above, but also applicable to clinical tests for "therapeutic means candidates".
- therapeutic means means a “device that is used (by a doctor) to perform a specific therapy” and a “program (or a medium that stores the program or a device in which the program is installed) that is used to perform a specific therapy”
- therapeutic means candidate means a "therapeutic device” or a “program (or a medium that stores the program or a device in which the program is installed)” before being approved or certified by the competent authorities on the basis of a specific clinical test and the like.
- the term “therapeutic means means a TMS device that is used to perform transcranial magnetic stimulation, which is used in accordance with predetermined usage, a pulse wave therapy device that is used for electroconvulsive therapy, an application program for a smartphone that supports cognitive behavioral therapy, a storage medium that stores the application program, a smartphone in which the application program is installed, etc.
- Fig. 44 illustrates the configuration of a screening support device 1000'.
- the screening support system 1000' includes a computer 400 provided in a medical institution 4 and connected so as to be able to receive data from an MRI device 410 that measures brain activity data of a subject whose diagnosis label is to be estimated, a support information providing device 300a, a classifier generation device 300b that performs a process of generating a clustering classifier, and a data server 200'.
- the MRI device 410 measures brain activity data of a subject to be subjected to stratification by the clustering classifier.
- the computer 400 stores the measured MRI measurement data in a non-volatile storage device 4100.
- the computer 400 transmits the measurement data on the subject anonymized by the anonymization processing unit 4042 to the support information providing device 300a as the brain activity measurement result in accordance with an instruction for transmission from a user (e.g. a doctor).
- the measurement data to be transmitted are provided with a temporary ID for specifying the subject.
- a table of correspondence between the temporary ID and personal information such as a patient name, for example, can be managed so as to be inaccessible from the computer 400.
- the content of the table of correspondence is configured to be not accessible at all at least in the support information providing device 300a.
- a harmonization process corresponding to the site at which the MRI device 410 is installed is preferably executed, as necessary, in the support information providing device 300a.
- the discrimination value calculator 3012 outputs the classification results, which is the results of stratification by the clustering classifier, for the input measurement results of brain activities of the subject.
- the classification results are stored in a storage device 2080'-1, for example, in association with a temporary ID that specifies the subject.
- a screening information output unit 3202 generates information for supporting screening based on the classification results in accordance with the classification results, and transmits the generated information to the computer 400 via a communication interface.
- the information presentation unit 4044 of the computer 400 presents the information for supporting screening for the specific subject returned from the screening information output unit 3202 of the support information providing device 300a to a doctor through a display device such as a display (not shown).
- “information for supporting screening” is returned from the screening information output unit 3202 to the computer 400, because it is assumed that the results of stratification themselves are not returned to the medical institution as a so-called “double blind test” or "randomized controlled trial” is performed in the case where a clinical test or a clinical trial is performed using the results of screening, for example, and the information is displayed on the computer as information for supporting execution of screening in accordance with the characteristics of such tests.
- test results are evaluated after the test is finished, the test results and the classification results for the subject can be collated with each other on the basis of the temporary ID.
- the screening support process is performed by a computer executing a screening support program.
- Fig. 43 is a flowchart illustrating the flow of a process of supporting screening of a subject in drug discovery.
- the support information providing device 300a receives the results of measurement of brain activities of the subject from the computer 400.
- the results of measurement of brain activities of the subject include image data (brain structure image data and brain function image data) anonymized by the computer 400.
- step S604 shown in Fig. 43 the support information providing device 300a executes the processes of calculating functional connectivity correlation matrix data and executes a process of correcting correlation values through a harmonization process for the results of measurement of brain activities of the subject, and thereafter inputs the measurement result to the clustering classifier generated by the classifier generation device 300b and acquires a belonging cluster probability which is the results of stratification of the subject.
- the belonging cluster probability is output as a probability at which the subject belongs to each cluster for all the clusters into which the clustering classifier can perform stratification.
- the support information providing device 300a can determine a cluster with the highest probability as a cluster to which the subject belongs.
- step S606 shown in Fig. 43 the support information providing device 300a generates information that indicates clusters as the results of stratification of the subject acquired in step S604.
- step S608 illustrated in Fig. 43 the support information providing device 300a outputs the information on the clusters generated in step S606 or information for supporting screening to the computer 400 via a communication interface.
- the support information providing device 300a can provide a doctor with information on the cluster to which the subject belongs in the process of a clinical trial on the basis of measurement data on brain activities of the subject.
- the doctor can perform a clinical trial by screening subjects in the corresponding cluster in accordance with a clinical trial protocol determined in advance.
- the therapy selection support system 1000 has been described above with reference to Fig. 39 , and the screening support device 1000' has been described above with reference to Figs. 42 to 44 .
- An MDD identifier generated by the disease identifier generator 3008 in generating a clustering classifier that is used for the verification data is configured as follows.
- brain regions are divided in accordance with a BSA (Brainvisa Sulci Atlas) method as a method of parcellating brain areas.
- BSA Brain Suci Atlas
- the BSA method is disclosed in the following reference, for example.
- a Pearson's correlation coefficient of an fMRI signal is calculated as an index of connection among brain regions, and an MDD identifier is trained and generated in accordance with discovery cohort data using the random forest method on the basis of brain functional connectivity links for the entire brain. In this case, correction among facilities based on the traveling subject method is not particularly applied.
- a process in which the clustering classifier generator 3010 generates a clustering classifier is as follows.
- the degree of importance in identification of brain functional connectivity links is determined by the random forest method for each of the identifiers, and the total sum for the 100 identifiers is calculated to obtain the total degree of importance.
- the brain functional connectivity links are ranked on the basis of the total degree of importance, and multiple co-clustering is executed using high-ranked connectivity links.
- the number of high-ranked connectivity links to be used can be determined by performing clustering for a plurality of numbers of connectivity links in predetermined patterns and adopting the number with the highest stability among datasets, although this is not particularly limiting.
- the ARI value described with reference to Fig. 33 can be used as an evaluation index for evaluation of the "stability among datasets".
- Fig. 45 shows views of the results of clustering through multiple co-clustering in which 30 brain functional connectivity links with the highest degree of importance in the MDD identifiers are used for Dataset 1.
- Fig. 46 shows views of the results of clustering through multiple co-clustering for Dataset 2.
- Fig. 47 shows the stability of clustering between Dataset 1 and Dataset 2.
- Fig. 47 is a table in which ARI for each view of Dataset 1 and each view of Dataset 2 is calculated, corresponding to the table shown in Fig. 33 .
- View 1 of Dataset 1 and View 1 of Dataset 2 and View 2 of Dataset 1 and View 3 of Dataset 2 have ARI values of 0.67 and 0.68, respectively, and are considered to be similar to each other.
- Fig. 48 shows views of the results of clustering for data of all depression patients (Datasets 1 + 2).
- Fig. 49 indicates the number of all depression patients and the number of depression patients with clinical data for each subtype for View 3 generated by clustering of Datasets 1 + 2.
- clinical data refers to "information on medication profile” of each patient, “information on diagnosis of the degree of depression” of each patient, etc.
- FIG. 48 and 49 will be further described below as a view found with characteristic clinical significance, specifically with a difference in responsiveness to therapy among the subtypes.
- Fig. 50 illustrates brain functional connectivity links (View 3) used in clustering.
- Fig. 50(a) indicates the positions in the brain of the brain functional connectivity links used in clustering.
- Fig. 50(b) indicates the regions of interest of the functional connectivity links.
- clustering is performed without assigning a weight and the like to the 30 selected connectivity links.
- three views are generated.
- the 30 connectivity links are divided into three groups (View 1: 22 connectivity links, View 2: 5 connectivity links, View 3: 3 connectivity links), and the subjects are clustered on the basis of the groups of the connectivity links.
- an algorithm automatically derives an optimal solution to how the connectivity links are divided and how the patients (subjects) are clustered.
- Fig. 51 indicates the relationship between the degree of severity of depression and the improvement rate in the degree of severity for each subtype in View 3 illustrated in Figs. 48 and 49 .
- Fig. 51(a) indicates the HAMD scores for the 0-th week and the sixth week after the start of therapy.
- the HAMD refers to the Hamilton Depression Rating Scale, which is a score for rating the degree of severity of depression.
- a main 17-item version constituted of 17 items that indicate the degree of severity of depression and a 21-item version with the addition of four additional items are mainly used.
- Subtypes 1 to 5 in Fig. 51(a) correspond to the top-five clusters in "Subject Clustering Results (View 3)" in Fig. 49 .
- the numbers of the subtypes are given in the descending order of the number of persons with clinical data. Subtypes with data on 10 subjects or more were analyzed. Therefore, Subtypes 1, 2, 4, and 5, among Subtypes 1 to 5, are indicated in the graphs.
- the 0-th week after the start of therapy means the time of the entry of study and the start of therapy with an SSRI.
- the sixth week after the start of therapy means the time six weeks after the entry of study and the start of therapy. That is, persons that were treated with an SSRI since before the entry of study are excluded.
- the SSRI refers to a "selective serotonin reuptake inhibitor", and includes escitalopram, for example.
- the treatment protocol in the study is as follows.
- Study is entered for patients of major depressive disorder that have not been treated or that have only been treated with an insufficient amount of medication or for an insufficient period.
- treatment with an SSRI such as escitalopram is started.
- the SSRI can be used in an increased amount through a clinical decision. There is no limitation on combined medication. If not improved with the SSRI, therapy with a different medical agent is performed.
- Fig. 51(b) indicates the HAMD improvement rate, making a comparison between the 0-th week and the sixth week.
- the improvement rate is represented by the following formula: HAMD 0 ⁇ HAMD 6 W / HAMD 0 ⁇ 100
- Fig. 51(a) It is seen from Fig. 51(a) that a difference in the HAMD is observed among the subtypes six weeks after the start of therapy with an SSRI.
- Fig. 51(b) indicates that, as is seen from the improvement rate from the initial value, the effect of the therapy with the SSRI was low for Subtype 1 compared to Subtypes 2 and 5 and, conversely, the effect of the therapy with the SSRI was high for Subtypes 2 and 5 compared to Subtype 1.
Landscapes
- Engineering & Computer Science (AREA)
- Health & Medical Sciences (AREA)
- Medical Informatics (AREA)
- Public Health (AREA)
- General Health & Medical Sciences (AREA)
- Artificial Intelligence (AREA)
- Physics & Mathematics (AREA)
- Epidemiology (AREA)
- Primary Health Care (AREA)
- Life Sciences & Earth Sciences (AREA)
- Theoretical Computer Science (AREA)
- Computer Vision & Pattern Recognition (AREA)
- Biomedical Technology (AREA)
- Evolutionary Computation (AREA)
- Mathematical Physics (AREA)
- Software Systems (AREA)
- General Physics & Mathematics (AREA)
- Chemical & Material Sciences (AREA)
- Psychiatry (AREA)
- Bioinformatics & Cheminformatics (AREA)
- Medicinal Chemistry (AREA)
- Data Mining & Analysis (AREA)
- Pathology (AREA)
- Heart & Thoracic Surgery (AREA)
- Surgery (AREA)
- Animal Behavior & Ethology (AREA)
- Molecular Biology (AREA)
- Veterinary Medicine (AREA)
- Biophysics (AREA)
- General Engineering & Computer Science (AREA)
- Signal Processing (AREA)
- Physiology (AREA)
- Computing Systems (AREA)
- Fuzzy Systems (AREA)
- Hospice & Palliative Care (AREA)
- Psychology (AREA)
- Social Psychology (AREA)
- Developmental Disabilities (AREA)
- Quality & Reliability (AREA)
- Radiology & Medical Imaging (AREA)
Applications Claiming Priority (2)
| Application Number | Priority Date | Filing Date | Title |
|---|---|---|---|
| JP2020123208 | 2020-07-17 | ||
| PCT/JP2021/026658 WO2022014682A1 (ja) | 2020-07-17 | 2021-07-15 | 脳機能結合相関値のクラスタリング装置、脳機能結合相関値のクラスタリングシステム、脳機能結合相関値のクラスタリング方法、脳機能結合相関値の分類器プログラムおよび脳活動マーカー分類システム |
Publications (2)
| Publication Number | Publication Date |
|---|---|
| EP4183333A1 true EP4183333A1 (de) | 2023-05-24 |
| EP4183333A4 EP4183333A4 (de) | 2023-12-20 |
Family
ID=79555705
Family Applications (1)
| Application Number | Title | Priority Date | Filing Date |
|---|---|---|---|
| EP21842607.0A Pending EP4183333A4 (de) | 2020-07-17 | 2021-07-15 | Hirnfunktionskonnektivitätskorrelationswertclusteringsystem, hirnfunktionskonnektivitätskorrelationswertclusteringverfahren |
Country Status (5)
| Country | Link |
|---|---|
| US (1) | US20230284983A1 (de) |
| EP (1) | EP4183333A4 (de) |
| JP (1) | JP7737099B2 (de) |
| CN (1) | CN116133587A (de) |
| WO (1) | WO2022014682A1 (de) |
Families Citing this family (8)
| Publication number | Priority date | Publication date | Assignee | Title |
|---|---|---|---|---|
| EP4308017A4 (de) * | 2021-03-18 | 2025-02-12 | The Board of Trustees of the Leland Stanford Junior University | Systeme und verfahren zur erzeugung einer chirurgischen risikobewertung und verwendungen davon |
| US20250342960A1 (en) * | 2022-05-19 | 2025-11-06 | Shionogi & Co., Ltd. | Information processing system and information processing method |
| US12586360B1 (en) * | 2022-12-19 | 2026-03-24 | Whiterabbit.Ai Inc. | Methods and systems for monitoring and surveillance of autonomous AI in medical imaging |
| US20240304330A1 (en) * | 2023-03-06 | 2024-09-12 | GE Precision Healthcare LLC | System and method for training artificial intelligence models using sub-group training datasets of a majortiy class of samples |
| CN117224105B (zh) * | 2023-10-31 | 2024-08-23 | 重庆博恩富克医疗设备有限公司 | 基于多模式电磁场生物检测的颅脑异常预测方法及装置 |
| CN119557677B (zh) * | 2024-11-11 | 2025-10-24 | 杭州电子科技大学 | 一种基于脑电协同聚类的半监督言语想象意图解码方法 |
| CN120260957B (zh) * | 2025-03-26 | 2025-11-18 | 浙江大学 | 一种数据处理方法及系统 |
| CN121421537B (zh) * | 2025-12-17 | 2026-03-31 | 山东第一医科大学(山东省医学科学院) | 基于静息态功能磁共振成像的情绪改善评估方法及系统 |
Family Cites Families (12)
| Publication number | Priority date | Publication date | Assignee | Title |
|---|---|---|---|---|
| EP2245568A4 (de) * | 2008-02-20 | 2012-12-05 | Univ Mcmaster | Expertensystem zur bestimmung der reaktion von patienten auf eine behandlung |
| WO2012083136A1 (en) * | 2010-12-17 | 2012-06-21 | The Trustees Of Columbia University In The City Of New York | Apparatus, method and computer-accessible medium for diagnosing and subtyping psychiatric diseases |
| JP5691086B1 (ja) * | 2013-05-01 | 2015-04-01 | 株式会社国際電気通信基礎技術研究所 | 脳活動解析装置、脳活動解析方法およびバイオマーカー装置 |
| US9632162B2 (en) | 2013-12-06 | 2017-04-25 | Toshiba Medical Systems Corporation | Method of, and apparatus for, correcting distortion in medical images |
| JP6195329B1 (ja) * | 2015-11-24 | 2017-09-13 | 株式会社国際電気通信基礎技術研究所 | 脳活動解析装置、脳活動解析方法、プログラムおよびバイオマーカー装置 |
| US11704790B2 (en) | 2017-09-26 | 2023-07-18 | Washington University | Supervised classifier for optimizing target for neuromodulation, implant localization, and ablation |
| JP6722845B2 (ja) * | 2017-10-03 | 2020-07-15 | 株式会社国際電気通信基礎技術研究所 | 判別装置、うつ症状の判別方法、うつ症状のレベルの判定方法、うつ病患者の層別化方法、うつ症状の治療効果の判定方法及び脳活動訓練装置 |
| JP7057995B2 (ja) * | 2017-10-03 | 2022-04-21 | 株式会社国際電気通信基礎技術研究所 | 哺乳動物におけるうつ病の病態プロファイルを検出するバイオマーカーとその利用 |
| WO2019182915A1 (en) * | 2018-03-19 | 2019-09-26 | The Board Of Trustees Of The Leland Stanford Junior University | Treatment of depression |
| CN108596236A (zh) * | 2018-04-18 | 2018-09-28 | 东南大学 | 一种基于全局连接特征和测地距离的丘脑核团分区方法 |
| JP6812022B2 (ja) * | 2018-10-11 | 2021-01-13 | 株式会社国際電気通信基礎技術研究所 | 脳機能結合相関値の調整方法、脳機能結合相関値の調整システム、脳活動分類器のハーモナイズ方法、脳活動分類器のハーモナイズシステム、および脳活動バイオマーカシステム |
| US12383196B2 (en) * | 2018-10-15 | 2025-08-12 | The Board Of Trustees Of The Leland Stanford Junior University | Treatment of depression using machine learning |
-
2021
- 2021-07-15 CN CN202180060576.5A patent/CN116133587A/zh active Pending
- 2021-07-15 WO PCT/JP2021/026658 patent/WO2022014682A1/ja not_active Ceased
- 2021-07-15 US US18/016,161 patent/US20230284983A1/en active Pending
- 2021-07-15 EP EP21842607.0A patent/EP4183333A4/de active Pending
- 2021-07-15 JP JP2022536448A patent/JP7737099B2/ja active Active
Also Published As
| Publication number | Publication date |
|---|---|
| EP4183333A4 (de) | 2023-12-20 |
| JP7737099B2 (ja) | 2025-09-10 |
| JPWO2022014682A1 (de) | 2022-01-20 |
| WO2022014682A1 (ja) | 2022-01-20 |
| US20230284983A1 (en) | 2023-09-14 |
| CN116133587A (zh) | 2023-05-16 |
Similar Documents
| Publication | Publication Date | Title |
|---|---|---|
| EP4134884B1 (de) | Hirnfunktionskorrelationswertclustersystem, hirnfunktionskonnektivitätskorrelationswertclusterverfahren | |
| US12390108B2 (en) | Brain functional connectivity correlation value adjustment method, brain functional connectivity correlation value adjustment system, brain activity classifier harmonization method, brain activity classifier harmonization system, and brain activity biomarker system | |
| EP3865061B1 (de) | Verfahren zur anpassung des korrelationswerts der funktionellen konnektivität des gehirns, system zur anpassung des korrelationswerts der funktionellen konnektivität des gehirns, verfahren zur harmonisierung eines gehirnaktivitätklassierers, system zur harmonisierung eines gehirnaktivitätklassierers und biomarkersystem für gehirnaktivität | |
| EP4183333A1 (de) | Hirnfunktionskonnektivitätskorrelationswertclusteringsystem, hirnfunktionskonnektivitätskorrelationswertclusteringverfahren | |
| CN111447874B (zh) | 判别装置、抑郁症状的判别方法、抑郁症状的水平的判断方法、抑郁症患者的分类方法、抑郁症状的治疗效果的判断方法和脑活动训练装置 | |
| EP3381361B1 (de) | Hirnaktivitätsanalysevorrichtung, hirnaktivitätsanalyseverfahren, programm und biomarkervorrichtung | |
| JP6497687B2 (ja) | 脳活動解析システム及び方法 | |
| US12573042B2 (en) | Differentiation device, differentiation method for depression symptoms, determination method for level of depression symptoms, stratification method for depression patients, determination method for effects of treatment of depression symptoms, and brain activity training device | |
| WO2019172245A1 (ja) | 脳活動訓練装置、脳活動訓練方法および脳活動訓練プログラム | |
| Li et al. | Sparse multivariate autoregressive modeling for mild cognitive impairment classification | |
| JP2024003782A (ja) | 統合失調スペクトラム障害に関する情報を提供するための診断支援システム、診断支援装置、診断支援方法、及び支援プログラム |
Legal Events
| Date | Code | Title | Description |
|---|---|---|---|
| STAA | Information on the status of an ep patent application or granted ep patent |
Free format text: STATUS: THE INTERNATIONAL PUBLICATION HAS BEEN MADE |
|
| PUAI | Public reference made under article 153(3) epc to a published international application that has entered the european phase |
Free format text: ORIGINAL CODE: 0009012 |
|
| STAA | Information on the status of an ep patent application or granted ep patent |
Free format text: STATUS: REQUEST FOR EXAMINATION WAS MADE |
|
| 17P | Request for examination filed |
Effective date: 20230213 |
|
| AK | Designated contracting states |
Kind code of ref document: A1 Designated state(s): AL AT BE BG CH CY CZ DE DK EE ES FI FR GB GR HR HU IE IS IT LI LT LU LV MC MK MT NL NO PL PT RO RS SE SI SK SM TR |
|
| DAV | Request for validation of the european patent (deleted) | ||
| DAX | Request for extension of the european patent (deleted) | ||
| A4 | Supplementary search report drawn up and despatched |
Effective date: 20231122 |
|
| RIC1 | Information provided on ipc code assigned before grant |
Ipc: G06T 7/00 20170101ALI20231116BHEP Ipc: A61B 5/372 20210101ALI20231116BHEP Ipc: A61B 5/05 20210101ALI20231116BHEP Ipc: A61B 5/055 20060101AFI20231116BHEP |