EP4172599B1 - Biophotonische analysegeräte für duvf-msi und verfahren zum nachweis von pathogenen auf pflanzen und zur messung der stressreaktion - Google Patents
Biophotonische analysegeräte für duvf-msi und verfahren zum nachweis von pathogenen auf pflanzen und zur messung der stressreaktion Download PDFInfo
- Publication number
- EP4172599B1 EP4172599B1 EP21740411.0A EP21740411A EP4172599B1 EP 4172599 B1 EP4172599 B1 EP 4172599B1 EP 21740411 A EP21740411 A EP 21740411A EP 4172599 B1 EP4172599 B1 EP 4172599B1
- Authority
- EP
- European Patent Office
- Prior art keywords
- light
- plant
- intensity
- spectral wavelength
- duvf
- Prior art date
- Legal status (The legal status is an assumption and is not a legal conclusion. Google has not performed a legal analysis and makes no representation as to the accuracy of the status listed.)
- Active
Links
Images


Classifications
-
- G—PHYSICS
- G01—MEASURING; TESTING
- G01N—INVESTIGATING OR ANALYSING MATERIALS BY DETERMINING THEIR CHEMICAL OR PHYSICAL PROPERTIES
- G01N21/00—Investigating or analysing materials by the use of optical means, i.e. using sub-millimetre waves, infrared, visible or ultraviolet light
- G01N21/17—Systems in which incident light is modified in accordance with the properties of the material investigated
- G01N21/25—Colour; Spectral properties, i.e. comparison of effect of material on the light at two or more different wavelengths or wavelength bands
- G01N21/31—Investigating relative effect of material at wavelengths characteristic of specific elements or molecules, e.g. atomic absorption spectrometry
-
- G—PHYSICS
- G01—MEASURING; TESTING
- G01N—INVESTIGATING OR ANALYSING MATERIALS BY DETERMINING THEIR CHEMICAL OR PHYSICAL PROPERTIES
- G01N21/00—Investigating or analysing materials by the use of optical means, i.e. using sub-millimetre waves, infrared, visible or ultraviolet light
- G01N21/17—Systems in which incident light is modified in accordance with the properties of the material investigated
- G01N21/47—Scattering, i.e. diffuse reflection
- G01N21/4738—Diffuse reflection, e.g. also for testing fluids, fibrous materials
- G01N21/474—Details of optical heads therefor, e.g. using optical fibres
-
- G—PHYSICS
- G01—MEASURING; TESTING
- G01N—INVESTIGATING OR ANALYSING MATERIALS BY DETERMINING THEIR CHEMICAL OR PHYSICAL PROPERTIES
- G01N21/00—Investigating or analysing materials by the use of optical means, i.e. using sub-millimetre waves, infrared, visible or ultraviolet light
- G01N21/62—Systems in which the material investigated is excited whereby it emits light or causes a change in wavelength of the incident light
- G01N21/63—Systems in which the material investigated is excited whereby it emits light or causes a change in wavelength of the incident light optically excited
- G01N21/64—Fluorescence; Phosphorescence
- G01N21/645—Specially adapted constructive features of fluorimeters
- G01N21/6456—Spatial resolved fluorescence measurements; Imaging
-
- G—PHYSICS
- G01—MEASURING; TESTING
- G01N—INVESTIGATING OR ANALYSING MATERIALS BY DETERMINING THEIR CHEMICAL OR PHYSICAL PROPERTIES
- G01N21/00—Investigating or analysing materials by the use of optical means, i.e. using sub-millimetre waves, infrared, visible or ultraviolet light
- G01N21/62—Systems in which the material investigated is excited whereby it emits light or causes a change in wavelength of the incident light
- G01N21/63—Systems in which the material investigated is excited whereby it emits light or causes a change in wavelength of the incident light optically excited
- G01N21/64—Fluorescence; Phosphorescence
- G01N21/6486—Measuring fluorescence of biological material, e.g. DNA, RNA, cells
-
- G—PHYSICS
- G01—MEASURING; TESTING
- G01N—INVESTIGATING OR ANALYSING MATERIALS BY DETERMINING THEIR CHEMICAL OR PHYSICAL PROPERTIES
- G01N21/00—Investigating or analysing materials by the use of optical means, i.e. using sub-millimetre waves, infrared, visible or ultraviolet light
- G01N21/62—Systems in which the material investigated is excited whereby it emits light or causes a change in wavelength of the incident light
- G01N21/63—Systems in which the material investigated is excited whereby it emits light or causes a change in wavelength of the incident light optically excited
- G01N2021/635—Photosynthetic material analysis, e.g. chrorophyll
-
- G—PHYSICS
- G01—MEASURING; TESTING
- G01N—INVESTIGATING OR ANALYSING MATERIALS BY DETERMINING THEIR CHEMICAL OR PHYSICAL PROPERTIES
- G01N21/00—Investigating or analysing materials by the use of optical means, i.e. using sub-millimetre waves, infrared, visible or ultraviolet light
- G01N21/62—Systems in which the material investigated is excited whereby it emits light or causes a change in wavelength of the incident light
- G01N21/63—Systems in which the material investigated is excited whereby it emits light or causes a change in wavelength of the incident light optically excited
- G01N21/64—Fluorescence; Phosphorescence
- G01N2021/6417—Spectrofluorimetric devices
- G01N2021/6419—Excitation at two or more wavelengths
-
- G—PHYSICS
- G01—MEASURING; TESTING
- G01N—INVESTIGATING OR ANALYSING MATERIALS BY DETERMINING THEIR CHEMICAL OR PHYSICAL PROPERTIES
- G01N21/00—Investigating or analysing materials by the use of optical means, i.e. using sub-millimetre waves, infrared, visible or ultraviolet light
- G01N21/62—Systems in which the material investigated is excited whereby it emits light or causes a change in wavelength of the incident light
- G01N21/63—Systems in which the material investigated is excited whereby it emits light or causes a change in wavelength of the incident light optically excited
- G01N21/64—Fluorescence; Phosphorescence
- G01N21/645—Specially adapted constructive features of fluorimeters
- G01N2021/6463—Optics
- G01N2021/6471—Special filters, filter wheel
-
- G—PHYSICS
- G01—MEASURING; TESTING
- G01N—INVESTIGATING OR ANALYSING MATERIALS BY DETERMINING THEIR CHEMICAL OR PHYSICAL PROPERTIES
- G01N21/00—Investigating or analysing materials by the use of optical means, i.e. using sub-millimetre waves, infrared, visible or ultraviolet light
- G01N21/84—Systems specially adapted for particular applications
- G01N2021/8466—Investigation of vegetal material, e.g. leaves, plants, fruits
-
- G—PHYSICS
- G01—MEASURING; TESTING
- G01N—INVESTIGATING OR ANALYSING MATERIALS BY DETERMINING THEIR CHEMICAL OR PHYSICAL PROPERTIES
- G01N21/00—Investigating or analysing materials by the use of optical means, i.e. using sub-millimetre waves, infrared, visible or ultraviolet light
- G01N21/84—Systems specially adapted for particular applications
- G01N21/88—Investigating the presence of flaws or contamination
- G01N21/8806—Specially adapted optical and illumination features
- G01N2021/8845—Multiple wavelengths of illumination or detection
-
- G—PHYSICS
- G01—MEASURING; TESTING
- G01N—INVESTIGATING OR ANALYSING MATERIALS BY DETERMINING THEIR CHEMICAL OR PHYSICAL PROPERTIES
- G01N2201/00—Features of devices classified in G01N21/00
- G01N2201/06—Illumination; Optics
- G01N2201/065—Integrating spheres
Definitions
- the present invention relates to devices and methods for the detection of pathogens on plants.
- devices and methods using deep ultraviolet fluorescence and multi spectral imaging for the rapid detection of pathogens on plants and for measuring the stress response of these plants.
- pathogens threaten the yield of crop production, but there have been repeated outbreaks of foodborne illnesses in the United States over the years caused by food crops contaminated by pathogens, such as Escherichia coli and Salmonella spp. [ Fletcher et al., "Human Pathogens on Plants: Designing a Multidisciplinary Strategy for Research” Phytopathology 103(4):306-15 (2013 )].
- whole farms might be infected before the plants exhibit any visible manifestations of the pathogen infection. Therefore, the grower may not know to take remedial measures until the yields are irreparably effected or, even worse, the plants have already made their way to the market with potential for causing human disease or death.
- JP 2019-197020 A discloses a device for detecting a fungi or bacteria on grains of rice, the device comprising visible sensors, IR sensors and cameras, a control device, imaging processing boards and RGB LEDs, UV LEDs, IR LEDs, visible LEDs to illuminate the rice grains whereby determination of the presence of the fungi or bacteria is made based on fluorescent images emitted from the grains in response to UV illumination.
- DUVF deep ultraviolet fluorescence
- MSI multi spectral imaging
- a biophotonic analyzer device capable of taking both DUVF and MSI measurements.
- a biophotonic analyzer device is provided herein in which both DUV and MSI light sources are included in an integrating cavity for diffuse light distribution and illumination of plants for rapid DUVF and MSI light intensity measurements.
- the biophotonic analyzer device can be used in a surveillance and monitoring system to ensure rapid detection of pathogen infection to enable prompt remediation measures to be taken to increase crop yields and prevent pathogen-contaminated plants from being incorporated into human foodstuffs and plant-based medicines.
- the device is configured for communication with a central processing unit, which converts the measurements of light intensity of the representation into emission intensity data whereby an increase in emission intensity of the first spectral wavelength by the plant or plant part indicates increased pathogen infection on the plant or plant part as compared to an equivalent plant or plant part with no increase in pathogen infection.
- the plurality of light sources comprises at least one additional light source having an additional spectral wavelength selected from a range of about 350 nm to about 1000 nm, provided that the additional spectral wavelength and the second spectral wavelength are not the same spectral wavelength.
- the plurality of light sources may comprise 2 to 20 additional light sources, each having an additional spectral wavelength selected from a range of about 350 nm to about 1000 nm, provided that none of the additional spectral wavelengths and the second spectral wavelength are the same spectral wavelength.
- the second spectral wavelength is in the range from about 360 nm to about 370 nm and wherein the plurality of light sources further comprises, a third light source having a third spectral wavelength in the range from 400 nm to 410 nm, a fourth light source having a fourth spectral wavelength in the range from 430 nm to 440 nm, a fifth light source having a fifth spectral wavelength in the range from 445 nm to 455 nm, a sixth light source having a sixth spectral wavelength in the range from 465 nm to 475 nm, a seventh light source having a seventh spectral wavelength in the range from 480 nm to 505 nm, an eighth light source having an eighth spectral wavelength in the range from 520 nm to 530 nm, a ninth light source having a ninth spectral wavelength in the range from 545 nm to 555 nm, a tenth light source having a tenth
- control unit causes each individual light source to emit light or not emit light in response to a user programmable input.
- control system causes each individual light source to emit light in succession in response to a user programmable input, wherein each light source emits light for a period of time.
- the period of time may be from about 0.1 seconds to about 2 seconds.
- the device also includes a light filtering element that is disposed between the mirror element and the camera.
- the light filtering element typically comprises at least one light permissible member and a plurality of light filters.
- the control unit causes the light filtering element to switch between the light permissible member and each of the light filters in response to a user programmable input.
- the light filters transmits light having a transmissible spectral wavelength or range of spectral wavelengths selected from about 300 nm to about 1000 nm.
- the central processing unit facilitates the conversion of the light intensity measurements of the representation into reflection intensity data whereby an increase in reflection intensity of a spectral wavelength other than the first spectral wavelength indicates a decrease in photopigment concentration in the plant or plant part.
- the central processing unit facilitates the conversion of the light intensity measurements of the representation into emission intensity data whereby an increase in emission intensity of a spectral wavelength other than the first spectral wavelength indicates a change in rate of photosynthesis in the plant or plant part.
- the plant or plant part is foliage of the clade viridiplantae.
- the device of the instant invention may also be attached to a conveyor element for moving the device laterally across a plurality of object samples such that light intensity measurements can be taken from each of the plurality of object samples when the second opening is in optical alignment with the sample.
- a system for detecting one or more pathogens on a plurality of objects is provided, wherein the system comprises an operation subsystem and at least one device as described above.
- the device is attached to a conveyor element for moving the device laterally across a plurality of object samples such that light intensity measurements can be taken from each of the plurality of object samples when the second opening of the device is in optical alignment with the object sample, and, once the light intensity measurements are taken from the object sample, the operation subsystem causes the conveyor element to move the device to the next sample in response to a programmable user input.
- the method may also include detecting with the DUVF detection system a second portion of the DUVF intensity, wherein the DUVF detection system comprises a second DUVF emission filter configured to transmit the second portion of the DUVF intensity having a spectral wavelength of about 350 nm to about 370 nm, whereby the second portion of the DUVF intensity is transmitted through the second DUVF emission filter and is detected by the DUVF intensity detector, and calculating the second portion of the DUVF intensity, wherein an increase in the second portion of the DUVF intensity indicates a pathogen presence on the plant or plant part as compared to an equivalent plant or plant part without a pathogen presence.
- the method includes the additional step of measuring light reflected by or emitted from the plant or plant part.
- This measuring step further includes: (A) subjecting the plant or plant part to a first light having a spectral wavelength in the range of about 350 nm to about 1000 nm, wherein the plant or plant part reflects a portion of the first light to produce a first reflection intensity; (B) detecting with a multi spectral imaging (MSI) detection system the first reflection intensity, wherein the MSI detection system comprises an MSI intensity detector for detecting the first reflection intensity; and (C) calculating the first reflection intensity, wherein an increase in the first reflection intensity indicates a reduction in photopigment concentration in response to a pathogen presence and/or (A) subjecting the plant or plant part to first excitation light having a spectral wavelength in the range of about 350 nm to about 660 nm, wherein the plant or plant part emits a first fluorescence intensity; (B) detecting with the MSI detection system a portion of the first fluor
- the first excitation light has a spectral wavelength in the range selected from group consisting of about 360 nm to about 370 nm, about 400 nm to about 410 nm, 430 nm to about 440nm, 625 nm to about 635 nm, 640 nm to about 650 nm, and 655 nm to about 665 nm, and wherein the portion of the first fluorescence intensity has a spectral wavelength of greater than 690 nm.
- the fluorescence measuring step further includes subjecting the plant or plant part to second excitation light, wherein the plant or plant part emits a second fluorescence intensity; detecting with the MSI detection system a portion of the second fluorescence intensity, whereby the portion of the second fluorescence intensity is transmitted through the fluorescence emission filter and is detected by the MSI intensity detector; and calculating the portion of the second fluorescence intensity, wherein an increase in the portion of the second fluorescence intensity indicates a pathogen presence.
- the second excitation light has a spectral wavelength in the range selected from group consisting of about 360 nm to about 370 nm, about 400 nm to about 410 nm, 425 nm to about 435 nm, 625 nm to about 635 nm, 640 nm to about 650 nm, and 655 nm to about 660 nm, provided that the spectral wavelength of the second excitation light is not the same as the spectral wavelength of the first excitation light, and wherein the portion of the second fluorescence intensity has a spectral wavelength of greater than 690 nm.
- both the reflection intensity measuring and fluorescence intensity measuring steps are included in the method.
- the reflection intensity measuring step is performed before the fluorescence intensity measuring step, and the portion of the first fluorescence intensity or the second fluorescence intensity is normalized by the first reflectance intensity to calculate a change in photosynthesis (carboxylation) rate according to the equation, where PCi is a constant derived for each type of plant reflectance and the control conditions for the plant.
- ⁇ Rate PCi ⁇ Reflectance ctrl Reflectance meas ⁇ Reflectance ctrl ⁇ Emission ⁇
- the first light has a spectral wavelength of about 505 nm to about 535 nm
- the reflection intensity measuring step further comprises subjecting the plant or plant part to a second light having a spectral wavelength in the range of about 535 nm to about 560 nm, wherein the plant or plant part reflects a portion of the second light to produce a second reflection intensity; detecting with the MSI intensity detector the second reflection intensity; and calculating the second reflection intensity, wherein an increase in the second reflection intensity indicates a reduction in photopigment concentration in response to a pathogen presence.
- the reflection intensity measuring step may also include a third light having a spectral wavelength in the range of about 560 nm to about 580 nm, wherein the plant or plant part reflects a portion of the third light to produce a third reflection intensity; a fourth light having a spectral wavelength in the range of about 580 nm to about 610 nm, wherein the plant or plant part reflects a portion of the fourth light to produce a fourth reflection intensity; and so on.
- the photopigment is chlorophyll.
- the plant or plant part is of the clade viridiplantae.
- the plant part is plant foliage.
- the pathogen detected by the method is a human pathogen, such as, but not limited to Erwinia sp., Pseudomonas sp., Bacillus sp., Clostridium sp., Klebsiella sp., Escherichia sp., Salmonella sp., Listeria sp., Rhizobium sp., and/or Sinorhizobium sp.,.
- the method may also include device that combines the DUVF detector system and the MSI detector system, such as the device of the instant invention described above.
- a method of detecting a pathogen on a plant or plant part using deep ultraviolet fluorescence and multi spectral imaging includes the steps of a) providing a plant or plant part; b) measuring DUVF emitted from plant or plant part with the device; c) measuring light reflected by the plant or plant part with the device; and d) measuring fluorescence emitted from the plant or plant part with the device.
- the DUVF measuring step includes subjecting the plant or plant part to an ultraviolet light having a spectral wavelength in the range of about 210 nm to about 280 nm, wherein the plant or plant part emits a DUVF intensity between 290-390 nm; detecting with a light detection system a first portion of the DUVF intensity, wherein the light detection system comprises a light intensity detector and a first DUVF emission filter configured to transmit the first portion of the DUVF intensity, whereby the first portion of the DUVF intensity is transmitted through the first DUVF emission filter and is detected by the light intensity detector; and calculating the first portion of the DUVF intensity, wherein an increase in the first portion of the DUVF intensity indicates a pathogen presence on the plant or plant part as compared to an equivalent plant or plant part without a pathogen presence.
- the light reflection measuring step includes subjecting the plant or plant part to a first light having a spectral wavelength in the range of about 350 nm to about 1000 nm, wherein the plant or plant part reflects a portion of the first light to produce a first reflection intensity; detecting with the light intensity detector the first reflection intensity; and calculating the first reflection intensity, wherein an increase in the first reflection intensity indicates a reduction in photopigment concentration in response to a pathogen presence.
- the fluorescence emission measuring step includes subjecting the plant or plant part to first excitation light having a spectral wavelength in the range of about 350 nm to about 660 nm, wherein the plant or plant part emits a first fluorescence intensity; detecting with the light detection system a portion of the first fluorescence intensity, wherein the light detection system comprises a fluorescence emission filter whereby the portion of the first fluorescence intensity is transmitted through the fluorescence emission filter and is detected by the light intensity detector; and calculating the portion of the first fluorescence intensity, wherein an increase in the portion of the second fluorescence intensity indicates a pathogen presence.
- the first DUVF emission filter transmits light having a spectral wavelength of about 335 nm to about 345 nm, and wherein the first portion of the DUVF intensity has a spectral wavelength of about 335 nm to about 345 nm.
- the method includes detecting with the light detection system a second portion of the DUVF intensity, wherein the light intensity detector comprises a second DUVF emission filter configured to transmit the second portion of the DUVF intensity having a spectral wavelength of about 355 nm to about 365 nm, whereby the second portion of the DUVF intensity is transmitted through the second DUVF emission filter and is detected by the light intensity detector; and calculating the second portion of the DUVF intensity, wherein an increase in the second portion of the DUVF intensity indicates a pathogen presence on the plant or plant part as compared to an equivalent plant or plant part without a pathogen presence.
- the first excitation light has a spectral wavelength in the range selected from group consisting of about 360 nm to about 370 nm, about 400 nm to about 410 nm, 425 nm to about 435 nm, 445 nm to about 455 nm, 625 nm to about 635 nm, 640 nm to about 650 nm, and 655 nm to about 665 nm, and wherein the portion of the first fluorescence intensity has a spectral wavelength of greater than 690 nm.
- the fluorescence emission measuring step may also include subjecting the plant or plant part to second excitation light, wherein the plant or plant part emits a second fluorescence intensity; detecting with the light detection system a portion of the second fluorescence intensity, whereby the portion of the second fluorescence intensity is transmitted through the fluorescence emission filter and is detected by the light intensity detector; and calculating the portion of the second fluorescence intensity, wherein an increase in the portion of the second fluorescence intensity indicates a pathogen presence.
- the second excitation light has a spectral wavelength in the range selected from group consisting of about 360 nm to about 370 nm, about 400 nm to about 410 nm, 425 nm to about 435 nm, 445 nm to about 455 nm, 625 nm to about 635 nm, 640 nm to about 650 nm, and 655 nm to about 665 nm, provided that the spectral wavelength of the second excitation light is not the same as the spectral wavelength of the first excitation light, and wherein the portion of the second fluorescence intensity has a spectral wavelength of greater than 690 nm.
- the first light has a spectral wavelength of about 505 nm to about 535 nm; and wherein reflection intensity measuring step further comprises subjecting the plant or plant part to a second light having a spectral wavelength in the range of about 535 nm to about 560 nm, wherein the plant or plant part reflects a portion of the second light to produce a second reflection intensity; detecting with the light intensity detector the second reflection intensity; and calculating the second reflection intensity, wherein an increase in the second reflection intensity indicates a reduction in photopigment concentration in response to a pathogen presence.
- this step may also include subjecting the plant or plant part to a third light having a spectral wavelength in the range of about 560 nm to about 580 nm, wherein the plant or plant part reflects a portion of the third light to produce a third reflection intensity; detecting with the light intensity detector the third reflection intensity; and calculating the third reflection intensity, wherein an increase in the third reflection intensity indicates a reduction in photopigment concentration in response to a pathogen presence.
- this step may include comprises subjecting the plant or plant part to a fourth light having a spectral wavelength in the range of about 580 nm to about 610 nm, wherein the plant or plant part reflects a portion of the fourth light to produce a fourth reflection intensity.
- Described herein is a novel biophotonic analyzer device and method to rapidly detect and measure both pathogen presence in or on plants and the plant stress response to the presence of pathogens.
- the device and method described herein are capable of detecting and measuring human pathogens on plants, including plants used for human consumption or in health or medicinal applications. Accordingly, these measurements can be used to support remediation efforts to improve food quality and prevent contamination in health supplements or medication.
- the devices and methods described herein utilize deep ultraviolet fluorescent (DUVF) to detect and measure the presence of pathogens on plants and, in preferred embodiments, can be used in combination with multi-spectral imaging (MSI) to further measure changes in a plant's photopigment activity and rate of photosynthesis as indicators of stress response due to the pathogen infection.
- DUVF deep ultraviolet fluorescent
- MSI multi-spectral imaging
- the methods provided herein include subjecting a plant or plant part to one or more light sources and measuring the intensity of the light reflected by and/or emitted from the plant or plant part, which is then used in a unique and innovative way to determine the presence of a pathogen and/or measure the concentration of a pathogen, such as a human pathogen, on the plant or plant part and further to measure the plant's stress response to the pathogen.
- the method entails subjecting the plant or plant part to DUV light and measuring the fluorescence emitted by the pathogen microbe, plant or plant part in response to DUV light.
- this fluorescence intensity can be used to detect the presence and concentration of a pathogen on the plant and further can be used to measure an increase or decrease in pathogen infection on the plant over time.
- the method additionally includes subjecting the plant to one or more light sources (i.e., visible light or near infra-red light) having different spectral wavelengths and measuring the intensity of the light reflected and/or the fluorescence emitted by the plant or plant part in response to the light exposure.
- the intensity of the reflected light/emitted fluorescence can be used to measure the stress-response of the plant as a result of the pathogen infection.
- the absorption of certain spectral wavelengths of light by photopigments can be used to measure the plant's stress response to levels of pathogen infection.
- photopigments e.g ., chlorophyll A, chlorophyll B, anthocyanin, carotenoid
- the light source exposure can be performed using any number of techniques
- a particular embodiment of the invention features the use of a novel biophotonic analyzer device capable of emitting both DUV light and visible/infra-red light for use with the present methods of analysis.
- the biophotonic analyzer device of the present invention includes a series of light sources ranging in spectral wavelength from DUV to near infra-red, which are used to detect and enumerate the pathogens presence on the plant foliar surface in real time and to determine the plant photosynthetic state, photopigments, water, and vascular responses to pathogens.
- the biophotonic analyzer device presented herein is the first to incorporate DUVF and MSI in a single device for real time reflective and fluorescence imaging of a plant foliar surface.
- the novel design allows for successive light and fluorescence imaging for a multitude of spectral wavelengths in a rapid and efficient manner to enable the user to measure several parameters of pathogen infection and stress response and monitor plant health.
- the present device and methods can be used with both traditional farming as well as in vertical farming, hydroponics, greenhouses, and laboratories to predict and improve plant growth, productivity, and quality control.
- steps for remediation of early-stage pathogen infection and stressors can be taken before visible symptoms appear on the plants, which often appear too late to salvage yield or the nutritional/medicinal qualities of the plants being grown.
- the biophotonic analyzer device of the instant invention includes, among other things, a light distributing component, a light detection or imaging system, and a control system that includes programmable elements for operation of the light sources.
- the control system further includes a calculating module or is linked to a central processing unit (CPU) that contains a calculating module for running software that calibrates the image data.
- the calibration program segments light intensity reflected from or emitted by the plant from the background light noise from soil and other surfaces or segment image data from certain plant anatomy.
- the calculating module further translates the imaging data into light intensity measurements which can be used to determine the presence of pathogens and the level of pathogen infection as well as the plant stress response to the pathogen.
- the light distributing component includes an integrating cavity with a hollow interior compartment configured for distribution of light.
- the integrating cavity will have a sloped or rounded inner surface.
- the inner surface of the integrating cavity is spherical or ball-shaped.
- the integrating cavity will have a top opening, or imaging port, and a bottom opening, or object port (or viewing aperture), with the both openings being positioned substantially along the same optical axis, which can also be referred to as substantially in optical alignment.
- the device is placed over an object, such as a plant or plant part, such that the object is directly underneath the object port to allow light to be emitted from the integrating cavity to the object and further to allow light reflected or emitted by the object to return through the view port and through the imaging port to the light detection or imaging system.
- the inner surface of the integrating component is preferably coated with a light diffuse reflective coating so that light emitted in the interior will uniformly illuminate the interior.
- the inner surface of the integrating cavity will include a plurality of light sources (e.g., LED lights) preferably mounted circumferentially around the equator of the inner surface. Each of the light sources will produce light of a specific spectral wavelength ranging from DUV to near infrared.
- the light sources can be turned on and off ( e.g., in a stroked or sequential manner) by the control system.
- the light detection or imaging system is disposed on the top surface of the integrating cavity and includes an imaging camera and, preferably, a mirror.
- the mirror is in optical alignment with the imaging port and the view port and directs light reflected or emitted by the object from the integrating cavity to the imaging camera.
- the imaging camera is placed in direct optical alignment with the imaging port of the integrating cavity and, thus, no mirror is needed.
- the inclusion of the mirror component alleviates the need to position the imaging camera directly above the integrating camera thereby allowing the anchoring of the device to, e.g., an overhead conveyor line or drone, while decreasing the height needed for system implementation.
- the light detection or imaging system may also include one or more emission filters for fluorescence imaging.
- the light detection or imaging system includes a filter wheel comprising multiple emission (fluorescence) filters, each configured for transmission of a particular wavelength or range of wavelengths.
- the filter wheel is enabled to spin and switch between no filter and emission filters of different transmission wavelengths.
- Ranges are used as shorthand to avoid having to list and describe each and every value within the range. Any value within the range can be selected, where appropriate, as the upper value, lower value, or the terminus of the range.
- the term “about” refers to the variation in the numerical value of a measurement, e.g., diameter, concentration, percentage, wavelength, etc., due to typical error rates of the device used to obtain that measure.
- the term “about” may mean within 5% of the reported numerical value, preferably, the term “about” means within 3% of the reported numerical value.
- controlled environmental conditions means that the plant or plant part being analyzed is kept under environmental conditions where one or more of the temperature, humidity, sunlight exposure, soil conditions, etc., are controlled and monitored, such as in a greenhouse, vertical farm, hydroponic system, and the like.
- a DUVF and/or MSI intensity profile can be developed for a specific plant in "controlled environmental conditions” and used as a benchmark for comparison to a test plant under the same “controlled environmental conditions” such that changes in DUVF and/or MSI intensity are indicative of a pathogen infection or the plant's stress response to the pathogen.
- integrating as used herein to refer to a sphere or cavity means an optical component consisting of a hollow spherical cavity with its interior covered with a diffuse light reflective coating, with openings for entrance and exit ports. Its relevant property is a uniform light scattering or diffusing effect.
- optical axis or optical alignment means that two components or features that are in close enough optical alignment such that the light path or images created by the light path is not significantly altered.
- two components that are “substantially on the same optical axis” might be off perfect alignment by 5% or less; preferably, less than 1%.
- DUVF imaging is performed on a plant or plant part. It has been discovered that pathogen presence/infection of the plant or plant part can affect the intensity of fluorescence emission from the plant in response to DUV light. In fact, the inventor has discovered that DUVF imaging can detect the presence of human pathogens on plants and in concentrations as low as about 10 colony forming units per milliliter (cfu/ml); preferably at least about 100 cfu/ml. While not intending to be bound by theory, the ability to detect and measure human pathogen presence on plants using DUVF imaging is due mainly to high concentrations of unsaturated amino acids, such as tryptophan, tyrosine, and phenylalanine produced by these pathogens.
- unsaturated amino acids such as tryptophan, tyrosine, and phenylalanine produced by these pathogens.
- the ability to detect such low levels of human pathogens on plants was very surprising.
- DUVF intensity can therefore be used to determine whether a plant is infected with a human pathogen and/or the estimated concentration of that pathogen and can be used to measure an increase or decreases in that pathogen infection over time.
- the plant or plant part is from the clade viridiplantae , which include the green land plants and algae.
- the present devices and methods can be adapted for use with any type of plant, soil samples, or wastewater.
- the method of the present invention can be used to detect the presence of a variety of pathogens including, but not limited to Erwinia sp., Pseudomonas sp., Bacillus sp., Clostridium sp., Klebsiella sp., Escherichia sp., Salmonella sp., Listeria sp., Rhizobium sp., Sinorhizobium sp., and the like, each of which include one or more species or subspecies that are harmful to humans and can decrease the quality of foodstuffs and medicines and, in many cases, cause illness and even death. Therefore, rapid and early detection of pathogens on plants, especially those used for human food or medicines, can not only allow for immediate remediation to increase plant survival and yields, but prevent human sickness due to consumption of infected plants.
- pathogens including, but not limited to Erwinia sp., Pseudomonas sp., Bacillus s
- UV Ultraviolet
- UV light having wavelengths towards the longer end of this range facilitate chemical reactions that cause many substances to glow or fluoresce. Therefore, as UV of a certain spectral wavelength impacts and is absorbed by a substance, the substance can emit light or other electromagnetic radiation of a longer wavelength (i.e., lower energy) that can be detectable by a suitable fluorescence detection or imaging system.
- DUV light which has a spectral wavelength of about 200 nm to about 280 nm, e.g., 200 nm, 210 nm, 220 nm, 230 nm, 240 nm, 250 nm, 260 nm, 270 nm, or 280 nm; preferably, the DUV light has a spectral wavelength of about 250 nm to about 280 nm. In one particular embodiment, the DUV light used in the present methods has a spectral wavelength of about 265 nm or about 270 nm.
- the DUV light source can be generated using light sources available in the art, including, but not limited to, a mercury-vapor lamp, laser diode, LED light, or any light source capable of emitting UV light with the appropriate spectral wavelength.
- a light source can be combined with an excitation light filter design to transmit only light having the desired DUV spectral wavelength.
- the DUV light source is generated from an LED configured to emit DUV and/or longer wavelength UV light (300-400 nm).
- the plant absorbs the DUV light and emits lower energy electromagnetic radiation.
- the emitted light can then be detected using photodetector or an imaging camera (e.g., digital camera, analog camera, color or monochrome camera, or CCD camera) in combination with one or more optical filters.
- Optical filters also referred to herein as "emission filters” or “fluorescence filters” when used with fluorescence detection/imaging) are available in the art and are designed to selectively transmit light of different spectral wavelengths. In this manner, imaging can be performed to measure fluorescence intensity of a particular spectral wavelength.
- Optical filters suitable for use herein include longpass filters, shortpass filters, band-pass filters, and dichroic filters.
- Dichroic filters are typically made by coating a glass substrate with a series of optical coatings and function to reflect the unwanted portion of the light while transmitting the remainder.
- a longpass (LP) filter is an optical interference or colored glass filter that attenuates light having shorter wavelengths and transmits light having longer spectral wavelengths over the active range of a target spectrum.
- shortpass (SP) filters are optical interference or colored glass filters that attenuate light having longer spectral wavelengths while transmitting light having shorter spectral wavelengths.
- Band-pass filters transmit only a certain spectral wavelength band or a narrow range of spectral wavelength bands while blocking all others.
- DUV light having a spectral wavelength of about 200 nm to about 280 nm, preferably, having a spectral wavelength of about 250 nm to about 280 nm is directed to a plant or plant part (e.g., foliage).
- the plant or plant part will emit fluorescent light, which can be detected using a suitable detection system, such as an imaging camera or a photodiode with the appropriate emission filter, such as a narrow bandpass filter.
- a photodiode with a narrow bandpass filter can detect emission intensity of a particular spectral wavelength in response to DUV excitation (e.g., 320 nm, 340 nm, 360 nm, or 380 nm), whereas, if images of the plant or plant part structure is desired, an imaging camera with appropriate emission filters will be used.
- DUV excitation e.g., 320 nm, 340 nm, 360 nm, or 380 nm
- Suitable emission spectra for use herein will have a spectral wavelength from about 300 nm to about 400 nm; preferably, between about 320 nm and about 385 nm, e.g., about 315 nm to about 325 nm, about 335 nm to about 345 nm, about 355 nm to about 365 nm, or about 375 nm to about 385 nm.
- emission spectra having wavelengths of about 320 nm, 340 nm, 360 nm, or 380 nm are used to detect the presence of a pathogen on the plant or plant part.
- the presence of a pathogen increases the DUVF intensity of a plant or plant part by at least 3% as compared to an equivalent uninfected plant or plant part. In other embodiments, the presence of a pathogen increases the DUVF intensity of a plant or plant part by 5% as compared to an equivalent uninfected plant or plant part. In yet other embodiments, the presence of a pathogen increases the DUVF intensity of a plant or plant part by 10% as compared to an equivalent uninfected plant or plant part.
- the method of measuring DUVF intensity can detect even a small concentration of a pathogen on the plant or plant part.
- pathogen concentration less than or equal to 10 7 cfu/ml can be detected; preferably less than or equal to 10 6 cfu/ml; or less than or equal to 10 5 cfu/ml; or less than or equal to 10 3 cfu/ml, or less than or equal to 10 cfu/ml.
- pathogen concentrations as low as about 10 to 100 cfu/ml can be detected.
- the DUVF intensity can be used to differentiate between certain species of pathogens. For instance, as shown in the examples, Salmonella enterica in water has a different DUVF profile as compared to Pseudomonas syringae DC3000 or Bacillus subtilis UD 1022. Likewise, plants infected with different pathogens will exhibit differentiated DUFV profiles. For instance, Black Seeded Simpson lettuce will produce a different DUVF profile when infected with S. enterica, Listeria innocua, or B. subtilis UD 1022. As such, the method described herein can be used to create specific DUVF intensity benchmarks or profiles of specific pathogen infection of particular plants or plant varieties. These benchmarks or profiles can be stored in a database and used for rapid, real time detection of pathogen presence on plants, the identification of the specific pathogen, and the determination of pathogen concentration.
- the plant of interest to the practitioner of the present method is Black Seeded Simpson lettuce.
- the practitioner takes DUVF measurements of multiple Black Seeded Simpson lettuce plants in controlled environmental conditions (e.g., a greenhouse or vertical farm with a stable atmospheric pressure, temperature, humidity and the like) to create an average baseline DUVF value for uninfected Black Seeded Simpson lettuce.
- controlled environmental conditions e.g., a greenhouse or vertical farm with a stable atmospheric pressure, temperature, humidity and the like
- the practitioner can take DUVF measurements of multiple Black Seeded Simpson lettuce plants in the same controlled environmental conditions after dosing with water and compare the intensity measurements to a set of black Seeded Simpson lettuce plants dosed with known concentrations of, e.g., S. enterica.
- the uninfected Black Seeded Simpson lettuce will have a specific DUVF intensity profile that can be differentiated from a plant infected with S. enterica under the same controlled environmental conditions.
- the DUFV profiles for the same plant can be differentiated among plants infected with different concentrations of S. enterica.
- These DUFV profiles can be compiled and stored in a database for use in monitoring and surveillance. Therefore, when a Black Seeded Simpson lettuce plant in the same controlled environment is subjected to DUFV analysis, the DUFV intensity measurements can be compared to the DUFV profile database to enable the user to rapidly, and in real-time, determine whether the black Seeded Simpson lettuce plant is infected with S. enterica and the level of infection.
- DUVF intensity profiles can be generated similarly for different concentrations of other pathogens, such as those described above.
- an entire DUVF intensity profile for Black Seeded Simpson lettuce can be generated. Therefore, when the method is used in practice, the DUVF measurements taken of a particular Black Seeded Simpson lettuce plant can rapidly inform the user of whether the plant is infected with a pathogen and, if so, the identity and approximate concentration of the pathogen.
- this method can be applied to other varieties of lettuce, e.g., Romain Lettuce, or any other plant of interest, e.g., varieties of spinach, cabbage, kale, collard greens, beet greens, arugula, endive, Bok Choy, turnip greens, Arabidopsis, and the like.
- lettuce e.g., Romain Lettuce
- any other plant of interest e.g., varieties of spinach, cabbage, kale, collard greens, beet greens, arugula, endive, Bok Choy, turnip greens, Arabidopsis, and the like.
- the DUVF analysis method described herein will allow farmers, growers, scientist, drug producers, and herbalists to develop pathogen profiles for their plants of interest and to monitor their plants for pathogen infection in real time. Indeed, the present method of DUVF analysis has extremely useful applications in agriculture, medicine, and food technology.
- the DUVF analysis of the present invention is used in combination with multi-spectral imaging (MSI) of the plants.
- MSI is used herein to measure and/or monitor plant foliar stress responses to pathogen infection.
- MSI can be used as well to assess both abiotic (environmental) stresses, such as, but not limited to, drought and nutrient deprivation and biotic stresses, such as, but not limited to, disease or insects.
- pathogen infection causes a direct measurable stress response, e.g., changes in light absorption by chlorophyll A and B or other photopigments and/or changes in water absorption.
- MSI utilizes light reflection and/or emission to detect and quantify photopigment and photosynthetic response of a plant to stress caused by pathogens.
- the present methods allow for detection and monitoring of both the presence of a pathogen and the direct plant foliar stress caused by the pathogen.
- MSI analysis of a plant or plant part involves subjecting the plant or plant part one or more spectral wavelengths of light.
- the MSI spectra ranges from about 350 nm to about 1,000 nm, e.g., 350 nm, 360 nm, 370 nm, 380 nm, 390 nm, 400 nm, 410 nm, 420 nm, 430 nm, 440 nm, 450 nm, 460 nm, 470 nm, 480 nm, 490 nm, 500 nm, 510 nm, 520 nm, 530 nm, 540 nm, 550 nm, 560 nm, 570 nm, 580 nm, 590 nm, 600 nm, 610 nm, 620 nm, 630 nm, 640 nm, 650 nm, 660 nm, 670 nm, 680
- the plant or plant part is subjected to one or more light sources emitting different spectral wavelengths of light, depending on the photopigment to be measured.
- the plant or plant part is subjected to 2, 3, 4, 5, 6, 7, 8, 9, 10, 11, 12, 13, 14, 15, 116, 17, 18, 19, 20, or more, lights sources or 20, 30, 40, 50, 60, 70, 80, 90, 100 or more lights sources.
- the plant or plant part is subjected to 2-19 light sources having different spectral wavelengths of light.
- certain spectral wavelengths of light are absorbed better than others. Those spectral wavelengths of light that are not well absorbed will have increased reflection.
- chlorophyll A and chlorophyll B absorb light in the red and blue spectral ranges very well, with a peak absorption in the blue band at about 435 nm (Soret band) and peak absorption in the red band at about 635 nm and about 662 nm (Qx band and Qy band, respectively).
- chlorophyll tends to reflect light in the green spectral range (about 495 to about 570 nm) thus giving many green plants their color.
- Exemplary photopigments present in plants and the spectral wavelengths with the highest reflection intensity and absorption spectra are summarized in Table 1 and Figure 1 . Table 1.
- the MSI method may include subjecting the plant or plant part to several different spectral wavelengths of light and measuring the reflection intensity, which, in turn, provides information about the concentration and function of certain photopigments.
- One or more sources of light having the desired spectral wavelengths can be generated by laser diodes, excitation filters that transmit light of a specific spectral wavelengths, LEDs, and the like.
- the light source such as a laser diode or LED, will emit light of a particular wavelength and directed to the plant or plant part, and the reflection image can be captured using an art standard imaging camera or light intensity detector as described above.
- an emission filter is not required for imaging at this step since the light source emits only the desired spectral wavelength. Therefore, the light reflected should be approximately the same spectral wavelength as the light emitted.
- Light sources emitting light in the spectral wavelength from about 495 nm to about 640 nm will tend be reflected by the chlorophyll A and B photopigments and produce large reflection intensity profiles in this spectral range. As such, the light reflection intensity in this spectral range is easily detectable using available imaging or photodetection techniques.
- a further increase in reflection of these spectral wavelengths as compared to a control profile or baseline level is an indication of decreased concentration and/or light-absorption function of these particular photopigments.
- light sources emitting light having spectral wavelengths greater than about 510 nm will be reflected by the carotenoid photopigment, and an increase in reflection intensity may indicate a decrease in concentration and/or function of the carotenoid photopigment.
- C (ctrl) is a constant for each plant type and is determined through plant evaluations with both MSI and absorption detection sensors.
- the relatively high intensity of the light being reflected by the plants enables the use of relatively short emitted light exposure times sufficient for adequate light intensity detection and imaging.
- the different light sources can be turned on in a successive or stroked manner such that the plant or plant part is subjected to each particular spectral wavelength for a brief period of time, e.g., 0.1 seconds, 0.2 seconds, 0.3 seconds, 0.4 seconds, 0.5 seconds, 0.6 seconds, 0.7 seconds, 0.8 seconds, 0.9 seconds, 1 second, or more.
- the light intensity detector e.g., digital camera
- the activation of the light source and the image capture/measuring is controlled by a programmable system so that the user can select the desired number of light sources for which to capture the light intensity measurements.
- the short emitted light exposure time allows for the user to take measurements with a large number of spectral wavelengths in a short period of time. For instance, in one particular embodiments, the user can take light reflection measurements for 19 different spectral wavelengths in less than about 5 seconds with a VideometerLab ® MSI (Videometer A/S, Copenhagen, Denmark).
- light reflection intensity measurements are captured for spectral wavelengths optimal for detecting and calculating photopigment development and activity for a variety of different photopigments.
- these photopigments include, among others, chlorophyll A and B, carotenoid, and anthocyanin.
- the light sources that are activated during the MSI method may include those having an emitted spectral wavelength selected from the range of 350 nm to about 1,000 nm.
- light sources such as LEDs, having spectral wavelengths of about 365 nm, 405 nm, 430 nm, 450, 470 nm, 490 nm, 525 nm, 550 nm, 570 nm, 590 nm, 630 nm, 645 nm, 660 nm, 690 nm, 770 nm, 850 nm, 870 nm, 940 nm, and 970 nm are used.
- the plant or plant part such as the foliage of a leafy green plant (e.g., lettuce, spinach), is subjected to each of these spectral wavelengths in succession for a brief period of time (e.g., 0.1-0.5 seconds each) while the image of the plant or plant part is captured by a digital camera.
- the intensity of the reflected light for each spectral wavelength is then measured and the reflection intensity and absorption concentration is calculated as described above.
- the presence of a pathogen will cause the photopigments of the plant to reflect a higher concentration of light as compared to an uninfected plant under the same controlled environmental conditions.
- the light reflection intensity can be used to estimate the light absorption capability of that photopigment according to Equation 1. For instance, an increase in reflection of spectral wavelengths from, e.g., about 525 nm to about 590 nm, indicate a decrease in absorption of this light and, therefore, a decrease in chlorophyll A/B concentration and/or function in response to the pathogen infection.
- the MSI method of the instant invention can be used to generate reflection intensity profiles for different plants infected with different pathogens.
- the practitioner takes MSI reflection intensity measurements for multiple Black Seeded Simpson lettuce plants in controlled environmental conditions to create an average baseline reflection intensity value.
- the practitioner can take MSI reflection intensity measurements of multiple Black Seeded Simpson lettuce plants in the same controlled environmental conditions after dosing with water and compare the intensity measurements to a set of Black Seeded Simpson lettuce plants dosed with known concentrations of, e.g., S. enterica to create another value. Data sets can be generated similarly for different concentrations of S. enterica and/or for different concentrations of other pathogens, such as those described above.
- an entire MSI reflection intensity profile for Black Seeded Simpson lettuce can be generated. This can be carried out for any number of plant varieties to create a library of MSI reflection intensity profiles for storage in a database.
- a particular plant type e.g., Black Seeded Simpson lettuce, Romaine lettuce, Arabidopsis, etc.
- a specific photopigment e.g., chlorophyll A, anthocyanin, etc
- Reflection is the average of reflection for at least four control plants of the same variety of plant under the same controlled environmental conditions.
- C (ctrl) is a normalization coefficient usually set to a known value for the particular plant of interest (e.g., from SPAD 502 chlorophyll meter measuring chlorophyll (Konica Minolta, U.S.A.)).
- MSI reflected light intensity measurements are taken from green plants using a light source having a spectral wavelength from about 525 nm to about 590 nm, e.g., 525 nm, 530 nm, 535, nm, 540 nm, 545 nm, 550 nm, 555 nm, 560 nm, 565 nm, 570 nm, 575 nm, 580 nm, 585 nm, or 590 nm, to measure concentration and/or function of chlorophyll A/B in the plant.
- a light source having a spectral wavelength from about 525 nm to about 590 nm, e.g., 525 nm, 530 nm, 535, nm, 540 nm, 545 nm, 550 nm, 555 nm, 560 nm, 565 nm, 570 nm, 575 nm, 580
- the spectral wavelengths of the light source(s) are about 525 nm, 550 nm, 570 nm, and/or 590 nm for measuring the light reflection by chlorophyll.
- an increase in reflection or decrease in absorption of light at these wavelengths as compared to a baseline or benchmark value indicates a decrease in chlorophyll A/B photopigment concentration and/or function.
- a measured decrease in chlorophyll A/B photopigment concentration or function of at least 1% indicates pathogen infection.
- a measured decrease in chlorophyll A/B photopigment of at least 5% indicates pathogen infection.
- this method can be used in combination with DUVF to measure increases in pathogen infection over time and differentiate between different pathogens, such as L. innocua, S. enterica, P. syringae DC3000, or B. subtilis UD 1022.
- pathogens such as L. innocua, S. enterica, P. syringae DC3000, or B. subtilis UD 1022.
- the MSI method provided herein may also utilize fluorescence imaging to measure, for example, photosynthesis activity and predicted electron transfer rate index changes in plants in response to pathogen infection.
- the excitation light source is absorbed by the plant or plant part, which is emitted by the plant in the form of lower energy wavelengths and detected using the light intensity detection systems in combination with the appropriate emission filter.
- MSI fluorescence detection requires a longer period of plant exposure to the excitation light.
- each light source used for emission detection is pulsed for about 0.5 seconds to about 2 seconds, e.g., 0.5 seconds, 0.6 seconds, 0.7 seconds, 0.8 seconds, 0.9 seconds, 1.0 seconds, 1.1 seconds, 1.2 seconds, 1.3 seconds, 1.4 seconds, 1.5 seconds, 1.6 seconds, 1.7 seconds, 1.8 seconds, 1.9 seconds, or 2.0 seconds.
- the plant or plant part is subjected to excitation light of one or more spectral wavelengths ranging from 350 nm to about 660 nm, e.g., 350 nm, 360 nm, 370 nm, 380 nm, 390 nm, 400 nm, 410 nm, 420 nm, 430 nm, 440 nm, 450 nm, 460 nm, 470 nm, 480 nm, 490 nm, 500 nm, 510 nm, 520 nm, 530 nm, 540 nm, 550 nm, 560 nm, 570 nm, 580 nm, 590 nm, 600 nm, 610 nm, 620 nm, 630 nm, 640 nm, 650 nm, or 660 nm.
- excitation light of one or more spectral wavelengths ranging from 350 nm to about
- light emission filters are used to detect and measure the intensity of only particular spectral wavelengths of light emitted by the plant or plant part in response to the excitation light.
- the fluorescence emitted from the subject plant or plant part is then transmitted to the photodiode or digital imaging camera by the emission filters.
- Suitable emission filters are selected based on the desired spectral wavelength of fluorescence to be measured and can include, longpass filters, shortpass filters, band-pass filters, and dichroic filters. For instance, fluorescence emission spectra having wavelengths greater than about 690 nm can be detected using a suitable long pass emission filter with an imaging camera.
- photosystem II (PSII) emission intensity from plants or plant parts is measured using the MSI method of the instant invention.
- PSII the chlorophyll photopigment molecules (ChlA and/or ChlB) create the fluorescence emission. In plants, this emission is typically caused by stress proportional to the excess energy the plant cannot use in photosynthesis. The rate at which these plants fluoresce and the number of molecules available to emit fluorescence must be accounted for to calculate change in stress.
- a given level of PSII fluorescence emission intensity is due to both the photopigment concentration (i.e., the fluorophore concentration) and the amount and type of stress (e.g., pathogen infection).
- the plant or plant part is subjected to excitation light from, e.g., an LED light source, having a spectral wavelength at or around the Soret peak band (about 435 nm), the Qx peak band (about 635 nm), and/or the Qy peak band (about 662 nm).
- excitation light from, e.g., an LED light source, having a spectral wavelength at or around the Soret peak band (about 435 nm), the Qx peak band (about 635 nm), and/or the Qy peak band (about 662 nm).
- the plant or plant part can be subjected to excitation light emitted from one or more light sources having a spectral wavelength from about 365 nm to about 450 nm and/or from about 630 nm to about 660 nm.
- the plant or plant part is subjected to excitation light emitted from one or more light sources having a spectral wavelength of about 365 nm, 405 nm, 430 nm, 450 nm, 630 nm, 645 nm, and/or 660 nm, which is absorbed by the chlorophyll photopigment and emitted as a lower energy spectral wavelength of greater than about 690 nm.
- the fluorescence emission is then transmitted through a suitable emission filter (e.g., long pass light filter transmitting light greater than about 690 nm) and detected by an imaging camera.
- an increase in fluorescence intensity indicates increased stress due to, e.g., the presence of a pathogen.
- human pathogens appear to spread across the mesophyllic leaf so that the stress is distributed across the foliar structure.
- the fluorescence emission intensity measurements can be further used to calculate the photosynthetic rate change for a specific plant variety.
- the photosynthetic rate for a particular plant in this case may be expressed as a percent change compared to control plants of the same variety and under the same controlled environmental conditions.
- fluorescence emission intensity of the same spectral wavelength as the testing group is measured for 3 or 4 plants that have not been infected by pathogens.
- the average fluorescence emission intensity for the control plants is Emission (ctrl) .
- Emission (ctrl) The average fluorescence emission intensity for the control plants.
- the change in fluorescence emission intensity for a given spectra and for a particular plant variety can be calculated according to Equation 3, where Ci is the coefficient related to a particular plant species, which is cross calibrated against a known value (e.g., from SPAD 502 meter or other systems) or established from a panel of control plants.
- Emission ⁇ Ci Emission meas ⁇ Emission ctrl Emissionl ctrl
- the photosynthetic rate can be calculated by normalizing the change in emission by the average percent change in intensity of light reflected from the plant or plant part at spectral wavelengths of about 645 nm and/or 660 nm according to Equation 4.
- PCi PCi ⁇ Reflectance meas ⁇ Reflectance ctrl Reflectance ctrl ⁇ Emission ⁇
- PCi is a constant derived for each type of plant reflectance and the control conditions for the plant.
- Reflectance (meas) is the measure of the intensity of reflected light of the plant or plant part when subjected to light at spectral wavelengths of about 645 nm and/or 660 nm
- Reflectance (ctrl) is the average reflective intensity measurement of control plants.
- the photosynthetic rate of a plant or plant part can be determined by first measuring the reflective intensity and fluorescence emission intensity and then calculating the percent change in photosynthetic rate using Equations 3 and 4.
- a decrease in photosynthetic rate compared to the benchmark control intensity indicates that the plant has been exposed to a stress, such as a pathogen infection.
- specific MSI fluorescence emission intensity profiles for specific plant varieties under specific controlled environmental conditions can be generated to allow the use of the present method for rapid detection of pathogen infection and the plant's corresponding stress response.
- the present methods can be used to generate a MSI intensity profile database for any particular plant variety that includes reference reflectance and emissions intensity data for uninfected as well as plants infected with any number and concentration of pathogens.
- the practitioner need only select the intensity profiles for monitoring and surveillance of the plant of interest and use these profiles with the methods described herein for rapid and real time detection of pathogen infection as well as the determination of the concentration of that pathogen. Therefore, the practitioner can take swift action to remediate the infection and prevent decreased crop yields and/or pathogen contamination.
- the presence of pathogen infection can be detected and measured along with the plant's stress response to the pathogen infection over time.
- the pathogen is a human pathogen. While the DUVF and MSI intensity measurements can be done in any order, it is preferable to perform the MSI reflection measurements followed by the MSI fluorescence emission measurements followed by the DUVF measurements.
- Figure 2 shows exemplary MSI reflection intensity and fluorescence emission intensity imaging of Arabidopsis.
- the present invention also includes a novel and innovative biophotonic analyzer device that, for the first time, utilizes both DUVF and MSI in a single device. Indeed, existing limitations at the time of the invention, including the lack of DUV LED with sufficient power output, prohibited development of a device combining DUVF and MSI with a single imager.
- the biophotonic analyzer device disclosed herein is an innovative tool that can be used for performing both the DUVF and MSI pathogen and stress-response detection methods discussed above in an efficient, rapid, and cost-effective manner.
- the design of the device enables its incorporation into line conveyor systems for use in greenhouses or vertical farms or for mounting to low flying drones for surveillance of outdoor crop fields.
- the biophotonic analyzer device will generally include a light distributing element, a light detection system, a control system, and a calculating module.
- the light distributing element includes an integrating cavity, which is preferably rounded or spherical in shape, with an inner surface forming a hollow interior.
- the inner surface comprises a dull light-reflective coating, such as a sintered polytetrafluoroethylene polymer coating (SPECTRALON ® , Labsphere, Inc., New Hampshire, United States) or a white diffusing paint based on barium sulphate.
- SPECTRALON ® sintered polytetrafluoroethylene polymer coating
- the integrating cavity will further include a top opening, or imaging port, and a bottom opening, or object port.
- both the imaging port and the object port are at opposite poles of the integrating cavity and substantially on the same optical axis and in substantial optical alignment.
- the integrating cavity will also include a DUV light source and one or more additional light sources, each of which is configured to emit light having a different spectral wavelength, e.g., 1, 2, 3, 4, 5, 6, 7, 8, 9, 10, 11, 12, 13, 14, 15, 16, 17, 18, 19, 20, 21, 22, 23, 24, 25, 26, 27, 28, 29, 30, or more additional light sources for MSI analysis.
- the integrating cavity may include a DUV light source and one additional source of light combined with a plurality of excitation light filters (e.g., a filter wheel) wherein each light filter is configured to transmit light of a particular spectral wavelength for MSI analysis.
- the DUV light source of the present device will emit light having a spectral wavelength of about 200 nm to about 280 nm (preferably, about 250 nm to about 280 nm), and the one or more additional light sources will emit light having spectral wavelengths selected from the range of about 350 nm to about 1,000 nm.
- the biophotonic analyzer device includes a DUV light source and 2-20 additional light sources for MSI analysis.
- the device may include light sources emitting light with spectral wavelengths of about 200 nm to about 280 nm (preferably between about 250 nm and about 280 nm) for DUV and a plurality of additional light sources for MSI that emit light with spectral wavelengths selected from about 360 nm to about 370 nm, 400 nm to about 410 nm, 430 nm to about 440 nm, 445 nm to about 455 nm, 465 nm to about 475 nm, 480 nm to about 505 nm, 520 nm to about 530 nm, 545 nm to about 555 nm, 565 nm to about 575 nm, 585 nm to about 600 nm, 625 nm to about 635 nm, 640 nm to about 650 nm, 655 nm to about 665 nm, 685 nm to about 695 nm, 765
- the biophotonic analyzer device includes lights sources that emit light having the following spectral wavelengths: 265 nm (DUV), 365 nm, 405 nm, 430 nm, 450 nm, 470 nm, 490 nm, 525 nm, 550 nm, 570 nm, 590 nm, 630 nm, 645 nm, 660 nm, 690 nm, 770 nm, 850 nm, 870 nm, 940 nm, and 970 nm.
- DC 265 nm
- the integrating cavity includes a plurality of LED lights mounted circumferentially and equatorially around the inner surface of the integrating cavity and configured to emit light of the desired spectral wavelengths.
- the light sources will be operated via a user-programmable control system programmed to active the light sources in the desired sequence and for the desired time.
- the integrating cavity will preferably be rounded or spherical in shape. In some embodiments, the integrating cavity will have a diameter of between about 7.62 cm to about 30.48 cm, e.g.
- the biophotonic analyzer device can be configured for hand-held operation or motorized/robotic mounting.
- the light detection system of the biophotonic analyzer may include a light intensity detector, such as a photodiode or digital imaging camera in optical communication with the view port, or aperture.
- the light intensity detector is a digital imaging camera.
- the biophotonic analyzer is designed such that the light intensity detector is off center relative to the view port, wherein a mirror element is in optical alignment with the view port and configured to divert light emitted from the interior of the integrating cavity to the digital imaging camera.
- the biophotonic analyzer device may also include one or more optical or emission filters for fluorescence imaging.
- the types of suitable emission filters are discussed above in detail.
- the biophotonic analyzer device includes a light filter component containing a plurality of emission filters and configured to switch between the different emission filters via the control system.
- Each of the emission filters will be adapted for transmission of a particular spectral wavelength or range of spectral wavelengths ranging from 260 nm to 1,000 nm.
- the emission filters can be short pass, narrow band pass, or long pass filters, each of which are readily available in the art, and it is well within the purview of the skilled artisan to select emission filters suitable for transmitting the desired light to the imaging camera.
- narrow band pass filters for transmitting fluorescence emission of 320 nm, 340 nm, 360 nm and/or 380 nm can be used for detecting DUVF
- long pass filters for transmitting fluorescence emission great than 690 nm can be used for detecting chlorophyll A/B fluorescence.
- the biophotonic analyzer will be calibrated prior to use.
- a non-limiting exemplary biophotonic analyzer device may include an industrial grey scale camera with a sensitivity range of about 350-1000 nm.
- the consistency of each of the LEDs of the device may be tested by comparing their respective emission spectra to commercial LED lights selected within the same target wavelength and bandwidth (e.g., 570 +/- 2 nm).
- the LED irradiative flux control (duration and power level ) are tuned across the visible spectrum to be proportional to the solar spectrum, on which the plants rely to conduct photosynthesis, and to insure imaging consistency.
- the camera controls shutter speed is also controlled for imaging sensitivity.
- the LEDs are fired in sequence from UV to visible to near infrared in order of increasing wavelength.
- the LED pulse energy and duration (typically between about 100-300 milliseconds per LED wavelength ) allow for the total irradiative flux (watts/cm 2 ) to be consistent relative to solar calibration.
- the camera sensitivity is set using three targets to insure spectral and spatial consistency.
- the integrating sphere is used to insure uniform object lighting at the aperture opposite the camera.
- the targets for the camera calibration include a white target surface to calibrate camera and LEDs, such as a disk of a diffuse white coating (Spectralon ® ) to set camera spectral sensitivity; an optical grey target to optimize sensitivity at each wavelength from most to least intense and a spatial calibration target to calibrate x and y dimensions.
- Spectralon ® diffuse white coating
- the MSI light arrangement will be calibrated for a given plant type as a control to establish a calibration image model for the control plant species.
- a suitable control plant for a given species preferably is a well-known variety, e.g. wild type Arabidopsis Columbian.
- the MSI light arrangement is activated to create LED lighting parameters for a given optimal spectral response for the control plant. This then is used to compare to other plants of the same variety for detecting spectral and shape changes due to stress, which in turn creates a loss of photopigment (e.g. Chlorophyll), as well as light reflection intensity and/or reduced vascular area. These differences are used to create models of spectral and spatial content against control plants (standard plant varieties).
- control measurements establish camera and LED parameters for MSI assays and can be programmed into a menu that is selectable by the user to enable the user to perform rapid sequential measurements of plants and calibrate the measurements for each wavelength for reflection and fluorescence incorporating the measurement sensitivity determined by the LED power and duration.
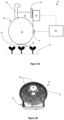
- FIG. 3A An exemplary biophotonic analyzer device is shown in Figure 3A .
- the biophotonic analyzer device 10 includes an integrating cavity 20 with a housing 25.
- the object port 30 is also shown.
- the imaging port 90 is not visible ( see Figure 4 ).
- the device includes a light detection system housing 40 disposed on top surface of the housing 25 of the integrating cavity 20 and is connected to an imaging camera 45.
- a power source (broken line) for operating the light sources and the imaging camera 45 is connected to control element 50 (e.g., programable CPU element).
- An attachment element 60 is configured for attaching the biophotonic analyzer device 10 to a conveyor system or other object (not shown).
- a filter wheel 55 is provided (see also Figure 3B ).
- the filter wheel 55 will be mechanically coupled to an electronic element 56 via rotor 57 that is configured to rotate the filter wheel 55.
- the filter wheel 55 will include a plurality of filter holder elements 58 in which the appropriate fluorescence emission filter can be inserted.
- at least one filter holder element 58 can be left empty for reflection imaging.
- the filter wheel 55 is configured to rotate about the rotor 57 in response to electrical signals sent from the control element 50. The rotation of the filter wheel 55 switches between the various fluorescence emission filters or no emission filter.
- the object of interest i.e., the plant 65
- the control element 50 sends signals to the light sources around the interior of the integrating cavity 20 via connection 35, which emit light from the object port 30 to the plant 65.
- the imaging camera 45 captures the image and relays the captured image to the control element 50, which includes or is in communication with a calculating module ( e.g., via wireless networking).
- the calculating module includes a software program for differentiating the plant 65 image and, in particular the surface of the plant leaves, from the background 70 ( e.g., soil).
- the calculating module software program will also be configured for differentiating the different plant tissues (e.g., mesophylls, vasculature, and seeds) (see Figure 2 ).
- the light intensity data can then be sent to a CPU for further analysis or storage.
- Figure 4 is a cross-section diagram showing the interior 75 of the integrating cavity 20.
- the object port 30 and the imaging port 90 are shown.
- the emitted light (represented by solid arrows) is reflected or emitted from the plant 65 (represented by dotted arrows).
- a mirror element 80 is in optical alignment with both the imaging port 90 and the object port 80 to direct the reflected or emitted light to the imaging camera 45.
- the filter wheel 55 switches to the appropriate light emission filter via the control element 50.
- the user will select the specific lights sources necessary for the desired DUVF and/or MSI analysis via the control element.
- the control element will be configured for the selection of one or more preset analysis programs.
- the user will be able to customize the activation and timing of the particular light sources and, if necessary, the emission filters.
- the user may interface with the control element and the calculating module via a computer processing unit (e.g., laptop or mobile device).
- the biophotonic analyzer device includes one light source for DUV (265 nm) and 19 additional light sources for MSI (365 nm, 405 nm, 430 nm, 450 nm, 470 nm, 490 nm, 525 nm, 550 nm, 570 nm, 590 nm, 630 nm, 645 nm, 660 nm, 690 nm, 770 nm, 850 nm, 870 nm, 940 nm, and 970 nm).
- MSI reflection intensity measurements are performed first.
- the user will select a program pre-set for MSI reflection measurements followed by MSI fluorescence emission and DUVF measurements via the control element 50 or via a separate device ( e.g., laptop or mobile device) configured to communicate with the control element 50 ( e.g., wireless networking).
- the control element 50 will send a signal to each of the 19 light sources 85 (for simplicity, only four representative light sources are shown) and pulse each light source 85 for about 0.1 to about 0.3 seconds in succession.
- each spectral wavelength of light is emitted from the object port 30 and is reflected off of the plant 65.
- the reflected light is directed back through the object port 30, through the imaging port 90, and directed by the mirror 80 to the imaging camera 45.
- the imaging camera 45 captures the image with reflected light intensity for each spectral wavelengths and sends the imaging data to the control element 50 and calculating module where the imaging data is calibrated and normalized for background.
- the reflected light intensity data is stored and compared to the stored MSI reflection intensity profiles to calculate the change in intensity compared to a normal plant of the same variety and under the same controlled environmental conditions.
- the control element 50 then sends a signal to one or more light sources corresponding to emitted light in the spectral wavelengths of 365 nm, 405 nm, 430 nm, 450 nm, 630 nm, 645 nm, and/or 660 nm for chlorophyll A/B emission measurements.
- the control element will send a signal to the filter wheel 55 to switch to the long pass filter for transmitting wavelengths greater than 690 nm.
- the control element will pulse each of the appropriate light sources for about 0.5 to about 2 seconds in succession. As the light is emitted from each of the light sources, it is emitted through the object port 30 and is absorbed into the surface of the leaves of plant 65.
- the fluorescence emission from the plant 65 is sent back through the object port 30, through the imaging port 90, and is directed by the mirror 80 and through the long pass filter of the filter wheel 55 to the imaging camera 45.
- the imaging camber 45 captures the image with fluorescence emission intensity for each of the excitation wavelengths and sends the imaging data to the control element 50 where the imaging data is calibrated and normalized for background.
- the fluorescence emission intensity data is stored and compared to the appropriate MSI emission intensity profiles to calculate the change in intensity. Further, the control element calculates the change in photosynthesis rate using the data from both the reflection analysis and the emission analysis.
- control element 50 sends a signal to the DUV light source, which emits DUV light having a spectral wavelength of 265 nm.
- the control element sends a signal to the filter wheel 55 to select the first DUVF emission filter (narrow band pass filter for transmission of 320 nm).
- the DUV light exits the object port 30 and is absorbed by the leaf surface of plant 65.
- the fluorescence emitted from the plant 65 is sent back through the object port 30 and is detected by the imaging camera 45, which relays the image and emission intensity data to the control element 50 as described above.
- the control element 50 then sends a signal to the filter wheel 55 to select the next DUVF emission filter (narrow band pass filter for transmission of 340 nm).
- This process repeats for each of the 360 nm and the 380 nm narrow band filters of the filter wheel 55.
- the imaging camera 45 sends the imaging data to the control element 50.
- the control element 50 or another CPU configured to communicate with a retrieve the light intensity data from the control element 50 is then used to compare the normalized and calibrated fluorescence intensity data to the DUVF intensity profiles for the same plant variety under the same controlled environmental conditions. As a result, the user obtains real time data that indicates whether the plant 65 was infected with a pathogen and, if so, the identity of the pathogen and level of infection.
- the biophotonic analyzer device can be used as a handheld device.
- the biophotonic analyzer device can be attached to the under carriage of a drone and flown slowly over rows of crops to take DUVF and MSI measurements.
- the control element may include wireless capability to send data to a remote CPU element for making the calculations or may include a calculating module for calibration and normalization of the light intensity data, which can then be sent to a CPU element (e.g., laptop) for further analysis.
- one or more biophotonic analyzer devices can be hung from a conveyor element for use in a vertical farm or greenhouse. In this embodiment, the devices are moved along rows of plants for taking DUVF and MSI measurements as described herein.
- Example 1 DUVF detection of S. enterica, UD 1022, and DC 3000 in serial dilutions.
- serial dilutions of S. enterica were prepared at 10 cfu/ml, 100 cfu/ml, 10 5 cfu/ml, and 10 7 cfu/ml. Liquid cultures of S. enterica were grown and diluted in water. The pathogen dilution samples were loaded into 3 cc fused silica cuvettes that were precalibrated with water.
- DUVF measurements were conducted using a TraC ® DUVF (Photon Systems, Inc., California, United States) configured to emit DUV light at 270 nm and detect emission intensities at 320 nm, 340 nm, 360 nm, and 380 nm.
- the log10 emission intensity for each dilution is shown in Figure 5 .
- the R-Sqrd value for each band intensity versus concentration was less than 0.98.
- the 340 nm and 360 nm emission intensity bands were most highly correlated to cfu/ml.
- the DUVF measurements were carried out on serial dilutions of P. syringae DC3000, B. subtilis UD 1022, and Sinorhizobium meliloti.
- Figure 6 compares the ratio of fluorescence intensities to mean intensity values for S. enterica, P. syringae DC3000, and B. subtilis UD 1022.
- the DUVF intensity ratios showed a clear differentiation between the pathogen species as the emission intensity differences at 340 nm and 360 nm were typically factors of at least 2- to 4-fold.
- meliloti serial dilutions at 100 cfu/ml, 10 3 cfu/ml, 10 4 cfu/ml, 10 5 cfu/ml, 10 6 cfu/ml, and 10 7 cfu/ml were exposed to DUV at 248 nm, and the emission intensities at about 340 nm were detected.
- the DUVF log10 emission intensity at 340 nm is differentiated between the two pathogens across five orders of magnitude of concentrations.
- Black Seeded Simpson lettuce plants at three weeks of age and under controlled environmental conditions were dosed with water (control) or either S. enterica, L. innocua, B. subtilis UD1022, or P. syringae DC3000 pathogens at concentrations ranging from 10 cfu/ml to 10 7 cfu/ml.
- DUVF measurements were obtained from 3 to 4 points on the foliar surfaces of each plant using a TraC ® DUVF (Photon Systems, Inc., California, United States). DUFV measurements were taken just prior to dosing and at regular post-dosing intervals ( ⁇ 10 minutes, 3 hours, 6 hours, 24 hours, 72 hours, and 120 hours).
- DUVF detection method allowed the differential detection of pathogen-infected plants compared to control plants, especially when comparing emission band ratios 340 nm/360 nm and 360 nm/380 nm.
- Figure 8 shows a DUVF log10 340 nm emission plot from control plants as compared to plants dosed with 10 3 cfu/ml of the different pathogens. Similar results were obtained for spinach plants (data not shown). The results showed that DUVF method of the present invention is capable of differential detection of the pathogens for up to 72 hours post-dosing, even at low concentrations of pathogens.
- the Black Seeded Simpson lettuce plants from Example 2 were further subjected to MSI analysis at each of the time points discussed above.
- the VideometerLab ® 4 MSI with a digital camera Videometer A/S, Copenhagen, Denmark was used.
- MSI reflection intensity was first carried out by exposing the foliar surfaces of each plant to light of different spectral wavelengths ranging from 365 nm to 970 nm. The intensity of reflected light from each plant for each wavelength was recorded using the digital camera of the VideometerLab ® 4 MSI. The image information from the foliar surfaces was segmented from the soil and other physical plant structures and calibrated to minimize background noise.
- Figure 9 shows the MSI reflection spectra for the control Black Seeded Simpson lettuce plant. (well-watered). As shown in Figure 9 , the reflection intensities for the different photopigments decrease over time indicating up to 18% photopigment concentration increase. In addition, the water concentration is increased by about 5% as indicated by the 940 nm reflection intensity.
- FIG. 10 shows the reflection intensity profile for a Black Seeded Simpson lettuce plant dosed with 10 3 cfu/ml L. innocua.
- the chlorophyll A and B concentration decreased by up to 16% over time ( see box).
- Figure 11 shows the percentage change from 0 hours post dosing to 120 hours post dosing for untreated control plants versus plants dosed with 10 3 cfu/ml or 10 6 cfu/ml P . syringae DC3000.
- increasing concentration of pathogen correlated with decreased photopigment development.
- the VideometerLab ® 4 MSI device was then switched to fluorescence imaging. Excitation wavelengths at 645 nm and 660 nm were used with a long pass filter to transmit wavelengths greater than 690 nm. Emission intensity was used to calculate the change in rate of photosynthesis using the equations provided above. The photosystem II emission response showed that control plants had a minimal emission change of about 5% to 8%. However, plants dosed with pathogens at about 10 to 20% from 24 to 48 hours after dosing, and about 20% to 30% by 120 hours post-dosing. Figure 12 shows the predicted loss in photosynthetic rate for Black Seeded Simpson lettuce inoculated with 10 6 cfu/ml P . syringae DC3000.
- MSI methods of the present invention were effective in measuring the stress response in plants infected with pathogens.
Landscapes
- Health & Medical Sciences (AREA)
- Physics & Mathematics (AREA)
- Life Sciences & Earth Sciences (AREA)
- Immunology (AREA)
- Chemical & Material Sciences (AREA)
- Analytical Chemistry (AREA)
- Biochemistry (AREA)
- General Health & Medical Sciences (AREA)
- General Physics & Mathematics (AREA)
- Pathology (AREA)
- Nuclear Medicine, Radiotherapy & Molecular Imaging (AREA)
- Spectroscopy & Molecular Physics (AREA)
- Molecular Biology (AREA)
- Biomedical Technology (AREA)
- Engineering & Computer Science (AREA)
- Investigating, Analyzing Materials By Fluorescence Or Luminescence (AREA)
Claims (15)
- Vorrichtung (10) zum Erfassen eines Pathogens auf einem Probenobjekt in Form einer Pflanze oder eines Pflanzenteils und zum Messen der Stressantwort des Probenobjekts, worin die Vorrichtung (10) ein Lichtverteilungselement, ein Lichterfassungssystem, eine Steuereinheit und ein Berechnungsmodul umfasst, wobei:a) das Lichtverteilungselement einen integrierenden Hohlraum (20) umfasst, der eine erste Öffnung, eine zweite Öffnung und eine innere Oberfläche aufweist, auf der eine diffus reflektierende Beschichtung aufgebracht ist und auf der mehrere Lichtquellen (85) angebracht sind, die ausgestaltet sind, Licht zu emittieren und einen Innenraum (75) des integrierenden Hohlraums (20) zu beleuchten, worin:i) der integrierende Hohlraum (20) ausgestaltet ist, das von den mehreren Lichtquellen (85) emittierte Licht durch die zweite Öffnung zu verteilen, um das Probenobjekt zu beleuchten, undb) das Lichterfassungssystem in optischer Verbindung mit der ersten Öffnung und der zweiten Öffnung steht und ausgestaltet ist, das von dem Probenobjekt reflektierte oder emittierte Licht zu empfangen, worin das Lichterfassungssystem umfasst:i) eine Kamera (45), die angepasst ist, eine Darstellung der aufgezeichneten Bilder an das Berechnungsmodul zu liefern; undii) ein Spiegelelement (80) in optischer Ausrichtung mit der ersten Öffnung und der zweiten Öffnung, so dass sich eine optische Achse des Spiegelelements durch die erste Öffnung und die zweite Öffnung des integrierenden Hohlraums (20) erstreckt, \und wobei das Spiegelelement (80) ausgestaltet ist, das von dem Probenobjekt reflektierte oder emittierte Licht zu der Kamera (45) umzuleiten;c) die Steuereinheit ausgestaltet ist, jede der mehreren Lichtquellen (85) zu veranlassen, Licht zu emittieren oder nicht zu emittieren;d) das Berechnungsmodul konfiguriert ist, zum:i) Aufzeichnen von Messungen der Lichtintensität der Darstellung und Durchführen einer spektralen Kalibrierung der Darstellung der aufgezeichneten Bilder;ii) Bestimmen von Lichtintensitätsdaten basierend auf den aufgezeichneten Messungen der Lichtintensität der Darstellung nach der spektralen Kalibrierung; undiii) Bestimmen aus den Lichtintensitätsdaten sowohl das Vorhandensein des Pathogens als auch die Stressantwort des Probenobjekts, wobei die Stressantwort auf der Grundlage einer durch das Pathogen verursachten Änderung der optischen Reaktion eines Photopigments in dem Probenobjekt bestimmt wird;worin die mehreren Lichtquellen (85) eine ultraviolette ("UV") Lichtquelle mit einer ersten spektralen Wellenlänge in einem Bereich von etwa 250 nm bis etwa 280 nm und sichtbare Lichtquellen mit jeweils unterschiedlichen visuellen spektralen Wellenlängen umfassen, die aus einem Bereich von etwa 350 nm bis etwa 1000 nm ausgewählt sind;worin die Lichtintensitätsdaten dem empfangenen Licht mit der ersten spektralen Wellenlänge und den sichtbaren spektralen Wellenlängen entsprechen.
- Vorrichtung (10) nach Anspruch 1, worin die Vorrichtung (10) zur Verbindung mit einer zentralen Verarbeitungseinheit ausgestaltet ist, wobei durch die zentrale Verarbeitungseinheit die Messungen der Lichtintensitätsdaten der Darstellung in Emissionsintensitätsdaten umgewandelt werden, wodurch eine Zunahme der Emissionsintensität der ersten Spektralwellenlänge durch die Pflanze (65) oder den Pflanzenteil eine erhöhte Pathogeninfektion auf der Pflanze (65) oder dem Pflanzenteil im Vergleich zu einer äquivalenten Pflanze oder einem Pflanzenteil ohne Zunahme der Pathogeninfektion anzeigt.
- Vorrichtung (10) nach einem der Ansprüche 1 oder 2, worin jede der sichtbaren Lichtquellen (85) eine LED-Leuchte ist, und worin die sichtbaren Lichtquellen (85) ferner Folgendes umfassen:eine zweite sichtbare Lichtquelle mit einer zweiten spektralen Wellenlänge im Bereich von 360 nm bis 370 nm;eine dritte Lichtquelle mit einer dritten spektralen Wellenlänge im Bereich von 400 nm bis 410 nm;eine vierte Lichtquelle mit einer vierten spektralen Wellenlänge im Bereich von 430 nm bis 440 nm;eine fünfte Lichtquelle mit einer fünften spektralen Wellenlänge im Bereich von 445 nm bis 455 nm;eine sechste Lichtquelle mit einer sechsten spektralen Wellenlänge im Bereich von 465 nm bis 475 nm;eine siebte Lichtquelle mit einer siebten spektralen Wellenlänge im Bereich von 480 nm bis 505 nm;eine achte Lichtquelle mit einer achten spektralen Wellenlänge im Bereich von 520 nm bis 530 nm;eine neunte Lichtquelle mit einer neunten spektralen Wellenlänge im Bereich von 545 nm bis 555 nm;eine zehnte Lichtquelle mit einer zehnten spektralen Wellenlänge im Bereich von 565 nm bis 575 nm;eine elfte Lichtquelle mit einer elften spektralen Wellenlänge im Bereich von 585 nm bis 600 nm;eine zwölfte Lichtquelle mit einer zwölften spektralen Wellenlänge im Bereich von 625 nm bis 635 nm;eine dreizehnte Lichtquelle mit einer dreizehnten spektralen Wellenlänge im Bereich von 640 nm bis 650 nm;eine vierzehnte Lichtquelle mit einer vierzehnten spektralen Wellenlänge im Bereich von 655 nm bis 665 nm;eine fünfzehnte Lichtquelle mit einer fünfzehnten spektralen Wellenlänge im Bereich von 685 nm bis 695 nm;eine sechzehnte Lichtquelle mit einer sechzehnten spektralen Wellenlänge im Bereich von 765 nm bis 775 nm;eine siebzehnte Lichtquelle mit einer siebzehnten spektralen Wellenlänge im Bereich von 845 nm bis 855 nm;eine achtzehnte Lichtquelle mit einer achtzehnten spektralen Wellenlänge im Bereich von 865 nm bis 875 nm;eine neunzehnte Lichtquelle mit einer neunzehnten spektralen Wellenlänge im Bereich von 935 nm bis 945 nm; undeine zwanzigste Lichtquelle mit einer zwanzigsten spektralen Wellenlänge im Bereich von 965 nm bis 975 nm.
- Vorrichtung (10) nach einem der Ansprüche 1-3, welche ferner ein Lichtfilterelement umfasst, das zwischen dem Spiegelelement (80) und der Kamera (45) angeordnet ist, worin das Lichtfilterelement mindestens ein lichtdurchlässiges Element und mehrere Lichtfilter umfasst, und wobei die Steuereinheit das Lichtfilterelement veranlasst, als Reaktion auf eine programmierbare Benutzereingabe zwischen dem lichtdurchlässigen Element und jedem der Lichtfilter umzuschalten, und wobei jeder der Lichtfilter Licht mit einer durchlässigen spektralen Wellenlänge oder einem Bereich von spektralen Wellenlängen durchlässt, der aus etwa 300 nm bis etwa 1000 nm ausgewählt ist.
- Vorrichtung (10) nach einem der Ansprüche 1-4, wobei die Steuereinheit jede einzelne Lichtquelle von der UV-Lichtquelle und der sichtbaren Lichtquelle veranlasst, als Reaktion auf eine programmierbare Benutzereingabe Licht zu emittieren oder nicht zu emittieren, und wobei das Steuersystem jede einzelne Lichtquelle veranlasst, als Reaktion auf eine programmierbare Benutzereingabe nacheinander Licht zu emittieren, wobei jede Lichtquelle für eine Zeitdauer von etwa 0,1 Sekunden bis etwa 2 Sekunden Licht emittiert.
- Vorrichtung (10) nach einem der Ansprüche 1-5, wobei:(i) durch eine zentrale Verarbeitungseinheit die Messungen der Lichtintensität der Darstellung in Reflexionsintensitätsdaten umgewandelt werden, wodurch eine Konzentration der Reflexionsintensität einer anderen Spektralwellenlänge als der ersten Spektralwellenlänge eine Photopigmentkonzentration in der Pflanze (65) oder dem Pflanzenteil anzeigt; oder(ii) durch die zentrale Verarbeitungseinheit die Messungen der Lichtintensität der Darstellung in Emissionsintensitätsdaten umgewandelt werden, wodurch eine Konzentration der Emissionsintensität einer anderen spektralen Wellenlänge als der ersten spektralen Wellenlänge eine Photosyntheserate in der Pflanze (65) oder dem Pflanzenteil anzeigt; oder(iii) sowohl (i) als auch (ii);wobei die Photopigmentkonzentrationen und/oder die Photosyntheserate die Stressantwort der Pflanze ( 65) oder des Pflanzenteils anzeigen.
- Verfahren zum Erfassen eines Pathogens auf einem Probenobjekt in Form einer Pflanze (65) oder eines Pflanzenteils und zum Messen der Stressantwort des Probenobjekts unter Verwendung von Tief-Ultraviolett-Fluoreszenz und multispektraler Bildgebung, wobei das Verfahren umfasst:a) Messen der tiefen ultravioletten Fluoreszenz (DUVF), die von der Pflanze (65) oder dem Pflanzenteil emittiert wird, wobei das Messen umfasst:i) Aussetzen der Pflanze (65) oder des Pflanzenteils einem ultravioletten Licht mit einer spektralen Wellenlänge in einem Bereich von etwa 210 nm bis etwa 280 nm, wobei die Pflanze (65) oder der Pflanzenteil eine DUVF-Intensität emittiert;ii) Erfassen eines ersten Teils der DUVF-Intensität mit einem DUVF-Erfassungssystem, worin das DUVF-Erfassungssystem einen DUVF-Intensitätsdetektor und einen ersten DUVF-Emissionsfilter umfasst, der ausgestaltet ist, den ersten Teil der DUVF-Intensität mit einer spektralen Wellenlänge von etwa 335 nm bis etwa 345 nm durchzulassen, wodurch der erste Teil der DUVF-Intensität durch den ersten DUVF-Emissionsfilter durchgelassen und von dem DUVF-Intensitätsdetektor erfasst wird; undiii) Berechnen des ersten Anteils der DUVF-Intensität, worin der erste Anteil der DUVF-Intensität das Vorhandensein eines Pathogens auf der Pflanze oder dem Pflanzenteil anzeigt; undb) Messen von Licht, das von der Pflanze (65) oder dem Pflanzenteil reflektiert oder emittiert wird, wobei,wobei der erste Teil der erfassten DUVF-Intensität und die erste Reflexionsintensität verwendet werden, um die Stressantwort der Pflanze oder des Pflanzenteils auf der Grundlage einer Änderung der optischen Reaktion eines Photopigments in der Pflanze oder dem Pflanzenteil zu bestimmen, die durch das Pathogen verursacht wird.i) das Messen umfasst:(A) Bestrahlung der Pflanze oder des Pflanzenteils mit einem ersten Licht mit einer spektralen Wellenlänge im Bereich von etwa 350 nm bis etwa 1000 nm;(B) Erfassen einer ersten Reflexionsintensität eines Teils des ersten Lichts, das von der Pflanze oder dem Pflanzenteil reflektiert wird, mit einem Multispektralbild-(MSI-) Erfassungssystem, worin das MSI-Erfassungssystem einen MSI-Intensitätsdetektor zum Erfassen der ersten Reflexionsintensität umfasst;
- Verfahren nach Anspruch 7, welches ferner umfasst:Erfassen eines zweiten Teils der DUVF-Intensität mit dem DUVF-Erfassungssystem, worin das DUVF-Erfassungssystem einen zweiten DUVF-Emissionsfilter umfasst, der ausgestaltet ist, den zweiten Teil der DUVF-Intensität mit einer spektralen Wellenlänge von etwa 350 nm bis etwa 370 nm durchzulassen, wodurch der zweite Teil der DUVF-Intensität durch den zweiten DUVF-Emissionsfilter durchgelassen und von dem DUVF-Intensitätsdetektor erfasst wird; undBerechnen des zweiten Anteils der DUVF-Intensität, worin der zweite Anteil der DUVF-Intensität das Vorhandensein eines Pathogens auf der Pflanze (65) oder einem Pflanzenteil anzeigt.
- Verfahren nach Anspruch 7 oder 8, welches ferner die Schritte umfasst:c) Messen des von der Pflanze (65) oder dem Pflanzenteil reflektierten oder emittierten Lichts, wobei das Messen umfasst:(A) Aussetzen der Pflanze (65) oder des Pflanzenteils einem ersten Anregungslicht mit einer Spektralwellenlänge im Bereich von etwa 350 nm bis etwa 660 nm, wobei die Pflanze (65) oder der Pflanzenteil eine erste Fluoreszenzintensität emittiert;(B) Erfassen eines Teils der ersten Fluoreszenzintensität mit dem MSI-Erfassungssystem, worin das MSI-Erfassungssystem einen Fluoreszenzemissionsfilter umfasst, wodurch der Teil der ersten Fluoreszenzintensität durch den Fluoreszenzemissionsfilter hindurchgelassen und durch den MSI-Intensitätsdetektor erfasst wird; und(C) Berechnen des Anteils der ersten Fluoreszenzintensität, wobei ein Anstieg des Anteils der ersten Fluoreszenzintensität das Vorhandensein eines Pathogens anzeigt;wobei die Messschritte b) und c) in beliebiger Reihenfolge durchgeführt werden können und wobei das erste Anregungslicht eine spektrale Wellenlänge in dem Bereich aufweist, der ausgewählt ist aus der Gruppe bestehend aus etwa 360 nm bis etwa 370 nm, etwa 400 nm bis etwa 410 nm, 430 nm bis etwa 440 nm, 625 nm bis etwa 635 nm, 640 nm bis etwa 650 nm und 655 nm bis etwa 665 nm, und wobei der Anteil der ersten Fluoreszenzintensität eine spektrale Wellenlänge von mehr als 690 nm aufweist.
- Verfahren nach Anspruch 9, wobei Schritt c) ii) ferner umfasst: Aussetzen der Pflanze (65) oder des Pflanzenteils einem zweiten Anregungslicht, wobei die Pflanze oder der Pflanzenteil eine zweite Fluoreszenzintensität emittiert; Erfassen eines Teils der zweiten Fluoreszenzintensität mit dem MSI-Erfassungssystem, wobei der Teil der zweiten Fluoreszenzintensität durch den Fluoreszenzemissionsfilter hindurchgelassen und durch den MSI-Intensitätsdetektor erfasst wird; und Berechnen des Teils der zweiten Fluoreszenzintensität, worin ein Anstieg des Teils der zweiten Fluoreszenzintensität das Vorhandensein eines Pathogens anzeigt; und
wobei das zweite Anregungslicht eine spektrale Wellenlänge in dem Bereich aufweist, der ausgewählt ist aus der Gruppe bestehend aus etwa 360 nm bis etwa 370 nm, etwa 400 nm bis etwa 410 nm, 425 nm bis etwa 435 nm, 625 nm bis etwa 635 nm, 640 nm bis etwa 650 nm und 655 nm bis etwa 660 nm, vorausgesetzt, dass die spektrale Wellenlänge des zweiten Anregungslichts sich von der spektralen Wellenlänge des ersten Anregungslichts unterscheidet, und wobei der Anteil der zweiten Fluoreszenzintensität eine spektrale Wellenlänge von mehr als 690 nm aufweist. - Verfahren nach Anspruch 9, wobei Schritt b) vor Schritt c) durchgeführt wird, und wobei der Anteil der ersten Fluoreszenzintensität oder der zweiten Fluoreszenzintensität durch die erste Reflexionsintensität normalisiert wird, um eine Änderung der Photosyntheserate gemäß der folgenden Gleichung zu berechnen:

- Verfahren nach einem der Ansprüche 7-11, wobei das erste Licht eine spektrale Wellenlänge von etwa 505 nm bis etwa 535 nm aufweist; und wobei Schritt b) ferner umfasst:ii) Aussetzen der Pflanze (65) oder des Pflanzenteils einem zweiten Licht mit einer spektralen Wellenlänge im Bereich von etwa 535 nm bis etwa 560 nm, wobei die Pflanze oder der Pflanzenteil einen Teil des zweiten Lichts reflektiert, um eine zweite Reflexionsintensität zu erzeugen;Erfassen der zweiten Reflexionsintensität mit dem MSI-Intensitätsdetektor; undBerechnen der zweiten Reflexionsintensität, wobei die zweite Reflexionsintensität eine Photopigmentkonzentration anzeigt; undiii) Aussetzen der Pflanze (65) oder des Pflanzenteils einem dritten Licht mit einer spektralen Wellenlänge im Bereich von etwa 560 nm bis etwa 580 nm, wobei die Pflanze (65) oder der Pflanzenteil einen Teil des dritten Lichts reflektiert, um eine dritte Reflexionsintensität zu erzeugen;
Erfassen der dritten Reflexionsintensität mit dem MSI-Intensitätsdetektor; und Berechnen der dritten Reflexionsintensität, wobei die dritte Reflexionsintensität eine zweite Photopigmentkonzentration anzeigt; undiv) Aussetzen der Pflanze (65) oder des Pflanzenteils einem vierten Licht mit einer Spektralwellenlänge im Bereich von etwa 580 nm bis etwa 610 nm, wobei die Pflanze (65) oder der Pflanzenteil einen Teil des vierten Lichts reflektiert, um eine vierte Reflexionsintensität zu erzeugen;Erfassen der vierten Reflexionsintensität mit dem MSI-Intensitätsdetektor; und Berechnen der vierten Reflexionsintensität, worin die vierte Reflexionsintensität eine dritte Photopigmentkonzentration anzeigt;wobei die erste Photopigmentkonzentration eine Konzentration von Chlorophyll A umfasst, die zweite Photopigmentkonzentration eine Konzentration von Chlorophyll B umfasst und die dritte Photopigmentkonzentration eine Konzentration von Anthocyanen und/oder Carotinoiden umfasst,worin die erste, zweite und dritte Photopigmentkonzentration eine Stressantwort in der Pflanze (65) oder dem Pflanzenteil anzeigen. - Verfahren nach Anspruch 12, wobei:(a) die Pflanze (65) oder der Pflanzenteil zur Klade der Viridiplantae gehört; oder(b) das Pathogen ein Humanpathogen ist, ausgewählt aus der Gruppe bestehend aus Erwinia sp., Pseudomonas sp., Bacillus sp., Clostridium sp., Klebsiella sp., Escherichia sp., Salmonella sp., Listeria sp., Rhizobium sp., Sinorhizobium sp. und jeder Kombination davon; oder(c) eine Kombination von a) und b).
- Verfahren nach einem der Ansprüche 7-13, worin das DUVF-Detektorsystem und das MSI-Detektorsystem zu einer einzigen Vorrichtung (10) nach einem der Ansprüche 1-6 kombiniert sind.
- Vorrichtung (10) nach Anspruch 6, worin die Photopigmentkonzentrationen die Konzentrationen von Chlorophyll A, Chlorophyll B, Anthocyanen und/oder Carotinoiden umfassen.
Applications Claiming Priority (2)
| Application Number | Priority Date | Filing Date | Title |
|---|---|---|---|
| US202063045578P | 2020-06-29 | 2020-06-29 | |
| PCT/US2021/038447 WO2022005812A1 (en) | 2020-06-29 | 2021-06-22 | Duvf-msi biophotonic analyzer device and methods for detecting pathogens on plants and measuring stress response |
Publications (3)
| Publication Number | Publication Date |
|---|---|
| EP4172599A1 EP4172599A1 (de) | 2023-05-03 |
| EP4172599C0 EP4172599C0 (de) | 2025-05-14 |
| EP4172599B1 true EP4172599B1 (de) | 2025-05-14 |
Family
ID=76859831
Family Applications (1)
| Application Number | Title | Priority Date | Filing Date |
|---|---|---|---|
| EP21740411.0A Active EP4172599B1 (de) | 2020-06-29 | 2021-06-22 | Biophotonische analysegeräte für duvf-msi und verfahren zum nachweis von pathogenen auf pflanzen und zur messung der stressreaktion |
Country Status (4)
| Country | Link |
|---|---|
| US (1) | US12360042B2 (de) |
| EP (1) | EP4172599B1 (de) |
| CA (1) | CA3182736A1 (de) |
| WO (1) | WO2022005812A1 (de) |
Families Citing this family (2)
| Publication number | Priority date | Publication date | Assignee | Title |
|---|---|---|---|---|
| DE102023130600A1 (de) * | 2023-11-06 | 2025-05-08 | RHENAC GreenTec AG | Vorrichtung zur zerstörungsfreien Bestimmung von Vitalitäsparametern von Pflanzen und dessen ggf. automatisierten Behandlung von Mängel- und Krankheitszuständen ein Verfahren hierzu |
| CN120873987B (zh) * | 2025-09-26 | 2026-01-09 | 闽南理工学院 | 基于量子点发光特性的植物病虫害智能预警系统 |
Citations (1)
| Publication number | Priority date | Publication date | Assignee | Title |
|---|---|---|---|---|
| WO2016167319A1 (ja) * | 2015-04-15 | 2016-10-20 | シャープ株式会社 | 画像解析装置および検査システム |
Family Cites Families (21)
| Publication number | Priority date | Publication date | Assignee | Title |
|---|---|---|---|---|
| JPS6311841A (ja) * | 1986-03-20 | 1988-01-19 | Satake Eng Co Ltd | 米の食味評価装置 |
| JPH03248045A (ja) * | 1990-02-27 | 1991-11-06 | Buran Le-Be Kk | 分光分析用試料皿および分光分析方法 |
| JP3324341B2 (ja) * | 1995-05-30 | 2002-09-17 | 株式会社サタケ | 分光分析測定装置 |
| JP3436093B2 (ja) * | 1996-08-01 | 2003-08-11 | 株式会社サタケ | 葉の成分測定装置 |
| BR9907660B1 (pt) | 1998-02-06 | 2011-01-25 | aparelho e processo para gravação de uma imagem de um objeto. | |
| US5914245A (en) * | 1998-04-20 | 1999-06-22 | Kairos Scientific Inc. | Solid phase enzyme kinetics screening in microcolonies |
| EP1777486B1 (de) | 2005-08-01 | 2013-07-17 | Pioneer-Hi-Bred International, Inc. | Sensorsystem, Verfahren und Computerprogrammprodukt zur Phenotypmessung von Pflanzen in landwirtschaftlichen Umgebungen |
| JP2011506977A (ja) * | 2007-12-13 | 2011-03-03 | バイオビジラント システムズ,インコーポレイテッド | サイズ/蛍光同時測定による病原体検出 |
| DK2291640T3 (en) | 2008-05-20 | 2019-03-11 | Univ Health Network | Device and method for fluorescence-based imaging and monitoring |
| US8384047B2 (en) | 2009-12-21 | 2013-02-26 | Sensor Electronic Technology, Inc. | Fluorescence-based ultraviolet illumination |
| US9658201B2 (en) | 2013-03-07 | 2017-05-23 | Blue River Technology Inc. | Method for automatic phenotype measurement and selection |
| JP2016033467A (ja) * | 2014-07-31 | 2016-03-10 | 株式会社島津製作所 | 高粘性溶液中の脂質量および/または水分量の分析方法および装置 |
| US10568316B2 (en) | 2014-08-15 | 2020-02-25 | Monsanto Technology Llc | Apparatus and methods for in-field data collection and sampling |
| CN105158204B (zh) * | 2015-09-28 | 2018-08-28 | 浙江大学 | 用于水果内部品质可见近红外光谱检测的可调节光源装置 |
| CN205080054U (zh) * | 2015-09-28 | 2016-03-09 | 浙江大学 | 用于水果内部品质可见近红外光谱检测的可调节光源装置 |
| US20170311553A1 (en) | 2016-05-02 | 2017-11-02 | Sensor Electronic Technology, Inc. | Ultraviolet Plant Illumination System |
| US10942113B2 (en) | 2018-03-07 | 2021-03-09 | Emerald Metrics | Methods, systems, and components thereof relating to using multi-spectral imaging for improved cultivation of cannabis and other crops |
| JP6410199B1 (ja) * | 2018-05-11 | 2018-10-24 | アクティブ販売株式会社 | 対象体選別装置 |
| US10803312B2 (en) | 2018-06-06 | 2020-10-13 | AgEYE Technologies, Inc. | AI-powered autonomous plant-growth optimization system that automatically adjusts input variables to yield desired harvest traits |
| CA3130218A1 (en) | 2019-02-14 | 2020-08-20 | Osram Gmbh | Controlled agricultural systems and methods of managing agricultural systems |
| GR1009898B (el) | 2020-05-12 | 2021-01-08 | Γεωργιος Αθανασιου Φευγας | Μεθοδος ανιχνευσης και αξιολογησης βιοτικου-αβιοτικου στρες σε καλλιεργειες απο θερμικες φωτογραφιες με χρηση τεχνητης νοημοσυνης |
-
2021
- 2021-06-22 EP EP21740411.0A patent/EP4172599B1/de active Active
- 2021-06-22 WO PCT/US2021/038447 patent/WO2022005812A1/en not_active Ceased
- 2021-06-22 CA CA3182736A patent/CA3182736A1/en active Pending
- 2021-06-22 US US18/001,727 patent/US12360042B2/en active Active
Patent Citations (1)
| Publication number | Priority date | Publication date | Assignee | Title |
|---|---|---|---|---|
| WO2016167319A1 (ja) * | 2015-04-15 | 2016-10-20 | シャープ株式会社 | 画像解析装置および検査システム |
Also Published As
| Publication number | Publication date |
|---|---|
| US12360042B2 (en) | 2025-07-15 |
| WO2022005812A1 (en) | 2022-01-06 |
| CA3182736A1 (en) | 2022-01-06 |
| EP4172599C0 (de) | 2025-05-14 |
| EP4172599A1 (de) | 2023-05-03 |
| US20230221254A1 (en) | 2023-07-13 |
Similar Documents
| Publication | Publication Date | Title |
|---|---|---|
| US9377404B2 (en) | Plant health diagnostic method and plant health diagnostic device | |
| US8476603B2 (en) | In-situ plant analysis apparatus, method for tracking the state or evolution of a culture and method for managing vegetable processing | |
| CA2679330C (en) | System for modulating plant growth or attributes | |
| US7215420B2 (en) | Optical method and apparatus for determining status of agricultural products | |
| US7112806B2 (en) | Bio-imaging and information system for scanning, detecting, diagnosing and optimizing plant health | |
| Saberioon et al. | A review of optical methods for assessing nitrogen contents during rice growth | |
| CN114007411B (zh) | 具有LiDAR感测的园艺照明设备 | |
| EP4172599B1 (de) | Biophotonische analysegeräte für duvf-msi und verfahren zum nachweis von pathogenen auf pflanzen und zur messung der stressreaktion | |
| Bao et al. | Assessing plant performance in the Enviratron | |
| Alves et al. | Optimizing band selection for spectral detection of Aphis glycines Matsumura in soybean | |
| Zhang et al. | Handheld multifunctional fluorescence imager for non-invasive plant phenotyping | |
| Saito | Plant and vegetation monitoring using laser-induced fluorescence spectroscopy | |
| Chiu et al. | Detecting cabbage seedling diseases by using chlorophyll fluorescence | |
| EP3379246B1 (de) | Überwachungsvorrichtung, -system und -verfahren zur zustandsüberwachung von früchten | |
| Johnson et al. | Deep ultraviolet fluorescence sensing with multispectral imaging to detect and monitor food‐borne pathogens on the leafy green phyllosphere | |
| CN114729990B (zh) | 用于园艺的飞行时间感测 | |
| Picot‐Clémente | The new green revolution: Photonics for smart farming | |
| Chunyan et al. | SOM neural network for clustering plant and plant stress based on kinetic imaging of chlorophyll fluorescence | |
| US20240418695A1 (en) | System and method for detecting and analyzing the physiological condition and health of plants | |
| Alves | Spectral detection of soybean aphid (Hemiptera: Aphididae) and confounding insecticide effects in soybean | |
| Kicherer et al. | High-throughput field phenotyping in vineyards: demand, approaches, objectives | |
| Spáčilová et al. | Potential of chlorophyll fluorescence and VIS/NIR spectroscopy measurement use for the detection of nitrogen content and disease infection of apple leaves | |
| Aario et al. | Vitality and reflectance spectra of living plants: experiments |
Legal Events
| Date | Code | Title | Description |
|---|---|---|---|
| STAA | Information on the status of an ep patent application or granted ep patent |
Free format text: STATUS: UNKNOWN |
|
| STAA | Information on the status of an ep patent application or granted ep patent |
Free format text: STATUS: THE INTERNATIONAL PUBLICATION HAS BEEN MADE |
|
| PUAI | Public reference made under article 153(3) epc to a published international application that has entered the european phase |
Free format text: ORIGINAL CODE: 0009012 |
|
| STAA | Information on the status of an ep patent application or granted ep patent |
Free format text: STATUS: REQUEST FOR EXAMINATION WAS MADE |
|
| 17P | Request for examination filed |
Effective date: 20230116 |
|
| AK | Designated contracting states |
Kind code of ref document: A1 Designated state(s): AL AT BE BG CH CY CZ DE DK EE ES FI FR GB GR HR HU IE IS IT LI LT LU LV MC MK MT NL NO PL PT RO RS SE SI SK SM TR |
|
| DAV | Request for validation of the european patent (deleted) | ||
| DAX | Request for extension of the european patent (deleted) | ||
| STAA | Information on the status of an ep patent application or granted ep patent |
Free format text: STATUS: EXAMINATION IS IN PROGRESS |
|
| 17Q | First examination report despatched |
Effective date: 20240416 |
|
| RAP3 | Party data changed (applicant data changed or rights of an application transferred) |
Owner name: BIOSPECTION LLC |
|
| GRAP | Despatch of communication of intention to grant a patent |
Free format text: ORIGINAL CODE: EPIDOSNIGR1 |
|
| STAA | Information on the status of an ep patent application or granted ep patent |
Free format text: STATUS: GRANT OF PATENT IS INTENDED |
|
| RIC1 | Information provided on ipc code assigned before grant |
Ipc: G01N 21/31 20060101ALI20241122BHEP Ipc: G01N 21/47 20060101ALI20241122BHEP Ipc: G01N 21/84 20060101ALI20241122BHEP Ipc: G01N 21/63 20060101ALI20241122BHEP Ipc: G01N 21/64 20060101AFI20241122BHEP |
|
| INTG | Intention to grant announced |
Effective date: 20241211 |
|
| GRAS | Grant fee paid |
Free format text: ORIGINAL CODE: EPIDOSNIGR3 |
|
| GRAA | (expected) grant |
Free format text: ORIGINAL CODE: 0009210 |
|
| STAA | Information on the status of an ep patent application or granted ep patent |
Free format text: STATUS: THE PATENT HAS BEEN GRANTED |
|
| AK | Designated contracting states |
Kind code of ref document: B1 Designated state(s): AL AT BE BG CH CY CZ DE DK EE ES FI FR GB GR HR HU IE IS IT LI LT LU LV MC MK MT NL NO PL PT RO RS SE SI SK SM TR |
|
| REG | Reference to a national code |
Ref country code: GB Ref legal event code: FG4D |
|
| REG | Reference to a national code |
Ref country code: CH Ref legal event code: EP |
|
| REG | Reference to a national code |
Ref country code: DE Ref legal event code: R096 Ref document number: 602021030794 Country of ref document: DE |
|
| REG | Reference to a national code |
Ref country code: IE Ref legal event code: FG4D |
|
| PGFP | Annual fee paid to national office [announced via postgrant information from national office to epo] |
Ref country code: GB Payment date: 20250605 Year of fee payment: 5 |
|
| U01 | Request for unitary effect filed |
Effective date: 20250609 |
|
| U07 | Unitary effect registered |
Designated state(s): AT BE BG DE DK EE FI FR IT LT LU LV MT NL PT RO SE SI Effective date: 20250616 |
|
| PGFP | Annual fee paid to national office [announced via postgrant information from national office to epo] |
Ref country code: AT Payment date: 20250721 Year of fee payment: 5 |
|
| U20 | Renewal fee for the european patent with unitary effect paid |
Year of fee payment: 5 Effective date: 20250624 |
|
| PG25 | Lapsed in a contracting state [announced via postgrant information from national office to epo] |
Ref country code: ES Free format text: LAPSE BECAUSE OF FAILURE TO SUBMIT A TRANSLATION OF THE DESCRIPTION OR TO PAY THE FEE WITHIN THE PRESCRIBED TIME-LIMIT Effective date: 20250514 |
|
| PG25 | Lapsed in a contracting state [announced via postgrant information from national office to epo] |
Ref country code: NO Free format text: LAPSE BECAUSE OF FAILURE TO SUBMIT A TRANSLATION OF THE DESCRIPTION OR TO PAY THE FEE WITHIN THE PRESCRIBED TIME-LIMIT Effective date: 20250814 Ref country code: GR Free format text: LAPSE BECAUSE OF FAILURE TO SUBMIT A TRANSLATION OF THE DESCRIPTION OR TO PAY THE FEE WITHIN THE PRESCRIBED TIME-LIMIT Effective date: 20250815 |
|
| PG25 | Lapsed in a contracting state [announced via postgrant information from national office to epo] |
Ref country code: PL Free format text: LAPSE BECAUSE OF FAILURE TO SUBMIT A TRANSLATION OF THE DESCRIPTION OR TO PAY THE FEE WITHIN THE PRESCRIBED TIME-LIMIT Effective date: 20250514 |
|
| PG25 | Lapsed in a contracting state [announced via postgrant information from national office to epo] |
Ref country code: HR Free format text: LAPSE BECAUSE OF FAILURE TO SUBMIT A TRANSLATION OF THE DESCRIPTION OR TO PAY THE FEE WITHIN THE PRESCRIBED TIME-LIMIT Effective date: 20250514 |
|
| PG25 | Lapsed in a contracting state [announced via postgrant information from national office to epo] |
Ref country code: RS Free format text: LAPSE BECAUSE OF FAILURE TO SUBMIT A TRANSLATION OF THE DESCRIPTION OR TO PAY THE FEE WITHIN THE PRESCRIBED TIME-LIMIT Effective date: 20250814 |
|
| PG25 | Lapsed in a contracting state [announced via postgrant information from national office to epo] |
Ref country code: IS Free format text: LAPSE BECAUSE OF FAILURE TO SUBMIT A TRANSLATION OF THE DESCRIPTION OR TO PAY THE FEE WITHIN THE PRESCRIBED TIME-LIMIT Effective date: 20250914 |
|
| PG25 | Lapsed in a contracting state [announced via postgrant information from national office to epo] |
Ref country code: SM Free format text: LAPSE BECAUSE OF FAILURE TO SUBMIT A TRANSLATION OF THE DESCRIPTION OR TO PAY THE FEE WITHIN THE PRESCRIBED TIME-LIMIT Effective date: 20250514 |
|
| PG25 | Lapsed in a contracting state [announced via postgrant information from national office to epo] |
Ref country code: CZ Free format text: LAPSE BECAUSE OF FAILURE TO SUBMIT A TRANSLATION OF THE DESCRIPTION OR TO PAY THE FEE WITHIN THE PRESCRIBED TIME-LIMIT Effective date: 20250514 |
|
| PG25 | Lapsed in a contracting state [announced via postgrant information from national office to epo] |
Ref country code: SK Free format text: LAPSE BECAUSE OF FAILURE TO SUBMIT A TRANSLATION OF THE DESCRIPTION OR TO PAY THE FEE WITHIN THE PRESCRIBED TIME-LIMIT Effective date: 20250514 |
|
| REG | Reference to a national code |
Ref country code: CH Ref legal event code: H13 Free format text: ST27 STATUS EVENT CODE: U-0-0-H10-H13 (AS PROVIDED BY THE NATIONAL OFFICE) Effective date: 20260127 |
|
| PG25 | Lapsed in a contracting state [announced via postgrant information from national office to epo] |
Ref country code: MC Free format text: LAPSE BECAUSE OF FAILURE TO SUBMIT A TRANSLATION OF THE DESCRIPTION OR TO PAY THE FEE WITHIN THE PRESCRIBED TIME-LIMIT Effective date: 20250514 |
|
| PLBE | No opposition filed within time limit |
Free format text: ORIGINAL CODE: 0009261 |
|
| STAA | Information on the status of an ep patent application or granted ep patent |
Free format text: STATUS: NO OPPOSITION FILED WITHIN TIME LIMIT |
|
| REG | Reference to a national code |
Ref country code: CH Ref legal event code: L10 Free format text: ST27 STATUS EVENT CODE: U-0-0-L10-L00 (AS PROVIDED BY THE NATIONAL OFFICE) Effective date: 20260325 |
|
| PG25 | Lapsed in a contracting state [announced via postgrant information from national office to epo] |
Ref country code: IE Free format text: LAPSE BECAUSE OF NON-PAYMENT OF DUE FEES Effective date: 20250622 |
|
| 26N | No opposition filed |
Effective date: 20260217 |