EP4128162B1 - Vorrichtung und verfahren zur analyse und rekonstruktion von pet-bildern - Google Patents
Vorrichtung und verfahren zur analyse und rekonstruktion von pet-bildern Download PDFInfo
- Publication number
- EP4128162B1 EP4128162B1 EP21713398.2A EP21713398A EP4128162B1 EP 4128162 B1 EP4128162 B1 EP 4128162B1 EP 21713398 A EP21713398 A EP 21713398A EP 4128162 B1 EP4128162 B1 EP 4128162B1
- Authority
- EP
- European Patent Office
- Prior art keywords
- image
- data
- model
- subset
- representation
- Prior art date
- Legal status (The legal status is an assumption and is not a legal conclusion. Google has not performed a legal analysis and makes no representation as to the accuracy of the status listed.)
- Active
Links
Images






Classifications
-
- G—PHYSICS
- G06—COMPUTING OR CALCULATING; COUNTING
- G06T—IMAGE DATA PROCESSING OR GENERATION, IN GENERAL
- G06T12/00—Tomographic reconstruction from projections
- G06T12/20—Inverse problem, i.e. transformations from projection space into object space
-
- A—HUMAN NECESSITIES
- A61—MEDICAL OR VETERINARY SCIENCE; HYGIENE
- A61B—DIAGNOSIS; SURGERY; IDENTIFICATION
- A61B6/00—Apparatus or devices for radiation diagnosis; Apparatus or devices for radiation diagnosis combined with radiation therapy equipment
- A61B6/02—Arrangements for diagnosis sequentially in different planes; Stereoscopic radiation diagnosis
- A61B6/03—Computed tomography [CT]
- A61B6/037—Emission tomography
Definitions
- the present invention relates to image analysis and reconstruction for medical imaging and in particular to a device and a method of positron emission tomography (PET) image reconstruction.
- PET positron emission tomography
- image reconstruction, enhancement and analysis are widely used on images related to medical scanners.
- a radioactive tracer is injected into a patient and it is constructed such that cancer cells will accumulate the tracer material.
- a PET scanner is then used to record the radioactive decay, and provide a reconstructed PET image representing the in-situ distribution of tracer intensity.
- a high tracer intensity can be indicative of cancer lesions.
- the PET image is contaminated by blurring and noise, related to how the PET data has been recorded.
- PET positron emission tomography
- an improved image reconstruction would be advantageous, and in particular, a more efficient and/or reliable method for image reconstruction would be advantageous.
- a Bayesian approach to image reconstruction can be posed as a probabilistic inverse problem.
- the extended Metropolis algorithm is different from the classical variants of the Metropolis-Hastings algorithms, in that one does not need to be able to evaluate ⁇ ( m ) (and hence not ⁇ ( m )); it is enough that an algorithm exists that can perform a random walk in the space of a priori possible modes (i.e. than an algorithm can sample ⁇ ( m ) through a random walk), and that one can evaluate the likelihood, L( m ), for any model.
- the use of the extended Metropolis algorithm has the potential to change the complexity of the sampling problem from a harder problem to an easier problem as the complexity is linked to the number of free parameters of the prior probability density ⁇ ( m ), and not the total number of model parameters considered.
- the number of free parameters may be much smaller than the actual number of model parameters. Therefore, the use of the extended Metropolis algorithm can be computationally more efficient than traditional Metropolis-Hastings based sampling.
- the method is still CPU intensive. Analysis of ⁇ ( m ) for a case considering a 2D PET image slice of 75x115 pixels, took many hours to complete.
- the above-described object and several other objects are intended to be obtained in a first aspect of the invention by providing a faster method for image reconstruction for medical imaging of a subject.
- the subject can be a human or an animal.
- the invention is particularly, but not exclusively, advantageous for obtaining improved detection and identification of tumours.
- the method is based on collecting expert data and use this data to improve the quality of PET scans of humans or animals.
- the best performance is obtained for cases with informed prior information and when applied to 'localized' inverse problems, in which the inverse problem can be applied many times to localized regions of the model parameter and data space.
- the training data set need only be computed once, and only the likelihood (data fit) needs to be computed for each considered data set.
- a sample of independent realizations of the posterior distribution, as well as summary statistics, can be computed accurately, using only a fraction of the CPU needed when sampling the posterior distribution using a Metropolis type algorithm.
- the PET scan, the reconstructed PET image, from here-on referred to as a PET image, d obs can be 2-dimensional or a 3-dimensional image covering parts of a human body.
- the PET image is divided into many small subset-images, d ss .
- a subset-image d ss is a localized image covering a small part of the full PET image, d obs . Therefore, the method of this invention is called LoPET.
- the method relies on an understanding of the physical process that generates the observed PET image, d obs .
- d g m + n m , where 'g' represents a function that applies smoothing and 'n' represent a function that generates noise according to a specific noise model.
- d represent one example of a PET image that would be observed for a specific model m.
- the likelihood function L( m ) describes the distribution of the noise n( m ) in (3), and is a measure of the degree of fit between data, in the invention described herein the data-images d, predicted from the model, in the invention described herein from the model-images m, using the g( m ) function, and the observed data d obs , which in the invention described herein is the subset-images d ss .
- g( m ) is a smoothing function and gives the noise free data-image d.
- the likelihood therefore is a function depending on the degree of fit between the data-image d and the observed data d obs , which is the subset-image d ss .
- the formulas (2)-(4) apply to both using the full PET image, d obs , and a localized part of the PET image, where d obs is the subset-image d ss .
- g(m) may be the linear operater G PSF (m).
- a noise model can be obtained by scanning a known target and computing the residual between the obtained PET image and the known target m target .
- the residual then represents one realization of the noise, from which a statistical model of the noise can be inferred.
- the averaging function G PSF (m) can be obtained by analysing the residual between the obtained PET image d obs and the noise-free forward response of the known target, g( m target ). For instance if G PSF is characterized by the width w of the averaging function, one can choose w as the value of w that miminizes ⁇ d obs - G PSFw ( m target ) ⁇ , where G PSFw ( m target ) is the averaging function with width w.
- the extended rejection sampler is a variant of the classical rejection sampler, where one can sample from the posterior distribution, requiring only that one can sample from the prior and evaluate the likelihood.
- This algorithm is described in the reference: Hansen, Thomas Mejer, et al. "Probabilistic integration of geo-information.” Integrated imaging of the earth: Theory and applications 218 (2016): 93-116 .
- Step 1 requires than one can sample from the prior.
- Step 2 requires than one can solve the forward problem (g( m *)), and evaluate the Likelihood (Eqn. 4).
- the extended rejection sampler is very simple to implement, but it is also regarded as an extremely inefficient way to sample the posterior distributions, as most proposed models will have a very small probability of being accepted. Further, the application of the extended rejection sampler is hampered by the fact the one must know the maximum possible value of the likelihood, max(L( m *)), that one can expect. This is in general not known and leads to an even more inefficient algorithm.
- LoPET The main idea of LoPET is to compute a set of realizations, in form of the sample M *, from the prior only once and store them in a lookup table. Also, for any model in the lookup table, the forward response is computed once, and stored in a lookup table. Then, when applying the extended rejection sampler for a specific observed data, one only needs to compute the likelihood function based on the lookup table. max(L( m *)) is then trivially obtained. The LoPET algorithm can then be efficiently applied on local subsets, subset-images d ss , of the full PET image d obs .
- the first step in the invention is to use the collected expert data to create a prior ⁇ ( m ) .
- the prior represents prior knowledge about the model parameters. This can come from expert knowledge, previous surveys and similar sources.
- An expert for instance a doctor working with diagnosing cancer from PET images, can make expert data, usually in cooperation with a data specialist.
- the expert creates or selects, for instance, a set of images for the expert data.
- the images the expert selects can be images from humans showing tumours or metastases or other kinds of relevant cell structures.
- a data specialist Based on the expert data a data specialist generates a statistical model, representing the prior information, describing the variation in these images.
- the data specialist can generate the prior from previous surveys or other data sources.
- the prior ⁇ ( m ) does not need to exist as a mathematical model (while it can) but is instead represented by the choice of algorithm and geostatistical model.
- the explicit choice of prior information is then quantified through the realizations generated by the algorithm and geostatistical model of choice.
- the example images generated are realizations of the prior and are called model-images, denoted by m*, and they form the sample M*.
- the sample M* comprises a large number of model-images m*, distributed according to ⁇ ( m ) .
- the sample M* includes a high number of model-images m*.
- the sample M* can include 1000 or 10000 or 100000 or any other suitable numbers of model-images m*.
- the sample M* is pre-computed and only created once.
- the model-image m* from the sample M* are placed in a lookup table.
- the number of sets of data in the lookup table will be denoted N I .
- a model-image m, as well as a subset-image d ss is a representation of a small image including 1 pixel, or 10 or 100 or 1000 or any other suitable number of pixels.
- the pixels can be placed in a 3-dimensional configuration for instance in an image of 9x9x9 pixels or a 2-dimensional configuration for instance in an image of 9x9 pixels.
- the number of pixels in a model-image m may be larger than the number of pixels in a subset-image d ss or a data-image d.
- one pixel in the subset-image d ss or the data-image d may correspond to 4 or 9 or 16 or any other suitable number of pixels in the model-image m.
- subset-image d ss or a data-image d.
- n denotes a model-image in general
- m* denotes a model-image from the sample M* included in the lookup table.
- step 1) and 2) has already been performed, By constructing the lookup table once, one can apply the extended rejection sampler without realizing new models from the prior, and without solving the forward problem. These two steps are typically the most computationally expensive of applying the extended rejection sampler.
- a likelihood is calculated for each model-image m* in the sample M*. Then an acceptance probability P acc for each model-image m* is determined (Eqn. 5), and this acceptance probability P acc is used to decide whether to accept the model-image m* and add it to the sample of the posterior distribution or reject it.
- the rejection sampler generates a sample of the posterior distribution comprising of a collection of model-images from the lookup table.
- This collection of model-images, representing the posterior distribution are used to create a representation image as the output of the method of this invention.
- This representation image is an image based on pixel representations from the posterior distribution.
- a computer-implemented method for image reconstruction for medical imaging of a subject is provided.
- the subject typically is a human, but can also be an animal.
- the method comprising:
- the model-images m* in the sample M* generated from the prior ⁇ ( m ) is placed in a lookup table in a first column. From each model-image m*, a data-image d* is computed using a function g. The data-image d* is placed in a second column in the lookup table.
- a data-image d is a smoothed version of the original model-image m, as quantified through the smoothing operator g or G PSF .
- a model-image m can represent N M pixels, the same number of pixels as a data-image d and the subset-image d ss represents, but also the model-image m can have more pixels than the data image d and the subset-image d ss . That is a model-image m can be represented using finer or more coarse resolution than the resolution of d so that the model-image m have more pixels than the data-image d.
- d denotes a data-image in general
- d* denotes a data-image from the lookup table.
- Each subset-image d ss from the PET image is now processed.
- a likelihood L( m ) is calculated for each set of data in the lookup table.
- L( m ) describes data residuals as quantified through the probability distribution f(g( m )- d ss ).
- the extended rejection sampler calculates the acceptance probability P acc for each set of data in the lookup table for the given subset-image d ss .
- the acceptance probability P acc is a number between 0 and 1 for each set of data in the lookup table for each subset-image d ss .
- the method further comprises that for each subset-image d ss , a probability acceptance P acc is calculated for each pre-computed set of data in the lookup table for the given subset-image d ss , based on the likelihood L( m ) for this pre-computed set of data for the given subset-image d ss divided by a maximum likelihood max(L) for the given subset-image d ss .
- a posterior distribution for the given subset-image d ss can be selected by the extended rejection sampler.
- Several sets of data for instance, 10, 100 or 1000 are selected from the lookup table to the posterior distribution. This is done by the extended rejection sampler running through the lookup table and for each set of data in the lookup table the extended rejection sampler calculates P acc and generates a random number between 0 and 1.
- P acc and the random number is compared, and if the random number is larger than P acc , then the model-image from the lookup table is rejected, but if the random number is smaller than P acc , then the model-image from the lookup table is accepted for the posterior distribution for the given subset-image d ss .
- the method is continuously going through the lookup table, starting from the beginning again when the last row is tested until the requested number of model-images for the posterior distribution is selected.
- the method further comprises for each subset-image d ss that the probability acceptance P acc , calculated for each pre-computed set of data in the lookup table for the given subset-image d ss , is used by the extended rejection sampler to determine whether to accept the model-image m* from the pre-computed set of data in the lookup table (20) for a posterior distribution for the given subset-image d ss .
- a random value is generated for each pre-computed set of data in the lookup table (20) to compare with the probability acceptance P acc to decide whether to accept the model-image m* from the pre-computed set of data in the lookup table (20) for the posterior distribution (82).
- the posterior distributions can be used to generate all kind of statistic data for different representations of the data. Including images that will make it easier to detect whether a patient has cancer or not.
- the size of the lookup table will be finite in size. This may introduce an error, as the number of sets of data N I in the lookup table may not reflect the full span of possible models a priori. On the other hand, if N I is large enough, then one may use the extended rejection sampler as it is, without modelling error related to the use of a limited set of data.
- the potential modelling error can be quantified by constructing an approximate error model.
- the modelling error is quantified by a statistical model, often Gaussian, that describes the expected data residual ( d ss - g( m )) due to forward model imperfections.
- d obs is the subset-image d ss and g( m ) is d* from the lookup table.
- the modelling error can be described by a Gaussian probability density function with the mean d t and the covariance C t .
- the measurement uncertainty can be described by the covariance C d .
- C d and C t are matrixes and d, m and d t are vectors.
- the method further comprises:
- the modelling error is included in the calculation of the likelihood L( m ).
- the modelling error is found by making a sample of a probability density representing the modelling error.
- the sample representing the modelling error obtained by comparing by examining a new, smaller, set of realizations from the prior, for instance, 1000, sets of data.
- Each model-image in the modelling error sample is called an error-model-image m'.
- the error-model-images m' from the modelling error sample is placed in a modelling-error-table.
- an error-data-image d' is calculated using the function g. So each set of data in the modelling-error-table comprises an error-model-image m' and an error-data-image d' corresponding to m * and d * in the original lookup table.
- the error-model-image m' is compared to the model-image m * from all the sets of data in the original lookup table, and the model-image m * from the lookup table that is most similar to the error-model-image m' in the modelling-error-table is selected.
- m * and m' are vectors of pixel tracer intensities, so it is a simple vector subtraction and then a summation of all the elements in the resulting vector.
- d * and d' is also implemented as vectors, so this is simple vector subtractions.
- DD * d ′ 1 ⁇ d app 1 , d ′ 2 ⁇ d app 2 , ... d ′ Ne ⁇ d appNe
- DD * is then an N M xN e size matrix, where N M is the number of pixels represented in a data-image and N e is the number of sets of data in the modelling-error-table.
- the mean d t (of size N M x1) and covariance C t (of size N M xN e ) can easily be computed from DD * such that the modelling error can be described by a Gaussian probability density function with mean d t and covariance C t .
- the modelling error is computed, however, for very large training sets, the modelling error will be negligible, and there is no need to compute the modelling error. Also, in case the magnitude of the measurement error is much higher than the modelling error (comparing C d and C t ), then one can also ignore modelling errors. If the differences are small for all the sets of data in the error model, there is no problem. Then the modelling error is insignificant.
- the posterior distributions are used to determine output representation images of the data.
- determining a representation image comprises calculating a pixel-wise mean of the model-images m in the posterior distribution, and outputting the pixel-wise mean of the posterior distribution as the representation image.
- the representation images can simply be created by calculating mean intensities for all the pixels in the model-images m in the posterior distribution, and output an image based on these mean intensities.
- a representation image can be determined by finding the most likely pixel intensity for each pixel.
- determining a representation image comprises determining the most likely pixel intensity for pixels of a representation image based on pixels intensities for the model-images m in of the posterior distribution, and wherein the representation image is based on the most likely pixel intensity.
- the representation images can also be created by counting the number of pixels with a high pixel intensity, that is high tracer intensity, for example, pixels with a tracer intensity higher than 15000. The percentage of the pixels with a high tracer intensity is calculated and the result is a probability that the pixel intensity is higher than 15000. Then pixel with a high probability is black in the representation image, while pixels with a low probability is white and all between is in grayscale.
- determining a representation image comprises determining the probability of pixels with a pixel intensity higher than a selected intensity for a representation image based on pixel intensities for the model-images m in the posterior distribution, and wherein the representation image is based on probability of pixels with a pixel intensity higher than a selected intensity.
- the representation image can be determined in many different ways by using many different statistical calculation methods.
- a method to make a representation image is to make subset-images d ss by moving the frame around the subset-image d ss only one pixel at a time, making a subset-image d ss for each pixel in the PET image, so the subset-image d ss , for instance, can be 9x9 pixels.
- the centre pixel is surrounded by the neighbour pixels in the subset-image d ss , but when the posterior distribution accepted for the subset-image d ss , is analyzed only the intensity of the centre-pixel is used for the representation image and the other 80 pixels around the centre pixel is ignored.
- the calculation gives the correct centre pixel value in the given case.
- more of the centre pixel can be used, and hence potentially lead to increased efficiency.
- Increased efficiency will depend on the increased computational demands to set up and evaluate the lookup-table for a larger subset-image.
- the centre 2x2, 3x3, 4x4 pixels in the posterior distribution images for a given subset-image d ss can be used for analysis and the remaining outer pixel be ignored.
- the invention relates to a computer program product comprising at least one computer having data storage means in connection therewith, and the computer program comprising instructions which, when the program is executed by a computer, cause the computer to carry out the steps of the method of the image reconstruction.
- the invention relates to a medical imaging device comprising a processor, wherein the processor is configured to:
- the invention relates to a computer program product being adapted to enable a computer system comprising at least one computer having data storage means in connection therewith to control a medical image device, such as a computer program product comprising instructions which, when the program is executed by a computer, cause the computer to carry out the method of the invention.
- This aspect of the invention is particularly, but not exclusively, advantageous in that the present invention may be accomplished by a computer program product enabling a computer system to carry out the operations of the method of the image reconstruction of the invention when down- or uploaded into the computer system.
- a computer program product may be provided on any kind of computer-readable medium, or through a network.
- Fig. 1 is a schematic drawing of a medical imaging system 100 in an aspect of the present invention.
- the system 100 comprises a scanning system 110, capable of obtaining data representative of a contrast agent concentration as a function of time of an injected contrast agent into a human 200, whose head is schematically seen in a cross-sectional view.
- One or more parts of the human can be imaged, e.g. the brain.
- the system comprises a PET scanner 112 and a corresponding measurement and control system 111.
- the scanner obtains primary data DAT which are communicated to the measurement and control system 111, where further processing resulting in secondary data DAT' being communicated to a processor 120.
- a method for estimating perfusion indices for the human 200 is implemented using the obtained data DAT and DAT' representative of a contrast agent concentration as a function of time of an injected contrast agent.
- the processor may be operably connected to a display device 130, such as a computer screen or a monitor, to enable showing an image of the resulting PET image as schematically indicated.
- a display device 130 such as a computer screen or a monitor
- the PET image may be communicated to a storage device 140 of any suitable kind for later analysis and diagnostic purposes.
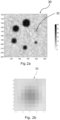
- Fig. 2a shows a 2D PET image, as output from a PET scanner.
- the 2D PET image is an example of a PET image 30.
- On Fig. 2b one subset-images d ss 32 is shown in a marked square where each tracer intensity of the subset-images d ss 32 is shown as a pixel representing the tracer intensity.
- This subset-image d ss 32 representation has 9x9 pixels.
- Fig. 3 shows that the prior ⁇ ( m ) 12 is generated based on expert data 10, the sample M* 14 is created from the prior ⁇ ( m ) 12 containing model-images m * 16 which is realizations from the prior ⁇ ( m ) 12. The model-images m * 16 is then placed in a look-up table 20.
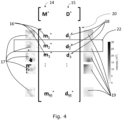
- Fig. 4 is a diagram displaying the lookup table 20 with the sample M * 14.
- the sample M * includes N I model-images m * 16.
- Each model-image m * 16 represents at least 1 pixel but can have 10, 100, 1000 pixels or any suitable number of pixels. All model-images m * 16 represents the same number of pixels.
- Each model-image m * 16 in the sample M * 14 is placed in a lookup table 20 in a first column.
- a function g is applied to generate a data-image d * 18.
- the data-image d * 18 is placed in a second column D * 15 in the lookup table.
- the lookup table 20 has two columns M * 14 and D * 15 and it has N I rows. Each row is a set of data 22 comprising a model-image m * 16 in a first column and a data-image d * 18 in a second column.
- the left side of fig. 4 shows of the model-images m * 16 from the sample M * 14 from the lookup table 20 represented as an image 17 wherein each intensity pixel value from m* 16 is represented by a greyscale colour.
- the right side of fig. 4 shows the data-images d * 18 from the lookup table 20 represented as an image 19 wherein each intensity pixel value from d * 18 is represented by a greyscale colour.
- the image 34 in fig. 5 is the representation image resulting from applying the forward method, the method of the invention, to the PET image (30).
- Fig. 6 illustrates that for each subset-image d ss 32 from the PET image 30, a likelihood L( m ) 42 is calculated for each set of data 22 in the lookup table 20.
- a list 40 of likelihoods L( m ) 42 for a subset-image d ss 32 is shown, and it is also illustrated that different lists 40 are made for each subset-image d ss 32.
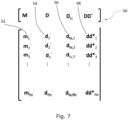
- fig. 7 shows the modelling-error-table 50 with N e sets of data. Each set of data comprises an error-model-image m' 52.
- the modelling-error-table 50 is similar to the lookup table 20 based on the prior ⁇ ( m ) . But the modelling-error-table 50 typically require fewer sets of data, for instance 1000.
- an error-data-image d' 54 is calculated using the function g.
- Each error-model-image m' 52 is compared to all model-images m * 16 in the lookup table 20 to find the most similar set of data in the look-up table 20.
- the data-image d* 18 for the chosen set of data is taken and placed in the modelling-error-table 50 as the data-image d lu 56.
- the distance between d' 54 and d lu 56 is calculated and the result dd* 58 is placed in the modelling-error-table 50 in a column DD *.
- the mean d t and the covariance C t is now computed from the column DD *.
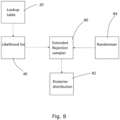
- Fig. 8 shows that based on the likelihood L( m ) in the list 40 for a given subset-image d ss , the extended rejection sampler 80 selects a posterior distribution 82 from the lookup table 20. This is done for each subset-image d ss . The selection is done by calculating P acc and comparing P acc with a number from a randomizer 84. A new randomized number is generated for each comparison made.
- the comparison starts from the top of the list 40 with calculating P acc based on the likelihood L 1 ( m ) and generating a random number between 0 and 1. If the random number is larger than P acc , then the set of data 22 from the lookup table 20 is rejected, but if the random number is smaller than P acc , then the corresponding set of data 22 from the lookup table 20 is accepted for the posterior distribution 82 for the given subset-image d ss and the model-image m * 16 from the set of data 22 in the lookup table 20 is added to the posterior distribution 82.
- the selection continues by calculating P acc for L 2 ( m ) and so on until the requested number of sets of data 22 from the lookup table 20 has been accepted and the model-image m * 16 added to the posterior distribution 82. If all the rows in the list 40 has been tested without reaching the requested number, the selecting starts again from the top of the subset-image list 40 and testing again the rows that was not selected in the first run and so on until the requested number of model-images m * has been added to the posterior distribution 82.
- Fig. 9 shows 10 image representations 17 of model-images m* 16 selected by the extended rejection sampler 80 for the posterior distribution 82 from lookup tables 20 of different sizes, 1000, 50000, 100000 and 500000 respectively.
- Fig. 10 shows six representation images 60 as a pointwise mean estimate of the intensity for the model-images m* in a posterior distribution 82 of with representations of ten model-images m* are shown in fig. 9 .
- the six representation images are created using lookup tables of the sizes of 1000, 5000, 10000, 50000, 100000 and 500000 sets of data respectively.
- an image 62 made by a prior art method, ProPET, used in WO2018/215357 is shown for comparison, showing that using an extended rejection sampler with a lookup table with 500000 sets of data gives the same result as using the prior art ProPET method.
- Fig. 11 shows the CPU time per subset-image analysed by LoPET, the method of the invention and for the prior art method ProPET as shown in fig. 10 .
- Graph with reference no. 90 shows the CPU time for the LoPET method and graph with reference no. 92 shows the CPU time used by the prior art method ProPET. It can be seen that the CPU time is considerably lower for LoPET than for ProPET, so LoPET, the method of the invention is considerably faster than the prior art method ProPET.
- Fig. 12a shows representation images for the method of the invention using a lookup table with 1000 sets of data.
- Fig. 12b shows representation images for the method of the invention using a lookup table with 5000 sets of data.
- Fig. 12c shows representation images for the method of the invention using a lookup table with 10000 sets of data.
- Fig. 12d shows representation images for the method of the invention using a lookup table with 25000 sets of data.
- Fig. 12e shows representation images for the method of the invention using a lookup table with 50000 sets of data.
- Figure 12f shows representation images based on the prior art ProPET method.
- the invention can be implemented by means of hardware, software, firmware or any combination of these.
- the invention or some of the features thereof can also be implemented as software running on one or more data processors and/or digital signal processors.
- the individual elements of an embodiment of the invention may be physically, functionally and logically implemented in any suitable way such as in a single unit, in a plurality of units or as part of separate functional units.
- the invention may be implemented in a single unit, or be both physically and functionally distributed between different units and processors.
Landscapes
- Engineering & Computer Science (AREA)
- Health & Medical Sciences (AREA)
- Life Sciences & Earth Sciences (AREA)
- Physics & Mathematics (AREA)
- Medical Informatics (AREA)
- General Physics & Mathematics (AREA)
- Theoretical Computer Science (AREA)
- Heart & Thoracic Surgery (AREA)
- General Health & Medical Sciences (AREA)
- Nuclear Medicine, Radiotherapy & Molecular Imaging (AREA)
- Optics & Photonics (AREA)
- Pathology (AREA)
- Radiology & Medical Imaging (AREA)
- Biomedical Technology (AREA)
- Biophysics (AREA)
- Molecular Biology (AREA)
- Surgery (AREA)
- Animal Behavior & Ethology (AREA)
- High Energy & Nuclear Physics (AREA)
- Public Health (AREA)
- Veterinary Medicine (AREA)
- Image Processing (AREA)
- Nuclear Medicine (AREA)
- Algebra (AREA)
- Mathematical Analysis (AREA)
- Mathematical Optimization (AREA)
- Mathematical Physics (AREA)
- Pure & Applied Mathematics (AREA)
- Apparatus For Radiation Diagnosis (AREA)
Claims (13)
- Computerimplementiertes Verfahren zur Bildrekonstruktion zur medizinischen Bildgebung eines Subjekts, wobei das Verfahren Folgendes umfasst:- Erhalten einer Nachschlagetabelle (20) von vorberechneten Sätzen von Daten (22), wobei jeder vorberechnete Satz von Daten (22) ein Modellbild m* (16) aus einem Abtastwert M* (14) und ein entsprechendes Datenbild d* (18) umfasst, das Modellbild m* (16) eine Umsetzung aus einem vorherigen ρ(m) (12) ist, der vorherige ρ(m) (12) ein statistisches Modell auf Grundlage von Expertendaten ist, jedes Modellbild m* (16) eine Darstellung eines Bildes von einem oder mehreren Pixeln ist, das Datenbild d* (18) auf Grundlage des Modellbilds m* (16) in demselben Satz von Daten (22) bestimmt wird, jedes Datenbild d* (18) eine Darstellung von einem oder mehreren Pixeln ist,- Erhalten eines PET-Bildes (30) und Unterteilen des PET-Bildes (30) in Teilmengenbilder d ss (32), wobei jedes Teilmengenbild d ss (32) eine Darstellung von einem oder mehreren Pixeln ist,- Verwenden einer erweiterten Verwerfungsabtastvorrichtung (80) für jedes Teilmengenbild d ss (32) aus dem PET-Bild (30), um Modellbilder m* (16) aus der Nachschlagetabelle (20) zu akzeptieren, welche die A-posteriori-Verteilung (82) angesichts des Teilmengenbild d ss (32) darstellen, und- Bestimmen und Ausgeben eines Darstellungsbildes (94) auf Grundlage des Abtastwertes der A-posteriori-Verteilung (82).
- Computerimplementiertes Verfahren zur Bildrekonstruktion nach Anspruch 1, wobei das Verfahren ferner umfasst, dass für jedes Teilmengenbild d ss (32) eine Wahrscheinlichkeit L(m) (42) für jeden vorberechneten Satz von Daten (22) in der Nachschlagetabelle (20) berechnet wird, wobei L(m*) eine Funktion L(m*) = f(g(m*)-d ss) ist, wobei g(m*) das Datenbild d* ist.
- Computerimplementiertes Verfahren zur Bildrekonstruktion nach einem der vorhergehenden Ansprüche, wobei das Verfahren ferner umfasst, dass für jedes Teilmengenbild d ss (32) eine Wahrscheinlichkeitsakzeptanz Pacc für jeden vorberechneten Satz von Daten (22) in der Nachschlagetabelle(20) für das gegebene Teilmengenbild d ss (32) auf Grundlage der Wahrscheinlichkeit L(m*) (42) für diesen vorberechneten Satz von Daten (22) für das gegebene Teilmengenbild d ss (32) geteilt durch eine maximale Wahrscheinlichkeit max(L) für das gegebene Teilmengenbild d ss (32) berechnet wird.
- Computerimplementiertes Verfahren zur Bildrekonstruktion nach einem der vorhergehenden Ansprüche, wobei das Verfahren ferner für jedes Teilmengenbild d ss (32) umfasst, dass die Wahrscheinlichkeitsakzeptanz Pacc, berechnet für jeden vorberechneten Satz von Daten (22) in der Nachschlagetabelle (20) für das gegebene Teilmengenbild d ss, von der erweiterten Verwerfungsabtastvorrichtung (80) verwendet wird, um zu bestimmen, ob das Modellbild m* aus dem vorberechneten Satz von Daten (22) in der Nachschlagetabelle (20) für eine A-posteriori-Verteilung (82) für das jeweilige Teilmengenbild d ss zu akzeptieren ist.
- Computerimplementiertes Verfahren zur Bildrekonstruktion nach einem der vorhergehenden Ansprüche, wobei ein Zufallswert für jeden vorberechneten Satz von Daten (22) in der Nachschlagetabelle (20) erzeugt wird, um mit der Wahrscheinlichkeitsannahme Pacc verglichen zu werden, um zu entscheiden, ob das Modellbild m* aus dem vorberechneten Satz von Daten (22) in der Nachschlagetabelle (20) für die A-posteriori-Verteilung (82) zu akzeptieren ist.
- Computerimplementiertes Verfahren zur Bildrekonstruktion nach einem der vorhergehenden Ansprüche, wobei das Verfahren ferner Folgendes umfasst:• Erhalten eines Rauschmodells für das PET-Bild (30) und• Erhalten eines Vorwärtsoperators g, zum Beispiel in Form eines linearen Punktverteilungsfunktionsoperators G PSF,• Erhalten eines Modellierungsfehlers aufgrund einer Verwendung einer Nachschlagetabelle (20) finiter Größe und• Verwenden des Modellierungsfehlers, vorzugsweise vor der Verwendung, einer erweiterten Verwerfungsabtastvorrichtung (80) zum Abtasten der A-posteriori-Verteilungen (82) auf Grundlage der Nachschlagetabelle (20) für jedes Teilmengenbild d ss aus dem PET-Bild (30).
- Computerimplementiertes Verfahren zur Bildrekonstruktion nach Anspruch 6, wobei der Modellierungsfehler in der Berechnung der Wahrscheinlichkeit L(m) beinhaltet ist.
- Computerimplementiertes Verfahren zur Bildrekonstruktion nach einem der vorhergehenden Ansprüche, wobei das Bestimmen eines Darstellungsbildes (94) Berechnen eines pixelweisen Mittelwerts der Modellbilder m (16) der A-posteriori-Verteilung (82) und Ausgeben des pixelweisen Mittelwerts der A-posteriori-Verteilung (82) als das Darstellungsbild (94) umfasst.
- Computerimplementiertes Verfahren zur Bildrekonstruktion nach einem der vorhergehenden Ansprüche, wobei das Bestimmen eines Darstellungsbildes (94) Bestimmen der wahrscheinlichsten Pixelintensität für Pixel eines Darstellungsbildes (94) auf Grundlage der Pixelintensitäten für die Modellbilder m (16) in der A-posteriori-Verteilung (82) umfasst und wobei das Darstellungsbild (94) auf den wahrscheinlichsten Pixelintensitäten basiert.
- Computerimplementiertes Verfahren zur Bildrekonstruktion nach einem der vorhergehenden Ansprüche, wobei das Bestimmen eines Darstellungsbildes (94) Bestimmen der Wahrscheinlichkeit von Pixeln mit einer Pixelintensität über einer ausgewählten Intensität für ein Darstellungsbild (94) auf Grundlage von Pixelintensitäten für die Modellbilder m (16) in der A-posteriori-Verteilung (82) umfasst und wobei das Darstellungsbild (94) auf der Wahrscheinlichkeit von Pixeln mit einer Pixelintensität über einer ausgewählten Intensität basiert.
- Computerimplementiertes Verfahren zur Bildrekonstruktion nach einem der vorhergehenden Ansprüche, wobei nur die zentrale Pixelintensität oder eine Gruppe von zentralen Pixelintensitäten für die Modellbilder m (16) in der A-posteriori-Verteilung (82) zum Erzeugen des Darstellungsbildes (94) verwendet wird.
- Medizinische Bildgebungsvorrichtung, umfassend einen Prozessor, wobei der Prozessor zu Folgendem konfiguriert ist:- Erhalten einer Nachschlagetabelle (20) von vorberechneten Sätzen von Daten (22), wobei jeder vorberechnete Satz von Daten (22) ein Modellbild m* (16) aus einem Abtastwert M* (14) und ein entsprechendes Datenbild d* (18) umfasst, das Modellbild m* (16) eine Umsetzung aus einem vorherigen ρ(m) (12) ist, der vorherige ρ(m) (12) ein statistisches Modell auf Grundlage von Expertendaten ist, jedes Modellbild m* (16) eine Darstellung eines Bildes von einem oder mehreren Pixeln ist, das Datenbild d* (18) auf Grundlage des Modellbilds m* (16) in demselben Satz von Daten (22) bestimmt wird, jedes Datenbild d* (18) eine Darstellung von einem oder mehreren Pixeln ist,- Erhalten eines PET-Bildes (30) und Unterteilen des PET-Bildes (30) in Teilmengenbilder d ss (32), wobei jedes Teilmengenbild d ss (32) eine Darstellung von einem oder mehreren Pixeln ist,- Verwenden einer erweiterten Verwerfungsabtastvorrichtung (80) für jedes Teilmengenbild d ss (32) aus dem PET-Bild (30), um Modellbilder m* (16) aus der Nachschlagetabelle (20) zu akzeptieren, welche die A-posteriori-Verteilung (82) angesichts des Teilmengenbild d ss (32) darstellen, und- Bestimmen und Ausgeben eines Darstellungsbildes (94) auf Grundlage des Abtastwertes der A-posteriori-Verteilung (82).
- Computerprogrammsoftware, die dazu ausgelegt ist, das Verfahren nach einem der Ansprüche 1-11 auszuführen.
Applications Claiming Priority (2)
| Application Number | Priority Date | Filing Date | Title |
|---|---|---|---|
| EP20165234 | 2020-03-24 | ||
| PCT/EP2021/057275 WO2021191151A1 (en) | 2020-03-24 | 2021-03-22 | Device and method for pet image analysis and reconstruction |
Publications (3)
| Publication Number | Publication Date |
|---|---|
| EP4128162A1 EP4128162A1 (de) | 2023-02-08 |
| EP4128162C0 EP4128162C0 (de) | 2025-05-07 |
| EP4128162B1 true EP4128162B1 (de) | 2025-05-07 |
Family
ID=69960413
Family Applications (1)
| Application Number | Title | Priority Date | Filing Date |
|---|---|---|---|
| EP21713398.2A Active EP4128162B1 (de) | 2020-03-24 | 2021-03-22 | Vorrichtung und verfahren zur analyse und rekonstruktion von pet-bildern |
Country Status (4)
| Country | Link |
|---|---|
| US (1) | US12307559B2 (de) |
| EP (1) | EP4128162B1 (de) |
| JP (1) | JP7688658B2 (de) |
| WO (1) | WO2021191151A1 (de) |
Family Cites Families (12)
| Publication number | Priority date | Publication date | Assignee | Title |
|---|---|---|---|---|
| GB2463242B (en) | 2008-09-03 | 2012-11-07 | Statoilhydro Asa | Method of modelling a subterranean region of the earth |
| WO2012037067A1 (en) * | 2010-09-14 | 2012-03-22 | Massachusetts Institute Of Technology | Multi-contrast image reconstruction with joint bayesian compressed sensing |
| CN102324089B (zh) * | 2011-07-13 | 2013-04-03 | 南方医科大学 | 基于广义熵与mr先验的pet图像最大后验重建方法 |
| US9460494B2 (en) * | 2012-02-03 | 2016-10-04 | The Research Foundation For The State University Of New York | Methods and systems for inverse problem reconstruction and application to ECT reconstruction |
| CN103559728B (zh) * | 2013-10-31 | 2017-05-03 | 南方医科大学 | 基于解剖功能联合先验模型的pet图像最大后验重建方法 |
| US10210635B2 (en) * | 2016-06-29 | 2019-02-19 | Siemens Medical Solutions Usa, Inc. | Reconstruction quality assessment with local non-uniformity in nuclear imaging |
| WO2018215357A1 (en) | 2017-05-24 | 2018-11-29 | Københavns Universitet | Device and method for pet image reconstruction |
| WO2019019199A1 (en) * | 2017-07-28 | 2019-01-31 | Shenzhen United Imaging Healthcare Co., Ltd. | SYSTEM AND METHOD FOR IMAGE CONVERSION |
| WO2019090533A1 (en) * | 2017-11-08 | 2019-05-16 | Shenzhen United Imaging Healthcare Co., Ltd. | System and method for diagnositic and treatment |
| JP7032913B2 (ja) | 2017-11-27 | 2022-03-09 | キヤノン株式会社 | 画像処理装置、画像処理方法、コンピュータプログラム |
| CN110009707B (zh) * | 2019-04-09 | 2023-01-03 | 上海联影医疗科技股份有限公司 | 图像散射校正方法、装置、计算机设备和存储介质 |
| CN110717951B (zh) * | 2019-09-12 | 2021-08-03 | 浙江大学 | 一种基于cGANs的PET图像直接重建方法 |
-
2021
- 2021-03-22 JP JP2022558121A patent/JP7688658B2/ja active Active
- 2021-03-22 EP EP21713398.2A patent/EP4128162B1/de active Active
- 2021-03-22 US US17/906,726 patent/US12307559B2/en active Active
- 2021-03-22 WO PCT/EP2021/057275 patent/WO2021191151A1/en not_active Ceased
Also Published As
| Publication number | Publication date |
|---|---|
| JP7688658B2 (ja) | 2025-06-04 |
| WO2021191151A1 (en) | 2021-09-30 |
| US12307559B2 (en) | 2025-05-20 |
| US20230154068A1 (en) | 2023-05-18 |
| EP4128162C0 (de) | 2025-05-07 |
| JP2023527106A (ja) | 2023-06-27 |
| EP4128162A1 (de) | 2023-02-08 |
Similar Documents
| Publication | Publication Date | Title |
|---|---|---|
| EP3779866B1 (de) | Systeme und verfahren zur schärfung medizinischer bilder unter verwendung eines tiefen neuronalen netzwerks | |
| EP3712849B1 (de) | Automatisierte unsicherheitsschätzung der läsionssegmentierung | |
| Goldsmith et al. | Smooth scalar-on-image regression via spatial Bayesian variable selection | |
| US8208706B2 (en) | Functional image presentation | |
| US12141979B2 (en) | Image data processing to increase follow-up analysis fidelity | |
| US20040101176A1 (en) | Method and system for measuring disease relevant tissue changes | |
| Hoppin et al. | Objective comparison of quantitative imaging modalities without the use of a gold standard | |
| CN109727660A (zh) | 在医学成像中针对血液动力学量化的不确定性或敏感性的机器学习预测 | |
| EP2987114B1 (de) | Verfahren und system zur bestimmung eines phänotyps von neoplasma in einem menschen- oder tierkörper | |
| US10210635B2 (en) | Reconstruction quality assessment with local non-uniformity in nuclear imaging | |
| CN111145140B (zh) | 使用深度学习确定肺结节的恶性程度 | |
| US20090074279A1 (en) | Method and system of multivariate analysis on slice-wise data of reference structure normalized images for improved quality in positron emission tomography studies | |
| EP4128162B1 (de) | Vorrichtung und verfahren zur analyse und rekonstruktion von pet-bildern | |
| JP2007521862A (ja) | 心臓機能の確率的解析 | |
| US12469190B2 (en) | X-ray tomographic reconstruction method and associated device | |
| US11200710B2 (en) | Device and method for PET image reconstruction | |
| EP4302261B1 (de) | Analyse und rekonstruktion von pet-bildern durch maschinelles lernen | |
| Park | 10 Spatial-domain model observers for optimizing tomosynthesis | |
| Kaur et al. | Advanced Methods and Approaches in Image Reconstruction | |
| KR20210068189A (ko) | 의료 영상을 이용한 병변 여부 판단 방법 | |
| Vale et al. | Deep learning for photoacoustic imaging of CAR-T cells in cancer immunotherapy | |
| Dalmau-Cedeño et al. | Regularized Hypothesis Testing in Random Fields with Applications to Neuroimaging | |
| US20240029324A1 (en) | Method for image reconstruction, computer device and storage medium | |
| Buvat | Quantitative Image Analysis in Tomography | |
| Li | Model-Based Approaches to Ill-Conditioned Inverse Problems in X-Ray Imaging |
Legal Events
| Date | Code | Title | Description |
|---|---|---|---|
| STAA | Information on the status of an ep patent application or granted ep patent |
Free format text: STATUS: UNKNOWN |
|
| STAA | Information on the status of an ep patent application or granted ep patent |
Free format text: STATUS: THE INTERNATIONAL PUBLICATION HAS BEEN MADE |
|
| PUAI | Public reference made under article 153(3) epc to a published international application that has entered the european phase |
Free format text: ORIGINAL CODE: 0009012 |
|
| STAA | Information on the status of an ep patent application or granted ep patent |
Free format text: STATUS: REQUEST FOR EXAMINATION WAS MADE |
|
| 17P | Request for examination filed |
Effective date: 20221011 |
|
| AK | Designated contracting states |
Kind code of ref document: A1 Designated state(s): AL AT BE BG CH CY CZ DE DK EE ES FI FR GB GR HR HU IE IS IT LI LT LU LV MC MK MT NL NO PL PT RO RS SE SI SK SM TR |
|
| DAV | Request for validation of the european patent (deleted) | ||
| DAX | Request for extension of the european patent (deleted) | ||
| GRAP | Despatch of communication of intention to grant a patent |
Free format text: ORIGINAL CODE: EPIDOSNIGR1 |
|
| STAA | Information on the status of an ep patent application or granted ep patent |
Free format text: STATUS: GRANT OF PATENT IS INTENDED |
|
| INTG | Intention to grant announced |
Effective date: 20240812 |
|
| GRAJ | Information related to disapproval of communication of intention to grant by the applicant or resumption of examination proceedings by the epo deleted |
Free format text: ORIGINAL CODE: EPIDOSDIGR1 |
|
| STAA | Information on the status of an ep patent application or granted ep patent |
Free format text: STATUS: REQUEST FOR EXAMINATION WAS MADE |
|
| INTC | Intention to grant announced (deleted) | ||
| GRAS | Grant fee paid |
Free format text: ORIGINAL CODE: EPIDOSNIGR3 |
|
| STAA | Information on the status of an ep patent application or granted ep patent |
Free format text: STATUS: GRANT OF PATENT IS INTENDED |
|
| GRAP | Despatch of communication of intention to grant a patent |
Free format text: ORIGINAL CODE: EPIDOSNIGR1 |
|
| INTG | Intention to grant announced |
Effective date: 20250124 |
|
| GRAA | (expected) grant |
Free format text: ORIGINAL CODE: 0009210 |
|
| STAA | Information on the status of an ep patent application or granted ep patent |
Free format text: STATUS: THE PATENT HAS BEEN GRANTED |
|
| AK | Designated contracting states |
Kind code of ref document: B1 Designated state(s): AL AT BE BG CH CY CZ DE DK EE ES FI FR GB GR HR HU IE IS IT LI LT LU LV MC MK MT NL NO PL PT RO RS SE SI SK SM TR |
|
| REG | Reference to a national code |
Ref country code: GB Ref legal event code: FG4D |
|
| REG | Reference to a national code |
Ref country code: CH Ref legal event code: EP |
|
| REG | Reference to a national code |
Ref country code: DE Ref legal event code: R096 Ref document number: 602021030396 Country of ref document: DE |
|
| REG | Reference to a national code |
Ref country code: IE Ref legal event code: FG4D |
|
| U01 | Request for unitary effect filed |
Effective date: 20250606 |
|
| U07 | Unitary effect registered |
Designated state(s): AT BE BG DE DK EE FI FR IT LT LU LV MT NL PT RO SE SI Effective date: 20250616 |
|
| PG25 | Lapsed in a contracting state [announced via postgrant information from national office to epo] |
Ref country code: ES Free format text: LAPSE BECAUSE OF FAILURE TO SUBMIT A TRANSLATION OF THE DESCRIPTION OR TO PAY THE FEE WITHIN THE PRESCRIBED TIME-LIMIT Effective date: 20250507 |
|
| PG25 | Lapsed in a contracting state [announced via postgrant information from national office to epo] |
Ref country code: GR Free format text: LAPSE BECAUSE OF FAILURE TO SUBMIT A TRANSLATION OF THE DESCRIPTION OR TO PAY THE FEE WITHIN THE PRESCRIBED TIME-LIMIT Effective date: 20250808 |
|
| PG25 | Lapsed in a contracting state [announced via postgrant information from national office to epo] |
Ref country code: PL Free format text: LAPSE BECAUSE OF FAILURE TO SUBMIT A TRANSLATION OF THE DESCRIPTION OR TO PAY THE FEE WITHIN THE PRESCRIBED TIME-LIMIT Effective date: 20250507 |
|
| PG25 | Lapsed in a contracting state [announced via postgrant information from national office to epo] |
Ref country code: HR Free format text: LAPSE BECAUSE OF FAILURE TO SUBMIT A TRANSLATION OF THE DESCRIPTION OR TO PAY THE FEE WITHIN THE PRESCRIBED TIME-LIMIT Effective date: 20250507 |
|
| PG25 | Lapsed in a contracting state [announced via postgrant information from national office to epo] |
Ref country code: RS Free format text: LAPSE BECAUSE OF FAILURE TO SUBMIT A TRANSLATION OF THE DESCRIPTION OR TO PAY THE FEE WITHIN THE PRESCRIBED TIME-LIMIT Effective date: 20250807 |
|
| PG25 | Lapsed in a contracting state [announced via postgrant information from national office to epo] |
Ref country code: IS Free format text: LAPSE BECAUSE OF FAILURE TO SUBMIT A TRANSLATION OF THE DESCRIPTION OR TO PAY THE FEE WITHIN THE PRESCRIBED TIME-LIMIT Effective date: 20250907 |
|
| PG25 | Lapsed in a contracting state [announced via postgrant information from national office to epo] |
Ref country code: SM Free format text: LAPSE BECAUSE OF FAILURE TO SUBMIT A TRANSLATION OF THE DESCRIPTION OR TO PAY THE FEE WITHIN THE PRESCRIBED TIME-LIMIT Effective date: 20250507 |
|
| PG25 | Lapsed in a contracting state [announced via postgrant information from national office to epo] |
Ref country code: CZ Free format text: LAPSE BECAUSE OF FAILURE TO SUBMIT A TRANSLATION OF THE DESCRIPTION OR TO PAY THE FEE WITHIN THE PRESCRIBED TIME-LIMIT Effective date: 20250507 |
|
| PG25 | Lapsed in a contracting state [announced via postgrant information from national office to epo] |
Ref country code: SK Free format text: LAPSE BECAUSE OF FAILURE TO SUBMIT A TRANSLATION OF THE DESCRIPTION OR TO PAY THE FEE WITHIN THE PRESCRIBED TIME-LIMIT Effective date: 20250507 |
|
| PLBE | No opposition filed within time limit |
Free format text: ORIGINAL CODE: 0009261 |
|
| STAA | Information on the status of an ep patent application or granted ep patent |
Free format text: STATUS: NO OPPOSITION FILED WITHIN TIME LIMIT |
|
| REG | Reference to a national code |
Ref country code: CH Ref legal event code: L10 Free format text: ST27 STATUS EVENT CODE: U-0-0-L10-L00 (AS PROVIDED BY THE NATIONAL OFFICE) Effective date: 20260318 |
|
| PGFP | Annual fee paid to national office [announced via postgrant information from national office to epo] |
Ref country code: GB Payment date: 20260324 Year of fee payment: 6 |
|
| PGFP | Annual fee paid to national office [announced via postgrant information from national office to epo] |
Ref country code: NO Payment date: 20260323 Year of fee payment: 6 |
|
| 26N | No opposition filed |
Effective date: 20260210 |
|
| U20 | Renewal fee for the european patent with unitary effect paid |
Year of fee payment: 6 Effective date: 20260326 |