EP4118657B1 - Systeme und verfahren zur entfaltung von expressionsdaten - Google Patents
Systeme und verfahren zur entfaltung von expressionsdaten Download PDFInfo
- Publication number
- EP4118657B1 EP4118657B1 EP21716903.6A EP21716903A EP4118657B1 EP 4118657 B1 EP4118657 B1 EP 4118657B1 EP 21716903 A EP21716903 A EP 21716903A EP 4118657 B1 EP4118657 B1 EP 4118657B1
- Authority
- EP
- European Patent Office
- Prior art keywords
- expression data
- cell
- cells
- rna
- genes
- Prior art date
- Legal status (The legal status is an assumption and is not a legal conclusion. Google has not performed a legal analysis and makes no representation as to the accuracy of the status listed.)
- Active
Links
Images


Classifications
-
- G—PHYSICS
- G16—INFORMATION AND COMMUNICATION TECHNOLOGY [ICT] SPECIALLY ADAPTED FOR SPECIFIC APPLICATION FIELDS
- G16B—BIOINFORMATICS, i.e. INFORMATION AND COMMUNICATION TECHNOLOGY [ICT] SPECIALLY ADAPTED FOR GENETIC OR PROTEIN-RELATED DATA PROCESSING IN COMPUTATIONAL MOLECULAR BIOLOGY
- G16B25/00—ICT specially adapted for hybridisation; ICT specially adapted for gene or protein expression
- G16B25/10—Gene or protein expression profiling; Expression-ratio estimation or normalisation
-
- G—PHYSICS
- G06—COMPUTING OR CALCULATING; COUNTING
- G06F—ELECTRIC DIGITAL DATA PROCESSING
- G06F17/00—Digital computing or data processing equipment or methods, specially adapted for specific functions
- G06F17/10—Complex mathematical operations
- G06F17/18—Complex mathematical operations for evaluating statistical data, e.g. average values, frequency distributions, probability functions, regression analysis
-
- G—PHYSICS
- G16—INFORMATION AND COMMUNICATION TECHNOLOGY [ICT] SPECIALLY ADAPTED FOR SPECIFIC APPLICATION FIELDS
- G16B—BIOINFORMATICS, i.e. INFORMATION AND COMMUNICATION TECHNOLOGY [ICT] SPECIALLY ADAPTED FOR GENETIC OR PROTEIN-RELATED DATA PROCESSING IN COMPUTATIONAL MOLECULAR BIOLOGY
- G16B40/00—ICT specially adapted for biostatistics; ICT specially adapted for bioinformatics-related machine learning or data mining, e.g. knowledge discovery or pattern finding
- G16B40/20—Supervised data analysis
-
- Y—GENERAL TAGGING OF NEW TECHNOLOGICAL DEVELOPMENTS; GENERAL TAGGING OF CROSS-SECTIONAL TECHNOLOGIES SPANNING OVER SEVERAL SECTIONS OF THE IPC; TECHNICAL SUBJECTS COVERED BY FORMER USPC CROSS-REFERENCE ART COLLECTIONS [XRACs] AND DIGESTS
- Y02—TECHNOLOGIES OR APPLICATIONS FOR MITIGATION OR ADAPTATION AGAINST CLIMATE CHANGE
- Y02A—TECHNOLOGIES FOR ADAPTATION TO CLIMATE CHANGE
- Y02A90/00—Technologies having an indirect contribution to adaptation to climate change
- Y02A90/10—Information and communication technologies [ICT] supporting adaptation to climate change, e.g. for weather forecasting or climate simulation
Definitions
- a tumor mass may comprise a population of malignant cells (e.g., cancer cells) and a microenvironment which may include, for example, immune cells, fibroblasts, and extracellular matrix proteins.
- WO 2019/018684 describes a method that quantifies the abundance of at least one of a plurality of distinct cell types by optimising a regression between a feature profile comprising a plurality of gene expression profiles and a reference matrix of feature signatures for a plurality of distinct cell types, wherein the feature profile is modelled as a linear combination of the reference matrix.
- US 2019/0233898 describes a method including: optimizing a regression between a) a feature profile of a first plurality of distinct components and b) a reference matrix of feature signatures for a second plurality of distinct components, wherein the feature profile is modeled as a linear combination of the reference matrix, and wherein the optimizing includes solving a set of regression coefficients of the regression; and estimating the fractional representation of one or more distinct components among the second plurality of distinct components present in the sample based on the set of regression coefficients.
- 2017;18(1):220 describes a method that uses gene signatures associated with cell types and a gene set enrichment analysis to determine enrichment scores for a cell type as the average single-sample GSEA (ssGSEA) score of all signatures corresponding to the cell type.
- the enrichment scores are then transformed to a linear scale and a spillover compensation technique is used to reduce dependencies between closely related cell types.
- a method comprising: using at least one computer hardware processor to perform: obtaining expression data for a biological sample, the biological sample previously obtained from a subject, the expression data including expression data associated with a plurality of gene sets associated with a respective plurality of cell types, the expression data including first expression data associated with a first set of genes of the plurality of gene sets, the first set of genes associated with a first cell type of the plurality of cell types; determining a plurality of cell composition percentages for the plurality of cell types, including a first cell composition percentage for the first cell type, using the expression data associated with the plurality of gene sets and a plurality of non-linear regression models including a first non-linear regression model, wherein the first cell composition percentage indicates an estimated percentage of cells of the first cell type in the biological sample, wherein determining the plurality of cell composition percentages for the plurality of cell types including the first cell composition percentage for the first cell type comprises: for each cell type of the plurality of cell types,
- a system comprising: at least one hardware processor; and at least one non-transitory computer-readable storage medium storing processor-executable instructions that, when executed by the at least one hardware processor, cause the at least one hardware processor to perform the method according to the first aspect.
- At least one non-transitory computer-readable storage medium storing processor-executable instructions that, when executed by at least one hardware processor, cause the at least one hardware processor to perform the method according to the first aspect
- the subject has, is suspected of having, or is at risk of having cancer.
- the expression data is RNA expression data.
- processing the first expression data with the first non-linear regression model comprises: providing the first expression data as input to the first non-linear regression model to obtain a corresponding output representing an estimated percentage of RNA from the first cell type; and determining, based on the estimated percentage of RNA from the first cell type, the first cell composition percentage for the first cell type.
- the expression data includes second expression data associated with the first set of genes associated with the first cell type; and the first non-linear regression model comprises: a first sub-model configured to generate, using the first expression data as input, a first value for the estimated percentage of RNA from the first cell type; and a second sub-model configured to generate, using the second expression data and the first value for the estimated percentage of RNA from the first cell type as input, a second value for the estimated percentage of RNA from the first cell type.
- the expression data includes second expression data associated with a second set of genes associated with a second cell type different from the first cell type
- the one or more non-linear regression models comprise a second non-linear regression model.
- Some embodiments further comprise determining a second cell composition percentage for the second cell type at least in part by processing the second expression data with the second non-linear regression model to determine the second cell composition percentage for the second cell type.
- the first cell type is selected from the group consisting of B cells, CD4+ T cells, CD8+ T cells, endothelial cells, fibroblasts, lymphocytes, macrophages, monocytes, NK cells, neutrophils, and T cells.
- the first expression data includes expression data for at least 10 genes selected from the group of genes for the first cell type in Table 2.
- genes in the plurality of gene sets include at least 25 genes selected from the group of genes in Table 2 and determining the plurality of cell composition percentages comprises processing expression data for the at least 25 genes.
- genes in the plurality of gene sets include at least 35 genes selected from the group of genes in Table 2 and determining the plurality of cell composition percentages comprises processing expression data for the at least 35 genes.
- genes in the plurality of gene sets include at least 50 genes selected from the group of genes in Table 2 and determining the plurality of cell composition percentages comprises processing expression data for the at least 50 genes.
- genes in the plurality of gene sets include at least 75 genes selected from the group of genes in Table 2 and determining the plurality of cell composition percentages comprises processing expression data for the at least 75 genes.
- genes in the plurality of gene sets include at least 100 genes selected from the group of genes in Table 2 and determining the plurality of cell composition percentages comprises processing expression data for the at least 100 genes.
- the one or more non-linear regression models comprise one or more random forest regression models.
- the one or more non-linear regression models comprise one or more neural network regression models.
- the one or more non-linear regression models comprise one or more support vector machine regression models.
- the first non-linear regression model was trained at least in part by: obtaining simulated expression data; and training the first non-linear regression model using the simulated expression data.
- Some embodiments further comprise obtaining the simulated expression data; and training the first non-linear regression model using the simulated expression data.
- obtaining the simulated expression data comprises generating the simulated expression data, wherein generating the simulated expression data comprises: obtaining a set of RNA expression data from one or more biological samples, the set of RNA expression data comprising microenvironment cell expression data and malignant cell expression data; generating simulated microenvironment cell expression data using the microenvironment cell expression data; generating simulated malignant cell expression data using the malignant cell expression data; and combining the simulated microenvironment cell expression data and the simulated malignant cell expression data to produce at least a part of the simulated expression data.
- Some embodiments further comprise determining a malignancy expression profile using an expression profile for the first cell type and the first cell composition percentage for the first cell type.
- the first non-linear regression model has been trained by: obtaining training data comprising simulated RNA expression data, the simulated RNA expression data including first RNA expression data for the first set of genes associated with the first cell type; training the first non-linear regression model to estimate a percentage of RNA from the first cell type, the training comprising: generating, using the first non-linear regression model and the first RNA expression data, an estimated percentage of RNA from the first cell type; and updating parameters of the first non-linear regression model using the estimated percentage of RNA from the first cell type.
- the inventors have developed machine learning techniques for determining cell composition percentages (e.g., percentages of cells of particular respective types) in a biological sample (e.g., such as a sample from a tumor or other diseased tissue) based on RNA expression data (e.g., data collected by processing the biological sample with a sequencing technique, such as bulk RNA-sequencing). Determining cell composition percentages for one or more cell types involves using one or more non-linear regression models to estimate respective cell composition percentages for the cell types.
- RNA expression data e.g., data collected by processing the biological sample with a sequencing technique, such as bulk RNA-sequencing.
- the non-linear regression models may be trained using simulated RNA expression data, which may be generated according to the techniques described herein, such as by combining RNA expression data for a variety of malignant and/or microenvironment cell types and/or using any of the sampling, rebalancing, and noising techniques described herein.
- TME tumor microenvironment
- immune and non-immune components of the TME participate in tumor survival, maintenance, growth, and development using cell-to-cell contacts and different molecular signals, such as growth factors and cytokines.
- the inventors have recognized that the TME can mediate tumor survival by controlling the immune system of the host, providing immune surveillance of the tumor. The inventors have therefore appreciated that understanding the quantity and functionality of TME components is essential for cancer research and is important for therapy and understanding its clinical impact.
- RNA-seq bulk RNA-sequencing
- TME cellular composition e.g., cell composition percentages
- cell types may be considered as populations of cells having distinguishable expression profiles.
- CD4+ T cells, CD8+ T cells and NK cells tend to share the expression of a substantial amount of structural and regulatory genes, including metabolic, signaling and surface markers.
- RNA expression data can contain both unique marker genes and genes relevant to the cell lineage.
- the inventors have also recognized that the ratio between marker and lineage-specific gene expression may or may not provide information about cell subtypes (for example the ratio of CD4/CD3D genes may be a marker of CD4+ T cells, but CD3D is not a unique marker for subtypes of helper T cells). Since cells of different types, even if they are closely related, can have significantly different impacts on tumor pathogenesis, the inventors have recognized that it nevertheless may be critical to distinguish cell populations even between closely related cell types.
- Another challenge with cellular deconvolution recognized by the inventors is the difficulty of distinguishing between the number of cells and their state.
- the expression of a gene specific or semi-specific to one cell type may vary depending on the activation state of the cells of that type or may differ between subtypes of that type.
- multiple studies can sequence similar cell subtypes, they may be captured in different biological states.
- the inventors have recognized and appreciated that the variability in biological states can play an important role in developing accurate estimate for cell composition percentages.
- the inventors have recognized and appreciated that the tumor microenvironment may make up only a relatively small fraction of the tumor as a whole.
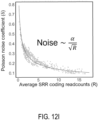
- the identification of small cell populations from bulk RNA-seq data can be especially challenging because of a reduced signal-to-noise ratio.
- the inventors have recognized that identifying changes in small cell populations (e.g., NK-cells) remains important, as even small cell populations can nevertheless have significant impact on response to treatment.
- RNA enrichment method e.g., total RNA-seq (REF), polyA enriched (REF), exome capture or 3' scRNA-seq (REF), for example
- scRNA-seq single cell RNA-seq
- a deconvolution method comprising obtaining expression data (e.g., bulk RNA-seq data) for a biological sample from a subject, and determining a cell composition percentages for one or more cell types (e.g., B cells, CD4+ T cells, CD8+ T cells, endothelial cells, fibroblasts, lymphocytes, macrophages, monocytes, NK cells, neutrophils, and T cells).
- expression data e.g., bulk RNA-seq data
- cell types e.g., B cells, CD4+ T cells, CD8+ T cells, endothelial cells, fibroblasts, lymphocytes, macrophages, monocytes, NK cells, neutrophils, and T cells.
- the cell composition percentage may indicate an estimated percentage of cells of a particular respective type in the biological sample.
- Determining a cell composition percentage for a particular cell type comprises obtaining expression data for a set of genes associated with the cell type (e.g., such as one or more marker genes, which may be specific or semi-specific genes for the particular cell type), and processing that expression data with a non-linear regression model to determine the cell composition percentage for the particular cell type. This process is be repeated or performed in parallel for each of multiple cell types (which may include subtypes of cell types, as described herein) in order to achieve a deconvolution across the multiple cell types. As described herein at least with respect to FIG. 7 , these techniques present a significant improvement over the prior art.
- Machine learning techniques used for determining cell composition percentages include using multiple non-linear regression models, each trained to determine a cell composition percentage for a particular respective cell type.
- the non-linear regression model may have multiple parameters (e.g., thousands, tens of thousands, hundreds of thousands, at least one million, millions, tens of millions, or hundreds of millions of parameters) and training the non-linear regression model may include estimating values of those parameters, computationally from expression data simulated for training.
- generating the simulated training data may include generating many training sets (e.g., at least 25,000, at least 50,000, at least 100,000, at least 150,000, at least 200,000, at least 500,000, etc.) for each non-linear regression model, for each cell type.
- multiple non-linear regression models may be trained respectively for multiple cells types (e.g., at least 5, at least 10, at least 20, at least 30, at least 40, etc.).
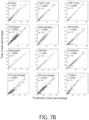
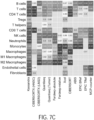
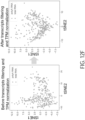
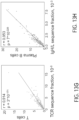
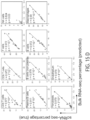
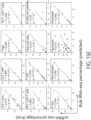
- FIGs. 7C and 7D show that, compared to conventional techniques, the non-linear deconvolution techniques developed by the inventors (e.g., referred to as "Kassandra") result in more accurate predictions of cell composition percentages for different cell types, even in the presence of cancer cell hyperexpression noise (e.g., as shown in FIG.
- the techniques described herein constitute an improvement to bioinformatics generally and, specifically, to supporting clinical decision making and understanding tumor pathogenesis because the techniques described herein provide for improved methods of determining cell composition percentages (e.g., particularly for cell populations in the tumor microenvironment.)
- the machine learning techniques described herein can successfully identify dependencies and interconnections between genes of phenotypically closely related cell types by using expression data associated with genes that are associated (e.g., specific and/or semi-specific) with the particular subtype as input to a non-linear regression model specifically trained for that subtype, allowing for the accurate detection of cell subtypes even with similar expression patterns ( FIGs. 7A , 7B ).
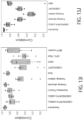
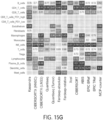
- the non-linear deconvolution techniques described herein are also more robust than prior algorithms, showing more consistent accuracy across a variety of cell types/subtypes, and providing significantly more accurate results than conventional techniques on realistic, noisy data ( FIGs. 7C , 7D , 13F , 15G ).
- these more accurate results enable improved cancer diagnosis and prognosis, as well as personalized treatment options for the patient.
- the expression data may include expression data associated with particular genes associated with the given cell type.
- the expression data includes expression data associated with genes for a given cell type.
- identifying the genes that are associated with a particular cell type may comprise processing expression data from multiple samples, which may be obtained from multiple databases, and/or with a variety of sequencing techniques, to identify genes that are only or predominantly expressed in certain cell types or subtypes.
- the use of expression data associated with particular genes associated with the particular cell types allows the cellular deconvolution techniques developed by the inventors to leverage domain-specific knowledge relating to which genes are expressed by which cell types, contributing to the success of the techniques described herein.
- the architecture employed both in training and using the non-linear deconvolution techniques described herein.
- a separate non-linear regression model is trained and used to estimate cell composition percentages for each respective cell type and/or subtype being analyzed in a biological sample (e.g., as described herein including at least with respect to FIG. 3A ). This may allow for cell types and/or subtypes in the biological sample to be distinguished more accurately (e.g., as shown in FIGs. 7A-7G ).
- the model architecture may include a tiered structure (e.g., as described herein including at least with respect to FIG.
- the model architecture may include multiple sub-models corresponding to multiple stages, in which the output of one or more previous sub-models (which may comprise, for example, initial predictions of one or more cell composition percentages for one or more cell types) may be used as part of the input for a subsequent sub-model.
- This allows the models to develop more accurate predictions by improving upon their initial predictions (e.g., from a first stage of training and/or using the models) in order to provide a more accurate final predictions (e.g., at a second, third, etc. stage of training and/or using the models).
- a tiered structure may be utilized in which outputs from the first sub-model across multiple models for multiple cell types and/or subtypes may be provided as input to subsequent sub-model(s) for each model.
- first sub-model predictions of cell composition percentages for all cell types may be provided as input to the second sub-models (e.g., for other cell types and/or subtypes.)
- second sub-models e.g., for other cell types and/or subtypes.
- the models described herein have been trained with data representing artificial mixtures of cell types, allowing the training process to take into account the diverse and tissue-specific expression of malignant and microenvironment cells across much larger numbers of samples of diverse composition (e.g., simulating a wide variety of tumor microenvironments) than could be practically possible by physically sampling and analyzing tumor samples.
- This substantially reduces the effort and computational resources associated with training the non-linear regression models for cellular deconvolution.
- the artificial mixes described herein can also be obtained in such a way that they replicate technical noise and capture a wide biological variability, improving the ability of a machine learning model trained using this data to identify biologically meaningful signals in the presence of such noise and variability.
- RNA expression data used to develop these artificial mixes was derived from multiple different samples, across multiple cell populations having a variety of biological states. These artificial mixes improve the ability of the non-linear regression models to effectively estimate cell composition percentages across a variety of cell types in real tumor samples.
- the techniques developed by the inventors also include, in an aspect not part of the claimed invention, improved linear techniques for cellular deconvolution.
- one aspect of the linear techniques that contributes to their success is the use of an error function developed by the inventors.
- the error function may be a piecewise, continuous error function. Compared to conventional methods, such as finding a square distance, the piecewise continuous error function accounts for genes that are strongly expressed in tumor cells. This may increase the accuracy for deconvolution of cells in tumor samples.
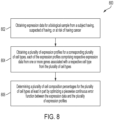
- the use of such an error function allows the techniques developed by the inventors to more accurately model the error associated with predicted cell composition percentages (e.g., as described herein including with respect to FIGs. 8 and 9A ), providing improved results over conventional techniques.
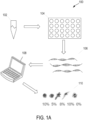
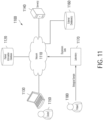
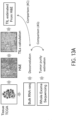
- FIG. 1A depicts a system 100 for determining cell composition percentages 110. As described herein including at least with respect to FIG. 11 , the illustrated system may be implemented in a clinical or laboratory setting.
- the system 100 includes a biological sample 102, which may be, for example, a tumor biopsy obtained for a subject (e.g., a subject having, suspected of having, or at risk of having cancer).
- a subject may be at risk of having cancer, for example, if the subject has a genetic predisposition (e.g., a known genetic mutation or mutations) to cancer or may have been exposed to cancer causing agents.
- the biological sample 102 may be obtained by performing a biopsy, obtaining a blood sample, a salivary sample, or any other suitable biological sample from the patient.
- the biological sample 102 may have been previously obtained from a subject. Thus any step applied to the sample (e.g., obtaining expression data from the biological sample) may be performed in vitro.
- the biological sample 102 may include diseased tissue (e.g., a tumor), and/or healthy tissue.
- the biological sample may be obtained from a physician, hospital, clinic, or other healthcare provider.
- the origin or preparation methods of the biological sample may include any of the embodiments described with respect to the "Biological Samples" section.
- the subject may include any of the embodiments described with the "Subjects" section.
- the system 100 may further include a sequencing platform 104, which may produce sequence information 106.
- the sequencing platform 104 may be a next generation sequencing platform (e.g., IlluminaTM, RocheTM, Ion TorrentTM, etc.), or any high-throughput or massively parallel sequencing platform.
- the sequencing platform 104 may include any suitable sequencing device and/or any sequencing system including one or more devices. In some embodiments, these methods may be automated, in some embodiments, there may be manual intervention.
- the sequence information 106 may be the result of non-next generation sequencing (e.g., Sanger sequencing).
- the sample preparation may be according to manufacturer's protocols.
- the sample preparation may be custom made protocols, or other protocols which are for research, diagnostic, prognostic, and/or clinical purposes.
- the protocols may be experimental.
- the origin or preparation method of the sequence information may be unknown.
- Sequence information 106 can include the sequence data generated by a sequencing protocol (e.g., the series of nucleotides in a nucleic acid molecule identified by next-generation sequencing, sanger sequencing, etc.) as well as information contained therein (e.g., information indicative of source, tissue type, etc.) which may also be considered information that can be inferred or determined from the sequence data. For example, in some embodiments RNA sequence information may be analyzed to determine whether the nucleic acid was primarily polyadenylated or not.
- a sequencing protocol e.g., the series of nucleotides in a nucleic acid molecule identified by next-generation sequencing, sanger sequencing, etc.
- information contained therein e.g., information indicative of source, tissue type, etc.
- RNA sequence information may be analyzed to determine whether the nucleic acid was primarily polyadenylated or not.
- sequence information 106 can include information included in a FASTA file, a description and/or quality scores included in a FASTQ file, an aligned position included in a BAM file, and/or any other suitable information obtained from any suitable file.
- the sequence information 106 may be generated using a nucleic acid from a sample from a subject.
- Reference to a nucleic acid may refer to one or more nucleic acid molecules (e.g., a plurality of nucleic acid molecules).
- the sequence information may be a sequence data indicating a nucleotide sequence of DNA and/or RNA from a previously obtained biological sample of a subject having, suspected of having, or at risk of having a disease.
- the nucleic acid is deoxyribonucleic acid (DNA).
- the nucleic acid is prepared such that the whole genome is present in the nucleic acid.
- the nucleic acid is processed such that only the protein coding regions of the genome remain (e.g., the exome).
- WES whole exome sequencing
- a variety of methods are known in the art to isolate the exome for sequencing, for example, solution based isolation wherein tagged probes are used to hybridize the targeted regions (e.g., exons) which can then be further separated from the other regions (e.g., unbound oligonucleotides). These tagged fragments can then be prepared and sequenced.
- the nucleic acid is ribonucleic acid (RNA).
- sequenced RNA comprises both coding and non-coding transcribed RNA found in a sample.
- total RNA total RNA
- the nucleic acids can be prepared such that the coding RNA (e.g., mRNA) is isolated and used for sequencing. This can be done through any means known in the art, for example by isolating or screening the RNA for polyadenylated sequences. This is sometimes referred to as mRNA-Seq.
- sequence information 106 may include raw DNA or RNA sequence data, DNA exome sequence data (e.g., from whole exome sequencing (WES), DNA genome sequence data (e.g., from whole genome sequencing (WGS)), RNA expression data, gene expression data, bias-corrected gene expression data, or any other suitable type of sequence data comprising data obtained from the sequencing platform 104 and/or comprising data derived from data obtained from sequencing platform 104.
- the origin or preparation of the sequencing information 106 may include any of the embodiments described with respect to the "Expression Data,” "Obtaining RNA expression data,” “Alignment and annotation,” “Removing non-coding transcripts,” and “Conversion to TPM and gene aggregation” sections.
- the sequence information 106 may be processed using computing device 108 in order to determine cell composition percentages 110.
- the sequence information 106 may be processed by one or more software programs running on computing device 108 (e.g., as described herein with respect to FIG. 10 ).
- the sequence information 106 may be processed according to the machine-learning based approach of FIGs. 2A-2C , or the non-linear deconvolution methods described at least with respect to FIGs. 2A-2C and 3A-3C ).
- the sequence information 106 may be processed according to the linear deconvolution methods described at least with respect to FIGs. 8 and 9A-B .
- the computing device 108 may be operated by a user such as a doctor, clinician, researcher, patient, or other individual.
- the user may provide the sequence information 106 as input to the computing device 108 (e.g., by uploading a file), and/or may provide user input specifying processing or other methods to be performed using the sequence information.
- each cell composition percentage may represent an estimated percentage of cells of a particular respective type in the biological sample 102.
- the cell composition percentages are normalized so that the biological sample as a whole represents 100%.
- Cell types may include, for example, B-cells, Plasma B-cells, Non plasma B cells, T cells, CD4+ T-cells, CD8+ T-cells, Treg, T helpers, CD8+ PD1-high, CD8+ PD1-low, NK-cells, monocytes, macrophages, resting tumor associated macrophages (TAM), M1-like or activated macrophages, neutrophils, endothelial cells, and fibroblasts, and/or any other suitable cell types.
- a cell type may comprise one or more subtypes.
- T cells may have subtypes including CD4+ T cells, CD8+ T cells, Tregs, etc.
- the cell composition percentages 110 may include percentages for cell subtypes as well as cell types which are not subtypes of any other cell types. According to some embodiments, the cell composition percentages may include a percentage for an "Other" cell type, which may represent an estimated percentage of cells not accounted for in the other cell composition percentages (e.g., cells of one or more types not explicitly included in the analysis).
- FIG. 1B is an example diagram for determining different cell composition percentages for different cell types and cell subtypes using a non-linear regression model for each respective cell type and cell sub-type, according to some embodiments of the technology described herein.
- a first non-linear regression model, model A 126 may be used to estimate cell composition percentage 128 for cell type A 122, using sequence information 124 associated with cell type A 122.
- a second non-linear regression model, model B 136 may be used to estimate cell composition percentage 138 for cell type B 132, using sequence information 134 associated with cell type B 136.
- cell type A 122 and cell type B 132 are different cell types.
- cell type A 122 may include B-cells, while cell type B 132 may include T cells.
- cell type A and/or cell type B may be any suitable cell type, as aspects of the technology described herein are not limited in that respect.
- sequence information 124 and sequence information 134 may be obtained for cell type A 122 and cell type B 132, respectively.
- sequence information may be associated with a set of genes that is specific and/or semi-specific to the cell type.
- sequence information 124 may be associated with a first set of genes that is specific to cell type A 122
- sequence information 134 may be associated with a second set of genes that is specific to cell type B 132.
- Techniques for identifying genes that are specific and/or semi-specific to a particular cell type and/or subtype may include any of the embodiments described with respect to the "Gene Selection & Specificity" section.
- model A 126 is used to estimate cell composition percentage 128 for cell type A 122
- model B 136 is used to estimate cell composition percentage 138 for cell type B 132.
- each of the models may be trained to estimate cell composition percentages for a specific cell type, as described herein including at least with respect to FIG. 4 .
- cell types may include cell subtypes.
- cell subtypes of close origin may share common genes (e.g., with one another and/or with the cell type from which it was differentiated.)
- cell type B 132 includes subtype A 142 and subtype B 162.
- cell type B 132 may include T cells
- subtype A 142 and subtype B 162 may include subtypes of T cells (e.g., CD4+ and CD8+ T cells).
- a third non-linear regression model, model C 146 may be used to estimate cell composition percentage 148 for subtype A 142, using sequence information 144.
- a fourth non-linear regression model, model D 156 may be used to estimate cell composition percentage 158 for subtype B 162, using sequence information 164.
- sequence information 144 and sequence information 164 may be obtained for subtype A 142 and subtype B 162, respectively. In some embodiments, this may include obtaining sequence information associated with a gene set that includes genes specific and/or semi-specific to the subtype. For example, sequence information 144 may be associated with a first set of genes that is specific to subtype A 142, while sequence information 164 may be associated with a second set of genes that is specific to subtype B 144. Techniques for identifying genes that are specific and/or semi-specific to a particular cell type and/or subtype may include any of the embodiments described with respect to the "Gene Selection & Specificity" section.
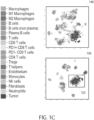
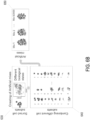
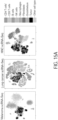
- FIG. 1C is a t-SNE visualization depicting expression data for a plurality of genes for exemplary cell populations including malignant and microenvironment cells.
- the cell types and/or subtypes depicted in the t-SNE plot include macrophages, M1 macrophages, M2 macrophages, B cells, B cells (non-plasma), Plasma B cells, T cells, CD8+ T cells, PD1+ CD8+ T cells, PD1- CD8+ T cells, CD4+ T cells, Tregs, T helpers, endothelium cells, monocytes, NK cells, fibroblasts, neutrophils and tumor cells (e.g., cancer cells).
- Malignant cells may comprise tumor cells, or any other cells associated with disease and/or diseased tissue.
- Microenvironment cells may comprise any non-tumor cells, including, for example, immune cells, skin cells, or any other cells not included in the tumor cells.
- RNA-seq samples which may be collected from biological samples via any of the sequencing techniques described herein.
- the RNA-seq datasets may be combined, homogeneously annotated, and bioinformatically recalculated (e.g., expression values are bioinformatically recalculated) to obtain accurate and comparable measurements of transcript expression.
- RNA-seq data was available for 12,450 sorted samples (e.g., sorted by flow cytometry and magnetic-assisted sorting of cells with beads), which could be subdivided into nineteen cell populations of interest. After the removal of low coverage samples and quality checks, the selected samples were distributed between 10 major cell types and 19 cell subpopulations, listed in Table 1, below.
- the quality control techniques may include any of the embodiments described in the "Data collection, analysis, and preprocessing" section, or any other suitable quality control techniques.
- data derived from cells with abnormal physiological states may be identified (e.g., based on the annotations provided with the data) and excluded.
- T cell samples with phorbol myristate acetate/ionomycin activation and/or induced pluripotent stem cell-derived samples were excluded.
- samples with a low isolation purity, sequencing quality parameters, high contamination from other organisms (e.g., organisms other than the primary organism under investigation), and/or low coverage were also eliminated.
- Table 1 This table specifies the number of samples, the number of datasets, and the average read counts for each of multiple cell types.
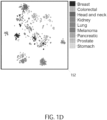
- the cell populations may include tumor cells 152.
- the cancer types may include breast cancer, colorectal cancer, head and neck cancer, kidney cancer, lung cancer, melanoma, pancreatic cancer, prostate cancer, stomach cancer, and/or any other types of cancer.
- some or all of the samples of RNA expression data plotted in FIGs. 1C and 1D may be used as part of selecting specific and/or semi-specific genes for particular cell types/subtypes, as described herein including at least with respect to FIG. 1E .
- some or all of the illustrated samples of RNA expression data may be used as part of generating artificial mixes of RNA expression data, as described herein at least with respect to FIG. 6A .
- 1C and 1D may be derived from public datasets and found using open source databases, such as Gene Expression Omnibus (GEO) and ArrayExpress.
- GEO Gene Expression Omnibus
- ArrayExpress ArrayExpress
- datasets including RNA expression data that is similar to the RNA expression data plotted in FIG. 1C and 1D can be used.
- similar data sets that include some or all of the cell types represented in Table 1, each represented by a plurality of samples from a plurality of datasets as illustrated in Table 1, can be used.
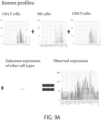
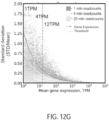
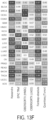
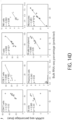
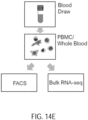
- FIG. 1E is a heatmap depicting exemplary expressions of genes 170 for cell types 160. As shown, the vertical axis represents the cell types 160, and the horizontal axis represents the expression of genes 170 in transcripts per million (TPM). Each row in the heat map represents a single RNA-seq sample. As described herein, some genes may be considered specific to certain cell types. For example, as shown in the heatmap of FIG. 1F , the selected genes 190 may be correlated with the RNA percentage in corresponding sorted cell populations 180. For example, as shown in the heatmap of FIG.1G , the selected genes 192 may have limited or no expression for tumor cell lines 182.
- Table 2 specifies, for each of multiple cell types, a set of genes which may be considered specific or semi-specific to that cell type, and/or which may be used for the deconvolution techniques described herein.
- the cellular deconvolution techniques developed by the inventors may involve using only certain gene expression data in order to determine cell composition percentages for a particular cell type.
- only expression data of specific and/or semi-specific genes for the particular cell type may be used, as described herein including at least with respect to FIGs. 2A-2C .
- genes which are highly expressed in malignant cells e.g., cancer cell lines
- may be excluded e.g., specific to tumor cells
- the specific and/or semi-specific genes for a particular cell type e.g., non-malignant cell types
- selecting specific and/or semi-specific genes for a particular cell type may comprise performing any or all of the following techniques: literature analysis, fold change analysis with statistical Kruskal-Wallis test (nonparametric ANOVA analogue), Conover-Iman test (nonparametric pairwise test for multiple comparisons), and/or correlation analysis using the RNA-seq data from FIGs. 1C-1D .
- gene sets may be collected from various sources. In some embodiments, only genes with a known function may be used. Some genes may be similar to the labels used in CYTOF, some may be taken from literature data (which may demonstrate the specificity of certain genes), and/or some genes may be found on existing RNA-seq samples of sorted cells (e.g., after filtering experimental conditions, sequencing quality, and quality by expressions). The search for genes in samples may be carried out in several ways: using differential gene expression, using correlations of gene expression with the proportion of cells in artificial mixes (e.g., as described herein including at least with respect to FIG.
- a gene may be considered “specific” to a particular cell type or subtype if it is only expressed in the particular cell type or cell subtype.
- a gene may be considered “semi-specific” to a particular cell type or subtype when: (1) it is expressed both in the particular cell type or subtype and in one or more other cell types or subtypes; and (2) it is expressed to a greater degree in the particular cell type or subtype than in the other cell type(s) or subtype(s).
- a gene may be considered semi-specific for a particular cell type or subtype if the average expression of the gene in the particular cell type or sub-type is at least a threshold percentage (e.g., 50%, 100%, 200%, 500%, 1000%, etc.) or threshold factor (e.g., a factor of 2, 5, 10, 15, 20, etc.) higher than the average expression of the same gene in the other cell types or sub-types.
- a gene may be considered semi-specific for a particular cell type or subtype if the average expression of the gene in the cell type or subtype is at least ten times higher than the average expression of the gene in the other cell types or subtypes.
- the common genes may be considered semi-specific to the cell types and/or subtypes (e.g., semi-specific to both CD4+ T cells and CD8+ T cells.)
- genes may be selected because their expression is significantly lower or absent in malignant cell (e.g., tumor) lines.
- the specificity criterion can be evaluated when assessed on combined expression data from a plurality of datasets, as described above. In some embodiments, if several types of cells are present in the same dataset, then for each such dataset, a similar specificity analysis may also be carried out inside the datasets to control batch effects.
- TCGA Cancer Genome Atlas
- analysis may be performed to determine how these genes are expressed in TCGA (The Cancer Genome Atlas) for the desired type of tumor. For example, for a given cell type, it may be desirable that the ratios of the average TCGA expression to the average expression lie within a comparable range. In other words, if the average expression of a specific or semi-specific gene (e.g., in a specific or semi-specific set of genes) in TCGA is 70% of the average expression in the samples of the sorted cells, while the other gene expressions of this set are around 5%, then the specific or semi-specific gene is likely expressed by a tumor or other cells, or the cells in the tumor differ greatly in the expression of this gene.
- TCGA Cancer Genome Atlas
- the expression of genes from the same set may be desirable for the expression of genes from the same set to correlate with one another among the TCGA samples for this type of tumor (e.g., the desired type of tumor, above.)
- the mean among the correlations with the other genes from the set may be analyzed.
- the characteristic values of the expression of the considered genes in TCGA LUAD may be low (e.g., less than 10 TPM), so the correlations of these genes with each other may also be low (e.g., due to insufficient sequencing depth). In some cases, there may be especially low gene expressions of NK cells and neutrophils.
- hematopoietic immune cells express CD45 (PTPRC) and HCLS1. Due to their development, immune cells can be divided into lymphocytes and myeloid cells. In turn, lymphocytes can be divided into T, B, NK cells, then CD4+ and CD8+ T cells can be distinguished from among T cells. But among these cells, there are also subtypes that can play an important role both in the development of tumors and in the course of treatment. Therefore, as described herein, it may be desirable for cell composition percentages to be determined for subtypes of certain cells.
- RNA expression data may be difficult, since fewer specific and/or semi-specific genes may be expressed in cell subtypes, and the number of such cells in the tumor microenvironment may be smaller than the combined groups of cells.
- one way to improve the accuracy of determining both cell types and subtypes may be to use information on the expression of genes specific and/or semi-specific for the combined group of cells (e.g., including cell types and cell subtypes that share common genes) in determining cell composition percentages for the cell subtypes.
- genes specific and/or semi-specific for the combined group of cells e.g., including cell types and cell subtypes that share common genes
- Such common genes can be used when determining cell composition percentages of individual cell types and subtypes, for example.
- Another way to use genes common to a group of cell subtypes may be to initially calculate a cell composition percentage for the combined group, then refine that calculation in order to determine cell composition percentages for individual cell types in the group, as described elsewhere herein.
- Table 2 This table specifies, for each of multiple cell types, the list of genes which may be considered specific or semi-specific to that cell type.
- these expression levels are used by the machine learning deconvolution techniques developed by the inventors.
- Exemplary NCBI Accession Numbers for genes mentioned herein are shown in Table 11 below.
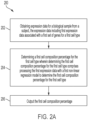
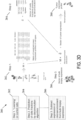
- FIG. 2A is a flowchart depicting a method 200 for determining a cell composition percentage for at least one cell type.
- the method 200 may be carried out on a computing device (e.g., as described herein including at least with respect to FIG. 10 ).
- the computing device may include at least one processor, and at least one non-transitory storage medium storing processor-executable instructions which, when executed, perform the acts of method 200.
- the method 200 may be carried out, for example, in a system such as system 100 (which may include, for example, a clinical setting or a laboratory setting), by one or more computing devices such as by computing device 108.
- the method 200 begins with obtaining expression data for a biological sample from a subject.
- Obtaining expression data includes obtaining expression data from a biological sample that has been previously obtained from a subject using any suitable techniques.
- obtaining the expression data may include obtaining expression data that has been previously obtained from a biological sample (e.g., obtaining the expression data by accessing a database.)
- the expression data is RNA expression data. Examples of RNA expression data are provided herein.
- the subject may have, be suspected of having, or be at risk of having cancer. As described herein including with respect to FIG.
- the biological sample may comprise a biopsy (e.g., of a tumor or other diseased tissue of the subject), any of the embodiments described herein including with respect to the "Biological Samples" section, or any other suitable type of biological sample.
- the origin or preparation of the expression data may include any of the embodiments described with respect to the "Expression Data” and "Obtaining RNA expression data” sections.
- the expression data may be RNA expression data extracted using any suitable techniques.
- the expression data obtained at act 202 may comprise RNA expression data measured in TPM.
- the expression data may be stored on at least one storage medium and accessed as part of act 202.
- the expression data may be stored in one or more files or in a database, then read.
- the at least one storage medium storing the RNA expression data may be local to the computing device (e.g., stored on the same at least one non-transitory storage medium), or may be external to the computing device (e.g., stored in a remote database or a cloud storage environment).
- the expression data may be stored on a single storage medium or may be distributed across multiple storage mediums.
- the expression data of act 202 includes first expression data associated with a first set of genes associated with a first cell type (e.g., a cell type of the cell types and/or subtypes being analyzed in the biological sample).
- the first set of genes may comprise genes that are specific and/or semi-specific to the first cell type, as described herein at least with respect to FIG. 1E .
- the set of genes may comprise: ANGPT2, APLN, CDH5, CLEC14A, ECSCR, EMCN, ENG, ESAM, ESM1, FLT1, HHIP, KDR, MMRN1, MMRN2, NOS3, PECAM1, PTPRB, RASIP1, ROBO4, SELE, TEK, TIE1, and/or VWF.
- the first set of genes may be the same as a set of genes, or a subset of a set of genes, used as part of training a corresponding non-linear regression model for the cell type, as described herein including at least with respect to FIGs. 4-6 .
- determining a first cell composition percentage for the first cell type comprises processing first expression data associated with a first set of genes for the first cell type with a first non-linear regression model (e.g., of the one or more non-linear regression models) to determine the first cell composition percentage for the first cell type.
- the first expression data may be provided as input to the first non-linear regression model.
- other information may be provided as part of the input to the non-linear regression model.
- a median of the expression data may be included as part of the input to the non-linear regression model.
- any other suitable information may additionally or alternatively be provided as part of the input (e.g., an average of the expression data, a median or average of a subset of the expression data, or any other suitable statistics derived from or otherwise relating to the expression data).
- parts of act 204 may be repeated and/or performed in parallel for each cell type and/or subtype being analyzed.
- a subset of the expression data may be provided as input to each non-linear regression model for each respective cell type and/or subtype.
- the output of the non-linear regression model may comprise information representing an estimated percentage of RNA from the first cell type in the sample.
- the estimate percentage of RNA from the first cell type may be used to calculate a corresponding cell composition percentage for the first cell type.
- the techniques described herein including at least with respect to FIG. 3C may be applied as part of processing the non-linear regression model, such that the output of the non-linear regression model may be an estimated cell composition percentage for the first cell type rather than an estimated percentage of RNA.
- process 200 then proceeds to act 206 for outputting the first cell composition percentage.
- the output(s) of the one or more non-linear regression models may be combined, stored, or otherwise post-processed as part of method 200.
- the cell composition percentages for each cell type may be stored locally on the computing device used to perform method 200 (e.g., on the non-transitory storage medium).
- the cell composition percentages may be stored in one or more external storage mediums (e.g., such as a remote database or cloud storage environment).
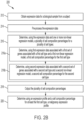
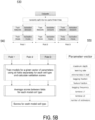
- FIG. 2B is an example implementation of method 200 for determining a cell composition percentage based on expression data.
- implementing method 200 may include any suitable combination of acts included in the example flowchart of FIG. 2B .
- implementing method 200 may include additional or alternative steps that are not shown in FIG. 2B .
- executing method 200 may include every act included in the example flowchart.
- method 200 may include only a subset of the acts included in the example flowchart (e.g., acts 212 and 216, acts 212, 214, 216, and 218, acts 212, 216, and 220, etc.).
- the example implementation 220 begins at act 212, where expression data is obtained for a biological sample previously obtained from a subject. Obtaining expression data for a biological sample from a subject is described herein above including with respect to act 202 of FIG. 2A .
- act 212 may include obtaining first expression data and second expression data.
- the first expression data may be associated with a first set of genes that is associated with a first cell type, while the second expression data may be associated with a second set of genes that is associated with a second cell type.
- the first expression data may be associated with a first set of genes that is associated with B cells, while the second expression data may be associated with a second set of genes that is associated with T cells.
- the first expression data may be associated with a first set of genes associated with a first cell subtype, while the second expression data may be associated with a second set of genes associated with a second cell subtype.
- the first expression data may be associated with a first set of genes associated with CD4+ cells, while the second expression data may be associated with a second set of genes associated with CD8+ cells.
- Techniques for identifying genes associated with different cell type and/or subtypes are described herein including with respect to the "Gene Selection & Specificity" section.
- the example method 220 proceeds to act 214, where the expression data is pre-processed.
- the pre-processing may make the expression data suitable to be processed using the one or more non-linear regression models.
- the expression data may be sorted, combined, organized into batches, filtered, or pre-processed with any other suitable techniques.
- techniques for processing the expression data may include any of the embodiments described with respect to the "Alignment and annotation," “Removing non-coding transcripts,” and "Conversion to TPM and gene aggregation" sections.
- example method 220 proceeds to act 216, where a plurality of cell composition percentages is determined for a plurality of cell types using the expression data and one or more non-linear regression models (e.g., at least five, at least ten, at least fifteen, models.)
- each non-linear regression model may be trained according to the techniques described herein including at least with respect to FIGs. 4-6 .
- act 216 may includes act 216 a and act 216 b , each of which includes using a separate non-linear regression model trained for determining cell composition percentages for the first and second cell types and/or subtypes, respectively.
- Act 216 a includes determining a first cell composition percentage for the first cell type using the first expression data and a first non-linear regression model.
- Act 216 b includes determining a second cell composition percentage for the second cell type using the second expression data and a second non-linear regression model.
- act 216 may include only one of acts 216 a and 216 b .
- Act 216 includes using one or more additional non-linear regression models for determining cell composition percentages for one or more other cell types (e.g., a third cell type or subtype).
- An example implementation of act 216 a is described herein including with respect to FIG. 2C .
- example method 220 proceeds to act 218 for outputting the plurality of cell composition percentages.
- the plurality of cell composition percentages may be output through a graphical user interface, saved to memory, transmitted to one or more other computing devices and/or output in any other suitable way.
- techniques may be used to post-process the plurality of cell composition percentages output at act 218 and/or the expression data obtained at act 212.
- post-processing techniques may include using the cell composition percentages and expression data to determine a malignancy expression profile for the biological sample at act 220.
- a malignancy expression profile may include information indicative of the expression of malignant cells included in the biological sample. For example, this may include the expression of different genes associated with the malignant cells.
- determining the malignancy expression profile may include (a) estimating the expression profile for TME cells in the biological sample and (b) subtracting the expression of the TME cells from the total expression (e.g., bulk expression data, expression data obtained at act 212, etc.) of the biological sample.
- An example method for determining a malignancy expression profile is described herein including with respect to FIG. 3D .
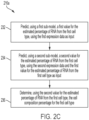
- FIG. 2C shows an example implementation of act 216 a for determining, using the first expression data and the first non-linear regression model, a first cell composition percentage for the first cell type.
- the first non-linear regression model may include a first sub-model and/or a second sub-model for processing the first expression data (e.g., as shown in FIG. 3C ).
- the first expression data may include first expression data associated with a first set of genes associated with the first cell type, as well as second expression data associated with a second set of genes associated with the first cell type.
- the example implementation begins at act 232, for predicting a first value for the estimated percentage of RNA from the first cell type, using a first sub-model.
- the first expression data associated with the first set of genes and/or any other input information may be provided as input to the first sub-model of the non-linear regression model, and the output may be a predicted percentage of RNA from the first cell type.
- the example implementation proceeds to act 234, for predicting a second value for the estimated percentage of RNA from the first cell type, using a second sub-model.
- the second expression data associated with the second set of genes may be provided as input to the second sub-model of the non-linear expression model in addition to the prediction from the first sub-model and/or any other input information provided at the first sub-model. Additionally or alternatively, the first expression data associated with the first set of genes may be provided as input to the second sub-model.
- predictions from multiple non-linear regression models may be provided as input to the second sub-model of the non-linear regression model for the first cell type.
- the output of the second sub-model of the non-linear regression model may be an estimated percentage of RNA from the first cell type in the sample.
- the output of the second sub-model may comprise the output of the non-linear regression model for the first cell type, in some embodiments.
- the non-linear regression model may comprise more than two sub-models.
- the second sub-model may be repeated any number of times, with the predictions from one or more of the prior sub-models being included as input each time.
- determining the estimated percentage of RNA from the first cell type may include (a) estimating the number of cells of the first type included in the biological sample and (b) estimating the total number of cells included in the biological sample (e.g., using equation 350.) Estimating the number of cells of the first type may include comparing the estimated percentage of RNA (e.g., R cell of equation 350) to an RNA per cell coefficient (e.g., A cell of equation 350.) Estimating the total number of cells may include estimating the number of cells of each cell type, then summing those values. Techniques for estimating cell composition percentages are described herein including with respect to FIG. 3C .
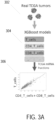
- FIG. 3A is a diagram depicting an illustrative use of a machine learning method for determining RNA percentages based on RNA expression data.
- RNA expression data from primary tumor samples 302 available on the TCGA database is processed according to the machine learning techniques described herein including at least with respect to FIGs. 2A-2C , in order to arrive at corresponding estimated RNA percentages 306 for T cells, CD4+ T cells, CD8+ T cells.
- the RNA expression data for the tumor samples 302 is obtained from an online database of RNA expression data (e.g., from The Cancer Genome Atlas (TCGA) database, in this example).
- TCGA Cancer Genome Atlas
- the RNA expression data may be obtained from any suitable source, including one or more databases such as TCGA, or directly from a biological sample (e.g., as described herein including at least with respect to FIG. 1A ).
- the RNA expression data may be processed using non-linear regression models 304.
- the non-linear regression models 304 may be implemented using a gradient boosting technique (e.g., as implemented in XGBoost) as described herein including at least with respect to FIGs. 4-6 .
- non-linear regression models 304 comprise separate non-linear regression model for each of multiple cell types.
- the non-linear regression models 304 include a non-linear regression model for T cells, a non-linear regression model for CD4+ T cells, and a non-linear regression model for CD8+ T cells.
- additional non-linear regression models for one or more additional cell types and/or subtypes may be provided, in some embodiments.
- the input to the non-linear regression models 304 may comprise a select subset of the RNA expression data for each non-linear regression model.
- the input to a non-linear regression model for a particular cell type may comprise RNA expression data for specific and/or semi-specific genes for that cell type.
- the non-linear regression model for T cells may take as input RNA expression data for genes: CAMK4, CBLB, CD2, CD226, CD3D, CD3E, CD3G, CD48, CD5, CD6, CD7, FLT3LG, ITK, KCNA3, KLRB1, LAG3, LAT, LCK, LTA, SIRPG, SIT1, SLA2, TBX21, TCF7, TESPA1, TRAC, TRAF3IP3, TRAT1, TRBC2, TRDC, TRGC1, TRGC2, UBASH3A, ZBED2.
- other information about the RNA expression data e.g., a median of the RNA expression data, or any other suitable statistics
- the output of non-linear regression models 304 may be RNA percentages 306 for respective cell types and/or subtypes.
- the non-linear regression model for T cells may produce as its output a predicted percentage of RNA from T cells in the input RNA expression data.
- the non-linear regression model for CD 4 T cells may produce as its output a predicted percentage of RNA from CD 4 T cells
- the non-linear regression model for CD 8 T cells may produce as its output a predicted percentage of RNA from CD 8 T cells.
- the predicted percentages of RNA may be used to calculate corresponding cell composition percentages for some or all of the cell types and/or subtypes being analyzed.
- the sum of the predictions for the subtypes may or may not be equal to the prediction for the type comprising those subtypes.
- the sum of predictions for CD 4 T cells and CD 8 T cells may exceed the prediction for T cells, or the sum of predictions for CD 4 T cells and CD 8 T cells may be lower than the prediction for T cells.
- the sum of the subtype predictions may be equal to the total type prediction, and/or the subtype predictions may be normalized or adjusted so that their sum is equal to the total type prediction.
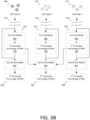
- FIG. 3B is a diagram depicting use of non-linear regression models 320, 322, 324 comprising first sub-models 326, 328, 330 and second sub-models 338, 340, 342 for determining RNA percentages based on RNA expression data.
- each example non-linear regression model includes a first sub-model 326, 328, 330, for generating a first value 332, 334, 336 for the estimated percentage of RNA from each cell type, and a second sub-model 338, 340, 342 for generating a second value 344, 346, 348 for the estimated percentage of RNA from each cell type.
- expression data 316 may be obtained from a set of genes associated with cell type B 310 and used as input to the non-linear regression model 322.
- cell type B 310 may include immune cells and the expression data 316 may include expression data for the genes ADAP2, ADGRE3, ADGRG3, C1QA, C1QC, and C3AR1 (e.g., from the gene set associated with immune cells listed in Table 2.)
- at least some of the expression data 316 e.g., expression data associated with a subset of genes, expression data associated with all the genes, etc.
- the first sub-model may then process the input expression data to determine a first value 334 of the estimated percentage of RNA from cell type B 310.
- the example non-linear regression model 322 may include a second sub-model 340 to generate a second value 346 of the estimated percentage of RNA from cell type B 310.
- the second sub-model 340 may use one or more inputs to generate the second value 340.
- at least some of the expression data 316 may be used as input.
- the expression data may include the same expression data input to the first sub-model 328 (e.g., expression data for the genes ADAP2, ADGRE3, and ADGRG3.) In some embodiments, the expression data may include the same expression data input to the first sub-model, as well as additional expression data (e.g., expression data for the genes ADAP2, ADGRE3, ADGRG3, C1QA, and C3AR1.) In some embodiments, the expression data may include expression data different from the expression data input to the first sub-model (e.g., expression data for the genes C1QA, C1QC, and C3AR1.)
- the second sub-model 340 may take as input estimate percentages of RNA output by the first sub-models 326, 330 of non-linear regression models 320, 324 for other cell types 308, 312.
- the second sub-model 340 for cell type B 310 takes as input the first value 332 for the estimate percentage of RNA from cell type A 308 and the first value 336 for the estimate percentage of RNA from cell type C 312. This type of input may be informative when trying to determine the percentage of RNA from a cell type that is associated with a same gene or same set of genes as another cell type(s).
- the first sub-model 330 outputs 0% as the first value 336 of the estimated percentage of RNA determined for cell type C. This indicates that there are no cells of cell type C 312 in the biological sample. As a result, any expression data obtained for gene X must have been expressed by cell type B 310.
- the second sub-model 340 can use the first values 332, 336 to make such inferences.
- the output of the second sub-model 340 is a second value 346 for the estimated percentage of RNA from cell type B 310.
- the estimated RNA percentages may be processed to determine cell composition percentages for each of the cell types.
- FIG. 3C is a diagram depicting a method for determining cell composition percentages 370 based on RNA percentages 360.
- the method of FIG. 3C may be applied to RNA percentages predicted according to the techniques described herein including with respect to FIGs. 2 and 3A , in order to arrive at predictions for cell composition percentages for some or all of the cell types and/or subtypes being analyzed.
- obtaining cell composition percentages based on RNA percentages may comprise applying equation 350 to the RNA percentages for each cell type.
- equation 350 may be applied independently to each RNA percentage (e.g., in sequence), or may be applied to some or all of the RNA percentages together (e.g., in parallel) in some embodiments.
- equation 350 may be applied initially to RNA percentages for cell types which are not subsets of one another.
- equation 350 may subsequently be applied to RNA percentages for cell types that are a subtype of one or more initially used cell types.
- the calculation of cell composition percentages for cell subtypes may be modified based on the initially calculated cell composition percentages. For example, in some embodiments, subsequently calculated cell composition percentages for cell subtypes may be normalized or otherwise adjusted such that they sum to the cell composition percentage for the total cell type (i.e., the initially-calculated cell type of which they are subtypes).
- the denominator may comprise a sum over all cell types and/or subtypes being analyzed ( cells ) .
- the expression R cell A cell may be initially computed for all cell types and/or subtypes, then used to compute individual C cell values for each cell type and/or subtype.
- an RNA percentage for a cell type may be represented as a fraction or decimal (e.g., for purposes of calculation with equation 350).
- an R other expression may be introduced, which may be equal to 1 - ⁇ cells R cell .
- equation 350 includes an RNA per cell coefficient A cell , which may represent an RNA concentration per cell.
- the inventors have recognized and appreciated that the abundance of RNA per cell may depend on the cellular size and/or other factors. As such, different cell types may contribute a different amount of RNA to the bulk sample.
- the RNA per cell coefficient can be used to allow the conversion of RNA percentages to corresponding cell composition percentages.
- the RNA per cell coefficient A cell may be determined as part of a model training process (e.g., from simulated or artificial data with known percentages of the different cell types.) In some embodiments, the RNA per cell coefficient A cell may be determined experimentally for some or all cell types.
- RNA per cell coefficients may be obtained by accessing data relating to RNA expression for each cell type (e.g., from available scientific literature, such as PMID: 29130882, PMID: 30726743, or estimated from single cell data, using average or nonlinearly transformed UMI count per cell type) and using that data to determine a corresponding RNA per cell coefficient (e.g., by analyzing purity and/or histological TCGA lymphocyte data, for example) for each cell type.
- data relating to RNA expression for each cell type e.g., from available scientific literature, such as PMID: 29130882, PMID: 30726743, or estimated from single cell data, using average or nonlinearly transformed UMI count per cell type
- a RNA per cell coefficient e.g., by analyzing purity and/or histological TCGA lymphocyte data, for example
- the RNA per cell coefficients may be tissue specific, and could vary based on the disease being analyzed (e.g., from cancer to cancer). In some embodiments, the RNA per cell coefficient may be tissue agnostic, and may not vary based on a disease being analyzed (e.g., because non-malignant microenvironment cells may be represented by the same or substantially similar cellular phenotypes even across different cancers, tissues, or diseases). In the latter case, data from multiple types of cancers, tissues, diseases, etc. may be combined in order to calculate the RNA per cell coefficients. For example, in some embodiments, more than 10,000 different cancer tissues samples from TCGA were analyzed as part of determining RNA per cell coefficients for cell types.
- determining RNA per cell coefficients may comprise aligning non-malignant cell composition percentages obtained from RNA to cell composition percentages obtained from DNA in order to develop coefficients for RNA per cell type.
- RNA-seq data some embodiments of the technology described herein may be applied to microarray data.
- the expression values may be normalized to lie in a range similar to the values of the transcripts per million (TPM) for RNA-seq (for example, make the sum of the expressions be 1 million) and optionally use a linear scale.
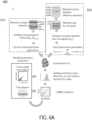
- FIG. 3D is a diagram depicting an example method 380 for determining malignancy expression profiles based on cell composition percentages, according to some embodiments of the technology described herein. This may include obtaining a biological sample (e.g., a biopsy) and determining the expression (e.g., the expression of individual genes) of malignant cells included in the biological sample. In some embodiments, this may include removing the expression of TME cells from the overall expression of the biological sample (e.g., bulk biopsy expression).
- a biological sample e.g., a biopsy
- the expression e.g., the expression of individual genes
- the example method includes three steps.
- the first step 382 includes determining mean expression profiles of different, non-malignant cell types.
- this may include using expression data from sorted cell types.
- this may include obtaining and using RNA-seq data from T cells, B cells, macrophages, fibroblasts, and any other suitable cell type that may be included in a TME.
- the cell types may exclude tumor (e.g., malignant) cells.
- a mean expression profile may include the mean expression of a set of genes for each cell type.
- the example method then proceeds to the second step 384 for predicting the cell composition fractions using cellular deconvolution techniques.
- the cell composition fractions may be indicative of the fraction of each cell type in a biological sample (e.g., a biopsy.) As shown, this may include generating a vector of cell composition fractions.
- cellular deconvolution techniques may include any of the embodiments described herein, including with respect to FIGs. 1-3C .
- the mean expression profiles of different cell types included in the TME may be used to estimate the expression of each cell type in the biological sample.
- the third step 386 may include determining the product of the matrix of expression profiles and the vector of cell fractions. The resulting vector is an estimate expression profile of the TME cells in the biological sample.
- determining the tumor expression profile may include subtracting the TME expression profile from the bulk expression of the biological sample (e.g., the bulk biopsy expression). As shown, this may include subtracting the vector generated for the expression profile of the TME cells from the vector of bulk expression.
- FIG. 4 is a flowchart depicting a method 400 for training one or more non-linear regression models to determine cell composition percentages based on RNA expression data.
- the method 400 may comprise training one or more non-linear regression models (e.g., at least five, at least ten, at least fifteen non-linear regression models) to estimate cell composition percentages for a corresponding one or more cell types in a biological sample.
- a separate non-linear regression model is trained for each cell type and/or subtype, such that each non-linear regression model is trained to estimate cell composition percentages for a particular cell type in the biological sample.
- the method 400 may be carried out on a computing device (e.g., as described herein including at least with respect to FIG. 10 ).
- the computing device may include at least one processor, and at least one non-transitory storage medium storing processor-executable instructions which, when executed, perform the acts of method 400.
- the method 400 may begin with obtaining training data comprising simulated RNA expression data.
- the "simulated" RNA expression data may include RNA expression data that is generated partially in silico.
- the simulated RNA expression data may include data that was obtained by sampling reads from multiple expression data sets from purified cell type samples.
- the RNA expression data may comprise expression data measured in TPM.
- the RNA expression data includes first RNA expression data for first genes associated with a first cell type and second RNA expression data for second genes associated with a second cell type.
- the first genes may be, for example, the specific and/or semi-specific genes for the first cell type, while the second genes may be specific and/or semi-specific genes for the second cell type.
- the training data may comprise RNA expression data of genes associated with each cell type and/or subtype being analyzed, and/or other cell types.
- the training data may be generated as part of act 402.
- the simulated RNA expression data may be generated by combining RNA expression data from malignant cells (e.g., cancer cells) with RNA expression data from microenvironment cells (e.g., immune cells, skin cells, etc.) to produce a plurality of simulated RNA mixtures (which may be referred to herein as "artificial mixtures" or "mixes") for training.
- RNA mixtures which may be referred to herein as "artificial mixtures" or "mixes”
- at least a thousand, at least ten thousand, at least one hundred thousand, or at least one million mixes may be generated and/or accessed as part of act 402.
- the training data may be obtained in any suitable manner at act 402.
- the training data may be stored on at least one storage medium (e.g., in one or more files, or in a database).
- the at least one storage medium storing the training data may be local to the computing device (e.g., stored on the same at least one non-transitory storage medium), or may be external to the computing device (e.g., stored in a remote database or a cloud storage environment).
- the training data may be stored on a single storage medium, or may be distributed across multiple storage mediums.
- act 402 may further comprise pre-processing the training data in any suitable manner.
- the training data may be sorted, combined, organized into batches, filtered, or pre-processed with any other suitable techniques.
- the pre-processing may make the training data suitable to be processed using the one or more non-linear regression models, for example.
- the training data may be split into separate training, validation, and holdout datasets, as described herein including at least with respect to FIG. 5A .
- acts 404 to 408 the method 400 may proceed with training the one or more non-linear regression models using the training data.
- acts 404 to 408 describe training a first model of the non-linear regression models to estimate cell composition percentages for a corresponding first cell type.
- Acts 404 and 406 may be referred to herein as a training step.
- each model of the non-linear regression models may be trained at least in part separately for each cell type (e.g., with corresponding different input data, and different learned parameters, for each non-linear regression model).
- each non-linear regression model of the one or more non-linear regression models may be trained, mutatis mutandis, according to the techniques described herein including with respect to acts 404 to 406, and/or stored according to act 408.
- training the first model of the non-linear regression models may proceed with generating an estimated percentage of RNA for the first cell type, using the first model and the first RNA expression data.
- the first RNA expression data may comprise first genes associated with the first cell type (e.g., only specific and/or semi-specific genes for the first cell type).
- the first RNA expression data may be provided as input to the first model.
- other input may additionally or alternatively be provided to the first model. For example, a median, average, or any other suitable information relating the some or all of the RNA expression data may be provided as part of the input to the first model.
- training the first model of the non-linear regression models may proceed with updating parameters using the estimated percentage of RNA from the first cell type.
- the estimated percentage of RNA from the first cell type may be compared to a known value for the percentage of RNA from the first cell type as part of act 406.
- a loss function may be applied to the estimated value and the known value in order to determine a loss associated with the estimated value.
- the loss may be used to update the parameters of the model.
- a gradient descent, or any other suitable optimization technique may be applied in order to update the parameters of the model so as to minimize the loss.
- the first model may process its input using any suitable techniques, including non-linear regression techniques, as described herein.
- the first model may use a gradient boosting machine learning technique.
- the first model may comprise an ensemble of weak prediction models, such as decision trees, or any other suitable prediction models, which may be combined in an iterative fashion using a gradient boosting algorithm.
- a gradient boosting framework such as XGBoost or LightGBM may be used as part of training the first model.
- a random forest model may be used as part of training the first model.
- acts 404 to 406 may be repeated multiple times (e.g., at least one hundred, at least one thousand, at least ten thousand, at least one hundred thousand, or at least one million times). In some embodiments, acts 404 to 406 may be repeated for a set number of iterations, or may be repeated until a threshold is surpassed (e.g., until loss decreases below a threshold value). In some embodiments, the non-linear regression models may be trained in two or more stages, as described herein including at least with respect to FIG. 5A .
- the method 400 may proceed with outputting the trained plurality of non-linear regression models including the first non-linear regression model and the second non-linear regression model.
- outputting the trained plurality of non-linear regression models may comprise: storing one or more of the models in at least one non-transitory computer-readable storage medium (e.g., memory) for subsequent access, providing the model(s) to a recipient (e.g., transmitting data associated with the model(s) to a recipient using any suitable communication network or other means), displaying information associate with the model(s) to a user via a graphical user interface, and/or any other suitable manner of outputting the trained models, as aspects of the technology described herein are not limited in this respect.
- FIG. 5A depicts an exemplary method 500 for training one or more non-linear regression models, according to the techniques developed by the inventors.
- the illustrated techniques may be used in conjunction with any of the other techniques described herein, including at least with respect to FIGs. 2 and 4 .
- the method 500 may begin at act 502 with preparing one or more datasets for training.
- the datasets may be generated (e.g., according to the techniques described herein including at least with respect to FIG. 6A ) and/or accessed (e.g., from one or more databases) as part of act 502.
- the datasets may comprise a plurality of artificial mixes of RNA expression data, which may comprise RNA expression data from a variety of malignant (e.g., tumor) and/or microenvironment cells.
- the datasets may comprise at least one thousand, at least ten thousand, at least one hundred thousand, or at least one million artificial mixes.
- the datasets may be separated into training datasets and holdout datasets.
- the datasets may be separated into the training and holdout datasets at random in some embodiments, with a set percentage of the datasets to be used for training and holdout, respectively. For instance, in the illustrated example, 80% of the datasets are used as training datasets, while the remaining 20% are retained as holdout datasets.
- the holdout datasets may be used to develop quality metrics (e.g., as described herein including at least with respect to FIG. 7B ). In some embodiments, there may be no holdout datasets, such that all the datasets may be used for training. As shown in the figure at act 502, the training datasets may be further subdivided into one or more (e.g., ten) folds each containing a respective training and validation set. According to some embodiments, the training datasets may be divided into folds at random. In some embodiments, cross-fold validation may be performed as part of training.
- each non-linear regression model may be trained to estimate, based on input RNA expression data, a corresponding percentage of RNA from a particular cell type.
- the non-linear regression models may be trained in two stages, the first stage corresponding to training a first sub-model of the non-linear regression model, the second stage corresponding to training a second sub-model of the non-linear regression model.
- the first sub-model of each non-linear regression model may be trained to generate an initial prediction for the percentage of RNA from its respective cell type.
- the input may comprise RNA expression data of specific and/or semi-specific genes for the corresponding cell type.
- only the RNA expression data of the specific and/or semi-specific genes for the cell type may be provided as input.
- other information such as a median of the expression data, may be provided.
- the output of the first stage may be initial predictions for the percentages of RNA from each cell type, with each first sub-model of each non-linear regression model providing a prediction for its respective cell type.
- the second sub-model of each non-linear regression model may be trained to generate a second prediction for the percentage of RNA from its respective cell type.
- the input may comprise RNA expression data of specific and/or semi-specific genes for the corresponding cell type, and the predictions from the first stage.
- the RNA expression data used at the second stage may be different from the RNA expression data used at the first stage.
- some or all of the training data may be regenerated (e.g., according to the techniques described herein including with respect to FIGs. 5B and 6 ) for the purposes of training the non-linear regression models in the second stage.
- the training data for the first stage and the second stage may be generated in parallel (e.g., at the same time) but independently, such that the training data for each stage is different.
- the predictions from the first stage may be provided as input at the second stage.
- the initial predictions for all cell types may be provided as input to the second stage. This may allow the second stage to effectively correct the predictions from the first stage, and may increase the consistency and/or accuracy of the final model.
- the output at the second stage may be second predictions for the percentages of RNA from each cell type, with the second sub-model of each non-linear regression model providing a prediction for its respective cell type.
- the second predictions may be the final output of the non-linear regression models (e.g., as described herein including with respect to FIGs. 2 and 4 ).
- additional stages of training e.g., additional sub-models
- Providing the predictions from the previous stage as part of the input to the next stage may allow a model for a particular cell type to use the information about estimated proportions of other cell types and adapt to them (e.g., by knowing that the total number of T cells equals 10 and number of CD4+ T cells is 8, the number of CD8+ T cells could not exceed 2).
- a multi-stage training procedure as described herein, may allow the model to account for this. This procedure may allow for information from different cell types and subtypes to be used for each individual cell type model.
- FIG. 5B is an exemplary, non-limiting illustration for training a machine learning model, in accordance with some embodiments of the technology described herein.
- the illustrated techniques may be used in conjunction with any of the other techniques described herein, including at least with respect to FIGs. 2 and 4 .
- diagram 530 illustrates the division of the datasets into one or more folds, as described herein including with respect to FIG. 5A .
- the datasets may be randomly split into three folds, with each of the three folds being further divided into a training dataset and a validation dataset.
- datasets may be used to generate artificial mixes, as described herein including with respect to FIG. 6A .
- the folds may then be used to train one or more models for a given set of parameters (e.g., parameters 550).
- the parameters may be generated (e.g., at random) based on a set of predetermined ranges shown in Table 3.
- at least some of the (e.g., all) folds may be used to train each cell type model separately.
- validation mixes may be used to evaluate each parameter set and generate associated evaluation data.
- parameters may be updated with each stage of training and/or used as input to subsequent training stages.
- a first fold may be used as input for a first stage of training to generate a first set of parameters.
- a second fold may then be used as input for a second stage of training to generate an updated set of parameters.
- Tables 4 and 5 show example parameters for one or more cell type models after a first stage and a second stage of training, respectively.
- Table 3 This table lists exemplary model parameters and specifies example values that define a range for each parameter.
- Float Table 4 This table specifies example values for the model parameters for each cell type model as a result of a first stage of training.
- FIG. 6A is a diagram depicting an exemplary method 600 for training one or more non-linear regression models, including generating simulated RNA expression data (e.g., to use as training data, as described herein including at least with respect to FIGs. 4-5 ).
- the simulated RNA expression data may be generated by combining samples of RNA expression data from malignant cells (e.g., cancer cells) and microenvironment cells (e.g., immune cells, stromal cells, etc.), as shown in branches 610 and 620 of the method 600.
- malignant cells e.g., cancer cells
- microenvironment cells e.g., immune cells, stromal cells, etc.
- An exemplary process for generating artificial mixes of RNA expression data is described herein below with respect to FIG. 6A .
- FIG. 6B is a diagram depicting an example of generating artificial mixes of RNA expression data to imitate real tissue, according to some embodiments of the technology described herein.
- the RNA expression data is derived from one or more sorted cell types/subtypes representing one or more biological states (e.g., positive gene regulation, negative gene regulation, etc.), as shown in branch 630.
- the one or more cell types/subtypes are mixed in different proportions to generate artificial mixes, as shown in branches 640 and 650.
- FIG. 6C is an exemplary diagram for generating and using artificial mixes to train cell type models, according to some embodiments of the technology described herein.
- the dataset is divided into folds.
- the resultant datasets are used to create artificial mixes.
- the artificial mixes are used to train and validate each of one or more non-linear regression models that is specific to one or more cell type/subtype.
- the resultant models from each of the folds may be considered together or independently, as described with respect to FIG. 5A .
- FIGS. 6D and 6E are exemplary illustrations for generating specific artificial mixes for training particular cell type/subtype models, according to some embodiments of the technology described herein.
- one or more datasets may be excluded for training a specific cell type/subtype model, as described herein including with respect to Table 6.
- FIG. 6F is an exemplary diagram illustrating techniques for processing datasets and generating artificial mixes, according to some embodiments of the technology described herein.
- act 602 illustrates datasets for a cell type, prior to rebalancing (e.g., resampling large datasets to avoid overtraining models.)
- datasets may be rebalanced 604 and combined into a total set of samples for a specific cell type. Further, as described herein, samples may then be randomly selected in act 608 and averaged in act 612.
- hyperexpression noise may be added to the expression of the cell type, as illustrated in 614.
- the samples of RNA expression data may be obtained as described herein including at least with respect to FIGs. 1C-1D .
- a large number of samples of sorted malignant and microenvironment cells may be used to construct the artificial mixes of RNA expression data.
- the number of samples may be on the order of the number of samples included in Table 1.
- the number of samples may be at least 5,000, at least 10,000, at least 15,000, at least 20,000, at least 30,000, at least 50,000, at least 100,000, or any number of suitable samples.
- open source datasets such as Gene Expression Omnibus (GEO) and ArrayExpress may be used.
- GEO Gene Expression Omnibus
- ArrayExpress may be used.
- the datasets used may be selected so as to satisfy the following criteria: only homo sapiens, standard RNA-seq (without polyA depletion, targeted panel, etc.) with read length higher 31 bp.
- only relevant cell types for the particular disease being analyzed e.g., particular type of tumor
- data for all cell types may instead be used.
- selection of datasets may be based on both biological and bioinformatic parameters. For example, datasets with samples cultivated in conditions close to normal physiological conditions may be used. In some embodiments, datasets with abnormal stimulation were excluded, like datasets of CD4+ T-cells hyper stimulated with phorbol 12-myristate 13-acetate and ionomycin activation or macrophages co-cultured with an excessive number of bacterial cultures. In some embodiments, only those samples having at least 4 million coding read counts were used.
- quality control may be performed on the RNA expression data prior to construction of the artificial mixes (e.g., to exclude strange or unreliable datasets). For example, if some samples of CD4+ T cells show no or very low expression of CD45, CD4 or CD3 genes, they may be excluded. The same may done for other cell types, in some embodiments. For example, samples for some cell types may be excluded if they significantly express genes that are not typical for that type of cell (e.g., if in a sample of T cells, CD 19, CD33, MS4A1, etc. were expressed in significant amounts, while in most other T cell samples these expressions were low). In some embodiments, samples of CD4+ T cells may be removed if they express significant amounts of CD8 genes.
- several methods of expression analysis like t-SNE or PCA with different gene sets may be used to visualize the similarities and differences between datasets (e.g., as shown in FIGs. 1C and 1D ). If a particular cell type from one dataset fails to cluster with the same cell type in the other datasets (e.g., in a t-SNE, PCA, or other plot), then the one dataset may be further analyzed as part of quality control, and some or all of the data from that dataset may be excluded.
- RNA expression data may be constructed using samples prepared as described herein above. Artificial mixes may be generated using sample expressions in TPM (transcripts per million) units, such that the gene expressions for an overall sample are formed as a linear combination of the expressions of individual cells from that sample.
- RNA expression data from samples of various cell types may be mixed in predetermined proportions, as described herein below.
- simulated RNA expression data for malignant cells e.g., generated as shown in branch 610
- simulated RNA expression data for microenvironment cells e.g., generated as shown in branch 620).
- samples of each cell type may be rebalanced by datasets (e.g., reducing the weight of datasets with a large number of samples) and subtypes (e.g., changing the proportions of subtypes of a sample).
- datasets e.g., reducing the weight of datasets with a large number of samples
- subtypes e.g., changing the proportions of subtypes of a sample.
- Techniques for rebalancing are described herein including with respect to the "Rebalancing by datasets" and "Rebalancing by subtypes” sections.
- For each cell type multiple samples may then be randomly selected and averaged. Then, for some or all of the cell types being used, the rebalanced/averaged samples may be mixed together in particular proportions (e.g., so as to simulate a real tumor microenvironment).
- branch 610 an exemplary process for generating simulated malignant cell RNA expression data is shown.
- random samples of cancer cells e.g., NSCLC, ccRCC, Mel, HNCK, etc.
- hyperexpression noise may be added to the resulting RNA expression data to account for abnormal expression of genes by malignant cells.
- tumor cells sometimes express genes which are ordinarily absent in the parental cell type.
- the overexpressed genes may interfere with the deconvolution techniques described herein.
- the result of branch 610 may be simulated malignant cell RNA expression data.
- the simulated RNA expression data for the malignant cells (e.g., generated as shown in branch 610) and the simulated RNA expression data for the microenvironment cells (e.g., generated as shown in branch 620) may be combined into an artificial mix (referred to in FIG. 6A as an "expression mix").
- the simulated RNA expression data for the malignant cells and the simulated RNA expression data for the microenvironment cells may be mixed together in a random proportion based on a given distribution for cancer cells.
- noise may then be added to the mix to mimic technical noise and noise resulting from biological variability.
- Each type of noise may be specified according to one or more suitable distributions. For example, as shown in FIG.
- the technical noise may be specified by a Poisson distribution, while the noise resulting from biological variability may be specified according to a normal distribution.
- technical noise may have multiple components, which may be specified by other distributions.
- another component of technical noise may be specified by a non-Poisson distribution.
- the artificial mix may be representative of an artificial tumor, including the tumor microenvironment (TME).
- the inventors have recognized and appreciated that, when creating artificial mixes, it may be desirable to use different cells of the same type from different samples. Using a small number of samples for the mixes, or even just one sample for each cell type, would provide poor performance on real tumor samples (e.g., due to the variability of cell states and their expressions, as well as noise due to limited numbers of read counts for different expressions, alignment errors and other causes of technical noise). Therefore, when creating artificial mixtures, the inventors have recognized that is may be desirable to use as many available cell samples as possible.
- RNA-seq samples e.g., at least one hundred, at least five hundred, at least one thousand, at least two thousand, or at least five thousand samples
- a number of datasets of malignant cells e.g., pure cancer cells for various diagnoses, cancer cell lines or sorted from tumors
- Table 7 lists the quantities of samples remaining after quality control for a number of cell types.
- the artificial mixes may be used as training datasets for training one or more non-linear regression models.
- the non-linear regression models may be specific to a cell type/subtype. Accordingly, in some embodiments many (e.g., 150,000) artificial mixes may be generated to train models for each specific cell type model.
- the sets of mixes used for each model may include or exclude specific datasets that allow for differentiation between particular cell types/subtypes, as illustrated in FIGS. 6D and 6E . For example, to train a model for CD4+ T cells, datasets that include unspecified T cells may be excluded to avoid uncertainty about the proportions of CD4+ T cells within the datasets.
- Table 6 specifies the mixes used to train one or more corresponding cell type/subtype models.
- Table 6: This table specifies, as an example, the samples included in the artificial mixes used to train particular cell type models. Mixes set Trained models All available samples Immune cells, Myeloid cells, Lymphocytes, Monocytes, Fibroblasts, Endothelium, Neutrophils, NK cells, T cells, Macrophages, B cells Without T cell samples CD4+ T cells, CD8+ T cells Without T cells, CD8+ T cells samples CD8+ T cells PD1 high, CD8+ T cells PD1 low Without T cells, CD4+ T cells samples Tregs, T helpers Without Macrophages samples Macrophages M1, Macrophages M2 Without B cells samples Plasma B cells, Non plasma B cells
- multiple samples for each cell type may be averaged in any suitable manner (e.g., to improve the quality of samples before adding artificial noise). For example, in some embodiments, averaging may be performed in groups of two, such that an averaged sample of 4 million reads may contain information on 8 million reads. In some embodiments, averaging across multiple samples may reduce the noise in the expression caused by technical factors during sequencing.
- num av samples are selected, the expressions of which are averaged (the value of num av is indicated in the parameter table, Table 9).
- any subtype samples may be used at this stage. So, for example, Tregs may be processed along with T cells in some embodiments. Since this approach creates greater subtype diversity for artificial samples but can decrease the biological variability of gene expression within cell type or subtype if too many samples are averaged, the degree of averaging employed may affect the learning outcome. Therefore, the number of samples for averaging may appear as a parameter, which, together with other parameters, may be selected during training (e.g., so as to increase or maximize quality).
- the number of samples may be rebalanced. As described herein below, in one example, the samples may be rebalanced by datasets, then by cell subtypes. Then num av samples may be selected from the rebalanced number of samples.
- the number of samples of sorted cells in datasets may range from one to several hundred (e.g., at least five, at least ten, at least 50, or at least 100 samples).
- each dataset may contain samples of one or two cell types, sorted and sequenced in the same way.
- Cell samples within the same dataset may also have specific conditions, such as a specific set of markers for sorting or a specific disease of patients from whom the cells were taken. Datasets with a large number of samples can lead to overtraining of models for such datasets. To reduce the weight of datasets with a large number of samples, samples of all datasets are resampled in order to rebalance by datasets.
- N dataset , new N max ⁇ N dataset , old N max 1 ⁇ rebalanc parameter
- N max is number of samples in the largest dataset (e.g., for the particular cell type) and N dataset,old is the original number of samples in the dataset.
- the rebalance parameter in the equation is a value in the range [0, 1], where 0 means there is no change in the number of samples, and 1 means that for each dataset there will be the same number of samples.
- the rebalancing parameter may be selected during training.
- samples of this type there may also be samples of more specific subtypes.
- the number of available subtype samples may not coincide with those ratios that are specified during the formation of mixes with these subtypes, in some cases. Therefore, when creating mixes for the cell type, samples of its subtypes may be rebalanced.
- CD4+ T cells there may be significantly more CD4+ T cells (and T helpers with Tregs) samples available than CD8+ T cells.
- proportions of CD4+ and CD8+ T cells samples may be changed before the random selection of samples.
- the proportions may be chosen similar to the ratios of the predicted average RNA fractions for the TCGA or PBMC samples for these cell types.
- the predictions may be obtained using one or more linear models trained on mixes with equal cell proportions.
- the subtype rebalancing algorithm may be as follows. To rebalance each subtype for a given type, resample with replacement a number of samples equal to: P subtype ⁇ msize / min P + 1
- P subtype is a number reflecting the proportion of a given subtype (e.g., the proportion of this subtype among all subtypes for the given type, which may be represented as the number of samples for the subtype divided by the total number of samples for the type); msize is the maximum number of samples among all the subtypes for the given type, and min P is the minimum number P subtype between all subtypes.
- the rebalancing operation may be performed recursively for all nested subtypes (e.g., subtypes which themselves have subtypes.
- the resulting samples of different cell types may be mixed with one another in random ratios in order to generate the simulated microenvironment cell RNA expression data.
- R cell is a random number distributed uniformly from 0 to 1 and K cell is the coefficient for the particular cell type.
- the coefficient K cell in the above equations may be chosen so that the most likely ratios of cells mRNA are close to what is observed in TCGA or PBMC samples. These approximate ratios may be calculated from the TCGA or PBMC samples, using models trained without using such ratios. For example, a vector of numbers may be used, reflecting approximate proportions for a given type of tissue. Each number of the vector is multiplied by a random number from 0 to 1. The resulting coefficients are normalized to the sum and used in a linear combination.
- K cell may be selected from Table 7, which specifies, for each of multiple cell types, the most likely proportion of the cell type based on tumor tissue and blood (PBMC).
- the inventors have recognized and appreciated that it may be desirable for the deconvolution algorithm to work in any cell range. For example, the preparation of a cell suspension from a tumor sample may lead to a dramatic increase in the proportion of lymphocytes - and it may be desirable for the algorithm to work on the sequencing data of such a suspension.
- the inventors have recognized and appreciated that the formation of cell ratios by the method described may generate practically no samples where there is a large proportion (e.g., 70-100%) of a certain cell type, such as NK cells. Therefore, in some embodiments, additional mixtures are created in which proportions are generated from the Dirichlet distribution with parameter 1/ number_of_types for each dimension. This parameter may be selected along with other parameters for creating mixtures.
- the number of samples in a dataset formed in this way may be controlled by a parameter dirichlet_samples_proportion (Table 9). This parameter may also be selected as a parameter for creating mixtures. Thus, in the final dataset, each cell type may be found in proportions from 0 to 100 percent. However, there most of the characteristic quantities may reflect cell populations that mimic real tumors.
- Table 7 This table specifies, for each of multiple cell types, the most likely proportion of the cell type based on tumor tissue and blood (PBMC).
- PBMC B_cells 11 Plasma_B_cells 6 3 Non_plasma_B_cells 5 17 T_cells 15 100 CD4_T_cells 7 50 Tregs 4 2 CD8_T_cells 8 50 CD8_T_cells_PD1_low 4 48 CD8_T_cells_PD1_high 4 2 NK_cells 2 16 Monocytes 2 80 Macrophages 40 1 Neutrophils 2 10 Fibroblasts 50 1 Endothelium 36 1 T_helpers 3 48 Macrophages_M1 12 0.5 Macrophages_M2 28 0.5
- noise e.g., technical noise, uniform noise, or any suitable form of noise
- expression of each gene may contribute noise to the overall tissue expression.
- T i j ⁇ T i + P i j + N prep i + N bio i
- u Ti represents the true expression of the gene
- P i j represents Poisson technical noise
- N prepi represents normally distributed noise derived from sequencing library preparation
- N bioi represents variable biological noise.
- a TPM-based mathematical noise model is provided, which accounts for technical noise (both Poisson and non-Poisson).
- this model of variability may be added to the artificial mixes generated to train the non-linear regression models, as described herein.
- technical non-Poisson noise is assumed to be normally distributed.
- Poisson noise is a type of technical noise which may be associated with the sequencing coverage or number of read counts and may not be normally distributed.
- T ⁇ i is a mean TPM in technical replicates
- R is read counts
- ⁇ is an estimated proportional coefficient
- this model may correctly represent the gene expression variability as a result of expression levels and coverage, as shown using technical replicates of purified cell populations ( FIG. 12I ).
- the limit of detection of gene expression varied from 1TPM at a coverage of 20 million total reads to 12 TPM at a coverage of 1 million reads per sample Therefore, the ability to assess gene expression may be influenced by the amount of material which is available.
- the noise coefficient ( ⁇ ) can be calculated for Poisson noise ( FIG. 12K ). By calculating this coefficient, the technical noise for each sample and each gene can be inferred according to the deduced formula.
- biological noise which may be associated with different activated states of a cell, can contribute to the overall variance in an RNA-seq sample.
- biological noise may already be present through the use of RNA-seq data derived from cell subsets representing a variation of biological states.
- this overall variance can be assessed, in one example, by plotting data for the same cell types, obtained by different experiments ( FIG. 12J ).
- An example of the dependence of technical noise, both Poisson and non-Poisson, and biological variability on the average sequencing coverage is presented in FIG. 12J .
- the noise increases from 10% to 26% from technical to biological replicates for certain cell types ( FIG. 12J , right).
- the analysis of noise contribution due to single gene expression may be applied to simulate technical and biological noise in artificial mixes.
- ⁇ P , ⁇ N ⁇ N(0,1), ⁇ is the coefficient of Poisson noise level coefficient, and ⁇ is the coefficient of uniform level non-Poisson noise (Table 9).
- the above-describe approach may be validated by excluding the technical Poisson noise from the technical non-Poisson and biological noise.
- an average variance at about 16% was obtained, which was subsequently used in mixes.
- the noise lost the dependence on the sequencing coverage. This may be expected, since the technical non-Poisson and biological variability do not depend on the measurement method.
- the noise model described herein may be used to add technical (both Poisson and non-Poisson) variation to artificial mixes. This results in artificial mixes which better mimic real tissues. Improved artificial mixes may subsequently be used to train the deconvolution algorithm (e.g., as described herein including with respect to FIGs. 4-6 ) to ensure model stability when encountering real sequencing variability.
- training a non-linear regression model may comprise estimating and/or updating parameters for the model, in some embodiments.
- the parameters for the model may include some parameters, which may be referred to herein as hyperparameters, other than the learned weights for the model (e.g., as described herein at least with respect to FIG. 4 ).
- hyperparameters may be referred to herein as hyperparameters, other than the learned weights for the model (e.g., as described herein at least with respect to FIG. 4 ).
- An exemplary list of such hyperparameters and their values is shown in Table 9.
- values for the hyperparameters may be estimated as the non-linear regression models are trained. For example, some or all of the hyperparameters may be updated based one or more validation sets of the training data (e.g., with each fold of the model training). In some embodiments, the hyperparameters may be estimated based on TCGA data. For example, the results for a particular setting of the hyperparameters may be checked for consistency against TCGA data, such that TCGA model concordance may be achieved.
- the sum of results across the cell subtypes e.g., T cells, B cells, and NK cells
- the sum of results across the cell subtypes is equal (or close) to the overall result for the cell type.
- a parameter search may be performed as part of estimating the hyperparameters. Any suitable parameter search technique may be used, including a random search, a grid search, or a genetic algorithm. In some embodiments, the parameter search may be performed using Bayesian optimization, gradient-based optimization, or evolutionary optimization, for example. In some embodiments, a parameter search may select one or more hyperparameter values from a predetermined range associated with the hyperparameter.
- Tables 8 and 9 list example hyperparameters: number of samples for averaging (Nav), uniform noise level ( ⁇ ), Dirichlet samples proportion (Dp), rebalance parameter (r), hyperexpression fraction (Hf), and maximum hyperexpression level (Mhl).
- a number of artificial mixes "Dp" may be created in which proportion are generated from the Dirichlet distribution.
- the rebalance parameter "r” may be used in an equation to determine a new number of samples in the dataset.
- “r” is a value in the range [0, 1], where 0 means there is no change in the number of samples, and 1 means that for each dataset there will be the same number of samples.
- the rebalancing parameter may be selected during training.
- hyperexpression noise may be added to each of the artificial mixes.
- random values are added to the genes' expression of a selected tumor sample with a small probability for creating each mix. For example, with a probability of "Hf" a random number from a uniform distribution from zero to "Mhl” may be added to the expression of each gene.
- Table 8 This table specifies, for each of multiple hyperparameters, example values that define a range for each hyperparameter.
- the machine learning models described herein may include tens of thousands, hundreds of thousands, or millions of parameters.
- the non-linear regression models 304 as described herein including at least with respect to FIGs. 2-6 , may include at least ten thousand parameters, at least one hundred thousand parameters, or at least one million parameters.
- processing data with machine learning models like the non-linear regression models 304 requires millions of calculations to be performed, which cannot be done practically in the human mind and without computers.
- the algorithms for training such the machine learning models described herein may require an even greater amount of computational resources, as such models are trained using tens of thousands, hundreds of thousands, or millions of artificial mixes (e.g., as described herein including at least with respect to FIG. 6A ). In one specific example, three million artificial mixes may be generated for training the non-linear regression models across two stages (e.g., as described herein including at least with respect to FIG. 5A ). Neither the training algorithms nor the use of the trained models may be performed without computing resources.
- FIGs. 7A-7G are a variety of results achieved using the techniques developed by the inventors.
- the techniques developed by the inventors substantially outperform conventional techniques for cellular deconvolution.
- the cellular deconvolution techniques developed by the inventors may be referred to as "Kassandra".
- FIG. 7A is a chart comparing simulated RNA expression data 702 (e.g., a plurality of artificial mixes generated according to the techniques of FIG. 6A ) to RNA expression data 704 from a plurality of biological samples (e.g., tumor).
- the RNA expression data 702 is obtained from five hundred artificial lung cancer samples, developed using the techniques described herein including with respect to FIG. 6A .
- FIG. 7B is a chart depicting exemplary cell composition percentages predicted according to the deconvolution techniques developed by the inventors, and corresponding true cell composition percentages.
- FIG. 7C and 7D are exemplary charts representing the Pearson correlation for different cell types between predicted and true artificial mix values (e.g., prediction accuracy.)
- the graphs compare exemplary prediction accuracy for the deconvolution techniques developed by the inventors, and the prediction accuracy for alternative algorithms.
- FIG. 7C the prediction accuracy without cancer cell hyperexpression noise is presented.
- FIG. 7D the prediction accuracy with cancer cell hyperexpression is presented.
- random hyperexpression noise may be added to artificial mixes (e.g., to allow the deconvolution techniques developed by the inventors to ignore aberrant expressions from malignant cells in the samples).
- four example gene markers in TCGA data derived from four different cancer types were analyzed: CD14 in bladder cancer, FCRLA in skin cutaneous melanoma, STAP1 in clear cell renal cell carcinoma, and PADl2 in lung squamous cell carcinoma. Each of these markers were found to be overexpressed in the corresponding cancer type. While these markers are not expressed in the corresponding normal tissue, they are found to be expressed in immune cells ( FIG. 7E ).
- the deconvolution techniques developed by the inventors are stable to aberrant high expression present in the data.
- the techniques developed by the inventors produce accurate predictions across cell types, even when hyperexpression noise is present ( FIG. 7D ).
- FIG. 7D indicates that the performance of the alternative algorithms is significantly reduced in the presence of overexpression noise, while the techniques developed by the inventors retained high correlation scores on the validation dataset.
- the alternative algorithms include CIBERSORT, CIBERSORTx, QuanTIseq, FARDEEP, Xcell, ABIS, EPIC, MCP-counter, Scaden, and MuSiC.
- Newman et al. (“Robust enumeration of cell subsets from tissue expression profiles.” Nat. Methods 12, 453-457,( 2015 )) describes CIBERSORT.
- Newman et al. (“Determining cell type abundance and expression from bulk tissues with digital cytometry.” Nat Biotechnol 37, 773-782 (2019 )), describes CIBERSORTx. Finotello et al.
- FIG. 7F is a heatmap representing the Pearson correlation for different cell types between predicted and true artificial mix values (e.g., prediction accuracy)for the deconvolution techniques developed by the inventors. Predicted cell percentages for different cell types are shown for data from sorted samples, derived from holdout datasets. As shown, the deconvolution techniques developed by the inventors achieved high prediction accuracy scores across cell types, including closely related cell types.
- predicted and true artificial mix values e.g., prediction accuracy
- FIG. 7G is a chart comparing exemplary non-specificity scores for the deconvolution techniques developed by the inventors to non-specificity scores for alternative algorithms.
- non-specificity scores for eleven alternative algorithms are shown.
- the values in the chart of FIG. 7G represent percentages of non-specific (false positive) predictions relative to specific (true positive) predictions for different cell types.
- a low non-specificity score indicates a lower percentage of false positives predictions (e.g., indicating a more specific model).
- the detection of signals for each cell type in pure populations was assessed, and B-cells, T-cells, and macrophages were further subdivided, with each subclass clearly distinguished from the others.
- a linear method of cellular deconvolution may be provided.
- An exemplary linear deconvolution technique is described herein below with respect to FIGs. 8 and 9A-9C .
- FIG. 8 is a flowchart depicting an exemplary linear method 800 for determining cell composition percentages based on expression data (e.g., RNA expression data).
- the method 800 may comprise estimating cell composition percentages for one or more cell types in a biological sample, using an expression profile (e.g., an RNA expression, and/or an expression profile as shown in FIG. 9A ) for each cell type.
- an expression profile e.g., an RNA expression, and/or an expression profile as shown in FIG. 9A
- the method 800 may be carried out on a computing device (e.g., as described herein including at least with respect to FIG. 10 ).
- the computing device may include at least one processor, and at least one non-transitory storage medium storing processor-executable instructions which, when executed, perform the acts of method 800.
- the method 800 may be carried out, for example, in a system such as system 100 (which may include, for example, a clinical setting or a laboratory setting), by one or more computing devices such as by computing device 108.
- the method 800 may begin with obtaining RNA expression data for a biological sample from a subject.
- act 802 may include accessing RNA expression data that was previously obtained from a biological sample.
- the biological sample may comprise a biopsy (e.g., of a tumor or other diseased tissue of the subject) or any other suitable type of biological sample, and the expression data may be extracted using any suitable techniques.
- the expression obtained at act 802 may comprise RNA expression data measured in TPM.
- the origin or preparation methods of the biological sample may include any of the examples described with respect to the "Biological Samples" section.
- the origin or preparation methods of the expression data may include any of the examples described with respect to the "Expression Data" and "Obtaining RNA expression data" sections.
- the expression data may be stored on at least one storage medium and accessed as part of act 802.
- the expression data may be stored in one or more files or in a database, which may be read as part of act 802.
- the at least one storage medium storing the expression data may be local to the computing device (e.g., stored on the same at least one non-transitory storage medium), or may be external to the computing device (e.g., stored in a remote database or a cloud storage environment).
- the expression data may be stored on a single storage medium or may be distributed across multiple storage mediums.
- act 802 may further comprise pre-processing the expression data in any suitable manner.
- the expression data may be sorted, combined, organized into batches, filtered, or pre-processed with any other suitable techniques.
- the pre-processing may make the expression data suitable to be processed using the linear regression technique described herein with respect to acts 804-806.
- pre-processing the RNA may include any of the embodiments described with respect to the "Alignment and annotation," “Removing non-coding transcripts,” and "Conversion to TPM and gene aggregation" sections.
- the method 800 may proceed with processing the RNA expression data using a linear regression technique in order to determine one or more corresponding cell composition percentages for the cell types.
- the method 800 may proceed with obtaining a plurality of expression profiles (e.g., as described herein including with respect to FIG. 9A ) for a corresponding plurality of cell types.
- a plurality of expression profiles e.g., as described herein including with respect to FIG. 9A
- an expression profile for CD4+ T cells, an expression profile for NK cells, and an expression profile for CD8+ T cells may be obtained at act 802.
- Each of the expression profiles (e.g., RNA expression profiles) may comprise respective expression data (e.g., RNA expression data) from one or more genes associated with a respective cell type from the plurality of cell types.
- the genes associated with each respective cell type may be specific and/or semi-specific genes for the cell type.
- the genes associated with each respective cell type may comprise corresponding genes listed in Table 2.
- the corresponding genes may include at least 2 genes, at least 4 genes, at least 6 genes, at least 8 genes, at least 10 genes, at least 12 genes, at least 14 genes, or at least 16 genes included in Table 2.
- the corresponding genes may include fewer than 10, 000, fewer than 5,000, fewer than 2,000, fewer than 1,000, fewer than 500, fewer than 250, or fewer than 100 genes.
- the expression profile may be obtained in any suitable manner.
- the expression profile may be stored in one or more files or in a database, which may be read as part of act 804.
- the at least one storage medium storing the expression profile may be local to the computing device (e.g., stored on the same at least one non-transitory storage medium), or may be external to the computing device (e.g., stored in a remote database or a cloud storage environment).
- the expression profile may be stored on a single storage medium, or may be distributed across multiple storage mediums.
- the method 800 may proceed with determining a plurality of cell composition percentages for the plurality of cell types at least in part by optimizing a piecewise continuous error function (e.g., the example piecewise continuous error function described with respect to FIG. 9A ) between the expression data and the plurality of expression profiles.
- Act 806 may be performed simultaneously or iteratively across the plurality of cell types, and may be repeated (e.g., for a set number of iterations, or until a measurement of error is below a threshold) in some examples.
- act 806 may comprise performing a linear regression using the expression data, the plurality of expression profiles, and the piecewise continuous error function. This may include, in some examples, optimizing the piecewise continuous error function. In some examples, optimizing the piecewise continuous error function is not limited to finding a global maximum or minimum of the piecewise continuous error function, but may also encompass finding a local maximum or minimum within a threshold distance of a global maximum or minimum. For example, act 806 may involve determining a combination (e.g., a weighted sum) of the expression profiles that has a lowest error or an error below a threshold (e.g., with the error measured using the piecewise continuous error function) relative to the expression data.
- a combination e.g., a weighted sum
- act 806 may comprise determining, for each gene associated with the cell type, a corresponding output of a piecewise continuous error function (e.g., such as the error function of FIG. 9C).
- the piecewise continuous error function may serve to compare an actual measured expression value from real data (e.g., RNA-seq data), against a predicted expression value which may be computed using the gene's expression in the expression profile for the cell type (e.g., as obtained at act 804).
- the predicted expression value may be computed as a product of the expression of the gene in the expression profile, and a coefficient ⁇ for the cell type.
- the input to the error function may be the coefficient ⁇ , the expression g of the gene in the input expression data, and the expression p of the gene in the expression profile for the cell type.
- the error function may have coefficients a, b, k, as described herein including with respect to FIG. 9C, which may be updated as part of act 806.
- act 806 may be performed iteratively or in parallel for some or all of the genes. For example, act 806 may be performed repeatedly across the plurality of cell types until a coefficient ⁇ is found for each cell type such that the piecewise continuous error function is below a threshold or minimized.
- the value of coefficient ⁇ may be determined by finding the coefficient value that minimizes the weighted error sum across all of the genes (e.g., the piecewise error function as described herein including with respect to act 806 and FIG. 9C, summed across all genes).
- the coefficient ⁇ may represent the cell composition percentage for the corresponding cell type (e.g., because ⁇ defines the weight of each expression profile in the weighted sum for the expression data).
- determining the plurality of cell composition percentages for the plurality of cell types may comprise processing the coefficients, such as by normalizing them, in order to obtain corresponding cell composition percentages for each of the plurality of cell types.
- FIG. 9A is a diagram depicting exemplary RNA expression profiles and overall RNA expression data.
- known RNA expression profiles are shown for CD4+ T cells, NK cells, and CD8+ T cells.
- Each RNA expression profile is illustrated as a bar graph, with the horizontal axis representing genes, and the vertical axis representing the expression of those genes. As shown in the figure, each RNA expression profile may be unique for a given cell type.
- the overall observed expression for a biological sample may be considered as a sum of expression profiles for cell types comprising the biological sample.
- each RNA expression profile may be weighted by a coefficient ⁇ , such that the biological sample may be considered as a weighted sum of the RNA expression profiles.
- the sum may further include a term for unknown expression of other cell types. This term may represent expression data that is not accounted for with the weighted sum of RNA expression profiles (e.g., as shown in gray in the observed expression for the biological sample).
- FIG. 9B depicts an exemplary piecewise continuous error function for use with the method of FIG. 8 .
- the error function f is piecewise, with the coefficients a and b dividing the function into three sections, and coefficient k affecting the shape of the rightmost section of the error function.
- the error may be computed according the illustrated expression.
- a biological sample is obtained from a subject having, suspected of having cancer, or at risk of having cancer.
- the biological sample may be any type of biological sample including, for example, a biological sample of a bodily fluid (e.g., blood, urine or cerebrospinal fluid), one or more cells (e.g., from a scraping or brushing such as a cheek swab or tracheal brushing), a piece of tissue (cheek tissue, muscle tissue, lung tissue, heart tissue, brain tissue, or skin tissue), or some or all of an organ (e.g., brain, lung, liver, bladder, kidney, pancreas, intestines, or muscle), or other types of biological samples (e.g., feces or hair).
- a bodily fluid e.g., blood, urine or cerebrospinal fluid
- cells e.g., from a scraping or brushing such as a cheek swab or tracheal brushing
- a piece of tissue e.g.
- the biological sample is a sample of a tumor from a subject. In some embodiments, the biological sample is a sample of blood from a subject. In some embodiments, the biological sample is a sample of tissue from a subject.
- a sample of a tumor refers to a sample comprising cells from a tumor.
- the sample of the tumor comprises cells from a benign tumor, e.g., non-cancerous cells.
- the sample of the tumor comprises cells from a premalignant tumor, e.g., precancerous cells.
- the sample of the tumor comprises cells from a malignant tumor, e.g., cancerous cells.
- tumors include, but are not limited to, adenomas, fibromas, hemangiomas, lipomas, cervical dysplasia, metaplasia of the lung, leukoplakia, carcinoma, sarcoma, germ cell tumors, and blastoma.
- a sample of blood refers to a sample comprising cells, e.g., cells from a blood sample.
- the sample of blood comprises non-cancerous cells.
- the sample of blood comprises precancerous cells.
- the sample of blood comprises cancerous cells.
- the sample of blood comprises blood cells.
- the sample of blood comprises red blood cells.
- the sample of blood comprises white blood cells.
- the sample of blood comprises platelets. Examples of cancerous blood cells include, but are not limited to, leukemia, lymphoma, and myeloma.
- a sample of blood is collected to obtain the cell-free nucleic acid (e.g., cell-free DNA) in the blood.
- a sample of blood may be a sample of whole blood or a sample of fractionated blood.
- the sample of blood comprises whole blood.
- the sample of blood comprises fractionated blood.
- the sample of blood comprises buffy coat.
- the sample of blood comprises serum.
- the sample of blood comprises plasma.
- the sample of blood comprises a blood clot.
- a sample of a tissue refers to a sample comprising cells from a tissue.
- the sample of the tumor comprises non-cancerous cells from a tissue.
- the sample of the tumor comprises precancerous cells from a tissue.
- tissue including organ tissue or non-organ tissue, including but not limited to, muscle tissue, brain tissue, lung tissue, liver tissue, epithelial tissue, connective tissue, and nervous tissue.
- the tissue may be normal tissue or it may be diseased tissue or it may be tissue suspected of being diseased.
- the tissue may be sectioned tissue or whole intact tissue.
- the tissue may be animal tissue or human tissue.
- Animal tissue includes, but is not limited to, tissues obtained from rodents (e.g., rats or mice), primates (e.g., monkeys), dogs, cats, and farm animals.
- the biological sample may be from any source in the subject's body including, but not limited to, any fluid [such as blood (e.g., whole blood, blood serum, or blood plasma), saliva, tears, synovial fluid, cerebrospinal fluid, pleural fluid, pericardial fluid, ascitic fluid, and/or urine], hair, skin (including portions of the epidermis, dermis, and/or hypodermis), oropharynx, laryngopharynx, esophagus, stomach, bronchus, salivary gland, tongue, oral cavity, nasal cavity, vaginal cavity, anal cavity, bone, bone marrow, brain, thymus, spleen, small intestine, appendix, colon, rectum, anus, liver, biliary tract, pancreas, kidney, ureter, bladder, urethra, uterus, vagina, vulva, ovary, cervix, scrotum, penis, prostate, testicle,
- any of the biological samples described herein may be obtained from the subject using any known technique. See, for example, the following publications on collecting, processing, and storing biological samples, each of which are incorporated herein in its entirety: Biospecimens and biorepositories: from afterthought to science by Vaught et al. (Cancer Epidemiol Biomarkers Prev. 2012 Feb;21(2):253-5 ), and Biological sample collection, processing, storage and information management by Vaught and Henderson (IARC Sci Publ. 2011;(163):23-42 ).
- the biological sample may be obtained from a surgical procedure (e.g., laparoscopic surgery, microscopically controlled surgery, or endoscopy), bone marrow biopsy, punch biopsy, endoscopic biopsy, or needle biopsy (e.g., a fine-needle aspiration, core needle biopsy, vacuum-assisted biopsy, or image-guided biopsy).
- a surgical procedure e.g., laparoscopic surgery, microscopically controlled surgery, or endoscopy
- bone marrow biopsy e.g., punch biopsy, endoscopic biopsy, or needle biopsy
- needle biopsy e.g., a fine-needle aspiration, core needle biopsy, vacuum-assisted biopsy, or image-guided biopsy.
- one or more than one cell may be obtained from a subject using a scrape or brush method.
- the cell biological sample may be obtained from any area in or from the body of a subject including, for example, from one or more of the following areas: the cervix, esophagus, stomach, bronchus, or oral cavity.
- one or more than one piece of tissue e.g., a tissue biopsy
- the tissue biopsy may comprise one or more than one (e.g., 2, 3, 4, 5, 6, 7, 8, 9, 10, or more than 10) biological samples from one or more tumors or tissues known or suspected of having cancerous cells.
- any of the biological samples from a subject described herein may be stored using any method that preserves stability of the biological sample.
- preserving the stability of the biological sample means inhibiting components (e.g., DNA, RNA, protein, or tissue structure or morphology) of the biological sample from degrading until they are measured so that when measured, the measurements represents the state of the sample at the time of obtaining it from the subject.
- a biological sample is stored in a composition that is able to penetrate the same and protect components (e.g., DNA, RNA, protein, or tissue structure or morphology) of the biological sample from degrading.
- degradation is the transformation of a component from one from to another such that the first form is no longer detected at the same level as before degradation.
- a biological sample e.g., tissue sample
- a "fixed" sample relates to a sample that has been treated with one or more agents or processes in order to prevent or reduce decay or degradation, such as autolysis or putrefaction, of the sample.
- fixative processes include but are not limited to heat fixation, immersion fixation, and perfusion.
- a fixed sample is treated with one or more fixative agents.
- fixative agents include but are not limited to cross-linking agents (e.g., aldehydes, such as formaldehyde, formalin, glutaraldehyde, etc.), precipitating agents (e.g., alcohols, such as ethanol, methanol, acetone, xylene, etc.), mercurials (e.g., B-5, Zenker's fixative, etc.), picrates, and Hepes-glutamic acid buffer-mediated organic solvent protection effect (HOPE) fixatuve.
- cross-linking agents e.g., aldehydes, such as formaldehyde, formalin, glutaraldehyde, etc.
- precipitating agents e.g., alcohols, such as ethanol, methanol, acetone, xylene, etc.
- mercurials e.g., B-5, Zenker's fixative, etc.
- picrates e.g., B-5, Zenker's fixative, etc
- a formalin-fixed biological sample is embedded in a solid substrate, for example paraffin wax.
- the biological sample is a formalin-fixed paraffin-embedded (FFPE) sample.
- FFPE formalin-fixed paraffin-embedded
- the biological sample is stored using cryopreservation.
- cryopreservation include, but are not limited to, step-down freezing, blast freezing, direct plunge freezing, snap freezing, slow freezing using a programmable freezer, and vitrification.
- the biological sample is stored using lyophilization.
- a biological sample is placed into a container that already contains a preservant (e.g., RNALater to preserve RNA) and then frozen (e.g., by snap-freezing), after the collection of the biological sample from the subject.
- a preservant e.g., RNALater to preserve RNA
- such storage in frozen state is done immediately after collection of the biological sample.
- a biological sample may be kept at either room temperature or 4oC for some time (e.g., up to an hour, up to 8 h, or up to 1 day, or a few days) in a preservant or in a buffer without a preservant, before being frozen.
- Non-limiting examples of preservants include formalin solutions, formaldehyde solutions, RNALater or other equivalent solutions, TriZol or other equivalent solutions, DNA/RNA Shield or equivalent solutions, EDTA (e.g., Buffer AE (10 mM Tris ⁇ Cl; 0.5 mM EDTA, pH 9.0)) and other coagulants, and Acids Citrate Dextronse (e.g., for blood specimens).
- EDTA e.g., Buffer AE (10 mM Tris ⁇ Cl; 0.5 mM EDTA, pH 9.0)
- Acids Citrate Dextronse e.g., for blood specimens.
- a vacutainer may be used to store blood.
- a vacutainer may comprise a preservant (e.g., a coagulant, or an anticoagulant).
- a container in which a biological sample is preserved may be contained in a secondary container, for the purpose of better preservation, or for the purpose of avoid contamination.
- any of the biological samples from a subject described herein may be stored under any condition that preserves stability of the biological sample.
- the biological sample is stored at a temperature that preserves stability of the biological sample.
- the sample is stored at room temperature (e.g., 25 °C).
- the sample is stored under refrigeration (e.g., 4 °C).
- the sample is stored under freezing conditions (e.g., -20 °C).
- the sample is stored under ultralow temperature conditions (e.g., -50 °C to -800 °C).
- the sample is stored under liquid nitrogen (e.g., -1700 °C).
- a biological sample is stored at -60°C to -80°C (e.g., -70°C) for up to 5 years (e.g., up to 1 month, up to 2 months, up to 3 months, up to 4 months, up to 5 months, up to 6 months, up to 7 months, up to 8 months, up to 9 months, up to 10 months, up to 11 months, up to 1 year, up to 2 years, up to 3 years, up to 4 years, or up to 5 years).
- a biological sample is stored as described by any of the methods described herein for up to 20 years (e.g., up to 5 years, up to 10 years, up to 15 years, or up to 20 years).
- Methods of the present disclosure encompass obtaining one or more biological samples from a subject for analysis.
- one biological sample is collected from a subject for analysis.
- more than one (e.g., 2, 3, 4, 5, 6, 7, 8, 9, 10, 11, 12, 13, 14, 15, 16, 17, 18, 19, 20, or more) biological samples are collected from a subject for analysis.
- one biological sample from a subject will be analyzed.
- more than one (e.g., 2, 3, 4, 5, 6, 7, 8, 9, 10, 11, 12, 13, 14, 15, 16, 17, 18, 19, 20, or more) biological samples may be analyzed.
- the biological samples may be procured at the same time (e.g., more than one biological sample may be taken in the same procedure), or the biological samples may be taken at different times (e.g., during a different procedure including a procedure 1, 2, 3, 4, 5, 6, 7, 8, 9, 10 days; 1, 2, 3, 4, 5, 6, 7, 8, 9, 10 weeks; 1, 2, 3, 4, 5, 6, 7, 8, 9, 10 months, 1, 2, 3, 4, 5, 6, 7, 8, 9, 10 years, or 1, 2, 3, 4, 5, 6, 7, 8, 9, 10 decades after a first procedure).
- a second or subsequent biological sample may be taken or obtained from the same region (e.g., from the same tumor or area of tissue) or a different region (including, e.g., a different tumor).
- a second or subsequent biological sample may be taken or obtained from the subject after one or more treatments and may be taken from the same region or a different region.
- the second or subsequent biological sample may be useful in determining whether the cancer in each biological sample has different characteristics (e.g., in the case of biological samples taken from two physically separate tumors in a patient) or whether the cancer has responded to one or more treatments (e.g., in the case of two or more biological samples from the same tumor or different tumors prior to and subsequent to a treatment).
- each of the at least one biological sample is a bodily fluid sample, a cell sample, or a tissue biopsy sample.
- one or more biological specimens are combined (e.g., placed in the same container for preservation) before further processing.
- a first sample of a first tumor obtained from a subject may be combined with a second sample of a second tumor from the subject, wherein the first and second tumors may or may not be the same tumor.
- a first tumor and a second tumor are similar but not the same (e.g., two tumors in the brain of a subject).
- a first biological sample and a second biological sample from a subject are sample of different types of tumors (e.g., a tumor in muscle tissue and brain tissue).
- a sample from which RNA and/or DNA is extracted is sufficiently large such that at least 2 ⁇ g (e.g., at least 2 ⁇ g, at least 2.5 ⁇ g, at least 3 ⁇ g, at least 3.5 ⁇ g or more) of RNA can be extracted from it.
- the sample from which RNA and/or DNA is extracted can be peripheral blood mononuclear cells (PBMCs).
- PBMCs peripheral blood mononuclear cells
- the sample from which RNA and/or DNA is extracted can be any type of cell suspension.
- a sample from which RNA and/or DNA is extracted is sufficiently large such that at least 1.8 ⁇ g RNA can be extracted from it.
- at least 50 mg e.g., at least 1 mg, at least 2 mg, at least 3 mg, at least 4 mg, at least 5 mg, at least 10 mg, at least 12 mg, at least 15 mg, at least 18 mg, at least 20 mg, at least 22 mg, at least 25 mg, at least 30 mg, at least 35 mg, at least 40 mg, at least 45 mg, or at least 50 mg
- tissue sample is collected from which RNA and/or DNA is extracted.
- tissue sample is collected from which RNA and/or DNA is extracted. In some embodiments, at least 30 mg of tissue sample is collected. In some embodiments, at least 10-50 mg (e.g., 10-50 mg, 10-15 mg, 10-30 mg, 10-40 mg, 20-30 mg, 20-40 mg, 20-50 mg, or 30-50 mg) of tissue sample is collected from which RNA and/or DNA is extracted. In some embodiments, at least 30 mg of tissue sample is collected. In some embodiments, at least 20-30 mg of tissue sample is collected from which RNA and/or DNA is extracted.
- a sample from which RNA and/or DNA is extracted is sufficiently large such that at least 0.2 ⁇ g (e.g., at least 200 ng, at least 300 ng, at least 400 ng, at least 500 ng, at least 600 ng, at least 700 ng, at least 800 ng, at least 900 ng, at least 1 ⁇ g, at least 1.1 ⁇ g, at least 1.2 ⁇ g, at least 1.3 ⁇ g, at least 1.4 ⁇ g, at least 1.5 ⁇ g, at least 1.6 ⁇ g, at least 1.7 ⁇ g, at least 1.8 ⁇ g, at least 1.9 ⁇ g, or at least 2 ⁇ g) of RNA can be extracted from it.
- at least 0.2 ⁇ g e.g., at least 200 ng, at least 300 ng, at least 400 ng, at least 500 ng, at least 600 ng, at least 700 ng, at least 800 ng, at least 900 ng, at least 1 ⁇ g, at least 1.1 ⁇ g,
- a sample from which RNA and/or DNA is extracted is sufficiently large such that at least 0.1 ⁇ g (e.g., at least 100 ng, at least 200 ng, at least 300 ng, at least 400 ng, at least 500 ng, at least 600 ng, at least 700 ng, at least 800 ng, at least 900 ng, at least 1 ⁇ g, at least 1.1 ⁇ g, at least 1.2 ⁇ g, at least 1.3 ⁇ g, at least 1.4 ⁇ g, at least 1.5 ⁇ g, at least 1.6 ⁇ g, at least 1.7 ⁇ g, at least 1.8 ⁇ g, at least 1.9 ⁇ g, or at least 2 ⁇ g) of RNA can be extracted from it.
- at least 0.1 ⁇ g e.g., at least 100 ng, at least 200 ng, at least 300 ng, at least 400 ng, at least 500 ng, at least 600 ng, at least 700 ng, at least 800 ng, at least 900 ng, at least 1
- a subject is a mammal (e.g., a human, a mouse, a cat, a dog, a horse, a hamster, a cow, a pig, or other domesticated animal).
- a subject is a human.
- a subject is an adult human (e.g., of 18 years of age or older).
- a subject is a child (e.g., less than 18 years of age).
- a human subject is one who has or has been diagnosed with at least one form of cancer.
- a cancer from which a subject suffers is a carcinoma, a sarcoma, a myeloma, a leukemia, a lymphoma, or a mixed type of cancer that comprises more than one of a carcinoma, a sarcoma, a myeloma, a leukemia, and a lymphoma.
- Carcinoma refers to a malignant neoplasm of epithelial origin or cancer of the internal or external lining of the body.
- Sarcoma refers to cancer that originates in supportive and connective tissues such as bones, tendons, cartilage, muscle, and fat.
- Myeloma is cancer that originates in the plasma cells of bone marrow.
- Leukemias are cancers of the bone marrow (the site of blood cell production). Lymphomas develop in the glands or nodes of the lymphatic system, a network of vessels, nodes, and organs (specifically the spleen, tonsils, and thymus) that purify bodily fluids and produce infection-fighting white blood cells, or lymphocytes.
- a mixed type of cancer include adenosquamous carcinoma, mixed mesodermal tumor, carcinosarcoma, and teratocarcinoma.
- a subject has a tumor.
- a tumor may be benign or malignant.
- a cancer is any one of the following: skin cancer, lung cancer, breast cancer, prostate cancer, colon cancer, rectal cancer, cervical cancer, and cancer of the uterus.
- a subject is at risk for developing cancer, e.g., because the subject has one or more genetic risk factors, or has been exposed to or is being exposed to one or more carcinogens (e.g., cigarette smoke, or chewing tobacco).
- Expression data (e.g., indicating expression levels) for a plurality of genes may be used for any of the methods or compositions described herein.
- the number of genes which may be examined may be up to and inclusive of all the genes of the subject. In some embodiments, expression levels may be examined for all of the genes of a subject.
- the expression data may include, for each cell type listed in Table 2, expression data for at least 5, at least 10, at least 15, at least 20, at least 25, at least 35, at least 50, at least 75, at least 100 genes selected from the group of genes for that cell type in Table 2.
- any method may be used on a sample from a subject in order to acquire expression data (e.g., indicating expression levels) for the plurality of genes.
- the expression data may be RNA expression data, DNA expression data, or protein expression data.
- DNA expression data refers to a level of DNA in a sample from a subject.
- the level of DNA in a sample from a subject having cancer may be elevated compared to the level of DNA in a sample from a subject not having cancer, e.g., a gene duplication in a cancer patient's sample.
- the level of DNA in a sample from a subject having cancer may be reduced compared to the level of DNA in a sample from a subject not having cancer, e.g., a gene deletion in a cancer patient's sample.
- DNA expression data refers to data for DNA (or gene) expressed in a sample, for example, sequencing data for a gene that is expressed in a patient's sample. Such data may be useful, in some embodiments, to determine whether the patient has one or more mutations associated with a particular cancer.
- RNA expression data may be acquired using any method known in the art including, but not limited to: whole transcriptome sequencing, total RNA sequencing, mRNA sequencing, targeted RNA sequencing, small RNA sequencing, ribosome profiling, RNA exome capture sequencing, and/or deep RNA sequencing.
- DNA expression data may be acquired using any method known in the art including any known method of DNA sequencing. For example, DNA sequencing may be used to identify one or more mutations in the DNA of a subject. Any technique used in the art to sequence DNA may be used with the methods and compositions described herein.
- the DNA may be sequenced through single-molecule real-time sequencing, ion torrent sequencing, pyrosequencing, sequencing by synthesis, sequencing by ligation (SOLiD sequencing), nanopore sequencing, or Sanger sequencing (chain termination sequencing).
- Protein expression data may be acquired using any method known in the art including, but not limited to: N-terminal amino acid analysis, C-terminal amino acid analysis, Edman degradation (including though use of a machine such as a protein sequenator), or mass spectrometry.
- the expression data is acquired through bulk RNA sequencing.
- Bulk RNA sequencing may include obtaining expression levels for one or more genes across RNA extracted from a population of multiple input cells, which population may include multiple different cell types.
- the expression data is acquired through single cell sequencing (e.g., scRNA-seq). Single cell sequencing may include sequencing individual cells.
- the expression data comprises whole exome sequencing (WES) data. In some embodiments, the expression data comprises whole genome sequencing (WGS) data. In some embodiments, the expression data comprises next-generation sequencing (NGS) data. In some embodiments, the expression data comprises microarray data.
- a method to process RNA expression data comprises obtaining RNA expression data for a subject (e.g., a subject who has or has been diagnosed with a cancer).
- obtaining RNA expression data comprises obtaining a biological sample and processing it to perform RNA sequencing using any one of the RNA sequencing methods described herein.
- RNA expression data is obtained from a lab or center that has performed experiments to obtain RNA expression data (e.g., a lab or center that has performed RNA-seq).
- a lab or center is a medical lab or center.
- RNA expression data is obtained by obtaining a computer storage medium (e.g., a data storage drive) on which the data exists.
- RNA expression data is obtained via a secured server (e.g., a SFTP server, or Illumina BaseSpace).
- data is obtained in the form of a text-based filed (e.g., a FASTQ file).
- a file in which sequencing data is stored also contains quality scores of the sequencing data).
- a file in which sequencing data is stored also contains sequence identifier information.
- a method to process RNA expression data comprises aligning and annotating genes in the RNA expression data with known sequences of the human genome to obtain annotated RNA expression data.
- alignment of RNA expression data comprises aligning the data to a known assembled genome for a particular species of subject (e.g., the genome of a human) or to a transcriptome database.
- a sequence alignment software are available and can be used to align data to an assembled genome or a transcriptome database.
- Non-limiting examples of alignment software includes short (unspliced) aligners (e.g., BLAT; BFAST, Bowtie, Burrows-Wheeler Aligner, Short Oligonucleotide Analysis package, or Mosaik), spliced aligners, aligners based on known splice junctions (e.g., Errange, IsoformEx, or Splice Seq), or de novo splice aligner (e.g., ABMapper, BBMap, CRAC, or HiSAT).
- any suitable tool can be used for aligning and annotating data.
- Kallisto github.com/pachterlab/kallisto
- a known genome is referred to as a reference genome.
- a reference genome also known as a reference assembly
- GRC Genome Reference Consortium
- human and mouse reference genomes used in any one of the methods described herein are maintained and improved by the Genome Reference Consortium (GRC).
- GPC Genome Reference Consortium
- Non-limiting examples of human reference releases are GRCh38, GRCh37, NCBI Build 36.1, NCBI Build 35, and NCBI Build 34.
- a non-limiting example of transcriptome databased include Transcriptome Shotgun Assembly (TSA).
- annotating RNA expression data comprises identifying the locations of genes and/or coding regions in the data to be processed by comparing it to assembled genomes or transcriptome databases.
- data sources for annotation include GENCODE (www.gencodegenes.org), RefSeq (see e.g., www.ncbi.nlm.nih.gov/refseq/ ), and Ensembl.
- annotating genes in RNA expression data is based on a GENCODE database (e.g., GENCODE V23 annotation; www.gencodegenes.org).
- a method to process RNA expression data comprises removing non-coding transcripts from annotated RNA expression data. Aligning and annotating RNA expression data allows identification of coding and non-coding reads.
- non-coding reads for transcripts are removed so as to concentrate analysis effort on expression of proteins (e.g., those that may be involved in pathology of cancer).
- removing reads for non-coding transcripts from the data reduces the variance in the data, e.g., in replicates of the same or similar sample (e.g., nucleic acid from the same cells or cell-type).
- non-limiting examples of expression data that is removed include one or more non-coding transcripts (e.g., 10-50, 50-100, 100-1,000, 1,000-2,500, 2,500-5,000 or more non-coding transcripts) that belong to one or more gene groups selected from the list consisting of: pseudogenes, polymorphic pseudogenes, processed pseudogenes, transcribed processed pseudogenes, unitary pseudogenes, unprocessed pseudogenes, transcribed unitary pseudogenes, constant chain immunoglobulin (IG C) pseudogenes, joining chain immunoglobulin (IG J) pseudogenes, variable chain immunoglobulin (IG V) pseudogenes, transcribed unprocessed pseudogenes, translated unprocessed pseudogenes, joining chain T cell receptor (TR J) pseudogenes, variable chain T cell receptor (TR V) pseudogenes, small nuclear RNAs (snRNA), small nucleolar RNAs (snoRNA), microRNAs (miRNA), rib
- information for one or more transcripts for one of more of these types of transcripts can be obtained in a nucleic acid database (e.g., a Gencode database, for example Gencode V23, Genbank database, EMBL database, or other database).
- a fraction e.g., 10%, 20% 30%, 40%, 50%, 60%, 70%, 80%, 90%, 95%, 98%, 99%, or 99.5% or more
- the non-coding transcripts histone-encoding gene, mitochondrial genes, interleukin-encoding genes, collagen-encoding genes, and/or T cell receptor-encoding genes as described herein are removed from aligned and annotated RNA expression data.
- a method to process RNA expression data comprises normalizing RNA expression data per length of transcript (e.g., to transcripts per kilobase million (TPM) format) that is read.
- RNA expression data that is normalized per length of transcript is first aligned and annotated. Conversion of data to TPM allows presentation of expression in the form of concentration, rather than counts, which in turn allows comparison of samples with different total read counts and/or length of reads.
- RNA expression data that is normalized per length of transcript read is then analyzed to obtain gene expression data (expression data per gene).
- gene aggregation comprises combining expression data in reads for transcripts for all isoforms of a gene to obtain expression data for that gene.
- gene aggregation to obtain gene expression data is performed after TPM normalization but before identifying genes that introduce bias. In some embodiments, gene aggregation is performed before conversion of the data to TPM.
- TPM total reads mapped to gene ⁇ 10 3 gene length in bp
- FIG. 10 An illustrative implementation of a computer system 1000 that may be used in connection with any of the embodiments of the technology described herein (e.g., such as the method of FIGs. 2 , 4 , and 6 ) is shown in FIG. 10 .
- the computer system 1000 includes one or more processors 1010 and one or more articles of manufacture that comprise non-transitory computer-readable storage media (e.g., memory 1020 and one or more non-volatile storage media 1030).
- the processor 1010 may control writing data to and reading data from the memory 1020 and the non-volatile storage device 1030 in any suitable manner, as the aspects of the technology described herein are not limited in this respect.
- the processor 1010 may execute one or more processor-executable instructions stored in one or more non-transitory computer-readable storage media (e.g., the memory 1020), which may serve as non-transitory computer-readable storage media storing processor-executable instructions for execution by the processor 1010.
- non-transitory computer-readable storage media e.g., the memory 1020
- Computing device 1000 may also include a network input/output (I/O) interface 1040 via which the computing device may communicate with other computing devices (e.g., over a network), and may also include one or more user I/O interfaces 1050, via which the computing device may provide output to and receive input from a user.
- the user I/O interfaces may include devices such as a keyboard, a mouse, a microphone, a display device (e.g., a monitor or touch screen), speakers, a camera, and/or various other types of I/O devices.
- the techniques described herein may be implemented in the illustrative environment 1100 shown in FIG. 11 .
- one or more biological samples of a subject 1180 may be provided to a laboratory 1170.
- Laboratory 1170 may process the biological sample(s) to obtain expression data (e.g., DNA, RNA, and/or protein expression data) and/or sequence information and provide it, via network 1110, to at least one database 1160 that stores information about subject (e.g., patient) 1180.
- expression data e.g., DNA, RNA, and/or protein expression data
- database 1160 that stores information about subject (e.g., patient) 1180.
- Network 1110 may be a wide area network (e.g., the Internet), a local area network (e.g., a corporate Intranet), and/or any other suitable type of network. Any of the devices shown in FIG. 11 may connect to the network 1110 using one or more wired links, one or more wireless links, and/or any suitable combination thereof.
- a wide area network e.g., the Internet
- a local area network e.g., a corporate Intranet
- Any of the devices shown in FIG. 11 may connect to the network 1110 using one or more wired links, one or more wireless links, and/or any suitable combination thereof.
- the at least one database 1120 may store expression data and or sequence information for the subject (e.g., patient), medical history data for the subject (e.g., patient), test result data for the subject (e.g., patient), and/or any other suitable information about the subject 1180. Examples of stored test result data for the subject (e.g., patient) include biopsy test results, imaging test results (e.g., MRI results), and blood test results.
- the information stored in at least one database 1120 may be stored in any suitable format and/or using any suitable data structure(s), as aspects of the technology described herein are not limited in this respect.
- the at least one database 1120 may store data in any suitable way (e.g., one or more databases, one or more files).
- the at least one database 1120 may be a single database or multiple databases.
- illustrative environment 1100 includes one or more external databases 1120, which may store information for patients other than patient 1180.
- external databases 1160 may store expression data and/or sequence information (of any suitable type) for one or more patients, medical history data for one or more patients, test result data (e.g., imaging results, biopsy results, blood test results) for one or more patients, demographic and/or biographic information for one or more patients, and/or any other suitable type of information.
- external database(s) 1160 may store information available in one or more publicly accessible databases such as TCGA (The Cancer Genome Atlas), one or more databases of clinical trial information, and/or one or more databases maintained by commercial sequencing suppliers.
- the external database(s) 1160 may store such information in any suitable way using any suitable hardware, as aspects of the technology described herein are not limited in this respect.
- the at least one database 1120 and the external database(s) 1160 may be the same database, may be part of the same database system, or may be physically co-located, as aspects of the technology described herein are not limited in this respect.
- server(s) 1140 may access information stored in database(s) 1120 and/or 1160 and use this information to perform processes described herein for determining one or more characteristics of a biological sample (e.g., determining cell composition percentages thereof) and/or of the sequence information.
- server(s) 1140 may include one or multiple computing devices. When server(s) 1140 include multiple computing devices, the device(s) may be physically co-located (e.g., in a single room) or distributed across multi-physical locations. In some embodiments, server(s) 1140 may be part of a cloud computing infrastructure. In some embodiments, one or more server(s) 1140 may be co-located in a facility operated by an entity (e.g., a hospital, research institution) with which doctor 1150 is affiliated. In such embodiments, it may be easier to allow server(s) 1140 to access private medical data for the patient 1180.
- entity e.g., a hospital, research institution
- the results of the analysis performed by server(s) 640 may be provided to doctor 1150 through a computing device 1130 (which may be a portable computing device, such as a laptop or smartphone, or a fixed computing device such as a desktop computer).
- the results may be provided in a written report, an e-mail, a graphical user interface, and/or any other suitable way.
- the results may be provided to patient 1180 or a caretaker of patient 1180, a healthcare provider such as a nurse, or a person involved with a clinical trial.
- the results may be part of a graphical user interface (GUI) presented to the doctor 1150 via the computing device 1130.
- GUI graphical user interface
- the GUI may be presented to the user as part of a webpage displayed by a web browser executing on the computing device 1130.
- the GUI may be presented to the user using an application program (different from a web-browser) executing on the computing device 1130.
- the computing device 1130 may be a mobile device (e.g., a smartphone) and the GUI may be presented to the user via an application program (e.g., "an app") executing on the mobile device.
- an application program e.g., "an app”
- Example 1 Establishment of RNA transcript normalization and analysis of sequencing technical noise.
- FIG. 12A shows the proportions of Transcripts Per Million (TPM) covering transcripts of different biological types calculated in the different samples of purified B cells sequenced in different laboratories (as an example for a cell type).
- GEO and ArrayExpress IDs of the different datasets of sorted B cells are shown as labels on the X axis.
- the transcript biological type is indicated in the legend (according to GENCODE annotation, version 23).
- variability in total expression belonging to short RNA transcripts strongly skews TPM value distribution of genes of interest due to increased variation resulting from length normalization of short transcripts.
- reads for non-coding transcripts from the data may reduce the variance in the data.
- FIG. 12B shows transcripts distribution by transcript biotype and length, as shown in the legend, of a reference human transcriptome (GENCODE, v23). Proportions of transcript numbers of different length for each biotype in the reference transcriptome are shown (with additional categories of all retained and all removed transcripts in FIG. 12C ).
- a substantial amount of noise was derived from short transcripts of TCR- and BCR-coding genes, annotated in the transcriptome as corresponding to V, D, or J regions. While T- and B-cells produce long transcripts after VDJ recombination, these short transcripts are never synthesized; therefore, different TCR and BCR variants (TCR and BCR repertoires) could not be correctly measured without specific realignment.
- TCR and BCR protein-coding transcripts were excluded from TPM normalization. Excluding non-coding transcripts and transcripts of TCR- and BCR-transcripts may reduce the variance in the data, as shown in FIG. 12B .
- FIG. 12C is a schematic representation of an exemplary process for expression quantification and TPM renormalization.
- TPM expressions of transcripts were calculated by Kallisto (Bray et al. 2016).
- Next non-coding transcripts transcripts coding for TCR/BCR associated with short V, D or J segments and other transcripts according to their biological properties and quality/evidence information are filtered.
- transcripts are aggregated by genes and normalized on 1 million TPM.
- Table 10 This table specifies example transcript groups that may be filtered and excluded from TPM normalization. All non-coding transcript biological types according to the GENCODE (Frankish et al.
- Minor groups of transcripts with low annotation or reference sequence quality Transcripts with GENCODE tags: fragmented_locus, inferred_exon_combination, low_sequence_quality, non_canonical_genome_sequence_error, non_canonical_TEC, not_best_in_genome_evidence, not_organism_supported, reference_genome_error, sequence_error
- FIGs. 12D-12E are violin plots showing the relative standard deviations in expression of 3515 housekeeping genes (Eisenberg and Levanon 2013) for different cell types before (red) and after (blue) transcript filtration and TPM renormalization. Data is grouped based on the library preparation type, using either total RNA-seq ( FIG. 12D ) or polyA RNA-seq ( FIG. 12E ). The indicated P-values are calculated by the two-sided Wilcoxon test. Medians of distributions and rank-biserial correlation coefficients are shown.
- FIG. 12F is a PCA projection of RNA expression of sorted B cells obtained from experiments using either total RNA-seq (green) or polyA RNA-seq (red), before (left) and after (right) proposed transcript filtration and renormalization. As shown, there is a decrease in unwanted batch effects between expression profiles, after the procedure of TPM renormalization described herein. Techniques for TPM normalization are described herein including with respect to the "Conversion to TPM and gene aggregation" section.
- FIG. 12G shows the dependence of relative standard deviation of technical replicates on gene expression levels (TPM). RNA-seq experiments with a total coverage of 1 (pink), 5 (yellow) and 10 (green) million readcounts are presented.
- FIG. 12H shows the dependence of mean standard deviation of gene expression on the total coverage of read counts in RNA-seq.
- the illustrated graph shows samples with sequential additions of noise level: Technical Poisson noise only (blue), all technical noise (yellow), and both technical and biological noise (red).
- FIG. 12H (right) is a violin plot showing the distribution of the same standard deviations of gene expression calculated within samples having different types of noise.
- a component of technical noise may specified by a Poisson distribution
- another component of technical noise may be specified by non-Poisson noise
- biological noise may be specified by a normal distribution.
- FIG. 12I is a plot showing measured Poisson noise coefficients for technical replicates of RNA-seq experiments with different total readcount coverage. Poisson noise is inversely proportional to the square root of the total readcount coverage of RNA-seq data.
- FIG. 12J shows the dependence of mean standard deviation of gene expression on the total coverage of read counts in RNA-seq.
- the illustrated graph shows gene expression with imputed Poisson noise (green) and data for the same samples with all technical noise (yellow).
- FIG. 12J shows the dependence of mean standard deviation of gene expression on the total coverage of read counts in RNA-seq.
- the illustrated graph shows the same data as presented in the left graph after subtraction of the imputed Poisson noise, revealing the non-Poisson addition to the technical noise. This non-Poisson technical noise does not show any dependence to sequencing coverage.
- FIG. 12K shows the dependence of mean standard deviation of gene expression on the total coverage of read counts in RNA-seq.
- the illustrated graph shows gene expression for one cell line across various laboratories and experiments, accounting for both biological and technical noise. Imputed Poisson technical noise calculated for the same samples is represented in green.
- FIG. 12K (right) shows the dependence of mean standard deviation of gene expression on the total coverage of read counts in RNA-seq. The illustrated graph shows gene expression as shown on the left after subtraction of the imputed Poisson noise, revealing the pure biological noise in the samples, which did not depend on sequencing coverage.
- Example 2 Deconvolution of microenvironment from RNA-seq of multiple normal and cancer tissues.
- RNA-seq data from multiple normal and cancer tissues.
- the cellular deconvolution techniques developed by the inventors may be referred to as "Kassandra". Specifically, techniques for selecting specific and/or semi-specific genes for cell types and/or subtypes, generating artificial mixes, training multiple non-linear regression models to determine a plurality of cell composition percentages for a plurality of cell types, using the trained non-linear regression models to determine the cell composition percentages, and other pre-processing and post-processing techniques described herein.
- FIG. 13A is a schematic representation of a validation experiment for deconvolution based on TCGA data. Data on the number of cells obtained by other methods from hematoxylin and eosin (H&E) slides and whole exome sequencing (WES) are used.
- H&E hematoxylin and eosin
- WES whole exome sequencing
- FIG. 13B are violin plots showing distributions of cell composition percentages estimated using the deconvolution techniques (e.g., using trained non-linear regression models) described herein for B-cells, CD4+, CD8+, macrophage, fibroblasts, and endothelium cells in 10,489 tumor biopsies from TCGA. As shown, tumor tissues are split by cancer type in the illustrated example.
- FIG. 13C is a t-SNE plot showing TCGA and GTEX samples calculated based on deconvolved cell percentages.
- FIG. 13D is a graph showing the Pearson correlation between percentages of lymphocytes predicted by the techniques described herein on TCGA RNA-seq data and predicted by machine analysis of histological TCGA data by (Saltz et al. 2018).
- FIG. 13E is a plot showing the correlation of predicted percentages of malignant cells from RNA-seq by the techniques described herein, with tumor purity estimated from WES for 11 TCGA cancer types.
- FIG. 13F is a graph showing Pearson correlations between tumor purity and predicted percentages of malignant cells based on RNA-seq data.
- Tumor data was derived from TCGA.
- the graph shows Pearson correlations for predictions by the techniques described herein, as well as Pearson correlations for predictions by various alternative algorithms. Compared to other algorithms, the non-linear deconvolution techniques developed by the inventors more accurately predicted the percentage of malignant cells, demonstrating an improvement over conventional techniques.
- FIG. 13G is a graph showing Pearson correlations of predicted T cell RNA percentages by the techniques described herein with T cell receptor (CDR3 region of TCR) reads by MiXCR in LUSC TCGA data.
- FIG. 13H is a graph showing Pearson correlations of predicted Plasma B cell RNA percentages by the techniques described herein with B cell receptor (CDR3 region of IgH) reads by MiXCR in LUSC TCGA data.
- FIG. 13I is a graph showing Pearson correlation values for predicted T cell RNA percentages with T cell receptor (CDR3 region of TCR) reads in different cancer types from TCGA data. Predictions by the techniques described herein and predictions by various alternative algorithms are shown. Each data point corresponds to a different cancer type (COAD, KIRC, LUAD, LUSC, READ, SKCM, TNBC).
- FIG. 13J is a graph showing Pearson correlation values for predicted Plasma B cell RNA percentages with B cell receptor (CDR3 region of IgH) reads in different cancer types from TCGA. Predictions by the techniques described herein and predictions by various alternative algorithms are shown. Each data point corresponds to a different cancer type (COAD, KIRC, LUAD, LUSC, READ, SKCM, TNBC).
- FIG. 13B the inventors analyzed the cellular composition of TCGA samples of different tumor types and healthy tissues.
- Five major cell populations were quantified including: B-cells, CD4+ T-cells, CD8+ T-cells, Macrophages, Fibroblasts, and Endothelial cells ( FIG. 13C ). These values agreed with what has been reported. For example, DLBC RNA-seq data showed a strong enrichment for B-cells.
- FIG. 13E-F the correlation between predicted tumor purity values by the techniques described herein and other deconvolution algorithms was compared using an established purity algorithm. This analysis supports the ability of the techniques described herein to accurately predict cell population from bulk RNAseq data.
- the proportion of expressed T-cell receptor (TCR) and IgH/L (B cell receptor) sequences in the RNA-seq data correlates with the presence of T or plasma B cells actively producing immunoglobulins.
- the sequences were realigned using MIXCR to measure the abundance and diversity of CDR3 transcripts, associated with different T and plasma B cell clones.
- MIXCR Magnetic Ink Characteristics
- Example 3 Deconvolution of single cell RNA-seq and bulk RNA-seq of blood.
- RNA-seq single cell RNA-seq data and bulk RNA-seq of blood data.
- the cellular deconvolution techniques developed by the inventors may be referred to as "Kassandra". Specifically, techniques for generating artificial mixes, selecting specific and/or semi-specific genes for cell types and/or subtypes, training multiple non-linear regression models to determine a plurality of cell composition percentages for a plurality of cell types, using the trained non-linear regression models to determine the cell composition percentages, and other pre-processing and post-processing techniques described herein.
- FIG. 14A is a schematic representation of a validation experiment for deconvolution using scRNA-seq samples from PBMC.
- the scRNA-seq data was artificially mixed to create a bulk RNA-seq dataset.
- FIG. 14B is a t-SNE plot of cell phenotyping across 9 single-cell PBMC datasets provided by 10x Genomics.
- the joined plot was obtained by the Seurat pipeline including SCTransform normalization, batch correction and preceding PCA(Butler et al. 2018; Stuart et al. 2019).
- different cell types and/or subtypes express key cell markers (e.g., specific and/or semi-specific genes) that distinguish them.
- FIG. 14C is a graph showing the correlation between true cell percentages from scRNA-seq of PBMC, and predictions made with the techniques described herein for the bulk RNA-seq mixture.
- FIG. 14D are plots showing correlation of true percentages from scRNA-seq of PBMC and predictions made with the techniques described herein (e.g., using non-linear regression models to determine cell composition percentages) for eight cell subtypes.
- FIG. 14E is a schematic representation of a validation experiment for deconvolution using bulk RNA-seq of PBMC or Whole blood and FACS measurement of the same sample.
- FIGs. 14F-1 and 14F-2 are graphs showing the correlation of predicted cell percentages by the techniques described herein from bulk RNA-seq, and actual cell percentages obtained by flow cytometry measurements for different cell types (CD4+ T cells, CD8+ T cells, NK cells, B cells, monocytes and neutrophils). Datasets that were used for comparison are:, GSE107572 (Finotello et al. 2019), GSE115823 (Altman et al. 2019), GSE60424 (Linsley et al. 2014), SDY67 (Zimmermann et al. 2016), GSE127813 (Newman et al. 2019), GSE53655 (Shin et al. 2014), GSE64655 (Hoek et al. 2015). Pearson correlations are shown for all cell types combined.
- RNA-seq which was built from scRNA-seq datasets derived from peripheral blood mononuclear cells (PBMCs)
- FIG. 14A-B A high correlation value was obtained when aligning the true scRNA-seq percentage with the predicted RNA-seq percentage
- FIG. 14D when graphing the correlation for each cell type separately, cell types which are present in a high number have the most significant correlation between true and predicted values.
- FIG. 14E Eight different PBMC samples were analyzed and for each sample the FACS analysis was compared to the predicted cell composition by the techniques described herein. As shown, all analysis presented with a correlation coefficient ranging from 0.900 to 0.984 ( FIG. 14F-1 and 14F-2).
- Example 4 Deconvolution of microenvironment from different cancer tissues.
- cellular deconvolution techniques developed by the inventors may be referred to as "Kassandra". Specifically, techniques for generating artificial mixes, selecting specific and/or semi-specific genes for cell types and/or subtypes, training multiple non-linear regression models to determine a plurality of cell composition percentages for a plurality of cell types, using the trained non-linear regression models to determine the cell composition percentages, and other pre-processing and post-processing techniques described herein.
- FIG. 15A depicts t-SNE plots of cell phenotyping, from left to right, in melanoma (GSE72056)(Tirosh et al. 2016), lung carcinoma (E-MTAB-6149 and E-MTAB-6653)(Lambrechts et al. 2018) and head and neck carcinoma (HNC)(GSE103322)(Puram et al. 2017) single-cell datasets.
- the t-SNE plot for lung carcinoma was obtained by the Seurat pipeline including SCTransform normalization, batch correction and preceding PCA(Butler et al. 2018; Stuart et al. 2019).
- the melanoma and head and neck carcinoma t-SNE plots were obtained by t-SNE transformation of log TPM expression values of cell-type-specific genes.
- FIG. 15B is a schematic representation of a validation experiment using scRNA-seq data derived from cancer tissues. scRNA-seq data was artificially mixed to create a bulk RNA-seq dataset.
- FIGs. 15G and 15H are heatmaps showing mean Pearson correlation values ( FIG. 15G ) and mean MAE (Mean Average Error) scores ( FIG. 15H ) between predicted values from artificial bulk RNA-seq data with true values derived from scRNA-seq data for melanoma, lung carcinoma and HNC.
- results from the techniques described herein are compared with results from alternative algorithms.
- the non-linear regression techniques developed by the inventors are shown to, on average, more accurately predict the cell composition percentages for different cell types with lower mean average error.
- FIG. 15I shows the correlation between predicted cell percentages by the techniques described herein and actual cell percentage obtained by FACS for lymphocytes, fibroblasts and lung adenocarcinoma cell line from dataset GSE121127 (Wang et al. 2018)(top) and CYTOF for bone marrow from dataset GSE120444 (Oetjen et al. 2018)(bottom).
- the Pearson correlation value (r) represents correlation value for all cell types combined.
- FIG. 15A cells from scRNA-seq were annotated manually ( FIG. 15A ) and certain percentages of each cell type were mixed to resemble a bulk-RNA-seq sample (e.g., as described herein above at least with respect to FIG. 6A ). Subsequently these cell percentages were compared with predicted values by the techniques described herein. The ability of the techniques described herein to reconstruct cell composition percentages for each cell type was measured ( FIGs. 15C-F ). The median correlation of cell types reconstruction reached ⁇ 0.97 and was the highest among other methods.
- One or more aspects and embodiments of the present disclosure involving the performance of processes or methods may utilize program instructions executable by a device (e.g., a computer, a processor, or other device) to perform, or control performance of, the processes or methods.
- a device e.g., a computer, a processor, or other device
- inventive concepts may be embodied as a computer readable storage medium (or multiple computer readable storage media) (e.g., a computer memory, one or more floppy discs, compact discs, optical discs, magnetic tapes, flash memories, circuit configurations in Field Programmable Gate Arrays or other semiconductor devices, or other tangible computer storage medium) encoded with one or more programs that, when executed on one or more computers or other processors, perform methods that implement one or more of the various embodiments described above.
- the computer readable medium or media can be transportable, such that the program or programs stored thereon can be loaded onto one or more different computers or other processors to implement various ones of the aspects described above.
- computer readable media may be non-transitory media.
- program or “software” are used herein in a generic sense to refer to any type of computer code or set of computer-executable instructions that can be employed to program a computer or other processor to implement various aspects as described above. Additionally, it should be appreciated that according to one aspect, one or more computer programs that when executed perform methods of the present disclosure need not reside on a single computer or processor, but may be distributed in a modular fashion among a number of different computers or processors to implement various aspects of the present disclosure.
- Computer-executable instructions may be in many forms, such as program modules, executed by one or more computers or other devices.
- program modules include routines, programs, objects, components, data structures, etc. that perform particular tasks or implement particular abstract data types.
- functionality of the program modules may be combined or distributed as desired in various embodiments.
- data structures may be stored in computer-readable media in any suitable form.
- data structures may be shown to have fields that are related through location in the data structure. Such relationships may likewise be achieved by assigning storage for the fields with locations in a computer-readable medium that convey relationship between the fields.
- any suitable mechanism may be used to establish a relationship between information in fields of a data structure, including through the use of pointers, tags or other mechanisms that establish relationship between data elements.
- the software code can be executed on any suitable processor or collection of processors, whether provided in a single computer or distributed among multiple computers.
- a computer may be embodied in any of a number of forms, such as a rack-mounted computer, a desktop computer, a laptop computer, or a tablet computer, as non-limiting examples. Additionally, a computer may be embedded in a device not generally regarded as a computer but with suitable processing capabilities, including a Personal Digital Assistant (PDA), a smartphone, a tablet, or any other suitable portable or fixed electronic device.
- PDA Personal Digital Assistant
- a computer may have one or more input and output devices. These devices can be used, among other things, to present a user interface. Examples of output devices that can be used to provide a user interface include printers or display screens for visual presentation of output and speakers or other sound generating devices for audible presentation of output. Examples of input devices that can be used for a user interface include keyboards, and pointing devices, such as mice, touch pads, and digitizing tablets. As another example, a computer may receive input information through speech recognition or in other audible formats.
- Such computers may be interconnected by one or more networks in any suitable form, including a local area network or a wide area network, such as an enterprise network, and intelligent network (IN) or the Internet.
- networks may be based on any suitable technology and may operate according to any suitable protocol and may include wireless networks, wired networks or fiber optic networks.
- some aspects may be embodied as one or more methods.
- the acts performed as part of the method may be ordered in any suitable way. Accordingly, embodiments may be constructed in which acts are performed in an order different than illustrated, which may include performing some acts simultaneously, even though shown as sequential acts in illustrative embodiments.
- a reference to "A and/or B", when used in conjunction with open-ended language such as “comprising” can refer, in one embodiment, to A only (optionally including elements other than B); in another embodiment, to B only (optionally including elements other than A); in yet another embodiment, to both A and B (optionally including other elements); etc.
- the phrase "at least one,” in reference to a list of one or more elements, should be understood to mean at least one element selected from any one or more of the elements in the list of elements, but not necessarily including at least one of each and every element specifically listed within the list of elements and not excluding any combinations of elements in the list of elements.
- This definition also allows that elements may optionally be present other than the elements specifically identified within the list of elements to which the phrase "at least one" refers, whether related or unrelated to those elements specifically identified.
- At least one of A and B can refer, in one embodiment, to at least one, optionally including more than one, A, with no B present (and optionally including elements other than B); in another embodiment, to at least one, optionally including more than one, B, with no A present (and optionally including elements other than A); in yet another embodiment, to at least one, optionally including more than one, A, and at least one, optionally including more than one, B (and optionally including other elements); etc.
- the terms “approximately,” “substantially,” and “about” may be used to mean within ⁇ 20% of a target value in some embodiments, within ⁇ 10% of a target value in some embodiments, within ⁇ 5% of a target value in some embodiments, within ⁇ 2% of a target value in some embodiments.
- the terms “approximately,” “substantially,” and “about” may include the target value.
Landscapes
- Engineering & Computer Science (AREA)
- Physics & Mathematics (AREA)
- Health & Medical Sciences (AREA)
- Life Sciences & Earth Sciences (AREA)
- Medical Informatics (AREA)
- Data Mining & Analysis (AREA)
- Theoretical Computer Science (AREA)
- Bioinformatics & Cheminformatics (AREA)
- Evolutionary Biology (AREA)
- Bioinformatics & Computational Biology (AREA)
- Genetics & Genomics (AREA)
- Biophysics (AREA)
- Spectroscopy & Molecular Physics (AREA)
- General Health & Medical Sciences (AREA)
- Biotechnology (AREA)
- Databases & Information Systems (AREA)
- Software Systems (AREA)
- Public Health (AREA)
- Evolutionary Computation (AREA)
- Epidemiology (AREA)
- Computer Vision & Pattern Recognition (AREA)
- Bioethics (AREA)
- Artificial Intelligence (AREA)
- Molecular Biology (AREA)
- General Physics & Mathematics (AREA)
- Mathematical Analysis (AREA)
- Computational Mathematics (AREA)
- Mathematical Optimization (AREA)
- Pure & Applied Mathematics (AREA)
- Mathematical Physics (AREA)
- Operations Research (AREA)
- Probability & Statistics with Applications (AREA)
- Algebra (AREA)
- General Engineering & Computer Science (AREA)
- Measuring Or Testing Involving Enzymes Or Micro-Organisms (AREA)
- Medical Treatment And Welfare Office Work (AREA)
Claims (15)
- Verfahren, das Folgendes umfasst:
Verwenden zumindest eines Computerhardwareprozessors, um Folgendes auszuführen:Erhalten von Expressionsdaten für eine biologische Probe, wobei die biologische Probe zuvor von einem Individuum erhalten wurde, wobei die Expressionsdaten Expressionsdaten beinhalten, die mit einer Vielzahl von Gensätzen assoziiert sind, die mit einer entsprechenden Vielzahl von Zelltypen assoziiert sind, wobei die Expressionsdaten erste Expressionsdaten umfassen, die mit einem ersten Gensatz aus der Vielzahl von Gensätzen assoziiert sind, wobei der erste Gensatz mit einem ersten Zelltyp der Vielzahl von Zelltypen assoziiert ist;Bestimmen einer Vielzahl von Zellzusammensetzungsprozentsätzen für die Vielzahl von Zelltypen, einschließlich eines ersten Zellzusammensetzungsprozentsatzes für den ersten Zelltyp, unter Verwendung der Expressionsdaten, die mit der Vielzahl von Gensätzen assoziiert sind, und einer Vielzahl von nichtlinearen Regressionsmodellen, einschließlich eines ersten nichtlinearen Regressionsmodells, wobei der erste Zellzusammensetzungsprozentsatz einen geschätzten Prozentsatz an Zellen des ersten Zelltyps in der biologischen Probe angibt, wobei das Bestimmen der Vielzahl von Zellzusammensetzungsprozentsätzen für die Vielzahl von Zelltypen, einschließlich des ersten Zellzusammensetzungsprozentsatzes für den ersten Zelltyp, Folgendes umfasst:für jeden Zelltyp der Vielzahl von Zelltypen, Verarbeiten von Expressionsdaten, die mit dem Gensatz assoziiert sind, der mit dem Zelltyp assoziiert ist, unter Verwendung eines entsprechenden nichtlinearen Regressionsmodells der Vielzahl von nichtlinearen Regressionsmodellen, um den Zellzusammensetzungsprozentsatz für den entsprechenden Zelltyp zu bestimmen, wobei das Verarbeiten von Expressionsdaten, die mit dem Gensatz assoziiert sind, der mit dem Zelltyp assoziiert ist, unter Verwendung des entsprechenden nichtlinearen Regressionsmodells der Vielzahl von nichtlinearen Regressionsmodellen, das Verarbeiten der ersten Expressionsdaten mit dem ersten nichtlinearen Regressionsmodell umfasst, um den ersten Zellzusammensetzungsprozentsatz zu bestimmen; undAusgeben des ersten Zellzusammensetzungsprozentsatzes;wobei unterschiedliche nichtlineare Regressionsmodelle verwendet werden, um die Zellzusammensetzungsprozentsätze für verschiedene Zelltypen zu bestimmen, und jedes der nichtlinearen Regressionsmodelle trainiert wurde, um Zellzusammensetzungsprozentsätze für einen spezifischen entsprechenden Zelltyp der Vielzahl von Zelltypen zu schätzen. - Verfahren nach Anspruch 1, wobei die ersten Expressionsdaten Expressionsdaten für zumindest 10 Gene umfassen, die aus einer ersten Gruppe von Genen ausgewählt sind, die mit einem ersten Zelltyp assoziiert sind, ausgewählt aus Folgenden:einer Gruppe von Genen, die mit Immunzellen assoziiert sind und die folgenden Gene umfassen:
ADAP2, ADGRE3, ADGRG3, ADORA3, AIF1, AOAH, APOBEC3D, ARHGAP 15, ARHGAP30, ARHGAP9, ARHGDIB, BANK1, BLK, C1QA, C1QC, C3AR1, C5AR1, CAMK4, CBLB, CCDC69, CCL5, CCL7, CCR1, CCR2, CCR3, CD14, CD160, CD163, CD19, CD1D, CD2, CD22, CD226, CD244, CD247, CD27, CD300A, CD300C, CD300E, CD300LB, CD302, CD33, CD37, CD3D, CD3E, CD3G, CD4, CD48, CD5, CD53, CD6, CD68, CD69, CD7, CD79A, CD79B, CD86, CEACAM8, CECR1, CELF2, CLDND2, CLEC17A, CLEC2D, CLEC5A, CLEC7A, CMKLR1, CORO1A, CPNE5, CR2, CSF1R, CSF2RA, CSF3R, CTSS, CTSW, CXCR1, CXCR2, CXCR5, CYBB, CYFIP2, CYTH4, CYTIP, DENND1C, DERL3, DOCK2, EAF2, ELF1, ELMO1, EVI2B, FAM129C, FAM78A, FCER1G, FCGR1A, FCGR1B, FCGR2A, FCGR3B, FCMR, FCN), FCRL1, FCRL2, FCRL3, FCRL5, FCRLA, FERMT3, FFAR2, FGR, FKBP11, FLT3LG, FMNL1, FNBP1, FPR1, FPR2, FPR3, GLCCI1, GLTID1, GPR174, GZMM, HCK, HCLS1, HLA-DOB, HMHA1, ICAM3, IFI30, IFITM2, IGFLRI, IGHG], IGHG3, IGHM, IGKC, IGLL5, IKZF1, IKZF3, IL10, IL16, IL2RB, IL2RG, IL4I1, INPP5D, IRF5, ITGAL, ITGAX, ITGB2, ITGB7, 1TK, KCNA3, KCNAB2, KCNJ15, KIR2DL1, KIR2DL2, KIR2DL3, KIR2DL4, KIR2DS2, KIR3DL1, KIR3DL2, KLRB1, KLRC2, KLRC3, KLRD1, KLRF1, KLRK1, LAG3, LAIR1, LAPTM5, LAT, LAX1, LCK, LCP1, LIM2, LRRC25, LSP1, LTA, LY9, MAP4K1, MEFV, MMP25, MNDA, MRC1, MS4A1, MS4A4A, MS4A6A. MSR1, MYO1F, MYO1G, MZB1, NCAM1, NCF2, NCKAPIL, NCR1, NCR3, NFATC2, NKG7, NLRC3, NMUR1, P2RY10, P2RY13, P2RY8, PADI2, PADI4, PARVG, PAX5, PGLYRP1, PHOSPHO1, PIK3AP1, P1LRA, PLA2G7, PLCB2, POU2AF1, PPPIR16B, PRF1, PRKCB, PTGDR, PTPN22, PTPN6, PTPRC, PTPRCAP, PVRIG, PYΣIIN1, RAB7B, RAC2, RASGRP1, RASGRP2, RASGRP4, RASSF5, RCSD1, RHOH, RLTPR, S1PR5, SAMD3, SAMSN1, SASH3, SEC1 1C, SH2D1B, SIGLEC1, SIGLECS, SIGLEC7, SIGLEC9, SIRPB2, SIRPG, SITI, SLA2, SLAMΓ6, SNX20, SP140, SPI1, SPIB, SPN, SSR4, STAP1. STAT5A, STK4, TAGAP, TBCID10C, TBX21, TCF7, TESPA1, TLR2, TMC8, TMIGD2. TNFAIPB, TNFAIP8L2, TNFRSF10C, TNFRSF13B, TNFRSF13C, TNFRSF17, TRAC, TRAF3IP3, TRAT1, TRBC2, TRDC, TREM2, TRGC1, TRGC2, TXNDC11, TXNDC5, TYROBP, UBASH3A, VAV1, VNN2, VNN3, VPREB3, VSIG4, WAS, XCL2, ZBED2;einer Gruppe von Genen, die mit B-Zellen assoziiert sind und die folgenden Gene umfassen: BANK1,
BLK, CD19, CD22, CD37, CD79A, CD79B, CLEC17A, CPNE5, CR2, CXCR5, DERL3, EAF2, FAM129C, FCRL1, FCRL2, FCRL3, FCRL5, FCRLA, FKBP11, GLCCI1, HLA-DOB, IGHG1, IGHG3, IGHM, IGKC, IGLL5, MS4A1, MZB1, PAX5, POU2AF1, SEC11C, SPIB, SSR4, STAP1, TNFRSF13B, TNFRSF3C, TNFRSF17, TXNIDCI1, TXNDC5, VPREB3;einer Gruppe von Genen, die mit Plasma-B-Zellen assoziiert sind und die folgenden Gene umfassen:
BANK1, BLK, CD19, CD22, CD37, CD79A, CD79B, CLEC17A, CPXE5, CR2, DERL3, EAF2, FAM129C, FCRL1, FCRL2, FCRL3, FCRL5, FCRLA, FKBP1 1, GLCCI1, HLA-DOB, IGHG1, IGHG3, IGHM, IGKC, IGLL5, MZB 1, POU2AF1, SEC11C, SPIB, SSR4, STAP1, TNFRSF13B, TNFRSF13C, TNFRSF17, TXNDC11, TXNDCS;einer Gruppe von Genen, die mit Nicht-Plasma-B-Zellen assoziiert sind und die folgenden Gene umfassen:
ADAM28, BANK1, BCL1 1A, BLK, CD19, CD22, CD37, CD72, CD79A, CD79B, CLEC17A, CPNE5, CR2, CXCR5, FAM129C, FCER2, FCRL1, FCRL2, FCRL3, FCRL5, FCRLA, HLA-DOB, MS4A1, PAX5, POU2AF1, RALGPS2, SPIB, STAP1, TNFRSF13B, TNFRSF13C, VPREB3;einer Gruppe von Genen, die mit T-Zellen assoziiert sind und die folgenden Gene umfassen: CAMK4,
CBLB, CD2, CD226, CD3D, CD3E, CD3G, CD48, CD5, CD6, CD7, FLT3LG, ITK, KCNA3, KLRB1, LAG3, LAT, LCK, LTA, SIRPG, STT1, SLA2, TBX21, TCF7, TESPA1, TRAC, TRAF3IP3, TRAT1, TRBC2, TRDC, TRGC1, TRGC2, UBASH3A, ZBED2;einer Gruppe von Genen, die mit CD4-T-Zellen assoziiert sind und die folgenden Gene umfassen:
ANKRD55, CCR4, CD2, CD27, CD28, CD3D, CD3E, CD3G, CD4, CD40LG, CD5, CD6, FHIT, FLTILG, ICOS, IKZF1, IL2RA, IL9, IRF4, ITK, LCK, LEF1, LTA, TESPA1, TNFRSF4, TRAC, TRAT1, TRBC2, UBASH3A;einer Gruppe von Genen, die mit T-reg-Zellen assoziiert sind und die folgenden Gene umfassen: CCR4,
CCR8, CD2, CD27, CD4, CTLA4, ENTPD 1, FOXP3, HAVCR2, IKZF2, IKZ1F4, 11.21R, IL2RA, IL2RB, IL2RG, ITGAE, ITK, LAG3, LTB, SIRPG, TIGIT, TNFRSF18, TNFRSF4, TNFRSF8, TNFRSF9, TRAC;einer Gruppe von Genen, die mit T-Helferzellen assoziiert sind und die folgenden Gene umfassen:
ANKRD55, CD2, CD28, CD40LG, CD5, CD6, FHIT, FLT3LG, IL7R, ITK, ITM2A, KLRB1, LCK, LEF1, LRRN3, NELL2, P2RY8, TCF7, TESPA1, THEMIS, TRAF3IP3, TRAT1;einer Gruppe von Genen, die mit CD8-T-Zellen assoziiert sind und die folgenden Gene umfassen: CCL5, CD2,
CD3D, CD3E, CD3G, CD6, CD7, CD8A, CD8B, CD96, CRTAM, CXCR3, EOMES, FCRL6, FLT3LG, GZMA, GZMB, GZMH, GZMK, ITK, KLRC2, KLRC4, KLRK1, PRF1, PRKCQ, PTGDR, PVRIG, SH2D1A, TBX21, TCF7, THEMIS, TIGIT, TRAC, TRAT1, TRBC2, UBASH3A, XCL2, ZAP70, ZBED2;einer Gruppe von Genen, die mit CD8-PD1-low-T-Zellen assoziiert sind und die folgenden Gene umfassen:
CCR7, CD160, CD28, CD5, CD8A, CD8B, CRTAM, EOMES, FCRL6, FGFBP2, GZMK, GZMM, IL7R, KCNA3, KLRF1, KLRG1, KLRK1, PRKCQ, PTGDR, PVRIG, S1PR5, SH2D1A, TCF7, ZAP70,einer Gruppe von Genen, die mit CD8-PD1-high-T-Zellen assoziiert sind und die folgenden Gene umfassen:
CBLB, CD2, CD226, CD244, CD27, CD38, CD8A, CD8B, CRTAM, CTLA4, ENTPD1, FASLG, HAVCR2, ICOS, IL2RA, IL2RB, IRF4, ITGAE, KLRC1, KLRK1, LAG3, LTA, PDCD1, PRDM1, PRKCQ, PVRIG, SH2D1A, SIRPG, TIGIT, TMIGD2, TNFRSF9,einer Gruppe von Genen, die mit NK-Zellen assoziiert sind und die folgenden Gene umfassen: CCL5,
CD160, CD244, CD247, CD7, CLDND2, CTSW, GZMM, IL2RB, KIR2DL1, KIR2DL2, KIR2DL3, KIR2DL4, KIR2DS2, KIR3DL1, KIR3DL2, KLRB1, KLRC2, KLRC3, KLRD1, KLRF1, KLRK1, LIM2, NCAM1, NCR1, NCR3, NKG7, NMUR1, PRF1, PTGDR, PYHIN1, S1PR5, SAMD3, SH2D1B, TMIGD2, XCL2,einer Gruppe von Genen, die mit Monozyten assoziiert sind und die folgenden Gene umfassen: AOAH,
CCR1, CCR2, CD1D, CD300C, CD300E, CD300LB, CD302, CD33, CECRL, CSF1R, CTSS, CYBB, FCN1, IRF5, MEFV, MS4A6A, PADI4;einer Gruppe von Genen, die mit Makrophagen assoziiert sind und die folgenden Gene umfassen:
ADAP2, ADORA3, C1QA, C1QC, C3AR1, C5AR1, CCL7, CCR1, CD14, CD163, CD33, CD4, CD68, CLEC5A, CMKLR1, CSF1R, CYBB, FPR3, IL10, IL4I1, MRC1, MS4A4A, MS4A7, MSR1, PLA2G7, RAB7B, SIGLEC1, TREM2, VSIG4;einer Gruppe von Genen, die mit M1-Makrophagen assoziiert sind und die folgenden Gene umfassen:
C15orf48, C1QC, C3AR1, CCL3, CCL3L3, CCL4L2, CCL7, CD14, CD68, CLEC5A, CSF1R, CXCL3, CYBB, GADD45G, GRAMD1A, IL10, IL12B, IL15RA, IL1RN, [L27, IL4I1, LILRB4, MMP19, PFKFB3, PLA2G7, SIGLEC1, SLAMF7, SOCS3, SOD2. SPHK1, TNF, TNFAIP6, TNIP3, VSIG4;einer Gruppe von Genen, die mit M2-Makrophagen assoziiert sind und die folgenden Gene umfassen: ADAP2,
C1QC, CCR1, CD14, CD163, CD209, CD4, CD68, CLEC5A, CMKLR1, CSFIR, CYI3B. FKBP15, FPR3, GPNMB, LACC1, LIPA, MRC1, MS4A4A, MSR1, NPL, PLA2G7, RAB42, SIGLEC1, SLC38A6, STAB1, TREM2, VSIG4;einer Gruppe von Genen, die mit Neutrophilen assoziiert sind und die folgenden Gene umfassen:
ADGRE3, ADGRG3, C5ARI, CCR3, CEACAM8, CLEC7A, CSF3R, CXCRI, CXCR2, EVI2B, FCGR2A, FCGR3B, FFAR2, FPR1, FPR2, GLT1D1, IFITM2, KCNJ 15, LILRB3, MEFV, MMP25, MNDA, P2RY13, PADI2, PADI4, PGLYRP1, PHOSPHO1, RASGRP4. SIGLEC5, TNFRSF10C, VNN2, VNN3, WAS;einer Gruppe von Genen, die mit Fibroblasten assoziiert sind und die folgenden Gene umfassen: ACTA2,
ADAMTS2, CD248, COL16A1, COL1A1, COL1A2, COL3A1, COL4A1, COL5A1, COL6A1, COL6A2, COL6A3, FAP, FBLN2, FBN1, FGF2, LOXL1, MFAP5, PCOLCE, PDGFRA, PDGFRB, TAGLN, THBS2, THY1, VEGFC;einer Gruppe von Genen, die mit Endothelzellen assoziiert sind und die folgenden Gene umfassen:
ANGPT2, APLN, CDH5, CLEC14A, ECSCR, EMCN, ENG, ESAM, ESM1, FLT1, HHIP, KDR, MMRN1, MMRN2, NOS3, PECAM1, PTPRB, RASIP1, ROBO4, SELE, TEK, TIE1, VWF;einer Gruppe von Genen, die mit myeloiden Zellen assoziiert sind und die folgenden Gene umfassen:
ACRBP, ADAP2, ADGRE2, ADGRE3, ADGRG3, ADORA3, AIF1, AOAH, C1QA, C1QC, C3AR1, C5AR1, CCL7, CCR1, CCR2, CCR3, CD14, CD163, CD1D, CD300A, CD300C, CD300E, CD300LB, CD302, CD33, CD4, CD68, CD86, CEACAM8, CECR1, CLEC5A, CLEC7A, CMKLR1, CSF1R, CSF2RA, CSF3R, CTSS, CXCR1, CXCR2, CYBB, EMILIN2, EV12B, FCER1G, FCGR1A, FCGR1B, FCGR2A, FCGR3B, FCN1, FFAR2, FGL2, FPR1, FPR2, FPR3, GLT1D1, HCK, HK3, IFI30, IFITM2, IGSF6, IL10, IL4I1, IRF5, ITGAM, ITGAX, KCNJ15, LILRA3, LILRA5, LILRA6, LILRB2, LRRC25, LYN, LYZ, MAFB, MEFV, MMP25, MNDA, MPP1, MRC1, MS4A4A, MS4A6A, MSR1, NCF2, NINJ1, OSCAR, P2RX1, P2RY13, PAD12, PADI4, PGLYRP1, PHOSPHO1, PILRA, PLA2G7, PLEK, PRKCD, PSAP, RAB7B, RASGRP4, RNASE6, RP2, SIGLEC1, SIGLEC14, SIGLEC5, SIGLEC9, SIRPB2, SPI1, STX11, TLR2, TNFRSF10C, TNFSF13, TREM2, TYROBP, VNN2, VNN3, VSIG4, WAS;einer Gruppe von Genen, die mit Lymphozyten assoziiert sind und die folgenden Gene umfassen:
ACAP1, ANXA2R, APOBEC3D, APOBEC3G, BANKI, BLK, CAMK4, CARD1I, CBLB, CCL5, CD160, CD19, CD2, CD22, CD226, CD244, CD247, CD27, CD37, CD3D, GD3E, CD3G, CD48, CD5, CD6, CD69, CD7, CD79A, CD79B, CLDND2, CLEC17A, CLEC2D, CPNE5, CR2, CTSW, CXCR5, CYFIP2, DEF6, DERL3, EAF2, ETS1, EVL, FAM129C, FCMR, FCRL1, FCRL2, FCRL3, FCRL5, FCRLA, FKBP1 1, FLT3LG, GLCCI1, GPR174. GPR18, GRAP2, GZMM, HLA-DOB, IGHG1, IGHG3, IGHM, IGKC, IGLL5, IKZF1, IKZF3, IL16, IL2RB, IL2RG, ITGB7, ITK, KCNA3, KIR2DL1, KIR2DL2, KIR2DL3, KIR2DL4, KIR2DS2, K1R3DL1, KIR3DL2, KLRB1, KLRC2, KLRC3. KLRD1, KLRF1, KLRK1, LAG3, LAT, LAX1, LCK, LIM2, LTA, LY9, MAP4K1, MS4A1, MZB1. NCAM1, NCR1, NCR3, NFATC2, NKG7, NLRC3, NMUR1, P2RY10, P2RY8, PARP15, PAX5, PIK3IP1, POU2AF1, PPP1R16B, PPP3CC, PRF1, PTGDR, PTPRCAP, PVRIG, PYHINJ, RASAL3, RASGRP1, RASGRP2, RHOH, RLTPR, S1PR5, SAMD3, SEC11C, SH2D1B, SIRPG, SIT1, SKAP1, SLA2, SLAMF6, SP140, SPIB, SSR4, STAP1, TBC1D10C, TBX21, TCF7, TESPA1, TMC6, TMC8, TMIGD2, TNFRSF13B, TNFRSF13C, TNFRSF17, TRAC, TRAF3IP3, TRAT1, TRBC2, TRDC, TRGC1, TRGC2, TXNDC11, TXNDC5, UBASH3A, VPREB3, XCL2, ZBED2, ZNF101. - Verfahren nach Anspruch 1 oder Anspruch 2, wobei das Individuum an einem Krebs leidet, vermutlich daran leidet oder ein Risiko dafür aufweist und/oder wobei die Expressionsdaten RNA-Expressionsdaten sind.
- Verfahren nach einem der vorangegangenen Ansprüche, wobei das Verarbeiten der ersten Expressionsdaten mit dem nichtlinearen Regressionsmodell Folgendes umfasst:Bereitstellen der ersten Expressionsdaten als Eingabe in das erste nichtlineare Regressionsmodell, um eine entsprechende Ausgabe zu erhalten, die einen geschätzten Prozentsatz an RNA vom ersten Zelltyp darstellt; undBestimmen, basierend auf dem geschätzten Prozentsatz an RNA vom ersten Zelltyp, des Zellzusammensetzungsprozentsatzes für den ersten Zelltyp.
- Verfahren nach einem der vorangegangenen Ansprüche, wobei:die Expressionsdaten zweite Expressionsdaten umfassen, die mit dem ersten Gensatz assoziiert sind, der mit dem ersten Zelltyp assoziiert ist; unddas erste nichtlineare Regressionsmodell Folgendes umfasst:ein erstes Submodell, das ausgelegt ist, um unter Verwendung der ersten Expressionsdaten als Eingabe einen ersten Wert für den geschätzten Prozentsatz an RNA vom ersten Zelltyp zu generieren; undein zweites Submodell, das ausgelegt ist, um unter Verwendung der zweiten Expressionsdaten und des ersten Werts für den geschätzten Prozentsatz an RNA vom ersten Zelltyp als Eingabe einen zweiten Wert für den geschätzten Prozentsatz an RNA vom ersten Zelltyp zu generieren.
- Verfahren nach einem der vorangegangenen Ansprüche, wobei die Expressionsdaten zweite Expressionsdaten umfassen, die mit einem zweiten Satz von Genen assoziiert sind, die mit einem zweiten Zelltyp assoziiert sind, der sich vom ersten Zelltyp unterscheidet,wobei das eine oder die mehreren nichtlinearen Regressionsmodelle ein zweites nichtlineares Regressionsmodell umfassen undwobei das Verfahren ferner das Bestimmen eines zweiten Zellzusammensetzungsprozentsatzes für den zweiten Zelltyp umfasst, zumindest teilweise durch Verarbeiten der zweiten Expressionsdaten mit dem zweiten nichtlinearen Regressionsmodell, um den zweiten Zellzusammensetzungsprozentsatz für den zweiten Zelltyp zu bestimmen.
- Verfahren nach einem der vorangegangenen Ansprüche, wobei der erste Zelltyp aus der aus B-Zellen, CD4+- T-Zellen, CD8+-T-Zellen, Endothelzellen, Fibroblasten, Lymphozyten, Makrophagen, Monozyten, NK-Zellen, Neutrophilen und T-Zellen bestehenden Gruppe ausgewählt ist.
- Verfahren nach einem der Ansprüche 2 bis 7, wobei Gene in der Vielzahl von Gensätzen zumindest 25, zumindest 35, zumindest 50, zumindest 75 oder zumindest 100 Gene umfassen, die aus den Gruppen von Genen in Anspruch 2 ausgewählt sind, und wobei das Bestimmen der Vielzahl von Zellzusammensetzungsprozentsätzen das Verarbeiten von Expressionsdaten für die zumindest 25, zumindest 35, zumindest 50, zumindest 75 oder zumindest 100 Gene umfasst; und/oder
wobei die Expressionsdaten zweite Expressionsdaten umfassen, die mit einem zweiten Satz von Genen assoziiert sind, die mit einem zweiten Zelltyp assoziiert sind, der sich vom ersten Zelltyp unterscheidet, wobei die zweiten Expressionsdaten RNA-Expressionsdaten für zumindest 10 Gene umfassen, die aus einer zweiten Gruppe von Genen in Anspruch 2 ausgewählt sind und wobei der zweite Zelltyp aus der aus B-Zellen, CD4+-T-Zellen, CD8+-T-Zellen, Endothelzellen, Fibroblasten, Lymphozyten, Makrophagen, Monozyten, NK-Zellen, Neutrophilen und T-Zellen bestehenden Gruppe ausgewählt ist. - Verfahren nach einem der vorangegangenen Ansprüche, wobei das eine oder die mehreren nichtlinearen Regressionsmodells ein oder mehrere Random-Forest-Regressionsmodelle umfasst und/oder wobei das eine oder die mehreren nichtlinearen Regressionsmodelle ein oder mehrere Regressionsmodelle mit neuronalen Netzwerken umfasst und/oder wobei das eine oder die mehreren nichtlinearen Regressionsmodelle ein oder mehrere Support-Vector-Machine-Regressionsmodelle umfasst.
- Verfahren nach einem der vorangegangenen Ansprüche, wobei das erste nichtlineare Regressionsmodell zumindest teilweise durch Folgendes trainiert wurde:Erhalten von simulierten Expressionsdaten; undTrainieren des ersten nichtlinearen Regressionsmodells unter Verwendung der simulierten Expressionsdaten;wobei das erste nichtlineare Regressionsmodell durch Folgendes trainiert wurde:
und/oderErhalten von Trainingsdaten, die simulierte RNA-Expressionsdaten umfassen, wobei die simulierten RNA-Expressionsdaten erste RNA-Expressionsdaten für den ersten Gensatz umfassen, der mit dem ersten Zelltyp assoziiert ist;Trainieren des ersten nichtlinearen Regressionsmodells, um einen Prozentsatz an RNA vom ersten Zelltyp zu schätzen, wobei das Trainieren Folgendes umfasst:
Generieren, unter Verwendung des ersten nichtlinearen Regressionsmodells und der ersten RNA-Expressionsdaten, eines geschätzten Prozentsatzes an RNA vom ersten Zelltyp; undAktualisieren von Parametern des ersten nichtlinearen Regressionsmodells unter Verwendung des geschätzten Prozentsatzes an RNA vom ersten Zelltyp; und/oder wobei das erste nichtlineare Modell zumindest durch Erhalten von simulierten Expressionsdaten trainiert wurde, wobei das Erhalten von simulierten Daten das Erhalten einer Vielzahl von künstlichen Mischungen durch Kombinieren von RNA-Expressionsdaten von Proben einer Vielzahl von Zelltypen in vorbestimmten Anteilen umfasst, wobei gegebenenfalls die simulierten Expressionsdaten simulierte RNA-Expressionsdaten von malignen Zellen umfassen und das Erhalten der simulierten Daten das Hinzufügen von Zufallshyperexpressionsrauschen zu den resultierenden Expressionsdaten umfasst; und
Trainieren des ersten nichtlinearen Regressionsmodells unter Verwendung der simulierten Expressionsdaten. - Verfahren nach Anspruch 10, das weiters Folgendes umfasst:Erhalten der simulierten Expressionsdaten; undTrainieren des ersten nichtlinearen Regressionsmodells unter Verwendung der simulierten Expressionsdaten.
- Verfahren nach Anspruch 11, wobei das Erhalten der simulierten Expressionsdaten das Generieren von simulierten Expressionsdaten umfasst, wobei das Generieren der simulierten Expressionsdaten Folgendes umfasst:Erhalten eines Satzes von RNA-Expressionsdaten von der einen oder den mehreren biologischen Proben, wobei der Satz von RNA-Expressionsdaten Expressionsdaten von Mikroumgebungszellen und Expressionsdaten von malignen Zellen umfassen;Generieren von simulierten Expressionsdaten von Mikroumgebungszellen unter Verwendung der Expressionsdaten von Mikroumgebungszellen;Generieren von simulierten Expressionsdaten von malignen Zellen unter Verwendung der Expressionsdaten von malignen Zellen; undKombinieren der simulierten Expressionsdaten von Mikroumgebungszellen und der simulierten Expressionsdaten von malignen Zellen, um zumindest einen Teil der simulierten Expressionsdaten zu erzeugen.
- Verfahren nach einem der vorangegangenen Ansprüche, das weiters Folgendes umfasst:
Bestimmen eines Malignitätsexpressionsprofils unter Verwendung eines Expressionsprofils für den ersten Zelltyp und des ersten Zellzusammensetzungsprozentsatzes für den ersten Zelltyp. - System, das Folgendes umfasst:zumindest einen Hardwareprozessor; undzumindest einen nichtflüchtiges computerlesbares Speichermedium, auf dem Prozessor-ausführbare Befehle gespeichert sind, die bei Ausführung durch den zumindest einen Hardwareprozessor bewirken, dass der zumindest eine Hardwareprozessor ein Verfahren nach einem der vorangegangenen Ansprüche ausführt.
- Zumindest ein nichtflüchtiges computerlesbares Speichermedium, auf dem Prozessor-ausführbare Befehle gespeichert sind, die bei Ausführung durch den zumindest einen Hardwareprozessor bewirken, dass der zumindest eine Hardwareprozessor ein Verfahren nach einem der Ansprüche 1 bis 13 ausführt.
Priority Applications (1)
| Application Number | Priority Date | Filing Date | Title |
|---|---|---|---|
| EP24161223.3A EP4383262A3 (de) | 2020-03-12 | 2021-03-12 | Systeme und verfahren zur entfaltung von expressionsdaten |
Applications Claiming Priority (3)
| Application Number | Priority Date | Filing Date | Title |
|---|---|---|---|
| US202062988700P | 2020-03-12 | 2020-03-12 | |
| US202063108262P | 2020-10-30 | 2020-10-30 | |
| PCT/US2021/022155 WO2021183917A1 (en) | 2020-03-12 | 2021-03-12 | Systems and methods for deconvolution of expression data |
Related Child Applications (2)
| Application Number | Title | Priority Date | Filing Date |
|---|---|---|---|
| EP24161223.3A Division EP4383262A3 (de) | 2020-03-12 | 2021-03-12 | Systeme und verfahren zur entfaltung von expressionsdaten |
| EP24161223.3A Division-Into EP4383262A3 (de) | 2020-03-12 | 2021-03-12 | Systeme und verfahren zur entfaltung von expressionsdaten |
Publications (2)
| Publication Number | Publication Date |
|---|---|
| EP4118657A1 EP4118657A1 (de) | 2023-01-18 |
| EP4118657B1 true EP4118657B1 (de) | 2024-05-01 |
Family
ID=75396875
Family Applications (2)
| Application Number | Title | Priority Date | Filing Date |
|---|---|---|---|
| EP24161223.3A Pending EP4383262A3 (de) | 2020-03-12 | 2021-03-12 | Systeme und verfahren zur entfaltung von expressionsdaten |
| EP21716903.6A Active EP4118657B1 (de) | 2020-03-12 | 2021-03-12 | Systeme und verfahren zur entfaltung von expressionsdaten |
Family Applications Before (1)
| Application Number | Title | Priority Date | Filing Date |
|---|---|---|---|
| EP24161223.3A Pending EP4383262A3 (de) | 2020-03-12 | 2021-03-12 | Systeme und verfahren zur entfaltung von expressionsdaten |
Country Status (7)
| Country | Link |
|---|---|
| US (3) | US11315658B2 (de) |
| EP (2) | EP4383262A3 (de) |
| JP (2) | JP7541585B2 (de) |
| AU (1) | AU2021233926B2 (de) |
| CA (1) | CA3175126A1 (de) |
| IL (1) | IL296316A (de) |
| WO (1) | WO2021183917A1 (de) |
Families Citing this family (10)
| Publication number | Priority date | Publication date | Assignee | Title |
|---|---|---|---|---|
| WO2021183917A1 (en) | 2020-03-12 | 2021-09-16 | Bostongene Corporation | Systems and methods for deconvolution of expression data |
| WO2022232615A1 (en) | 2021-04-29 | 2022-11-03 | Bostongene Corporation | Machine learning techniques for estimating tumor cell expression complex tumor tissue |
| US20220375543A1 (en) | 2021-05-18 | 2022-11-24 | Bostongene Corporation | Techniques for single sample expression projection to an expression cohort sequenced with another protocol |
| CN114038505B (zh) * | 2021-10-19 | 2024-06-14 | 清华大学 | 一种在线整合多来源单细胞数据的方法和系统 |
| AU2022376433A1 (en) | 2021-10-29 | 2024-05-09 | Bostongene Corporation | Tumor microenvironment types in breast cancer |
| WO2024108156A2 (en) | 2022-11-17 | 2024-05-23 | Bostongene Corporation | Comprehensive immunoprofiling of peripheral blood |
| US20240295486A1 (en) | 2023-03-01 | 2024-09-05 | Bostongene Corporation | Systems and methods for analyzing cytometry data |
| WO2024216069A1 (en) | 2023-04-13 | 2024-10-17 | Bostongene Corporation | Pan-cancer tumor microenvironment classification based on immune escape mechanisms and immune infiltration |
| CN116779043A (zh) * | 2023-06-30 | 2023-09-19 | 京东方科技集团股份有限公司 | 细胞比例预测方法、模型生成方法、设备及介质 |
| WO2025096811A1 (en) | 2023-10-31 | 2025-05-08 | Bostongene Corporation | Machine learning technique for identifying ici responders and non-responders |
Family Cites Families (7)
| Publication number | Priority date | Publication date | Assignee | Title |
|---|---|---|---|---|
| JP6791598B2 (ja) * | 2015-01-22 | 2020-11-25 | ザ ボード オブ トラスティーズ オブ ザ レランド スタンフォード ジュニア ユニバーシティー | 異なる細胞サブセットの比率の決定方法およびシステム |
| US10636512B2 (en) | 2017-07-14 | 2020-04-28 | Cofactor Genomics, Inc. | Immuno-oncology applications using next generation sequencing |
| US12249401B2 (en) * | 2017-07-21 | 2025-03-11 | The Board Of Trustees Of The Leland Stanford Junior University | Systems and methods for analyzing mixed cell populations |
| JP7421475B2 (ja) | 2018-06-29 | 2024-01-24 | 株式会社Preferred Networks | 学習方法、混合率予測方法及び学習装置 |
| CA3108632A1 (en) | 2018-08-06 | 2020-02-13 | Tempus Labs, Inc. | A multi-modal approach to predicting immune infiltration based on integrated rna expression and imaging features |
| JP7685436B2 (ja) | 2018-12-31 | 2025-05-29 | テンプス エーアイ,インコーポレイティド | 転移性組織サンプルのトランスクリプトームデコンボリューション |
| WO2021183917A1 (en) * | 2020-03-12 | 2021-09-16 | Bostongene Corporation | Systems and methods for deconvolution of expression data |
-
2021
- 2021-03-12 WO PCT/US2021/022155 patent/WO2021183917A1/en not_active Ceased
- 2021-03-12 EP EP24161223.3A patent/EP4383262A3/de active Pending
- 2021-03-12 AU AU2021233926A patent/AU2021233926B2/en active Active
- 2021-03-12 US US17/200,492 patent/US11315658B2/en active Active
- 2021-03-12 EP EP21716903.6A patent/EP4118657B1/de active Active
- 2021-03-12 JP JP2022554893A patent/JP7541585B2/ja active Active
- 2021-03-12 IL IL296316A patent/IL296316A/en unknown
- 2021-03-12 CA CA3175126A patent/CA3175126A1/en active Pending
-
2022
- 2022-03-29 US US17/707,623 patent/US11587642B2/en active Active
- 2022-12-15 US US18/082,157 patent/US20230178178A1/en active Pending
-
2024
- 2024-08-16 JP JP2024135878A patent/JP7818662B2/ja active Active
Also Published As
| Publication number | Publication date |
|---|---|
| US11587642B2 (en) | 2023-02-21 |
| CA3175126A1 (en) | 2021-09-16 |
| JP2024174879A (ja) | 2024-12-17 |
| IL296316A (en) | 2022-11-01 |
| EP4383262A2 (de) | 2024-06-12 |
| JP2023518185A (ja) | 2023-04-28 |
| EP4383262A3 (de) | 2024-08-14 |
| US20220230707A1 (en) | 2022-07-21 |
| WO2021183917A8 (en) | 2021-12-16 |
| AU2021233926B2 (en) | 2025-12-18 |
| AU2021233926A1 (en) | 2022-09-29 |
| EP4118657A1 (de) | 2023-01-18 |
| US20210287759A1 (en) | 2021-09-16 |
| JP7541585B2 (ja) | 2024-08-28 |
| WO2021183917A9 (en) | 2021-11-04 |
| US11315658B2 (en) | 2022-04-26 |
| JP7818662B2 (ja) | 2026-02-20 |
| US20230178178A1 (en) | 2023-06-08 |
| WO2021183917A1 (en) | 2021-09-16 |
Similar Documents
| Publication | Publication Date | Title |
|---|---|---|
| EP4118657B1 (de) | Systeme und verfahren zur entfaltung von expressionsdaten | |
| US12584180B2 (en) | Methods and systems for determining proportions of distinct cell subsets | |
| Leader et al. | Single-cell analysis of human non-small cell lung cancer lesions refines tumor classification and patient stratification | |
| Ravi et al. | T-cell dysfunction in the glioblastoma microenvironment is mediated by myeloid cells releasing interleukin-10 | |
| Massoni-Badosa et al. | An atlas of cells in the human tonsil | |
| US20230407404A1 (en) | Methods and compositions for analyzing immune infiltration in cancer stroma to predict clinical outcome | |
| US20250322909A1 (en) | Systems and Methods for Analyzing Mixed Cell Populations | |
| Mo et al. | Stromal gene expression is predictive for metastatic primary prostate cancer | |
| Barefoot et al. | Detection of cell types contributing to cancer from circulating, cell-free methylated DNA | |
| CN112602156A (zh) | 用于检测残留疾病的系统和方法 | |
| JP2022538499A (ja) | サンプル調製、サンプルシークエンシング、およびシークエンシングデータのバイアス補正と品質管理のためのシステムならびに方法 | |
| JP2021505977A (ja) | 体細胞突然変異のクローン性を決定するための方法及びシステム | |
| US11482301B2 (en) | Gene expression analysis techniques using gene rankings and statistical models for identifying biological sample characteristics | |
| Patkar et al. | Large-scale comparative analysis of canine and human osteosarcomas uncovers conserved clinically relevant tumor microenvironment subtypes | |
| Zhang et al. | Identification of five cytotoxicity-related genes involved in the progression of triple-negative breast cancer | |
| Zhang et al. | Single-nucleus sequencing unveils heterogeneity in renal cell carcinomas microenvironment: Insights into pathogenic origins and treatment-responsive cellular subgroups | |
| US20220223227A1 (en) | Machine learning techniques for identifying malignant b- and t-cell populations | |
| Zhang et al. | Comprehensive analysis of a novel RNA modifications-related model in the prognostic characterization, immune landscape and drug therapy of bladder cancer | |
| Frangieh et al. | Single-cell and spatial profiling in cancer biology and clinical oncology | |
| US20250372255A1 (en) | Machine learning model trained using artificial cell-free rna (cfrna) expression data | |
| Amechi et al. | Spatial transcriptomics and proteomics of mycosis fungoides biopsies from skin of color patients reveal biomarkers and potential treatment targets | |
| Yamamoto et al. | Rapid donor-specific single nucleotide variation detection by nanopore sequencing of ex vivo lung perfusate | |
| WO2025137363A1 (en) | Methods for detecting cellular transitions |
Legal Events
| Date | Code | Title | Description |
|---|---|---|---|
| STAA | Information on the status of an ep patent application or granted ep patent |
Free format text: STATUS: UNKNOWN |
|
| STAA | Information on the status of an ep patent application or granted ep patent |
Free format text: STATUS: THE INTERNATIONAL PUBLICATION HAS BEEN MADE |
|
| PUAI | Public reference made under article 153(3) epc to a published international application that has entered the european phase |
Free format text: ORIGINAL CODE: 0009012 |
|
| STAA | Information on the status of an ep patent application or granted ep patent |
Free format text: STATUS: REQUEST FOR EXAMINATION WAS MADE |
|
| 17P | Request for examination filed |
Effective date: 20220927 |
|
| AK | Designated contracting states |
Kind code of ref document: A1 Designated state(s): AL AT BE BG CH CY CZ DE DK EE ES FI FR GB GR HR HU IE IS IT LI LT LU LV MC MK MT NL NO PL PT RO RS SE SI SK SM TR |
|
| DAV | Request for validation of the european patent (deleted) | ||
| DAX | Request for extension of the european patent (deleted) | ||
| STAA | Information on the status of an ep patent application or granted ep patent |
Free format text: STATUS: EXAMINATION IS IN PROGRESS |
|
| 17Q | First examination report despatched |
Effective date: 20230731 |
|
| GRAP | Despatch of communication of intention to grant a patent |
Free format text: ORIGINAL CODE: EPIDOSNIGR1 |
|
| STAA | Information on the status of an ep patent application or granted ep patent |
Free format text: STATUS: GRANT OF PATENT IS INTENDED |
|
| INTG | Intention to grant announced |
Effective date: 20231102 |
|
| GRAS | Grant fee paid |
Free format text: ORIGINAL CODE: EPIDOSNIGR3 |
|
| GRAA | (expected) grant |
Free format text: ORIGINAL CODE: 0009210 |
|
| STAA | Information on the status of an ep patent application or granted ep patent |
Free format text: STATUS: THE PATENT HAS BEEN GRANTED |
|
| RIN1 | Information on inventor provided before grant (corrected) |
Inventor name: SHPAK, BORIS Inventor name: CHEREMUSHKIN, ILYA Inventor name: ATAULLAKHANOV, RAVSHAN Inventor name: BAGAEV, ALEXANDER Inventor name: DYIKANOV, DANIIAR Inventor name: ZYRIN, VLADIMIR Inventor name: NUZHDINA, EKATERINA Inventor name: CHELUSHKIN, MAKSIM Inventor name: ZAITSEV, ALEKSANDR |
|
| P01 | Opt-out of the competence of the unified patent court (upc) registered |
Effective date: 20240304 |
|
| AK | Designated contracting states |
Kind code of ref document: B1 Designated state(s): AL AT BE BG CH CY CZ DE DK EE ES FI FR GB GR HR HU IE IS IT LI LT LU LV MC MK MT NL NO PL PT RO RS SE SI SK SM TR |
|
| REG | Reference to a national code |
Ref country code: GB Ref legal event code: FG4D |
|
| REG | Reference to a national code |
Ref country code: CH Ref legal event code: EP |
|
| REG | Reference to a national code |
Ref country code: IE Ref legal event code: FG4D |
|
| REG | Reference to a national code |
Ref country code: DE Ref legal event code: R096 Ref document number: 602021012705 Country of ref document: DE |
|
| REG | Reference to a national code |
Ref country code: NL Ref legal event code: FP |
|
| REG | Reference to a national code |
Ref country code: LT Ref legal event code: MG9D |
|
| PG25 | Lapsed in a contracting state [announced via postgrant information from national office to epo] |
Ref country code: IS Free format text: LAPSE BECAUSE OF FAILURE TO SUBMIT A TRANSLATION OF THE DESCRIPTION OR TO PAY THE FEE WITHIN THE PRESCRIBED TIME-LIMIT Effective date: 20240901 |
|
| PG25 | Lapsed in a contracting state [announced via postgrant information from national office to epo] |
Ref country code: BG Free format text: LAPSE BECAUSE OF FAILURE TO SUBMIT A TRANSLATION OF THE DESCRIPTION OR TO PAY THE FEE WITHIN THE PRESCRIBED TIME-LIMIT Effective date: 20240501 |
|
| PG25 | Lapsed in a contracting state [announced via postgrant information from national office to epo] |
Ref country code: FI Free format text: LAPSE BECAUSE OF FAILURE TO SUBMIT A TRANSLATION OF THE DESCRIPTION OR TO PAY THE FEE WITHIN THE PRESCRIBED TIME-LIMIT Effective date: 20240501 Ref country code: HR Free format text: LAPSE BECAUSE OF FAILURE TO SUBMIT A TRANSLATION OF THE DESCRIPTION OR TO PAY THE FEE WITHIN THE PRESCRIBED TIME-LIMIT Effective date: 20240501 |
|
| PG25 | Lapsed in a contracting state [announced via postgrant information from national office to epo] |
Ref country code: GR Free format text: LAPSE BECAUSE OF FAILURE TO SUBMIT A TRANSLATION OF THE DESCRIPTION OR TO PAY THE FEE WITHIN THE PRESCRIBED TIME-LIMIT Effective date: 20240802 |
|
| PG25 | Lapsed in a contracting state [announced via postgrant information from national office to epo] |
Ref country code: PT Free format text: LAPSE BECAUSE OF FAILURE TO SUBMIT A TRANSLATION OF THE DESCRIPTION OR TO PAY THE FEE WITHIN THE PRESCRIBED TIME-LIMIT Effective date: 20240902 |
|
| REG | Reference to a national code |
Ref country code: AT Ref legal event code: MK05 Ref document number: 1683548 Country of ref document: AT Kind code of ref document: T Effective date: 20240501 |
|
| PG25 | Lapsed in a contracting state [announced via postgrant information from national office to epo] |
Ref country code: ES Free format text: LAPSE BECAUSE OF FAILURE TO SUBMIT A TRANSLATION OF THE DESCRIPTION OR TO PAY THE FEE WITHIN THE PRESCRIBED TIME-LIMIT Effective date: 20240501 |
|
| PG25 | Lapsed in a contracting state [announced via postgrant information from national office to epo] |
Ref country code: AT Free format text: LAPSE BECAUSE OF FAILURE TO SUBMIT A TRANSLATION OF THE DESCRIPTION OR TO PAY THE FEE WITHIN THE PRESCRIBED TIME-LIMIT Effective date: 20240501 |
|
| PG25 | Lapsed in a contracting state [announced via postgrant information from national office to epo] |
Ref country code: PL Free format text: LAPSE BECAUSE OF FAILURE TO SUBMIT A TRANSLATION OF THE DESCRIPTION OR TO PAY THE FEE WITHIN THE PRESCRIBED TIME-LIMIT Effective date: 20240501 |
|
| PG25 | Lapsed in a contracting state [announced via postgrant information from national office to epo] |
Ref country code: LV Free format text: LAPSE BECAUSE OF FAILURE TO SUBMIT A TRANSLATION OF THE DESCRIPTION OR TO PAY THE FEE WITHIN THE PRESCRIBED TIME-LIMIT Effective date: 20240501 |
|
| PG25 | Lapsed in a contracting state [announced via postgrant information from national office to epo] |
Ref country code: PT Free format text: LAPSE BECAUSE OF FAILURE TO SUBMIT A TRANSLATION OF THE DESCRIPTION OR TO PAY THE FEE WITHIN THE PRESCRIBED TIME-LIMIT Effective date: 20240902 Ref country code: PL Free format text: LAPSE BECAUSE OF FAILURE TO SUBMIT A TRANSLATION OF THE DESCRIPTION OR TO PAY THE FEE WITHIN THE PRESCRIBED TIME-LIMIT Effective date: 20240501 Ref country code: NO Free format text: LAPSE BECAUSE OF FAILURE TO SUBMIT A TRANSLATION OF THE DESCRIPTION OR TO PAY THE FEE WITHIN THE PRESCRIBED TIME-LIMIT Effective date: 20240801 Ref country code: LV Free format text: LAPSE BECAUSE OF FAILURE TO SUBMIT A TRANSLATION OF THE DESCRIPTION OR TO PAY THE FEE WITHIN THE PRESCRIBED TIME-LIMIT Effective date: 20240501 Ref country code: IS Free format text: LAPSE BECAUSE OF FAILURE TO SUBMIT A TRANSLATION OF THE DESCRIPTION OR TO PAY THE FEE WITHIN THE PRESCRIBED TIME-LIMIT Effective date: 20240901 Ref country code: HR Free format text: LAPSE BECAUSE OF FAILURE TO SUBMIT A TRANSLATION OF THE DESCRIPTION OR TO PAY THE FEE WITHIN THE PRESCRIBED TIME-LIMIT Effective date: 20240501 Ref country code: GR Free format text: LAPSE BECAUSE OF FAILURE TO SUBMIT A TRANSLATION OF THE DESCRIPTION OR TO PAY THE FEE WITHIN THE PRESCRIBED TIME-LIMIT Effective date: 20240802 Ref country code: FI Free format text: LAPSE BECAUSE OF FAILURE TO SUBMIT A TRANSLATION OF THE DESCRIPTION OR TO PAY THE FEE WITHIN THE PRESCRIBED TIME-LIMIT Effective date: 20240501 Ref country code: ES Free format text: LAPSE BECAUSE OF FAILURE TO SUBMIT A TRANSLATION OF THE DESCRIPTION OR TO PAY THE FEE WITHIN THE PRESCRIBED TIME-LIMIT Effective date: 20240501 Ref country code: BG Free format text: LAPSE BECAUSE OF FAILURE TO SUBMIT A TRANSLATION OF THE DESCRIPTION OR TO PAY THE FEE WITHIN THE PRESCRIBED TIME-LIMIT Effective date: 20240501 Ref country code: AT Free format text: LAPSE BECAUSE OF FAILURE TO SUBMIT A TRANSLATION OF THE DESCRIPTION OR TO PAY THE FEE WITHIN THE PRESCRIBED TIME-LIMIT Effective date: 20240501 Ref country code: RS Free format text: LAPSE BECAUSE OF FAILURE TO SUBMIT A TRANSLATION OF THE DESCRIPTION OR TO PAY THE FEE WITHIN THE PRESCRIBED TIME-LIMIT Effective date: 20240801 |
|
| PG25 | Lapsed in a contracting state [announced via postgrant information from national office to epo] |
Ref country code: DK Free format text: LAPSE BECAUSE OF FAILURE TO SUBMIT A TRANSLATION OF THE DESCRIPTION OR TO PAY THE FEE WITHIN THE PRESCRIBED TIME-LIMIT Effective date: 20240501 |
|
| PG25 | Lapsed in a contracting state [announced via postgrant information from national office to epo] |
Ref country code: EE Free format text: LAPSE BECAUSE OF FAILURE TO SUBMIT A TRANSLATION OF THE DESCRIPTION OR TO PAY THE FEE WITHIN THE PRESCRIBED TIME-LIMIT Effective date: 20240501 |
|
| PG25 | Lapsed in a contracting state [announced via postgrant information from national office to epo] |
Ref country code: CZ Free format text: LAPSE BECAUSE OF FAILURE TO SUBMIT A TRANSLATION OF THE DESCRIPTION OR TO PAY THE FEE WITHIN THE PRESCRIBED TIME-LIMIT Effective date: 20240501 |
|
| PG25 | Lapsed in a contracting state [announced via postgrant information from national office to epo] |
Ref country code: SK Free format text: LAPSE BECAUSE OF FAILURE TO SUBMIT A TRANSLATION OF THE DESCRIPTION OR TO PAY THE FEE WITHIN THE PRESCRIBED TIME-LIMIT Effective date: 20240501 Ref country code: RO Free format text: LAPSE BECAUSE OF FAILURE TO SUBMIT A TRANSLATION OF THE DESCRIPTION OR TO PAY THE FEE WITHIN THE PRESCRIBED TIME-LIMIT Effective date: 20240501 |
|
| PG25 | Lapsed in a contracting state [announced via postgrant information from national office to epo] |
Ref country code: SM Free format text: LAPSE BECAUSE OF FAILURE TO SUBMIT A TRANSLATION OF THE DESCRIPTION OR TO PAY THE FEE WITHIN THE PRESCRIBED TIME-LIMIT Effective date: 20240501 |
|
| PG25 | Lapsed in a contracting state [announced via postgrant information from national office to epo] |
Ref country code: SM Free format text: LAPSE BECAUSE OF FAILURE TO SUBMIT A TRANSLATION OF THE DESCRIPTION OR TO PAY THE FEE WITHIN THE PRESCRIBED TIME-LIMIT Effective date: 20240501 Ref country code: SK Free format text: LAPSE BECAUSE OF FAILURE TO SUBMIT A TRANSLATION OF THE DESCRIPTION OR TO PAY THE FEE WITHIN THE PRESCRIBED TIME-LIMIT Effective date: 20240501 Ref country code: RO Free format text: LAPSE BECAUSE OF FAILURE TO SUBMIT A TRANSLATION OF THE DESCRIPTION OR TO PAY THE FEE WITHIN THE PRESCRIBED TIME-LIMIT Effective date: 20240501 Ref country code: EE Free format text: LAPSE BECAUSE OF FAILURE TO SUBMIT A TRANSLATION OF THE DESCRIPTION OR TO PAY THE FEE WITHIN THE PRESCRIBED TIME-LIMIT Effective date: 20240501 Ref country code: DK Free format text: LAPSE BECAUSE OF FAILURE TO SUBMIT A TRANSLATION OF THE DESCRIPTION OR TO PAY THE FEE WITHIN THE PRESCRIBED TIME-LIMIT Effective date: 20240501 Ref country code: CZ Free format text: LAPSE BECAUSE OF FAILURE TO SUBMIT A TRANSLATION OF THE DESCRIPTION OR TO PAY THE FEE WITHIN THE PRESCRIBED TIME-LIMIT Effective date: 20240501 |
|
| REG | Reference to a national code |
Ref country code: DE Ref legal event code: R097 Ref document number: 602021012705 Country of ref document: DE |
|
| PG25 | Lapsed in a contracting state [announced via postgrant information from national office to epo] |
Ref country code: IT Free format text: LAPSE BECAUSE OF FAILURE TO SUBMIT A TRANSLATION OF THE DESCRIPTION OR TO PAY THE FEE WITHIN THE PRESCRIBED TIME-LIMIT Effective date: 20240501 |
|
| PLBE | No opposition filed within time limit |
Free format text: ORIGINAL CODE: 0009261 |
|
| STAA | Information on the status of an ep patent application or granted ep patent |
Free format text: STATUS: NO OPPOSITION FILED WITHIN TIME LIMIT |
|
| 26N | No opposition filed |
Effective date: 20250204 |
|
| PG25 | Lapsed in a contracting state [announced via postgrant information from national office to epo] |
Ref country code: SI Free format text: LAPSE BECAUSE OF FAILURE TO SUBMIT A TRANSLATION OF THE DESCRIPTION OR TO PAY THE FEE WITHIN THE PRESCRIBED TIME-LIMIT Effective date: 20240501 |
|
| PGFP | Annual fee paid to national office [announced via postgrant information from national office to epo] |
Ref country code: CH Payment date: 20250401 Year of fee payment: 5 |
|
| PG25 | Lapsed in a contracting state [announced via postgrant information from national office to epo] |
Ref country code: SE Free format text: LAPSE BECAUSE OF FAILURE TO SUBMIT A TRANSLATION OF THE DESCRIPTION OR TO PAY THE FEE WITHIN THE PRESCRIBED TIME-LIMIT Effective date: 20240501 |
|
| PG25 | Lapsed in a contracting state [announced via postgrant information from national office to epo] |
Ref country code: MC Free format text: LAPSE BECAUSE OF FAILURE TO SUBMIT A TRANSLATION OF THE DESCRIPTION OR TO PAY THE FEE WITHIN THE PRESCRIBED TIME-LIMIT Effective date: 20240501 |
|
| REG | Reference to a national code |
Ref country code: CH Ref legal event code: U11 Free format text: ST27 STATUS EVENT CODE: U-0-0-U10-U11 (AS PROVIDED BY THE NATIONAL OFFICE) Effective date: 20260401 |
|
| PGFP | Annual fee paid to national office [announced via postgrant information from national office to epo] |
Ref country code: GB Payment date: 20260327 Year of fee payment: 6 |
|
| PGFP | Annual fee paid to national office [announced via postgrant information from national office to epo] |
Ref country code: IE Payment date: 20260327 Year of fee payment: 6 Ref country code: DE Payment date: 20260327 Year of fee payment: 6 |
|
| PGFP | Annual fee paid to national office [announced via postgrant information from national office to epo] |
Ref country code: LU Payment date: 20260327 Year of fee payment: 6 Ref country code: BE Payment date: 20260327 Year of fee payment: 6 |
|
| PGFP | Annual fee paid to national office [announced via postgrant information from national office to epo] |
Ref country code: NL Payment date: 20260326 Year of fee payment: 6 |
|
| PGFP | Annual fee paid to national office [announced via postgrant information from national office to epo] |
Ref country code: FR Payment date: 20260325 Year of fee payment: 6 |