EP4053512A1 - Propagation time measurement device - Google Patents
Propagation time measurement device Download PDFInfo
- Publication number
- EP4053512A1 EP4053512A1 EP20882140.5A EP20882140A EP4053512A1 EP 4053512 A1 EP4053512 A1 EP 4053512A1 EP 20882140 A EP20882140 A EP 20882140A EP 4053512 A1 EP4053512 A1 EP 4053512A1
- Authority
- EP
- European Patent Office
- Prior art keywords
- signal
- transmission signal
- vibrator
- propagation time
- measurement device
- Prior art date
- Legal status (The legal status is an assumption and is not a legal conclusion. Google has not performed a legal analysis and makes no representation as to the accuracy of the status listed.)
- Pending
Links
- 238000005259 measurement Methods 0.000 title claims description 70
- 230000005540 biological transmission Effects 0.000 claims abstract description 226
- 238000005311 autocorrelation function Methods 0.000 claims abstract description 42
- 238000010219 correlation analysis Methods 0.000 claims abstract description 18
- 239000012530 fluid Substances 0.000 claims description 36
- 230000001902 propagating effect Effects 0.000 claims description 13
- 230000004044 response Effects 0.000 claims description 6
- 238000005314 correlation function Methods 0.000 description 39
- 238000010586 diagram Methods 0.000 description 23
- 238000012545 processing Methods 0.000 description 20
- 238000000034 method Methods 0.000 description 14
- 238000004088 simulation Methods 0.000 description 10
- 230000002238 attenuated effect Effects 0.000 description 9
- 238000011144 upstream manufacturing Methods 0.000 description 9
- 238000006243 chemical reaction Methods 0.000 description 5
- 230000000737 periodic effect Effects 0.000 description 5
- 230000000694 effects Effects 0.000 description 3
- 230000006870 function Effects 0.000 description 3
- 239000000463 material Substances 0.000 description 3
- 238000000691 measurement method Methods 0.000 description 3
- 230000008569 process Effects 0.000 description 3
- 238000002604 ultrasonography Methods 0.000 description 3
- 230000003321 amplification Effects 0.000 description 2
- 238000004458 analytical method Methods 0.000 description 2
- 238000004364 calculation method Methods 0.000 description 2
- 230000000052 comparative effect Effects 0.000 description 2
- 230000007423 decrease Effects 0.000 description 2
- 230000007274 generation of a signal involved in cell-cell signaling Effects 0.000 description 2
- 238000012986 modification Methods 0.000 description 2
- 230000004048 modification Effects 0.000 description 2
- 238000003199 nucleic acid amplification method Methods 0.000 description 2
- 239000011347 resin Substances 0.000 description 2
- 229920005989 resin Polymers 0.000 description 2
- 230000000717 retained effect Effects 0.000 description 2
- 238000005070 sampling Methods 0.000 description 2
- 238000012935 Averaging Methods 0.000 description 1
- 239000004809 Teflon Substances 0.000 description 1
- 229920006362 Teflon® Polymers 0.000 description 1
- 238000004891 communication Methods 0.000 description 1
- 230000000593 degrading effect Effects 0.000 description 1
- 238000002474 experimental method Methods 0.000 description 1
- 239000004519 grease Substances 0.000 description 1
- 239000007788 liquid Substances 0.000 description 1
- 239000002184 metal Substances 0.000 description 1
- 239000007787 solid Substances 0.000 description 1
- 239000000126 substance Substances 0.000 description 1
- 238000012360 testing method Methods 0.000 description 1
Images


Classifications
-
- G—PHYSICS
- G01—MEASURING; TESTING
- G01F—MEASURING VOLUME, VOLUME FLOW, MASS FLOW OR LIQUID LEVEL; METERING BY VOLUME
- G01F1/00—Measuring the volume flow or mass flow of fluid or fluent solid material wherein the fluid passes through a meter in a continuous flow
- G01F1/66—Measuring the volume flow or mass flow of fluid or fluent solid material wherein the fluid passes through a meter in a continuous flow by measuring frequency, phase shift or propagation time of electromagnetic or other waves, e.g. using ultrasonic flowmeters
- G01F1/662—Constructional details
-
- G—PHYSICS
- G01—MEASURING; TESTING
- G01F—MEASURING VOLUME, VOLUME FLOW, MASS FLOW OR LIQUID LEVEL; METERING BY VOLUME
- G01F1/00—Measuring the volume flow or mass flow of fluid or fluent solid material wherein the fluid passes through a meter in a continuous flow
- G01F1/66—Measuring the volume flow or mass flow of fluid or fluent solid material wherein the fluid passes through a meter in a continuous flow by measuring frequency, phase shift or propagation time of electromagnetic or other waves, e.g. using ultrasonic flowmeters
- G01F1/667—Arrangements of transducers for ultrasonic flowmeters; Circuits for operating ultrasonic flowmeters
Definitions
- the present invention relates to a technique for measuring the propagation time of an acoustic signal.
- Patent Literature 1 describes a device that uses a pair of upstream and downstream ultrasonic vibrators on a pipe to determine the flow rate of a fluid based on the difference in propagation time between ultrasound propagating in the flow direction of the fluid and ultrasound propagating in the direction opposite to the flow direction.
- the device in Patent Literature 1 calculates, as the propagation time difference, the cross-correlation between the signal received by the upstream ultrasonic vibrator and the signal received by the downstream ultrasonic vibrator.
- Patent Literature 2 describes use of the Hilbert transform to determine the correlation peak from the cross-correlation between an upstream reception signal and a downstream reception signal.
- a pulse signal or a burst signal is commonly used as a signal for measurement.
- these signals are susceptible to noise and limit the accuracy of cross-correlation analysis.
- known ultrasonic flowmeters cannot be used for highly accurate measurement such as measurement of low flow rates.
- one or more aspects of the present invention are directed to a technique for measuring propagation time highly accurately with high robustness to noise.
- a propagation time measurement device includes a plurality of vibrators located at different positions relative to a pipe in which a fluid flows and including at least a first vibrator that converts a transmission signal being an electric signal to an acoustic signal and a second vibrator that receives the acoustic signal transmitted from the first vibrator and propagating through the fluid in the pipe and converts the acoustic signal to a reception signal being an electric signal, a transmission signal generator that generates the transmission signal for measurement, and a signal processor that determines a propagation time of the acoustic signal from the first vibrator to the second vibrator through cross-correlation analysis between the transmission signal and the reception signal.
- the transmission signal generator generates the transmission signal to satisfy (1) a ratio of a height of a peak other than a maximum peak in an autocorrelation function of the transmission signal to a height of the maximum peak being 0.8 or less and (2) a duration of the transmission signal being at least five times a shortest period of the transmission signal or at least 20 times a half width at half maximum of the autocorrelation function of the transmission signal.
- the reception signal satisfying condition 1 causes a sufficiently large difference between the maximum peak and other peaks in the cross-correlation function between the transmission signal and the reception signal.
- the transmission signal with a duration satisfying condition 2 increases the amount of information to undergo cross-correlation analysis between the transmission signal and reception signal. This structure is expected to reduce errors in the cross-correlation function.
- the transmission signal satisfying conditions 1 and 2 causes a cross-correlation function to have fewer errors and have an easily identifiable and distinctive maximum peak. This allows accurate determination of the maximum peak position in the cross-correlation function, or more specifically, accurate determination of the propagation time of the acoustic signal.
- the transmission signal generator may generate the transmission signal to further satisfy (3) the duration of the transmission signal being at least 10 times the shortest period of the transmission signal or at least 40 times the half width at half maximum of the autocorrelation function of the transmission signal.
- Condition 3 is stricter than condition 2.
- the transmission signal with a duration satisfying condition 3 further reduces errors in the cross-correlation function to further improve the measurement accuracy of the propagation time of the acoustic signal.
- the transmission signal generator may generate the transmission signal to further satisfy (4) the duration of the transmission signal being shorter than a minimum propagation time estimated as the propagation time of the acoustic signal from the first vibrator to the second vibrator.
- the transmission period of the transmission signal and the reception period of the reception signal can avoid overlapping each other.
- crosstalk causing any transmission signal mixed into the path of the reception signal does not affect signal analysis.
- the transmission signal may include a frequency-modulated signal.
- the transmission signal may include a signal including a random pulse.
- the transmission signal may include a signal containing a plurality of signals having different frequencies combined together.
- the transmission signal may include a signal having a frequency changing at predetermined time segments.
- the signal processor may use a plurality of reception signals resulting from a plurality of transmissions from the first vibrator and a plurality of receptions by the second vibrator to perform cross-correlation analysis.
- the use of multiple reception signals reduces noise, thus improving the accuracy of cross-correlation analysis.
- the signal processor may generate a noise-reduced reception signal using the plurality of reception signals and perform cross-correlation analysis between the transmission signal and the noise-reduced reception signal.
- the cross-correlation function is calculated after noise of the reception signal is reduced using multiple reception signals. This procedure reduces the number of computations for the cross-correlation function causing a high computational load, thus enabling fast processing.
- the first vibrator and the second vibrator may face each other across the pipe.
- the first vibrator and the second vibrator may be at different positions in a longitudinal direction of the pipe.
- the propagation time measurement device may further include a switch that causes the transmission signal to be input into the second vibrator and causes the reception signal to be output from the first vibrator receiving the acoustic signal transmitted from the second vibrator.
- the signal processor may determine the propagation time of the acoustic signal from the second vibrator to the first vibrator through cross-correlation analysis between the transmission signal input into the second vibrator and the reception signal output from the first vibrator. This structure allows accurate determination of the propagation time of the acoustic signal propagating downstream and the propagation time of the acoustic signal propagating upstream for the same propagation path.
- the signal processor may determine at least one of a flow velocity or a flow rate of the fluid in the pipe based on a difference between the propagation time of the acoustic signal from the first vibrator to the second vibrator and the propagation time of the acoustic signal from the second vibrator to the first vibrator. This allows highly accurate measurement to obtain information about the fluid in the pipe.
- One or more aspects of the present invention may be directed to a propagation time measurement device including at least part of the above structure, to, for example, a flow velocity measurement device, a flow rate measurement device, a flowmeter, or a flow sensor, or to, for example, a transmission signal generation device that generates a transmission signal or a transmission circuit.
- One or more aspects of the present invention may be directed to a propagation time measurement method, a flow velocity measurement method, a flow rate measurement method, or a transmission signal generation method including at least part of the above processes, or to a program for implementing any of these methods or a non-transitory storage medium storing the program.
- the above structures and processes may be combined with one another in any manner to form one or more aspects of the present invention.
- the technique according to the above aspects of the present invention allows highly accurate measurement of propagation time with high robustness to noise.
- the propagation time measurement device 1 includes two or more vibrators 101 to receive an acoustic signal transmitted from one vibrator (e.g., vibrator 101a) with another vibrator (e.g., vibrator 101b) and measure the time (propagation time) taken for the acoustic signal to propagate on a path between the two vibrators.
- the vibrators 101 are at different positions relative to a pipe 120.
- the acoustic signal propagating between the two vibrators 101 thus travels through (crosses) the pipe 120.
- the propagation time of the acoustic signal is not constant, but varies in accordance with the state (e.g., flow velocity, flow rate, or any presence of bubbles or foreign matter) of a fluid 121 flowing in the pipe 120.
- the propagation time measured by the propagation time measurement device 1 can be used to measure the state of the fluid 121 in the pipe 120 nondestructively.
- the fluid 121 can be any substance that can transmit acoustic signals, including a liquid and a gas. Acoustic signals are typically ultrasonic, but may include audible sound waves.
- the propagation time measurement device 1 uses cross-correlation analysis to calculate the propagation time.
- a transmission signal is an electric signal for driving the transmitting vibrator 101
- a reception signal is an electric signal output from the receiving vibrator 101.
- the propagation time measurement device 1 calculates the cross-correlation function between the transmission signal and the reception signal and determines the lag (time delay) of the reception signal to the transmission signal based on the position of the maximum peak in the cross-correlation function. This lag corresponds to the propagation time of the acoustic signal from the transmitting vibrator 101 to the receiving vibrator 101.
- the lag (or propagation time) between the two signals can be determined accurately.
- the acoustic signal is attenuated while propagating through the pipe 120 and the fluid 121, with noise from various factors superimposed on the acoustic signal. This causes waveform distortion of the reception signals.
- the cross-correlation function thus has undistinctive peaks, degrading the estimation accuracy of peak positions and possibly causing erroneous selection of a peak other than a correct peak.
- a pulse or a burst signal as the transmission signal as in known ultrasonic flowmeters, is susceptible to such attenuation and noise. Flowmeters that can measure low flow rates are now awaited. Such flowmeters are to measure the propagation time with the accuracy of, for example, nanosecond order to picosecond order.
- the propagation time measurement device 1 thus uses a transmission signal designed to be highly robust against attenuation of the acoustic signal and noise in measurement. More specifically, the propagation time measurement device 1 may generate a transmission signal with the waveform and the duration satisfying conditions 1 and 2 below.
- the ratio of the height of each peak other than the maximum peak in the autocorrelation function of the transmission signal to the height of the maximum peak is 0.8 or less.
- the duration of the transmission signal is at least five times the shortest period of the transmission signal or at least 20 times the half width at half maximum of the autocorrelation function of the transmission signal.
- the cross-correlation function between the transmission signal and the reception signal has peaks repeatedly occurring at intervals corresponding to the periods of the waveform of the transmission signal.
- a reception signal with a well-retained signal waveform allows the maximum peak to be more easily distinguishable from other peaks.
- the waveform can be distorted by attenuation and noise and may increase misidentification of the maximum peak in the cross-correlation function for a highly periodic transmission signal.
- Condition 1 defines the transmission signal not to be too periodic.
- FIG. 2A shows an example autocorrelation function of a transmission signal.
- the horizontal axis represents time (time shift), and the vertical axis represents the value of autocorrelation normalized to have the maximum peak height of 1.
- the autocorrelation function of the transmission signal is the correlation between the transmission signal and a time-shifted signal of the transmission signal.
- the maximum peak occurs at the time shift being zero (at which the two signals overlap completely).
- peaks also occur at positions corresponding to the periods.
- the cross-correlation function between the transmission signal and the reception signal also has a difference between the maximum peak and the other peaks large enough to reduce misidentification of the maximum peak resulting from any waveform distortion of the reception signal due to attenuation or noise.
- Condition 2 defines the signal duration to reduce errors in the cross-correlation function.
- FIG. 2B shows an example transmission signal. The horizontal axis represents time, and the vertical axis represents amplitude. As shown in FIG. 2B , the duration of the transmission signal is the full time length of the transmission signal.
- the shortest period of the transmission signal is a period for a frequency-modulated transmission signal corresponding to the reciprocal of the maximum frequency in the transmission signal.
- the half width at half maximum of the autocorrelation function is the time shift by which the height of the maximum peak (the peak occurring at the time shift of zero) of the autocorrelation function is halved, as shown in FIG. 2A . Any transmission signal without the shortest period is to satisfy the latter part of condition 2. Any transmission signal with the shortest period is to satisfy either of the former or latter part of condition 2.
- a signal with a shorter duration has less information to undergo cross-correlation analysis. Such a signal is thus susceptible to noise contained in the reception signal and increases errors in the cross-correlation function. This can degrade the estimation accuracy of peak positions and cause misidentification of the maximum peak.
- a signal having a duration satisfying at least condition 2 is expected to reduce errors in the cross-correlation function, allowing accurate estimation of the peak position.
- condition 2 may be replaced by a stricter condition 3.
- the duration of the transmission signal is at least 10 times the shortest period of the transmission signal or at least 40 times the half width at half maximum of the autocorrelation function of the transmission signal.
- Condition 4 defines the maximum duration of the signal.
- the duration of the transmission signal is shorter than the minimum propagation time estimated as the propagation time of the acoustic signal from the transmitting vibrator to the receiving vibrator.
- the propagation time of the acoustic signal varies between when the acoustic signal propagates in the direction in which the fluid flows and when the acoustic signal propagates in the direction opposite to the direction of the fluid flow.
- the propagation time also varies depending on the propagation path, medium, and flow velocity. For example, the sizes and relative positions of the pipe and the vibrators, the characteristics of the medium through which the signal propagates, the flow velocity of the fluid, the angle of propagation, and the direction of propagation (propagating downstream or upstream) may be determined to pre-estimate the range of propagation times possibly taken by the acoustic signal. For example, with the minimum propagation time being Tmin and the maximum propagation time being Tmax, the duration of the transmission signal is to be set shorter than Tmin.
- FIG. 1 is schematic block diagram of the propagation time measurement device 1.
- FIG. 3 is a cross-sectional view of example vibrators mounted on a pipe.
- the propagation time measurement device 1 according to the present embodiment nondestructively measures the flow velocity and the flow rate of a fluid 121 flowing in a pipe 120.
- the device is also referred to as an ultrasonic flowmeter or an ultrasonic flow sensor.
- the propagation time measurement device 1 includes a main body 100 and multiple vibrators 101.
- the main body 100 and each vibrator 101 are connected with a cable.
- the structure includes two vibrators 101, or more specifically, a first vibrator 101a upstream in the longitudinal direction of the pipe 120 and a second vibrator 101b downstream from the first vibrator 101a (the two vibrators are hereafter referred to as the first vibrator 101a and the second vibrator 101b when distinguished from each other and simply as vibrators 101 when their common features are described).
- the structure may include three or more vibrators 101, rather than two vibrators 101.
- the vibrators 101 convert an electrical signal to an acoustic signal and an acoustic signal to an electric signal.
- the vibrators 101 may also be referred to as transducers.
- the vibrators 101 may be, for example, piezoelectric elements that use the piezoelectric effect to convert a force to a voltage and a voltage to a force.
- each vibrator 101 is buried in a resin clamp 30. When the clamp 30 holds the pipe 120, the two vibrators 101a and 101b face each other across the pipe 120.
- the line segment connecting the two vibrators 101a and 101b extends at a predetermined angle ⁇ with the axis of the pipe 120.
- the angle ⁇ is the propagation angle of the acoustic signal. Although the propagation angle ⁇ may be set to any angle, it may be 0 ⁇ ⁇ ⁇ 90 degrees, or more specifically, 20 ⁇ ⁇ ⁇ 60 degrees to use transit-time described below.
- the main body 100 mainly includes a control circuit 102, a digital-to-analog (D/A) converter 103, an analog-to-digital (A/D) converter 104, a switch 105, and an output device 106.
- the control circuit 102 controls the components of the propagation time measurement device 1 and performs, for example, signal processing and computations.
- the D/A converter 103 performs D/A conversion and signal amplification based on the transmission signal (digital data) input from the control circuit 102 and outputs a transmission signal (analog signal) at a predetermined voltage to one of the vibrators 101.
- the A/D converter 104 converts the reception signal (analog signal) input from another vibrator 101 to digital data at predetermined sampling intervals and outputs the reception signal (digital data) to the control circuit 102.
- the switch 105 changes the connection of the D/A converter 103 and the A/D converter 104 with the first vibrator 101a and the second vibrator 101b.
- the vibrator 101 connected to the D/A converter 103 serves as a transmitter, and the vibrator 101 connected to the A/D converter 104 as a receiver.
- the output device 106 outputs information such as the results of signal processing and computations performed by the control circuit 102.
- the output device 6 is a display.
- the main body 100 may also include an input device (e.g., buttons or a touch panel) for user operations and a communication circuit (e.g., Wi-Fi module) to transmit information to an external device (e.g., an external computer or a server).
- an input device e.g., buttons or a touch panel
- the control circuit 102 includes a transmission signal generator 110, a signal processor 111, and a storage 112.
- the transmission signal generator 110 generates transmission signal data for measurement and outputs the data to the D/A converter 103.
- the signal processor 111 calculates the propagation time of the acoustic signal based on the transmission signal and the reception signal and also calculates the flow velocity, the flow rate, or both of the fluid based on the propagation time.
- the storage 112 stores waveform data that defines the waveform of the transmission signal.
- the storage 112 can store multiple types of waveform data.
- the transmission signal generator 110 selects the appropriate type of waveform data from the storage 112 and generates the transmission signal data.
- the control circuit 102 is, for example, a computer including a central processing unit (CPU), a random-access memory (RAM), a nonvolatile storage (e.g., read-only memory or ROM, a flash memory, or a hard disk drive), an input device, and an output device.
- the CPU loads the program stored in the storage into the RAM and executes the program to implement the transmission signal generator 110 and the signal processor 111.
- Any computer may be used.
- the computer may be a personal computer, an embedded computer, a smartphone, or a tablet.
- all or part of the functions provided by the control circuit 102 may be implemented by a circuit such as an application-specific integrated circuit (ASIC) or a field-programmable gate array (FPGA).
- ASIC application-specific integrated circuit
- FPGA field-programmable gate array
- distributed computing and cloud computing may allow the control circuit 102 to cooperate with other computers to perform the processing described later.
- the pipe 120 may be formed from any material, and have any size and any shape.
- the pipe 120 may be a metal pipe or a resin pipe.
- the pipe 120 may be sized in accordance with the standard defined by Japanese Industrial Standards (JIS) or the American National Standards Institute (ANSI), or sized individually.
- JIS Japanese Industrial Standards
- ANSI American National Standards Institute
- the method in the present embodiment allows highly accurate measurement of low flow rates, and thus is particularly effective in measuring small pipes, such as 1/8-inch pipes (OD: 3.18 mm, ID: 1.59 mm), 1/4-inch pipes (OD: 6.35 mm, ID: 3.97 mm), and 1/2-inch pipes (OD: 12.70 mm, ID: 9.53 mm).
- the pipe may be bent or curved, rather than straight, and may have any cross section.
- the propagation time measurement device 1 performs measurement with a transmission signal designed to satisfy conditions 1 and 2 or conditions 1 and 3 described above. Example transmission signals satisfying these conditions will now be described.
- FIG. 4A shows an example frequency-modulated signal.
- the horizontal axis represents time, and the vertical axis represents amplitude (normalized to have the maximum amplitude of 1).
- the transmission signal in FIG. 4A has a duration of one microsecond and a frequency that increases linearly with time from 1 to 5 MHz.
- FIG. 4B shows the autocorrelation function of the transmission signal in FIG. 4A .
- the horizontal axis represents time, and the vertical axis represents the value of the autocorrelation function (normalized to have the maximum peak value of 1 when the shift is zero).
- the second peak value in the autocorrelation function is about 0.2, indicating that the transmission signal in FIG. 4A satisfies condition 1.
- the transmission signal in FIG. 4A has the shortest period of 0.2 microseconds (the wavelength corresponding to 5 MHz) and a duration that is five times the shortest period. The transmission signal in FIG. 4A thus satisfies condition 2 as well.
- the effect of the transmission signal in FIG. 4A was verified with a simulated system including the two vibrators 101a and 101b mounted on a Teflon (registered trademark) 1/8-inch pipe at an angle ⁇ of 45 degrees.
- a reception signal to be received by the second vibrator 101b in response to an input of the transmission signal in FIG. 4A into the first vibrator 101a was determined.
- the cross-correlation function between the transmission signal and the reception signal was calculated.
- the simulation results do not show lower estimation accuracy of peak positions or misidentification of the maximum peak with any attenuated reception signal or under any noise condition, thus verifying accurate determination of the propagation time.
- the propagation time of the acoustic signal between the two vibrators is about three microseconds.
- the duration of the transmission signal (one microsecond) also satisfies condition 4.
- FIG. 5A shows another example frequency-modulated signal.
- the horizontal axis represents time, and the vertical axis represents amplitude (normalized to have the maximum amplitude of 1).
- the transmission signal in FIG. 5A has a duration of one microsecond and a frequency that increases linearly with time from 3.5 to 5 MHz.
- FIG. 5B shows the autocorrelation function of the transmission signal in FIG. 5A .
- the horizontal axis represents time, and the vertical axis represents the value of the autocorrelation function (normalized to have the maximum peak value of 1 when the shift is zero).
- the second peak value in the autocorrelation function is about 0.75, indicating that the transmission signal in FIG. 5A satisfies condition 1.
- the transmission signal in FIG. 5A has the shortest period of 0.2 microseconds (the wavelength corresponding to 5 MHz) and a duration that is five times the shortest period. The transmission signal in FIG. 5A thus satisfies condition 2 as well.
- FIG. 6A shows a frequency-modulated signal in a comparative example.
- the transmission signal in FIG. 6A has a duration of one microsecond and a frequency that increases linearly with time from 4 to 5 MHz.
- FIG. 6B shows the autocorrelation function of the transmission signal in FIG. 6A .
- the second peak value in the autocorrelation function is greater than 0.8, indicating that the transmission signal in FIG. 6A does not satisfy condition 1.
- the same simulation described above was performed with the transmission signal in FIG. 6A .
- the results show the likelihood of lower estimation accuracy of peak positions and misidentification of the maximum peak with an attenuated reception signal or under a noise condition.
- the frequency may be modulated in different manners.
- the signal may have a frequency that decreases with time or have a frequency that increases or decreases nonlinearly (e.g., exponentially) with time.
- FIG. 7A shows an example transmission signal including random pulses.
- the horizontal axis represents time, and the vertical axis represents amplitude (normalized to have the maximum amplitude of 1).
- the transmission signal in FIG. 7A has a duration of 6.2 microseconds and includes a combination of multiple pulses with random widths.
- FIG. 7B shows the autocorrelation function of the transmission signal in FIG. 7A .
- the horizontal axis represents time, and the vertical axis represents the value of the autocorrelation function (normalized to have the maximum peak value of 1 when the shift is zero).
- the second peak value in the autocorrelation function is about 0.25, indicating that the transmission signal in FIG. 7A satisfies condition 1.
- the transmission signal in FIG. 7A in the autocorrelation function has the maximum peak that falls sharply, distinctively indicating that the signal duration is at least 20 times the half width at half maximum. Thus, the transmission signal in FIG. 7A satisfies condition 2 as well.
- FIG. 8A shows an example transmission signal including multiple signals having different frequencies combined together, with a signal component of 1 MHz and a signal component of 5 MHz superimposed on each other.
- the horizontal axis represents time, and the vertical axis represents amplitude (normalized to have the maximum amplitude of 1).
- the transmission signal in FIG. 8A has a duration of two microseconds.
- FIG. 8B shows the autocorrelation function of the transmission signal in FIG. 8A .
- the horizontal axis represents time, and the vertical axis represents the value of the autocorrelation function (normalized to have the maximum peak value of 1 when the shift is zero).
- the second peak value in the autocorrelation function is about 0.7, indicating that the transmission signal in FIG.
- the transmission signal in FIG. 8A satisfies condition 1.
- the transmission signal in FIG. 8A has the shortest period of 0.2 microseconds (the wavelength corresponding to 5 MHz) and a duration that is 10 times the shortest period.
- the transmission signal in FIG. 8A thus satisfies condition 3 as well.
- FIG. 9A shows an example transmission signal with a frequency that changes at predetermined time segments.
- the horizontal axis represents time, and the vertical axis represents amplitude (normalized to have the maximum amplitude of 1).
- the frequency changes every two microseconds in the order of 1 MHz, 5 MHz, 1 MHz, 3 MHz, and 1 MHz.
- the transmission signal in FIG. 9A has a duration of 10 microseconds.
- FIG. 9B shows the autocorrelation function of the transmission signal in FIG. 9A .
- the horizontal axis represents time
- the vertical axis represents the value of the autocorrelation function (normalized to have the maximum peak value of 1 when the shift is zero).
- the second peak value in the autocorrelation function is about 0.5, indicating that the transmission signal in FIG. 9A satisfies condition 1.
- the transmission signal in FIG. 9A has the shortest period of 0.2 microseconds (the wavelength corresponding to 5 MHz) and a duration that is 50 times the shortest period. The transmission signal in FIG. 9A thus satisfies condition 3 as well.
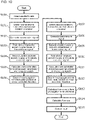
- the measurement performed by the propagation time measurement device 1 will be described with reference to the flowchart in FIG. 10 .
- the transmission signal generator 110 in the control circuit 102 reads the waveform data about a transmission signal from the storage 112.
- the waveform data about the transmission signal is in any format that defines the waveform of a transmission signal.
- the transmission signal shown in FIG. 4A and 5A can be defined with parameters such as a signal duration, the range of frequency sweep (start and end frequencies), and amplitude.
- the transmission signal shown in FIG. 7A can be defined with parameters such as a signal duration, width of each pulse in the transmission signal, and amplitude.
- the transmission signal shown in FIG. 8A can be defined with parameters such as a signal duration, the frequency of each signal component, and amplitude.
- the waveform data may be in other formats, such as a signal waveform defined by a function and a signal waveform defined by amplitude values at multiple points on a signal waveform.
- step S101 the control circuit 102 controls the switch 105 to connect the D/A converter 103 to the first vibrator 101a and the A/D converter 104 to the second vibrator 101b.
- the first vibrator 101a thus serves as a transmitter, and the second vibrator 101b as a receiver.
- step S102 the transmission signal generator 110 generates a transmission signal based on the waveform data read in step S100 and outputs the signal to the D/A converter 103.
- the transmission signal is temporarily stored in a RAM (work memory) for cross-correlation analysis performed later.
- step S103 the transmission signal resulting from D/A conversion and amplification performed by the D/A converter 103 is input into the first vibrator 101a, which then transmits an acoustic signal based on the transmission signal.
- FIG. 11A is an example transmission signal (frequency-modulated signal)
- FIG. 11B is an example acoustic signal based on the transmission signal in FIG. 11A .
- the amplitude of the acoustic signal is not constant irrespective of the constant amplitude of transmission signal due to the frequency response of the vibrator.
- the acoustic signal travels through the clamp 30, the pipe 120, and the fluid 121 to the second vibrator 101b.
- step S104 the second vibrator 101b converts the received acoustic signal into a reception signal and outputs the signal to the A/D converter 104.
- FIG. 11C shows an example of the reception signal.
- the acoustic signal is attenuated during propagation.
- the reception signal has amplitude (voltage) on the order of about 1/100 to 1/1000 the transmission signal.
- the transmission signal in FIG. 11A has amplitude of about 30 V
- the reception signal in FIG. 11C has amplitude of about 10 mV.
- various noise components are on the reception signal, as shown in FIG. 11C .
- the reception signal resulting from A/D conversion performed by the A/D converter 104 enters the control circuit 102 and is temporarily stored into the RAM (work memory).
- step S105 the signal processor 111 reads the transmission signal and the reception signal from the RAM and calculates the cross-correlation function between the two signals.
- FIG. 11D shows an example cross-correlation function, showing the area near the maximum peak alone in an enlarged manner. A distinctive peak occurs at the point corresponding to the lag between the transmission signal and the reception signal.
- the cross-correlation function is a known technique, and is not described in detail herein.
- step S106 the signal processor 111 determines the vertex position of the maximum peak in the cross-correlation function. This position corresponds to the propagation time of the acoustic signal from the first vibrator 101a to the second vibrator 101b. Due to the limitation on digital signal processing, the cross-correlation function calculated in step S105 is represented as discrete data. Thus, as shown in FIG. 12A , the points at which the cross-correlation function data is obtained (the points indicated by solid circles) may not match the vertex positions of the peak. The signal processor 111 may thus approximate the shape of the maximum peak from the discrete data for the cross-correlation function and then estimate the vertex position of the maximum peak. For example, as shown in FIG.
- the signal processor 111 may transform the data near the maximum peak in the cross-correlation function to phase data by Hilbert transform, approximate the resultant data linearly, and determine the zero crossing point (the position at which the phase is zero) of the approximate line to be the vertex position of the maximum peak.
- the signal processor 111 may estimate the shape of the maximum peak by interpolating the data near the maximum peak in the cross-correlation function by polynomial approximation to determine the vertex position. Such processing can accurately determine the position at which cross-correlation is maximum with a resolution higher than the sampling intervals of A/D conversion, or more specifically, correctly determine the propagation time of the acoustic signal.
- step S107 the control circuit 102 controls the switch 105 to connect the D/A converter 103 to the second vibrator 101b and the A/D converter 104 to the first vibrator 101a.
- the transmitting vibrator is switched to the receiving vibrator and the receiving vibrator is to the transmitting vibrator.
- the processing in subsequent steps S108 to S112 is the same as the processing in steps S102 to S106 (except that the first vibrator 101a is replaced with the second vibrator 101b and the second vibrator 101b with the first vibrator 101a).
- the processing described above determines a propagation time Tab of the acoustic signal from the first vibrator 101a to the second vibrator 101b and a propagation time Tba of the acoustic signal from the second vibrator 101b to the first vibrator 101a.
- a time difference occurs between the propagation times Tab and Tba depending on the flow velocity of the fluid 121.
- the propagation times Tab and Tba can be used to calculate the flow velocity and the flow rate of the fluid 121.
- step S113 the signal processor 111 determines a flow velocity V of the fluid 121 with the formula below.
- V L 2 cos ⁇ 1 Tba ⁇ To ⁇ 1 Tab ⁇ To
- V is the flow velocity of the fluid
- L is the length of the propagation path in the pipe
- ⁇ is the propagation angle
- Tab is the propagation time from the upstream vibrator to the downstream vibrator
- Tba is the propagation time from the downstream vibrator to the upstream vibrator
- To is the propagation time for a non-fluid portion.
- the propagation time To for the non-fluid portion is, for example, the time for the acoustic signal to propagate through the clamp 30 and the pipe 120, and can be predetermined through experiment or simulation based on the specifications of the pipe 120 (e.g., inner diameter, outer diameter, or material).
- step S114 the signal processor 111 determines a flow rate Q of the fluid with the formula below.
- Q V ⁇ A
- Q is the flow rate of the fluid
- V is the flow velocity of the fluid
- A is the hollow cross-section of the pipe.
- the hollow cross-section A is known in this example.
- step S115 the signal processor 111 outputs the processing results (e.g., propagation time, flow velocity, or flow rate) to the output device 106.
- processing results e.g., propagation time, flow velocity, or flow rate
- the structure according to the present embodiment described above uses, as a signal for measurement, the transmission signal satisfying conditions 1 and 2 or conditions 1 and 3, causing the cross-correlation function to have fewer errors and an easily identifiable and distinctive maximum peak.
- This structure allows accurate determination of the maximum peak position in the cross-correlation function, or more specifically, accurate determination of the propagation time of the acoustic signal.
- the structure can be used in highly-accurate measurement situations such as measuring a low flow rate.
- the acoustic signal is transmitted and received multiple times through the same propagation path.
- the multiple resultant reception signals are used in the cross-correlation analysis to improve the measurement accuracy.
- the basic structure is the same as described in the first embodiment.
- the second embodiment will be described focusing on the difference from the first embodiment.
- FIG. 13 is a flowchart of measurement performed by a propagation time measurement device 1 according to the second embodiment. Like numbers denote like processing steps in the flowchart in the first embodiment ( FIG. 10 ).
- step S130 the number of times the reception signal is obtained is counted.
- the processing in steps S102 to S104 is repeated until the count reaches N.
- N is set to, for example, 3 to 500 in the present embodiment, N may be any number.
- N reception signals are accumulated in the RAM.
- the signal processor 111 uses the N reception signals to generate a reception signal with reduced noise.
- the signal processor 111 may calculate the average of N reception signals or simply generate a signal by combining the N reception signals. In either case, the signal-to-noise ratio of the reception signal can be improved.
- step S132 the signal processor 111 calculates the cross-correlation function between the transmission signal and the noise-reduced reception signal.
- the processing is the same as in step S105 in the first embodiment except that the noise-reduced reception signal is used.
- step S106 the signal processor 111 determines the propagation time from the first vibrator 101a to the second vibrator 101b.
- step S107 and subsequent steps is the same as the processing described above except that the transmitting vibrator and the receiving vibrator are switched, and will not be described.
- N reception signals are used in cross-correlation analysis. This allows more accurate measurement than in the first embodiment.
- N reception signals are averaged or combined to reduce noise in the reception signal before calculation of the cross-correlation function.
- this procedure may be replaced by calculation of the cross-correlation function of each N reception signal and then averaging or combining the resultant N cross-correlation functions to reduce noise in the cross-correlation function.
- cross-correlation functions cause a high computational load.
- the former procedure may be used to reduce the number of computations for the cross-correlation function.
- the reception signals alone are averaged.
- the transmission signals may also be averaged. Such an averaged transmission signal contains less noise, thus further reducing the noise in the cross-correlation function.
- a propagation time measurement device 1 automatically sets the appropriate transmission signal waveform in accordance with the arrangement (relative positions) of the vibrator pair.
- the basic structure is the same as described in the above embodiments.
- the third embodiment will be described focusing on the difference from the above embodiments.
- FIG. 14 is a flowchart of automatic setting of a transmission signal in the third embodiment. For example, after the clamp 30 of the propagation time measurement device 1 is attached to the pipe 120, a predetermined button may be pressed to activate the automatic setting function. This causes the control circuit 102 to start the process shown in FIG. 14 .
- step S140 the control circuit 102 detects the opening degree of the clamp 30.
- the opening degree of the clamp 30 is the distance or angle between the arms of the clamp.
- the opening degree can be detected with a sensor such as a range sensor or potentiometer.
- step S141 the control circuit 102 calculates the relative positions of the two vibrators 101a and 101b based on the opening degree of the clamp 30 and estimates the propagation time of the acoustic signal based on the propagation distance between the two vibrators 101a and 101b.
- Other parameters that affect the propagation time e.g., the wall thickness and material of the pipe 120, or the flow velocity and the flow rate of the fluid 121) may be preset or may be provided by the user.
- step S142 the control circuit 102 determines the maximum duration of the transmission signal based on the estimated propagation time.
- the maximum duration may be determined to be shorter than the estimated propagation time.
- step S143 the control circuit 102 selects the waveform data for the optimum duration from multiple pieces of waveform data registered in the storage 112. For example, the control circuit 102 may select, as the waveform data for measurement, the waveform data with the longest duration from the waveform data pieces with the duration shorter than or equal to the maximum duration determined in step S142. This allows measurement using the transmission signal with the longest possible duration among transmission signals satisfying condition 4, thus improving measurement accuracy.
- the distance between the two vibrators is determined from the opening degree of the clamp 30 in the present embodiment
- the distance and propagation time may be determined by other methods. For example, after the clamp 30 is attached to the pipe 120, a test signal may be transmitted from one of the vibrators to measure the propagation time.
- the user may set parameters such as a pipe size, a fluid type, and a flow velocity. The distance and propagation time may be estimated from the set parameters.
- the embodiments described above are mere examples of the present invention.
- the present invention is not limited to the embodiments described above, but may be modified variously within the scope of the technical ideas of the invention.
- the measured propagation time is used to calculate the flow velocity and the flow rate of the fluid.
- the flow velocity and the flow rate are not calculated.
- the propagation time measurement device may simply measure the propagation time. In this case, the processing in steps S100 to S106 in the flowchart in FIG. 10 or FIG. 13 may simply be performed.
- the propagation angle ⁇ may be 90 degrees when measuring the propagation time alone.
- the clamp-on device to clamp the pipe is used.
- the device may be built in the pipe.
- the vibrators in the above embodiments may be three or more vibrators, including vibrator pairs for propagating acoustic signals downstream and vibrator pairs for propagating acoustic signals upstream.
- the first vibrator 101a may include vibrators 101c and 101d each with different frequency response.
- the second vibrator 101b may include vibrators 101c and 101d each with different frequency response.
- the vibrator 101c with a resonance frequency near 1 MHz and the vibrator 101d with a resonance frequency near 5 MHz may be arranged side by side. In this case, both of the frequency components can have higher conversion efficiency between electric signals and acoustic signals.
- Such vibrators may be effectively used with the transmission signal including combination of signals having different frequencies as in the example in FIG. 8A and with the frequency-modulated transmission signals as in the examples in FIGs. 4A and 5A .
- two vibrators 101c and 101d are combined, although three or more vibrators may be combined.
- the vibrators 101c and 101d may be aligned in the axial direction or radial direction of the pipe 120.
Landscapes
- Physics & Mathematics (AREA)
- Electromagnetism (AREA)
- Fluid Mechanics (AREA)
- General Physics & Mathematics (AREA)
- Measuring Volume Flow (AREA)
Abstract
Description
- The present invention relates to a technique for measuring the propagation time of an acoustic signal.
- Known devices in practical use measure the propagation time of an acoustic signal propagating inside a pipe with a sensor externally mounted on the pipe. Such devices nondestructively measure the flow velocity and the flow rate of a fluid flowing in the pipe based on the propagation time. Such a device typically uses ultrasound as an acoustic signal, and is referred to as, for example, an ultrasonic flowmeter.
- For example,
Patent Literature 1 describes a device that uses a pair of upstream and downstream ultrasonic vibrators on a pipe to determine the flow rate of a fluid based on the difference in propagation time between ultrasound propagating in the flow direction of the fluid and ultrasound propagating in the direction opposite to the flow direction. The device inPatent Literature 1 calculates, as the propagation time difference, the cross-correlation between the signal received by the upstream ultrasonic vibrator and the signal received by the downstream ultrasonic vibrator.Patent Literature 2 describes use of the Hilbert transform to determine the correlation peak from the cross-correlation between an upstream reception signal and a downstream reception signal. -
- Patent Literature 1:
Japanese Unexamined Patent Application Publication No. 2008-304281 - Patent Literature 2:
Japanese Unexamined Patent Application Publication No. 2002-243514 - A pulse signal or a burst signal is commonly used as a signal for measurement. However, these signals are susceptible to noise and limit the accuracy of cross-correlation analysis. Thus, known ultrasonic flowmeters cannot be used for highly accurate measurement such as measurement of low flow rates.
- In response to the above issue, one or more aspects of the present invention are directed to a technique for measuring propagation time highly accurately with high robustness to noise.
- A propagation time measurement device according to an aspect of the present disclosure includes a plurality of vibrators located at different positions relative to a pipe in which a fluid flows and including at least a first vibrator that converts a transmission signal being an electric signal to an acoustic signal and a second vibrator that receives the acoustic signal transmitted from the first vibrator and propagating through the fluid in the pipe and converts the acoustic signal to a reception signal being an electric signal, a transmission signal generator that generates the transmission signal for measurement, and a signal processor that determines a propagation time of the acoustic signal from the first vibrator to the second vibrator through cross-correlation analysis between the transmission signal and the reception signal. The transmission signal generator generates the transmission signal to satisfy (1) a ratio of a height of a peak other than a maximum peak in an autocorrelation function of the transmission signal to a height of the maximum peak being 0.8 or less and (2) a duration of the transmission signal being at least five times a shortest period of the transmission signal or at least 20 times a half width at half maximum of the autocorrelation function of the transmission signal.
- The reception signal satisfying
condition 1 causes a sufficiently large difference between the maximum peak and other peaks in the cross-correlation function between the transmission signal and the reception signal. Thus, the difference between the maximum peak and the other peaks (or easily identifiable and distinctive maximum peak) is retained for a reception signal with a waveform distorted to a certain degree by, for example, noise. The transmission signal with a durationsatisfying condition 2 increases the amount of information to undergo cross-correlation analysis between the transmission signal and reception signal. This structure is expected to reduce errors in the cross-correlation function. In other words, the transmission signal satisfyingconditions - The transmission signal generator may generate the transmission signal to further satisfy (3) the duration of the transmission signal being at least 10 times the shortest period of the transmission signal or at least 40 times the half width at half maximum of the autocorrelation function of the transmission signal. Condition 3 is stricter than
condition 2. Thus, the transmission signal with a duration satisfying condition 3 further reduces errors in the cross-correlation function to further improve the measurement accuracy of the propagation time of the acoustic signal. - The transmission signal generator may generate the transmission signal to further satisfy (4) the duration of the transmission signal being shorter than a minimum propagation time estimated as the propagation time of the acoustic signal from the first vibrator to the second vibrator. With the maximum duration of the transmission signal set to satisfy condition 4, the transmission period of the transmission signal and the reception period of the reception signal can avoid overlapping each other. Thus, crosstalk causing any transmission signal mixed into the path of the reception signal does not affect signal analysis.
- Various transmission signals can satisfy
conditions 1 to 4 described above. For example, the transmission signal may include a frequency-modulated signal. The transmission signal may include a signal including a random pulse. The transmission signal may include a signal containing a plurality of signals having different frequencies combined together. The transmission signal may include a signal having a frequency changing at predetermined time segments. - The signal processor may use a plurality of reception signals resulting from a plurality of transmissions from the first vibrator and a plurality of receptions by the second vibrator to perform cross-correlation analysis. The use of multiple reception signals reduces noise, thus improving the accuracy of cross-correlation analysis.
- The signal processor may generate a noise-reduced reception signal using the plurality of reception signals and perform cross-correlation analysis between the transmission signal and the noise-reduced reception signal. The cross-correlation function is calculated after noise of the reception signal is reduced using multiple reception signals. This procedure reduces the number of computations for the cross-correlation function causing a high computational load, thus enabling fast processing.
- The first vibrator and the second vibrator may face each other across the pipe. The first vibrator and the second vibrator may be at different positions in a longitudinal direction of the pipe.
- The propagation time measurement device may further include a switch that causes the transmission signal to be input into the second vibrator and causes the reception signal to be output from the first vibrator receiving the acoustic signal transmitted from the second vibrator. The signal processor may determine the propagation time of the acoustic signal from the second vibrator to the first vibrator through cross-correlation analysis between the transmission signal input into the second vibrator and the reception signal output from the first vibrator. This structure allows accurate determination of the propagation time of the acoustic signal propagating downstream and the propagation time of the acoustic signal propagating upstream for the same propagation path.
- The signal processor may determine at least one of a flow velocity or a flow rate of the fluid in the pipe based on a difference between the propagation time of the acoustic signal from the first vibrator to the second vibrator and the propagation time of the acoustic signal from the second vibrator to the first vibrator. This allows highly accurate measurement to obtain information about the fluid in the pipe.
- One or more aspects of the present invention may be directed to a propagation time measurement device including at least part of the above structure, to, for example, a flow velocity measurement device, a flow rate measurement device, a flowmeter, or a flow sensor, or to, for example, a transmission signal generation device that generates a transmission signal or a transmission circuit. One or more aspects of the present invention may be directed to a propagation time measurement method, a flow velocity measurement method, a flow rate measurement method, or a transmission signal generation method including at least part of the above processes, or to a program for implementing any of these methods or a non-transitory storage medium storing the program. The above structures and processes may be combined with one another in any manner to form one or more aspects of the present invention.
- The technique according to the above aspects of the present invention allows highly accurate measurement of propagation time with high robustness to noise.
-
-
FIG. 1 is a schematic diagram of a propagation time measurement device. -
FIG. 2A is a diagram of an example autocorrelation function of a transmission signal, andFIG. 2B is a diagram of an example transmission signal. -
FIG. 3 is a cross-sectional view of example vibrators mounted on a pipe. -
FIG. 4A is a diagram of an example frequency modulated signal, andFIG. 4B is a diagram of the autocorrelation function of the transmission signal inFIG. 4A . -
FIG. 5A is a diagram of an example frequency modulated signal, andFIG. 5B is a diagram of the autocorrelation function of the transmission signal inFIG. 5A . -
FIG. 6A is a diagram of a frequency modulated signal in a comparative example, andFIG. 6B is a diagram of the autocorrelation function of the frequency modulated signal inFIG. 6A . -
FIG. 7A is a diagram of an example transmission signal including random pulses, andFIG. 7B is a diagram of the autocorrelation function of the transmission signal inFIG. 7A . -
FIG. 8A is a diagram of an example transmission signal including multiple signals having different frequencies combined together, andFIG. 8B is a diagram of the autocorrelation function of the transmission signal inFIG. 8A . -
FIG. 9A is a diagram of an example transmission signal having a frequency that changes at predetermined time segments, andFIG. 9B is a diagram of the autocorrelation function of the transmission signal inFIG. 9A . -
FIG. 10 is a flowchart of measurement performed by a propagation time measurement device according to a first embodiment. -
FIG. 11A is a diagram of an example transmission signal,FIG. 11B is a diagram of an example acoustic signal based on the transmission signal inFIG. 11A, FIG. 11C is a diagram of an example reception signal, andFIG. 11D is a diagram of an example cross-correlation function. -
FIG. 12A is an enlarged diagram of the area near the maximum peak of a cross-correlation function, andFIG. 12B is a diagram of an example of the Hilbert transform. -
FIG. 13 is a flowchart of measurement performed by a propagation time measurement device according to a second embodiment. -
FIG. 14 is a flowchart of automatic setting of a transmission signal in a third embodiment. -
FIGs. 15A and 15B are diagrams of vibrators in modifications. - An example use of a propagation time measurement device will be described with reference to
FIG. 1 . - The propagation
time measurement device 1 includes two ormore vibrators 101 to receive an acoustic signal transmitted from one vibrator (e.g., vibrator 101a) with another vibrator (e.g.,vibrator 101b) and measure the time (propagation time) taken for the acoustic signal to propagate on a path between the two vibrators. Thevibrators 101 are at different positions relative to apipe 120. The acoustic signal propagating between the twovibrators 101 thus travels through (crosses) thepipe 120. The propagation time of the acoustic signal is not constant, but varies in accordance with the state (e.g., flow velocity, flow rate, or any presence of bubbles or foreign matter) of a fluid 121 flowing in thepipe 120. Thus, the propagation time measured by the propagationtime measurement device 1 can be used to measure the state of the fluid 121 in thepipe 120 nondestructively. - The fluid 121 can be any substance that can transmit acoustic signals, including a liquid and a gas. Acoustic signals are typically ultrasonic, but may include audible sound waves.
- The propagation
time measurement device 1 uses cross-correlation analysis to calculate the propagation time. For example, a transmission signal is an electric signal for driving the transmittingvibrator 101, and a reception signal is an electric signal output from the receivingvibrator 101. The propagationtime measurement device 1 calculates the cross-correlation function between the transmission signal and the reception signal and determines the lag (time delay) of the reception signal to the transmission signal based on the position of the maximum peak in the cross-correlation function. This lag corresponds to the propagation time of the acoustic signal from the transmittingvibrator 101 to the receivingvibrator 101. - When the signal waveform of the transmission signal is retained sufficiently in the reception signal, a distinctive peak occurs in the cross-correlation function. Thus, the lag (or propagation time) between the two signals can be determined accurately. However, in real situations, the acoustic signal is attenuated while propagating through the
pipe 120 and the fluid 121, with noise from various factors superimposed on the acoustic signal. This causes waveform distortion of the reception signals. The cross-correlation function thus has undistinctive peaks, degrading the estimation accuracy of peak positions and possibly causing erroneous selection of a peak other than a correct peak. A pulse or a burst signal as the transmission signal, as in known ultrasonic flowmeters, is susceptible to such attenuation and noise. Flowmeters that can measure low flow rates are now awaited. Such flowmeters are to measure the propagation time with the accuracy of, for example, nanosecond order to picosecond order. - The propagation
time measurement device 1 thus uses a transmission signal designed to be highly robust against attenuation of the acoustic signal and noise in measurement. More specifically, the propagationtime measurement device 1 may generate a transmission signal with the waveform and the durationsatisfying conditions -
Condition 1. The ratio of the height of each peak other than the maximum peak in the autocorrelation function of the transmission signal to the height of the maximum peak is 0.8 or less. -
Condition 2. The duration of the transmission signal is at least five times the shortest period of the transmission signal or at least 20 times the half width at half maximum of the autocorrelation function of the transmission signal. - For a highly periodic transmission signal, the cross-correlation function between the transmission signal and the reception signal has peaks repeatedly occurring at intervals corresponding to the periods of the waveform of the transmission signal. A reception signal with a well-retained signal waveform allows the maximum peak to be more easily distinguishable from other peaks. However, as described above, the waveform can be distorted by attenuation and noise and may increase misidentification of the maximum peak in the cross-correlation function for a highly periodic transmission signal.
Condition 1 defines the transmission signal not to be too periodic. -
FIG. 2A shows an example autocorrelation function of a transmission signal. The horizontal axis represents time (time shift), and the vertical axis represents the value of autocorrelation normalized to have the maximum peak height of 1. The autocorrelation function of the transmission signal is the correlation between the transmission signal and a time-shifted signal of the transmission signal. The maximum peak occurs at the time shift being zero (at which the two signals overlap completely). For a transmission signal having a periodic waveform, peaks also occur at positions corresponding to the periods. Whencondition 1 is satisfied, or more specifically, when the ratio of the height of each peak other than the maximum peak to the height of the maximum peak is 0.8 or less, the waveform of the transmission signal is sufficiently less periodic. In this case, the cross-correlation function between the transmission signal and the reception signal also has a difference between the maximum peak and the other peaks large enough to reduce misidentification of the maximum peak resulting from any waveform distortion of the reception signal due to attenuation or noise. -
Condition 2 defines the signal duration to reduce errors in the cross-correlation function.FIG. 2B shows an example transmission signal. The horizontal axis represents time, and the vertical axis represents amplitude. As shown inFIG. 2B , the duration of the transmission signal is the full time length of the transmission signal. The shortest period of the transmission signal is a period for a frequency-modulated transmission signal corresponding to the reciprocal of the maximum frequency in the transmission signal. The half width at half maximum of the autocorrelation function is the time shift by which the height of the maximum peak (the peak occurring at the time shift of zero) of the autocorrelation function is halved, as shown inFIG. 2A . Any transmission signal without the shortest period is to satisfy the latter part ofcondition 2. Any transmission signal with the shortest period is to satisfy either of the former or latter part ofcondition 2. - A signal with a shorter duration has less information to undergo cross-correlation analysis. Such a signal is thus susceptible to noise contained in the reception signal and increases errors in the cross-correlation function. This can degrade the estimation accuracy of peak positions and cause misidentification of the maximum peak. In contrast, a signal having a duration satisfying at least
condition 2 is expected to reduce errors in the cross-correlation function, allowing accurate estimation of the peak position. - A signal having a longer duration is expected to reduce errors more effectively. In this case,
condition 2 may be replaced by a stricter condition 3. - Condition 3. The duration of the transmission signal is at least 10 times the shortest period of the transmission signal or at least 40 times the half width at half maximum of the autocorrelation function of the transmission signal.
- In addition to
conditions conditions 1 and 3, condition 4 below may be added. Condition 4 defines the maximum duration of the signal. - Condition 4. The duration of the transmission signal is shorter than the minimum propagation time estimated as the propagation time of the acoustic signal from the transmitting vibrator to the receiving vibrator.
- The propagation time of the acoustic signal varies between when the acoustic signal propagates in the direction in which the fluid flows and when the acoustic signal propagates in the direction opposite to the direction of the fluid flow. The propagation time also varies depending on the propagation path, medium, and flow velocity. For example, the sizes and relative positions of the pipe and the vibrators, the characteristics of the medium through which the signal propagates, the flow velocity of the fluid, the angle of propagation, and the direction of propagation (propagating downstream or upstream) may be determined to pre-estimate the range of propagation times possibly taken by the acoustic signal. For example, with the minimum propagation time being Tmin and the maximum propagation time being Tmax, the duration of the transmission signal is to be set shorter than Tmin.
- Acoustic signals are attenuated during propagation, and thus the reception signal level is much lower than the transmission signal level. Thus, any overlap between the transmission period of the transmission signal and the reception period of the reception signal can cause the transmission signal to be mixed into the reception signal through stray capacitance in the circuit and increase the noise in the reception signal. With the maximum duration of the transmission signal set to satisfy condition 4, the transmission period and the reception period can avoid overlapping each other. Thus, any transmission signal mixed into the path of the reception signal does not affect signal analysis. When any other measure is taken to prevent mixing of the signal or when the noise resulting from the signal mixing is negligible, condition 4 (or the maximum duration) may not be satisfied.
- The specific structure of the propagation
time measurement device 1 will be described with reference toFIGs. 1 and3 .FIG. 1 is schematic block diagram of the propagationtime measurement device 1.FIG. 3 is a cross-sectional view of example vibrators mounted on a pipe. The propagationtime measurement device 1 according to the present embodiment nondestructively measures the flow velocity and the flow rate of a fluid 121 flowing in apipe 120. The device is also referred to as an ultrasonic flowmeter or an ultrasonic flow sensor. - The propagation
time measurement device 1 includes amain body 100 andmultiple vibrators 101. Themain body 100 and eachvibrator 101 are connected with a cable. In the present embodiment, the structure includes twovibrators 101, or more specifically, afirst vibrator 101a upstream in the longitudinal direction of thepipe 120 and asecond vibrator 101b downstream from thefirst vibrator 101a (the two vibrators are hereafter referred to as thefirst vibrator 101a and thesecond vibrator 101b when distinguished from each other and simply asvibrators 101 when their common features are described). The structure may include three ormore vibrators 101, rather than twovibrators 101. - The
vibrators 101 convert an electrical signal to an acoustic signal and an acoustic signal to an electric signal. Thevibrators 101 may also be referred to as transducers. For example, thevibrators 101 may be, for example, piezoelectric elements that use the piezoelectric effect to convert a force to a voltage and a voltage to a force. As shown inFIG. 3 , eachvibrator 101 is buried in aresin clamp 30. When theclamp 30 holds thepipe 120, the twovibrators pipe 120. The line segment connecting the twovibrators pipe 120. This clamp structure facilitates mounting of thevibrators 101 onto the existingpipe 120 at appropriate positions (without any modification to the pipe 120). Any grease or gel applied between thepipe 120 and theclamp 30 can tightly connect them together and increase the impedance matching between them. The angle θ is the propagation angle of the acoustic signal. Although the propagation angle θ may be set to any angle, it may be 0 < θ < 90 degrees, or more specifically, 20 < θ < 60 degrees to use transit-time described below. - The
main body 100 mainly includes acontrol circuit 102, a digital-to-analog (D/A)converter 103, an analog-to-digital (A/D)converter 104, aswitch 105, and anoutput device 106. Thecontrol circuit 102 controls the components of the propagationtime measurement device 1 and performs, for example, signal processing and computations. The D/A converter 103 performs D/A conversion and signal amplification based on the transmission signal (digital data) input from thecontrol circuit 102 and outputs a transmission signal (analog signal) at a predetermined voltage to one of thevibrators 101. The A/D converter 104 converts the reception signal (analog signal) input from anothervibrator 101 to digital data at predetermined sampling intervals and outputs the reception signal (digital data) to thecontrol circuit 102. Theswitch 105 changes the connection of the D/A converter 103 and the A/D converter 104 with thefirst vibrator 101a and thesecond vibrator 101b. Thevibrator 101 connected to the D/A converter 103 serves as a transmitter, and thevibrator 101 connected to the A/D converter 104 as a receiver. Theoutput device 106 outputs information such as the results of signal processing and computations performed by thecontrol circuit 102. For example, the output device 6 is a display. Themain body 100 may also include an input device (e.g., buttons or a touch panel) for user operations and a communication circuit (e.g., Wi-Fi module) to transmit information to an external device (e.g., an external computer or a server). - As shown in
FIG. 1 , thecontrol circuit 102 includes atransmission signal generator 110, asignal processor 111, and astorage 112. Thetransmission signal generator 110 generates transmission signal data for measurement and outputs the data to the D/A converter 103. Thesignal processor 111 calculates the propagation time of the acoustic signal based on the transmission signal and the reception signal and also calculates the flow velocity, the flow rate, or both of the fluid based on the propagation time. Thestorage 112 stores waveform data that defines the waveform of the transmission signal. Thestorage 112 can store multiple types of waveform data. Thetransmission signal generator 110 selects the appropriate type of waveform data from thestorage 112 and generates the transmission signal data. - The
control circuit 102 is, for example, a computer including a central processing unit (CPU), a random-access memory (RAM), a nonvolatile storage (e.g., read-only memory or ROM, a flash memory, or a hard disk drive), an input device, and an output device. In this case, the CPU loads the program stored in the storage into the RAM and executes the program to implement thetransmission signal generator 110 and thesignal processor 111. Any computer may be used. For example, the computer may be a personal computer, an embedded computer, a smartphone, or a tablet. In some embodiments, all or part of the functions provided by thecontrol circuit 102 may be implemented by a circuit such as an application-specific integrated circuit (ASIC) or a field-programmable gate array (FPGA). In some embodiments, distributed computing and cloud computing may allow thecontrol circuit 102 to cooperate with other computers to perform the processing described later. - The
pipe 120 may be formed from any material, and have any size and any shape. For example, thepipe 120 may be a metal pipe or a resin pipe. Thepipe 120 may be sized in accordance with the standard defined by Japanese Industrial Standards (JIS) or the American National Standards Institute (ANSI), or sized individually. The method in the present embodiment allows highly accurate measurement of low flow rates, and thus is particularly effective in measuring small pipes, such as 1/8-inch pipes (OD: 3.18 mm, ID: 1.59 mm), 1/4-inch pipes (OD: 6.35 mm, ID: 3.97 mm), and 1/2-inch pipes (OD: 12.70 mm, ID: 9.53 mm). The pipe may be bent or curved, rather than straight, and may have any cross section. - The propagation
time measurement device 1 according to the present embodiment performs measurement with a transmission signal designed to satisfyconditions conditions 1 and 3 described above. Example transmission signals satisfying these conditions will now be described. -
FIG. 4A shows an example frequency-modulated signal. The horizontal axis represents time, and the vertical axis represents amplitude (normalized to have the maximum amplitude of 1). The transmission signal inFIG. 4A has a duration of one microsecond and a frequency that increases linearly with time from 1 to 5 MHz.FIG. 4B shows the autocorrelation function of the transmission signal inFIG. 4A . The horizontal axis represents time, and the vertical axis represents the value of the autocorrelation function (normalized to have the maximum peak value of 1 when the shift is zero). InFIG. 4B , the second peak value in the autocorrelation function is about 0.2, indicating that the transmission signal inFIG. 4A satisfiescondition 1. The transmission signal inFIG. 4A has the shortest period of 0.2 microseconds (the wavelength corresponding to 5 MHz) and a duration that is five times the shortest period. The transmission signal inFIG. 4A thus satisfiescondition 2 as well. - The effect of the transmission signal in
FIG. 4A was verified with a simulated system including the twovibrators second vibrator 101b in response to an input of the transmission signal inFIG. 4A into thefirst vibrator 101a was determined. The cross-correlation function between the transmission signal and the reception signal was calculated. The simulation results do not show lower estimation accuracy of peak positions or misidentification of the maximum peak with any attenuated reception signal or under any noise condition, thus verifying accurate determination of the propagation time. In the simulation, the propagation time of the acoustic signal between the two vibrators is about three microseconds. Thus, the duration of the transmission signal (one microsecond) also satisfies condition 4. -
FIG. 5A shows another example frequency-modulated signal. The horizontal axis represents time, and the vertical axis represents amplitude (normalized to have the maximum amplitude of 1). The transmission signal inFIG. 5A has a duration of one microsecond and a frequency that increases linearly with time from 3.5 to 5 MHz.FIG. 5B shows the autocorrelation function of the transmission signal inFIG. 5A . The horizontal axis represents time, and the vertical axis represents the value of the autocorrelation function (normalized to have the maximum peak value of 1 when the shift is zero). InFIG. 5B , the second peak value in the autocorrelation function is about 0.75, indicating that the transmission signal inFIG. 5A satisfiescondition 1. The transmission signal inFIG. 5A has the shortest period of 0.2 microseconds (the wavelength corresponding to 5 MHz) and a duration that is five times the shortest period. The transmission signal inFIG. 5A thus satisfiescondition 2 as well. - The same simulation described above was performed with the transmission signal in
FIG. 5A . The results do not show lower estimation accuracy of peak positions or misidentification of the maximum peak with any attenuated reception signal or under any noise condition, thus verifying accurate determination of the propagation time. In this simulation, the transmission signal inFIG. 5A also satisfies condition 4. -
FIG. 6A shows a frequency-modulated signal in a comparative example. The transmission signal inFIG. 6A has a duration of one microsecond and a frequency that increases linearly with time from 4 to 5 MHz.FIG. 6B shows the autocorrelation function of the transmission signal inFIG. 6A . InFIG. 6B , the second peak value in the autocorrelation function is greater than 0.8, indicating that the transmission signal inFIG. 6A does not satisfycondition 1. The same simulation described above was performed with the transmission signal inFIG. 6A . The results show the likelihood of lower estimation accuracy of peak positions and misidentification of the maximum peak with an attenuated reception signal or under a noise condition. - Although the signals in the example in
FIGs. 4A and5A have frequencies that increase linearly with time, the frequency may be modulated in different manners. For example, the signal may have a frequency that decreases with time or have a frequency that increases or decreases nonlinearly (e.g., exponentially) with time. -
FIG. 7A shows an example transmission signal including random pulses. The horizontal axis represents time, and the vertical axis represents amplitude (normalized to have the maximum amplitude of 1). The transmission signal inFIG. 7A has a duration of 6.2 microseconds and includes a combination of multiple pulses with random widths.FIG. 7B shows the autocorrelation function of the transmission signal inFIG. 7A . The horizontal axis represents time, and the vertical axis represents the value of the autocorrelation function (normalized to have the maximum peak value of 1 when the shift is zero). InFIG. 7B , the second peak value in the autocorrelation function is about 0.25, indicating that the transmission signal inFIG. 7A satisfiescondition 1. The transmission signal inFIG. 7A in the autocorrelation function has the maximum peak that falls sharply, distinctively indicating that the signal duration is at least 20 times the half width at half maximum. Thus, the transmission signal inFIG. 7A satisfiescondition 2 as well. - The same simulation described above was performed with the transmission signal in
FIG. 7A . The results do not show lower estimation accuracy of peak positions or misidentification of the maximum peak with any attenuated reception signal or under any noise condition, thus verifying accurate determination of the propagation time. -
FIG. 8A shows an example transmission signal including multiple signals having different frequencies combined together, with a signal component of 1 MHz and a signal component of 5 MHz superimposed on each other. The horizontal axis represents time, and the vertical axis represents amplitude (normalized to have the maximum amplitude of 1). The transmission signal inFIG. 8A has a duration of two microseconds.FIG. 8B shows the autocorrelation function of the transmission signal inFIG. 8A . The horizontal axis represents time, and the vertical axis represents the value of the autocorrelation function (normalized to have the maximum peak value of 1 when the shift is zero). InFIG. 8B , the second peak value in the autocorrelation function is about 0.7, indicating that the transmission signal inFIG. 8A satisfiescondition 1. The transmission signal inFIG. 8A has the shortest period of 0.2 microseconds (the wavelength corresponding to 5 MHz) and a duration that is 10 times the shortest period. The transmission signal inFIG. 8A thus satisfies condition 3 as well. - The same simulation described above was performed with the transmission signal in
FIG. 8A . The results do not show lower estimation accuracy of peak positions or misidentification of the maximum peak with any attenuated reception signal or under any noise condition, thus verifying accurate determination of the propagation time. In this simulation, the transmission signal inFIG. 8A satisfies condition 4 as well. -
FIG. 9A shows an example transmission signal with a frequency that changes at predetermined time segments. The horizontal axis represents time, and the vertical axis represents amplitude (normalized to have the maximum amplitude of 1). In this example, the frequency changes every two microseconds in the order of 1 MHz, 5 MHz, 1 MHz, 3 MHz, and 1 MHz. The transmission signal inFIG. 9A has a duration of 10 microseconds.FIG. 9B shows the autocorrelation function of the transmission signal inFIG. 9A . The horizontal axis represents time, and the vertical axis represents the value of the autocorrelation function (normalized to have the maximum peak value of 1 when the shift is zero). InFIG. 9B , the second peak value in the autocorrelation function is about 0.5, indicating that the transmission signal inFIG. 9A satisfiescondition 1. The transmission signal inFIG. 9A has the shortest period of 0.2 microseconds (the wavelength corresponding to 5 MHz) and a duration that is 50 times the shortest period. The transmission signal inFIG. 9A thus satisfies condition 3 as well. - The same simulation described above was performed with the transmission signal in
FIG. 9A . The results do not show lower estimation accuracy of peak positions or misidentification of the maximum peak with any attenuated reception signal or under any noise condition, thus verifying accurate determination of the propagation time. - The measurement performed by the propagation
time measurement device 1 will be described with reference to the flowchart inFIG. 10 . - In step S100, the
transmission signal generator 110 in thecontrol circuit 102 reads the waveform data about a transmission signal from thestorage 112. The waveform data about the transmission signal is in any format that defines the waveform of a transmission signal. For example, the transmission signal shown inFIG. 4A and5A can be defined with parameters such as a signal duration, the range of frequency sweep (start and end frequencies), and amplitude. The transmission signal shown inFIG. 7A can be defined with parameters such as a signal duration, width of each pulse in the transmission signal, and amplitude. The transmission signal shown inFIG. 8A can be defined with parameters such as a signal duration, the frequency of each signal component, and amplitude. The transmission signal shown inFIG. 9A can be defined with parameters such as a signal duration, the length and frequency of each time segment, and amplitude. The waveform data may be in other formats, such as a signal waveform defined by a function and a signal waveform defined by amplitude values at multiple points on a signal waveform. - In step S101, the
control circuit 102 controls theswitch 105 to connect the D/A converter 103 to thefirst vibrator 101a and the A/D converter 104 to thesecond vibrator 101b. Thefirst vibrator 101a thus serves as a transmitter, and thesecond vibrator 101b as a receiver. - In step S102, the
transmission signal generator 110 generates a transmission signal based on the waveform data read in step S100 and outputs the signal to the D/A converter 103. The transmission signal is temporarily stored in a RAM (work memory) for cross-correlation analysis performed later. - In step S103, the transmission signal resulting from D/A conversion and amplification performed by the D/
A converter 103 is input into thefirst vibrator 101a, which then transmits an acoustic signal based on the transmission signal.FIG. 11A is an example transmission signal (frequency-modulated signal), andFIG. 11B is an example acoustic signal based on the transmission signal inFIG. 11A . In this example, the amplitude of the acoustic signal is not constant irrespective of the constant amplitude of transmission signal due to the frequency response of the vibrator. The acoustic signal travels through theclamp 30, thepipe 120, and the fluid 121 to thesecond vibrator 101b. - In step S104, the
second vibrator 101b converts the received acoustic signal into a reception signal and outputs the signal to the A/D converter 104.FIG. 11C shows an example of the reception signal. The acoustic signal is attenuated during propagation. Thus, the reception signal has amplitude (voltage) on the order of about 1/100 to 1/1000 the transmission signal. For example, the transmission signal inFIG. 11A has amplitude of about 30 V, whereas the reception signal inFIG. 11C has amplitude of about 10 mV. Additionally, various noise components are on the reception signal, as shown inFIG. 11C . The reception signal resulting from A/D conversion performed by the A/D converter 104 enters thecontrol circuit 102 and is temporarily stored into the RAM (work memory). - In step S105, the
signal processor 111 reads the transmission signal and the reception signal from the RAM and calculates the cross-correlation function between the two signals.FIG. 11D shows an example cross-correlation function, showing the area near the maximum peak alone in an enlarged manner. A distinctive peak occurs at the point corresponding to the lag between the transmission signal and the reception signal. The cross-correlation function is a known technique, and is not described in detail herein. - In step S106, the
signal processor 111 determines the vertex position of the maximum peak in the cross-correlation function. This position corresponds to the propagation time of the acoustic signal from thefirst vibrator 101a to thesecond vibrator 101b. Due to the limitation on digital signal processing, the cross-correlation function calculated in step S105 is represented as discrete data. Thus, as shown inFIG. 12A , the points at which the cross-correlation function data is obtained (the points indicated by solid circles) may not match the vertex positions of the peak. Thesignal processor 111 may thus approximate the shape of the maximum peak from the discrete data for the cross-correlation function and then estimate the vertex position of the maximum peak. For example, as shown inFIG. 12B , thesignal processor 111 may transform the data near the maximum peak in the cross-correlation function to phase data by Hilbert transform, approximate the resultant data linearly, and determine the zero crossing point (the position at which the phase is zero) of the approximate line to be the vertex position of the maximum peak. In some embodiments, thesignal processor 111 may estimate the shape of the maximum peak by interpolating the data near the maximum peak in the cross-correlation function by polynomial approximation to determine the vertex position. Such processing can accurately determine the position at which cross-correlation is maximum with a resolution higher than the sampling intervals of A/D conversion, or more specifically, correctly determine the propagation time of the acoustic signal. - In step S107, the
control circuit 102 controls theswitch 105 to connect the D/A converter 103 to thesecond vibrator 101b and the A/D converter 104 to thefirst vibrator 101a. In other words, the transmitting vibrator is switched to the receiving vibrator and the receiving vibrator is to the transmitting vibrator. The processing in subsequent steps S108 to S112 is the same as the processing in steps S102 to S106 (except that thefirst vibrator 101a is replaced with thesecond vibrator 101b and thesecond vibrator 101b with thefirst vibrator 101a). - The processing described above determines a propagation time Tab of the acoustic signal from the
first vibrator 101a to thesecond vibrator 101b and a propagation time Tba of the acoustic signal from thesecond vibrator 101b to thefirst vibrator 101a. When the fluid 121 flows in thepipe 120, a time difference occurs between the propagation times Tab and Tba depending on the flow velocity of thefluid 121. Thus, the propagation times Tab and Tba can be used to calculate the flow velocity and the flow rate of thefluid 121. - In step S113, the
signal processor 111 determines a flow velocity V of the fluid 121 with the formula below.
- In the formula, V is the flow velocity of the fluid, L is the length of the propagation path in the pipe, θ is the propagation angle, Tab is the propagation time from the upstream vibrator to the downstream vibrator, Tba is the propagation time from the downstream vibrator to the upstream vibrator, and To is the propagation time for a non-fluid portion. The propagation time To for the non-fluid portion is, for example, the time for the acoustic signal to propagate through the
clamp 30 and thepipe 120, and can be predetermined through experiment or simulation based on the specifications of the pipe 120 (e.g., inner diameter, outer diameter, or material). - In step S114, the
signal processor 111 determines a flow rate Q of the fluid with the formula below.
- In the formula, Q is the flow rate of the fluid, V is the flow velocity of the fluid, and A is the hollow cross-section of the pipe. The hollow cross-section A is known in this example.
- In step S115, the
signal processor 111 outputs the processing results (e.g., propagation time, flow velocity, or flow rate) to theoutput device 106. - The structure according to the present embodiment described above uses, as a signal for measurement, the transmission signal
satisfying conditions conditions 1 and 3, causing the cross-correlation function to have fewer errors and an easily identifiable and distinctive maximum peak. This structure allows accurate determination of the maximum peak position in the cross-correlation function, or more specifically, accurate determination of the propagation time of the acoustic signal. Thus, the structure can be used in highly-accurate measurement situations such as measuring a low flow rate. - In a second embodiment of the present invention, the acoustic signal is transmitted and received multiple times through the same propagation path. The multiple resultant reception signals are used in the cross-correlation analysis to improve the measurement accuracy. The basic structure is the same as described in the first embodiment. Thus, the second embodiment will be described focusing on the difference from the first embodiment.
-
FIG. 13 is a flowchart of measurement performed by a propagationtime measurement device 1 according to the second embodiment. Like numbers denote like processing steps in the flowchart in the first embodiment (FIG. 10 ). - The processing in steps S100 to S104 is the same as in the first embodiment. In step S130, the number of times the reception signal is obtained is counted. The processing in steps S102 to S104 is repeated until the count reaches N. Although N is set to, for example, 3 to 500 in the present embodiment, N may be any number. With this processing, N reception signals are accumulated in the RAM.
- In step S131, the
signal processor 111 uses the N reception signals to generate a reception signal with reduced noise. For example, thesignal processor 111 may calculate the average of N reception signals or simply generate a signal by combining the N reception signals. In either case, the signal-to-noise ratio of the reception signal can be improved. - In step S132, the
signal processor 111 calculates the cross-correlation function between the transmission signal and the noise-reduced reception signal. The processing is the same as in step S105 in the first embodiment except that the noise-reduced reception signal is used. In step S106, thesignal processor 111 determines the propagation time from thefirst vibrator 101a to thesecond vibrator 101b. - Subsequently, the same processing is performed by switching the transmitting vibrator to the receiving vibrator and the receiving vibrator to the transmitting vibrator. The processing in step S107 and subsequent steps is the same as the processing described above except that the transmitting vibrator and the receiving vibrator are switched, and will not be described.
- In the present embodiment described above, N reception signals are used in cross-correlation analysis. This allows more accurate measurement than in the first embodiment. In the present embodiment, N reception signals are averaged or combined to reduce noise in the reception signal before calculation of the cross-correlation function. In some embodiments, this procedure may be replaced by calculation of the cross-correlation function of each N reception signal and then averaging or combining the resultant N cross-correlation functions to reduce noise in the cross-correlation function. However, cross-correlation functions cause a high computational load. Thus, the former procedure may be used to reduce the number of computations for the cross-correlation function. In the present embodiment, the reception signals alone are averaged. In some embodiments, the transmission signals may also be averaged. Such an averaged transmission signal contains less noise, thus further reducing the noise in the cross-correlation function.
- A propagation
time measurement device 1 according to a third embodiment of the present invention automatically sets the appropriate transmission signal waveform in accordance with the arrangement (relative positions) of the vibrator pair. The basic structure is the same as described in the above embodiments. Thus, the third embodiment will be described focusing on the difference from the above embodiments. -
FIG. 14 is a flowchart of automatic setting of a transmission signal in the third embodiment. For example, after theclamp 30 of the propagationtime measurement device 1 is attached to thepipe 120, a predetermined button may be pressed to activate the automatic setting function. This causes thecontrol circuit 102 to start the process shown inFIG. 14 . - In step S140, the
control circuit 102 detects the opening degree of theclamp 30. The opening degree of theclamp 30 is the distance or angle between the arms of the clamp. The opening degree can be detected with a sensor such as a range sensor or potentiometer. In step S141, thecontrol circuit 102 calculates the relative positions of the twovibrators clamp 30 and estimates the propagation time of the acoustic signal based on the propagation distance between the twovibrators pipe 120, or the flow velocity and the flow rate of the fluid 121) may be preset or may be provided by the user. In step S142, thecontrol circuit 102 determines the maximum duration of the transmission signal based on the estimated propagation time. The maximum duration may be determined to be shorter than the estimated propagation time. In step S143, thecontrol circuit 102 selects the waveform data for the optimum duration from multiple pieces of waveform data registered in thestorage 112. For example, thecontrol circuit 102 may select, as the waveform data for measurement, the waveform data with the longest duration from the waveform data pieces with the duration shorter than or equal to the maximum duration determined in step S142. This allows measurement using the transmission signal with the longest possible duration among transmission signals satisfying condition 4, thus improving measurement accuracy. - Although the distance between the two vibrators is determined from the opening degree of the
clamp 30 in the present embodiment, the distance and propagation time may be determined by other methods. For example, after theclamp 30 is attached to thepipe 120, a test signal may be transmitted from one of the vibrators to measure the propagation time. In some embodiments, the user may set parameters such as a pipe size, a fluid type, and a flow velocity. The distance and propagation time may be estimated from the set parameters. - The embodiments described above are mere examples of the present invention. The present invention is not limited to the embodiments described above, but may be modified variously within the scope of the technical ideas of the invention. For example, in the device according to each of the above embodiments, after measurement of the propagation time of the acoustic signal, the measured propagation time is used to calculate the flow velocity and the flow rate of the fluid. In some embodiments, the flow velocity and the flow rate are not calculated. The propagation time measurement device may simply measure the propagation time. In this case, the processing in steps S100 to S106 in the flowchart in
FIG. 10 orFIG. 13 may simply be performed. The propagation angle θ may be 90 degrees when measuring the propagation time alone. In the above embodiments, the clamp-on device to clamp the pipe is used. In some embodiments, the device may be built in the pipe. The vibrators in the above embodiments may be three or more vibrators, including vibrator pairs for propagating acoustic signals downstream and vibrator pairs for propagating acoustic signals upstream. - As shown in
FIG. 15A , thefirst vibrator 101a may includevibrators second vibrator 101b may includevibrators vibrator 101c with a resonance frequency near 1 MHz and thevibrator 101d with a resonance frequency near 5 MHz may be arranged side by side. In this case, both of the frequency components can have higher conversion efficiency between electric signals and acoustic signals. Such vibrators may be effectively used with the transmission signal including combination of signals having different frequencies as in the example inFIG. 8A and with the frequency-modulated transmission signals as in the examples inFIGs. 4A and5A . In the example inFIG. 15A , twovibrators vibrators pipe 120. -
- 1. A propagation time measurement device (1), comprising:
- a plurality of vibrators (101a, 101b) at different positions relative to a pipe (120) in which a fluid (121) flows, the plurality of vibrators (101a, 101b) including at least a first vibrator (101a) configured to convert a transmission signal being an electric signal to an acoustic signal and a second vibrator (101b) configured to receive the acoustic signal transmitted from the first vibrator (101a) and propagating through the fluid (121) in the pipe (120) and convert the acoustic signal to a reception signal being an electric signal;
- a transmission signal generator (110) configured to generate the transmission signal for measurement; and
- a signal processor (111) configured to determine a propagation time of the acoustic signal from the first vibrator (101a) to the second vibrator (101b) through cross-correlation analysis between the transmission signal and the reception signal,
- wherein the transmission signal generator (110) generates the transmission signal to satisfy
- (1) a ratio of a height of a peak other than a maximum peak in an autocorrelation function of the transmission signal to a height of the maximum peak being 0.8 or less, and
- (2) a duration of the transmission signal being at least five times a shortest period of the transmission signal or at least 20 times a half width at half maximum of the autocorrelation function of the transmission signal.
-
- 1: propagation time measurement device
- 101: vibrator
- 101a: first vibrator
- 101b: second vibrator
- 102:control circuit
- 110: transmission signal generator
- 111: signal processor
- 120: pipe
- 121:fluid
Claims (14)
- A propagation time measurement device, comprising:a plurality of vibrators at different positions relative to a pipe in which a fluid flows, the plurality of vibrators including at least a first vibrator configured to convert a transmission signal being an electric signal to an acoustic signal and a second vibrator configured to receive the acoustic signal transmitted from the first vibrator and propagating through the fluid in the pipe and convert the acoustic signal to a reception signal being an electric signal;a transmission signal generator configured to generate the transmission signal for measurement; anda signal processor configured to determine a propagation time of the acoustic signal from the first vibrator to the second vibrator through cross-correlation analysis between the transmission signal and the reception signal,wherein the transmission signal generator generates the transmission signal to satisfy(1) a ratio of a height of a peak other than a maximum peak in an autocorrelation function of the transmission signal to a height of the maximum peak being 0.8 or less, and(2) a duration of the transmission signal being at least five times a shortest period of the transmission signal or at least 20 times a half width at half maximum of the autocorrelation function of the transmission signal.
- The propagation time measurement device according to claim 1, whereinthe transmission signal generator generates the transmission signal to further satisfy(3) the duration of the transmission signal being at least 10 times the shortest period of the transmission signal or at least 40 times the half width at half maximum of the autocorrelation function of the transmission signal.
- The propagation time measurement device according to claim 1 or claim 2, whereinthe transmission signal generator generates the transmission signal to further satisfy(4) the duration of the transmission signal being shorter than a minimum propagation time estimated as the propagation time of the acoustic signal from the first vibrator to the second vibrator.
- The propagation time measurement device according to any one of claims 1 to 3, wherein
the transmission signal includes a frequency-modulated signal. - The propagation time measurement device according to any one of claims 1 to 3, wherein
the transmission signal includes a signal including a random pulse. - The propagation time measurement device according to any one of claims 1 to 3, wherein
the transmission signal includes a signal containing a plurality of signals having different frequencies combined together. - The propagation time measurement device according to any one of claims 1 to 3, wherein
the transmission signal includes a signal having a frequency changing at predetermined time segments. - The propagation time measurement device according to any one of claims 1 to 7, wherein
the signal processor uses a plurality of reception signals resulting from a plurality of transmissions from the first vibrator and a plurality of receptions by the second vibrator to perform cross-correlation analysis. - The propagation time measurement device according to claim 8, wherein
the signal processor generates a noise-reduced reception signal using the plurality of reception signals and performs cross-correlation analysis between the transmission signal and the noise-reduced reception signal. - The propagation time measurement device according to any one of claims 1 to 9, wherein
the first vibrator and the second vibrator face each other across the pipe. - The propagation time measurement device according to any one of claims 1 to 10, wherein
the first vibrator and the second vibrator are at different positions in a longitudinal direction of the pipe. - The propagation time measurement device according to any one of claims 1 to 11, further comprising:a switch configured to cause the transmission signal to be input into the second vibrator and cause the reception signal to be output from the first vibrator receiving the acoustic signal transmitted from the second vibrator,wherein the signal processor determines the propagation time of the acoustic signal from the second vibrator to the first vibrator through cross-correlation analysis between the transmission signal input into the second vibrator and the reception signal output from the first vibrator.
- The propagation time measurement device according to claim 12, wherein
the signal processor determines at least one of a flow velocity or a flow rate of the fluid in the pipe based on a difference between the propagation time of the acoustic signal from the first vibrator to the second vibrator and the propagation time of the acoustic signal from the second vibrator to the first vibrator. - The propagation time measurement device according to any one of claims 1 to 13, wherein
each of the first vibrator and the second vibrator includes a combination of a plurality of vibrators each with different frequency response.
Applications Claiming Priority (2)
| Application Number | Priority Date | Filing Date | Title |
|---|---|---|---|
| JP2019196256A JP2021071307A (en) | 2019-10-29 | 2019-10-29 | Propagation time measuring device |
| PCT/JP2020/036323 WO2021084985A1 (en) | 2019-10-29 | 2020-09-25 | Propagation time measurement device |
Publications (2)
| Publication Number | Publication Date |
|---|---|
| EP4053512A1 true EP4053512A1 (en) | 2022-09-07 |
| EP4053512A4 EP4053512A4 (en) | 2023-11-15 |
Family
ID=75712864
Family Applications (1)
| Application Number | Title | Priority Date | Filing Date |
|---|---|---|---|
| EP20882140.5A Pending EP4053512A4 (en) | 2019-10-29 | 2020-09-25 | Propagation time measurement device |
Country Status (6)
| Country | Link |
|---|---|
| US (1) | US20220291026A1 (en) |
| EP (1) | EP4053512A4 (en) |
| JP (1) | JP2021071307A (en) |
| CN (1) | CN114599940A (en) |
| TW (1) | TWI759886B (en) |
| WO (1) | WO2021084985A1 (en) |
Families Citing this family (2)
| Publication number | Priority date | Publication date | Assignee | Title |
|---|---|---|---|---|
| CN117836663A (en) * | 2021-10-07 | 2024-04-05 | 株式会社村田制作所 | Object detection device and method |
| JP2024010554A (en) * | 2022-07-12 | 2024-01-24 | オムロン株式会社 | Operation device and wheel mouse |
Family Cites Families (12)
| Publication number | Priority date | Publication date | Assignee | Title |
|---|---|---|---|---|
| JPH08110376A (en) * | 1994-10-13 | 1996-04-30 | Fuji Electric Co Ltd | Ultrasonic wave transducer |
| FR2781565B1 (en) * | 1998-07-24 | 2000-08-25 | Inst Francais Du Petrole | METHOD AND DEVICE FOR MEASURING THE FLOW SPEED OF A FLUID VEIN |
| JP3876370B2 (en) * | 1998-11-10 | 2007-01-31 | バブコック日立株式会社 | Acoustic flow velocity measuring device |
| WO2001067050A1 (en) * | 2000-03-09 | 2001-09-13 | Nest International N.V. | Simultaneous determination of multiphase flowrates and concentrations |
| JP3616324B2 (en) * | 2000-11-27 | 2005-02-02 | 東京計装株式会社 | Ultrasonic flow meter by propagation time difference method |
| JP4135056B2 (en) | 2001-02-15 | 2008-08-20 | 横河電機株式会社 | Ultrasonic flow meter |
| EP1712888A1 (en) * | 2005-04-11 | 2006-10-18 | Agilent Technologies Inc | Time-of-flight measurement using pulse sequences |
| GB0516752D0 (en) * | 2005-08-13 | 2005-09-21 | Flownetix Ltd | A method for ultra low power transit time ultrasonic flow measurement |
| JP2008304281A (en) | 2007-06-06 | 2008-12-18 | Honda Electronic Co Ltd | Ultrasonic method and program for measuring flow rate and ultrasonic flow meter |
| DE102009049067A1 (en) * | 2009-10-12 | 2011-04-14 | Robert Bosch Gmbh | Method and apparatus for improved ultrasonic transit time difference measurement |
| JP2013185891A (en) * | 2012-03-07 | 2013-09-19 | Tokyo Institute Of Technology | Device and method for ultrasonic flow metering |
| JP2017187310A (en) * | 2016-04-01 | 2017-10-12 | 株式会社ソニック | Ultrasonic flowmeter |
-
2019
- 2019-10-29 JP JP2019196256A patent/JP2021071307A/en active Pending
-
2020
- 2020-09-25 EP EP20882140.5A patent/EP4053512A4/en active Pending
- 2020-09-25 WO PCT/JP2020/036323 patent/WO2021084985A1/en unknown
- 2020-09-25 US US17/769,888 patent/US20220291026A1/en active Pending
- 2020-09-25 CN CN202080073685.6A patent/CN114599940A/en active Pending
- 2020-09-30 TW TW109133980A patent/TWI759886B/en active
Also Published As
| Publication number | Publication date |
|---|---|
| CN114599940A (en) | 2022-06-07 |
| US20220291026A1 (en) | 2022-09-15 |
| EP4053512A4 (en) | 2023-11-15 |
| WO2021084985A1 (en) | 2021-05-06 |
| TWI759886B (en) | 2022-04-01 |
| JP2021071307A (en) | 2021-05-06 |
| TW202117289A (en) | 2021-05-01 |
Similar Documents
| Publication | Publication Date | Title |
|---|---|---|
| EP2116818A1 (en) | Transit-time difference type ultrasonic flowmeter | |
| US9885593B2 (en) | Method for verifying the reliability of measurement data of an ultrasonic flow measurement based on the travel-time difference method and ultrasonic flow measurement device | |
| EP4053512A1 (en) | Propagation time measurement device | |
| EP1719979A1 (en) | Ultrasonic flowmeter compatible with both of pulse doppler method and propagation time difference method, method and program for automatically selecting the measurement method in the flowmeter, and electronic device for the flowmeter | |
| JP4535065B2 (en) | Doppler ultrasonic flow meter | |
| US20230324208A1 (en) | Propagation time measurement device | |
| CN112639412B (en) | Flow measuring device | |
| US20230243682A1 (en) | Ultrasonic flow measurement | |
| JP2608961B2 (en) | Sound wave propagation time measurement method | |
| CN107532933B (en) | Method for determining the transit time of an ultrasonic pulse train, in particular in an ultrasonic flow meter, flow meter | |
| US11280648B2 (en) | Ultrasonic flow-rate measurement device and ultrasonic flow-rate measurement method | |
| EP2722654A1 (en) | Fluid Flow Metering Apparatus | |
| JP5316795B2 (en) | Ultrasonic measuring instrument | |
| JP3738891B2 (en) | Ultrasonic flow meter | |
| RU186705U1 (en) | FLUID FLOW METER | |
| KR101806306B1 (en) | Apparatus for measuring flow velocity based on measurement for thickness of pipe | |
| JP2010151583A (en) | Ultrasonic flow measuring device | |
| JPH0739964B2 (en) | Ultrasonic flow meter | |
| JP2017215188A (en) | Flow velocity distribution measuring method and device thereof | |
| JP2005274387A (en) | Apparatus for measuring flow of fluid | |
| JP2005195372A (en) | Ultrasonic flowmeter, and wedge used for ultrasonic flowmeter |
Legal Events
| Date | Code | Title | Description |
|---|---|---|---|
| STAA | Information on the status of an ep patent application or granted ep patent |
Free format text: STATUS: THE INTERNATIONAL PUBLICATION HAS BEEN MADE |
|
| PUAI | Public reference made under article 153(3) epc to a published international application that has entered the european phase |
Free format text: ORIGINAL CODE: 0009012 |
|
| STAA | Information on the status of an ep patent application or granted ep patent |
Free format text: STATUS: REQUEST FOR EXAMINATION WAS MADE |
|
| 17P | Request for examination filed |
Effective date: 20220413 |
|
| AK | Designated contracting states |
Kind code of ref document: A1 Designated state(s): AL AT BE BG CH CY CZ DE DK EE ES FI FR GB GR HR HU IE IS IT LI LT LU LV MC MK MT NL NO PL PT RO RS SE SI SK SM TR |
|
| DAV | Request for validation of the european patent (deleted) | ||
| DAX | Request for extension of the european patent (deleted) | ||
| A4 | Supplementary search report drawn up and despatched |
Effective date: 20231013 |
|
| RIC1 | Information provided on ipc code assigned before grant |
Ipc: G01F 1/667 20220101ALI20231009BHEP Ipc: G01F 1/66 20220101AFI20231009BHEP |