EP3979010B1 - Überwachung und steuerung von bioprozessen - Google Patents
Überwachung und steuerung von bioprozessen Download PDFInfo
- Publication number
- EP3979010B1 EP3979010B1 EP20199899.4A EP20199899A EP3979010B1 EP 3979010 B1 EP3979010 B1 EP 3979010B1 EP 20199899 A EP20199899 A EP 20199899A EP 3979010 B1 EP3979010 B1 EP 3979010B1
- Authority
- EP
- European Patent Office
- Prior art keywords
- bioprocess
- maturity
- metabolic
- variables
- function
- Prior art date
- Legal status (The legal status is an assumption and is not a legal conclusion. Google has not performed a legal analysis and makes no representation as to the accuracy of the status listed.)
- Active
Links
Images


Classifications
-
- G—PHYSICS
- G16—INFORMATION AND COMMUNICATION TECHNOLOGY [ICT] SPECIALLY ADAPTED FOR SPECIFIC APPLICATION FIELDS
- G16B—BIOINFORMATICS, i.e. INFORMATION AND COMMUNICATION TECHNOLOGY [ICT] SPECIALLY ADAPTED FOR GENETIC OR PROTEIN-RELATED DATA PROCESSING IN COMPUTATIONAL MOLECULAR BIOLOGY
- G16B40/00—ICT specially adapted for biostatistics; ICT specially adapted for bioinformatics-related machine learning or data mining, e.g. knowledge discovery or pattern finding
-
- C—CHEMISTRY; METALLURGY
- C12—BIOCHEMISTRY; BEER; SPIRITS; WINE; VINEGAR; MICROBIOLOGY; ENZYMOLOGY; MUTATION OR GENETIC ENGINEERING
- C12M—APPARATUS FOR ENZYMOLOGY OR MICROBIOLOGY; APPARATUS FOR CULTURING MICROORGANISMS FOR PRODUCING BIOMASS, FOR GROWING CELLS OR FOR OBTAINING FERMENTATION OR METABOLIC PRODUCTS, i.e. BIOREACTORS OR FERMENTERS
- C12M41/00—Means for regulation, monitoring, measurement or control, e.g. flow regulation
- C12M41/30—Means for regulation, monitoring, measurement or control, e.g. flow regulation of concentration
- C12M41/36—Means for regulation, monitoring, measurement or control, e.g. flow regulation of concentration of biomass, e.g. colony counters or by turbidity measurements
-
- C—CHEMISTRY; METALLURGY
- C12—BIOCHEMISTRY; BEER; SPIRITS; WINE; VINEGAR; MICROBIOLOGY; ENZYMOLOGY; MUTATION OR GENETIC ENGINEERING
- C12M—APPARATUS FOR ENZYMOLOGY OR MICROBIOLOGY; APPARATUS FOR CULTURING MICROORGANISMS FOR PRODUCING BIOMASS, FOR GROWING CELLS OR FOR OBTAINING FERMENTATION OR METABOLIC PRODUCTS, i.e. BIOREACTORS OR FERMENTERS
- C12M41/00—Means for regulation, monitoring, measurement or control, e.g. flow regulation
- C12M41/30—Means for regulation, monitoring, measurement or control, e.g. flow regulation of concentration
- C12M41/38—Means for regulation, monitoring, measurement or control, e.g. flow regulation of concentration of metabolites or enzymes in the cells
-
- C—CHEMISTRY; METALLURGY
- C12—BIOCHEMISTRY; BEER; SPIRITS; WINE; VINEGAR; MICROBIOLOGY; ENZYMOLOGY; MUTATION OR GENETIC ENGINEERING
- C12M—APPARATUS FOR ENZYMOLOGY OR MICROBIOLOGY; APPARATUS FOR CULTURING MICROORGANISMS FOR PRODUCING BIOMASS, FOR GROWING CELLS OR FOR OBTAINING FERMENTATION OR METABOLIC PRODUCTS, i.e. BIOREACTORS OR FERMENTERS
- C12M41/00—Means for regulation, monitoring, measurement or control, e.g. flow regulation
- C12M41/48—Automatic or computerized control
Definitions
- the present disclosure relates to computer implemented methods, computer programs and systems for the monitoring and control of bioprocesses.
- Particular methods, programs and systems of the disclosure use multivariate models including one or more variables representative of the metabolic condition of cells in a bioprocess.
- Upstream bioprocesses use living organisms, such as CHO (Chinese Hamster Ovary) or E. Coli cells, to produce a desired product, for example a substance with therapeutic effects (e.g. monoclonal antibodies, mAbs).
- Therapeutic effects of such products are dictated by aspects of their molecular structure, such as e.g. glycosylation profiles (particularly in the case of mAbs). These aspects are collectively referred to as "critical quality attributes" (CQAs).
- CQAs critical quality attributes
- biomanufacturers are often required to prove to regulatory agencies that they can reliably operate their process in a consistent manner, such that the CQAs are guaranteed to meet specification by virtue of the way the process was run.
- Statistical process analysis methods can be used to assess satisfactory performance of a bioprocess.
- multivariate statistical models including principal component analysis - PCA - and (orthogonal) partial least square regression - (O)PLS
- CPPs critical process parameters
- Umetrics ® software suite Sartorius Stedim Data Analytics
- process variables e.g. a few dozen process variables including temperature, concentration of key nutrients and metabolites, pH, volume, gas concentrations, viable cell density, etc.
- process variables together represent the "process condition”.
- Many of these variables are highly correlated and as such methods such as PCA and PLS can be used to identify summary variables that capture the correlation structure in the data.
- PCA and PLS can be used to identify summary variables that capture the correlation structure in the data.
- These (typically relatively few) variables can then be extracted and the range of values of theses variables that define a "normal" process condition can be estimated. For example, Gao and Adamec (American Pharmaceutical Review, vol. 23, no.
- WO 2019/129891 A describes an approach for predicting the metabolic condition of a cell culture at a future point in time. This comprises inputting measured values comprising concentrations of extracellular metabolites and cell density of the cell culture into a trained machine learning program logic to predict extracellular fluxes of the extracellular metabolites at a future point in time, and performing metabolic flux analysis to predict the intracellular fluxes at the future point in time using the predicted extracellular fluxes.
- a computer-implemented method for monitoring a bioprocess comprising a cell culture in a bioreactor, the method including the steps of:
- the present inventors hypothesised that models that are more informative as to the underlying causes of departure from a normal or optimal evolution of a process could be obtained by describing the process using variables that capture the metabolic condition of the cells in the bioprocess instead or in addition to the process parameters that have been previously used to monitor process evolution.
- the invention is based at least in part on the discovery that the metabolic condition of the cells can be seen as a maturity-dependent evolving process that can be characterised using a multivariate batch evolution modelling approach.
- Cellular metabolism is the causal reason for the correlation structure exploited by the batch evolution modelling technique described above.
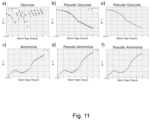
- protein concentration increases in tandem with decreasing glutamine concentrations and increasing glutamate concentrations. This is because if the cell is considered as the factory, then metabolism is the process that governs how raw materials (nutrients like glutamine, in this particular example) are used to construct the final product (protein, in this example) as well as the waste created during that production (by-products like glutamate, in this example). Therefore, the cellular metabolism provides a far more complete characterisation of the process condition than the macroscopic properties currently used as input to batch evolution models presently. Using information about the cell metabolism as input to a multivariate batch evolution model therefore provides a better characterisation of the process path because it describes the evolution of the cell's metabolic process directly instead of indirectly describing this evolution through observed macroscopic process conditions that can be measured.
- any macroscopic process change that corrects the metabolic condition is acceptable.
- FDA U.S. Food and Drugs Administration
- EMA European Medicines Agency
- such a definition enables biological products to be manufactured at the scale which makes appropriate sense economically, and enable it to change over time because a process that maintains the metabolic condition consistently will be covered by the initial specification even if the process parameters need to be changed to operate at a new scale.
- the method of the first aspect may have any one or any combination of the following optional features.
- the multivariate model is advantageously a linear model that uses process variables including the metabolic condition variables as predictor variables and maturity as a response variable.
- the step of determining is performed at least in part based on the measurements of the amount of biomass and the amount of one or more metabolites in the bioreactor as a function of bioprocess maturity.
- the method comprises determining, at least in part based on the measurements of the amount of biomass and the amount of one or more metabolites in the bioreactor as a function of bioprocess maturity, one or more metabolic condition variables.
- the step of determining may comprise using a model of conservation of mass in the bioprocess and the measurements of the amount of biomass and the amount of one or more metabolites in the bioreactor to determine the specific transport rates between the cells and a culture medium in the bioreactor for some or all of the one or more metabolites as a function of maturity (i.e.
- the step of determining may comprise using: (a) a metabolic model and (b) the measurements of the amount of biomass and the amount of one or more metabolites in the bioreactor and/or the specific transport rates between the cells and a culture medium in the bioreactor for some or all of the one or more metabolites, to determine one or both of the internal concentration of one or more metabolites as a function of bioprocess maturity, and reaction rates for one or more metabolic reactions that form part of the cell's metabolism, as a function of maturity (i.e. at the maturity associated with the measurements used in the model).
- the method may further comprise outputting a signal to a user if the comparison step indicates that the bioprocess is not operating normally.
- a signal may be output through a user interface such as a screen, or through any other means such as audio or haptic signalling.
- Obtaining measurements of the amount of biomass and the amount of one or more metabolites in the bioreactor as a function of bioprocess maturity may comprise obtaining measurements of the amount of biomass and the amount of one or more metabolites, wherein each measurement is associated with a bioprocess maturity value.
- the measurements may comprise measurements for a plurality of bioprocess maturity values, or a single bioprocess maturity value.
- the step of determining one or more metabolic condition variables may be performed separately for each maturity value at which the metabolic condition variables are determined.
- the multivariate model may have been trained using data including metabolic condition variables at a plurality of maturities.
- the multivariate model may be a PLS or OPLS model.
- the multivariate model may be a PLS model as defined in equations (1) and (2), where in equations (1) and (2): X is the m x n matrix of process variables at maturities m, Y is the m x 1 matrix of maturity values, and T is the m x l matrix of score values that describe the aspects of the process variables that are most correlated with maturity, including the one or more latent variables.
- the multivariate model may be a principal component regression.
- the multivariate model may be a PCR model where PCA is applied on the matrix X of process variables at maturities m, and the matrix Y of maturity values is regressed on the principal components thus obtained to identify the principal components most correlated with maturity, the PCA scores representing latent variables describing the aspects of the process variables that are most correlated with maturity.
- the multivariate model may be a PCA, the PCA scores representing latent variables describing the aspects of the process variables that are most variable across training data acquired at a plurality of maturities.
- Comparing the value(s) of the one or more latent variables to one or more predetermined values may comprise comparing the value for a latent variable to the average value for the latent variable in a set of bioprocesses that are considered to operate normally.
- a bioprocess may be considered to operate normally if the value of one or more latent variables is within a predetermined range of the average value for the respective latent variables in a set of bioprocesses that are considered to operate normally.
- the predetermined range may be defined as a function of the standard deviation associated with the average value of the respective latent variables.
- a bioprocess may be considered to operate normally if the value of one or more latent variables t is within a range defined as average(t) ⁇ n*SD(t), where average(t) is the average value of the latent variable t in a set of bioprocesses that are considered to operate normally, SD(t) is the standard deviation associated with average(t), and n is a predetermined constant (which may be the same for the subrange average(t)+n*SD(t) and for the subrange average(t)-n*SD(t), or may differ between these subranges).
- n is 1, 2, 3 or a value that results in a chosen confidence interval, for example a 95% confidence interval.
- a bioprocess may be considered to operate normally if the value of one or more latent variables t is within a range defined as a confidence interval, e.g. a 95% confidence interval, around average(t), based on an assumed distribution of t.
- An assumed distribution may be a Gaussian (normal) distribution, a chi-squared distribution, etc.
- a p% confidence interval (where p can be e.g. 95) may be equivalent to a range of average(t) ⁇ n * SD(t), where n is a single value that results in the p% confidence interval (e.g. n may be about 1.96 for a 95% confidence interval).
- a bioprocess may be considered to operate normally if it resulted or is predicted to result in a product that complies with a predetermined specification.
- a predetermined specification may comprise acceptable ranges for one or more critical quality attributes.
- Obtaining measurements of the amount of biomass and the amount of one or more metabolites in the bioreactor as a function of bioprocess maturity may comprise measuring amount of biomass and the amount of one or more metabolites in the bioreactor as a function of bioprocess maturity, receiving previously obtained measurements, or a combination of these.
- the process variables used as predictor variables in the linear model may include, in addition to the metabolic condition variables, one or more variables derived from the specific transport rates and/or reaction rates, such as one or more variables that are linear combinations of one or more specific transport rates and/or reaction rates.
- the process variables used as predictor variables in the linear model may include, in addition to the metabolic condition variables, one or more process conditions variables.
- the internal concentration of one or more metabolites may refer to the calculated or estimated concentration of the metabolites within the cells or a part thereof.
- Determining one or more metabolic condition variables may comprise determining the specific transport rate of the one or more metabolites between the cells and the culture medium, wherein the specific transport rate of a metabolite i is the amount of the metabolite transported between the cells and the culture medium, per cell and per unit of maturity.
- V is the volume of the culture
- [Met] is the metabolite concentration in the culture
- t is the maturity
- F F is the feed mass flow flowrate (if present)
- ⁇ is the medium density
- [Met] F is the metabolite concentration in the feed flow (if present)
- F B is the bleed mass flow flowrate (if present)
- F H is the harvest mass flow flowrate (if present)
- VCD the viable cell density.
- Equation (8) may be solved using a first order finite approximation for the differential.
- the term - F H + F B ⁇ ⁇ Met may be replaced by a corresponding term - F B ⁇ ⁇ Met B ⁇ F H ⁇ ⁇ Met H where [Met B ] is the metabolite concentration in the bleed flow (if present), and [Met] H is the metabolite concentration in the harvest flow (if present). This may be advantageous where the concentration of the metabolite in the harvest and/or bleed flows cannot be considered to be the same as that in the reactor.
- the specific transport rate of a metabolite i at a particular maturity m may be determined for a perfusion culture using equation (9a):
- qMet m V ⁇ Met m + 1 ⁇ Met m ⁇ F Fm ⁇ ⁇ Met F ⁇ t m + 1 ⁇ t m + F Fm ⁇ ⁇ Met m ⁇ t m + 1 ⁇ t m V ⁇ IVCD m
- V is the volume of the culture
- [Met] is the metabolite concentration in the culture
- t the maturity
- F F is the feed mass flow flowrate
- ⁇ the medium density
- [Met] F is the metabolite concentration in the feed flow
- F B is the bleed mass flow flowrate
- F H is the harvest mass flow flowrate
- IVCD is the integrated viable cell density between maturities m and m + 1.
- feed-flow is continuous or semi-continuous, such as e.g. in drip feed flows.
- a pseudo metabolite concentration [pMet] may be obtained by: (i) using the measured (or otherwise determined, such as e.g.
- a pseudo metabolite concentration [pMet] may be obtained by: (i) using the measured (or otherwise determined, such as e.g.
- a function may be fitted to some or all of the metabolite data (i.e. a function that expresses the metabolite concentration as a function of bioprocess maturity for some or all of the metabolites at some or all of the maturity values). For example, this may be advantageous for the purpose of smoothing the metabolite data. Where a function has been fitted to metabolites data, this function can be used to obtain the term d Met dt in any of equations (9c), (8c) and (9d).
- the specific transport rate of a metabolite may be a specific consumption rate or a specific production rate.
- a specific consumption rate may also be referred to as an uptake rate (or cellular uptake rate).
- a specific production rate may also be referred to as a secretion rate (or cellular secretion rate).
- a specific transport rate quantifies the rate of transport of a metabolite between an average cell and the culture medium.
- Measurements of the amount of biomass in the bioreactor may comprise measurements of the viable cell density. Measurements of the amount of one or more metabolites in the bioreactor may comprise measurements of the amount or concentration of one or more metabolites in the cellular compartment, in the culture medium compartment, or in the cell culture as a whole.
- Determining one or more metabolic condition variables may comprise determining reaction rates for one or more metabolic reactions that form part of the metabolism of the cells in the culture as a function of bioprocess maturity.
- the reaction rates for the one or more metabolic reactions may be determined at least in part using the specific transport rate of the one or more metabolites between the cells and a culture medium in the bioreactor as a function of bioprocess maturity.
- Determining reaction rates for one or more metabolic reactions may comprise obtaining a metabolic model comprising said reactions and solving the metabolic model using at least the specific transport rate of the one or more metabolites as constraints of the metabolic model.
- a metabolic model comprises a stoichiometric matrix S and a set of reaction rates v and solving the metabolic model comprises determining reaction rates v that satisfy:
- obtaining a metabolic model comprises obtaining a metabolic network and deriving a stoichiometry matrix from said metabolic network, or obtaining a stoichiometry matrix.
- obtaining a metabolic model comprises obtaining one or more objective functions to be minimised or maximised. Suitable objective functions include e.g. the maximisation of biomass production, the maximisation of ATP production, the maximisation of protein secretion, etc.
- Using the specific transport rate of the one or more metabolites as constraints of the metabolic model comprises specifying an allowable range of values for at least one of the metabolic reaction rates as a function of at least one of the specific transport rates.
- references to "the cell” may refer to an average cell in the bioprocess.
- Determining or measuring any variable as a function of maturity may comprise determining or measuring the variable as a function of time.
- Measuring a variable as a function of maturity may comprise measuring the variable inline or offline.
- Determining or measuring any variable as a function of maturity may comprise iteratively determining or measuring the variable at a plurality of maturities, such as at successive time points.
- the pre-trained multivariate model may have been trained using biomass and metabolite measurements as a function of maturity from a plurality of bioprocesses considered to operate normally, wherein the measurements include measurements at a plurality of maturities.
- the multiple maturities preferably include maturities that capture the evolution of the bioprocesses from their start to their completion.
- the number and/or frequency of measurements may depend on the circumstances, such as e.g. on practical considerations associated with the measuring process, on the kinetics of the bioprocess itself, etc.
- the multivariate model may have been pre-trained using data from a plurality of similar bioprocesses considered to operate normally, wherein a similar bioprocess is one that uses the same cells for the same purpose.
- the multivariate model may have been pre-trained using data from a plurality of similar bioprocess in which at least some of the bioprocesses differ from each other by one or more process conditions as a function of maturity.
- Two bioprocesses may be considered to differ from each other by one or more process conditions as a function of maturity where said one or more process conditions differ between the bioprocesses for at least one of a plurality of maturities.
- the method may further comprise predicting the effect of a change in one or more process conditions of the bioprocess on the one or more latent variables and/or the one or more metabolic condition variables.
- At least some of the plurality of runs used to train the multivariate model may be associated with one or more critical quality attributes (CQAs).
- the method may further comprise using the values of one or more process variables including one or more metabolic condition variables and a model trained using the values of the one or more metabolic condition variables for the plurality of training runs and the corresponding CQAs to predict one or more CQAs of the bioprocess.
- the model may be a PLS model where the process variables are predictor variables and the CQAs are output variables.
- the method may further comprise merging multiple measurements and/or metabolic condition variables into a single table where the measurements/variables are aligned by maturity.
- the method may further comprise subsampling or binning at least some of the measurements and/or metabolic condition variables.
- the method may further comprise smoothing and optionally supersampling at least some of the measurements and/or metabolic condition variables.
- the data comprises as many of the measurements as possible for each of a plurality of maturity values.
- subsampling, binning and/or supersampling techniques can be used to obtain complete sets of measurements for each of a series of maturity values.
- the analysis performed by the multivariate analysis module is particularly robust to missing data. For example, if an entire observation (all reaction rates) are missing for a particular bioprocess at a particular maturity, the resulting model should still be able to produce useful information.
- the model may not perform as well for this particular maturity, but may still perform satisfactorily for other maturity values.
- data it is believed to be advantageous for data to be available in relation to a large proportion (such as e.g. 50% or more) of the metabolites included in the metabolic model. Indeed, missing specific transport rates may cause errors to occur in the estimates of the other reaction rates in the metabolic model.
- the complexity of the metabolic model i.e. the reactions / pathways
- the complexity of the metabolic model i.e. the reactions / pathways
- a computer implemented method for controlling a bioprocess comprising a cell culture in a bioreactor, the method comprising: implementing the steps of any of the embodiments of the preceding aspect; and sending a signal to one or more effector device(s) to implement a corrective action if the comparison step indicates that the bioprocess is not operating normally.
- the method according to the present aspect may have any of the features disclosed in relation to the first aspect.
- the method of the present aspect may further have any one or any combination of the following optional features.
- the method may further comprise repeating the steps of the method of monitoring the bioprocess, after a predetermined period of time has elapsed since obtaining the preceding measurements.
- the method may further comprise determining a corrective action to be implemented using the loadings associated with the one or more latent variables that are determined to be outside of a predetermined range as a function of maturity.
- An effector device may be any device coupled to the bioreactor and which is configured to change one or more physical or chemical conditions in the bioreactor.
- a system for monitoring a bioprocess comprising a cell culture in a bioreactor, the system including:
- the system according to the present aspect may be configured to implement the method of any embodiment of the first aspect.
- the at least one non-transitory computer readable medium may contain instructions that, when executed by the at least one processor, cause the at least one processor to perform operations comprising any of the operations described in relation to the first aspect.
- a system for controlling a bioprocess including:
- a system for controlling a bioprocess including:
- a method of providing a tool for monitoring a bioprocess comprising a cell culture in a bioreactor, the method including the steps of: obtaining measurements of the amount of biomass and the amount of one or more metabolites in the bioreactor at a plurality of bioprocess maturities for a plurality of bioprocesses that are considered to operate normally;
- the method may comprise any of the features of the first aspect.
- a system for monitoring and/or controlling a bioprocess including: at least one processor; and at least one non-transitory computer readable medium containing instructions that, when executed by the at least one processor, cause the at least one processor to perform the method of any of embodiment of the first or second aspect.
- the system may further comprise, in operable connection with the processor, one or more of:
- a non-transitory computer readable medium comprising instructions that, when executed by at least one processor, cause the at least one processor to perform the method of any embodiment of the first, second or sixth aspect.
- a computer program comprising code which, when the code is executed on a computer, causes the computer to perform the method of any embodiment of the first, second or sixth aspect.
- a system for providing a tool for monitoring a bioprocess comprising a cell culture in a bioreactor, the system including:
- the system according to the present aspect may be configured to implement the method of any embodiment of the sixth aspect.
- the at least one non-transitory computer readable medium may contain instructions that, when executed by the at least one processor, cause the at least one processor to perform operations comprising any of the operations described in relation to the sixth aspect.
- bioprocess refers to a process where biological components such as cells, parts thereof such as organelles or multicellular structures such as organoids or spheroids are maintained in a liquid medium in an artificial environment such as a bioreactor.
- the bioprocess refers to a cell culture.
- a bioprocess typically results in a product, which can include biomass and/or one or more compounds that are produced as a result of the activity of the biological components.
- a bioreactor can be a single use vessel or a reusable vessel in which a liquid medium suitable for carrying out a bioprocess can be contained.
- a bioreactor may be chosen from: advanced microbioreactors (such as e.g. Ambr ® 250 or Ambr ® 15 bioreactors from The Automation Partnership Ltd.), single use bioreactors (e.g. bag-based bioreactors such as Biostat ® STR bioreactors from Sartorius Stedim Biotech GmbH), stainless steel bioreactors (such as e.g. 5 to 2,000 I bioreactors available in the Biostat ® range from Sartorius Stedim Systems GmbH), etc.
- the present invention is applicable to any type of bioreactor and in particular to any vendor and any scale of bioreactor from benchtop systems to manufacturing scale systems.
- a cell culture refers to a bioprocess whereby live cells are maintained in an artificial environment such as a bioreactor.
- the methods, tools and systems described herein are applicable to bioprocesses that use any types of cells that can be maintained in culture, whether eukaryotic or prokaryotic.
- the invention can in particular be used to monitor and/or control bioprocesses using cells types including but not limited to mammalian cells (such as Chinese hamster ovary (CHO) cells, human embryonic kidney (HEK) cells, Vero cells, etc.), non-mammalian animal cells (such as e.g. chicken embryo fibroblast (CEF) cells), insect cells (such as e.g. D. melanogaster cells, B .
- mammalian cells such as Chinese hamster ovary (CHO) cells, human embryonic kidney (HEK) cells, Vero cells, etc.
- non-mammalian animal cells such as e.g. chicken embryo fibroblast (CEF) cells
- insect cells such
- a bioprocess typically results in the production of a product, which can be the cells themselves (e.g. a cell population for use in further bioprocesses, a cell population for use in cell therapy, a cell population for use as a product such as a probiotic, feedstock, etc.), a macromolecule or macromolecular structure such as a protein, peptide, nucleic acid or viral particle (e.g.
- enzymes such as e.g. for use in the food industry, for environmental applications such as water purification, decontamination, etc.
- a small molecule e.g. alcohols, sugars, amino acids, etc.
- Products of a bioprocess may have one or more critical quality attributes (CQAs).
- CQAs critical quality attributes
- a "critical quality attribute” is any property of a product (including in particular any chemical, physical, biological and microbiological property) that can be defined and measured to characterise the quality of a product.
- the quality characteristics of a product may be defined to ensure that the safety and efficacy of a product is maintained within predetermined boundaries.
- CQAs may include in particular the molecular structure of a small molecule or macromolecule (including in particular any of the primary, secondary and tertiary structure of a peptide or protein), the glycosylation profile of a protein or peptide, etc.
- a product may be associated with a "specification” which provides the values or ranges of values of one or more CQAs, that a product must comply with.
- a product may be referred to as “in-specification” (or “according to specification”, “within specification”, etc.) if all of its CQAs comply with the specification, and “non-specification” (or “out-of-specification”) otherwise.
- CQAs may be associated with a set of critical process parameters (CPPs), and ranges of values of the CPPs (optionally maturity-dependent ranges) that lead to acceptable CQAs.
- a bioprocess run i.e.
- CPPs are process parameters.
- the invention provides a way to define the CPPs for a bioprocess in terms of the metabolic condition of the cells in the bioprocess.
- the invention enables the operation of a bioprocess (including in particular the monitoring and/or control of a bioprocess within CQA specification) in terms of a metabolic design space instead or in addition to a process design space (the CQAs are maintained within specification by keeping the metabolic activity within specification instead of by keeping process parameters within specification).
- Process condition refers to any measurable physico-chemical parameter of operation of a bioprocess.
- Process conditions may include in particular parameters of the culture medium and bioreactor operation, such as e.g. the pH, temperature, medium density, volumetric / mass flowrate of material in / out of the bioreactor, volume of the reactor, agitation rate, etc.
- Process conditions may also include measurements of the biomass in the bioreactor or the quantity of a metabolite in a compartment as a whole (including in particular the quantity of a metabolite in any of the cell compartment, culture compartment including culture medium and cells, and the culture medium compartment) of the bioprocess.
- process output refers to a value or set of values that quantify the desired outcome of a process.
- the desired outcome of a process may be the production of biomass itself, the production of one or more metabolites, the degradation of one or more metabolites, or a combination of these.
- Metabolites refers to any molecule that is consumed or produced by a cell in a bioprocess. Metabolites include in particular nutrients such as e.g. glucose, amino acids etc., by-products such as e.g. lactate and ammonia, desired products such as e.g. recombinant proteins or peptides, complex molecules that participate in biomass production such as e.g. lipids and nucleic acids, as well as any other molecules such as oxygen (O 2 ) that are consumed or produced by the cell. As the skilled person understands, depending on the particular situation, the same molecule may be considered a nutrient, a by-product or a desired product, and this may even change as a bioprocess is operated. However, all molecules that take part in cellular metabolism (whether as an input or output of reactions performed by the cellular machinery) are referred to herein as "metabolites”.
- cell metabolic condition refers to the value of one or more variables that characterise the dynamics of the metabolism of cells in a bioprocess (i.e. metabolic activity of the cells in a bioprocess). This may include in particular the specific transport rate of a metabolite into / out of cells, the reaction rate of a metabolic reaction, the concentration of a metabolite inside a cell (also referred to herein as “internal metabolite concentration”), or any variable that is derived from one or more of these (e.g. using multivariate analysis techniques).
- the cell uptake or secretion rate of a metabolite i.e.
- the concentration of the metabolite inside a cell may be considered to represent metabolic variables (in that they characterise the metabolism of the cell).
- the concentration of the same metabolite in a compartment of the bioprocess e.g. in the bulk composition or the liquid medium, which may be expressed in terms of units of mass per volume
- a process variable in that it characterises a macroscopic process variable.
- the concentration of oxygen or glucose in the liquid medium e.g.
- process parameter describing the process at a macroscopic level (process condition)
- concentration of oxygen or glucose in the cells e.g. in mass/cell
- metabolic variable describing the metabolic condition of the cells.
- the term “maturity” refers to a measure of completion of a bioprocess. Maturity is commonly captured in terms of time from the start of a bioprocess to the end of the bioprocess. Therefore, the term “maturity” or “bioprocess maturity” may refer to an amount of time from a reference time point (e.g. the start of the bioprocess). As such, the wording "as a function of bioprocess maturity” (e.g. quantifying a variable "as a function of bioprocess maturity”) may in some embodiments refer to "a function of time” (e.g. quantifying a variable "as a function of time, e.g.
- any other measure that increases monotonically as a function of time could be used, such as e.g. the amount of a desired product (or undesired by-product) accumulating in the medium or extracted since the start of a bioprocess, the integrated cell density, etc. may be used.
- the maturity may be expressed in terms of percentage (or other fractional measure) or as an absolute value that progresses to a value (typically a maximum or minimum value), at which point the bioprocess is considered complete.
- multivariate statistical model refers to a mathematical model that aims to capture the relationships between multiple variables.
- Common multivariate statistical models include principal components analysis (PCA), partial least square regression (PLS) and orthogonal PLS (OPLS).
- PCA principal components analysis
- PLS partial least square regression
- OPLS orthogonal PLS
- multivariate statistical analysis refers to the building (including but not limited to the design and parameterisation) and/or using of a multivariate statistical model.
- Principal component analysis is used to identify a set of orthogonal axes (referred to as "principal components) that capture progressively smaller amounts of the variance in the data.
- the first principal component (PC1) is the direction (axis) that maximises the variance of the projection of a set of data onto the PC1 axis.
- the second principal component (PC2) is the direction (axis) that is orthogonal to PC1 and that maximises the variance of the projection of the data onto the PC1 and PC2 axes.
- the coordinates of a data point in the new space defined by one or more principal components is sometimes referred to as "scores”.
- PCA functions as a dimensionality reduction approach, resulting in scores for each data point that capture the contribution of multiple underlying variables to the diversity in the data.
- PCA can be used on historical data about a set of runs of a bioprocess, to characterise and distinguish good (normal) and bad (not normal) process conditions. This enables the retrospective identification of when a historical batch has deviated outside of acceptable process conditions, and to interpret which of the individual process variables are most responsible for the deviation observed in the global process condition. This can then be used to investigate how to avoid such a deviation in the future.
- PLS is a regression tool that identifies a linear regression model by projecting a set of predicted variables and corresponding observable variables onto a new space.
- PLS identifies the relationship between a matrix of matrix of predictors X (dimension mxn ) and a matrix of responses Y (dimension mxp ) as:
- X TP t + E
- Y UQ t + F
- T and U are matrices of dimension mxl that are, respectively, the X score (projections of X onto a new space of "latent variables") and the Y scores (projections of Y onto a new space);
- P and Q are orthogonal loading matrices (that define the new spaces and respectively have dimensions nxl and px /); and
- matrices E and F are error terms (both assumed to be IID - independent and identically distributed - random normal variables).
- the scores matrix T summarises the variation in the predictor variables in X
- the scores matrix U summarises variation in the responses in Y.
- the matrix P expresses the correlation between X and U
- the matrix Q expresses the correlation between Y and T.
- the decomposition of X and Y into a matrix of scores and corresponding loadings is performed so as to maximise the covariance between T and U.
- OPLS is a variant of PLS where the variation in X is separated into three parts: a predictive part that is correlated to Y ( TP t as in the PLS model), an orthogonal part ( T orth P orth t which captures systematic variability that is not correlated to Y ) and a noise part (E as in the PLS model - which captures residual variation).
- Partial least squares (PLS) and orthogonal PLS (OPLS) regression can be used to characterise the impact that the process condition has on a desired process output (concentration of product, quality attribute, etc.).
- This can be performed by fitting an (O)PLS model as described above, with X including the one or more process variables that are believed to have an effect on the process output, and Y including the corresponding measures of process output. This can be used to identify which process variables can be manipulated, and how they should be manipulated, to improve or control a desired output.
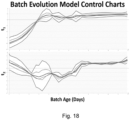
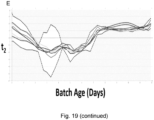
- the Umetrics ® software suite (Sartorius Stedim Data Analytics) further includes so called "batch evolution models" (BEM) which describe the time-series evolution of process conditions, referred to as the process 'path'.
- BEM batch evolution models
- the process paths are obtained by fitting an (O)PLS model as described above, but where X includes the one or more process variables that are believed to be of potential relevance, measured at multiple times (maturity values) over the evolution of the process, and Y includes the corresponding maturity values.
- X includes the one or more process variables that are believed to be of potential relevance, measured at multiple times (maturity values) over the evolution of the process
- Y includes the corresponding maturity values.
- a set of n process variables may have been measured at m maturity values, and these nxm values may be included as a coefficient in the matrix X.
- the corresponding matrix Y is an mx1 matrix (i.e.
- the T matrix therefore comprises scores values for each of the m maturity values and each of I identified latent variables that describe the aspects of the process variables that are most correlated with maturity.
- process measurements that are contributing to the deviation in process condition can be highlighted to the operator (by analysing the variables in X that most contribute to the score in T that has been observed to deviate from the expected course) to assist in diagnosing the problem and identifying the appropriate course of corrective action. This can all be done in real-time. Furthermore, operators only need to consider a small set of summary parameters during normal batch operation with the option to drill-down into specifics with an appropriate subject matter expert only when something is going wrong.
- FBA flux balance analysis
- the method further defines an objection function Z (which describes cells goals in mathematical terms, according to an assumption of what the metabolism of the cell is optimised for) to be maximised (or minimised) and a set of constraints lowerbound ⁇ v ⁇ upperbound.
- x are the variables that define the cell goals (typically one or more of the reaction rates v )
- ⁇ and ⁇ are coefficients that describe the impact of x on the cell goals
- met is the vector of internal metabolite concentrations (i.e.
- Equation (4a) does not have a unique solution because the number of reactions it typically higher than the number of metabolites, resulting in an under-determined system of equations with more variables than equations. This can be resolved for example using linear programming, quadratic programming, integer linear programming or mixed integer linear programming. All of these involve the specification of an objective function (to be minimised or maximised) and a set of constraints that specify a space (a convex polytope) over which the objective function is to be optimised.
- the objective function is linear and so are the constraints.
- quadratic programming the objective function is a quadratic function of several variables, and the constraints are linear.
- integer linear programming the variables are constrained to be integers, whereas mixed integer linear programming uses both integer and linear constraints.
- a suitable optimisation method may advantageously be chosen depending on the form of the objective function.
- nonlinear optimisation methods may be advantageous when using objective functions that do not have a convex solution space.
- nonlinear optimisation methods may start with an initial guess of the solution space from which they find a local optimum, and this process may be repeated a number of times to increase confidence that the global optimum has been found.
- the objective function and constraints are often chosen taking into account biological considerations.
- the objective function represents how each component in the system contributes to the production of product to be maximised (or minimised, as the case may be).
- a common choice of objective function is the biomass in the system, assuming that the metabolism of a cell is optimised to maximise the production of new biomass.
- the stoichiometry of the biomass pseudo reaction may capture the mass fraction ( ⁇ i ) of the i metabolites needed to produce new cells (by producing e.g. RNA, DNA, proteins, etc.) .
- a biomass pseudo reaction could be provided as ⁇ i ⁇ i ⁇ [ i ] ⁇ biomass + ⁇ j ⁇ j ⁇ [ j ]
- ⁇ i is the mass fraction of the metabolites i (with concentration [i]) needed to produce the biomass (e.g. amino acids needed to produce protein, nucleotide sugars needed to create DNA and RNA, energy in the form of e.g. ATP, water, etc.)
- ⁇ j is the mass fraction of the metabolites j (with concentration [j]) that are by-products of the production of biomass (e.g. ADP/AMP, phosphate, hydrogen, etc.).
- an objective function may include maximising the amount of ATP produced (e.g. maximising the rate of production of ATP or the ATP yield, where ATP yield may normalise the rate of production of ATP to the specific uptake rate of a nutrient such as e.g. glucose), minimising the amount of nutrient consumed per biomass production, etc. (as reviewed in Schuetz, Kuepfer and Sauer, Mol. Syst Biol. 2007; 3:119 ).
- an objective function may include minimizing the overall intracellular flux (e.g. using an objective function of the form min ⁇ i v i 2 ), in which case quadratic programming may be used to solve the optimisation problem.
- objective function may include maximizing ATP yield per flux unit (e.g. using an objective function of the form max v ATP ⁇ i v i 2 ), in which case a nonlinear solver may be used to solve the optimization problem.
- the constraints on the fluxes of each reaction ( lowerbound / upperbound ) can be set to arbitrary low/high values (i.e. very loose constraints). Alternatively, constraints on the fluxes can be determined experimentally.
- the flux in the model can be constrained to be within some error ⁇ of the experimentally defined value, i.e.: v i,exp - ⁇ ⁇ v i ⁇ v i,exp + ⁇ .
- MFA metabolic flux analysis
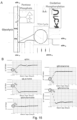
- FIG. 1A shows an embodiment of a system for monitoring and/or controlling a bioprocess according to the present disclosure.
- the system comprises a computing device 1, which comprises a processor 101 and computer readable memory 102.
- the computing device 1 also comprises a user interface 103, which is illustrated as a screen but may include any other means of conveying information to a user such as e.g. through audible or visual signals.
- the computing device 1 is operably connected, such as e.g. through a network 6, to a bioprocess control system comprising a bioreactor 2, one or more sensors 3, and one or more effectors 4.
- the computing device may be a smartphone, tablet, personal computer or other computing device.
- the computing device is configured to implement a method for monitoring a bioprocess, as described herein.
- the computing device 1 is configured to communicate with a remote computing device (not shown), which is itself configured to implement a method of monitoring a bioprocess, as described herein.
- the remote computing device may also be configured to send the result of the method of monitoring a bioprocess to the computing device.
- Communication between the computing device 1 and the remote computing device may be through a wired or wireless connection, and may occur over a local or public network such as e.g. over the public internet.
- Each of the sensor(s) 3 and optional effector(s) 4 may be in wired connection with the computing device 1, or may be able to communicate through a wireless connection, such as e.g. through WiFi, as illustrated.
- connection between the computing device 1 and the effector(s) 4 and sensor(s) may be direct or indirect (such as e.g. through a remote computer).
- the one or more sensors 3 are configured to acquire data that relates to a bioprocess being performed in the bioreactor 2.
- the one or more effectors 4 are configured to control one or more process parameters of the bioprocess being performed in the bioreactor 2.
- the one or more sensors 3 may each be on-line sensors (sometimes also referred to as "inline sensors"), which automatically measure a property of the bioprocess as it progresses (with or without requiring a sample of the culture to be extracted), or off-line sensors (for which a sample is obtained whether manually or automatically, and subsequently processed to obtain the measurement). Each measurement from a sensor (or quantity derived from such a measurement) represents a data point, which is associated with a maturity value.
- the one or more sensors 3 comprise a sensor that is configured to record the biomass in the bioreactor 2, referred to herein as a "biomass sensor”.
- the biomass sensor may record a physical parameter from which the biomass in the bioreactor (typically in the form of the total cell density or the viable cell density) can be estimated.
- biomass sensors based on optical density or capacitance are known in the art.
- the one or more sensors further comprise one or more sensors that measure the concentration of one or more metabolites, referred to herein as "metabolite sensors".
- a metabolite sensor may measure the concentration of a single or a plurality of metabolites (such as e.g. from a few metabolites to hundreds or even thousands of metabolites), in the culture as a whole, the culture medium compartment, the biomass compartment (i.e. the cells as a whole), or specific cellular compartments.
- Examples of metabolite sensors are known in the art and include NMR spectrometers, mass spectrometers, enzyme-based sensors (sometimes referred to as "biosensors", e.g.
- sensors 3 may also refer to systems that estimate the concentration of a metabolite or the amount of biomass from one or more measured variables (e.g. provided by other sensors).
- a metabolite sensor may in practice be implemented as a processor (e.g. processor 101) receiving information from one or more sensors (e.g. measuring physical/chemical properties of the system) and using one or more mathematical models to estimate the concentration of a metabolite from this information.
- a metabolite sensor may be implemented as a processor receiving spectra from a near infrared spectrometer and estimating the concentration of metabolites from these spectra.
- the one or more sensors 3 may optionally further include one or more sensors that measure further process conditions such as pH, volume of the culture, volumetric / mass flowrate of material in / out of the bioreactor, medium density, temperature, etc. Such sensors are known in the art. Whether one or more sensors 3 that measure further process conditions are necessary or advantageous may depend on at least the operating mode and the assumptions made by the material balance module as will be explained further below. For example, where the bioprocess is not operated as an unfed-batch, it may be advantageous to include one or more sensors measuring the amount and/or composition of the flows entering and/or leaving the bioreactor. Further, where the material balance module does not assume a constant volume in the bioreactor, it may be advantageous to include a sensor that measures the volume of liquid in the bioreactor (such as e.g. a level sensor).
- FIG. 1B shows a simplified process diagram for a generic bioprocess that can be implemented in the system of Figure 1A .
- the bioprocess is implemented in the reactor 2, which in the embodiment shown is equipped with agitation means 22.
- Four flows are depicted, although depending on the particular situation any or all of these flows may be absent.
- a first flow 24 is a feed flow F F containing anything that is added to the culture in the bioreactor (typically this includes fresh medium, in which case the bioprocess may be referred to as a "fed-batch” process, "perfusion” process or “continuous” process), a second flow 26 is a bleed flow F B that has the same composition as the culture in the bioreactor, a third flow 28A is a harvest flow F H which is obtained through the processing of an auxiliary harvest stream 28C through a cell separation means 28 to produce the third (harvest) and fourth flow 28B, the fourth flow 28B being a recycle flow F R comprising the cells and any culture medium that has not been completely separated out in the cell separation means 28.
- the recycle flow F R may be ignored as considering only the harvest flow F H is sufficient to capture the flow that is effectively output from the bioreactor through the harvesting and cell separation process. Therefore, the reference to a harvest flow being present or absent may refer to the auxiliary harvest stream 28C (and derived harvest and recycle flows - F H and F R ) being present or absent.
- This harvest flow F H may be assumed to comprise medium that has the same composition as the medium in the reactor, but no or few cells.
- the feed, bleed and harvest flows (F F , F B , F H and F R ) may all be absent, in which case the bioprocess is referred to as an "unfed batch process" or simply "batch process".
- the bioprocess When a feed flow F F and a harvest flow F H are provided, the bioprocess may be referred to as a "perfusion" culture.
- a feed flow F F and a bleed flow F B are provided such that the bioprocess is operated at (pseudo) steady-state (from a process condition point of view, i.e. maintaining in particular the volume of the culture constant), the bioprocess may be referred to as a "continuous" culture.
- a feed flow F F is provided in the absence of output flows (bleed and harvest flows, F B and F H )
- the bioprocess When a feed flow F F is provided in the absence of output flows (bleed and harvest flows, F B and F H ), the bioprocess may be referred to as a "fed-batch" process.
- the present invention is applicable to all of the above operating modes.
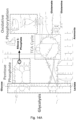
- FIG 1C illustrates schematically a computing architecture for implementing a method according to embodiments of the invention.
- the computing architecture may be embodied in a computer software product that is run by the computing device 1 or a remote computing device. Further some of the modules described below may be executed by the computing device 1 and others by a remote computer.
- the architecture comprises a parsing and pre-processing module 110, a material balance module 120, a systems biology module 140, and a multivariate analysis module 160.
- the multivariate analysis module 160 may output one or more results to a user interface 1003 (e.g. user interface 103 of computing device 1).
- the parsing and preprocessing module 110 takes as input data about one or more bioprocesses, for example data received from the one or more sensors 3, including biomass data 130A, metabolites data 130B, and optional additional data 103C such as e.g. further process data such as temperature, pH, etc. Each data point is associated with a maturity value.
- the parsing and preprocessing module 110 converts the data generated by the sensors 103 into a format that can be used by the material balance module 120. This may involve one or more steps selected from: loading the data generated by each of the sensors in the physical apparatus description into the computer used for performing calculations, appending user specified metadata (such as e.g. a batch identifier, date, process condition of interest e.g. where a specific feeding scheme is being evaluated, etc.), merging multiple measurements into a single data table, aligning the measurements to a common set of maturities such as by subsampling or binning higher frequency data and/or smoothing and super-sampling lower frequency data - for example using methods such as linear interpolation, zero-order hold, etc.
- appending user specified metadata such as e.g. a batch identifier, date, process condition of interest e.g. where a specific feeding scheme is being evaluated, etc.
- merging multiple measurements into a single data table aligning the measurements to a common set of maturities such as by sub
- Merging multiple measurements into a single data table may include combining data in a table where all data is aligned by maturity (e.g. one column per maturity value and one row per sensor). Where data from multiple batches is combined for joint analysis, multiple tables may be created one for each run. Smoothing some or all of the measurements may comprise fitting one or more models to the data, such as e.g. one or more polynomial models.
- the parsing and preprocessing module 110 may instead or in addition to smoothing the measurements data, smooth derived values such as e.g. pseudo metabolite concentrations and/or specific transport rates determined by the material balance module 120.
- the material balance module 120 uses the biomass and metabolite concentration data and calculates a metabolite transport rate (qMet) for one or more (such as e.g. all) metabolites for which concentration data is available, at a plurality of maturities m.
- Concentration data may be available because it has been measured using one or more sensors 3, or because it is known for example by virtue of using a chemically defined medium.
- References to "measured metabolites” and “measured metabolite concentrations” as used herein refer to metabolites whose concentration is known, regardless of whether it is measured by sensors 3 or whether it has bene previously determined and/or is known as part of the characteristics of a medium that is used.
- the transport rate qMet n of a metabolite n quantifies the flux of the metabolite between the cells and the culture medium in the bioreactor. This flux typically results from consumption and/or production of the metabolite by the cells, and may be expressed in units of a quantity of metabolite (e.g. mass or moles) per cell per unit of time or maturity. Where the metabolite is a nutrient, the specific transport rate may also be referred to as a "specific consumption rate”. Where the metabolite is a product or by-product, the specific transport rate may be referred to as a "specific production rate".
- Equation (7) expresses in mathematical form the conservation of mass in the system. At every maturity m (e.g. every time point t), equation (7) must be satisfied.
- the flows of metabolite in equation (7) may be expressed as mass flows or molar flows (as the latter can be converted to the former and vice-versa using molar mass, such that the conservation of mass expressed in the equation is verified regardless of the units chosen), and the skilled person would be able to convert one into the other.
- references to mass flows are intended to encompass the use of the corresponding molar flows with corresponding adjustments for consistency of units within an equation.
- the flow of metabolite into the bioreactor depends on the value of the feed flow F F and the concentration of the metabolite in this flow (if this flow is present, i.e. F F ⁇ 0).
- the flow of metabolite out of the bioreactor depends on the value of the harvest flow F H (if present) and the value of the bleed flow F B (if present), and the concentration of the metabolite in these respective flows.
- qMet is negative if the metabolite is being consumed, and positive if it is being produced. Equation (8) assumes that the harvest flow 28A contains the only material leaving the system through the auxiliary harvest flow 28C (i.e.
- Equation (8) can be adapted to include an auxiliary harvest flow 28C (and corresponding [Met] and ⁇ ) and a return flow 28B (and corresponding [Met] and ⁇ ). Further, Equation (8) can be amended to model the removal of some cells through the harvest flow. In other words, additional terms can be added to Equation (8) and some can be removed depending on the set-up of the bioprocess and the assumptions made.
- IVCD m may be calculated as ((VCD m + 1 + VCD m ) / 2) * ( t m +1 - t m )).
- a function may be fitted to the viable cell density data (i.e. a function that expresses the viable cell density as a function of time/maturity), for example for the purpose of smoothing the data in the parsing and preprocessing module 110.
- Such a function can be used to calculate the integrated viable cell density, by integrating the function at maturity m (e.g. analytically). For example, where the function expressing the concentration of a metabolite ( y j ) is a polynomial (e.g.
- equation in (7) can be expressed and solved for qMet differently depending on the operating mode (e.g. fed-batch, unfed-batch, etc.) and the assumptions made (e.g. variable volume, variable concentration in the various flows and in the bioreactor, etc.).
- the skilled person would be able to express and solve equation (7) accordingly, in light of the teaching provided herein. Further, whether a particular assumption is reasonable may depend on the situation, and the skilled person would be able to verify whether this is the case using well known techniques. For example, the skilled person would be able to verify whether the volume of a culture is constant (e.g.
- the concentration of a small molecule metabolite in the culture medium may be likely to be the same in the bioreactor and in the out flows (harvest and /or bleed flows), whereas the concentration of a macromolecule may differ between the bioreactor and one or more of the out flows if the macromolecule is likely to be held up on filters or other structures.
- Equation (8b) may be particularly useful in embodiments where the feed-flow is continuous or semi-continuous, such as e.g. in drip feed flows.
- a pseudo metabolite concentration [pMet] may be obtained by: (i) using the measured (or otherwise determined, such as e.g. based on the initial reactor volume and the volumes provided in the one or more feed bolus) reactor volume and known feed concentrations to determine how much of the metabolite is added to the reactor with each feed, and (ii) subtracting the value in (i) from all measurements of the metabolite's concentration after the feed.
- a pseudo metabolite concentration [pMet] may be obtained by: (i) using the measured (or otherwise determined, such as e.g.
- the integrated viable cell density may be calculated using any methods known in the art.
- the integrated viable cell density may be calculated, as explained above, using the trapezoidal rule or by integrating a function that may have been fitted to the viable cell density data.
- a function may be fitted to the metabolite data (i.e. a function that expresses the metabolite concentration as a function of time/maturity), for example for the purpose of smoothing the data in the parsing and preprocessing module 110.
- Such a function can be used to obtain the term d Met dt in any of the above equations (instead of using a first order finite difference approximation), by obtaining the derivative of the function at maturity m (e.g. analytically).
- the equations for qMet as described above can be solved using the measured biomass and metabolite concentration to obtain a metabolite transport rate at every time point / maturity value where the above measurements are available. Further, this can be performed individually for each measured metabolite.
- the resulting metabolite transport rates characterise the metabolic condition of the cells in the culture as a function of maturity, and are expressed as an amount of metabolite (mass or moles) per cell per unit of maturity (i.e. typically per unit of time).
- the output of the material balance module 120 may also be used by the systems biology module 140, which models the metabolic processes that occur within the cells in the culture in order to calculate at least cell metabolic reaction rates.
- the systems biology module 140 models the metabolic processes that occur within the cells in the culture in order to calculate at least cell metabolic reaction rates.
- FBA flux balance analysis
- MFA Metabolic Flux Analysis
- TMFA Thermodynamic-based MFA
- parsimonious flux balance analysis which seeks to minimise the total flux through all reactions in the model while also optimising the objective function in equation (3)
- enzyme capacity constrained flux balance analysis which adds constraints to the flux values using enzyme kinetic data such as turnover rates
- FBA and MFA any approach to determine the cell metabolic reaction rates associated with a metabolic network may be used.
- any approach may be used that solves equation 3, subject to the constraints of Equation 4, (with or without making the further assumption of equation (4a)) and one or more boundary constraints such as those of equation (5) (where a lower and/or upper bound may be available for any flux v, i.e. there may be arbitrary sets of fluxes v i and v j - which may be partially or fully overlapping sets, and may not include all fluxes in the model S, such that ⁇ i, lower bound; ⁇ v i and ⁇ j, v j ⁇ upper bound j ).
- the systems biology module 140 may calculate further values in addition to the cell metabolic reaction rates, such as e.g. the concentration of one or more metabolites in the cells. This may be the case, for example, where MFA is used to model the metabolic processes that occur within the cell. Any such outputs may also represent metabolic condition variables and may be used by the multivariate analysis module160 as will be explained further below.
- the objective function can be chosen as e.g. the maximisation of biomass, thereby expressing the optimization problem as a calculation of all internal reaction rates, v, that lead to a maximum amount of biomass, Z, being produced in order to simulate cell growth (see equation (6) above).
- Any other objective function known in the art may be used, as explained above, such as e.g. maximising the production of ATP, maximising the production (or the secretion rate) of a desired product (e.g. if a cell has been specifically engineered to maximise said production), etc.
- different objective functions may be used at different stages of a bioprocess (i.e. at different maturity values). For example, an objective function that maximises biomass production may be used during the growth phase of a cell culture, and an objective function that maximises a protein production rate may be used in the stationary phase of a cell culture.
- the constraints on at least some of the reaction rates v may advantageously be expressed as functions of the specific transport rates determined by the material balance module 120 (where such specific transport rates are available).
- the reaction rates v that relate to the transport of a metabolite between the cellular compartment and the culture medium is advantageously constrained using the corresponding specific transport rate determined by the material balance module 120.
- the constraints on a reaction rate that represents the transport reaction corresponding to the specific transport rate e.g.
- f low,i (qMet i ) may be chosen as (1-x)*qMeti (where x is a value between 0 and 1, such as e.g. 0.1, 0.2, 0.3, 0.4, etc.).
- f up,i (qMet i ) may be chosen as (1+x)*qMet i (where x is a value between 0 and 1, such as e.g. 0.1, 0.2, 0.3, 0.4, etc.). In embodiments where x is the same for both functions, this effectively in v Exchange,i being constrained in the interval qMet i ⁇ (x * qMet i ). In embodiments where x is e.g. 0.1 (respectively 0.2, 0.3, 0.4 etc.), this results in v Exchange, being constrained to be within 10% (respectively 20%, 30%, 40% etc) of qMeti.
- reaction rates v may be loosely constrained to include a wide range of possible values (i.e. setting a lowerbound and a high upperbound ), for example where no specific transport rate is available that could be used to set the constraints. Further, some reaction rates v may be constrained using prior knowledge of likely reaction rates, such as e.g. obtained from literature or prior experimentation. For example, for a reaction that only works in one direction, the lowerbound may be set to 0. Similarly, realistic upper and lower bounds for some reaction rates may be obtainable from measurements obtained using similar cells and/or enzymes.
- the stoichiometry matrix S may contain coefficients that correspond to a metabolic network that captures any part of a cell's metabolism that is assumed to be potentially relevant to the bioprocess.
- Metabolic networks and pathways that make up such networks are available from multiple databases for many model cell lines and organisms, including e.g. CHO cells and E.coli cells. Further, relevant subsets of these metabolic networks and pathways may be selected based on prior knowledge or automatically extracted based on the information available (e.g. using the metabolites for which specific transport rates are available and any other metabolites that are involved whether directly or indirectly in their consumption or production, using information about what enzymes are expressed by a cell such as e.g. obtained through gene expression analysis, etc.). In embodiments, metabolic networks that are limited to the central carbon metabolism may be used. In other embodiments, genome scale metabolic networks may be used. Metabolic networks / pathways that are specific to the cell type used or a related cell type are preferably used.
- the systems biology module 140 may execute the following operations: 1) generate or receive (e.g. from a user, database, etc.) a stoichiometric matrix S; 2) generate or receive (e.g. from a user, database, etc.) an objective function Z ; 3) for a plurality of (such as e.g.
- each) maturity points for which specific transport rates have been determined by the material balance module 120 calculate all reaction rates v, by solving equation (3) (or (6), as the case may be) subject to the constraints in equations (4) (or (4a), where a pseudo steady state assumption is made, such as when a flux balance analysis approach is used) and (5) (or (10), where specific transport rates - from the material balance module 120- are available that correspond to the particular reaction rate to be constrained).
- the equations for v as described above can be solved using the metabolite transport rates at every time point / maturity value where these were calculated by the material balance module 120.
- the resulting reaction rates further characterise the metabolic condition of the cells in the culture as a function of maturity, as they not only capture the transport of metabolites between a cell and the culture medium, but also any reaction within the cell that has been included in the model (at least some of which consume or produce the metabolites that have been measured).
- the stoichiometric matrix S and the optimization function used for every maturity may be the same.
- the stoichiometric matrix S and/or the optimization function (Equation (3)) may be chosen independently (and hence may differ) at every time point.
- different stoichiometric matrices S may be used at different time points when a metabolic network is constructed from different data (e.g. transcripts) at different time points.
- the optimization problem may be modified to reflect different objectives Z depending on the culture phase, such as e.g. maximizing biomass during growth phase and maximizing protein production during stationary phase.
- the systems biology module 140 generating or receiving a stoichiometric matrix S may comprise the systems biology module 140 generating or receiving a plurality of stoichiometric matrices each associated with one or more maturities.
- the systems biology module 140 generating or receiving an objective function Z may comprise the systems biology module 140 generating or receiving a plurality of objective functions Z each associated with one or more maturities.
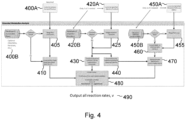
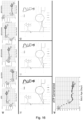
- FIG. 4 As specific embodiment of a method for determining cell metabolic reaction rates that can be implemented by the systems biology module 140 is illustrated on Figure 4 .
- step 400A specific transport rates are received from the material balance module 120. These represent experimentally derived constraints on the metabolic fluxes.
- additional information on "reasonable" fluxes is optionally obtained from prior knowledge (e.g. data base, default settings, etc.). These represent prior knowledge derived constraints on the metabolic fluxes.
- the experimentally derived constraints are combined with the optional prior knowledge derived constraints, for example by using an experimentally derived constraint wherever available, and using prior knowledge derived constraint otherwise.
- flux boundaries are created using the constraints from step 405. For example, the flux boundaries may be created as functions (e.g. predetermined linear functions) of the constraints from step 410, as explained above.
- one or more cell goals to be optimised are received from a user and/or a database, respectively.
- any user defined cell goals that may have been received are merged with any database-derived cell goals that may have been received.
- an objective function Z is constructed which reflects the cell goals.
- any pseudo-reaction that may be needed to tie the objective function to the metabolic network that will be modelled is optionally created.
- the objective function reflects the goal of maximising the production of ATP
- a pseudo-reaction may be created which captures the outputs of all reactions that produce ATP. This may be achieved, for example, by including a pseudo reaction that consumes ATP, such as e.g.
- a set of metabolic pathways (also referred to herein as a metabolic network) is received from a user and/or a database.
- any user defined and any database derived metabolic pathways are merged into a single metabolic network.
- the metabolic network is converted into a stoichiometry matrix S.
- any pseudo-reactions created at step 440 are added to the stoichiometry matrix S.
- pseudo reactions that capture the objectives to be used may not be necessary and/or may already be included in a metabolic network received from a user and/or a database. As such, steps 440 and 470 may not be performed.
- all reaction rates v solutions of the flux balance analysis
- the multivariate analysis module 160 takes inputs from the material balance module 120 (in the form of the qMet that have been determined as explained above for a plurality of time/maturity values over the course of one or more bioprocesses), and optionally also from the systems biology module 140 (in the form of at least the reaction rates v - and optionally also the internal metabolites concentrations m - that have been determined as explained above for a plurality of time/maturity values over the course of one or more bioprocesses, if available). Each of these inputs provides information about the cell metabolic condition at a given time / maturity during a bioprocess.
- the inputs from the systems biology module 140 are not required for the functioning of the multivariate analysis module, but they advantageously provide further (potentially more complete / detailed) information about the metabolic condition of the cells. Therefore, embodiments in which the multivariate analysis module 160 takes inputs from the material balance module 120, and embodiments in which the multivariate analysis module 160 takes inputs from the material balance module 120 and the systems biology module 140 are both explicitly envisaged herein.
- the multivariate analysis module uses this information to characterise the evolution of the bioprocess over time, in a manner that takes into account the cell metabolic condition. This is accomplished using one or more multivariate analysis models as described above, where the variables representing the cell metabolic condition are used instead or in addition to process variables that were previously used in such analyses. This may be advantageously accomplished using a batch evolution modelling process as explained above. In particular, this may be accomplished using a PLS model where, in equations (1) and (2):
- the PLS model projects the set of measured/calculated process variables (including the variables that characterise the cell metabolic condition, i.e. the reaction rates v, internal metabolites concentrations (when these have been determined) and/or specific transport rates qMet ) and the corresponding maturities t onto principal components that maximize the covariance between the principal components extracted from the measured/calculated process variables and the principal components extracted from the maturity variable.
- the loadings in P and Q are selected to maximise the covariance between the measured/calculated variables (including at least cell metabolic condition variables) and the maturity.
- the scores in U describe the variability in maturity
- the set of scores in T describe the variability in the predictive variables X.
- the model finds a smaller space that captures much of the variability in the data.
- the PLS takes as input a large set of highly correlated reaction rates and finds the consistent patterns between these, to identify a smaller set of variables that can be interpreted as drivers of metabolic shifts, and relates the changes in terms of these variables to the maturity.
- the score values T can then be used as summary variables that characterise the cell metabolic condition as a bioprocess progresses.
- the parameters of the PLS model (loadings and weights) can be quantified using a series of related bioprocesses (e.g.
- model calibration procedure including data from runs that are considered normal, i.e. resulting in a product "within specification", whether the runs were obtained using the same or different process parameters), in order to define a range of values of the scores that are acceptable.
- This can be referred to as a model calibration procedure, or model training procedure.
- the results of the model calibration process can then be used to monitor a new bioprocess (i.e. to implement a monitoring step or a prediction method by using the loadings in P to calculate scores T for new bioprocesses and compare these to the scores for historical bioprocesses that are within specification).
- these inputs may include rates that correspond to the specific transport rates obtained by the material balance analysis module 120 (where corresponding rates are rates that are present in the metabolic model and capture the same process as the specific transport rate, i.e. the net input /output of a metabolite in/out of the cells).
- the systems biology module 140 will calculate reaction rates v which include those uptake rates and rates of all internal reactions that have been included in the model, such that the objective function is optimised, and qGlucose, qLactate are within the specified ranges.
- the inputs from the systems biology module 140 may therefore include those qGlucose, qLactate, instead or in addition to the values from the material balance analysis module 120. In embodiments, such as e.g.
- the rates provided by the systems biology module 140 and that correspond to the specific transport rates obtained by the material balance analysis module 120 are identical to those respective corresponding rates.
- the rates from the material balance analysis module 120 may in practice be sufficient for the multivariate analysis module 160 to receive inputs from the systems biology module 140. Therefore, the multivariate analysis module 160 receiving inputs from the systems biology module 140 and from the material balance analysis module 120 may comprise the multivariate analysis module 160 receiving inputs from the systems biology module 140 and from the material balance analysis module 120 via the systems biology module 140 (i.e. as part of the inputs from the systems biology module 140).
- both sets of inputs may nevertheless be received by the multivariate analysis module 160, for example to verify that the corresponding rates are indeed the same.
- the multivariate analysis module 160 may receive inputs from both the systems biology module 140 and the material balance analysis module 120, and may, for each rate that has a corresponding rate received from both module, use the rate from one or the other module, or a rate derived from both rates (such as e.g. by averaging the corresponding rates).
- FIG. 2 illustrates schematically a model calibration procedure, through which a tool for monitoring a bioprocess may be provided.
- data is obtained in relation to one or more runs of a bioprocess which resulted in a product within specification.
- the data includes biomass data 103A, metabolites data 103B and optional additional data 103C.
- Obtaining data may include collecting historical data (i.e. obtaining data from a data store, such as e.g. database 102) or obtaining data by performing one or more runs of a bioprocess and measuring the biomass and concentration of one or more metabolites at a plurality of time points (maturity values).
- the data preferably includes enough observations to build a representative data set capturing common cause variation in metabolism.
- the data may additionally include enough observations to capture special cause variation.
- Common cause variation refers to variations in metabolism that are expected during the normal course of a bioprocess, such as e.g. when the cells progress from an exponential growth phase to a stationary growth phase.
- Special cause variation refers to variations in metabolism that are the result of a change in a process condition, such as e.g. a change in temperature, pH or bulk media composition.
- a change in a process condition may be introduced deliberately, for example in order to test the effect of the process condition change on the output of the bioprocess.
- the model resulting from calibration using said data can be used to monitor a process by performing fault detection, i.e. determining whether a bioprocess is operating in expected ("normal") conditions.
- the model resulting from calibration using said data may be used to monitor a process by performing fault detection (identifying where a bioprocess has not proceeded in expected ("normal") conditions), and to perform a predictive analysis whereby the effect of a change in process conditions on the bioprocess may be predicted.
- a data set may be considered to include "enough observations” to capture common and/or special causes of variation when one or more convergence criteria are met.
- a data set may be considered to include "enough observations” when the standard deviation of the trajectories of the scores for the first n (where n can be e.g. 1, 2, 3, 4 or 5) principal components as a function of maturity remains stable (e.g. does not change by more than e.g.
- T scores associated with each run can be extracted from the PLS model.
- the process can be repeated using an additional run of the bioprocess (i.e. including the 4 previous runs and a fifth run). This will result in new trajectories, average trajectories and standard deviations.
- the data may be considered to include "enough observations” to capture the variation that is present in the series of runs on which the model was calibrated (which may be e.g. common cause variation only if all runs did not include any special cause of variation, such as e.g. if all process conditions were maintained between the runs, or common and special cause variation if some of the runs included special cause variation).
- "enough observations” to capture the variation that is present in the series of runs on which the model was calibrated (which may be e.g. common cause variation only if all runs did not include any special cause of variation, such as e.g. if all process conditions were maintained between the runs, or common and special cause variation if some of the runs included special cause variation).
- special cause of variation such as e.g. if all process conditions were maintained between the runs, or common and special cause variation if some of the runs included special cause variation.
- the concept of a "golden batch” (which represents a normal batch) and an acceptable range of CQA (e.g. a "safe/ effective range”) may be used to define when the process has been sufficiently characterised (i.e. what convergence criteria to use). For example, different convergence criteria may be used depending on the range of value of critical quality attributes that characterize safe and effective product relative to the range of value considered to be within the "golden batch”. Where the range of value considered to be within the "golden batch” is narrow relative to the range of value for a safe and effective product, a few batches within the "golden batch” range may be sufficient to characterise the "golden batch".
- the data is processed by the parsing and preprocessing module 110.
- specific transfer rates are calculated by the material balance module 120, for one or more metabolites for which data is available.
- reaction rates are optionally calculated by the systems biology module 140, using the specific transfer rates from step 220.
- a metabolic condition model is calibrated by the multivariate analysis model 160. This may include in particular the following steps.
- a matrix of maturities for all runs i.e. the Y matrix
- Observation-wise unfolding comprises concatenating the series of maturity values for a first run, followed by the series of maturity values for a second run, etc.
- a matrix of cell metabolic condition variables for all runs may be obtained by stacking the rates determined at step 220 and/or the rates determined at step 260 "on top" of on another such that every column contains data about a particular rate and every row contains data about a maturity value.
- the X matrix would be of size 18 x 95. Additional optional columns may be added to the output of steps 220,260 in the X matrix. For example, variables that are calculated as a function of other reaction rates (such as e.g.
- Knowledge of the critical quality attributes of the product of the bioprocess may then be combined 280 with the information from the model, to define runs that are considered normal and/or to correlate measured or predicted CQAs with the metabolic condition information in the model (for example using the reaction rates and/or internal metabolites concentrations, alone or in combination with process conditions, as predictor variables of a PLS model to predict CQAs).
- the score values in T for those normal runs may then be used to define the normal evolution of internal metabolic conditions by defining an acceptable region (such as e.g. a ⁇ n standard deviation (SD) window, where n can be chosen as e.g. 1, 2, 3 or a value that results in a chosen confidence interval e.g.
- SD standard deviation
- FIG. 5 shows the scores t for the first and second principal components (respectively top and bottom panels) for five runs, as well as the average score over time and the ⁇ 3 standard deviations envelope around the average score.
- Other models may be used at step 260, such as e.g. a PCA (as part of a principal component regression, PCR) or (O)PLS model.
- PCA as part of a principal component regression, PCR
- OPLS model for example, such models could be used to define multivariate scores as a function of maturity, which scores could be used to monitor the evolution of a process.
- the matrix X may be subject to principal component analysis (PCA).
- PCA principal component analysis
- the vector Y vector of maturities
- PCR has the disadvantage that it creates the score space by looking for variation in X independently of Y.
- the PCA identifies the most process variables that vary the most in the data set, it does so by essentially treating the process variables at the plurality of maturities as replicates (losing the maturity information).
- PCA scores are not may not capture the aspects of the process variables that vary particularly as a function of time (although it will capture the variability in the process variables as a whole and as such is nonetheless informative).
- the PCA scores for one or more of the principal components thus obtained, for a set of batches considered to have run normally can be obtained, as a function of time, and used to define a "normal" trajectory (for each such principal component), and confidence envelope as already described.
- FIG. 3 illustrates schematically a bioprocess monitoring procedure, which uses a tool obtained by calibrating a model as described in relation to Figure 2 .
- data is obtained in relation to a run of a bioprocess to be monitored.
- the data includes biomass data 103A, metabolites data 103B and optional additional data 103C.
- the data is optionally processed by the parsing and preprocessing module 110.
- specific transfer rates are calculated by the material balance module 120, for one or more metabolites for which data is available.
- reaction rates are optionally calculated by the systems biology module 140, using the specific transfer rates from step 320.
- a pre-calibrated metabolic condition model is used to classify the metabolic condition of the bioprocess (optionally supplemented with information about the process conditions) between normal and "not normal” classes, by calculating the metabolic condition of the cells in the bioprocess and comparing this to the expected metabolic condition of the cells in a normal bioprocess.
- the model is a PLS model
- the previously calibrated loading weights P may be used to project the rates calculated at steps 320, 340 onto the one or more principal components that form the new space defined by P, in order to obtain the new variables T that capture the metabolic condition of the cells in the bioprocess.
- the previously calibrated loading weights P may be used to calculate scores T for the new run.
- Comparing the metabolic condition of the cells in the bioprocess to the expected metabolic condition of the cells in a normal bioprocess may comprise comparing one or more of the scores T obtained for the bioprocess with a confidence envelope (which can be e.g. a confidence interval or a standard deviation envelope, i.e. an envelope defined as the range of values between ⁇ n standard deviations of an average value - where n can be e.g. 1, 2 or 3, or any value that is equivalent to a p% confidence interval under a chosen statistical distribution, and n can be the same or different for the subrange above the average value and the subrange below the average value, i.e.
- a confidence envelope which can be e.g. a confidence interval or a standard deviation envelope, i.e. an envelope defined as the range of values between ⁇ n standard deviations of an average value - where n can be e.g. 1, 2 or 3, or any value that is equivalent to a p% confidence interval under a chosen statistical distribution, and n can be the same
- the metabolic condition of the cells in the bioprocess at a particular maturity value may be classified as "normal” if the T score for at least the first principal component falls within the standard deviation envelope, and "not normal” otherwise.
- the metabolic condition of the cells in the bioprocess at a particular maturity value may be classified as "normal” if the T score for at least the first and the second principal components (or the first, second and third, or any number of the principal components) fall within the respective confidence envelope, and "not normal” otherwise. Any number of principal components (up to the number of variables in the data) can be extracted, and any of these can in principle be monitored.
- the number of principal components to be extracted is determined by cross-validation where one or more additional principal components are extracted and/or monitored if this results in an increased cross-validation rate when predicting the values in Y from the values in X.
- a step 360B a fault may be identified if the metabolic condition of the cells in the bioprocess is classified as "not normal". The fault may be reported to a user in real time (i.e. as soon as it is identified at step 360A). In embodiments, the identification of a fault may cause a signal to be send to a user interface or to an effector device, in order for corrective action to be taken by an operator or automatically by the effector device.
- one or more critical quality attributes may be predicted based on the metabolic condition of the cells, for example using a pre-trained predictive model such as PLS. Steps 300 to 360A and optionally 360B and 360C may be repeated for every time point / maturity value at which data is acquired.
- An exemplary result is illustrated on Figure 6 , which shows the scores t for the first principal component for three normal runs, as well as the average score over time and the ⁇ 3 standard deviations envelope around the average score for the normal runs, and the scores for the first principal component for two runs in which a process condition change (temperature shift) that result in an out-of-specification product were deliberately included at day 7.
- the invention finds uses in monitoring bioprocesses to ensure that they remain within specification. This also enables for alarms to be raised for the process operators so that corrective action can be taken to bring the batch back in-specification or to end a batch early to avoid the waste of further resources.
- Metabolites in particular, glucose, glutamine and lactate concentrations
- cell density measurements for an unfed batch culture were simulated using the equations in Karra, Sager and Karim (Computer Aided Chemical Engineering, Vol. 29, 2011, Pages 1311-1315 ).
- the initial glucose concentration and model coefficients were adjusted to simulate fed batch behaviour in three different media.
- White noise was added to the simulated data with a 5% relative standard deviation for the cell density and 7% relative standard deviation for the metabolite concentrations in order to approximate the impact of measurement uncertainty using a Nova Flex Analyzer.
- the resulting simulated raw cell density measurements are shown in Figure 7A .
- the resulting simulated raw metabolite measurements are shown in
- a Cellca DG44 CHO cell line (Sartorius) expressing a monoclonal IgG1 antibody was used in this study. This cell line was selected because the process and the biologic it produces are proven industrially and have been well characterised.
- the inoculation train started with cryo vial thaw.
- the cryo vial contained 1 mL CHO suspension at a concentration of 30 million cells/mL.
- CHO suspension was transferred in a 15 mL Falcon TM tube (Sarstedt) with 10 ml pre-warmed (36.8 °C) seed medium. To remove all freezing medium, the suspension was centrifuged at 190 g for 3 minutes at room temperature (Centrifuge 3-30K, Sigma).
- the supernatant was decanted, and the pellet was re-suspended in 10 mL fresh pre-warmed seed medium.
- This suspension was transferred in a 500 mL Shake flask (Corning) filled with 150 mL pre-warmed seed medium.
- Suspension culture was shaken in an incubation shaker (CERTOMAT TM CT plus, Sartorius) at 120 rpm with a shaking amplitude of 50 mm, 36.8 °C and 7.5 % CO 2 atmosphere.
- the seed culture was passaged every 3-4 days until inoculation of the production culture (passage 9).
- SM seed medium
- PM basal medium for production
- FMA Feed Medium A
- FMB Feed Medium B
- All media were part of the commercially available XtraCHO media platform (Sartorius) and chemically defined. For all components powder were used which was liquefied with water and sterile filtered.
- Small-scale Bioreactors The highly parallel small-scale bioreactor system ambr TM 250 high throughput with up to 24 disposable cell culture bioreactor vessels were used (Sartorius). The bioreactors have two pitched-blade impellers and an open pipe sparger and the working volume can be in the range of 185 mL and 250 mL. Dissolved oxygen (DO), Temperature (T), pH and gassing are controlled independent for each bioreactor. Air, oxygen (O 2 ) and carbon dioxide (CO 2 ) were used for gassing, whereby CO 2 was also used for pH control. Process conditions are described in detail below.
- the bioreactor system was connected to a computer for performing the calculations needed to operate the bioreactor - which includes, among other things, a value for the liquid volume in the reactors throughout the culture after feed is added to the reactor or samples are drawn from the reactor.
- the bioreactor system was also connected to a monitor for displaying the current status of the bioreactor's operation.
- the supernatant was filtered through Minisart TM RC4 0.2 ⁇ m syringe filters (Sartorius) and stored in the freezer at -80 °C.
- Extracellular metabolites like the amino acids were analyzed via NMR using an external service provider (Eurofins Scientific).
- the resulting raw cell density measurements from the FLEX2 are shown in Figure 8A .
- the resulting raw metabolite measurements are shown in 9B-F from the FLEX2 (glucose, lactate and ammonia) and the external NMR analysis (glutamine and glutamate).
- Perfusion culture was performed according to a proprietary process.
- perfusion bioreactor s culture cells over long periods, which can extend into months, by continuously feeding the cells with fresh media and removing spent media while keeping cells in culture.
- the flowrate of fresh medium is typically one of the process conditions that is controlled and/or known (such as e.g. fixed or measured), as is the composition and physical characteristics (e.g. density) of the fresh media.
- the flowrate of spent medium is also typically controlled and/or known (such as e.g. fixed or measured).
- perfusion there are different ways to keep the cells in culture while removing spent media.
- One way is to keep the cells in the bioreactor by using capillary fibers or membranes, which the cells bind to. Another does not bind the cells, but rather relies on filtration systems that keep the cells in the bioreactor while allowing the media to be removed.
- Another method is the use of a centrifuge to separate cells and return them to the bioreactor.
- the primary purpose of the parsing and preprocessing module is to align the different measurements to a common set of maturities (time in all of the present examples).
- An optional part of the module is to smooth the data so that future calculations will be more accurate.
- An algorithm was employed here which accomplishes both goals in a single step. This was developed in house using Python 3.6. Any method for aligning the measurements to a common set of maturities could be used. These include, for example, linear interpolation, zero-order hold, etc.
- any smoothing algorithm may be applied, including for example a moving average, Savistsky-Golay, etc.
- the Savitsky-Golay algorithm uses the linear least squares method to fit successive sub-sets of adjacent data points with a low-degree polynomial. Where one or more functions are fitted to the data, such as e.g. using the Savistsky-Golay algorithm, missing values and smoothed values can be obtained from the fitted functions. This is the type of approach that was used in Examples 2-3 below.
- a generic upstream cell culture process grows cells to produce a product that results from the cells metabolic processes; a generic diagram of these processes is shown in Figure 1B .
- the concentration of the cells, also known as Viable Cell Density, in the reactor 2 is labeled VCD.
- the cells are grown in a reactor 2 of volume V.
- the media inside this vessel has density, ⁇ , and it is comprised of nutrients that are used by the cells to grow, and also metabolic byproducts that have been secreted into the media by the cells; the concentration of all these metabolites is labeled [Met] where Met can be glucose, lactate, etc.
- the diagram represents all three process types used in Examples 1-3.
- a feed stream 24 is used to supply additional media to the bioreactor.
- the mass (or volume) flow rate of material into the reactor is F F .
- the density of the feed media is labeled ⁇ F and the concentration of metabolites in the feed media is labeled [Met] F .
- a bleed stream 26 can be used to control the cell density inside the bioreactor by draining cell rich media from the bioreactor out of the culture while cell free media is being fed into the bioreactor.
- the bleed stream is characterised by the same three factors as the feed stream, which are subscripted here with a B instead of an F.
- a cell retention device 28 for example an alternating tangential flow filtration (ATF) system can be attached to the bioreactor.
- ATF alternating tangential flow filtration
- the auxiliary harvest stream brings cell rich media from the reactor to the cell retention device, the cell free media can then be removed in a harvest stream 28A that continuously removes product from the system for purification; an auxiliary return stream 28B then returns the leftover media and concentrated cells back to the bioreactor.
- the harvest stream is characterised by the same parameters as the bleed stream and are subscripted with the letter H.
- the two auxiliary streams (auxiliary harvest stream and auxiliary return stream) could also be characterised like all other streams, and corresponding terms added to the mass balance equations.
- only a harvest stream 28A was modeled as the material in this flow truly leaves the system (i.e. the harvest flow contains the part of the auxiliary harvest stream that leaves the system), whereas the material in the auxiliary return flow does not.
- Equation (8) Based on the system shown in Figure 1B , this takes the form of Equation (8) were qMet is the specific metabolite transport rate, assuming that the auxiliary streams can be ignored and that the harvest stream does not contain cells (i.e. that the retention device 28 is perfect). In this formulation, if qMet is negative, the metabolite is being consumed and if it is positive then it is being produced. Equation (8) can be expressed and solved for each of the types of cultures used in these examples, as explained below in relation to Examples 1-3.
- the chemical reaction stoichiometries, S define a system of equations that relate the internal metabolite concentrations, m, to the reaction rates (also known as fluxes), v, as shown in Equation (4).
- a mathematical description of the cell's objective, Z is used.
- the cell factory may strive to produce new DNA, maximize ATP generation, maximize biomass produced per unit of ATP, maximize protein production rate, etc.
- the macromolecular structure of DNA is comprised of intermediate building blocks that are created by the cell factory's assembly lines.
- ribose 5-phosphate needs to be created by the pentose phosphate pathway in order to construct the DNAs nucleotide structure.
- This provides the mathematical link between the phenotypic behavior of interest, such as DNA replication rate, and the internal metabolic condition of the cell that is being modeled, x, such as the ribose 5-phosphate production rate.
- This takes the form of an optimization problem like the one shown in Equation (3) where the coefficients ⁇ and ⁇ describe the linear and nonlinear impact of x on the cells objective, Z.
- metabolite uptake rate data is included in the models to define the quantity of raw materials available to the cell factory. For example, the rate of bringing glucose into the cell factory places an upper limit on the rate of creating ribose-5-phosphate, which in turn places an upper limit on the rate of creating new DNA.
- byproduct (or product) secretion rates data can be included in the models to define the quantity of raw materials that is lost and unable to be used for accomplishing the cells objective.
- the specific transport rates that have been determined by the materials balance module can be used to set constraints on the metabolic model.
- Constraints can be set on any internal reaction rates (e.g. based on heuristics or prior knowledge about the reactions), as well as any uptake / secretion rate. These constraints can be used to apply upper and lower boundaries to the fluxes as shown in Equation (5), i.e. for each of the i and j reactions where these boundaries are known, we can set: ⁇ i , lower bound i ⁇ v i ⁇ j , v j ⁇ upper bound j
- equation (3) may be solved, subject to the constraints in Equations (4) and (5) (or (5a), (5b)) to estimate the internal metabolic state of the cells.
- S was defined using the 94 reactions in the central carbon metabolism pathway map shown in Figure 14 , and a pseudo reaction for biomass (leading to a total of 95 reactions represented in S).
- v biomass is the rate of production of biomass according to a pseudo reaction that expresses the relationship between the metabolites assumed to be necessary for the production of biomass (e.g. metabolic precursors for DNA, proteins, etc., energy, water, etc.), the biomass produced and any by-products of the biomass production (e.g. in terms of mass fractions, ⁇ i , defining the relative amounts of metabolites involved in biomass production). Therefore, the optimization problem is that of finding the vector of fluxes v i , that result in the maximum value for the singular flux represented by the biomass pseudo reaction.
- Equation (3a) At every single time-point, we then solve Equation (3a), subject to the constraints in Equations (4) and (5c), in order to find all reaction rates, v, for the respective point in time.
- v For the first time point from one of the normal batches metabolite transport rates shown in Figure 13 , the resulting flux distribution is shown in Figure 15A .
- the 5 individual reaction rate used to constrain Equation (5c) are also labeled on the boundary of Figure 15A and their values are highlighted in Figure 15B .
- the optimization problem was implemented using the COBRA toolbox in MATLAB (Mathworks).
- the total amount of ATP generated by the cells can be calculated by summing up the reaction rates of all reactions that are producing ATP, such as the PGK and PYK reaction labeled on Figure 15A .
- different stoichiometric matrices S may be used at different time points when a metabolic network is constructed from different data (e.g. transcripts) at different time points.
- the optimization problem may be modified to reflect different objectives Z depending on the culture phase, such as e.g. maximizing biomass during growth phase and maximizing protein production during stationary phase.
- Partial Least Squares (PLS) regression was used to characterise the way that the reaction rates and ATP generated, collectively referred to as X, are varying with maturity (i.e. the batch age in this example), referred to as Y. Together, X and Y are referred to as the feature space.
- the variables in X are not independent of one another. For example, the four reactions in the middle of the glycolysis pathway where there is no branching must vary collinearly - increasing the reaction rate of one reaction necessarily increases the reaction rate of the remaining three due to the steady-state assumption in Equation (4a). Therefore, a set of linearly independent variables, called principal components are found, where the regression can be performed on these variables instead of the original variables.
- the loading weights, p i and q i define the relationship between the original feature space and the new score space for the X and Y data, respectively. It is referred to as the score space, because the value of each observation on the principal components is referred to as the scores.
- the X block scores are denoted by t i
- the Y block scores are denoted by u i .
- the loading weights, p i and q i are selected to maximize the covariance between the scores t i and u i so that the predictive power between X and Y is optimized in the linearly independent score space.
- the score values, T, for each principal component extracted can be used to define the normal evolution of internal metabolic states by defining an envelope of ⁇ n standard deviation (where n can take any chosen value such as e.g. 3) around the average score value for each point in time. Bioprocesses whose scores remain within these boundaries can be said to maintain the internal metabolic state similar enough to the historical bioprocesses that were known to produce valid product, and as such the new bioprocess can be assumed to produce a valid product (i.e. a product according to specification).
- Equation (1a) The loadings, p i , that were generated by the PLS model in the training step, Equation (1a) were used to calculate the scores, t i , for each observation from the new batches. These values were and overlaid on the control chart generated by the training step. Any deviations from the control limits can be notified to an engineer / plant operator. As such, from a single control chart, the operator is able to identify that the process is out of specification even if they have no understanding of the biological systems that are captured in those charts.
- the information from the model can be used to investigate the underlying causes of the deviations in the control charts.
- the loadings capture the effect of multiple original variables, each of which may be small, and hence enable to detect small deviations in many variables instead of needing to find a large deviation in just one variable.
- the loading weights can be used to determine the multivariate contribution of each variable (which in this example are the fluxes in the metabolic model, and the total ATP generated) to the difference in projections between the average observations of two batches (such as e.g. the normal batches -within specification- and the batches at very low temperature -outside of specification).
- Parsing and Preprocessing Module Simulated viable cell density, glucose concentration, lactate concentration and glutamine concentration data were obtained as explained above. This data is shown on Figure 7 . The data was generated for a common set of batch ages, and as such they can be merged immediately. Each simulated batch was given a unique ID (which in practice could be used e.g. to indicate which vessel it came from (1-1, 1-2, etc.). While not necessary, the media type for each batch was also appended to the data to allow for plotting the data in a meaningful way. The vessel / batch ID and media type are examples of metadata that can be appended to the data by the parsing and preprocessing module. The simulated raw viable cell densities shown on Figure 7A and simulated raw metabolite data shown on Figures 7B-D were each smoothed independently, producing the smoothed data shown on Figure 9 .
- Equation (8c) We assume that the amount of material removed from the bioreactors is negligible compared to the overall reactor volume. Therefore, the reactor volume is roughly constant and Equation (8c) can be solved for qMet as shown in Equation (9c) (first step). Equation (8c) can be solved for qMet as shown in Equation (9c), second step, by making a first order finite difference approximation.
- this function can be used to obtain the term d Met dt at maturity m, by obtaining the derivative of the function at maturity m (e.g. analytically).
- the function expressing the concentration of a metabolite ( y j ) is a polynomial (e.g.
- Multivariate Analysis Module the total ATP generated for the unfed batch processes (shown on Figure 17 ) and the 95 flux values from the metabolic model (from which the values in Figure 17 were derived) were obtained for each point in time through the systems biology module. These were used to construct the X and Y block of the PLS model as explained above in the same way as for the fed-batch process. The resulting multivariate control charts are shown in Figure 20 . In this experiment, there were no batches with deliberate deviations to detect changes in metabolic state, and as such no prediction step was implemented. Such a step would be accomplished in an analogous way as explained above for the fed-batch process.
- Parsing and Preprocessing Module The raw viable cell density, glucose concentration, lactate concentration, glutamine concentration, glutamate concentration and ammonia concentrations were saved in an excel file. Despite some of the metabolites being measured on the Flex2 and some being measured on an NMR, they were generated from the same sample so they could be merged into a single file immediately with the common batch age shown in Figure 8 . Each batch was given a unique ID to indicate which batch it came from (BR01, BR02, etc.). While not necessary, the DoE condition for each batch was also appended to the data to allow for plotting the data in a meaningful way. The batch ID and DOE conditions are examples of metadata that can be appended to the data by the parsing and preprocessing module.
- the raw viable cell densities shown on Figure 8A were smoothed as described above. The smoothed data for the viable cell density is shown on Figure 10 .
- the metabolites data was smoothed using an approach that takes into account the spike changes in concentration caused by feeds which are provided according to a bolus feed scheme (ex: the daily spikes after day 3 in the glucose concentration shown on Figure 8B ), where a large instantaneous addition of medium is used.
- a bolus feed scheme ex: the daily spikes after day 3 in the glucose concentration shown on Figure 8B
- the terms of the differential equation expressing the material balance were expressed using a pseudo metabolite concentration, [pMet], that allows the feed stream term to be eliminated.
- the measured reactor volumes are used to determine the change in concentration due to dilution that is caused by each feed. This value is then added to all measurements of the metabolite's concentration that come after that feed. This gives us the pseudo metabolite concentration, which is shown for Ammonia in Figure 11(d) .
- a smoothing algorithm as known in the art e.g. as used for the VCD
- the smoothing was applied in two steps, one for the data before the DOE conditions were implemented, and one for the data following the implementation of the DoE conditions.
- smoothing may be performed for the metabolites in a similar way as for the unfed batch and perfusion cultures.
- Equation (8d) can be solved for qMet as shown in Equation (9d), second step, by making a first order finite difference approximation.
- this function can be used to obtain the term d pMet dt at maturity m, by obtaining the derivative of the function at maturity m (e.g. analytically).
- Figure 16A shows the evolution of metabolite transport rates for one of the normal batches in Figure 13 .
- the evolution of the internal flux distribution is shown as an example for three time points: t 0 in the lag phase in Figure 16B , t 5 in the exponential growth phase in Figure 16C and t 27 in the stationary phase in Figure 16D .
- the evolution of the total amount of energy generated by the cells, represented by the total amount of ATP generated, throughout the batch is calculated from the evolution of flux distributions and is shown in Figure 16E .
- Figure 16F shows the total amount of ATP generated, calculated for all batches.
- Multivariate Analysis Module For the training step, a PLS model was fitted to the data as explained above, using the three fed batch processes operated at normal pH and temperature levels. This resulted in three principal components being extracted. These three new independent variables described 95.8% of the variability contained in the original 96 collinear variables in X and 91.4% of the variability in Y and 90% of the cross-validated variability in Y when predicting it from X. In other words, the principal components did a very good job of describing the flux data and the predictive power is high. Therefore, the score values on these three principal components could be used to define the normal evolution of the 95 reaction rates and total ATP generated during the normal operation of our fed-batch process.
- Parsing and Preprocessing Module The raw viable cell density, glucose concentration, lactate concentration, glutamine concentration, glutamate concentration and ammonia concentrations are saved in an excel file. As all of the measurements were generated on the Flex analyzer from the same sample so they can be merged into a single file immediately using the common batch age. Each batch was given a unique ID to indicate which batch it came from (7-18, 7-22, etc.). Due to the way that a perfusion process is operated, discontinuities in concentration data may result from step changes in the control strategy used to manipulate the flow of material in and out of the reactor. In order to deal with this, in this example the smoothing process was applied to the calculated metabolite transport rates themselves (calculated by the Material Balance Module) instead of the raw data that is used to calculate the transport rates.
- Equation (9a) we can create a first-order finite difference representation of the differential equation in Equation (8a') and solve the resulting algebraic equation for qMet at the m th timepoint as shown in Equation (9a).
- the numerical integral of the viable cell density used in equation (9a) was evaluated by applying the trapezoidal approximation to the raw cell densities.
- the metabolite concentrations and IVCDs, as well as their respective time points, have been measured or calculated.
- the feed flow rates were measured, and the reactor volume, media density and feed media composition were known. Therefore, the metabolite transport rates can be found directly from Equation (9a) for each time point. Then the procedure is repeated for all metabolites.
- the resulting metabolite transport rates were smoothed as explained above.
- Multivariate Analysis Module the total ATP generated for the perfusion processes and the 95 flux values from the metabolic model were obtained for each point in time through the systems biology module. These were used to construct the X and Y block of the PLS model as explained above in the same way as for the fed-batch process. In this experiment, there were no batches with deliberate deviations to detect changes in metabolic state, and as such no prediction step was implemented. Such a step would be accomplished in an analogous way as explained above for the fed-batch process.
- Example 2 the data from the Fed Batch Process (Example 2 above) was used to compare a solution according to the invention (as in Example 2) with an approach in which the metabolic condition is not used to monitor bioprocess evolution.
- the Y block data is the exact same maturity values used in the model in Example 2.
- Process Data Model No metabolic condition variables: The process data model used the 21 variables representing measurements during process operation as X block features (see multivariate analysis module explanation above). The first two principal components were found to characterise 56.3% of the variability in the process data and 98% of the variability in maturity with a Q 2 of 0.977.
- the Batch Evolution Model (BEM) control charts generated by the training step are shown in Figure 21A and the results of the prediction step are shown in Figure 21B for the first two principal components.
- Figure 21 shows that there is very good detection of the process deviations in this case. However, this is primarily because the temperature and pH levels have been included in the model, where these parameters are the primary reason for process deviation as explained above. Accordingly, the primary source of detecting these differences in the BEM stems directly from the temperature and pH measurements.
- a second model was built using 19 of the process data variables as X block features. In this case, the Temperature and pH levels are excluded. The first two principal components were found to characterise 61.7% of the variability in the process data and 97.9% of the variability in maturity with a Q 2 of 0.978.
- the BEM control charts generated by the training step are shown in Figure 22A and the results of the prediction step are shown in Figure 22B for the first two principal components. Detecting the process deviations is clearly worse here. On both principal components, more so the second, there are sustained deviations outside of the control limits between days 4-6 despite no process deviation occurring before day 7. In addition, only the extreme temperature shift, marked in blue, shows a consistent departure outside the control limits and only for the second principal component. Furthermore, the low temperature shift is largely indistinguishable from the normal batch on both principal components. Finally, the normal, low temperature and extreme low temperature batches all go in and out of the control limits on the first principal component.
- Transport Rate Data Model In this model, only the transport rate data (output from the material balance analysis module) was used, i.e. the transport rate data model uses the 5 transport rates as X block features. In this case, the first two principal components were found to characterise 98.7% of the variability in the transport rate data and 79.4% of the variability in maturity with a Q 2 of 0.782.
- the BEM control charts generated by the training step are shown in Figure 23A and the results of the prediction step are shown in Figure 23B for the first two principal components.
- there is a significant improvement in the model robustness At most only a single data point appears outside of the control limits before day 7 on either principal component (compared with several days in a row being outside of the control limits in Figure 22B ).
- the normal batch does not move outside of the control limits after day 7 like it did several times in Figure 22B .
- the extreme temperature shift appears outside of the control limits after day 7 (excluding the last 1.5 days on the second principal component).
- the low temperature batches appear slightly outside of the control limits for most of the stationary phase on the first principal component and briefly on the second principal component. However, even when it is not correctly detecting a deviation for the low temperature batch, the effect is still captured consistently in this model.
- the low temperature batch appears above the normal batch, even for the regions where it remains in the control limits (excluding the end of the batch on PC2); furthermore, the extreme low temperature batch appears above the low temperature batches (again excluding the end of the batch on PC2). Finally, the deviation is detected on the primary process driver (PC1) in the transport rate model instead of on the secondary process driver (PC2).
- Flux Data Model In this model, all 95 reaction rates in the metabolic model and the total ATP generated (output from the systems biology module module) were used, i.e. the flux data model uses the 96 internal flux rates as X block features. This is the same model as in Example 2. In this case, the first two principal components were found to characterize 94.4% of the variability in the transport rate data and 87.5% of the variability in maturity with a Q 2 of 0.872.
- the BEM control charts generated by the training step are shown in Figure 18 and the results of the prediction step are shown in Figure 19A and Figure 19E for the first two principal components. The interpretation is very similar to the transport rate model, except the results are improved.
- the data in this example demonstrates that there is a clear advantage of using the material balance module's output as inputs for the multivariate analysis module (compared to using the process data alone). There is a smaller advantage seen when using the systems biology module's output as inputs for the multivariate analysis module (compared to using the output from the material balance module directly).
- the performance of the process data model depends on the variables that are included in the model. As such, it is likely that the improvement between the models shown here would be less pronounced for an industrial process that had determined all critical process parameters and used a robust DoE to manipulate the CPPs when training the batch evolution model from process data alone.
- the use of the metabolic condition variables allows to obtain a model without requiring as much data as would be needed to obtain a similar model using process data alone.
- the use of the metabolic condition variables in the characterisation of the process enable to pursue scale-up and regulatory filings in parallel (as a product specification can be characterised in terms of metabolic condition instead of solely in terms of process condition), as well as adjustment of process parameters between scales without re-characterising the process, by ensuring that the internal state (metabolic condition) is maintained.
- a computer system includes the hardware, software and data storage devices for embodying a system or carrying out a method according to the above described embodiments.
- a computer system may comprise a central processing unit (CPU), input means, output means and data storage, which may be embodied as one or more connected computing devices.
- the computer system has a display or comprises a computing device that has a display to provide a visual output display (for example in the design of the business process).
- the data storage may comprise RAM, disk drives or other computer readable media.
- the computer system may include a plurality of computing devices connected by a network and able to communicate with each other over that network.
- the methods of the above embodiments may be provided as computer programs or as computer program products or computer readable media carrying a computer program which is arranged, when run on a computer, to perform the method(s) described above.
- computer readable media includes, without limitation, any non-transitory medium or media which can be read and accessed directly by a computer or computer system.
- the media can include, but are not limited to, magnetic storage media such as floppy discs, hard disc storage media and magnetic tape; optical storage media such as optical discs or CD-ROMs; electrical storage media such as memory, including RAM, ROM and flash memory; and hybrids and combinations of the above such as magnetic/optical storage media.
Landscapes
- Chemical & Material Sciences (AREA)
- Engineering & Computer Science (AREA)
- Life Sciences & Earth Sciences (AREA)
- Health & Medical Sciences (AREA)
- Bioinformatics & Cheminformatics (AREA)
- Zoology (AREA)
- Wood Science & Technology (AREA)
- Organic Chemistry (AREA)
- Analytical Chemistry (AREA)
- Biotechnology (AREA)
- General Health & Medical Sciences (AREA)
- Microbiology (AREA)
- Biochemistry (AREA)
- General Engineering & Computer Science (AREA)
- Sustainable Development (AREA)
- Genetics & Genomics (AREA)
- Biomedical Technology (AREA)
- Computer Hardware Design (AREA)
- Cell Biology (AREA)
- Physics & Mathematics (AREA)
- Medical Informatics (AREA)
- Public Health (AREA)
- Evolutionary Biology (AREA)
- Data Mining & Analysis (AREA)
- Databases & Information Systems (AREA)
- Epidemiology (AREA)
- Evolutionary Computation (AREA)
- Computer Vision & Pattern Recognition (AREA)
- Software Systems (AREA)
- Biophysics (AREA)
- Bioinformatics & Computational Biology (AREA)
- Bioethics (AREA)
- Spectroscopy & Molecular Physics (AREA)
- Theoretical Computer Science (AREA)
- Artificial Intelligence (AREA)
- Apparatus Associated With Microorganisms And Enzymes (AREA)
Claims (15)
- Computerimplementiertes Verfahren zur Überwachung eines Bioprozesses, der eine Zellkultur in einem Bioreaktor umfasst, wobei das Verfahren die folgenden Schritte umfasst:Erhalten von Messwerten der Menge an Biomasse und der Menge eines oder mehrerer Metaboliten im Bioreaktor als Funktion der Bioprozessreife;Bestimmen einer oder mehrerer Stoffwechselzustandsvariablen, ausgewählt aus: den spezifischen Transportraten zwischen den Zellen und einem Kulturmedium im Bioreaktor für einige oder alle des einen oder der mehreren Metaboliten als Funktion der Bioprozessreife, der internen Konzentration eines oder mehrerer Metaboliten als Funktion der Bioprozessreife und Reaktionsraten für eine oder mehrere Stoffwechselreaktionen, die Teil des Stoffwechsels der Zelle sind, als Funktion der Bioprozessreife;Verwenden eines vortrainierten multivariaten Modells, um den Wert einer oder mehrerer latenter Variablen als Funktion der Bioprozessreife zu bestimmen, wobei das multivariate Modell ein lineares Modell ist, das Prozessvariablen einschließlich der Stoffwechselzustandsvariablen als Prädiktorvariablen verwendet;Vergleichen des Werts/der Werte der einen oder mehreren latenten Variablen mit einem oder mehreren vorgegebenen Werten als Funktion der Reife; undBestimmen, auf der Grundlage des Vergleichs, ob der Bioprozess normal abläuft.
- Verfahren nach Anspruch 1, wobei das Bestimmen einer oder mehrerer Stoffwechselzustandsvariablen das Bestimmen der spezifischen Transportrate des einen oder der mehreren Metaboliten zwischen den Zellen und dem Kulturmedium umfasst, wobei die spezifische Transportrate eines Metaboliten i die Menge des zwischen den Zellen und dem Kulturmedium transportierten Metaboliten pro Zelle und pro Reifeeinheit ist, wobei optional die spezifische Transportrate eines Metaboliten i bei einer bestimmten Reife m unter Verwendung der Gleichung (7) bestimmt wird:

- Verfahren nach Anspruch 2, wobei die spezifische Transportrate eines Metaboliten eine spezifische Verbrauchsrate oder eine spezifische Produktionsrate ist.
- Verfahren nach einem der vorstehenden Ansprüche, wobei die Messwerte der Menge an Biomasse in dem Bioreaktor Messwerte der Dichte lebensfähiger Zellen umfassen, und/oder wobei Messwerte der Menge eines oder mehrerer Metaboliten in dem Bioreaktor Messwerte der Menge oder Konzentration eines oder mehrerer Metaboliten in dem Zellkompartiment, in dem Kulturmediumkompartiment oder in der Zellkultur als Ganzes umfassen.
- Verfahren nach einem der vorstehenden Ansprüche, wobei das Bestimmen einer oder mehrerer Stoffwechselzustandsvariablen das Bestimmen von Reaktionsraten für eine oder mehrere Stoffwechselreaktionen, die Teil des Stoffwechsels der Zellen in der Kultur sind, als Funktion der Bioprozessreife umfasst, wobei optional die Reaktionsraten für die eine oder mehreren Stoffwechselreaktionen zumindest teilweise unter Verwendung der spezifischen Transportrate des einen oder der mehreren Metaboliten zwischen den Zellen und einem Kulturmedium in dem Bioreaktor als Funktion der Bioprozessreife bestimmt werden.
- Verfahren nach Anspruch 5, wobei das Bestimmen der Reaktionsraten für eine oder mehrere Stoffwechselreaktionen das Erhalten eines Stoffwechselmodells, das diese Reaktionen umfasst, und das Lösen des Stoffwechselmodells unter Verwendung mindestens der spezifischen Transportrate des einen oder der mehreren Metaboliten als Nebenbedingungen des Stoffwechselmodells umfasst.
- Verfahren nach Anspruch 6, wobei ein Stoffwechselmodell eine stöchiometrische Matrix S und einen Satz von Reaktionsraten v umfasst und das Lösen des Stoffwechselmodells das Bestimmen der Reaktionsraten v umfasst, die Folgendes erfüllen:


- Verfahren nach Anspruch 6 oder Anspruch 7, wobei das Verwenden der spezifischen Transportrate des einen oder der mehreren Metaboliten als Nebenbedingungen des Stoffwechselmodells das Spezifizieren eines zulässigen Wertebereichs für mindestens eine der Stoffwechselreaktionsraten als Funktion mindestens einer der spezifischen Transportraten umfasst, wobei optional die Verwendung der spezifischen Transportrate eines Metaboliten i als Nebenbedingung des Stoffwechselmodells das Spezifizieren umfasst:

- Verfahren nach einem der vorstehenden Ansprüche, wobei das Bestimmen oder Messen einer beliebigen Variablen als Funktion der Reife das Bestimmen oder Messen der Variablen als Funktion der Zeit umfasst.
- Verfahren nach einem der vorstehenden Ansprüche, wobei das multivariate Modell ein lineares Modell ist, das Prozessvariablen einschließlich der Stoffwechselzustandsvariablen als Prädiktorvariablen und Reife als Reaktionsvariable verwendet, und/oder wobei das multivariate Modell unter Verwendung von Daten aus einer Vielzahl von ähnlichen Bioprozessen, von denen angenommen wird, dass sie normal ablaufen, vortrainiert wurde, wobei ein ähnlicher Bioprozess ein solcher ist, der die gleichen Zellen für den gleichen Zweck verwendet, wobei optional das multivariate Modell unter Verwendung von Daten aus einer Vielzahl von ähnlichen Bioprozessen vortrainiert wurde, bei denen sich mindestens einige der Bioprozesse durch eine oder mehrere Prozessbedingungen als Funktion der Reife voneinander unterscheiden.
- Verfahren nach Anspruch 10,
wobei das Verfahren ferner das Vorhersagen der Auswirkung einer Änderung einer oder mehrerer Prozessbedingungen des Bioprozesses auf die eine oder mehreren latenten Variablen und/oder die eine oder mehreren Stoffwechselzustandsvariablen umfasst. - Verfahren nach Anspruch 10 oder Anspruch 11, wobei mindestens einige der Vielzahl von Durchläufen, die zum Trainieren des multivariaten Modells verwendet werden, einem oder mehreren kritischen Qualitätsattributen (CQA) zugeordnet sind, und wobei das Verfahren ferner die Verwendung der Werte von einer oder mehreren Prozessvariablen, die eine oder mehrere Stoffwechselzustandsvariablen enthalten, und eines Modells umfasst, das unter Verwendung der Werte der einen oder mehreren Stoffwechselzustandsvariablen für die Vielzahl von Trainingsdurchläufen und der entsprechenden CQAs trainiert wurde, um einen oder mehrere CQAs des Bioprozesses vorherzusagen.
- Verfahren nach einem der vorstehenden Ansprüche, das ferner einen oder mehrere der folgenden Schritte umfasst:Zusammenführen mehrerer Messwerte und/oder Stoffwechselzustandsvariablen zu einer einzigen Tabelle, wobei die Messwerte/Variablen nach Reife geordnet sind;Subsampling oder Gruppieren zumindest einiger der Messwerte und/oder Stoffwechselzustandsvariablen; undGlätten und optional Supersampling zumindest eines Teils der Messwerte und/oder Stoffwechselzustandsvariablen.
- Verfahren der Bereitstellung eines Tools zur Überwachung eines Bioprozesses, der eine Zellkultur in einem Bioreaktor umfasst, wobei das Verfahren die folgenden Schritte umfasst:Erhalten von Messwerten der Menge an Biomasse und der Menge eines oder mehrerer Metaboliten im Bioreaktor bei einer Vielzahl von der Bioprozessreifen für eine Vielzahl von Bioprozessen, von denen angenommen wird, dass sie normal ablaufen;Bestimmen einer oder mehrerer Stoffwechselzustandsvariablen, ausgewählt aus: den spezifischen Transportraten zwischen den Zellen und einem Kulturmedium im Bioreaktor für den einen oder die mehreren Metaboliten bei einer Vielzahl von Bioprozessreifen, der internen Konzentration eines oder mehrerer Metaboliten bei einer Vielzahl von Bioprozessreifen und Reaktionsraten für eine oder mehrere Stoffwechselreaktionen, die Teil des Stoffwechsels der Zellen in der Kultur bei der Vielzahl von Bioprozessreifen sind, für jeden der Bioprozesse;gemeinsames Verwenden der spezifischen Transportraten und/oder Reaktionsraten aus der Vielzahl von Bioprozessen bei der Vielzahl von Bioprozessreifen, um ein multivariates Modell zu trainieren, um den Wert einer oder mehrerer latenter Variablen als Funktion der Bioprozessreife zu bestimmen, wobei das multivariate Modell ein lineares Modell ist, das Prozessvariablen einschließlich der Stoffwechselzustandsvariablen als Prädiktorvariablen verwendet;Definieren eines oder mehrerer Werte der einen oder mehreren latenten Variablen als Funktion der Reife, die die Bioprozesse charakterisieren, von denen angenommen wird, dass sie normal ablaufen, wobei optional der eine oder die mehreren Werte den Durchschnitt einer oder mehrerer latenter Variablen als Funktion der Reife und/oder eines oder mehrerer Bereiche, die als Funktion der Standardabweichung um den Durchschnitt einer jeweiligen latenten Variablen als Funktion der Reife definiert sind, beinhalten; wobei optional das Verfahren eines der Merkmale der Ansprüche 2 bis 13 umfasst.
- System zum Überwachen und/oder Steuern eines Bioprozesses, wobei das System Folgendes umfasst:zumindest einen Prozessor; undzumindest ein nichtflüchtiges, computerlesbares Medium, das Befehle enthält, die bei Ausführung durch den zumindest einen Prozessor den zumindest einen Prozessor veranlassen, das Verfahren nach einem der Ansprüche 1 bis 14 durchzuführen;wobei das System optional ferner in funktionsfähiger Verbindung mit dem Prozessor eines oder mehrere der folgenden Elemente umfasst:eine Benutzerschnittstelle, wobei die Befehle den Prozessor ferner dazu veranlassen, der Benutzerschnittstelle zur Ausgabe an einen Benutzer eines oder mehrere der folgenden Elemente bereitzustellen: den Wert der einen oder mehreren latenten Variablen als Funktion der Bioprozessreife, den einen oder die mehreren vorbestimmten Werte als Funktion der Reife, das Ergebnis des Vergleichsschritts und ein Signal, das anzeigt, dass bestimmt wurde, dass der Bioprozess normal abläuft oder nicht normal abläuft;einen oder mehrere Biomassesensor(en);einen oder mehrere Metabolitsensor(en),einen oder mehrere Prozesszustandssensoren; undeine oder mehrere Effektorvorrichtung(en).
Priority Applications (4)
| Application Number | Priority Date | Filing Date | Title |
|---|---|---|---|
| EP20199899.4A EP3979010B1 (de) | 2020-10-02 | 2020-10-02 | Überwachung und steuerung von bioprozessen |
| US18/027,045 US20230323275A1 (en) | 2020-10-02 | 2021-09-09 | Monitoring and control of bioprocesses |
| CN202180068095.9A CN116261691B (zh) | 2020-10-02 | 2021-09-09 | 生物过程的监测和控制 |
| PCT/EP2021/074866 WO2022069180A1 (en) | 2020-10-02 | 2021-09-09 | Monitoring and control of bioprocesses |
Applications Claiming Priority (1)
| Application Number | Priority Date | Filing Date | Title |
|---|---|---|---|
| EP20199899.4A EP3979010B1 (de) | 2020-10-02 | 2020-10-02 | Überwachung und steuerung von bioprozessen |
Publications (2)
| Publication Number | Publication Date |
|---|---|
| EP3979010A1 EP3979010A1 (de) | 2022-04-06 |
| EP3979010B1 true EP3979010B1 (de) | 2023-07-12 |
Family
ID=72744680
Family Applications (1)
| Application Number | Title | Priority Date | Filing Date |
|---|---|---|---|
| EP20199899.4A Active EP3979010B1 (de) | 2020-10-02 | 2020-10-02 | Überwachung und steuerung von bioprozessen |
Country Status (4)
| Country | Link |
|---|---|
| US (1) | US20230323275A1 (de) |
| EP (1) | EP3979010B1 (de) |
| CN (1) | CN116261691B (de) |
| WO (1) | WO2022069180A1 (de) |
Families Citing this family (7)
| Publication number | Priority date | Publication date | Assignee | Title |
|---|---|---|---|---|
| US12100484B2 (en) | 2021-11-01 | 2024-09-24 | Matterworks Inc | Methods and compositions for analyte quantification |
| US20230137741A1 (en) | 2021-11-01 | 2023-05-04 | Matterworks Inc | Methods and compositions for analyte quantification |
| EP4289927A1 (de) * | 2022-06-10 | 2023-12-13 | Sartorius Stedim Data Analytics AB | Steuerung von perfusionsfluss-bioprozessen |
| NL2033094B1 (en) * | 2022-09-21 | 2024-03-26 | Simabs Nv | Method for controlling a perfusion process in a bioreactor |
| CN117837434A (zh) * | 2024-01-09 | 2024-04-09 | 山东农业大学 | 一种检测鹿茸菇菌丝体成熟度的方法 |
| CN118207306B (zh) * | 2024-05-21 | 2024-07-19 | 成都徕伯益科技有限公司 | 一种pcr检测方法 |
| CN118497285B (zh) * | 2024-07-17 | 2024-11-15 | 江西科技师范大学 | 红曲霉的发酵工艺优化方法、装置及红曲霉发酵方法 |
Citations (3)
| Publication number | Priority date | Publication date | Assignee | Title |
|---|---|---|---|---|
| EP3291038A1 (de) | 2016-08-31 | 2018-03-07 | Sartorius Stedim Biotech GmbH | Steuerung und überwachung eines prozesses zur herstellung eines chemischen, pharmazeutischen oder biotechnologischen produkts |
| WO2019129891A1 (de) | 2017-12-29 | 2019-07-04 | F. Hoffmann-La Roche Ag | Vorhersage des metabolischen zustands einer zellkultur |
| WO2020120232A1 (en) | 2018-12-13 | 2020-06-18 | Ge Healthcare Bio-Sciences Ab | Method for control of a bioprocess |
Family Cites Families (5)
| Publication number | Priority date | Publication date | Assignee | Title |
|---|---|---|---|---|
| GB201213506D0 (en) | 2012-07-30 | 2012-09-12 | Tap Biosystems Phc Ltd | Bioreactor vessels and associated bioreactor systems |
| GB2515751A (en) | 2013-07-01 | 2015-01-07 | Tap Biosystems Phc Ltd | Bioreactor consumable units |
| CN103440435B (zh) * | 2013-08-19 | 2016-05-11 | 天津师范大学 | 预测影响特定代谢产物产量关键反应的通量域比较方法 |
| CN106770857A (zh) * | 2016-12-13 | 2017-05-31 | 南京医科大学 | 一种基于代谢组学的动物模型抑郁程度评价的实验方法 |
| CN111210867B (zh) * | 2020-02-10 | 2023-07-14 | 江南大学 | 基于代谢分析及酶调控的微生物生长状态估计方法 |
-
2020
- 2020-10-02 EP EP20199899.4A patent/EP3979010B1/de active Active
-
2021
- 2021-09-09 US US18/027,045 patent/US20230323275A1/en active Pending
- 2021-09-09 WO PCT/EP2021/074866 patent/WO2022069180A1/en not_active Ceased
- 2021-09-09 CN CN202180068095.9A patent/CN116261691B/zh active Active
Patent Citations (4)
| Publication number | Priority date | Publication date | Assignee | Title |
|---|---|---|---|---|
| EP3291038A1 (de) | 2016-08-31 | 2018-03-07 | Sartorius Stedim Biotech GmbH | Steuerung und überwachung eines prozesses zur herstellung eines chemischen, pharmazeutischen oder biotechnologischen produkts |
| WO2019129891A1 (de) | 2017-12-29 | 2019-07-04 | F. Hoffmann-La Roche Ag | Vorhersage des metabolischen zustands einer zellkultur |
| US20200377844A1 (en) | 2017-12-29 | 2020-12-03 | Hoffmann-La Roche Inc. | Predicting the metabolic condition of a cell culture |
| WO2020120232A1 (en) | 2018-12-13 | 2020-06-18 | Ge Healthcare Bio-Sciences Ab | Method for control of a bioprocess |
Non-Patent Citations (2)
| Title |
|---|
| GAO JINXIN, ADAMEC-E: "Multivariate analysis of cell culture bioprocess data", AMERICAN PHARMACEUTICAL REVIEW, vol. 23, no. 3, pages 78 - 81, XP055786057 |
| MESQUITA THIAGO JOSÉ, SARGO CÍNTIA REGINA, FUZER JOSÉ ROBERTO, PAREDES SHEYLA ALEXANDRA HIDALGO, GIORDANO ROBERTO DE CAMPOS, HORTA: "Metabolic fluxes-oriented control of bioreactors: a novel approach to tune micro-aeration and substrate feeding in fermentations", MICROBIAL CELL FACTORIES, SPRINGER, vol. 18, no. 1, 1 December 2019 (2019-12-01), XP093187105, ISSN: 1475-2859, DOI: 10.1186/s12934-019-1198-6 |
Also Published As
| Publication number | Publication date |
|---|---|
| CN116261691B (zh) | 2024-04-09 |
| WO2022069180A1 (en) | 2022-04-07 |
| CN116261691A (zh) | 2023-06-13 |
| EP3979010A1 (de) | 2022-04-06 |
| US20230323275A1 (en) | 2023-10-12 |
Similar Documents
| Publication | Publication Date | Title |
|---|---|---|
| EP3979010B1 (de) | Überwachung und steuerung von bioprozessen | |
| US20240304284A1 (en) | Monitoring, simulation and control of bioprocesses | |
| CN115427898B (zh) | 生物过程的监测、模拟、以及控制 | |
| Luo et al. | Bioprocess systems analysis, modeling, estimation, and control | |
| US20250068794A1 (en) | Method for Predicting Outcome of an Modelling of a Process in a Bioreactor | |
| JP2021508872A (ja) | 細胞培養物の代謝状態の予測 | |
| Gunther et al. | Process monitoring and quality variable prediction utilizing PLS in industrial fed-batch cell culture | |
| EP3525053B1 (de) | Skalierungswerkzeug | |
| Mu'azzam et al. | A roadmap for model-based bioprocess development | |
| Sinner et al. | Usage of digital twins along a typical process development cycle | |
| CN106462656A (zh) | 制备合成多成分生物技术和化学过程样品的方法和系统 | |
| Borgosz et al. | Industrial internet of things: What does it mean for the bioprocess industries? | |
| US20210257045A1 (en) | Method for verifying cultivation device performance | |
| Ding et al. | Towards digital twin for biopharmaceutical processes: concept and progress | |
| González-Martínez et al. | Metabolic flux understanding of Pichia pastoris grown on heterogenous culture media | |
| Whitford | Bioprocess intensification: technologies and goals | |
| US20230077294A1 (en) | Monitoring, simulation and control of bioprocesses | |
| Craven et al. | Process analytical technology and quality-by-design for animal cell culture | |
| Hebing et al. | Efficient generation of models of fed-batch fermentations for process design and control | |
| Ghodba et al. | A robust batch-to-batch optimization framework for pharmaceutical applications | |
| Narayanan et al. | Consistent value creation from bioprocess data with customized algorithms: Opportunities beyond multivariate analysis | |
| Loebenstein | Soft-sensor development for real-time state estimation as an enabler for robust processing with Escherichia coli | |
| Barza et al. | and growth in automated | |
| Reyes et al. | A recurrent neural network for soft sensor development using CHO stable pools in fed‐batch process for SARS‐CoV‐2 spike protein production as a vaccine antigen | |
| Schmidt et al. | Special Topics |
Legal Events
| Date | Code | Title | Description |
|---|---|---|---|
| PUAI | Public reference made under article 153(3) epc to a published international application that has entered the european phase |
Free format text: ORIGINAL CODE: 0009012 |
|
| STAA | Information on the status of an ep patent application or granted ep patent |
Free format text: STATUS: THE APPLICATION HAS BEEN PUBLISHED |
|
| AK | Designated contracting states |
Kind code of ref document: A1 Designated state(s): AL AT BE BG CH CY CZ DE DK EE ES FI FR GB GR HR HU IE IS IT LI LT LU LV MC MK MT NL NO PL PT RO RS SE SI SK SM TR |
|
| STAA | Information on the status of an ep patent application or granted ep patent |
Free format text: STATUS: REQUEST FOR EXAMINATION WAS MADE |
|
| 17P | Request for examination filed |
Effective date: 20221005 |
|
| RBV | Designated contracting states (corrected) |
Designated state(s): AL AT BE BG CH CY CZ DE DK EE ES FI FR GB GR HR HU IE IS IT LI LT LU LV MC MK MT NL NO PL PT RO RS SE SI SK SM TR |
|
| REG | Reference to a national code |
Ref country code: DE Ref legal event code: R079 Free format text: PREVIOUS MAIN CLASS: G05B0013040000 Ref country code: DE Ref legal event code: R079 Ref document number: 602020013583 Country of ref document: DE Free format text: PREVIOUS MAIN CLASS: G05B0013040000 Ipc: G16B0040000000 |
|
| RIC1 | Information provided on ipc code assigned before grant |
Ipc: C12M 1/34 20060101ALI20221221BHEP Ipc: C12M 1/38 20060101ALI20221221BHEP Ipc: C12M 1/36 20060101ALI20221221BHEP Ipc: G16B 40/00 20190101AFI20221221BHEP |
|
| GRAP | Despatch of communication of intention to grant a patent |
Free format text: ORIGINAL CODE: EPIDOSNIGR1 |
|
| STAA | Information on the status of an ep patent application or granted ep patent |
Free format text: STATUS: GRANT OF PATENT IS INTENDED |
|
| INTG | Intention to grant announced |
Effective date: 20230307 |
|
| GRAS | Grant fee paid |
Free format text: ORIGINAL CODE: EPIDOSNIGR3 |
|
| GRAA | (expected) grant |
Free format text: ORIGINAL CODE: 0009210 |
|
| STAA | Information on the status of an ep patent application or granted ep patent |
Free format text: STATUS: THE PATENT HAS BEEN GRANTED |
|
| P01 | Opt-out of the competence of the unified patent court (upc) registered |
Effective date: 20230526 |
|
| AK | Designated contracting states |
Kind code of ref document: B1 Designated state(s): AL AT BE BG CH CY CZ DE DK EE ES FI FR GB GR HR HU IE IS IT LI LT LU LV MC MK MT NL NO PL PT RO RS SE SI SK SM TR |
|
| REG | Reference to a national code |
Ref country code: CH Ref legal event code: EP |
|
| REG | Reference to a national code |
Ref country code: DE Ref legal event code: R096 Ref document number: 602020013583 Country of ref document: DE |
|
| REG | Reference to a national code |
Ref country code: IE Ref legal event code: FG4D |
|
| REG | Reference to a national code |
Ref country code: LT Ref legal event code: MG9D |
|
| REG | Reference to a national code |
Ref country code: NL Ref legal event code: MP Effective date: 20230712 |
|
| REG | Reference to a national code |
Ref country code: AT Ref legal event code: MK05 Ref document number: 1588003 Country of ref document: AT Kind code of ref document: T Effective date: 20230712 |
|
| PG25 | Lapsed in a contracting state [announced via postgrant information from national office to epo] |
Ref country code: NL Free format text: LAPSE BECAUSE OF FAILURE TO SUBMIT A TRANSLATION OF THE DESCRIPTION OR TO PAY THE FEE WITHIN THE PRESCRIBED TIME-LIMIT Effective date: 20230712 |
|
| PG25 | Lapsed in a contracting state [announced via postgrant information from national office to epo] |
Ref country code: GR Free format text: LAPSE BECAUSE OF FAILURE TO SUBMIT A TRANSLATION OF THE DESCRIPTION OR TO PAY THE FEE WITHIN THE PRESCRIBED TIME-LIMIT Effective date: 20231013 |
|
| PG25 | Lapsed in a contracting state [announced via postgrant information from national office to epo] |
Ref country code: ES Free format text: LAPSE BECAUSE OF FAILURE TO SUBMIT A TRANSLATION OF THE DESCRIPTION OR TO PAY THE FEE WITHIN THE PRESCRIBED TIME-LIMIT Effective date: 20230712 |
|
| PG25 | Lapsed in a contracting state [announced via postgrant information from national office to epo] |
Ref country code: IS Free format text: LAPSE BECAUSE OF FAILURE TO SUBMIT A TRANSLATION OF THE DESCRIPTION OR TO PAY THE FEE WITHIN THE PRESCRIBED TIME-LIMIT Effective date: 20231112 |
|
| PG25 | Lapsed in a contracting state [announced via postgrant information from national office to epo] |
Ref country code: SE Free format text: LAPSE BECAUSE OF FAILURE TO SUBMIT A TRANSLATION OF THE DESCRIPTION OR TO PAY THE FEE WITHIN THE PRESCRIBED TIME-LIMIT Effective date: 20230712 Ref country code: RS Free format text: LAPSE BECAUSE OF FAILURE TO SUBMIT A TRANSLATION OF THE DESCRIPTION OR TO PAY THE FEE WITHIN THE PRESCRIBED TIME-LIMIT Effective date: 20230712 Ref country code: PT Free format text: LAPSE BECAUSE OF FAILURE TO SUBMIT A TRANSLATION OF THE DESCRIPTION OR TO PAY THE FEE WITHIN THE PRESCRIBED TIME-LIMIT Effective date: 20231113 Ref country code: NO Free format text: LAPSE BECAUSE OF FAILURE TO SUBMIT A TRANSLATION OF THE DESCRIPTION OR TO PAY THE FEE WITHIN THE PRESCRIBED TIME-LIMIT Effective date: 20231012 Ref country code: LV Free format text: LAPSE BECAUSE OF FAILURE TO SUBMIT A TRANSLATION OF THE DESCRIPTION OR TO PAY THE FEE WITHIN THE PRESCRIBED TIME-LIMIT Effective date: 20230712 Ref country code: LT Free format text: LAPSE BECAUSE OF FAILURE TO SUBMIT A TRANSLATION OF THE DESCRIPTION OR TO PAY THE FEE WITHIN THE PRESCRIBED TIME-LIMIT Effective date: 20230712 Ref country code: IS Free format text: LAPSE BECAUSE OF FAILURE TO SUBMIT A TRANSLATION OF THE DESCRIPTION OR TO PAY THE FEE WITHIN THE PRESCRIBED TIME-LIMIT Effective date: 20231112 Ref country code: HR Free format text: LAPSE BECAUSE OF FAILURE TO SUBMIT A TRANSLATION OF THE DESCRIPTION OR TO PAY THE FEE WITHIN THE PRESCRIBED TIME-LIMIT Effective date: 20230712 Ref country code: GR Free format text: LAPSE BECAUSE OF FAILURE TO SUBMIT A TRANSLATION OF THE DESCRIPTION OR TO PAY THE FEE WITHIN THE PRESCRIBED TIME-LIMIT Effective date: 20231013 Ref country code: FI Free format text: LAPSE BECAUSE OF FAILURE TO SUBMIT A TRANSLATION OF THE DESCRIPTION OR TO PAY THE FEE WITHIN THE PRESCRIBED TIME-LIMIT Effective date: 20230712 Ref country code: ES Free format text: LAPSE BECAUSE OF FAILURE TO SUBMIT A TRANSLATION OF THE DESCRIPTION OR TO PAY THE FEE WITHIN THE PRESCRIBED TIME-LIMIT Effective date: 20230712 Ref country code: AT Free format text: LAPSE BECAUSE OF FAILURE TO SUBMIT A TRANSLATION OF THE DESCRIPTION OR TO PAY THE FEE WITHIN THE PRESCRIBED TIME-LIMIT Effective date: 20230712 |
|
| PG25 | Lapsed in a contracting state [announced via postgrant information from national office to epo] |
Ref country code: PL Free format text: LAPSE BECAUSE OF FAILURE TO SUBMIT A TRANSLATION OF THE DESCRIPTION OR TO PAY THE FEE WITHIN THE PRESCRIBED TIME-LIMIT Effective date: 20230712 |
|
| REG | Reference to a national code |
Ref country code: DE Ref legal event code: R026 Ref document number: 602020013583 Country of ref document: DE |
|
| PLBI | Opposition filed |
Free format text: ORIGINAL CODE: 0009260 |
|
| PLAX | Notice of opposition and request to file observation + time limit sent |
Free format text: ORIGINAL CODE: EPIDOSNOBS2 |
|
| PG25 | Lapsed in a contracting state [announced via postgrant information from national office to epo] |
Ref country code: SM Free format text: LAPSE BECAUSE OF FAILURE TO SUBMIT A TRANSLATION OF THE DESCRIPTION OR TO PAY THE FEE WITHIN THE PRESCRIBED TIME-LIMIT Effective date: 20230712 Ref country code: RO Free format text: LAPSE BECAUSE OF FAILURE TO SUBMIT A TRANSLATION OF THE DESCRIPTION OR TO PAY THE FEE WITHIN THE PRESCRIBED TIME-LIMIT Effective date: 20230712 Ref country code: EE Free format text: LAPSE BECAUSE OF FAILURE TO SUBMIT A TRANSLATION OF THE DESCRIPTION OR TO PAY THE FEE WITHIN THE PRESCRIBED TIME-LIMIT Effective date: 20230712 Ref country code: DK Free format text: LAPSE BECAUSE OF FAILURE TO SUBMIT A TRANSLATION OF THE DESCRIPTION OR TO PAY THE FEE WITHIN THE PRESCRIBED TIME-LIMIT Effective date: 20230712 Ref country code: CZ Free format text: LAPSE BECAUSE OF FAILURE TO SUBMIT A TRANSLATION OF THE DESCRIPTION OR TO PAY THE FEE WITHIN THE PRESCRIBED TIME-LIMIT Effective date: 20230712 Ref country code: SK Free format text: LAPSE BECAUSE OF FAILURE TO SUBMIT A TRANSLATION OF THE DESCRIPTION OR TO PAY THE FEE WITHIN THE PRESCRIBED TIME-LIMIT Effective date: 20230712 |
|
| 26 | Opposition filed |
Opponent name: GEA PROCESS ENGINEERING A/S Effective date: 20240412 |
|
| PG25 | Lapsed in a contracting state [announced via postgrant information from national office to epo] |
Ref country code: IT Free format text: LAPSE BECAUSE OF FAILURE TO SUBMIT A TRANSLATION OF THE DESCRIPTION OR TO PAY THE FEE WITHIN THE PRESCRIBED TIME-LIMIT Effective date: 20230712 Ref country code: MC Free format text: LAPSE BECAUSE OF FAILURE TO SUBMIT A TRANSLATION OF THE DESCRIPTION OR TO PAY THE FEE WITHIN THE PRESCRIBED TIME-LIMIT Effective date: 20230712 |
|
| REG | Reference to a national code |
Ref country code: CH Ref legal event code: PL |
|
| REG | Reference to a national code |
Ref country code: BE Ref legal event code: MM Effective date: 20231031 |
|
| PG25 | Lapsed in a contracting state [announced via postgrant information from national office to epo] |
Ref country code: LU Free format text: LAPSE BECAUSE OF NON-PAYMENT OF DUE FEES Effective date: 20231002 |
|
| PG25 | Lapsed in a contracting state [announced via postgrant information from national office to epo] |
Ref country code: LU Free format text: LAPSE BECAUSE OF NON-PAYMENT OF DUE FEES Effective date: 20231002 |
|
| PG25 | Lapsed in a contracting state [announced via postgrant information from national office to epo] |
Ref country code: CH Free format text: LAPSE BECAUSE OF NON-PAYMENT OF DUE FEES Effective date: 20231031 |
|
| PG25 | Lapsed in a contracting state [announced via postgrant information from national office to epo] |
Ref country code: CH Free format text: LAPSE BECAUSE OF NON-PAYMENT OF DUE FEES Effective date: 20231031 Ref country code: SI Free format text: LAPSE BECAUSE OF FAILURE TO SUBMIT A TRANSLATION OF THE DESCRIPTION OR TO PAY THE FEE WITHIN THE PRESCRIBED TIME-LIMIT Effective date: 20230712 |
|
| PLBB | Reply of patent proprietor to notice(s) of opposition received |
Free format text: ORIGINAL CODE: EPIDOSNOBS3 |
|
| PG25 | Lapsed in a contracting state [announced via postgrant information from national office to epo] |
Ref country code: BE Free format text: LAPSE BECAUSE OF NON-PAYMENT OF DUE FEES Effective date: 20231031 |
|
| PG25 | Lapsed in a contracting state [announced via postgrant information from national office to epo] |
Ref country code: IE Free format text: LAPSE BECAUSE OF NON-PAYMENT OF DUE FEES Effective date: 20231002 |
|
| PG25 | Lapsed in a contracting state [announced via postgrant information from national office to epo] |
Ref country code: IE Free format text: LAPSE BECAUSE OF NON-PAYMENT OF DUE FEES Effective date: 20231002 |
|
| PG25 | Lapsed in a contracting state [announced via postgrant information from national office to epo] |
Ref country code: BG Free format text: LAPSE BECAUSE OF FAILURE TO SUBMIT A TRANSLATION OF THE DESCRIPTION OR TO PAY THE FEE WITHIN THE PRESCRIBED TIME-LIMIT Effective date: 20230712 |
|
| PG25 | Lapsed in a contracting state [announced via postgrant information from national office to epo] |
Ref country code: BG Free format text: LAPSE BECAUSE OF FAILURE TO SUBMIT A TRANSLATION OF THE DESCRIPTION OR TO PAY THE FEE WITHIN THE PRESCRIBED TIME-LIMIT Effective date: 20230712 |
|
| PGFP | Annual fee paid to national office [announced via postgrant information from national office to epo] |
Ref country code: GB Payment date: 20241024 Year of fee payment: 5 |
|
| PGFP | Annual fee paid to national office [announced via postgrant information from national office to epo] |
Ref country code: FR Payment date: 20241024 Year of fee payment: 5 |
|
| REG | Reference to a national code |
Ref country code: DE Ref legal event code: R100 Ref document number: 602020013583 Country of ref document: DE |
|
| PLCK | Communication despatched that opposition was rejected |
Free format text: ORIGINAL CODE: EPIDOSNREJ1 |
|
| PG25 | Lapsed in a contracting state [announced via postgrant information from national office to epo] |
Ref country code: CY Free format text: LAPSE BECAUSE OF FAILURE TO SUBMIT A TRANSLATION OF THE DESCRIPTION OR TO PAY THE FEE WITHIN THE PRESCRIBED TIME-LIMIT; INVALID AB INITIO Effective date: 20201002 |
|
| PG25 | Lapsed in a contracting state [announced via postgrant information from national office to epo] |
Ref country code: HU Free format text: LAPSE BECAUSE OF FAILURE TO SUBMIT A TRANSLATION OF THE DESCRIPTION OR TO PAY THE FEE WITHIN THE PRESCRIBED TIME-LIMIT; INVALID AB INITIO Effective date: 20201002 |
|
| PLBN | Opposition rejected |
Free format text: ORIGINAL CODE: 0009273 |
|
| STAA | Information on the status of an ep patent application or granted ep patent |
Free format text: STATUS: OPPOSITION REJECTED |
|
| 27O | Opposition rejected |
Effective date: 20250624 |
|
| PG25 | Lapsed in a contracting state [announced via postgrant information from national office to epo] |
Ref country code: TR Free format text: LAPSE BECAUSE OF FAILURE TO SUBMIT A TRANSLATION OF THE DESCRIPTION OR TO PAY THE FEE WITHIN THE PRESCRIBED TIME-LIMIT Effective date: 20230712 |
|
| PGFP | Annual fee paid to national office [announced via postgrant information from national office to epo] |
Ref country code: DE Payment date: 20251020 Year of fee payment: 6 |