EP3973388B1 - Stack traces using shadow stack - Google Patents
Stack traces using shadow stack Download PDFInfo
- Publication number
- EP3973388B1 EP3973388B1 EP20723683.7A EP20723683A EP3973388B1 EP 3973388 B1 EP3973388 B1 EP 3973388B1 EP 20723683 A EP20723683 A EP 20723683A EP 3973388 B1 EP3973388 B1 EP 3973388B1
- Authority
- EP
- European Patent Office
- Prior art keywords
- stack
- shadow
- call
- shadow stack
- return
- Prior art date
- Legal status (The legal status is an assumption and is not a legal conclusion. Google has not performed a legal analysis and makes no representation as to the accuracy of the status listed.)
- Active
Links
Images


Classifications
-
- G—PHYSICS
- G06—COMPUTING OR CALCULATING; COUNTING
- G06F—ELECTRIC DIGITAL DATA PROCESSING
- G06F9/00—Arrangements for program control, e.g. control units
- G06F9/06—Arrangements for program control, e.g. control units using stored programs, i.e. using an internal store of processing equipment to receive or retain programs
- G06F9/44—Arrangements for executing specific programs
- G06F9/448—Execution paradigms, e.g. implementations of programming paradigms
- G06F9/4482—Procedural
- G06F9/4484—Executing subprograms
-
- G—PHYSICS
- G06—COMPUTING OR CALCULATING; COUNTING
- G06F—ELECTRIC DIGITAL DATA PROCESSING
- G06F9/00—Arrangements for program control, e.g. control units
- G06F9/06—Arrangements for program control, e.g. control units using stored programs, i.e. using an internal store of processing equipment to receive or retain programs
- G06F9/30—Arrangements for executing machine instructions, e.g. instruction decode
- G06F9/38—Concurrent instruction execution, e.g. pipeline or look ahead
- G06F9/3802—Instruction prefetching
- G06F9/3804—Instruction prefetching for branches, e.g. hedging, branch folding
- G06F9/3806—Instruction prefetching for branches, e.g. hedging, branch folding using address prediction, e.g. return stack, branch history buffer
-
- G—PHYSICS
- G06—COMPUTING OR CALCULATING; COUNTING
- G06F—ELECTRIC DIGITAL DATA PROCESSING
- G06F11/00—Error detection; Error correction; Monitoring
- G06F11/36—Prevention of errors by analysis, debugging or testing of software
- G06F11/362—Debugging of software
- G06F11/3636—Debugging of software by tracing the execution of the program
-
- G—PHYSICS
- G06—COMPUTING OR CALCULATING; COUNTING
- G06F—ELECTRIC DIGITAL DATA PROCESSING
- G06F21/00—Security arrangements for protecting computers, components thereof, programs or data against unauthorised activity
- G06F21/50—Monitoring users, programs or devices to maintain the integrity of platforms, e.g. of processors, firmware or operating systems
- G06F21/52—Monitoring users, programs or devices to maintain the integrity of platforms, e.g. of processors, firmware or operating systems during program execution, e.g. stack integrity ; Preventing unwanted data erasure; Buffer overflow
-
- G—PHYSICS
- G06—COMPUTING OR CALCULATING; COUNTING
- G06F—ELECTRIC DIGITAL DATA PROCESSING
- G06F11/00—Error detection; Error correction; Monitoring
- G06F11/36—Prevention of errors by analysis, debugging or testing of software
- G06F11/3604—Analysis of software for verifying properties of programs
- G06F11/3612—Analysis of software for verifying properties of programs by runtime analysis
-
- G—PHYSICS
- G06—COMPUTING OR CALCULATING; COUNTING
- G06F—ELECTRIC DIGITAL DATA PROCESSING
- G06F11/00—Error detection; Error correction; Monitoring
- G06F11/36—Prevention of errors by analysis, debugging or testing of software
- G06F11/3698—Environments for analysis, debugging or testing of software
Definitions
- a program has modules or units of executable code such as methods, subroutines, functions, etc. (collectively referred to herein as "functions").
- a compiled program usually includes many such functions, each having a name or handle by which it can be referenced.
- a function will have executable instructions, and often will have parameters for exchanging data and locally declared variables for internal computation.
- a program may consist of many such functions, and in many cases functions call other functions, for instance a()called b(), which then called c().
- An executing program may have long chains of such function invocations.
- a function e.g., a() called b()
- a corresponding new stack frame is pushed to the call stack (in this case, a frame for b() is pushed on top of a frame for a()).
- the new frame contains a return address, i.e., the point in the program where the corresponding function was invoked (in the example, a location in a() where b() was called).
- the function's frame is popped from the call stack and the control flow passes to whichever return address is in the frame.
- a frame can also be used to store parameters passed to/from its function and local data declared in its function.
- the order of frames on the call stack reflects the current order of chained function calls, where each frame represents a function that has not yet exited. It is often desirable to know the current chain of function invocations when a program is executing. This information, sometimes called a stack trace or backtrace, can be useful for, among other things, debugging and performance profiling. As discussed next, there are different ways that a call stack can be used to construct a backtrace, but all prior approaches for backtracing incur computing overhead to the extent that in some scenarios backtracing is not practical. For instance, in many production systems and user devices, even a small increase in incurred latency can make backtracing prohibitive.
- One prior approach for backtracing involves saving a caller's frame address in the callee's stack frame, and using a dedicated register (e.g., the x86 EBP register) to point to the current callee's frame.
- the dedicated register is used to get the current stack frame, from which the caller's stack frame's address is obtained, from which the caller's stack frame address is obtained.
- the return address of the corresponding function is stored at a fixed offset. Therefore, to get the stack backtrace, the return address of each frame is found and dumped.
- Another approach involves not saving the caller's stack frame address in the callee's stack frame. Instead, the stack frame size is computed by reverse executing function prologues.
- a stack backtrace starts by computing the stack size, which is then subtracted from the stack pointer to get the return address. Using the return address, the caller's stack frame size can be computed, which gets the caller's return address, and so forth.
- this approach is more efficient when not backtracing (lower support overhead), but is less efficient when carrying out a stack backtrace.
- LBR Last Branch Record
- US 2019/050566 A1 relates to technologies for control flow exploit mitigation using processor trace.
- Certain ROP (return-oriented programming) exploits may be prevented by maintaining a "shadow stack" in parallel with the ordinary system stack.
- the shadow stack maintains a copy of the legacy stack in memory inaccessible to ordinary software, and may be used to determine if the legacy stack has been tampered with by malware.
- a computing device for control flow exploit detection and mitigation includes a processor having hardware real-time instruction tracing (RTIT) support. In use, the computing device executes software with RTIT support enabled and the processor automatically outputs trace data indicative of the control flow of the software.
- RTIT hardware real-time instruction tracing
- the computing device initializes real-time instruction tracing using the RTIT support of the processor.
- the computing device injects additional data into the trace data stream to allow shadow stack monitoring.
- the computing device constructs and/or maintains a shadow stack in the shadow stack area based on the trace data and identifies suspected ROP exploits by comparing the active system stack to the shadow stack.
- There is no need to output the return address to the trace data as part of the method because the RTIT support of the processor will automatically output a TIP (target instruction pointer) packet with the return address for mispredicted return instructions, and the return address may be determined from the shadow stack for correctly predicted return instructions.
- TIP target instruction pointer
- US 7 581 089 B1 relates to method of protecting a computer stack.
- Information stored on a stack is protected in an easily accessible but un-modifiable location, and the unmatched calls/returns are protected from being overwritten.
- Two computer stacks are created, a first computer stack operates as a traditional stack would, and a second computer stack, or shadow stack, stores the return address upon a call to a subroutine, the address of the return address on the first computer stack, and a user-definable state variable. After jumping to, and executing a subroutine, the return address from both the first computer stack and the second computer stack are compared. When a mismatch occurs, the second stack is searched for a matching return address.
- TRUSS is able to operate with an average performance overhead of about 20% to 50%.
- a runtime shadow stack of return addresses is maintained. On the execution of a procedure return, the return addresses on both the program stack and the shadow stack are compared. If there is any discrepancy, an error is raised.
- TRUSS is an implementation in a runtime binary rewriting framework.
- a program is executed using a call stack and shadow stack.
- the call stack includes frames having respective return addresses.
- the frames may also store variables and/or parameters.
- the shadow stack stores duplicates of the return addresses in the call stack.
- the call stack and the shadow stack are maintained by, (i) each time a function is called, adding a corresponding stack frame to the call stack and adding a corresponding return address to the shadow stack, and (ii) each time a function is exited, removing a corresponding frame from the call stack and removing a corresponding return address from the shadow stack.
- a backtrace of the program's current call chain is generated by accessing the return addresses in the shadow stack.
- the outputted backtrace includes the return addresses from the shadow stack and/or information about the traced functions that is derived from the shadow stack's return addresses.
- Embodiments discussed below relate to using a shadow stack to enable efficient stack backtracing. Discussion will begin with an overview of call stacks and shadow stacks. Various ways of implementing a shadow stack are then described, followed by details of methods for using a shadow stack to facilitate stack backtraces.
- Figure 1 shows an executing program 100 and a corresponding call stack 102 and shadow stack 104.
- the program 100 may be compiled machine instructions, bytecode, source code being executed by an interpreter, and so forth.
- the program 100 includes various functions and calls to the functions.
- the call stack 102 may be implemented in any of many known ways. As mentioned in the Background, frames are pushed and popped in correspondence with function invocations and exits/returns, respectively.
- the shadow stack 104 may also be implemented in known ways, using software, hardware, or both.
- a function exits when a function exits, its stack frame is popped off the call stack and execution control passes to whichever code location the frame's return address points to, usually, a location in the function that called the exiting function.
- the call stack's role in flow control - of providing return addresses - is a well-known security weakness. Using various techniques, the call stack can be altered or corrupted to change a return address, thereby directing execution to the location of malicious code.
- Shadow stacks are one solution to the return address vulnerability.
- a shadow stack is a stack that is separate from the call stack and is synchronized with the call stack so that each time a frame is added to the call stack the frame's return address is added to the shadow stack.
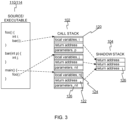
- Figure 2 shows an example of source code 110 compiled by a compiler 112 to produce an executable program 114.
- the source code 110 contains various functions and function calls.
- the compiler 112 translates the source code into the executable program 114, which might be in the form of machine code, bytecode, intermediate code, object code, etc.
- the compiled executable program 114 has units of code/instructions that respectively correspond to the functions in the source code.
- the compiler also adds to the executable program 114 instructions for implementing the call stack.
- the compiler 112 also adds instrumentation code for implementing the shadow stack.
- FIG 3 shows details of the call stack 102 and the shadow stack 104.
- the call stack 102 consists of frames 120, one for each still-pending function invocation. Each frame 120 includes a return address 122, as well as memory for local variables 124 and parameters 126, as the case may be.
- the example of Figure 3 includes functions main(), bar(), and foo().
- the main() function is coded to call foo(), which is coded to call bar().
- the call stack 102 shown in Figure 3 reflects the executable program 114 when foo() has been called and is still executing.
- the shadow stack 104 should contain duplicates 126 of the return addresses in the respective frames in the call stack, and in the same order.
- Figure 4 shows how the call stack 102 and shadow stack 104 are maintained.
- the steps for shadow stack management in Figure 4 can be performed by special shadow stack hardware of the processor, by software, or both.
- a new frame 134 is pushed to the call stack 102.
- the new frame 134 includes a return address corresponding to the point where the called function was invoked.
- a new return address 138 (the same return address that is in the new frame 134) is pushed onto the shadow stack 104.
- the steps for adding to the stacks can be performed in any order or in parallel.
- the executing program 100 is executing a called function and the function returns (e.g., exits).
- the frame corresponding to the returned-from function is popped from the call stack, and at step 144 the top return address on the shadow stack is popped from the shadow stack.
- the steps for removing from the stacks can be performed in any order or in parallel.
- the removal/exit process includes some logic, whether in hardware or software, to compare the return address in the popped frame with the return address popped from the shadow stack, and to respond accordingly if they do not match. However, the comparison is not necessary for backtracing and if it is possible to implement a shadow stack without any comparison/remediating steps, the small backtrace overhead may be lowered further.
- the shadow stack can be implemented by hardware or software.
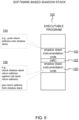
- Figure 5 shows a software-based shadow stack implementation.
- the compiler inserts into its translated output instrumentation code that implements the shadow stack.
- instrumentation code 150 will be placed near each function call 152.
- the instrumentation code 150 may include entry logic 154 and exit logic 156.
- the entry logic 154 may push the relevant return address onto the shadow stack, among other things.
- the exit logic 156 may pop the top of the shadow stack and check the popped return address against the return address in a corresponding call frame.
- FIG. 6 shows a hardware-based shadow stack implementation.
- a processor 160 has circuitry that implements the various instructions in the processor's instruction set.
- the processor's implementation of the call instruction includes both the ordinary call logic 164 as well as shadow stack logic 166.
- the ordinary call logic 164 is the control flow logic of the call instruction that is found in a typical processor, regardless of whether the processor implements a shadow stack.
- the shadow stack logic 166 performs the shadow stack functionality discussed above, but in association with the call instruction 162.
- Some processors may have a register for controlling whether the shadow stack logic is active, which may control implementation and/or backtrace-usage of the shadow stack logic 166, among other things.
- the executable program may have no visibility of the shadow stack, which is implemented without instrumentation code. In other words, the same executable can run without modification on (i) one processor that lacks shadow stack support (and execution will have no shadows stack) and (ii) another processor that has shadow stack support (and will have shadow stacks).
- the shadow stack is assumed to be available for reading at any time, whether by the program/thread whose calls it is tracking, or by another component such as a debugger or runtime environment.
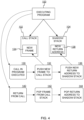
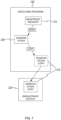
- FIG. 7 shows how the shadow stack can be used to satisfy a backtrace request 170.
- the compiled program 100 is executing. As discussed above, the program calls functions within functions, resulting in chains of function calls while corresponding state is reflected in the call stack and the shadow stack.
- the backtrace request 170 can be received during any arbitrary point of execution.
- the backtrace request 170 may be an application programming interface (API) call, an invocation of a backtrace function included in the executable program 100, etc.
- API application programming interface
- the backtrace request might also be issued by an exception handler, a signal handler invoked by an external signal, and so forth.
- the shadow stack 104 is accessed and read, either by code in (or linked to) the program 100, by a shadow stack instruction implemented by the processor, or a combination thereof.
- a full or partial copy 172 of the shadow stack 104 is captured (as used herein, a "copy" of the shadow stack refers to a full copy or a selective/partial copy).
- the return addresses copied from the shadow stack may be limited to a top-N subset of the available addresses. Such a limit might come from a hardware constraint (e.g., a buffer size), a variable set in the program, a parameter passed into the backtrace request, etc.
- the shadow stack copy 172 is incorporated into a trace or debug output 174.
- Any of the many known means for capturing diagnostic information may be supplemented with shadow stack backtrace data in this fashion.
- any known approach for requesting and storing a backtrace can be used by modifying such approach to obtain return address data from the shadow stack in addition to, or instead of, from the call stack.
- a return address which is just a number, can be converted into a function name, line number, file number etc. from symbol information.
- Such a full stack trace can then be stored in a log file, output to the screen, or sent over a network as telemetry for crash analysis etc.
- Figure 8 shows a process for using the shadow stack.
- a stack trace or backtrace is requested during execution of the program, either by the internal logic of the program or by a component communicating with the program.
- information about the shadow stack may be optionally acquired, for instance whether a shadow stack exists, its location, current size (or number of elements), the format of elements of the shadow stack, security information, attributes of the shadow stack (e.g., is it implemented in hardware or software), and so forth.
- the shadow stack information may be used to decide how or whether to carry out the backtrace request. For instance, unless a shadow stack is available (or has some specific trait), then the backtrace request may not generate a backtrace. Attributes of the shadow stack such as size, location, the size/number of elements, permissions, etc., may also be used to access and copy the shadow stack.
- the shadow stack is used to generate a backtrace.
- the backtrace is a verbatim copy of the shadow stack or a portion thereof.
- the return addresses in the shadow stack are used to identify the relevant corresponding functions, the source code modules and line numbers where they are defined, the names of the called functions, the line numbers in functions where calls were made, information about the relevant functions (e.g., return type, parameter types/names), to name a few.
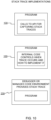
- Figure 9 shows shadow stack content 220 being used in combination with other information to generate a backtrace 222.
- the return addresses in the shadow stack content 222 is used in combination with the call stack 102 and/or program/module metadata 224 to derive an enriched backtrace 222.
- the program/module metadata 224 is metadata found in object files, symbol tables, source code files, and the like.
- a backtrace generating function 226 receives the shadow stack content 220.
- the backtrace generating function 226 also receives or accesses the program/module metadata 226 and/or the call stack 102. This information can be synthesized/combined in various ways.
- the return addresses in the shadow stack content 220 can serve as an index to additional data; the shadow stack allows near zero-cost reconstruction of the call chain, and the call chain can be fleshed out with additional diagnostic information from other sources.
- the backtrace 222 is outputted, possibly through an existing diagnostic/debugging/telemetry scheme, which might involve using APIs for outputting diagnostic data, collecting formatted output in log files, sending the log files to a collection service, etc.
- Figure 10 shows various contexts where backtrace logic can be implemented.
- the program 100 includes calls to an API for capturing backtraces.
- the API may be any known API for debugging or capturing backtraces.
- the logic implementing the API uses the shadow stack.
- the API may also have additional functions/methods that are relevant to using a shadow stack.
- the API may define functions for setting prerequisites for honoring backtrace requests (e.g., shadow stack is available, shadow stack is available and supported by hardware, etc.).
- the API may also facilitate backward compatibility.
- the backtracing functionality can also be fully contained within the program, as shown in the middle of Figure 10 .
- an environment 230 such as a debugger, managed code environment, interpreter, or the like both executes the program and provides the backtracing functionality.
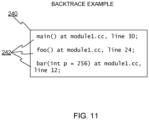
- Figure 11 shows a backtrace output example 240.
- the example includes strings 242 generated based on shadow stack data. Any known style of backtrace formatting and content can be used. Settings, different backtrace functions (e.g., backtrace_raw() or backtrace_symbols()), or backtrace function parameters can be used to control the backtrace style and content, which can range from a list of bare memory addresses to detailed information and graphics about the functions that appear in the backtrace.
- backtrace_raw() e.g., backtrace_raw() or backtrace_symbols()
- backtrace function parameters can be used to control the backtrace style and content, which can range from a list of bare memory addresses to detailed information and graphics about the functions that appear in the backtrace.
- Some call stack implementations use multiple call stacks that are linked together. In such cases, corresponding shadow stacks are linked, and unwinding the current call chain for a backtrace may involve unwinding the linked shadow stacks.
- program as used herein is also considered to refer to threads. Usually, each thread has its own call stack and shadow stack.
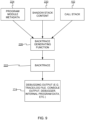
- FIG 12 shows details of a computing device 300 on which embodiments described above may be implemented.
- the technical disclosures herein will suffice for programmers to write software, and/or configure reconfigurable processing hardware (e.g., field-programmable gate arrays (FPGAs)), and/or design application-specific integrated circuits (ASICs), etc., to run on the computing device or host 300 (possibly via cloud APIs) to implement the embodiments described herein.
- reconfigurable processing hardware e.g., field-programmable gate arrays (FPGAs)
- ASICs application-specific integrated circuits
- the computing device or host 300 may have one or more displays 322, a network interface 324 (or several), as well as storage hardware 326 and processing hardware 328, which may be a combination of any one or more of: central processing units, graphics processing units, analog-to-digital converters, bus chips, FPGAs, ASICs, Application-specific Standard Products (ASSPs), or Complex Programmable Logic Devices (CPLDs), etc.
- the storage hardware 326 may be any combination of magnetic storage, static memory, volatile memory, non-volatile memory, optically or magnetically readable matter, etc.
- storage does not refer to signals or energy per se, but rather refers to physical apparatuses and states of matter used thereby to read and/or store information.
- the hardware elements of the computing device or host 300 may cooperate in ways well understood in the art of machine computing.
- input devices may be integrated with or in communication with the computing device or host 300.
- the computing device or host 300 may have any form-factor or may be used in any type of encompassing device.
- the computing device or host 300 may be in the form of a handheld device such as a smartphone, a tablet computer, a gaming device, a server, a rack-mounted or backplaned computer-on-a-board, a system-on-a-chip, or others.
- Embodiments and features discussed above can be realized in the form of information stored in volatile or non-volatile computer or device readable media. This is deemed to include at least media such as optical storage (e.g., compact-disk read-only memory (CD-ROM)), magnetic media, flash read-only memory (ROM), or any current or future means of storing digital information.
- the stored information can be in the form of machine executable instructions (e.g., compiled executable binary code), source code, bytecode, or any other information that can be used to enable or configure computing devices to perform the various embodiments discussed above.
- RAM random-access memory
- CPU central processing unit
- non-volatile media storing information that allows a program or executable to be loaded and executed.
- the embodiments and features can be performed on any type of computing device, including portable devices, workstations, servers, mobile wireless devices, and so on.
Landscapes
- Engineering & Computer Science (AREA)
- Theoretical Computer Science (AREA)
- Software Systems (AREA)
- Physics & Mathematics (AREA)
- General Engineering & Computer Science (AREA)
- General Physics & Mathematics (AREA)
- Computer Security & Cryptography (AREA)
- Computer Hardware Design (AREA)
- Quality & Reliability (AREA)
- Debugging And Monitoring (AREA)
- Executing Machine-Instructions (AREA)
Description
- Most programming languages support modular construction and execution of software. Typically, a program has modules or units of executable code such as methods, subroutines, functions, etc. (collectively referred to herein as "functions"). A compiled program usually includes many such functions, each having a name or handle by which it can be referenced. A function will have executable instructions, and often will have parameters for exchanging data and locally declared variables for internal computation. A program may consist of many such functions, and in many cases functions call other functions, for instance a()called b(), which then called c(). An executing program may have long chains of such function invocations.
- To manage the invocation and execution of functions, most compilers compile programs to use some form of call stack when executing. Each time a function is called (e.g., a() called b()), a corresponding new stack frame is pushed to the call stack (in this case, a frame for b() is pushed on top of a frame for a()). The new frame contains a return address, i.e., the point in the program where the corresponding function was invoked (in the example, a location in a() where b() was called). Each time a function exits, the function's frame is popped from the call stack and the control flow passes to whichever return address is in the frame. A frame can also be used to store parameters passed to/from its function and local data declared in its function.
- At any given time, the order of frames on the call stack reflects the current order of chained function calls, where each frame represents a function that has not yet exited. It is often desirable to know the current chain of function invocations when a program is executing. This information, sometimes called a stack trace or backtrace, can be useful for, among other things, debugging and performance profiling. As discussed next, there are different ways that a call stack can be used to construct a backtrace, but all prior approaches for backtracing incur computing overhead to the extent that in some scenarios backtracing is not practical. For instance, in many production systems and user devices, even a small increase in incurred latency can make backtracing prohibitive.
- One prior approach for backtracing involves saving a caller's frame address in the callee's stack frame, and using a dedicated register (e.g., the x86 EBP register) to point to the current callee's frame. The dedicated register is used to get the current stack frame, from which the caller's stack frame's address is obtained, from which the caller's stack frame address is obtained. In each frame, the return address of the corresponding function is stored at a fixed offset. Therefore, to get the stack backtrace, the return address of each frame is found and dumped.
- Another approach involves not saving the caller's stack frame address in the callee's stack frame. Instead, the stack frame size is computed by reverse executing function prologues. A stack backtrace starts by computing the stack size, which is then subtracted from the stack pointer to get the return address. Using the return address, the caller's stack frame size can be computed, which gets the caller's return address, and so forth. Compared to the first approach, this approach is more efficient when not backtracing (lower support overhead), but is less efficient when carrying out a stack backtrace.
- Yet another approach is to use special hardware support such as Intel's Last Branch Record (LBR). If the LBR is configured to call-stack-mode, it will record active calls. Such active call information can be dumped as a stack backtrace.
- While these prior approaches may yield the desired output, the overhead they incur is not negligible. The first approach requires extra instructions to save the caller's stack frame address in the callee's stack frame, and the caller's frame address must be computed when "walking the stack". The second approach requires intensive memory lookups to find the frame size information. The third approach puts stress on thread context switches because many extra registers need to be saved and restored for each context switch.
- Discussed below are techniques for using a shadow stack to facilitate backtracing with negligible overhead.
US 2019/050566 A1 relates to technologies for control flow exploit mitigation using processor trace. Certain ROP (return-oriented programming) exploits may be prevented by maintaining a "shadow stack" in parallel with the ordinary system stack. The shadow stack maintains a copy of the legacy stack in memory inaccessible to ordinary software, and may be used to determine if the legacy stack has been tampered with by malware. A computing device for control flow exploit detection and mitigation includes a processor having hardware real-time instruction tracing (RTIT) support. In use, the computing device executes software with RTIT support enabled and the processor automatically outputs trace data indicative of the control flow of the software. The computing device initializes real-time instruction tracing using the RTIT support of the processor. The computing device injects additional data into the trace data stream to allow shadow stack monitoring. The computing device constructs and/or maintains a shadow stack in the shadow stack area based on the trace data and identifies suspected ROP exploits by comparing the active system stack to the shadow stack. There is no need to output the return address to the trace data as part of the method, because the RTIT support of the processor will automatically output a TIP (target instruction pointer) packet with the return address for mispredicted return instructions, and the return address may be determined from the shadow stack for correctly predicted return instructions. -
US 7 581 089 B1 relates to method of protecting a computer stack. Information stored on a stack is protected in an easily accessible but un-modifiable location, and the unmatched calls/returns are protected from being overwritten. Two computer stacks are created, a first computer stack operates as a traditional stack would, and a second computer stack, or shadow stack, stores the return address upon a call to a subroutine, the address of the return address on the first computer stack, and a user-definable state variable. After jumping to, and executing a subroutine, the return address from both the first computer stack and the second computer stack are compared. When a mismatch occurs, the second stack is searched for a matching return address. First, below the stack top is searched, and then above the stack top is searched. If a matching return address is found, it is checked to make sure that the corresponding address of the stack pointer stored in the second stack matches the current location of the first stack's pointer, and that the user-definable variable indicates that the data was stored on the second stack as a return address datatype. - Burow Nathan et al: "SoK: Shining Light on Shadow Stacks", 2019 IEEE Symposium on Security and Privacy (SP), IEEE, 19 May 2019 (2019-05-19), pages 985-999, relates to SoK: Shining Light on Shadow Stacks. Control-Flow Hijacking attacks are the dominant attack vector against C/C++ programs. Control-Flow Integrity (CFI) solutions mitigate these attacks on the forward edge, i.e., indirect calls through function pointers and virtual calls. Shadow Stacks are a fully precise mechanism for protecting backwards edges, and should be deployed with CFI mitigations. Calls for a shadow stack design that leverages a dedicated register are renewed resulting in low performance overhead, and minimal memory overhead, but sacrifices compatibility. Two new Intel x86 extensions for memory protection (MPX), and page table control (MPK) are repurposed. Building on the isolation efforts with MPX and MPK, the design requirements for a dedicated hardware mechanism to support intra-process memory isolation are presented.
- Saravanan Sinnadurai et al: "Transparent Runtime Shadow Stack: Protection against malicious return address modifications", 1 January 2008 (2008-01-01), relates to Transparent Runtime Shadow Stack: Protection against malicious return address modifications. Exploitation of buffer overflow vulnerabilities constitutes a significant portion of security attacks in computer systems. One of the most common types of buffer overflow attacks is the hijacking of the program counter by overwriting function return addresses in the process' stack so as to redirect the program's control flow to some malicious code injected into the process' memory. The Transparent Runtime Shadow Stack (TRUSS) is used to protect against function return address modification. Our proposed scheme is built on top of DynamoRIO, a dynamic binary rewriting framework. TRUSS is able to operate with an average performance overhead of about 20% to 50%. A runtime shadow stack of return addresses is maintained. On the execution of a procedure return, the return addresses on both the program stack and the shadow stack are compared. If there is any discrepancy, an error is raised. TRUSS is an implementation in a runtime binary rewriting framework.
- It is the object of the present invention to improve software development with minimum computational overhead.
- This object is solved by the subject matter of the independent claims.
- Preferred embodiments are defined by the dependent claims.
- The following summary is included only to introduce some concepts discussed in the Detailed Description below. This summary is not comprehensive and is not intended to delineate the scope of the claimed subject matter, which is set forth by the claims presented at the end.
- A program is executed using a call stack and shadow stack. The call stack includes frames having respective return addresses. The frames may also store variables and/or parameters. The shadow stack stores duplicates of the return addresses in the call stack. The call stack and the shadow stack are maintained by, (i) each time a function is called, adding a corresponding stack frame to the call stack and adding a corresponding return address to the shadow stack, and (ii) each time a function is exited, removing a corresponding frame from the call stack and removing a corresponding return address from the shadow stack. A backtrace of the program's current call chain is generated by accessing the return addresses in the shadow stack. The outputted backtrace includes the return addresses from the shadow stack and/or information about the traced functions that is derived from the shadow stack's return addresses.
- Many of the attendant features will be explained below with reference to the following detailed description considered in connection with the accompanying drawings.
- The present description will be better understood from the following detailed description read in light of the accompanying drawings, wherein like reference numerals are used to designate like parts in the accompanying description.
-
Figure 1 shows an executing program, and a corresponding call stack and shadow stack. -
Figure 2 shows an example of source code compiled by a compiler to produce an executable program. -
Figure 3 shows details of the call stack and the shadow stack. -
Figure 4 shows how the call stack and shadow stack are maintained. -
Figure 5 shows a software-based shadow stack implementation. -
Figure 6 shows a hardware-based shadow stack implementation. -
Figure 7 shows how the shadow stack can be used to satisfy a backtrace request. -
Figure 8 shows a process for using the shadow stack. -
Figure 9 shows shadow stack content being used in combination with other information to generate a backtrace. -
Figure 10 shows various contexts where backtrace logic can be implemented. -
Figure 11 shows a backtrace output example. -
Figure 12 shows details of a computing device. - Embodiments discussed below relate to using a shadow stack to enable efficient stack backtracing. Discussion will begin with an overview of call stacks and shadow stacks. Various ways of implementing a shadow stack are then described, followed by details of methods for using a shadow stack to facilitate stack backtraces.
-
Figure 1 shows an executingprogram 100 and acorresponding call stack 102 andshadow stack 104. Theprogram 100 may be compiled machine instructions, bytecode, source code being executed by an interpreter, and so forth. Theprogram 100 includes various functions and calls to the functions. Thecall stack 102 may be implemented in any of many known ways. As mentioned in the Background, frames are pushed and popped in correspondence with function invocations and exits/returns, respectively. - The
shadow stack 104 may also be implemented in known ways, using software, hardware, or both. As noted in the Background, in nearly all call stack implementations, when a function exits, its stack frame is popped off the call stack and execution control passes to whichever code location the frame's return address points to, usually, a location in the function that called the exiting function. The call stack's role in flow control - of providing return addresses - is a well-known security weakness. Using various techniques, the call stack can be altered or corrupted to change a return address, thereby directing execution to the location of malicious code. - Shadow stacks are one solution to the return address vulnerability. Briefly, a shadow stack is a stack that is separate from the call stack and is synchronized with the call stack so that each time a frame is added to the call stack the frame's return address is added to the shadow stack. Each time a frame is popped from the top of the call stack the return address at the top of the shadow stack is correspondingly popped off the shadow stack. If the popped return address does not match the return address in the popped frame, then an error has occurred and a remedial action can be taken.
-
Figure 2 shows an example ofsource code 110 compiled by acompiler 112 to produce anexecutable program 114. Thesource code 110 contains various functions and function calls. Thecompiler 112 translates the source code into theexecutable program 114, which might be in the form of machine code, bytecode, intermediate code, object code, etc. The compiledexecutable program 114 has units of code/instructions that respectively correspond to the functions in the source code. Except perhaps in some managed runtime environments, the compiler also adds to theexecutable program 114 instructions for implementing the call stack. As discussed in detail below, in embodiments that use a software-based shadow stack, thecompiler 112 also adds instrumentation code for implementing the shadow stack. -
Figure 3 shows details of thecall stack 102 and theshadow stack 104. Thecall stack 102 consists offrames 120, one for each still-pending function invocation. Eachframe 120 includes areturn address 122, as well as memory forlocal variables 124 andparameters 126, as the case may be. The example ofFigure 3 includes functions main(), bar(), and foo(). The main() function is coded to call foo(), which is coded to call bar(). Thecall stack 102 shown inFigure 3 reflects theexecutable program 114 when foo() has been called and is still executing. As shown inFigure 3 , assuming that thecall stack 102 has not been compromised, theshadow stack 104 should containduplicates 126 of the return addresses in the respective frames in the call stack, and in the same order. -
Figure 4 shows how thecall stack 102 andshadow stack 104 are maintained. As discussed in detail below, the steps for shadow stack management inFigure 4 can be performed by special shadow stack hardware of the processor, by software, or both. When the executingprogram 100 calls a function atstep 130, at step 132 anew frame 134 is pushed to thecall stack 102. Thenew frame 134 includes a return address corresponding to the point where the called function was invoked. Atstep 136, based on the same function invocation, a new return address 138 (the same return address that is in the new frame 134) is pushed onto theshadow stack 104. The steps for adding to the stacks can be performed in any order or in parallel. - At
step 140 the executingprogram 100 is executing a called function and the function returns (e.g., exits). Atstep 142 the frame corresponding to the returned-from function is popped from the call stack, and atstep 144 the top return address on the shadow stack is popped from the shadow stack. As with most steps described herein, the steps for removing from the stacks can be performed in any order or in parallel. Moreover, the removal/exit process includes some logic, whether in hardware or software, to compare the return address in the popped frame with the return address popped from the shadow stack, and to respond accordingly if they do not match. However, the comparison is not necessary for backtracing and if it is possible to implement a shadow stack without any comparison/remediating steps, the small backtrace overhead may be lowered further. - As noted above, the shadow stack can be implemented by hardware or software.
Figure 5 shows a software-based shadow stack implementation. In this embodiment, the compiler inserts into its translated output instrumentation code that implements the shadow stack. Generally,instrumentation code 150 will be placed near eachfunction call 152. Theinstrumentation code 150 may includeentry logic 154 andexit logic 156. Theentry logic 154 may push the relevant return address onto the shadow stack, among other things. Theexit logic 156 may pop the top of the shadow stack and check the popped return address against the return address in a corresponding call frame. -
Figure 6 shows a hardware-based shadow stack implementation. Aprocessor 160 has circuitry that implements the various instructions in the processor's instruction set. In one embodiment, the processor's implementation of the call instruction includes both theordinary call logic 164 as well asshadow stack logic 166. Theordinary call logic 164 is the control flow logic of the call instruction that is found in a typical processor, regardless of whether the processor implements a shadow stack. Theshadow stack logic 166 performs the shadow stack functionality discussed above, but in association with thecall instruction 162. Some processors may have a register for controlling whether the shadow stack logic is active, which may control implementation and/or backtrace-usage of theshadow stack logic 166, among other things. The executable program may have no visibility of the shadow stack, which is implemented without instrumentation code. In other words, the same executable can run without modification on (i) one processor that lacks shadow stack support (and execution will have no shadows stack) and (ii) another processor that has shadow stack support (and will have shadow stacks). - In both hardware and software implementations, while a thread or program is executing, the shadow stack is assumed to be available for reading at any time, whether by the program/thread whose calls it is tracking, or by another component such as a debugger or runtime environment.
-
Figure 7 shows how the shadow stack can be used to satisfy abacktrace request 170. The compiledprogram 100 is executing. As discussed above, the program calls functions within functions, resulting in chains of function calls while corresponding state is reflected in the call stack and the shadow stack. Thebacktrace request 170 can be received during any arbitrary point of execution. Thebacktrace request 170 may be an application programming interface (API) call, an invocation of a backtrace function included in theexecutable program 100, etc. The backtrace request might also be issued by an exception handler, a signal handler invoked by an external signal, and so forth. - Based on the
backtrace request 170, theshadow stack 104 is accessed and read, either by code in (or linked to) theprogram 100, by a shadow stack instruction implemented by the processor, or a combination thereof. A full orpartial copy 172 of theshadow stack 104 is captured (as used herein, a "copy" of the shadow stack refers to a full copy or a selective/partial copy). In some embodiments, the return addresses copied from the shadow stack may be limited to a top-N subset of the available addresses. Such a limit might come from a hardware constraint (e.g., a buffer size), a variable set in the program, a parameter passed into the backtrace request, etc. - Finally, the
shadow stack copy 172 is incorporated into a trace ordebug output 174. Any of the many known means for capturing diagnostic information may be supplemented with shadow stack backtrace data in this fashion. In one embodiment, any known approach for requesting and storing a backtrace can be used by modifying such approach to obtain return address data from the shadow stack in addition to, or instead of, from the call stack. For example, a return address, which is just a number, can be converted into a function name, line number, file number etc. from symbol information. Such a full stack trace can then be stored in a log file, output to the screen, or sent over a network as telemetry for crash analysis etc. -
Figure 8 shows a process for using the shadow stack. Atstep 200, a stack trace or backtrace is requested during execution of the program, either by the internal logic of the program or by a component communicating with the program. Atstep 202, information about the shadow stack may be optionally acquired, for instance whether a shadow stack exists, its location, current size (or number of elements), the format of elements of the shadow stack, security information, attributes of the shadow stack (e.g., is it implemented in hardware or software), and so forth. - At
step 204, if shadow stack information was acquired, then the shadow stack information may be used to decide how or whether to carry out the backtrace request. For instance, unless a shadow stack is available (or has some specific trait), then the backtrace request may not generate a backtrace. Attributes of the shadow stack such as size, location, the size/number of elements, permissions, etc., may also be used to access and copy the shadow stack. - At
step 206 the shadow stack is used to generate a backtrace. As discussed above, in some embodiments the backtrace is a verbatim copy of the shadow stack or a portion thereof. In other embodiments, the return addresses in the shadow stack are used to identify the relevant corresponding functions, the source code modules and line numbers where they are defined, the names of the called functions, the line numbers in functions where calls were made, information about the relevant functions (e.g., return type, parameter types/names), to name a few. -
Figure 9 showsshadow stack content 220 being used in combination with other information to generate abacktrace 222. According to the invention, the return addresses in theshadow stack content 222 is used in combination with thecall stack 102 and/or program/module metadata 224 to derive an enrichedbacktrace 222. The program/module metadata 224 is metadata found in object files, symbol tables, source code files, and the like. Abacktrace generating function 226 receives theshadow stack content 220. Thebacktrace generating function 226 also receives or accesses the program/module metadata 226 and/or thecall stack 102. This information can be synthesized/combined in various ways. By correlating the return addresses in the shadow stack content with frames and return addresses in the call stack, the values of parameters and local variables can be obtained, the names of functions and modules can be found, line numbers of calls can be obtained, and so forth. Conceptually, the return addresses in theshadow stack content 220 can serve as an index to additional data; the shadow stack allows near zero-cost reconstruction of the call chain, and the call chain can be fleshed out with additional diagnostic information from other sources. In whatever form, thebacktrace 222 is outputted, possibly through an existing diagnostic/debugging/telemetry scheme, which might involve using APIs for outputting diagnostic data, collecting formatted output in log files, sending the log files to a collection service, etc. - Another example is if there is data corruption on the regular stack. This is common because local variables are also stored on the regular stack, so a bug in the code can allow the return address on the regular stack to get overwritten. Because the shadow stack has no local variables, the program should need to touch any memory on the shadow stack, therefore it is much less likely to get corrupted. In the hardware case, the hardware can enforce the shadow stack to be read-only, and in the software case, the operating system can also make it read-only to everyone except for itself (for pushing and popping return addresses). In any case, if the return address is corrupted on the regular stack, the extra copy of the return address on the shadow stack could be substituted in to correct the problem. Then, the program could possibly continue to run if there are no other corruptions. If there are other corruptions, then at least we can still obtain a successful stack trace to catch the culprit of the corruption.
- In addition, when unwinding the stack, if there is corruption in the middle of the stack, then unwinding will fail at the location of the corruption and further unwinding will be impossible since the data on the stack is wrong, therefore the location of the next return address is unknown. But if a shadow stack is available, even if the shadow stack itself has a few corrupted entries, the corrupted return address entries can be skipped and unwinding can proceed since the return addresses are known to be contiguous in memory.
-
Figure 10 shows various contexts where backtrace logic can be implemented. In one implementation, shown at the top ofFigure 10 , theprogram 100 includes calls to an API for capturing backtraces. The API may be any known API for debugging or capturing backtraces. However, the logic implementing the API uses the shadow stack. The API may also have additional functions/methods that are relevant to using a shadow stack. For example, the API may define functions for setting prerequisites for honoring backtrace requests (e.g., shadow stack is available, shadow stack is available and supported by hardware, etc.). The API may also facilitate backward compatibility. The backtracing functionality can also be fully contained within the program, as shown in the middle ofFigure 10 . In another embodiment, anenvironment 230 such as a debugger, managed code environment, interpreter, or the like both executes the program and provides the backtracing functionality. -
Figure 11 shows a backtrace output example 240. The example includes strings 242 generated based on shadow stack data. Any known style of backtrace formatting and content can be used. Settings, different backtrace functions (e.g., backtrace_raw() or backtrace_symbols()), or backtrace function parameters can be used to control the backtrace style and content, which can range from a list of bare memory addresses to detailed information and graphics about the functions that appear in the backtrace. - Although embodiments above involve compiled programs, most of the techniques can be readily applied to interpreted programs. In that case, the interpreter can be configured to use the shadow stack in similar fashion. The interpreter should be the same from the program's point of view; both compiled and interpreted programs have call/ret instructions that get executed by the processor.
- Some call stack implementations use multiple call stacks that are linked together. In such cases, corresponding shadow stacks are linked, and unwinding the current call chain for a backtrace may involve unwinding the linked shadow stacks.
- The term "program" as used herein is also considered to refer to threads. Usually, each thread has its own call stack and shadow stack.
-
Figure 12 shows details of acomputing device 300 on which embodiments described above may be implemented. The technical disclosures herein will suffice for programmers to write software, and/or configure reconfigurable processing hardware (e.g., field-programmable gate arrays (FPGAs)), and/or design application-specific integrated circuits (ASICs), etc., to run on the computing device or host 300 (possibly via cloud APIs) to implement the embodiments described herein. - The computing device or host 300 may have one or
more displays 322, a network interface 324 (or several), as well asstorage hardware 326 andprocessing hardware 328, which may be a combination of any one or more of: central processing units, graphics processing units, analog-to-digital converters, bus chips, FPGAs, ASICs, Application-specific Standard Products (ASSPs), or Complex Programmable Logic Devices (CPLDs), etc. Thestorage hardware 326 may be any combination of magnetic storage, static memory, volatile memory, non-volatile memory, optically or magnetically readable matter, etc. The meaning of the term "storage", as used herein does not refer to signals or energy per se, but rather refers to physical apparatuses and states of matter used thereby to read and/or store information. The hardware elements of the computing device or host 300 may cooperate in ways well understood in the art of machine computing. In addition, input devices may be integrated with or in communication with the computing device orhost 300. The computing device or host 300 may have any form-factor or may be used in any type of encompassing device. The computing device or host 300 may be in the form of a handheld device such as a smartphone, a tablet computer, a gaming device, a server, a rack-mounted or backplaned computer-on-a-board, a system-on-a-chip, or others. - Embodiments and features discussed above can be realized in the form of information stored in volatile or non-volatile computer or device readable media. This is deemed to include at least media such as optical storage (e.g., compact-disk read-only memory (CD-ROM)), magnetic media, flash read-only memory (ROM), or any current or future means of storing digital information. The stored information can be in the form of machine executable instructions (e.g., compiled executable binary code), source code, bytecode, or any other information that can be used to enable or configure computing devices to perform the various embodiments discussed above. This is also deemed to include at least volatile memory such as random-access memory (RAM) and/or virtual memory storing information such as central processing unit (CPU) instructions during execution of a program carrying out an embodiment, as well as non-volatile media storing information that allows a program or executable to be loaded and executed. The embodiments and features can be performed on any type of computing device, including portable devices, workstations, servers, mobile wireless devices, and so on.
Claims (15)
- A method comprising:
executing, by a processor (160), a program (100), the program comprising functions, each function comprising respective code for respective functions and calls invoking the functions, the executing comprising:maintaining a call stack (102) comprised of frames corresponding to respective invocations of the functions by the calls, each frame comprising a corresponding return address and memory for local variables and parameters;maintaining a shadow stack (104), the maintaining comprising adding/removing return addresses to/from the shadow stack in correspondence with adding/removing the frames to/from the call stack, the shadow stack comprising return addresses that respectively correspond to the return addresses in the call stack; andreceiving a request (170) to capture a stack trace (106), and based thereon, using the return addresses in the shadow stack in combination with the call stack to capture and store the stack trace, wherein the return addresses in the shadow stack are correlated with frames and return addresses in the call stack to obtain local variables and parameters. - A method according to claim 1, wherein the request comprises calling of a backtrace function.
- A method according to claim 1, further comprising, for each return address in the shadow stack, obtaining respectively corresponding function metadata.
- A method according to claim 3, the metadata comprising names of functions respectively corresponding to the return addresses in the shadow stack.
- A method according to claim 1, wherein the processor implements the shadow stack by providing a call instruction for which a single execution thereof causes a corresponding return address to be pushed onto the call stack and onto the shadow stack.
- A method according to claim 1, wherein the capturing the stack trace comprises copying the shadow stack and storing the copy of the shadow stack and storing an indication that the copy of the shadow stack is associated with the program.
- Computer-readable storage hardware storing instructions configured to cause a computing device to perform a process, the computing device comprising processing hardware (160) and memory, the process comprising:executing a program (100) by the processing hardware, the executing comprising maintaining a call stack (102) and shadow stack (104) in the memory, the call stack comprising stack frames, each stack frame comprising a respectively corresponding return address and memory for local variables and parameters, the shadow stack comprising return addresses that respectively correspond to the return addresses in the call stack,the maintaining the call stack and the shadow stack comprising:each time a function is called by the program, adding a corresponding stack frame to the call stack and adding a corresponding return address to the shadow stack; andeach time a function of the program is exited, removing a corresponding stack frame from the call stack and removing a corresponding return address from the shadow stack;receiving a request (170) to capture a stack trace (106) in association with the program, and based on the request, using the return addresses in the shadow stack in combination with the call stack to capture and store the stack trace, wherein the return addresses in the shadow stack are correlated with frames and return addresses in the call stack to obtain local variables and parameters.
- Computer-readable storage hardware according to claim 7, the process further comprising determining that the shadow stack is available, wherein the stack trace is only captured when the shadow stack has been determined to be available.
- Computer-readable storage hardware according to claim 7, wherein capturing the stack trace further comprises:using the return addresses in the shadow stack to identify text strings respectively corresponding to the return addresses in the shadow stack, andincluding the text strings in the stack trace, the stack trace comprising the text strings arranged in an order corresponding to an order of the return addresses in the shadow stack when the request to capture the stack trace was received.
- Computer-readable storage hardware according to claim 7, wherein the stack trace is formed without accessing the call stack.
- A device comprising:processing hardware (160);storage hardware storing instructions configured to cause the processing hardware to perform a process, the process comprising:executing a program (100), the executing including maintaining a call stack (102) comprised of frames corresponding to respective invocations of the functions by the calls, each frame comprising a corresponding return address and memory for local variables and parameters, and a shadow stack (104), wherein the maintaining of the shadow stack comprises adding/removing return addresses to/from the shadow stack in correspondence with adding/removing the frames to/from the call stack, the shadow stack comprising return addresses that respectively correspond to the return addresses in the call stack; andwhile the program is executing, responding to a request (170) to capture a stack trace (106) for the program by using the return addresses in the shadow stack in combination with the call stack to capture and store the stack trace, wherein the return addresses in the shadow stack are correlated with frames and return addresses in the call stack to obtain local variables and parameters.
- A device according to claim 11, wherein the processing hardware comprises hardware instructions that include a call instruction, the call instruction including logic to manage the shadow stack.
- A device according to claim 11, wherein the processing hardware instructions further comprise a return instruction, the call instruction configured to push addresses onto the shadow stack, and the return instruction configured to pop addresses from the shadow stack.
- A device according to claim 11, the process further comprising the program calling a backtrace function to request the stack trace.
- A device according to claim 11, wherein the backtrace function determines whether the shadow stack is available or accessible, and generates the stack trace based on determining that the shadow stack is available or accessible.
Applications Claiming Priority (2)
| Application Number | Priority Date | Filing Date | Title |
|---|---|---|---|
| US16/417,493 US11294682B2 (en) | 2019-05-20 | 2019-05-20 | Stack traces using shadow stack |
| PCT/US2020/027813 WO2020236333A1 (en) | 2019-05-20 | 2020-04-10 | Stack traces using shadow stack |
Publications (2)
| Publication Number | Publication Date |
|---|---|
| EP3973388A1 EP3973388A1 (en) | 2022-03-30 |
| EP3973388B1 true EP3973388B1 (en) | 2024-10-23 |
Family
ID=70482857
Family Applications (1)
| Application Number | Title | Priority Date | Filing Date |
|---|---|---|---|
| EP20723683.7A Active EP3973388B1 (en) | 2019-05-20 | 2020-04-10 | Stack traces using shadow stack |
Country Status (4)
| Country | Link |
|---|---|
| US (2) | US11294682B2 (en) |
| EP (1) | EP3973388B1 (en) |
| CN (2) | CN114144764B (en) |
| WO (1) | WO2020236333A1 (en) |
Families Citing this family (9)
| Publication number | Priority date | Publication date | Assignee | Title |
|---|---|---|---|---|
| US12327120B2 (en) | 2019-05-20 | 2025-06-10 | Microsoft Technology Licensing, Llc | Verified stack trace generation and accelerated stack-based analysis with shadow stacks |
| US11188470B2 (en) * | 2019-05-22 | 2021-11-30 | Vdoo Connected Trust Ltd. | Dynamic identification of stack frames |
| CN112882695B (en) * | 2021-03-02 | 2023-11-28 | 百果园技术(新加坡)有限公司 | Parameter transmission method, parameter transmission device, computer equipment and storage medium |
| CN112925718B (en) * | 2021-03-22 | 2023-10-20 | 北京字节跳动网络技术有限公司 | Call stack backtracking method, device, equipment and medium |
| CN114185803A (en) * | 2021-12-17 | 2022-03-15 | 中国平安财产保险股份有限公司 | Page script debugging method and device, computer readable storage medium and server |
| GB2618116B (en) * | 2022-04-28 | 2025-10-22 | Advanced Risc Mach Ltd | Exception return state lock parameter |
| US12493542B2 (en) * | 2023-02-08 | 2025-12-09 | Google Llc | Call stack profiling with hardware-assisted call path signature generation |
| FR3147397A1 (en) * | 2023-03-28 | 2024-10-04 | Stmicroelectronics International N.V. | COMPUTER SYSTEM CONFIGURED TO RUN A COMPUTER PROGRAM |
| CN120762940A (en) * | 2024-07-17 | 2025-10-10 | 荣耀终端股份有限公司 | Resource leakage point positioning method, electronic device and storage medium |
Family Cites Families (15)
| Publication number | Priority date | Publication date | Assignee | Title |
|---|---|---|---|---|
| US6951011B1 (en) * | 1999-10-21 | 2005-09-27 | Oracle International Corp. | Diagnostic method and article for identifying significant events |
| US20030204838A1 (en) * | 2002-04-30 | 2003-10-30 | Eric Caspole | Debugging platform-independent software applications and related code components |
| US7712082B2 (en) * | 2005-03-24 | 2010-05-04 | Microsoft Corporation | Profiler stackwalker |
| US8516444B2 (en) * | 2006-02-23 | 2013-08-20 | International Business Machines Corporation | Debugging a high performance computing program |
| US7581089B1 (en) | 2006-04-20 | 2009-08-25 | The United States Of America As Represented By The Director Of The National Security Agency | Method of protecting a computer stack |
| US8595709B2 (en) * | 2009-12-10 | 2013-11-26 | Microsoft Corporation | Building an application call graph from multiple sources |
| US8719791B1 (en) * | 2012-05-31 | 2014-05-06 | Google Inc. | Display of aggregated stack traces in a source code viewer |
| CN103019707B (en) * | 2012-11-30 | 2016-01-27 | 华为技术有限公司 | The analyzing and processing method of call stack and device |
| US9378117B2 (en) * | 2014-05-30 | 2016-06-28 | Apple Inc. | Queue debugging using stored backtrace information |
| US9501637B2 (en) * | 2014-09-26 | 2016-11-22 | Intel Corporation | Hardware shadow stack support for legacy guests |
| US10007784B2 (en) | 2015-03-27 | 2018-06-26 | Intel Corporation | Technologies for control flow exploit mitigation using processor trace |
| CN106708488A (en) * | 2015-11-17 | 2017-05-24 | 中兴通讯股份有限公司 | Multi-application debugging system and method |
| US20180004531A1 (en) * | 2016-06-30 | 2018-01-04 | Microsoft Technology Licensing, Llc | Split control stack and data stack platform |
| US10216934B2 (en) * | 2016-07-18 | 2019-02-26 | Crowdstrike, Inc. | Inferential exploit attempt detection |
| CN109409083B (en) * | 2018-09-21 | 2021-04-13 | 中国科学院信息工程研究所 | Device for detecting return address tampering in stack |
-
2019
- 2019-05-20 US US16/417,493 patent/US11294682B2/en active Active
-
2020
- 2020-04-10 WO PCT/US2020/027813 patent/WO2020236333A1/en not_active Ceased
- 2020-04-10 EP EP20723683.7A patent/EP3973388B1/en active Active
- 2020-04-10 CN CN202080037709.2A patent/CN114144764B/en active Active
- 2020-04-10 CN CN202511354320.1A patent/CN121116438A/en active Pending
-
2022
- 2022-03-23 US US17/702,714 patent/US11922168B2/en active Active
Also Published As
| Publication number | Publication date |
|---|---|
| CN121116438A (en) | 2025-12-12 |
| CN114144764A (en) | 2022-03-04 |
| EP3973388A1 (en) | 2022-03-30 |
| US20200371809A1 (en) | 2020-11-26 |
| WO2020236333A1 (en) | 2020-11-26 |
| CN114144764B (en) | 2025-10-10 |
| US11294682B2 (en) | 2022-04-05 |
| US11922168B2 (en) | 2024-03-05 |
| US20220214882A1 (en) | 2022-07-07 |
Similar Documents
| Publication | Publication Date | Title |
|---|---|---|
| EP3973388B1 (en) | Stack traces using shadow stack | |
| Balasubramanian et al. | System programming in rust: Beyond safety | |
| Lhee et al. | Buffer overflow and format string overflow vulnerabilities | |
| KR102306568B1 (en) | Processor trace-based enforcement of control flow integrity in computer systems | |
| Lhee et al. | {Type-Assisted} Dynamic Buffer Overflow Detection | |
| Ming et al. | {TaintPipe}: Pipelined symbolic taint analysis | |
| Castro et al. | Securing software by enforcing data-flow integrity | |
| US8990780B2 (en) | Setting breakpoints in optimized instructions | |
| US20060095895A1 (en) | Method and apparatus for inserting code | |
| US11188470B2 (en) | Dynamic identification of stack frames | |
| Ruwase et al. | Parallelizing dynamic information flow tracking | |
| Stüttgen et al. | Robust Linux memory acquisition with minimal target impact | |
| JP2002512396A (en) | Real-time debugger interface for embedded systems | |
| US20040019774A1 (en) | Processor device and information processing device, compiling device, and compiling method using said processor device | |
| Zeng et al. | Palantír: Optimizing attack provenance with hardware-enhanced system observability | |
| US11681806B2 (en) | Protecting against out-of-bounds buffer references | |
| US8943480B2 (en) | Setting breakpoints in optimized instructions | |
| Chow et al. | Multi-stage replay with crosscut | |
| Nagarajan et al. | Dynamic information flow tracking on multicores | |
| Sinnadurai et al. | Transparent runtime shadow stack: Protection against malicious return address modifications | |
| Brünink et al. | Boundless memory allocations for memory safety and high availability | |
| Gens | OS-level Attacks and Defenses: from Software to Hardware-based Exploits | |
| Li et al. | Detecting undefined behaviors in CUDA C | |
| Andrić et al. | Enabling the syscall_intercept library for RISC-V | |
| Gerhorst | Flexible and Low-Overhead System-Call Aggregation using BPF |
Legal Events
| Date | Code | Title | Description |
|---|---|---|---|
| STAA | Information on the status of an ep patent application or granted ep patent |
Free format text: STATUS: UNKNOWN |
|
| STAA | Information on the status of an ep patent application or granted ep patent |
Free format text: STATUS: THE INTERNATIONAL PUBLICATION HAS BEEN MADE |
|
| PUAI | Public reference made under article 153(3) epc to a published international application that has entered the european phase |
Free format text: ORIGINAL CODE: 0009012 |
|
| STAA | Information on the status of an ep patent application or granted ep patent |
Free format text: STATUS: REQUEST FOR EXAMINATION WAS MADE |
|
| 17P | Request for examination filed |
Effective date: 20211022 |
|
| AK | Designated contracting states |
Kind code of ref document: A1 Designated state(s): AL AT BE BG CH CY CZ DE DK EE ES FI FR GB GR HR HU IE IS IT LI LT LU LV MC MK MT NL NO PL PT RO RS SE SI SK SM TR |
|
| DAV | Request for validation of the european patent (deleted) | ||
| DAX | Request for extension of the european patent (deleted) | ||
| STAA | Information on the status of an ep patent application or granted ep patent |
Free format text: STATUS: EXAMINATION IS IN PROGRESS |
|
| 17Q | First examination report despatched |
Effective date: 20230510 |
|
| GRAP | Despatch of communication of intention to grant a patent |
Free format text: ORIGINAL CODE: EPIDOSNIGR1 |
|
| STAA | Information on the status of an ep patent application or granted ep patent |
Free format text: STATUS: GRANT OF PATENT IS INTENDED |
|
| INTG | Intention to grant announced |
Effective date: 20240524 |
|
| P01 | Opt-out of the competence of the unified patent court (upc) registered |
Free format text: CASE NUMBER: APP_35377/2024 Effective date: 20240612 |
|
| GRAS | Grant fee paid |
Free format text: ORIGINAL CODE: EPIDOSNIGR3 |
|
| GRAA | (expected) grant |
Free format text: ORIGINAL CODE: 0009210 |
|
| STAA | Information on the status of an ep patent application or granted ep patent |
Free format text: STATUS: THE PATENT HAS BEEN GRANTED |
|
| AK | Designated contracting states |
Kind code of ref document: B1 Designated state(s): AL AT BE BG CH CY CZ DE DK EE ES FI FR GB GR HR HU IE IS IT LI LT LU LV MC MK MT NL NO PL PT RO RS SE SI SK SM TR |
|
| REG | Reference to a national code |
Ref country code: GB Ref legal event code: FG4D |
|
| REG | Reference to a national code |
Ref country code: CH Ref legal event code: EP |
|
| REG | Reference to a national code |
Ref country code: DE Ref legal event code: R096 Ref document number: 602020039862 Country of ref document: DE |
|
| REG | Reference to a national code |
Ref country code: IE Ref legal event code: FG4D |
|
| REG | Reference to a national code |
Ref country code: LT Ref legal event code: MG9D |
|
| REG | Reference to a national code |
Ref country code: NL Ref legal event code: MP Effective date: 20241023 |
|
| REG | Reference to a national code |
Ref country code: AT Ref legal event code: MK05 Ref document number: 1735394 Country of ref document: AT Kind code of ref document: T Effective date: 20241023 |
|
| PG25 | Lapsed in a contracting state [announced via postgrant information from national office to epo] |
Ref country code: NL Free format text: LAPSE BECAUSE OF FAILURE TO SUBMIT A TRANSLATION OF THE DESCRIPTION OR TO PAY THE FEE WITHIN THE PRESCRIBED TIME-LIMIT Effective date: 20241023 |
|
| PG25 | Lapsed in a contracting state [announced via postgrant information from national office to epo] |
Ref country code: NL Free format text: LAPSE BECAUSE OF FAILURE TO SUBMIT A TRANSLATION OF THE DESCRIPTION OR TO PAY THE FEE WITHIN THE PRESCRIBED TIME-LIMIT Effective date: 20241023 |
|
| PG25 | Lapsed in a contracting state [announced via postgrant information from national office to epo] |
Ref country code: IS Free format text: LAPSE BECAUSE OF FAILURE TO SUBMIT A TRANSLATION OF THE DESCRIPTION OR TO PAY THE FEE WITHIN THE PRESCRIBED TIME-LIMIT Effective date: 20250223 Ref country code: PT Free format text: LAPSE BECAUSE OF FAILURE TO SUBMIT A TRANSLATION OF THE DESCRIPTION OR TO PAY THE FEE WITHIN THE PRESCRIBED TIME-LIMIT Effective date: 20250224 Ref country code: HR Free format text: LAPSE BECAUSE OF FAILURE TO SUBMIT A TRANSLATION OF THE DESCRIPTION OR TO PAY THE FEE WITHIN THE PRESCRIBED TIME-LIMIT Effective date: 20241023 |
|
| PG25 | Lapsed in a contracting state [announced via postgrant information from national office to epo] |
Ref country code: FI Free format text: LAPSE BECAUSE OF FAILURE TO SUBMIT A TRANSLATION OF THE DESCRIPTION OR TO PAY THE FEE WITHIN THE PRESCRIBED TIME-LIMIT Effective date: 20241023 |
|
| PG25 | Lapsed in a contracting state [announced via postgrant information from national office to epo] |
Ref country code: BG Free format text: LAPSE BECAUSE OF FAILURE TO SUBMIT A TRANSLATION OF THE DESCRIPTION OR TO PAY THE FEE WITHIN THE PRESCRIBED TIME-LIMIT Effective date: 20241023 |
|
| PG25 | Lapsed in a contracting state [announced via postgrant information from national office to epo] |
Ref country code: ES Free format text: LAPSE BECAUSE OF FAILURE TO SUBMIT A TRANSLATION OF THE DESCRIPTION OR TO PAY THE FEE WITHIN THE PRESCRIBED TIME-LIMIT Effective date: 20241023 |
|
| PG25 | Lapsed in a contracting state [announced via postgrant information from national office to epo] |
Ref country code: NO Free format text: LAPSE BECAUSE OF FAILURE TO SUBMIT A TRANSLATION OF THE DESCRIPTION OR TO PAY THE FEE WITHIN THE PRESCRIBED TIME-LIMIT Effective date: 20250123 |
|
| PG25 | Lapsed in a contracting state [announced via postgrant information from national office to epo] |
Ref country code: AT Free format text: LAPSE BECAUSE OF FAILURE TO SUBMIT A TRANSLATION OF THE DESCRIPTION OR TO PAY THE FEE WITHIN THE PRESCRIBED TIME-LIMIT Effective date: 20241023 Ref country code: LV Free format text: LAPSE BECAUSE OF FAILURE TO SUBMIT A TRANSLATION OF THE DESCRIPTION OR TO PAY THE FEE WITHIN THE PRESCRIBED TIME-LIMIT Effective date: 20241023 Ref country code: GR Free format text: LAPSE BECAUSE OF FAILURE TO SUBMIT A TRANSLATION OF THE DESCRIPTION OR TO PAY THE FEE WITHIN THE PRESCRIBED TIME-LIMIT Effective date: 20250124 |
|
| PG25 | Lapsed in a contracting state [announced via postgrant information from national office to epo] |
Ref country code: PL Free format text: LAPSE BECAUSE OF FAILURE TO SUBMIT A TRANSLATION OF THE DESCRIPTION OR TO PAY THE FEE WITHIN THE PRESCRIBED TIME-LIMIT Effective date: 20241023 |
|
| PGFP | Annual fee paid to national office [announced via postgrant information from national office to epo] |
Ref country code: GB Payment date: 20250319 Year of fee payment: 6 |
|
| PG25 | Lapsed in a contracting state [announced via postgrant information from national office to epo] |
Ref country code: RS Free format text: LAPSE BECAUSE OF FAILURE TO SUBMIT A TRANSLATION OF THE DESCRIPTION OR TO PAY THE FEE WITHIN THE PRESCRIBED TIME-LIMIT Effective date: 20250123 |
|
| PG25 | Lapsed in a contracting state [announced via postgrant information from national office to epo] |
Ref country code: SM Free format text: LAPSE BECAUSE OF FAILURE TO SUBMIT A TRANSLATION OF THE DESCRIPTION OR TO PAY THE FEE WITHIN THE PRESCRIBED TIME-LIMIT Effective date: 20241023 |
|
| PGFP | Annual fee paid to national office [announced via postgrant information from national office to epo] |
Ref country code: DE Payment date: 20250319 Year of fee payment: 6 |
|
| PG25 | Lapsed in a contracting state [announced via postgrant information from national office to epo] |
Ref country code: DK Free format text: LAPSE BECAUSE OF FAILURE TO SUBMIT A TRANSLATION OF THE DESCRIPTION OR TO PAY THE FEE WITHIN THE PRESCRIBED TIME-LIMIT Effective date: 20241023 |
|
| PG25 | Lapsed in a contracting state [announced via postgrant information from national office to epo] |
Ref country code: EE Free format text: LAPSE BECAUSE OF FAILURE TO SUBMIT A TRANSLATION OF THE DESCRIPTION OR TO PAY THE FEE WITHIN THE PRESCRIBED TIME-LIMIT Effective date: 20241023 |
|
| PG25 | Lapsed in a contracting state [announced via postgrant information from national office to epo] |
Ref country code: RO Free format text: LAPSE BECAUSE OF FAILURE TO SUBMIT A TRANSLATION OF THE DESCRIPTION OR TO PAY THE FEE WITHIN THE PRESCRIBED TIME-LIMIT Effective date: 20241023 |
|
| REG | Reference to a national code |
Ref country code: DE Ref legal event code: R097 Ref document number: 602020039862 Country of ref document: DE |
|
| PG25 | Lapsed in a contracting state [announced via postgrant information from national office to epo] |
Ref country code: SK Free format text: LAPSE BECAUSE OF FAILURE TO SUBMIT A TRANSLATION OF THE DESCRIPTION OR TO PAY THE FEE WITHIN THE PRESCRIBED TIME-LIMIT Effective date: 20241023 |
|
| PG25 | Lapsed in a contracting state [announced via postgrant information from national office to epo] |
Ref country code: CZ Free format text: LAPSE BECAUSE OF FAILURE TO SUBMIT A TRANSLATION OF THE DESCRIPTION OR TO PAY THE FEE WITHIN THE PRESCRIBED TIME-LIMIT Effective date: 20241023 |
|
| PG25 | Lapsed in a contracting state [announced via postgrant information from national office to epo] |
Ref country code: IT Free format text: LAPSE BECAUSE OF FAILURE TO SUBMIT A TRANSLATION OF THE DESCRIPTION OR TO PAY THE FEE WITHIN THE PRESCRIBED TIME-LIMIT Effective date: 20241023 |
|
| PLBE | No opposition filed within time limit |
Free format text: ORIGINAL CODE: 0009261 |
|
| STAA | Information on the status of an ep patent application or granted ep patent |
Free format text: STATUS: NO OPPOSITION FILED WITHIN TIME LIMIT |
|
| PG25 | Lapsed in a contracting state [announced via postgrant information from national office to epo] |
Ref country code: SE Free format text: LAPSE BECAUSE OF FAILURE TO SUBMIT A TRANSLATION OF THE DESCRIPTION OR TO PAY THE FEE WITHIN THE PRESCRIBED TIME-LIMIT Effective date: 20241023 |
|
| 26N | No opposition filed |
Effective date: 20250724 |
|
| REG | Reference to a national code |
Ref country code: CH Ref legal event code: H13 Free format text: ST27 STATUS EVENT CODE: U-0-0-H10-H13 (AS PROVIDED BY THE NATIONAL OFFICE) Effective date: 20251125 |
|
| PG25 | Lapsed in a contracting state [announced via postgrant information from national office to epo] |
Ref country code: LU Free format text: LAPSE BECAUSE OF NON-PAYMENT OF DUE FEES Effective date: 20250410 |
|
| PG25 | Lapsed in a contracting state [announced via postgrant information from national office to epo] |
Ref country code: MC Free format text: LAPSE BECAUSE OF FAILURE TO SUBMIT A TRANSLATION OF THE DESCRIPTION OR TO PAY THE FEE WITHIN THE PRESCRIBED TIME-LIMIT Effective date: 20241023 |
|
| REG | Reference to a national code |
Ref country code: BE Ref legal event code: MM Effective date: 20250430 |
|
| PG25 | Lapsed in a contracting state [announced via postgrant information from national office to epo] |
Ref country code: FR Free format text: LAPSE BECAUSE OF NON-PAYMENT OF DUE FEES Effective date: 20250430 |
|
| PG25 | Lapsed in a contracting state [announced via postgrant information from national office to epo] |
Ref country code: BE Free format text: LAPSE BECAUSE OF NON-PAYMENT OF DUE FEES Effective date: 20250430 |
|
| PG25 | Lapsed in a contracting state [announced via postgrant information from national office to epo] |
Ref country code: CH Free format text: LAPSE BECAUSE OF NON-PAYMENT OF DUE FEES Effective date: 20250430 |