EP3961204A1 - Quantitative diagnostic method for quality of manufacturing equipment - Google Patents
Quantitative diagnostic method for quality of manufacturing equipment Download PDFInfo
- Publication number
- EP3961204A1 EP3961204A1 EP20851856.3A EP20851856A EP3961204A1 EP 3961204 A1 EP3961204 A1 EP 3961204A1 EP 20851856 A EP20851856 A EP 20851856A EP 3961204 A1 EP3961204 A1 EP 3961204A1
- Authority
- EP
- European Patent Office
- Prior art keywords
- production
- factor
- frequency
- target product
- per
- Prior art date
- Legal status (The legal status is an assumption and is not a legal conclusion. Google has not performed a legal analysis and makes no representation as to the accuracy of the status listed.)
- Pending
Links
- 238000004519 manufacturing process Methods 0.000 title claims abstract description 150
- 238000002405 diagnostic procedure Methods 0.000 title abstract description 4
- 238000000034 method Methods 0.000 claims abstract description 32
- 238000007689 inspection Methods 0.000 claims description 60
- 238000006243 chemical reaction Methods 0.000 claims description 41
- 230000014509 gene expression Effects 0.000 claims description 20
- 230000001502 supplementing effect Effects 0.000 claims description 3
- 239000000047 product Substances 0.000 description 53
- 230000007547 defect Effects 0.000 description 4
- WHXSMMKQMYFTQS-UHFFFAOYSA-N Lithium Chemical compound [Li] WHXSMMKQMYFTQS-UHFFFAOYSA-N 0.000 description 3
- 229910052744 lithium Inorganic materials 0.000 description 3
- 239000013589 supplement Substances 0.000 description 3
- 238000004458 analytical method Methods 0.000 description 2
- 230000008901 benefit Effects 0.000 description 2
- 238000004364 calculation method Methods 0.000 description 2
- 239000003990 capacitor Substances 0.000 description 2
- 238000000354 decomposition reaction Methods 0.000 description 2
- 238000003745 diagnosis Methods 0.000 description 2
- 238000010586 diagram Methods 0.000 description 2
- 238000011002 quantification Methods 0.000 description 2
- 239000002994 raw material Substances 0.000 description 2
- MBXCVSANAPSXKM-UHFFFAOYSA-N CC1C#CCC1 Chemical compound CC1C#CCC1 MBXCVSANAPSXKM-UHFFFAOYSA-N 0.000 description 1
- 238000003915 air pollution Methods 0.000 description 1
- 238000007599 discharging Methods 0.000 description 1
- 230000000694 effects Effects 0.000 description 1
- XPYGGHVSFMUHLH-UUSULHAXSA-N falecalcitriol Chemical compound C1(/[C@@H]2CC[C@@H]([C@]2(CCC1)C)[C@@H](CCCC(O)(C(F)(F)F)C(F)(F)F)C)=C\C=C1\C[C@@H](O)C[C@H](O)C1=C XPYGGHVSFMUHLH-UUSULHAXSA-N 0.000 description 1
- 239000002803 fossil fuel Substances 0.000 description 1
- 239000011159 matrix material Substances 0.000 description 1
- 230000000704 physical effect Effects 0.000 description 1
- 238000013441 quality evaluation Methods 0.000 description 1
- 238000000926 separation method Methods 0.000 description 1
- 230000009469 supplementation Effects 0.000 description 1
- 230000009466 transformation Effects 0.000 description 1
Images


Classifications
-
- G—PHYSICS
- G06—COMPUTING; CALCULATING OR COUNTING
- G06F—ELECTRIC DIGITAL DATA PROCESSING
- G06F17/00—Digital computing or data processing equipment or methods, specially adapted for specific functions
- G06F17/10—Complex mathematical operations
-
- G—PHYSICS
- G05—CONTROLLING; REGULATING
- G05B—CONTROL OR REGULATING SYSTEMS IN GENERAL; FUNCTIONAL ELEMENTS OF SUCH SYSTEMS; MONITORING OR TESTING ARRANGEMENTS FOR SUCH SYSTEMS OR ELEMENTS
- G05B19/00—Programme-control systems
- G05B19/02—Programme-control systems electric
- G05B19/418—Total factory control, i.e. centrally controlling a plurality of machines, e.g. direct or distributed numerical control [DNC], flexible manufacturing systems [FMS], integrated manufacturing systems [IMS], computer integrated manufacturing [CIM]
- G05B19/41875—Total factory control, i.e. centrally controlling a plurality of machines, e.g. direct or distributed numerical control [DNC], flexible manufacturing systems [FMS], integrated manufacturing systems [IMS], computer integrated manufacturing [CIM] characterised by quality surveillance of production
-
- G—PHYSICS
- G01—MEASURING; TESTING
- G01H—MEASUREMENT OF MECHANICAL VIBRATIONS OR ULTRASONIC, SONIC OR INFRASONIC WAVES
- G01H17/00—Measuring mechanical vibrations or ultrasonic, sonic or infrasonic waves, not provided for in the preceding groups
-
- G—PHYSICS
- G01—MEASURING; TESTING
- G01N—INVESTIGATING OR ANALYSING MATERIALS BY DETERMINING THEIR CHEMICAL OR PHYSICAL PROPERTIES
- G01N29/00—Investigating or analysing materials by the use of ultrasonic, sonic or infrasonic waves; Visualisation of the interior of objects by transmitting ultrasonic or sonic waves through the object
- G01N29/04—Analysing solids
- G01N29/045—Analysing solids by imparting shocks to the workpiece and detecting the vibrations or the acoustic waves caused by the shocks
-
- G—PHYSICS
- G01—MEASURING; TESTING
- G01H—MEASUREMENT OF MECHANICAL VIBRATIONS OR ULTRASONIC, SONIC OR INFRASONIC WAVES
- G01H13/00—Measuring resonant frequency
-
- G—PHYSICS
- G01—MEASURING; TESTING
- G01N—INVESTIGATING OR ANALYSING MATERIALS BY DETERMINING THEIR CHEMICAL OR PHYSICAL PROPERTIES
- G01N29/00—Investigating or analysing materials by the use of ultrasonic, sonic or infrasonic waves; Visualisation of the interior of objects by transmitting ultrasonic or sonic waves through the object
- G01N29/04—Analysing solids
- G01N29/048—Marking the faulty objects
-
- G—PHYSICS
- G01—MEASURING; TESTING
- G01R—MEASURING ELECTRIC VARIABLES; MEASURING MAGNETIC VARIABLES
- G01R31/00—Arrangements for testing electric properties; Arrangements for locating electric faults; Arrangements for electrical testing characterised by what is being tested not provided for elsewhere
- G01R31/36—Arrangements for testing, measuring or monitoring the electrical condition of accumulators or electric batteries, e.g. capacity or state of charge [SoC]
- G01R31/385—Arrangements for measuring battery or accumulator variables
- G01R31/3865—Arrangements for measuring battery or accumulator variables related to manufacture, e.g. testing after manufacture
-
- G—PHYSICS
- G05—CONTROLLING; REGULATING
- G05B—CONTROL OR REGULATING SYSTEMS IN GENERAL; FUNCTIONAL ELEMENTS OF SUCH SYSTEMS; MONITORING OR TESTING ARRANGEMENTS FOR SUCH SYSTEMS OR ELEMENTS
- G05B19/00—Programme-control systems
- G05B19/02—Programme-control systems electric
- G05B19/418—Total factory control, i.e. centrally controlling a plurality of machines, e.g. direct or distributed numerical control [DNC], flexible manufacturing systems [FMS], integrated manufacturing systems [IMS], computer integrated manufacturing [CIM]
- G05B19/4183—Total factory control, i.e. centrally controlling a plurality of machines, e.g. direct or distributed numerical control [DNC], flexible manufacturing systems [FMS], integrated manufacturing systems [IMS], computer integrated manufacturing [CIM] characterised by data acquisition, e.g. workpiece identification
-
- G—PHYSICS
- G06—COMPUTING; CALCULATING OR COUNTING
- G06Q—INFORMATION AND COMMUNICATION TECHNOLOGY [ICT] SPECIALLY ADAPTED FOR ADMINISTRATIVE, COMMERCIAL, FINANCIAL, MANAGERIAL OR SUPERVISORY PURPOSES; SYSTEMS OR METHODS SPECIALLY ADAPTED FOR ADMINISTRATIVE, COMMERCIAL, FINANCIAL, MANAGERIAL OR SUPERVISORY PURPOSES, NOT OTHERWISE PROVIDED FOR
- G06Q10/00—Administration; Management
- G06Q10/06—Resources, workflows, human or project management; Enterprise or organisation planning; Enterprise or organisation modelling
- G06Q10/063—Operations research, analysis or management
- G06Q10/0639—Performance analysis of employees; Performance analysis of enterprise or organisation operations
- G06Q10/06395—Quality analysis or management
-
- G—PHYSICS
- G06—COMPUTING; CALCULATING OR COUNTING
- G06Q—INFORMATION AND COMMUNICATION TECHNOLOGY [ICT] SPECIALLY ADAPTED FOR ADMINISTRATIVE, COMMERCIAL, FINANCIAL, MANAGERIAL OR SUPERVISORY PURPOSES; SYSTEMS OR METHODS SPECIALLY ADAPTED FOR ADMINISTRATIVE, COMMERCIAL, FINANCIAL, MANAGERIAL OR SUPERVISORY PURPOSES, NOT OTHERWISE PROVIDED FOR
- G06Q50/00—Systems or methods specially adapted for specific business sectors, e.g. utilities or tourism
- G06Q50/04—Manufacturing
-
- H—ELECTRICITY
- H01—ELECTRIC ELEMENTS
- H01M—PROCESSES OR MEANS, e.g. BATTERIES, FOR THE DIRECT CONVERSION OF CHEMICAL ENERGY INTO ELECTRICAL ENERGY
- H01M10/00—Secondary cells; Manufacture thereof
- H01M10/42—Methods or arrangements for servicing or maintenance of secondary cells or secondary half-cells
- H01M10/48—Accumulators combined with arrangements for measuring, testing or indicating the condition of cells, e.g. the level or density of the electrolyte
- H01M10/488—Cells or batteries combined with indicating means for external visualization of the condition, e.g. by change of colour or of light density
-
- G—PHYSICS
- G06—COMPUTING; CALCULATING OR COUNTING
- G06F—ELECTRIC DIGITAL DATA PROCESSING
- G06F17/00—Digital computing or data processing equipment or methods, specially adapted for specific functions
- G06F17/10—Complex mathematical operations
- G06F17/14—Fourier, Walsh or analogous domain transformations, e.g. Laplace, Hilbert, Karhunen-Loeve, transforms
- G06F17/141—Discrete Fourier transforms
- G06F17/142—Fast Fourier transforms, e.g. using a Cooley-Tukey type algorithm
-
- H—ELECTRICITY
- H01—ELECTRIC ELEMENTS
- H01M—PROCESSES OR MEANS, e.g. BATTERIES, FOR THE DIRECT CONVERSION OF CHEMICAL ENERGY INTO ELECTRICAL ENERGY
- H01M10/00—Secondary cells; Manufacture thereof
- H01M10/05—Accumulators with non-aqueous electrolyte
- H01M10/052—Li-accumulators
- H01M10/0525—Rocking-chair batteries, i.e. batteries with lithium insertion or intercalation in both electrodes; Lithium-ion batteries
-
- Y—GENERAL TAGGING OF NEW TECHNOLOGICAL DEVELOPMENTS; GENERAL TAGGING OF CROSS-SECTIONAL TECHNOLOGIES SPANNING OVER SEVERAL SECTIONS OF THE IPC; TECHNICAL SUBJECTS COVERED BY FORMER USPC CROSS-REFERENCE ART COLLECTIONS [XRACs] AND DIGESTS
- Y02—TECHNOLOGIES OR APPLICATIONS FOR MITIGATION OR ADAPTATION AGAINST CLIMATE CHANGE
- Y02E—REDUCTION OF GREENHOUSE GAS [GHG] EMISSIONS, RELATED TO ENERGY GENERATION, TRANSMISSION OR DISTRIBUTION
- Y02E60/00—Enabling technologies; Technologies with a potential or indirect contribution to GHG emissions mitigation
- Y02E60/10—Energy storage using batteries
-
- Y—GENERAL TAGGING OF NEW TECHNOLOGICAL DEVELOPMENTS; GENERAL TAGGING OF CROSS-SECTIONAL TECHNOLOGIES SPANNING OVER SEVERAL SECTIONS OF THE IPC; TECHNICAL SUBJECTS COVERED BY FORMER USPC CROSS-REFERENCE ART COLLECTIONS [XRACs] AND DIGESTS
- Y02—TECHNOLOGIES OR APPLICATIONS FOR MITIGATION OR ADAPTATION AGAINST CLIMATE CHANGE
- Y02P—CLIMATE CHANGE MITIGATION TECHNOLOGIES IN THE PRODUCTION OR PROCESSING OF GOODS
- Y02P90/00—Enabling technologies with a potential contribution to greenhouse gas [GHG] emissions mitigation
- Y02P90/30—Computing systems specially adapted for manufacturing
Definitions
- the present invention relates to a method of quantifying and diagnosing the quality of a manufacturing facility.
- the secondary battery has attracted attention as a power source of an electric vehicle (EV), a hybrid electric vehicle (HEV), etc., which are proposed as a solution for air pollution of existing gasoline vehicles and diesel vehicles using fossil fuel.
- EV electric vehicle
- HEV hybrid electric vehicle
- the types of applications using the secondary battery are currently much diversified due to the advantages of the secondary battery, and it is expected that the secondary battery will be applied to many fields and products in the future.
- a method for diagnosing a quality of a manufacturing facility includes:
- the continuously obtaining the inspection values for the target product includes inspecting a specific factor of the target product and continuously acquiring the inspection values by comparing inspection results based on a reference value.
- the continuously obtaining the inspection values for the target product includes inspecting a specific factor of the target product
- the target product is an electrochemical device.
- the electrochemical device includes not only a unit cell such as a battery or a capacitor, but also a battery module or a battery pack.
- the electrochemical device is a secondary battery, for example, a lithium secondary battery.
- the deriving the conversion peak per frequency indicating the degree of expression per production cycle by separating the continuously obtained inspection values for each frequency band is performed by Fast Fourier Transform (FFT).
- FFT Fast Fourier Transform
- the securing the natural frequency for each production factor expressed per production cycle for each production factor includes deriving the each production factor that affects a production of the target product, and securing the natural frequency based on a number of expressions per production cycle for each production factor.
- the number of expressions per production cycle for each production factor is a result of extracting a frequency at which an inspection value for a specific factor of the target product deviates from a standard value due to an influence of the each production factor.
- each production factor is an equipment factor that is involved in the production of the target product.
- the equipment factor is an electrochemical device manufacturing equipment factor.
- the diagnosing the quality of each production factor includes selecting the production factor of a natural frequency corresponding to a frequency at which the conversion peak is high as a subject of quality improvement by comparing each conversion peak per frequency for each natural frequency for each pre-set production factor.
- the production factor of a natural frequency corresponding to a frequency at which a conversion peak is higher than a specific value is selected as a subject of quality improvement, and a production factor of a natural frequency corresponding to a frequency at which the conversion peak is lower than a specific value is excluded from the subject of quality improvement.
- the method of quantifying and diagnosing the quality of a manufacturing facility according to the present invention can quantify the quality of manufacturing facilities having a plurality of production factors and diagnose them at once.
- the present invention relates to a method of diagnosing the quality of a manufacturing facility, and the method includes:
- the step of securing the natural frequency expressed per production cycle for each production factor can be performed separately, regardless of before or after performing other steps.
- the natural frequency expressed per production cycle for each production factor may be secured in advance before performing the diagnostic method according to the present invention.
- the step of obtaining the continuous inspection values for the target product includes inspecting a specific factor of the target product and continuously acquiring the inspection values by comparing inspection results based on a reference value.
- an inspection value is continuously acquired for a target product. This means that the quality inspection of the target product is continuously performed at the middle or end of the production line. For example, the shape, size, or physical properties of the target product are continuously inspected, and this is constructed as data.
- the continuous acquisition of the inspection value includes performing a complete inspection on a target product or performing a sample test at regular intervals, but means that the process is performed at regular intervals.
- a specific element of the target product is inspected. If the inspection result exceeds the reference value, it is quantified as a positive (+) number, and if the inspection result is less than the reference value, it is quantified as a negative (-) number, and the quantified values are continuously acquired and performed.
- the method of obtaining the inspection value for the target product is not particularly limited as long as the result can be obtained as a quantified graph.
- an inspection value is obtained for a specific factor of a target product, for example, a thickness or a property value of a specific area.
- a reference value that can be identified as a normal product is set in advance, and a (+) or (-) sign is added to the delta value of the reference value and the inspection value of the target product for quantification.
- the target product is an electrochemical device.
- the electrochemical device includes not only a unit cell such as a battery or a capacitor, but also a battery module or a battery pack.
- the electrochemical device is a secondary battery, for example, a lithium secondary battery.
- a manufacturing facility subject to the present invention is a facility for manufacturing a secondary battery unit cell or a secondary battery module.
- the inspection values for the target product include, for example, battery size specifications, low or high temperature stability, charge/discharge capacity or charge/discharge cycle characteristics.
- the step of deriving the conversion peak per frequency indicating the degree of expression per production cycle by separating the continuously obtained inspection values for each frequency band is performed by Fast Fourier Transform (FFT).
- FFT Fast Fourier Transform
- the conversion technique can be applied in various ways.
- FFT is an algorithm that computes the Discrete Fourier Transform (DFT) or the inverse (IDFT) of a sequence. Fourier analysis transforms a signal from its original domain (often time or space) to a representation of the frequency domain, and vice versa.
- the Discrete Fourier Transform (DFT) is obtained by decomposing a series of values into components of different frequencies.
- a schematic description of the fast Fourier transform is as follows. However, the following description is only for a general understanding of the fast Fourier transform, and the present invention is not limited thereto. In addition, the fast Fourier transform can be explained through various papers, and the present invention includes all of them.
- Fast Fourier Transform is an algorithm that calculates an approximate value of a function, and is designed to reduce the number of operations when calculating a Discrete Fourier Transform using an approximation formula based on the Fourier transform.
- the fast Fourier transform became commonly known by J.W. Coli and J.W. Turkey in the mid-1960s, and has been independently discovered and used by several people for about 20 years before that.
- h n is called the inverse Fourier transform coefficient.
- the algorithm of Fast Fourier Transform is based on the fact that the calculation of Formula 1 can be performed by dividing the steps using direct product decomposition.
- N 2 that is, the operation of (N 1 N 2 ) 2 is required, but when using the direct product decomposition method, H n1,n2 can be calculated by the operation of N 1 N 2 (N 1 + N 2 ). Since the matrix corresponding to the above transformation is a direct product of the N 1 XN 1 and N 2 XN 2 matrices, the calculation is performed by dividing it into the following two steps.
- the step of securing the natural frequency for each production factor expressed per production cycle for each production factor includes deriving production factors that affect production of the target product, and securing a natural frequency based on the number of expressions per production cycle for each derived production factor.
- the number of expressions per production cycle for each production factor is a result of extracting a frequency at which an inspection value for a specific factor of the target product deviates from a standard value due to an influence of each production factor.
- the production factor is an equipment factor involved in the production of the target product.
- the equipment factor is an electrochemical device manufacturing equipment factor. In a facility for manufacturing a unit cell of a lithium secondary battery, for example, a raw material supply unit, various rollers, conveying belts, etc.
- the natural frequency expressed per production cycle for each of various production factors including the above-described production factors is secured.
- the step of diagnosing the quality of each production factor by comparing the natural frequency of each production factor and the conversion peak per frequency includes selecting a production factor of a natural frequency corresponding to a frequency at which the conversion peak is high as a subject of quality improvement by comparing each conversion peak per frequency for each natural frequency for each pre-set production factor.
- a production factor of a natural frequency corresponding to a frequency at which a conversion peak is higher than a specific value is selected as a subject of quality improvement, and a production factor of a natural frequency corresponding to a frequency at which the conversion peak is lower than a specific value is excluded from the subject of quality improvement.
- the method further includes a step of supplementing or replacing production factors selected as subjects of quality improvement.
- FIG. 1 is a schematic diagram schematically showing a manufacturing facility quality quantification diagnostic method according to the present invention.
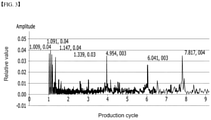
- FIG. 2 is a graph showing the results of obtaining continuous inspection values for a target product.
- FIG. 3 is a graph showing the result of deriving a conversion peak per frequency indicating the degree of expression per production cycle by separating inspection values continuously obtained for each frequency band.
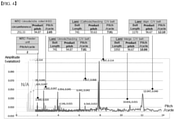
- FIG. 4 is a graph showing a result of comparing the natural frequency of each production factor and the conversion peak per frequency.
- a product inspection is first performed.
- the product inspection is a process of obtaining continuous product inspection values for a target product. For example, when manufacturing a unit cell of a secondary battery, a specific factor of a target product is inspected, and an inspection value is continuously obtained by comparing the inspection result value with the reference value.
- the specific factor of the target product may be selected from product quality evaluation items, and any one factor or a plurality of factors may be considered in combination.
- FIG. 2 a specific factor of a target product is continuously inspected and a product inspection value derived therefrom is shown.
- FIG. 1 the test values derived in the product inspection process are separated for each frequency band (see waves 1 to 3). Then, a conversion peak per frequency representing the degree of expression per production cycle is derived from the graph separated by frequency band.
- FIG. 3 is a result of deriving a conversion peak per frequency indicating the degree of expression per production cycle after separating the product inspection values derived in FIG. 2 for each frequency band through a fast Fourier transform.
- the production factor of the natural frequency corresponding to the frequency in which the conversion peak appears high is selected as a quality improvement target, compared to the conversion peak per frequency for each natural frequency of each production element.
- the result of comparing the natural frequency per production factor and the conversion peak per frequency can be confirmed.
- the natural frequencies of respective production factors expressed per production cycle for each production factor were secured in advance.
- the production factors include feeder unit, negative electrode idle roller, negative electrode feeding C/V belt, positive electrode feeding C/V belt, merge C/V belt, and align C/V belt.
- it is compared with the conversion peak per frequency, which represents the degree of expression per production cycle.
- the natural frequency expressed per production cycle was about 7.91, and the degree of expression was the highest.
- the natural frequency expressed per production cycle was about 2, and the degree of expression was very low. Therefore, in the facility of FIG. 4 , the positive electrode supply C/V belt is a subject of priority supplement, and the raw material supply unit is a subject of subsequent supplement.
- follow-up measures are taken to supplement or replace production factors selected for quality improvement.
Abstract
Description
- The present invention relates to a method of quantifying and diagnosing the quality of a manufacturing facility.
- This application claims the benefit of priority based on
Korean Patent Application No. 10-2019-0097050, filed on August 9, 2019 - Recently, secondary batteries capable of charging and discharging have been widely used as energy sources of wireless mobile devices. In addition, the secondary battery has attracted attention as a power source of an electric vehicle (EV), a hybrid electric vehicle (HEV), etc., which are proposed as a solution for air pollution of existing gasoline vehicles and diesel vehicles using fossil fuel.
- Therefore, the types of applications using the secondary battery are currently much diversified due to the advantages of the secondary battery, and it is expected that the secondary battery will be applied to many fields and products in the future.
- In small mobile devices, one or a small number of battery cells are used per device, whereas in medium-large-sized devices such as automobiles, due to the necessity of high power and large capacity, a medium-to-large battery module electrically connected to a plurality of battery cells is used.
- On the other hand, if the defect rate increases as a result of quality inspection for the manufactured secondary battery, diagnosis and supplementation of the above manufacturing facilities are required. However, equipment for manufacturing secondary batteries includes various production factors. Therefore, in order to identify the production factors that cause product defects, an overall diagnosis of the entire manufacturing facility is required. This causes a decrease in process efficiency for the secondary battery.
- It is an object of the present invention to solve the above-mentioned problems of the prior art and the technical problems required from the past. It is an object of the present invention to a method for quantifying and diagnosing the quality of a manufacturing facility having a plurality of production factors.
- In order to achieve the above object, a method for diagnosing a quality of a manufacturing facility according to the present invention includes:
- a step of obtaining continuous inspection values for a target product;
- continuously obtaining inspection values for a target product;
- deriving a conversion peak per frequency indicating a degree of expression per production cycle by separating the inspection values for each frequency band;
- securing a natural frequency for each production factor expressed per production cycle for each production factor; and
- diagnosing a quality of each production factor by comparing the natural frequency of each production factor and a conversion peak per frequency.
- In one example, in the method for diagnosing a quality of a manufacturing facility according to the present invention, the continuously obtaining the inspection values for the target product includes inspecting a specific factor of the target product and continuously acquiring the inspection values by comparing inspection results based on a reference value.
- Specifically, the continuously obtaining the inspection values for the target product includes inspecting a specific factor of the target product,
- wherein if an inspection result exceeds a reference value, the specific factor is quantified as a positive number, and
- wherein if the inspection result is less than the reference value, the specific factor is quantified as a negative number, and
- the continuously obtaining the inspection values for the target product continually obtains quantified numbers.
- For example, in the continuously obtaining the inspection values for the target product, the target product is an electrochemical device. In the present invention, the electrochemical device includes not only a unit cell such as a battery or a capacitor, but also a battery module or a battery pack. Specifically, the electrochemical device is a secondary battery, for example, a lithium secondary battery.
- In one example of the present invention, the deriving the conversion peak per frequency indicating the degree of expression per production cycle by separating the continuously obtained inspection values for each frequency band is performed by Fast Fourier Transform (FFT).
- In one example, the securing the natural frequency for each production factor expressed per production cycle for each production factor includes deriving the each production factor that affects a production of the target product, and securing the natural frequency based on a number of expressions per production cycle for each production factor.
- Specifically, the number of expressions per production cycle for each production factor is a result of extracting a frequency at which an inspection value for a specific factor of the target product deviates from a standard value due to an influence of the each production factor.
- Further, the each production factor is an equipment factor that is involved in the production of the target product. For example, the equipment factor is an electrochemical device manufacturing equipment factor.
- In one example, the diagnosing the quality of each production factor includes selecting the production factor of a natural frequency corresponding to a frequency at which the conversion peak is high as a subject of quality improvement by comparing each conversion peak per frequency for each natural frequency for each pre-set production factor.
- In another example, by comparing each conversion peak per frequency for each natural frequency for each pre-set production factor, the production factor of a natural frequency corresponding to a frequency at which a conversion peak is higher than a specific value is selected as a subject of quality improvement, and a production factor of a natural frequency corresponding to a frequency at which the conversion peak is lower than a specific value is excluded from the subject of quality improvement.
- In another example, after the diagnosing the quality of each production factor by comparing the natural frequency of each production factor and the conversion peak per frequency, further comprising:
supplementing or replacing production factors selected as subjects of quality improvement. - The method of quantifying and diagnosing the quality of a manufacturing facility according to the present invention can quantify the quality of manufacturing facilities having a plurality of production factors and diagnose them at once.
-
-
FIG. 1 is a schematic diagram schematically showing a method of quantifying and diagnosing the quality of a manufacturing facility according to an embodiment of the present invention. -
FIG. 2 is a graph showing the results of obtaining continuous inspection values for a target product. -
FIG. 3 is a graph showing the result of deriving a conversion peak per frequency indicating the degree of expression per production cycle by separating inspection values continuously obtained for each frequency band. -
FIG. 4 is a graph showing a result of comparing the natural frequency of each production factor and the conversion peak per frequency. - Hereinafter, the present invention will be described in detail with reference to the drawings. The terms and words used in the present specification and claims should not be construed as limited to ordinary or dictionary terms and the inventor may properly define the concept of the terms in order to best describe its invention. The terms and words should be construed as meaning and concept consistent with the technical idea of the present invention.
- The present invention relates to a method of diagnosing the quality of a manufacturing facility, and the method includes:
- a step of obtaining continuous inspection values for a target product;
- a step of deriving a conversion peak per frequency indicating a degree of expression per production cycle by separating the continuously obtained inspection values for each frequency band;
- a step of securing the natural frequency for each production factor expressed per production cycle for each production factor; and
- a step of diagnosing the quality of each production factor by comparing the natural frequency of each production factor and the conversion peak per frequency.
- In each of the above steps, the step of securing the natural frequency expressed per production cycle for each production factor can be performed separately, regardless of before or after performing other steps. For example, in the step of securing a natural frequency expressed per production cycle for each production factor, the natural frequency expressed per production cycle for each production factor may be secured in advance before performing the diagnostic method according to the present invention.
- In one example, in the method for diagnosing a quality of a manufacturing facility according to the present invention, the step of obtaining the continuous inspection values for the target product includes inspecting a specific factor of the target product and continuously acquiring the inspection values by comparing inspection results based on a reference value. In the present invention, an inspection value is continuously acquired for a target product. This means that the quality inspection of the target product is continuously performed at the middle or end of the production line. For example, the shape, size, or physical properties of the target product are continuously inspected, and this is constructed as data. In the present invention, the continuous acquisition of the inspection value includes performing a complete inspection on a target product or performing a sample test at regular intervals, but means that the process is performed at regular intervals.
- Specifically, in the step of acquiring continuous inspection values for the target product, a specific element of the target product is inspected. If the inspection result exceeds the reference value, it is quantified as a positive (+) number, and if the inspection result is less than the reference value, it is quantified as a negative (-) number, and the quantified values are continuously acquired and performed. The method of obtaining the inspection value for the target product is not particularly limited as long as the result can be obtained as a quantified graph. As an example, an inspection value is obtained for a specific factor of a target product, for example, a thickness or a property value of a specific area. In this case, a reference value that can be identified as a normal product is set in advance, and a (+) or (-) sign is added to the delta value of the reference value and the inspection value of the target product for quantification.
- In the step of acquiring continuous inspection values for the target product, the target product is an electrochemical device. In the present invention, the electrochemical device includes not only a unit cell such as a battery or a capacitor, but also a battery module or a battery pack. Specifically, the electrochemical device is a secondary battery, for example, a lithium secondary battery. In one example, a manufacturing facility subject to the present invention is a facility for manufacturing a secondary battery unit cell or a secondary battery module. At this time, the inspection values for the target product include, for example, battery size specifications, low or high temperature stability, charge/discharge capacity or charge/discharge cycle characteristics.
- In one example, the step of deriving the conversion peak per frequency indicating the degree of expression per production cycle by separating the continuously obtained inspection values for each frequency band is performed by Fast Fourier Transform (FFT). In the present invention, as long as separation from a graph representing continuously acquired inspection values is possible, the conversion technique can be applied in various ways. As an example, Fast Fourier Transform (FFT) is an algorithm that computes the Discrete Fourier Transform (DFT) or the inverse (IDFT) of a sequence. Fourier analysis transforms a signal from its original domain (often time or space) to a representation of the frequency domain, and vice versa. The Discrete Fourier Transform (DFT) is obtained by decomposing a series of values into components of different frequencies.
- A schematic description of the fast Fourier transform is as follows. However, the following description is only for a general understanding of the fast Fourier transform, and the present invention is not limited thereto. In addition, the fast Fourier transform can be explained through various papers, and the present invention includes all of them.
- Fast Fourier Transform is an algorithm that calculates an approximate value of a function, and is designed to reduce the number of operations when calculating a Discrete Fourier Transform using an approximation formula based on the Fourier transform.
- The fast Fourier transform became commonly known by J.W. Coli and J.W. Turkey in the mid-1960s, and has been independently discovered and used by several people for about 20 years before that.
- For example, when hm(0≤m≤N-1) is a set of complex numbers, the discrete Fourier transform of the sequence {hm} is as follows.

- In the same way as in the continuous Fourier transform, the inverse transform can be obtained for the discrete transform as follows.

- hn is called the inverse Fourier transform coefficient. The algorithm of Fast Fourier Transform is based on the fact that the calculation of
Formula 1 can be performed by dividing the steps using direct product decomposition. - When N=N1N2 and N1 and N2 are relative prime, a two-dimensional Fourier transform coefficient is taken as an example as follows.

- If one complex multiplication and complex addition are used as one basic operation, when using Horner's method, N2, that is, the operation of (N1N2)2 is required, but when using the direct product decomposition method, Hn1,n2 can be calculated by the operation of N1N2(N1 + N2). Since the matrix corresponding to the above transformation is a direct product of the N1XN1 and N2XN2 matrices, the calculation is performed by dividing it into the following two steps.
- As a first step, for 0≤m1≤N1-1 and 0≤n2≤N2-1,

- Then, for 0≤n1≤N1-1 and 0≤n2≤N2-1,

- In one example, the step of securing the natural frequency for each production factor expressed per production cycle for each production factor includes deriving production factors that affect production of the target product, and securing a natural frequency based on the number of expressions per production cycle for each derived production factor. Specifically, the number of expressions per production cycle for each production factor is a result of extracting a frequency at which an inspection value for a specific factor of the target product deviates from a standard value due to an influence of each production factor. Further, the production factor is an equipment factor involved in the production of the target product. For example, the equipment factor is an electrochemical device manufacturing equipment factor. In a facility for manufacturing a unit cell of a lithium secondary battery, for example, a raw material supply unit, various rollers, conveying belts, etc. are respective production factors, and these influence the production of the target product. Some of these production factors cause defects in certain parts of the product with frequent and short cycles, within a given repetition period. Another factor of production causes defects in certain parts of the product with relatively few times and long cycles. In the step of securing the natural frequency according to the present invention, the natural frequency expressed per production cycle for each of various production factors including the above-described production factors is secured.
- In one example, the step of diagnosing the quality of each production factor by comparing the natural frequency of each production factor and the conversion peak per frequency includes selecting a production factor of a natural frequency corresponding to a frequency at which the conversion peak is high as a subject of quality improvement by comparing each conversion peak per frequency for each natural frequency for each pre-set production factor. In another example, by comparing each conversion peak per frequency for each natural frequency for each pre-set production factor, a production factor of a natural frequency corresponding to a frequency at which a conversion peak is higher than a specific value is selected as a subject of quality improvement, and a production factor of a natural frequency corresponding to a frequency at which the conversion peak is lower than a specific value is excluded from the subject of quality improvement. Further, in the present invention, after the step of diagnosing the quality of each production factor by comparing the natural frequency of each production factor and the conversion peak per frequency, the method further includes a step of supplementing or replacing production factors selected as subjects of quality improvement.
- Hereinafter, the present invention will be described in more detail through drawings and the like, but this is only a specific example of the present invention, and the scope of the present invention is not limited thereto.
-
FIG. 1 is a schematic diagram schematically showing a manufacturing facility quality quantification diagnostic method according to the present invention.FIG. 2 is a graph showing the results of obtaining continuous inspection values for a target product.FIG. 3 is a graph showing the result of deriving a conversion peak per frequency indicating the degree of expression per production cycle by separating inspection values continuously obtained for each frequency band. In addition,FIG. 4 is a graph showing a result of comparing the natural frequency of each production factor and the conversion peak per frequency. - In
FIG. 1 , a product inspection is first performed. The product inspection is a process of obtaining continuous product inspection values for a target product. For example, when manufacturing a unit cell of a secondary battery, a specific factor of a target product is inspected, and an inspection value is continuously obtained by comparing the inspection result value with the reference value. Here, the specific factor of the target product may be selected from product quality evaluation items, and any one factor or a plurality of factors may be considered in combination. Referring toFIG. 2 , a specific factor of a target product is continuously inspected and a product inspection value derived therefrom is shown. - Then, frequency analysis is performed on the obtained product inspection results. In this case, successively obtained inspection values are separated for each frequency band by using a fast Fourier transform or the like, and a conversion peak per frequency representing the degree of expression per production cycle is derived therefrom. Referring to
FIG. 1 , the test values derived in the product inspection process are separated for each frequency band (seewaves 1 to 3). Then, a conversion peak per frequency representing the degree of expression per production cycle is derived from the graph separated by frequency band.FIG. 3 is a result of deriving a conversion peak per frequency indicating the degree of expression per production cycle after separating the product inspection values derived inFIG. 2 for each frequency band through a fast Fourier transform. - Next, it goes through a process of matching with the natural frequency of each unit. This is a step of diagnosing the quality of each production factor by comparing the natural frequency of each production factor and the conversion peak per frequency. In this case, the production factor of the natural frequency corresponding to the frequency in which the conversion peak appears high is selected as a quality improvement target, compared to the conversion peak per frequency for each natural frequency of each production element.
- Referring to
FIG. 4 , the result of comparing the natural frequency per production factor and the conversion peak per frequency can be confirmed. In a production facility that manufactures a unit cell of a secondary battery, the natural frequencies of respective production factors expressed per production cycle for each production factor were secured in advance. Herein, examples of the production factors include feeder unit, negative electrode idle roller, negative electrode feeding C/V belt, positive electrode feeding C/V belt, merge C/V belt, and align C/V belt. And, it is compared with the conversion peak per frequency, which represents the degree of expression per production cycle. - Referring to the results of
FIG. 4 , in the case of the positive electrode feeding C/V belt (cathode feeding C/V belt), the natural frequency expressed per production cycle was about 7.91, and the degree of expression was the highest. On the contrary, in the case of the feeder unit, it was confirmed that the natural frequency expressed per production cycle was about 2, and the degree of expression was very low. Therefore, in the facility ofFIG. 4 , the positive electrode supply C/V belt is a subject of priority supplement, and the raw material supply unit is a subject of subsequent supplement. Follow-up measures are taken to supplement or replace production factors selected for quality improvement.
Claims (12)
- A method for diagnosing a quality of a manufacturing facility, comprising:continuously obtaining inspection values for a target product;deriving a conversion peak per frequency indicating a degree of expression per production cycle by separating the inspection values for each frequency band;securing a natural frequency for each production factor expressed per production cycle for each production factor; anddiagnosing a quality of each production factor by comparing the natural frequency of each production factor and a conversion peak per frequency.
- The method of claim 1, wherein the continuously obtaining the inspection values for the target product includes inspecting a specific factor of the target product and continuously acquiring the inspection values by comparing inspection results based on a reference value.
- The method of claim 1, wherein the continuously obtaining the inspection values for the target product includes inspecting a specific factor of the target product,wherein if an inspection result exceeds a reference value, the specific factor is quantified as a positive number, andwherein if the inspection result is less than the reference value, the specific factor is quantified as a negative number, andthe continuously obtaining the inspection values for the target product continually obtains quantified numbers.
- The method of claim 1, wherein in the continuously obtaining the inspection values for the target product, the target product is an electrochemical device.
- The method of claim 1, wherein the deriving the conversion peak per frequency indicating the degree of expression per production cycle by separating the continuously obtained inspection values for each frequency band is performed by Fast Fourier Transform (FFT).
- The method of claim 1, wherein the securing the natural frequency for each production factor expressed per production cycle for each production factor includes deriving the each production factor that affects a production of the target product, and securing the natural frequency based on a number of expressions per production cycle for each production factor.
- The method of claim 6, wherein the number of expressions per production cycle for each production factor is a result of extracting a frequency at which an inspection value for a specific factor of the target product deviates from a standard value due to an influence of the each production factor.
- The method of claim 1, wherein the each production factor is an equipment factor that is involved in the production of the target product.
- The method of claim 8, wherein the equipment factor is an electrochemical device manufacturing equipment factor.
- The method of claim 1, wherein the diagnosing the quality of each production factor includes selecting the production factor of a natural frequency corresponding to a frequency at which the conversion peak is high as a subject of quality improvement by comparing each conversion peak per frequency for each natural frequency for each pre-set production factor.
- The method of claim 1, wherein, by comparing each conversion peak per frequency for each natural frequency for each pre-set production factor, the production factor of a natural frequency corresponding to a frequency at which a conversion peak is higher than a specific value is selected as a subject of quality improvement, and a production factor of a natural frequency corresponding to a frequency at which the conversion peak is lower than a specific value is excluded from the subject of quality improvement.
- The method of claim 1, after the diagnosing the quality of each production factor by comparing the natural frequency of each production factor and the conversion peak per frequency, further comprising:
supplementing or replacing production factors selected as subjects of quality improvement.
Applications Claiming Priority (2)
| Application Number | Priority Date | Filing Date | Title |
|---|---|---|---|
| KR1020190097050A KR20210017577A (en) | 2019-08-09 | 2019-08-09 | Quantitatively diagnosis method for manufacturing facility |
| PCT/KR2020/010190 WO2021029583A1 (en) | 2019-08-09 | 2020-08-03 | Quantitative diagnostic method for quality of manufacturing equipment |
Publications (2)
| Publication Number | Publication Date |
|---|---|
| EP3961204A1 true EP3961204A1 (en) | 2022-03-02 |
| EP3961204A4 EP3961204A4 (en) | 2022-07-06 |
Family
ID=74571094
Family Applications (1)
| Application Number | Title | Priority Date | Filing Date |
|---|---|---|---|
| EP20851856.3A Pending EP3961204A4 (en) | 2019-08-09 | 2020-08-03 | Quantitative diagnostic method for quality of manufacturing equipment |
Country Status (6)
| Country | Link |
|---|---|
| US (1) | US20220244714A1 (en) |
| EP (1) | EP3961204A4 (en) |
| JP (1) | JP7334275B2 (en) |
| KR (1) | KR20210017577A (en) |
| CN (1) | CN113939745A (en) |
| WO (1) | WO2021029583A1 (en) |
Family Cites Families (33)
| Publication number | Priority date | Publication date | Assignee | Title |
|---|---|---|---|---|
| JP3161921B2 (en) * | 1994-10-27 | 2001-04-25 | ファナック株式会社 | Product quality influence factor analysis method and equipment, molding condition adjustment method, product quality judgment item selection method |
| JPH10209230A (en) * | 1997-01-23 | 1998-08-07 | Hitachi Ltd | Method and device for fault analysis |
| JP3397726B2 (en) * | 1999-07-14 | 2003-04-21 | 株式会社日立製作所 | Rolling mill abnormality diagnosis method and apparatus |
| DE19946787A1 (en) * | 1999-09-29 | 2001-04-05 | Focke & Co | Method and device for diagnosing machines |
| JP2002297217A (en) * | 2001-03-29 | 2002-10-11 | Japan Institute Of Plant Maintenance | Quality management method in manufacture task, quality management supporting system and trend management program |
| JP4348177B2 (en) * | 2002-11-20 | 2009-10-21 | ポスココーポレーションリミテッド | Finishing rolling abnormality diagnosis device and method |
| JP2005195422A (en) * | 2004-01-06 | 2005-07-21 | Ho Jinyama | Facility diagnostic apparatus |
| JP3874012B2 (en) * | 2004-05-18 | 2007-01-31 | オムロン株式会社 | Knowledge creation support apparatus and display method |
| JP2006113002A (en) * | 2004-10-18 | 2006-04-27 | Nsk Ltd | Anomaly diagnosis system for mechanical equipment |
| JP5412245B2 (en) * | 2009-11-09 | 2014-02-12 | 株式会社日立製作所 | Diagnostic system and diagnostic method for lithium ion secondary battery |
| KR101159233B1 (en) * | 2010-12-24 | 2012-06-25 | 삼성중공업 주식회사 | System and method for stability diagnosis of machine using vibration |
| DE102011006786B4 (en) * | 2011-04-05 | 2013-04-11 | Siemens Aktiengesellschaft | Product sensor, product with product sensor, system and method for communication between product sensor and system |
| JP5663441B2 (en) * | 2011-09-14 | 2015-02-04 | 東芝三菱電機産業システム株式会社 | Square battery outer shape measuring device |
| JP5772546B2 (en) * | 2011-11-28 | 2015-09-02 | 新日鐵住金株式会社 | Operation quality prediction device, operation quality prediction method, computer program, and computer-readable storage medium |
| JP5838896B2 (en) * | 2012-04-13 | 2016-01-06 | 新日鐵住金株式会社 | Data analysis support device, data analysis support method, computer program, and computer-readable storage medium |
| KR101416400B1 (en) * | 2012-12-11 | 2014-08-07 | 현대자동차 주식회사 | Method and apparatus for diagnosing fault of fuel cell stack |
| CN103606012B (en) * | 2013-09-30 | 2017-01-11 | 北京理工大学 | Method and device for reconfiguration scale selection of reconfigurable manufacture system |
| JP6244260B2 (en) * | 2014-05-08 | 2017-12-06 | 株式会社神戸製鋼所 | Defect analysis apparatus and defect analysis method |
| KR101663820B1 (en) * | 2014-12-26 | 2016-10-10 | 주식회사 아이티매직 | Method and apparatus of machine diagnosis using sound signal |
| WO2016189536A1 (en) * | 2015-05-26 | 2016-12-01 | Aspect Ai Ltd. | Apparatus and method for quality detection of a processed product |
| JP2017059640A (en) * | 2015-09-15 | 2017-03-23 | ルネサスエレクトロニクス株式会社 | Semiconductor device manufacturing method |
| JP6365526B2 (en) * | 2015-12-28 | 2018-08-01 | Jfeスチール株式会社 | Bearing deterioration detection method and bearing deterioration detection device for small diameter roll |
| DE102016012451A1 (en) * | 2016-10-18 | 2018-01-04 | Daimler Ag | Method for monitoring, analyzing and operating at least one production facility |
| CN109996615B (en) * | 2016-11-28 | 2020-07-07 | 东芝三菱电机产业系统株式会社 | Abnormality diagnosis method and apparatus for rolling equipment |
| KR20180063927A (en) * | 2016-12-02 | 2018-06-14 | 주식회사 나루이엠에스 | Automated Ultra Sonic Inspection System |
| FR3061171B1 (en) | 2016-12-23 | 2020-11-13 | Saint Gobain | IMPROVED FLOAT GLASS MANUFACTURING PROCESS |
| JP6865927B2 (en) | 2017-01-16 | 2021-04-28 | 株式会社Kjtd | Inspection equipment, inspection methods, inspection programs, storage media, and inspection systems |
| CN107194826A (en) * | 2017-06-16 | 2017-09-22 | 北京航空航天大学 | A kind of manufacture system Gernral Check-up and Forecasting Methodology based on quality state Task Network |
| KR102120756B1 (en) | 2017-06-23 | 2020-06-09 | 퓨처메인 주식회사 | Automatic diagnosis method for rotating machinery using real-time vibration analysis |
| WO2019016892A1 (en) * | 2017-07-19 | 2019-01-24 | 三菱電機株式会社 | Quality analysis device and quality analysis method |
| JP6896590B2 (en) * | 2017-11-08 | 2021-06-30 | 三菱重工航空エンジン株式会社 | Predictive model maintenance system, predictive model maintenance method and predictive model maintenance program |
| US11143630B2 (en) * | 2018-05-08 | 2021-10-12 | Vibrant Corporation | Resonance inspection of manufactured parts with witness coupon testing |
| CN111553178A (en) * | 2019-02-12 | 2020-08-18 | 斯凯孚公司 | Intelligent identification method for vibration characteristics of rotating machinery |
-
2019
- 2019-08-09 KR KR1020190097050A patent/KR20210017577A/en unknown
-
2020
- 2020-08-03 JP JP2021571727A patent/JP7334275B2/en active Active
- 2020-08-03 EP EP20851856.3A patent/EP3961204A4/en active Pending
- 2020-08-03 US US17/612,434 patent/US20220244714A1/en active Pending
- 2020-08-03 CN CN202080039745.2A patent/CN113939745A/en active Pending
- 2020-08-03 WO PCT/KR2020/010190 patent/WO2021029583A1/en unknown
Also Published As
| Publication number | Publication date |
|---|---|
| KR20210017577A (en) | 2021-02-17 |
| WO2021029583A1 (en) | 2021-02-18 |
| JP2022535069A (en) | 2022-08-04 |
| US20220244714A1 (en) | 2022-08-04 |
| JP7334275B2 (en) | 2023-08-28 |
| EP3961204A4 (en) | 2022-07-06 |
| CN113939745A (en) | 2022-01-14 |
Similar Documents
| Publication | Publication Date | Title |
|---|---|---|
| CN111426955B (en) | Lithium ion battery fault diagnosis method | |
| US11221372B2 (en) | Battery performance evaluation device, and battery performance evaluation method | |
| Xu et al. | Improving the state of charge estimation of reused lithium-ion batteries by abating hysteresis using machine learning technique | |
| US10677848B2 (en) | Apparatus, circuit model, and method for battery modelling | |
| CN109765496A (en) | A kind of cell health state estimation method based on online electrochemical impedance spectrometry | |
| CN112834945A (en) | Evaluation model establishing method, battery health state evaluation method and related product | |
| Stock et al. | Early quality classification and prediction of battery cycle life in production using machine learning | |
| DE102012208509A1 (en) | Apparatus for determining a state quantity of a cell for converting chemical energy into electrical energy, cell, cell module and method for determining a state quantity of a cell | |
| CN109613446B (en) | Lithium battery aging detection method based on time series analysis | |
| CN110161421A (en) | A kind of method of battery impedance within the scope of on-line reorganization setpoint frequency | |
| US20150338471A1 (en) | Reconstructed battery pack applicability determination method for used secondary battery, and reconstruction method for reconstructed battery pack | |
| CN110323508B (en) | Recovery system and method for power battery in electric automobile | |
| CN110703112A (en) | Online estimation method of battery pack state based on local charging data | |
| EP3961204A1 (en) | Quantitative diagnostic method for quality of manufacturing equipment | |
| Ipek et al. | A novel method for SOC estimation of Li-ion batteries using a hybrid machinelearning technique | |
| CN113391229A (en) | Performance evaluation method, equipment and system for retired power battery | |
| US11366168B2 (en) | Battery information processing system, battery information processing method, and battery assembly and method of manufacturing battery assembly | |
| Lucu et al. | Data-driven nonparametric Li-ion battery ageing model aiming at learning from real operation data: Holistic validation with ev driving profiles | |
| Zhou et al. | Lithium-ion battery cell open circuit fault diagnostics: Methods, analysis, and comparison | |
| US20220397611A1 (en) | Battery capacity estimation method and battery capacity estimation system | |
| WO2023052521A1 (en) | Determination of an ageing value for batteries with current-voltage time series in time domain and load domain | |
| DE102018108184A1 (en) | Method and device for determining the state of a rechargeable battery and computer program | |
| Kim et al. | Efficient on-board health monitoring for multicell lithium-ion battery systems using Gaussian process clustering | |
| CN113391214A (en) | Battery micro-fault diagnosis method based on battery charging voltage ranking change | |
| CN117420448B (en) | Method and system for online evaluation of consistency of cell formation |
Legal Events
| Date | Code | Title | Description |
|---|---|---|---|
| STAA | Information on the status of an ep patent application or granted ep patent |
Free format text: STATUS: THE INTERNATIONAL PUBLICATION HAS BEEN MADE |
|
| PUAI | Public reference made under article 153(3) epc to a published international application that has entered the european phase |
Free format text: ORIGINAL CODE: 0009012 |
|
| STAA | Information on the status of an ep patent application or granted ep patent |
Free format text: STATUS: REQUEST FOR EXAMINATION WAS MADE |
|
| 17P | Request for examination filed |
Effective date: 20211125 |
|
| AK | Designated contracting states |
Kind code of ref document: A1 Designated state(s): AL AT BE BG CH CY CZ DE DK EE ES FI FR GB GR HR HU IE IS IT LI LT LU LV MC MK MT NL NO PL PT RO RS SE SI SK SM TR |
|
| RAP3 | Party data changed (applicant data changed or rights of an application transferred) |
Owner name: LG ENERGY SOLUTION, LTD. |
|
| A4 | Supplementary search report drawn up and despatched |
Effective date: 20220609 |
|
| RIC1 | Information provided on ipc code assigned before grant |
Ipc: G01N 29/09 20060101ALI20220602BHEP Ipc: G01H 15/00 20060101ALI20220602BHEP Ipc: G06Q 50/04 20120101ALI20220602BHEP Ipc: H01M 10/48 20060101ALI20220602BHEP Ipc: G06F 17/10 20060101ALI20220602BHEP Ipc: G01H 17/00 20060101ALI20220602BHEP Ipc: G01N 29/04 20060101AFI20220602BHEP |
|
| DAV | Request for validation of the european patent (deleted) | ||
| DAX | Request for extension of the european patent (deleted) | ||
| STAA | Information on the status of an ep patent application or granted ep patent |
Free format text: STATUS: EXAMINATION IS IN PROGRESS |
|
| 17Q | First examination report despatched |
Effective date: 20230901 |
|
| GRAP | Despatch of communication of intention to grant a patent |
Free format text: ORIGINAL CODE: EPIDOSNIGR1 |
|
| STAA | Information on the status of an ep patent application or granted ep patent |
Free format text: STATUS: GRANT OF PATENT IS INTENDED |
|
| RIC1 | Information provided on ipc code assigned before grant |
Ipc: G01N 29/09 20060101ALI20240119BHEP Ipc: H01M 10/0525 20100101ALI20240119BHEP Ipc: G06Q 10/0639 20230101ALI20240119BHEP Ipc: G01H 13/00 20060101ALI20240119BHEP Ipc: G01H 15/00 20060101ALI20240119BHEP Ipc: H01M 10/48 20060101ALI20240119BHEP Ipc: G06Q 50/04 20120101ALI20240119BHEP Ipc: G06F 17/10 20060101ALI20240119BHEP Ipc: G01H 17/00 20060101ALI20240119BHEP Ipc: G01N 29/04 20060101AFI20240119BHEP |
|
| INTG | Intention to grant announced |
Effective date: 20240212 |
|
| P01 | Opt-out of the competence of the unified patent court (upc) registered |
Effective date: 20240301 |