EP3766416B1 - Mapping atrial fibrillation using fragmentation index - Google Patents
Mapping atrial fibrillation using fragmentation index Download PDFInfo
- Publication number
- EP3766416B1 EP3766416B1 EP20185867.7A EP20185867A EP3766416B1 EP 3766416 B1 EP3766416 B1 EP 3766416B1 EP 20185867 A EP20185867 A EP 20185867A EP 3766416 B1 EP3766416 B1 EP 3766416B1
- Authority
- EP
- European Patent Office
- Prior art keywords
- peaks
- processor
- fragmentation
- local
- additional
- Prior art date
- Legal status (The legal status is an assumption and is not a legal conclusion. Google has not performed a legal analysis and makes no representation as to the accuracy of the status listed.)
- Active
Links
Images


Classifications
-
- A—HUMAN NECESSITIES
- A61—MEDICAL OR VETERINARY SCIENCE; HYGIENE
- A61B—DIAGNOSIS; SURGERY; IDENTIFICATION
- A61B5/00—Measuring for diagnostic purposes; Identification of persons
- A61B5/24—Detecting, measuring or recording bioelectric or biomagnetic signals of the body or parts thereof
- A61B5/316—Modalities, i.e. specific diagnostic methods
- A61B5/318—Heart-related electrical modalities, e.g. electrocardiography [ECG]
- A61B5/346—Analysis of electrocardiograms
- A61B5/349—Detecting specific parameters of the electrocardiograph cycle
- A61B5/361—Detecting fibrillation
-
- A—HUMAN NECESSITIES
- A61—MEDICAL OR VETERINARY SCIENCE; HYGIENE
- A61B—DIAGNOSIS; SURGERY; IDENTIFICATION
- A61B5/00—Measuring for diagnostic purposes; Identification of persons
- A61B5/24—Detecting, measuring or recording bioelectric or biomagnetic signals of the body or parts thereof
- A61B5/316—Modalities, i.e. specific diagnostic methods
- A61B5/318—Heart-related electrical modalities, e.g. electrocardiography [ECG]
- A61B5/339—Displays specially adapted therefor
- A61B5/343—Potential distribution indication
-
- A—HUMAN NECESSITIES
- A61—MEDICAL OR VETERINARY SCIENCE; HYGIENE
- A61B—DIAGNOSIS; SURGERY; IDENTIFICATION
- A61B5/00—Measuring for diagnostic purposes; Identification of persons
- A61B5/24—Detecting, measuring or recording bioelectric or biomagnetic signals of the body or parts thereof
- A61B5/316—Modalities, i.e. specific diagnostic methods
- A61B5/318—Heart-related electrical modalities, e.g. electrocardiography [ECG]
- A61B5/367—Electrophysiological study [EPS], e.g. electrical activation mapping or electro-anatomical mapping
Definitions
- the present invention relates generally to electrophysiological mapping, and particularly to methods, systems and processor-readable media for mapping atrial fibrillation using a fragmentation index.
- Atrial fibrillation is an irregular heart rhythm generated in the atria.
- Various techniques for mapping atrial fibrillation are known in the art.
- U.S. Patent Application Publication 2017/0367601 describes a method for identifying areas of the heart of a patient able to be involved in the perpetuation of atrial fibrillation. This method takes into account the reference cycle of the arrhythmia and has two variants: a local variant in which the areas of the heart are each analyzed separately and a regional variant in which several areas of the heart are analyzed together.
- U.S. Patent Application Publication 2015/0359430 describes a method of medical image processing for images of body structures, the method comprising: receiving anatomical data to reconstruct an anatomical image of a region of a body of a patient, said region comprises a portion of at least one internal body part which borders or is spaced apart from a target tissue; receiving functional data from a functional imaging modality which images at least said portion of the region of the body of the patient; processing said anatomical image to generate at least one image mask corresponding to the zone outside of the wall of said at least one internal body part; correlating the at least one generated image mask with the functional data for guiding a reconstruction of a functional image depicting said target tissue; and providing the reconstructed functional image.
- U.S. Patent Application Publication 2012/0078129 describes a method of displaying an image of the location of one or more low voltage structures in tissue.
- the method includes receiving electrical mapping data corresponding to a portion of the tissue, and generating an image using the electrical mapping data. Electrical mapping values within at least one voltage range having two endpoints that bound the upper and lower limits of the voltage range are distinguishable from electrical mapping values outside the at least one voltage range. The two endpoints are selected to distinguish the one or more low voltage structures of the tissue from other portions of the tissue.
- EP2851002A1 discloses a monitoring device for monitoring and evaluating electrogram signals representing electric activities of a heart chamber, said monitoring device comprising a signal input operatively connected to a mapping catheter and a signal processing and evaluation unit for processing and evaluating electrogram signals received at the signal input.
- the morphology of a detection complex is characterised by the evaluation device, including on the basis of the number of local peaks in the deflection complex.
- WO2010054409A1 discloses a method for visualization of electrical activity on a surface of an organ over a time period, including morphological analysis of complex fractionated electrograms.
- an embodiment of the present invention that is described herein provides a computer-implemented method for visualizing a map of atrial fibrillation (AF) in a heart, as specified in appended claim 1.
- the heart has a region that includes (i) the given position located at a given distance from a predefined location of the region, and (ii) at least an additional position having an additional FI and located at an additional distance from the predefined location, and the method includes calculating and visualizing, based on the given distance and the additional distance, and based on the local FI and the additional FI, a regional FI of the region.
- the predefined location includes a geometrical center of gravity (COG) of the region
- calculating and visualizing the regional FI includes calculating, based on the given distance and the additional distance, a weighted average of at least the local FI and the additional FI.
- COG geometrical center of gravity
- the method includes defining a window of interest (WOI) within the CL, and identifying the one or more secondary peaks within the WOI.
- the EGM signal includes multiple CLs, and calculating the local FI includes calculating, based on the multiple CLs, an average CL, and calculating an average number of the secondary peaks per the average CL.
- AF atrial fibrillation
- Some medical procedures are based on measuring electrogram (EGM) signals by disposing a plurality of electrodes at different respective sites on the cardiac tissue.
- EGM electrogram
- a physician may use the EGM signals to characterize the propagation of the wavefront of electrical activation through the cardiac tissue of a patient during a cardiac cycle. For each of the EGM signals, the physician may attempt to identify electrical activation points that correspond to an instance at which the wavefront passed through the site at which the signal was acquired.
- AF heart atrial fibrillation
- EGM signals typically contain regularly-spaced and sharp primary peaks that clearly indicate electrical activations.
- irregular EGMs may exhibit a wide variety of different forms, and may comprise numerous bursts of secondary peaks that are typically not indicative of regular electrical activation.
- Embodiments of the present invention that are described hereinbelow provide methods and systems for mapping AF by calculating local and regional fragmentation indexes (FIs), and visualizing the FIs on a map of a patient heart.
- a system for mapping AF in a patient heart comprises a processor and a display.
- the processor is configured to receive, from a catheter inserted into a patient heart, an EGM signal that exhibits the AF and acquired at a given position in the heart.
- the processor is further configured to identify, in the EGM signal, two or more primary activation peaks, also referred to herein as annotations, and to calculate a cycle length (CL) between adjacent annotations.
- the processor is further configured to hold predefined criteria for identifying a regular atrial fibrillation cycle length (AFCL), such as but not limited to, a cycle length between 120 ms (referred to herein as short AFCLs) and 250 ms (referred to herein as long AFCLs) having a standard deviation smaller than 30 ms.
- AFCL regular atrial fibrillation cycle length
- the processor is configured to define a window of interest (WOI) within the AFCL, and to identify within the WOI, one or more secondary activation peaks, also referred to herein as fragmentation peaks.
- the processor calculates at the given position, a local fragmentation index (FI) that is indicative of an average number of the fragmentation peaks per WOI.
- WOI window of interest
- FI local fragmentation index
- the processor is configured to merge, based on a predefined threshold and criteria, two or more adjacent fragmentation peaks.
- the EGM signal comprises multiple AFCLs
- the processor is configured to calculate, based on the multiple AFCLs, an average AFCL, and to calculate an average number of the fragmentation peaks per the average AFCL.
- the display is configured to display the calculated and visualized local FI on a map of at least part of the heart.
- a region of patient heart contains the given position, which is located at a given distance from a geometrical center-of-gravity (COG) of the region.
- the region additionally comprises multiple positions located at respective distances from the COG.
- the processor is configured to acquire, using the catheter, additional EGM signals at the additional respective positions, and to calculate, for each of the additional positions, a respective additional FI.
- the processor is configured to calculate, based on the given distance and the additional distances, and based on the local FI and the additional FIs, a regional FI of the region.
- the processor is further configured to output, to the display, a visualization of the regional FI and the AFCLs.
- the display is configured to display the calculated and visualized regional FI on a map of the heart showing at least the aforementioned region, and to display the short and the long AFCLs, overlaid on the regional FIs.
- the processor is configured to display, on the heart map, important regions, such as regions having short AFCLs and large regional FI.
- the disclosed techniques provide the physician with the features of detection and display of regions suspected to have irregular activation.
- the physician may apply ablation in one or more of the suspected regions, in order to reduce the arrhythmia in the patient heart.
- Fig. 1 is a schematic, pictorial illustration of a system 21 for annotating an electrogram (EGM) signal 22.
- EMM electrogram
- a physician 27 inserts a catheter 29 and navigates a distal end 31 of catheter 29 into a desired location in a heart 23 of a patient 25.
- EGM signals 22 generated by the tissue.
- Such signals may be sensed, for example, while heart 23 experiences atrial fibrillation (AF) or any other arrhythmia.
- AF atrial fibrillation
- the arrhythmia may be induced by the physician as part of the procedure.
- a processor 28 of system 21 receives EGM signals 22 from distal end 31, via an electrical interface 35, such as a socket or port, and processes these EGM signals as will be described in detail in Figs. 2 and 3 below.
- processor 28 in response to processing the EGM signals, is configured to generate an output, which typically comprises a visual output displayed on a display 26 of system 21.
- processor 28 is configured to annotate at least one peak of EGM signal 22 to show the activation points of the EGM signal, and to display the annotated signal on display 26.
- processor 28 may, for example, place a marker 24 over each activation point.
- the annotated signal shown by marker 24 is also referred to herein as a "primary peak” or as an “annotated activation signal.”
- each EGM signal 22 may be a bipolar signal, so that the signal represents the voltage between a respective pair of the electrodes at distal end 31.
- at least one of the acquired EGM signals may be a unipolar signal, so that the EGM signal represents the voltage between one of the electrodes and a reference electrode that is coupled externally to patient 25.
- processor 28 may comprise a single processor, or a cooperatively networked or clustered set of processors.
- the functionality of processor 28, as described herein may be implemented solely in hardware, e.g., using one or more Application-Specific Integrated Circuits (ASICs) or Field-Programmable Gate Arrays (FPGAs).
- ASICs Application-Specific Integrated Circuits
- FPGAs Field-Programmable Gate Arrays
- the functionality of processor 28 may be implemented at least partly in software.
- processor 28 may comprise a programmed digital computing device comprising at least a central processing unit (CPU) and random access memory (RAM).
- system 21 may comprise any suitable types of non-volatile memory devices.
- processor 28 may comprise a general-purpose processor, which is programmed in software to carry out the functions described herein.
- the software may be downloaded to the processor in electronic form, over a network, for example, or it may, alternatively or additionally, be provided and/or stored on non-transitory tangible media, such as magnetic, optical, or electronic memory.
- system 21 is shown by way of example, in order to illustrate certain problems that are addressed by embodiments of the present invention and to demonstrate the application of these embodiments in enhancing the performance of such a system.
- Embodiments of the present invention are by no means limited to this specific sort of example system, and the principles described herein may similarly be applied to other sorts of systems for mapping arrhythmia and to other sorts of systems for annotating and analyzing any suitable signals acquired from any human organ.
- Fig. 2 is a graph showing an identification of activation points in an EGM signal 100.
- EGM signal 100 may replace, for example, EGM signal 22 of Fig. 1 above.
- EGM signal 100 is acquired at a given position in heart 23 using one or more electrodes of distal end 31, and comprises a complex fractionated EGM signal measured in millivolts (mV) over time.
- processor 28 is configured to divide the total period that is spanned by the signal into successive smaller time periods, each being of a predefined length or within a range of lengths, e.g., between 100 milliseconds (ms) and 200 ms, or any other suitable period of time.
- processor 28 identifies a set of candidate fragmentation peaks, such as peaks 106, 106A, 106B, 106C, 107, 108A and 108B shown in Fig. 2 above.
- processor 28 may filter out at least some of the candidate fragmentation peaks, such as peak 107 which is within the noise threshold located between noise-threshold lines 103 and 105 shown in Fig. 2 above.
- processor identifies a group of peaks comprising two or more secondary peaks that are within a predefined time interval (e.g., 20 ms) from one another and having the same sign (positive or negative). For example, a group of peaks 106A and 108A, and another group of peaks 106B and 108B.
- processor 28 may select, within the group of peaks, the peak having the largest absolute electro-potential value and removes the other peaks from the set of secondary peaks. As depicted in Fig. 2 above, peaks 108A and 108B had the largest absolute electro-potential value and therefore, respective peaks 106A and 106B have been removed.
- processor calculates the local FI using equation (1), which is described in Fig. 2 above.
- Processor 28 applies to equation (1), the total number of primary and secondary peaks identified and verified after the filtering and merging processes described in steps 206 and 208 above, and the total actual and nominal WOI time durations used for identifying the primary and secondary peaks.
- the calculated local FI is indicative of the average number of secondary peaks per AFCL time duration.
- the calculated value of the local FI equals 2.334, which is indicative of the average number of secondary peaks per average AFCL time duration.
- display 26 displays the local FI on the map of heart 23 received from processor 28.
- display 26 is configured to display a visualization of the local FI using color coding or any other suitable visualization technique.
- processor 28 and/or display 26 may assign warm colors, e.g., red, to small values of FI, and cold colors, e.g., blue, to large values of FI.
- display 26 may also display the one or more AFCLs overlaid on the heart map and on the displayed local FI.
- An exemplary embodiment of the map is shown in Fig. 5 below.
- Fig. 4 is a schematic, pictorial illustration of a region 300 of heart 23 for which a regional fragmentation index (FI) is calculated based on multiple local FIs.
- region 300 comprises points 302, 304, 306, 308 and 310, located at respective distances of 3 mm, 1 mm, 2 mm, 4 mm, and 5 mm, from a geometrical center-of-gravity (COG), referred to as COG 333 of region 300.
- COG geometrical center-of-gravity
- processor 28 is configured to calculate the regional FI of region 300 by calculating a weighted average over the local FIs of points 302, 304, 306, 308 and 310, using the respective distances from COG 333 for deriving the averaging weights.
- the respective local FI is weighted by a weight value that is proportional to the inverse value of the distance between the given point and COG 333.
- point 304 which is located 1 mm from COG 333, has larger weight (e.g., 1) relative to that of point 310 located 5 mm from COG 333, and therefore having a 5X smaller weight (e.g., 1/5).
- processor 28 calculates normalized weights for points 302, 304, 306, 308 and 310 and outputs the respective values of 0.146, 0.438, 0.219, 0.109 and 0.087, and then multiplies, for each point, the respective local FI by the respective normalized weight, and sums.
- processor 28 After calculating a sum of the weighted local FIs, processor 28 outputs the regional FI having a value of 6.628. Subsequently, processor 28 outputs the calculated regional FI and the calculated AFCLs of region 300, to display 26.
- map 400 further comprises AFCL markers 422, 423, 424, 425, 426 and 428, which are calculated by processor 28 (e.g., using the technique described in Fig. 2 above) in the sections represented by respective contours 402, 403, 404, 405, 406 and 408.
- map 400 comprises a legend 440 that provides another set of coding of the visualized values of the average AFCL markers.
- 120 ms represents "short" AFCL values and 250 ms represents "long" AFCL values.
- the local FI is indicative of the average number of fragmentation peaks (also referred to herein as secondary peaks) per regular AFCL.
- a short regular AFCL is indicative of a short time duration between two annotated activation signals (also referred to herein as primary peaks).
- a combination of a large value of a regional FI and one or more short regular AFCLs, as shown for example in contour 403 and AFCL marker 423, respectively, may be indicative of a section having high AF activity in region 410.
- processor 28 may highlight on display 26 outstanding combinations, e.g., of high regional FI and short regular AFCLs, so as to draw the attention of physician 27 during the EP procedure shown for example in Fig. 1 above.
- processor 28 may hold any set of thresholds for the regional FI and regular AFCLs, and for any combination thereof, so as to alert of any outstanding AF activities identified at specific sections or regions of heart 23.
- processor 28 may add any other suitable types of markers to be visualized on map 400, or may reduce at least one of the AFCLs or regional FIs shown on map 400 of Fig. 5 .
- map 400 is shown by way of example, in order to illustrate certain problems that are addressed by embodiments of the present invention and to demonstrate the application of these embodiments in enhancing the performance of a system for analyzing arrhythmia, such as system 21.
- Embodiments of the present invention are by no means limited to this specific sort of example mapping and visualizing configuration, and the principles described herein may similarly be applied to other sorts of visualizations of any medical systems.
- the embodiments described herein mainly address arrhythmia and particularly atrial fibrillation, the methods and systems described herein can also be used in other applications, such as in persistent atrial fibrillation or in any other type arrhythmia in a human heart.
Landscapes
- Health & Medical Sciences (AREA)
- Life Sciences & Earth Sciences (AREA)
- Cardiology (AREA)
- Heart & Thoracic Surgery (AREA)
- Molecular Biology (AREA)
- Pathology (AREA)
- Engineering & Computer Science (AREA)
- Biomedical Technology (AREA)
- Physics & Mathematics (AREA)
- Medical Informatics (AREA)
- Biophysics (AREA)
- Surgery (AREA)
- Animal Behavior & Ethology (AREA)
- General Health & Medical Sciences (AREA)
- Public Health (AREA)
- Veterinary Medicine (AREA)
- Physiology (AREA)
- Measurement And Recording Of Electrical Phenomena And Electrical Characteristics Of The Living Body (AREA)
- Medicines Containing Plant Substances (AREA)
Description
- The present invention relates generally to electrophysiological mapping, and particularly to methods, systems and processor-readable media for mapping atrial fibrillation using a fragmentation index.
- Atrial fibrillation is an irregular heart rhythm generated in the atria. Various techniques for mapping atrial fibrillation are known in the art.
- For example,
U.S. Patent Application Publication 2017/0367601 describes a method for identifying areas of the heart of a patient able to be involved in the perpetuation of atrial fibrillation. This method takes into account the reference cycle of the arrhythmia and has two variants: a local variant in which the areas of the heart are each analyzed separately and a regional variant in which several areas of the heart are analyzed together. -
U.S. Patent Application Publication 2015/0359430 describes a method of medical image processing for images of body structures, the method comprising: receiving anatomical data to reconstruct an anatomical image of a region of a body of a patient, said region comprises a portion of at least one internal body part which borders or is spaced apart from a target tissue; receiving functional data from a functional imaging modality which images at least said portion of the region of the body of the patient; processing said anatomical image to generate at least one image mask corresponding to the zone outside of the wall of said at least one internal body part; correlating the at least one generated image mask with the functional data for guiding a reconstruction of a functional image depicting said target tissue; and providing the reconstructed functional image. -
U.S. Patent Application Publication 2012/0078129 describes a method of displaying an image of the location of one or more low voltage structures in tissue. The method includes receiving electrical mapping data corresponding to a portion of the tissue, and generating an image using the electrical mapping data. Electrical mapping values within at least one voltage range having two endpoints that bound the upper and lower limits of the voltage range are distinguishable from electrical mapping values outside the at least one voltage range. The two endpoints are selected to distinguish the one or more low voltage structures of the tissue from other portions of the tissue. -
EP2851002A1 discloses a monitoring device for monitoring and evaluating electrogram signals representing electric activities of a heart chamber, said monitoring device comprising a signal input operatively connected to a mapping catheter and a signal processing and evaluation unit for processing and evaluating electrogram signals received at the signal input. The morphology of a detection complex is characterised by the evaluation device, including on the basis of the number of local peaks in the deflection complex. -
WO2010054409A1 discloses a method for visualization of electrical activity on a surface of an organ over a time period, including morphological analysis of complex fractionated electrograms. - An embodiment of the present invention that is described herein provides a computer-implemented method for visualizing a map of atrial fibrillation (AF) in a heart, as specified in appended
claim 1. In some embodiments, the heart has a region that includes (i) the given position located at a given distance from a predefined location of the region, and (ii) at least an additional position having an additional FI and located at an additional distance from the predefined location, and the method includes calculating and visualizing, based on the given distance and the additional distance, and based on the local FI and the additional FI, a regional FI of the region. In other embodiments, the predefined location includes a geometrical center of gravity (COG) of the region, and calculating and visualizing the regional FI includes calculating, based on the given distance and the additional distance, a weighted average of at least the local FI and the additional FI. - In an embodiment, the method includes defining a window of interest (WOI) within the CL, and identifying the one or more secondary peaks within the WOI. In another embodiment, the EGM signal includes multiple CLs, and calculating the local FI includes calculating, based on the multiple CLs, an average CL, and calculating an average number of the secondary peaks per the average CL.
- There is additionally provided, a system for mapping atrial fibrillation (AF) in a heart, as defined in appended claim 6.
- The present invention will be more fully understood from the following detailed description of the embodiments thereof, taken together with the drawings in which:
-
Fig. 1 is a schematic, pictorial illustration of a system for annotating an electrogram (EGM) signal; -
Fig. 2 is a graph showing an identification of activation points in an electrogram signal; -
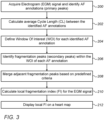
Fig. 3 is a flow chart that schematically illustrates a method for mapping atrial fibrillation (AF) in a patient heart; -
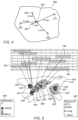
Fig. 4 is a schematic, pictorial illustration of a regional map of heart having a regional fragmentation index (FI) calculated based on multiple local FIs; and -
Fig. 5 is a schematic pictorial illustration of a map of a region of a patient heart. - Some medical procedures are based on measuring electrogram (EGM) signals by disposing a plurality of electrodes at different respective sites on the cardiac tissue. In some cardiac procedures, a physician may use the EGM signals to characterize the propagation of the wavefront of electrical activation through the cardiac tissue of a patient during a cardiac cycle. For each of the EGM signals, the physician may attempt to identify electrical activation points that correspond to an instance at which the wavefront passed through the site at which the signal was acquired.
- In cases of heart atrial fibrillation (AF) or other arrhythmias, it may be difficult, even for an experienced physician, to identify such activation points, due to irregularity and/or variability of the EGM signals. Regular electrograms typically contain regularly-spaced and sharp primary peaks that clearly indicate electrical activations. In contrast, irregular EGMs may exhibit a wide variety of different forms, and may comprise numerous bursts of secondary peaks that are typically not indicative of regular electrical activation.
- Embodiments of the present invention that are described hereinbelow provide methods and systems for mapping AF by calculating local and regional fragmentation indexes (FIs), and visualizing the FIs on a map of a patient heart. In embodiments, a system for mapping AF in a patient heart comprises a processor and a display.
- In some embodiments, the processor is configured to receive, from a catheter inserted into a patient heart, an EGM signal that exhibits the AF and acquired at a given position in the heart. The processor is further configured to identify, in the EGM signal, two or more primary activation peaks, also referred to herein as annotations, and to calculate a cycle length (CL) between adjacent annotations. The processor is further configured to hold predefined criteria for identifying a regular atrial fibrillation cycle length (AFCL), such as but not limited to, a cycle length between 120 ms (referred to herein as short AFCLs) and 250 ms (referred to herein as long AFCLs) having a standard deviation smaller than 30 ms.
- The processor is configured to define a window of interest (WOI) within the AFCL, and to identify within the WOI, one or more secondary activation peaks, also referred to herein as fragmentation peaks. The processor calculates at the given position, a local fragmentation index (FI) that is indicative of an average number of the fragmentation peaks per WOI.
- The processor is configured to merge, based on a predefined threshold and criteria, two or more adjacent fragmentation peaks. In some embodiments, the EGM signal comprises multiple AFCLs, and the processor is configured to calculate, based on the multiple AFCLs, an average AFCL, and to calculate an average number of the fragmentation peaks per the average AFCL. In some embodiments, the display is configured to display the calculated and visualized local FI on a map of at least part of the heart.
- In some embodiments, a region of patient heart contains the given position, which is located at a given distance from a geometrical center-of-gravity (COG) of the region. The region additionally comprises multiple positions located at respective distances from the COG. In such embodiments, the processor is configured to acquire, using the catheter, additional EGM signals at the additional respective positions, and to calculate, for each of the additional positions, a respective additional FI.
- In some embodiments, the processor is configured to calculate, based on the given distance and the additional distances, and based on the local FI and the additional FIs, a regional FI of the region. The processor is further configured to output, to the display, a visualization of the regional FI and the AFCLs. The display is configured to display the calculated and visualized regional FI on a map of the heart showing at least the aforementioned region, and to display the short and the long AFCLs, overlaid on the regional FIs. In such embodiments, the processor is configured to display, on the heart map, important regions, such as regions having short AFCLs and large regional FI.
- The disclosed techniques provide the physician with the features of detection and display of regions suspected to have irregular activation. The physician may apply ablation in one or more of the suspected regions, in order to reduce the arrhythmia in the patient heart.
-
Fig. 1 is a schematic, pictorial illustration of asystem 21 for annotating an electrogram (EGM)signal 22. As shown inFig. 1 , during an electrophysiological (EP) procedure, a physician 27 inserts acatheter 29 and navigates adistal end 31 ofcatheter 29 into a desired location in aheart 23 of apatient 25. - When physician 27 moves
distal end 31 ofcatheter 29 along the inner epicardial surface, also referred to herein as tissue, ofheart 23, one or more electrodes (not shown) disposed atdistal end 31 ofcatheter 29, which are in contact with tissue of the heart,sense EGM signals 22 generated by the tissue. Such signals may be sensed, for example, whileheart 23 experiences atrial fibrillation (AF) or any other arrhythmia. Note that in some cases, the arrhythmia may be induced by the physician as part of the procedure. - In some embodiments, a
processor 28 ofsystem 21 receives EGMsignals 22 fromdistal end 31, via anelectrical interface 35, such as a socket or port, and processes these EGM signals as will be described in detail inFigs. 2 and3 below. In some embodiments, in response to processing the EGM signals,processor 28 is configured to generate an output, which typically comprises a visual output displayed on adisplay 26 ofsystem 21. - In some embodiments,
processor 28 is configured to annotate at least one peak ofEGM signal 22 to show the activation points of the EGM signal, and to display the annotated signal ondisplay 26. In annotating the signal,processor 28 may, for example, place amarker 24 over each activation point. In the context of the present invention and in the claims, the annotated signal shown bymarker 24 is also referred to herein as a "primary peak" or as an "annotated activation signal." - In some embodiments, the electrodes at
distal end 31 may be arranged in any suitable configuration, such as a circular, linear, or multi-spline configuration. Typically, eachEGM signal 22 may be a bipolar signal, so that the signal represents the voltage between a respective pair of the electrodes atdistal end 31. In alternative embodiments, at least one of the acquired EGM signals may be a unipolar signal, so that the EGM signal represents the voltage between one of the electrodes and a reference electrode that is coupled externally topatient 25. - In some embodiments,
processor 28 may comprise a single processor, or a cooperatively networked or clustered set of processors. In some embodiments, the functionality ofprocessor 28, as described herein, may be implemented solely in hardware, e.g., using one or more Application-Specific Integrated Circuits (ASICs) or Field-Programmable Gate Arrays (FPGAs). In other embodiments, the functionality ofprocessor 28 may be implemented at least partly in software. For example, in some embodiments,processor 28 may comprise a programmed digital computing device comprising at least a central processing unit (CPU) and random access memory (RAM). In some embodiments,system 21 may comprise any suitable types of non-volatile memory devices. - In other embodiments,
processor 28 may comprise a general-purpose processor, which is programmed in software to carry out the functions described herein. The software may be downloaded to the processor in electronic form, over a network, for example, or it may, alternatively or additionally, be provided and/or stored on non-transitory tangible media, such as magnetic, optical, or electronic memory. - This particular configuration of
system 21 is shown by way of example, in order to illustrate certain problems that are addressed by embodiments of the present invention and to demonstrate the application of these embodiments in enhancing the performance of such a system. Embodiments of the present invention, however, are by no means limited to this specific sort of example system, and the principles described herein may similarly be applied to other sorts of systems for mapping arrhythmia and to other sorts of systems for annotating and analyzing any suitable signals acquired from any human organ. -
Fig. 2 is a graph showing an identification of activation points in anEGM signal 100. EGM signal 100 may replace, for example,EGM signal 22 ofFig. 1 above. - In some embodiments, EGM signal 100 is acquired at a given position in
heart 23 using one or more electrodes ofdistal end 31, and comprises a complex fractionated EGM signal measured in millivolts (mV) over time. In some embodiments,processor 28 is configured to divide the total period that is spanned by the signal into successive smaller time periods, each being of a predefined length or within a range of lengths, e.g., between 100 milliseconds (ms) and 200 ms, or any other suitable period of time. - In some embodiments,
processor 28 is configured to select a set of candidate activation points that comprises, for each of the time periods, the point (or "peak") of greatest magnitude within the time period, provided that the greatest magnitude is greater than the threshold for the time period and is also greater than a predefined noise threshold (e.g., 0.05 mV), indicated inFig. 2 by upper and lower noise-threshold lines line 103 is located 0.05 mV above the center line ofEGM signal 100, andline 105 is located 0.05 mV below the center line ofEGM signal 100. Subsequently,processor 28 is configured to remove, from the set of candidate activation points, one of any pair of the candidate points that are within a predefined time interval (e.g., 80 ms) from one another. The points remaining in the set are then assumed to be the annotated activation signals, in the present example,primary peaks - The
processor 28 is configured to calculate an atrial fibrillation cycle length (AFCL) between adjacent annotated activation signals, in the example ofFig. 2 , anAFCL 102 betweenprimary peaks processor 28 may hold two thresholds used for defining a range of AFCLs that are considered regular for AF. For example, EGM signal 100 may be acquired over a total period of 2500 ms and having seventeen (17) candidate primary peaks and therefore sixteen (16) calculated AFCLs. Each adjacent primary peaks may delimit an AFCL between 120 ms (referred to herein as a short AFCL) and 250 ms (referred to herein as a long AFCL) and having a standard deviation (SD) smaller than 30 ms relative to the calculated 16 AFCLs ofEGM signal 100. - In some embodiments,
processor 28 is configured to calculate, based on the calculated AFCLs, an average AFCL and to hold two thresholds for the average AFCL and a threshold for the SD. In accordance with the above example,processor 28 may hold thresholds of 120 ms and 250 ms for the lower and higher values of the average AFCL, respectively, and to hold an additional threshold of 30 ms for the AFCL SD. - In some embodiments,
processor 28 is configured to define a window of interest (WOI) 104 having a width smaller than the AFCL and/or within the duration ofwidth 102. In the example ofFig. 2 , the centers ofWOIs 104 are aligned with the respective time ofprimary peaks WOI 104 has an 80% length of the total length ofAFCL 102. In other embodiments,processor 28 may hold any other suitable threshold, other than 80%, for defining the length (or time interval) ofWOI 104 relative toAFCL 102. - The
processor 28 is configured to identify, withinWOI 104, a set of candidate fragmentation peaks, also referred to herein as secondary peaks.Processor 28 is further configured to filter out some of the candidate peaks, using a predefined threshold and criteria, and to obtain a final set of fragmentation peaks. - In the example of
Fig. 2 ,processor 28 identifies candidate peaks 106, 106A, 106B, 106C, 107, 108A and 108B. In an embodiment,processor 28 filters outcandidate peak 107, which is below the 0.05 mV noise threshold (i.e., betweenlines processor 28 does not filter out peak 106C, which has an absolute value slightly larger than the noise threshold. In an embodiment,processor 28 checks whether all peaks larger than 0.05 mV, i.e., located aboveline 103, are trending-up over time before the peak and are trending-down over time after the peak. Similarly,processor 28 checks whether all peaks smaller than -0.05 mV, i.e., located belowline 105, are trending-down over time before the peak and are trending-up over time after the peak. - In some embodiments,
processor 28 is configured to remove, from the set of candidate peaks, at least one of any group of the candidate peaks that are within a predefined time interval (e.g., 20 ms) from one another and having the same sign (positive or negative), and to consolidate the removed one or more peak into the largest peak from among the group. In the example ofFig. 2 ,peaks peak 108A is larger thanpeak 106A. Therefore,processor 28 removespeak 106A, or in other words, mergespeak 106A intopeak 108A. Similarly, peaks 106B and 108B are within the predefined time interval of 20 ms and peak 108B has an absolute electro-potential value larger than that ofpeak 106B. Therefore,processor 28 merges peak 106B intopeak 108B. Subsequently,processor 28 produces a final list of the secondary peaks, in the example ofFig. 2 the final list comprisespeaks processor 28 may hold any other suitable one or more thresholds value for any of the above time intervals and/or noise threshold. - In some embodiments,
processor 28 is configured to calculate for EGM signal 100 that was acquired at the given location ofheart 23, a local fragmentation index (FI) that is indicative of an average number of the secondary peaks per AFCL. - In some embodiments,
processor 28 is configured to calculate the local FI using equation (1) given by:
- SP is an accumulated number of secondary peaks counted within the actual WOI.
- PP is an accumulated number of primary peaks counted within the actual WOI.
- AWOI is an accumulated actual time durations of all actual WOIs within
EGM signal 100. - NWOI is an accumulated nominal time durations of all nominal WOIs within
EGM signal 100. - For example, the total time duration of
EGM signal 100 is 2500 ms, the accumulated nominal time durations of all WOIs (NWOI) is 80% of the total time, and therefore has a value of 2000 ms. The accumulated actual time durations of all WOIs (AWOI) withinEGM signal 100 is 1984 ms. During the AWOI, a number 17 of primary peaks and a number 40 of secondary peaks remained after applying the threshold and filtering criteria described above. - In this example,
processor 28 calculates the local FI using equation (1), and outputs the local FI as shown in equation (2):
- In some embodiments,
processor 28 is configured to output to display 26, the local FI and the calculated average AFCL, on a map of at least part ofheart 23. Note that the local FI is indicative of an average number of the fragmentation peaks per AFCL between two annotated activation signals, shown inFig. 2 asprimary peaks WOIs 104 ofprimary peaks lines processor 28 may exclude such sections from the calculation of AFCLs and local FI, using any suitable criteria and/or predefined or learned parameters. - In other embodiments,
processor 28 is configured to exclude the WOI and to identify the candidate set of secondary peaks along the entire AFCL between adjacent primary peaks. In such embodiments, the calculated local FI may comprise only the total number of identified secondary peaks, divided by the total number of primary peaks. -
Fig. 3 is a flow chart that schematically illustrates a method for mapping AF inheart 23. - The method begins at an EGM
signal acquisition step 200, with acquiring EGM signal 100 usingdistal end 31 having one or more electrodes positioned at the given position in tissue ofheart 23. In some embodiments,processor 28 receives EGM signal 100 that exhibits the AF, and identifies withinEGM signal 100, the annotated activation signals, such asprimary peaks - At a cycle
length calculation step 202,processor 28 calculates the AFCL between any pair of adjacent primary peaks. In some embodiments,processor 28 calculates an average AFCL of the calculated AFCLs. - At a
WOI definition step 204,processor 28 defines a WOI, such asWOI 104, having a length that is typically a fraction of the calculated AFCL, e.g., 70% or 80% of the AFCL length. In some embodiments,processor 28 calculates the WOI based on the aforementioned average AFCL length. In other embodiments,processor 28 calculates a WOI for each section ofEGM signal 100, using a predefined fraction of the AFCL length of the respective section. Additionally or alternatively,processor 28 may calculate an average length of two adjacent AFCLs for the definition of a WOI located between the two respective AFCLs, or using any other suitable method for defining the WOI. - At a fragmentation peaks
identification step 206,processor 28 identifies a set of candidate fragmentation peaks, such aspeaks Fig. 2 above. In some embodiments,processor 28 may filter out at least some of the candidate fragmentation peaks, such aspeak 107 which is within the noise threshold located between noise-threshold lines Fig. 2 above. - At a fragmentation
peaks merging step 208, processor identifies a group of peaks comprising two or more secondary peaks that are within a predefined time interval (e.g., 20 ms) from one another and having the same sign (positive or negative). For example, a group ofpeaks peaks processor 28 may select, within the group of peaks, the peak having the largest absolute electro-potential value and removes the other peaks from the set of secondary peaks. As depicted inFig. 2 above, peaks 108A and 108B had the largest absolute electro-potential value and therefore,respective peaks - At a local fragmentation index (FI)
calculation step 210, processor calculates the local FI using equation (1), which is described inFig. 2 above.Processor 28 applies to equation (1), the total number of primary and secondary peaks identified and verified after the filtering and merging processes described insteps - In other embodiments,
processor 28 may apply any other suitable equation for calculating the local FI. For example, using a median value of all the AFCLs calculated withinEGM signal 100. - At a
map displaying step 212, processor is configured to output, to display 26, the visualized map of at least part ofheart 23, which comprises at least the given point used for acquiring EGM signal 100 and the calculated FI and one or more AFCLs. - In some embodiments,
display 26 displays the local FI on the map ofheart 23 received fromprocessor 28. In some embodiments,display 26 is configured to display a visualization of the local FI using color coding or any other suitable visualization technique. For example,processor 28 and/ordisplay 26 may assign warm colors, e.g., red, to small values of FI, and cold colors, e.g., blue, to large values of FI. As described inFig. 2 above,display 26 may also display the one or more AFCLs overlaid on the heart map and on the displayed local FI. An exemplary embodiment of the map is shown inFig. 5 below. -
Fig. 4 is a schematic, pictorial illustration of aregion 300 ofheart 23 for which a regional fragmentation index (FI) is calculated based on multiple local FIs. In some embodiments,region 300 comprisespoints COG 333 ofregion 300. - In some embodiments,
distal end 31 ofcatheter 29 acquired one or more EGM signals from each ofpoints processor 28 calculates, e.g., using the techniques disclosed atFigs. 2 and3 above, a local FI for each of the points ofregion 300. In the example ofFig. 4 , the values calculated for the local FIs ofpoints - In some embodiments,
processor 28 is configured to calculate the regional FI ofregion 300 by calculating a weighted average over the local FIs ofpoints COG 333 for deriving the averaging weights. For a given point, the respective local FI is weighted by a weight value that is proportional to the inverse value of the distance between the given point andCOG 333. For example,point 304, which is located 1 mm fromCOG 333, has larger weight (e.g., 1) relative to that ofpoint 310 located 5 mm fromCOG 333, and therefore having a 5X smaller weight (e.g., 1/5). - In some embodiments,
processor 28 calculates the weighted average by calculating a weighted sum and normalizing the weighted sum by the sum of weights. Based on the exemplary values provided above, the weights ofpoints - In some embodiments,
processor 28 calculates normalized weights forpoints - Based on the exemplary values described above,
processor 28 multiplies, for each point, the local FI ofpoints - In some embodiments, after calculating a sum of the weighted local FIs,
processor 28 outputs the regional FI having a value of 6.628. Subsequently,processor 28 outputs the calculated regional FI and the calculated AFCLs ofregion 300, to display 26. -
Fig. 5 is a schematic pictorial illustration of amap 400 of aregion 410 ofheart 23. In some embodiments,map 400 compriseslocations 420 identified byprocessor 28 and displayed bydisplay 26 as locations having regular AF activity. - In some embodiments,
processor 28 analyzes multiple EGM signals 100 acquired, e.g., bydistal end 31, atrespective locations 420 ofregion 410. As described inFigs. 2 and3 above,processor 28 identifies the primary peaks, calculates CLs and identifies, within the CLs, the AFCLs having a CL duration between 120 ms and 250 ms. As further described inFigs 2 and3 above,processor 28 defines the WOIs, and identifies the fragmentation peaks within the respective WOIs. Based on the identified and verified fragmentation peaks (after filtering out the candidate fragmentation peaks not meeting the predefined threshold and/or criteria),processor 28 calculated local FI for eachlocation 420, as described inFigs. 2 and3 above. - Subsequently,
processor 28 calculates for each section ofregion 410, a regional FI, using the technique described inFig. 4 above, and outputs to display 26, a visual map comprising the calculated AFCLs and/or one or more regional FIs. In some embodiments,display 26 is configured to display the output map using any suitable type of display, such as a gradient map using color coding. - In the example of
Fig. 5 , map 400 ofregion 410, which is displayed ondisplay 26, comprises multiple sections havingrespective contours map 400 comprises alegend 430, which provides any suitable type of coding of the visualized regional FI values. For example,contours contours contour 406 has a "small" value of regional FI. In the present example, the term "large value of regional FI" refers to typical values between 3 and 7, and the term "small value of regional FI" refers to a typical value smaller than 7. - In some embodiments, map 400 further comprises
AFCL markers Fig. 2 above) in the sections represented byrespective contours map 400 comprises alegend 440 that provides another set of coding of the visualized values of the average AFCL markers. In this example embodiment, 120 ms represents "short" AFCL values and 250 ms represents "long" AFCL values. - In some embodiments, the local FI is indicative of the average number of fragmentation peaks (also referred to herein as secondary peaks) per regular AFCL. Moreover, a short regular AFCL is indicative of a short time duration between two annotated activation signals (also referred to herein as primary peaks). In some cases, a combination of a large value of a regional FI and one or more short regular AFCLs, as shown for example in
contour 403 andAFCL marker 423, respectively, may be indicative of a section having high AF activity inregion 410. - In some embodiments,
processor 28 may highlight ondisplay 26 outstanding combinations, e.g., of high regional FI and short regular AFCLs, so as to draw the attention of physician 27 during the EP procedure shown for example inFig. 1 above. In such embodiments,processor 28 may hold any set of thresholds for the regional FI and regular AFCLs, and for any combination thereof, so as to alert of any outstanding AF activities identified at specific sections or regions ofheart 23. - In alternative embodiments,
processor 28 may add any other suitable types of markers to be visualized onmap 400, or may reduce at least one of the AFCLs or regional FIs shown onmap 400 ofFig. 5 . - This particular configuration of
map 400 is shown by way of example, in order to illustrate certain problems that are addressed by embodiments of the present invention and to demonstrate the application of these embodiments in enhancing the performance of a system for analyzing arrhythmia, such assystem 21. Embodiments of the present invention, however, are by no means limited to this specific sort of example mapping and visualizing configuration, and the principles described herein may similarly be applied to other sorts of visualizations of any medical systems. - Although the embodiments described herein mainly address arrhythmia and particularly atrial fibrillation, the methods and systems described herein can also be used in other applications, such as in persistent atrial fibrillation or in any other type arrhythmia in a human heart.
- It will thus be appreciated that the embodiments described above are cited by way of example, and that the present invention is not limited to what has been particularly shown and described hereinabove. Rather, the scope of the present invention includes both combinations and sub-combinations of the various features described hereinabove, as well as variations and modifications thereof which would occur to persons skilled in the art upon reading the foregoing description and which are not disclosed in the prior art, and which fall under the scope of the appended claims.
Claims (11)
- A computer-implemented method for visualizing a map of atrial fibrillation,AF, in a heart, the method comprising:receiving an electrogram, EGM, signal exhibiting the AF, acquired at a given position in the heart;identifying (200), in the EGM signal, two or more primary activation peaks and calculating (202) a cycle length, CL, between adjacent primary activation peaks;identifying (206), in the EGM signal, one or more fragmentation peaks within the CL, wherein identifying the one or more fragmentation peaks comprises identifying one of more candidate peaks, wherein each of the one or more candidate peaks has an absolute value larger than a noise threshold, and wherein identifying the one or more fragmentation peaks comprises merging, based on being within a predefined time interval and on having the same sign, two or more adjacent candidate peaks in the EGM signal;calculating (210) a local fragmentation index, FI, that is indicative of a number of the fragmentation peaks per CL; andvisualizing (212), on a display, the local FI on a map of at least part of the heart.
- The computer-implemented method according to claim 1, wherein the heart has a region that comprises (i) the given position located at a given distance from a predefined location of the region, and (ii) at least an additional position having an additional FI and located at an additional distance from the predefined location, and comprising calculating and visualizing, based on the given distance and the additional distance, and based on the local FI and the additional FI, a regional FI of the region.
- The computer-implemented method according to claim 2, wherein the predefined location comprises a geometrical center of gravity (COG) of the region, and wherein calculating and visualizing the regional FI comprises calculating, based on the given distance and the additional distance, a weighted average of at least the local FI and the additional FI.
- The computer-implemented method according to claim 1, and comprising defining (204) a window of interest (WOI) within the CL, and identifying the one or more fragmentation peaks within the WOI.
- The computer-implemented method according to claim 1, wherein the EGM signal comprises multiple CLs, and wherein calculating the local FI comprises calculating, based on the multiple CLs, an average CL, and calculating an average number of the fragmentation peaks per the average CL.
- A system (21) for mapping atrial fibrillation,AF, in a heart (23), the system comprising:
a processor (28), which is configured to:(a) receive an electrogram,EGM, signal (100) exhibiting the AF, acquired at a given position in the heart;(b) identify, in the EGM signal, two or more primary activation peaks (101, 111, 121) and calculate a cycle length,CL, (104) between adjacent primary activation peaks;(c) identify, in the EGM signals, one or more fragmentation peaks (106, 106A, 106B, 106C, 107, 108A, 108B) within a duration of the CL, wherein identifying the one or more fragmentation peaks comprises identifying one or more candidate peaks, wherein each of the one or more candidate peaks has an absolute value larger than a noise threshold, and wherein identifying the one or more fragmentation peaks comprises merging, based on being within a predefined time interval and on having the same sign, two or more adjacent candidate peaks (106B, 108B) in the EGM signal; and(d) calculate a local fragmentation index,FI, that is indicative of a number of the fragmentation peaks per CL; and the system further comprising:
a display (26), which is configured to display the local FI on a map of at least part of the heart. - The system according to claim 6, wherein the heart has a region (300) that comprises (i) the given position (302) located at a given distance from a predefined location of the region, and (ii) at least an additional position (304, 306, 308, 310) having an additional FI and located at an additional distance from the predefined location, and wherein the processor is configured to calculate and visualize, based on the given distance and the additional distance, and based on the local FI and the additional FI, a regional FI of the region.
- The system according to claim 7, wherein the predefined location comprises a geometrical center of gravity (COG) of the region, and wherein the processor is configured to calculate and visualize the regional FI by calculating, based on the given distance and the additional distance, a weighted average of at least the local FI and the additional FI.
- The system according to claim 6, wherein the processor is configured to define a window of interest (WOI) (104) within a duration of the CL, and to identify the one or more fragmentation peaks within the WOI.
- The system according to claim 6, wherein the EGM signal comprises multiple CLs, and wherein the processor is configured to calculate, based on the multiple CLs, an average CL, and to calculate an average number of the fragmentation peaks per the average CL.
- A processor-readable medium comprising instructions that, when executed, cause the processor, coupled to a display, to execute the method of one of claims 1 to 5.
Applications Claiming Priority (1)
| Application Number | Priority Date | Filing Date | Title |
|---|---|---|---|
| US16/512,588 US10905349B1 (en) | 2019-07-16 | 2019-07-16 | Mapping atrial fibrillation using fragmentation index |
Publications (3)
| Publication Number | Publication Date |
|---|---|
| EP3766416A1 EP3766416A1 (en) | 2021-01-20 |
| EP3766416C0 EP3766416C0 (en) | 2025-04-02 |
| EP3766416B1 true EP3766416B1 (en) | 2025-04-02 |
Family
ID=71620241
Family Applications (1)
| Application Number | Title | Priority Date | Filing Date |
|---|---|---|---|
| EP20185867.7A Active EP3766416B1 (en) | 2019-07-16 | 2020-07-15 | Mapping atrial fibrillation using fragmentation index |
Country Status (5)
| Country | Link |
|---|---|
| US (1) | US10905349B1 (en) |
| EP (1) | EP3766416B1 (en) |
| JP (1) | JP7588976B2 (en) |
| CN (1) | CN112315486B (en) |
| IL (1) | IL275666B2 (en) |
Families Citing this family (1)
| Publication number | Priority date | Publication date | Assignee | Title |
|---|---|---|---|---|
| EP4473910A1 (en) * | 2023-06-06 | 2024-12-11 | CathVision ApS | Method for analyzing an electrogram |
Family Cites Families (20)
| Publication number | Priority date | Publication date | Assignee | Title |
|---|---|---|---|---|
| US20050288599A1 (en) * | 2004-05-17 | 2005-12-29 | C.R. Bard, Inc. | High density atrial fibrillation cycle length (AFCL) detection and mapping system |
| US8229545B2 (en) * | 2005-09-15 | 2012-07-24 | St. Jude Medical, Atrial Fibrillation Division, Inc. | System and method for mapping complex fractionated electrogram information |
| US7792584B2 (en) * | 2006-04-25 | 2010-09-07 | Medtronic, Inc. | System and method for characterization of atrial wall using digital signal processing |
| US8359092B2 (en) * | 2007-11-29 | 2013-01-22 | Biosense Webster, Inc. | Determining locations of ganglia and plexi in the heart using complex fractionated atrial electrogram |
| JP5911726B2 (en) * | 2008-11-10 | 2016-04-27 | カーディオインサイト テクノロジーズ インコーポレイテッド | Visualization of electrophysiological data |
| US8965496B2 (en) | 2010-09-27 | 2015-02-24 | Steven J. Bailin | Method for determining the location of regions in tissue relevant to electrical propagation |
| US8626278B2 (en) * | 2010-10-08 | 2014-01-07 | Euljoon Park | Method and system for discriminating and monitoring atrial arrhythmia based on cardiogenic impedance |
| US9144382B2 (en) * | 2011-04-07 | 2015-09-29 | The Johns Hopkins University | Non-invasive methods and systems for producing cardiac electrogram characteristic maps for use with catheter ablation of ventricular tachycardia |
| US9314205B2 (en) * | 2011-04-28 | 2016-04-19 | Medtronic, Inc. | Measurement of cardiac cycle length and pressure metrics from pulmonary arterial pressure |
| JP6470185B2 (en) | 2013-01-24 | 2019-02-13 | タイラートン インターナショナル ホールディングス インコーポレイテッドTylerton International Holdings Inc. | Body structure imaging |
| US9456759B2 (en) * | 2013-09-16 | 2016-10-04 | Biotronik Se & Co. Kg | Device for automatic mapping of complex fractionated atrial electrogram |
| US9554718B2 (en) * | 2014-01-29 | 2017-01-31 | Biosense Webster (Israel) Ltd. | Double bipolar configuration for atrial fibrillation annotation |
| CA2942904C (en) * | 2014-03-31 | 2023-08-29 | University Health Network | System and method for focal source identification |
| US10154794B2 (en) * | 2014-04-25 | 2018-12-18 | Medtronic, Inc. | Implantable cardioverter-defibrillator (ICD) tachyarrhythmia detection modifications responsive to detected pacing |
| CN107072573B (en) * | 2014-10-15 | 2018-11-16 | 圣犹达医疗用品心脏病学部门有限公司 | For generating the method and system for being directed to the integrated substrate-based mapping figure of arrhythmia cordis |
| FR3030217B1 (en) | 2014-12-23 | 2021-09-03 | Clement Bars | HIGH DENSITY REGIONAL MAPPING OF ATRIAL FIBRILLATION SUBSTRATE |
| EP3451918B1 (en) * | 2016-05-03 | 2020-09-23 | CardioInsight Technologies, Inc. | Detection and analysis of electrograms |
| EP3528702B1 (en) * | 2016-10-18 | 2025-05-21 | Cardiac Pacemakers, Inc. | System for arrhythmia detection |
| US10952793B2 (en) * | 2017-01-25 | 2021-03-23 | Biosense Webster (Israel) Ltd. | Method and system for eliminating a broad range of cardiac conditions by analyzing intracardiac signals providing a detailed map and determining potential ablation points |
| US10888379B2 (en) * | 2017-01-25 | 2021-01-12 | Biosense Webster (Israel) Ltd. | Analyzing and mapping ECG signals and determining ablation points to eliminate brugada syndrome |
-
2019
- 2019-07-16 US US16/512,588 patent/US10905349B1/en active Active
-
2020
- 2020-06-25 IL IL275666A patent/IL275666B2/en unknown
- 2020-07-15 EP EP20185867.7A patent/EP3766416B1/en active Active
- 2020-07-15 JP JP2020121139A patent/JP7588976B2/en active Active
- 2020-07-16 CN CN202010688951.8A patent/CN112315486B/en active Active
Also Published As
| Publication number | Publication date |
|---|---|
| IL275666B2 (en) | 2023-07-01 |
| JP7588976B2 (en) | 2024-11-25 |
| EP3766416C0 (en) | 2025-04-02 |
| IL275666B1 (en) | 2023-03-01 |
| IL275666A (en) | 2021-01-31 |
| US20210015383A1 (en) | 2021-01-21 |
| EP3766416A1 (en) | 2021-01-20 |
| CN112315486B (en) | 2026-01-13 |
| CN112315486A (en) | 2021-02-05 |
| US10905349B1 (en) | 2021-02-02 |
| JP2021016788A (en) | 2021-02-15 |
Similar Documents
| Publication | Publication Date | Title |
|---|---|---|
| US10004413B2 (en) | Signal analysis related to treatment sites | |
| EP2994044B1 (en) | Analysis and detection for arhythmia drivers | |
| EP2345024B1 (en) | Visualization of electrophysiology data | |
| CN104271038B (en) | Method and equipment for evaluating myocardial damage based on current density change | |
| EP3178391A1 (en) | Displaying multiple-activation areas on an electroanatomical map | |
| CN107358196A (en) | A kind of sorting technique of heart beat type, device and electrocardiogram equipment | |
| EP3787492B1 (en) | Detection of regions exhibiting irregular electrophysiological activity | |
| US20140107519A1 (en) | Apparatus for measuring brain local activity | |
| EP4026497A1 (en) | Incorporating a confidence level into an electrophysiological (ep) map | |
| CN112057039A (en) | Visually distinguish primary and secondary activations on electrophysiological maps | |
| EP4091547B1 (en) | Medical apparatus for diagnostic and site determination of cardiac arrhythmias | |
| EP3766416A1 (en) | Mapping atrial fibrillation using fragmentation index | |
| EP3571985B1 (en) | Identifying activations in an atrial fibrillation electrogram | |
| EP3441937B1 (en) | A computer implemented method for calculating values indicative for the local spatial structure of conducting properties of heart muscle tissue and computer programs thereof | |
| US20200397327A1 (en) | Systems and methods for identifying split activation histograms in cardiac mapping procedures | |
| US11006886B2 (en) | Visualization of different cardiac rhythms using different timing-pattern displays | |
| WO2020242334A1 (en) | System and method of automated electrocardiogram analysis and interpretation | |
| US10806359B2 (en) | Connectivity analysis for arrhythmia drivers | |
| KR102483854B1 (en) | Method And Apparatus for Clustering ECG Signal | |
| US12011273B2 (en) | Method and device for the technical support of the analysis of signals acquired by measurement, the signals having a time- and space-dependent signal characteristic | |
| EP4389003A1 (en) | Method for analysing an intracardiac electrogram | |
| Ge | Detecting myocardial infraction using VCG leads | |
| JP2025003018A (en) | WAVEFORM DISPLAY DEVICE, WAVEFORM DISPLAY SYSTEM, WAVEFORM DISPLAY METHOD, AND PROGRAM |
Legal Events
| Date | Code | Title | Description |
|---|---|---|---|
| PUAI | Public reference made under article 153(3) epc to a published international application that has entered the european phase |
Free format text: ORIGINAL CODE: 0009012 |
|
| STAA | Information on the status of an ep patent application or granted ep patent |
Free format text: STATUS: THE APPLICATION HAS BEEN PUBLISHED |
|
| AK | Designated contracting states |
Kind code of ref document: A1 Designated state(s): AL AT BE BG CH CY CZ DE DK EE ES FI FR GB GR HR HU IE IS IT LI LT LU LV MC MK MT NL NO PL PT RO RS SE SI SK SM TR |
|
| AX | Request for extension of the european patent |
Extension state: BA ME |
|
| STAA | Information on the status of an ep patent application or granted ep patent |
Free format text: STATUS: REQUEST FOR EXAMINATION WAS MADE |
|
| 17P | Request for examination filed |
Effective date: 20210611 |
|
| RBV | Designated contracting states (corrected) |
Designated state(s): AL AT BE BG CH CY CZ DE DK EE ES FI FR GB GR HR HU IE IS IT LI LT LU LV MC MK MT NL NO PL PT RO RS SE SI SK SM TR |
|
| RAP3 | Party data changed (applicant data changed or rights of an application transferred) |
Owner name: BIOSENSE WEBSTER (ISRAEL) LTD. |
|
| STAA | Information on the status of an ep patent application or granted ep patent |
Free format text: STATUS: EXAMINATION IS IN PROGRESS |
|
| 17Q | First examination report despatched |
Effective date: 20221221 |
|
| REG | Reference to a national code |
Free format text: PREVIOUS MAIN CLASS: A61B0005046000 Ipc: A61B0005361000 Ref country code: DE Ref legal event code: R079 Ref document number: 602020048614 Country of ref document: DE |
|
| GRAP | Despatch of communication of intention to grant a patent |
Free format text: ORIGINAL CODE: EPIDOSNIGR1 |
|
| STAA | Information on the status of an ep patent application or granted ep patent |
Free format text: STATUS: GRANT OF PATENT IS INTENDED |
|
| RIC1 | Information provided on ipc code assigned before grant |
Ipc: A61B 5/361 20210101AFI20240426BHEP |
|
| INTG | Intention to grant announced |
Effective date: 20240529 |
|
| GRAJ | Information related to disapproval of communication of intention to grant by the applicant or resumption of examination proceedings by the epo deleted |
Free format text: ORIGINAL CODE: EPIDOSDIGR1 |
|
| STAA | Information on the status of an ep patent application or granted ep patent |
Free format text: STATUS: EXAMINATION IS IN PROGRESS |
|
| GRAP | Despatch of communication of intention to grant a patent |
Free format text: ORIGINAL CODE: EPIDOSNIGR1 |
|
| INTC | Intention to grant announced (deleted) | ||
| STAA | Information on the status of an ep patent application or granted ep patent |
Free format text: STATUS: GRANT OF PATENT IS INTENDED |
|
| INTG | Intention to grant announced |
Effective date: 20241107 |
|
| GRAS | Grant fee paid |
Free format text: ORIGINAL CODE: EPIDOSNIGR3 |
|
| GRAA | (expected) grant |
Free format text: ORIGINAL CODE: 0009210 |
|
| STAA | Information on the status of an ep patent application or granted ep patent |
Free format text: STATUS: THE PATENT HAS BEEN GRANTED |
|
| AK | Designated contracting states |
Kind code of ref document: B1 Designated state(s): AL AT BE BG CH CY CZ DE DK EE ES FI FR GB GR HR HU IE IS IT LI LT LU LV MC MK MT NL NO PL PT RO RS SE SI SK SM TR |
|
| REG | Reference to a national code |
Ref country code: GB Ref legal event code: FG4D |
|
| REG | Reference to a national code |
Ref country code: CH Ref legal event code: EP |
|
| REG | Reference to a national code |
Ref country code: DE Ref legal event code: R096 Ref document number: 602020048614 Country of ref document: DE |
|
| REG | Reference to a national code |
Ref country code: IE Ref legal event code: FG4D |
|
| U01 | Request for unitary effect filed |
Effective date: 20250423 |
|
| U07 | Unitary effect registered |
Designated state(s): AT BE BG DE DK EE FI FR IT LT LU LV MT NL PT RO SE SI Effective date: 20250502 |
|
| PGFP | Annual fee paid to national office [announced via postgrant information from national office to epo] |
Ref country code: GB Payment date: 20250529 Year of fee payment: 6 |
|
| U20 | Renewal fee for the european patent with unitary effect paid |
Year of fee payment: 6 Effective date: 20250606 |
|
| PG25 | Lapsed in a contracting state [announced via postgrant information from national office to epo] |
Ref country code: ES Free format text: LAPSE BECAUSE OF FAILURE TO SUBMIT A TRANSLATION OF THE DESCRIPTION OR TO PAY THE FEE WITHIN THE PRESCRIBED TIME-LIMIT Effective date: 20250402 |
|
| PG25 | Lapsed in a contracting state [announced via postgrant information from national office to epo] |
Ref country code: NO Free format text: LAPSE BECAUSE OF FAILURE TO SUBMIT A TRANSLATION OF THE DESCRIPTION OR TO PAY THE FEE WITHIN THE PRESCRIBED TIME-LIMIT Effective date: 20250702 Ref country code: GR Free format text: LAPSE BECAUSE OF FAILURE TO SUBMIT A TRANSLATION OF THE DESCRIPTION OR TO PAY THE FEE WITHIN THE PRESCRIBED TIME-LIMIT Effective date: 20250703 |
|
| PG25 | Lapsed in a contracting state [announced via postgrant information from national office to epo] |
Ref country code: PL Free format text: LAPSE BECAUSE OF FAILURE TO SUBMIT A TRANSLATION OF THE DESCRIPTION OR TO PAY THE FEE WITHIN THE PRESCRIBED TIME-LIMIT Effective date: 20250402 |
|
| PG25 | Lapsed in a contracting state [announced via postgrant information from national office to epo] |
Ref country code: HR Free format text: LAPSE BECAUSE OF FAILURE TO SUBMIT A TRANSLATION OF THE DESCRIPTION OR TO PAY THE FEE WITHIN THE PRESCRIBED TIME-LIMIT Effective date: 20250402 |
|
| PG25 | Lapsed in a contracting state [announced via postgrant information from national office to epo] |
Ref country code: RS Free format text: LAPSE BECAUSE OF FAILURE TO SUBMIT A TRANSLATION OF THE DESCRIPTION OR TO PAY THE FEE WITHIN THE PRESCRIBED TIME-LIMIT Effective date: 20250702 |
|
| PG25 | Lapsed in a contracting state [announced via postgrant information from national office to epo] |
Ref country code: IS Free format text: LAPSE BECAUSE OF FAILURE TO SUBMIT A TRANSLATION OF THE DESCRIPTION OR TO PAY THE FEE WITHIN THE PRESCRIBED TIME-LIMIT Effective date: 20250802 |
|
| PG25 | Lapsed in a contracting state [announced via postgrant information from national office to epo] |
Ref country code: SM Free format text: LAPSE BECAUSE OF FAILURE TO SUBMIT A TRANSLATION OF THE DESCRIPTION OR TO PAY THE FEE WITHIN THE PRESCRIBED TIME-LIMIT Effective date: 20250402 |
|
| PG25 | Lapsed in a contracting state [announced via postgrant information from national office to epo] |
Ref country code: CZ Free format text: LAPSE BECAUSE OF FAILURE TO SUBMIT A TRANSLATION OF THE DESCRIPTION OR TO PAY THE FEE WITHIN THE PRESCRIBED TIME-LIMIT Effective date: 20250402 |
|
| PG25 | Lapsed in a contracting state [announced via postgrant information from national office to epo] |
Ref country code: SK Free format text: LAPSE BECAUSE OF FAILURE TO SUBMIT A TRANSLATION OF THE DESCRIPTION OR TO PAY THE FEE WITHIN THE PRESCRIBED TIME-LIMIT Effective date: 20250402 |
|
| PLBE | No opposition filed within time limit |
Free format text: ORIGINAL CODE: 0009261 |
|
| STAA | Information on the status of an ep patent application or granted ep patent |
Free format text: STATUS: NO OPPOSITION FILED WITHIN TIME LIMIT |
|
| REG | Reference to a national code |
Ref country code: CH Ref legal event code: L10 Free format text: ST27 STATUS EVENT CODE: U-0-0-L10-L00 (AS PROVIDED BY THE NATIONAL OFFICE) Effective date: 20260211 |
|
| REG | Reference to a national code |
Ref country code: CH Ref legal event code: H13 Free format text: ST27 STATUS EVENT CODE: U-0-0-H10-H13 (AS PROVIDED BY THE NATIONAL OFFICE) Effective date: 20260224 |
|
| 26N | No opposition filed |
Effective date: 20260105 |
|
| PG25 | Lapsed in a contracting state [announced via postgrant information from national office to epo] |
Ref country code: CH Free format text: LAPSE BECAUSE OF NON-PAYMENT OF DUE FEES Effective date: 20250731 |