EP3764392A1 - Oxygen concentration evaluation method - Google Patents
Oxygen concentration evaluation method Download PDFInfo
- Publication number
- EP3764392A1 EP3764392A1 EP19764636.7A EP19764636A EP3764392A1 EP 3764392 A1 EP3764392 A1 EP 3764392A1 EP 19764636 A EP19764636 A EP 19764636A EP 3764392 A1 EP3764392 A1 EP 3764392A1
- Authority
- EP
- European Patent Office
- Prior art keywords
- intensity
- line
- oxygen concentration
- carbon
- single crystal
- Prior art date
- Legal status (The legal status is an assumption and is not a legal conclusion. Google has not performed a legal analysis and makes no representation as to the accuracy of the status listed.)
- Granted
Links
Images

Classifications
-
- C—CHEMISTRY; METALLURGY
- C30—CRYSTAL GROWTH
- C30B—SINGLE-CRYSTAL GROWTH; UNIDIRECTIONAL SOLIDIFICATION OF EUTECTIC MATERIAL OR UNIDIRECTIONAL DEMIXING OF EUTECTOID MATERIAL; REFINING BY ZONE-MELTING OF MATERIAL; PRODUCTION OF A HOMOGENEOUS POLYCRYSTALLINE MATERIAL WITH DEFINED STRUCTURE; SINGLE CRYSTALS OR HOMOGENEOUS POLYCRYSTALLINE MATERIAL WITH DEFINED STRUCTURE; AFTER-TREATMENT OF SINGLE CRYSTALS OR A HOMOGENEOUS POLYCRYSTALLINE MATERIAL WITH DEFINED STRUCTURE; APPARATUS THEREFOR
- C30B33/00—After-treatment of single crystals or homogeneous polycrystalline material with defined structure
- C30B33/04—After-treatment of single crystals or homogeneous polycrystalline material with defined structure using electric or magnetic fields or particle radiation
-
- C—CHEMISTRY; METALLURGY
- C30—CRYSTAL GROWTH
- C30B—SINGLE-CRYSTAL GROWTH; UNIDIRECTIONAL SOLIDIFICATION OF EUTECTIC MATERIAL OR UNIDIRECTIONAL DEMIXING OF EUTECTOID MATERIAL; REFINING BY ZONE-MELTING OF MATERIAL; PRODUCTION OF A HOMOGENEOUS POLYCRYSTALLINE MATERIAL WITH DEFINED STRUCTURE; SINGLE CRYSTALS OR HOMOGENEOUS POLYCRYSTALLINE MATERIAL WITH DEFINED STRUCTURE; AFTER-TREATMENT OF SINGLE CRYSTALS OR A HOMOGENEOUS POLYCRYSTALLINE MATERIAL WITH DEFINED STRUCTURE; APPARATUS THEREFOR
- C30B29/00—Single crystals or homogeneous polycrystalline material with defined structure characterised by the material or by their shape
- C30B29/02—Elements
- C30B29/06—Silicon
-
- G—PHYSICS
- G01—MEASURING; TESTING
- G01N—INVESTIGATING OR ANALYSING MATERIALS BY DETERMINING THEIR CHEMICAL OR PHYSICAL PROPERTIES
- G01N23/00—Investigating or analysing materials by the use of wave or particle radiation, e.g. X-rays or neutrons, not covered by groups G01N3/00 – G01N17/00, G01N21/00 or G01N22/00
- G01N23/22—Investigating or analysing materials by the use of wave or particle radiation, e.g. X-rays or neutrons, not covered by groups G01N3/00 – G01N17/00, G01N21/00 or G01N22/00 by measuring secondary emission from the material
- G01N23/225—Investigating or analysing materials by the use of wave or particle radiation, e.g. X-rays or neutrons, not covered by groups G01N3/00 – G01N17/00, G01N21/00 or G01N22/00 by measuring secondary emission from the material using electron or ion
- G01N23/2251—Investigating or analysing materials by the use of wave or particle radiation, e.g. X-rays or neutrons, not covered by groups G01N3/00 – G01N17/00, G01N21/00 or G01N22/00 by measuring secondary emission from the material using electron or ion using incident electron beams, e.g. scanning electron microscopy [SEM]
- G01N23/2254—Measuring cathodoluminescence
-
- G—PHYSICS
- G01—MEASURING; TESTING
- G01N—INVESTIGATING OR ANALYSING MATERIALS BY DETERMINING THEIR CHEMICAL OR PHYSICAL PROPERTIES
- G01N2223/00—Investigating materials by wave or particle radiation
- G01N2223/60—Specific applications or type of materials
- G01N2223/604—Specific applications or type of materials monocrystal
-
- G—PHYSICS
- G01—MEASURING; TESTING
- G01N—INVESTIGATING OR ANALYSING MATERIALS BY DETERMINING THEIR CHEMICAL OR PHYSICAL PROPERTIES
- G01N2223/00—Investigating materials by wave or particle radiation
- G01N2223/60—Specific applications or type of materials
- G01N2223/611—Specific applications or type of materials patterned objects; electronic devices
- G01N2223/6116—Specific applications or type of materials patterned objects; electronic devices semiconductor wafer
-
- G—PHYSICS
- G01—MEASURING; TESTING
- G01N—INVESTIGATING OR ANALYSING MATERIALS BY DETERMINING THEIR CHEMICAL OR PHYSICAL PROPERTIES
- G01N2223/00—Investigating materials by wave or particle radiation
- G01N2223/60—Specific applications or type of materials
- G01N2223/652—Specific applications or type of materials impurities, foreign matter, trace amounts
Definitions
- the present invention relates to a method for evaluating an oxygen concentration in a silicon single crystal.
- Methods for measuring an impurity concentration in a silicon single crystal with high sensitivity include low-temperature photoluminescence (PL) methods.
- the first method is a method of irradiating a sample with an electron beam, and a carbon ion or an oxygen ion to form composite defects and measuring a luminescence intensity attributable to the composite defects to quantify the oxygen concentration from the intensity.
- the second method is a method of irradiating a sample with a large quantity of carbon ion beam to form composite defects and measuring a luminescence intensity attributable to the composite defects to quantify the oxygen concentration from the intensity.
- Non Patent Document 1 and Patent Document 1 disclose a method of irradiating a sample with an electron beam, or an ion beam of a carbon ion or an oxygen ion to form composite defects and measuring a luminescence intensity attributable to the composite defects to quantify the carbon concentration from the intensity.
- Patent Document 2 discloses a method of preparing a calibration curve from a value obtained by standardizing, with the use of an emission line (TO line) derived from silicon, a luminescence spectrum (W line) derived from interstitial silicon (I) introduced by irradiating the silicon single crystal with an electron beam, and a carbon concentration in the silicon single crystal, and quantifying the carbon concentration from the W line/TO line obtained by a luminescence method.
- TO line emission line
- W line luminescence spectrum
- I interstitial silicon
- Patent Document 3 discloses a method of injecting ions other than carbon or oxygen into a silicon single crystal, preparing a calibration curve from a luminescence spectrum intensity of interstitial carbon, Ci-Cs, or Ci-Oi formed in this manner, and a carbon concentration, and quantifying the carbon concentration from a spectrum intensity of carbon-related composite defects.
- An FT-IR method or a SIMS method is generally used as a method for measuring an oxygen concentration in a silicon single crystal. Lower detection limits thereof are 0.07 (ppma-JEITA) in the FT-IR method, and 0.02 (ppma) in the SIMS method.
- Non Patent Document 1 M. Nakamura et al., J.Electochem.Soc.141,3576(1994 )
- Methods for measuring an impurity concentration with high sensitivity by measuring an intensity of composite defects formed in a silicon single crystal include low-temperature PL methods, but as described above, many of the methods are methods for measuring a carbon concentration.
- Patent Document 1 discloses a method for measuring an oxygen concentration by a low-temperature PL method, which is a method of determining the oxygen concentration by irradiating with a large quantity of carbon ion beam or both an electron beam and an ion beam.
- a low-temperature PL method which is a method of determining the oxygen concentration by irradiating with a large quantity of carbon ion beam or both an electron beam and an ion beam.
- the ions for irradiation affect the formation of Ci-Cs and Ci-Oi, and therefore, the oxygen concentration determined using this photoluminescence intensity is inaccurate.
- an FT-IR method and a SIMS method are common as methods for measuring an oxygen concentration in a silicon single crystal, but sensitivity is poor with these methods, and lower detection limits thereof are 0.07 (ppma-JEITA) in the FT-IR method, and 0.02 (ppma) in the SIMS method.
- Ci-Oi When oxygen is present in a silicon single crystal, Ci-Oi is apt to be formed. Since these composite defects become lifetime killers, which shorten lifetime, low oxygen is desired particularly in power devices. Accordingly, it is important to measure oxygen with high sensitivity.
- the present invention has been made in view of the problems in the above-described conventional technology, and an object thereof is to provide a method for evaluating an oxygen concentration in a silicon single crystal with high sensitivity.
- the method for evaluating an oxygen concentration of the present invention by a photoluminescence method or a cathode luminescence (CL) method as described makes it possible to quantify oxygen concentration with high sensitivity from the ratio of the luminescence intensities of the carbon-related composite defects (the composite defects Ci-Oi and the composite defects Ci-Cs described above) in the silicon single crystal and the carbon concentration in the silicon single crystal.
- the proportionality constant ⁇ varies depending on the temperature (sample temperature) when measuring the luminescence intensity and the conditions (dose) of the electron-beam irradiation and the ion-beam irradiation, and therefore, when an oxygen concentration of a silicon single crystal substrate is measured at a different sample temperature, electron-beam irradiation conditions or ion-beam irradiation conditions, the proportionality constant ⁇ is more preferably determined for each case. Accordingly, as described above, the preliminary test described above can be performed using a test crystal to determine in advance the proportionality constant ⁇ under the same conditions as when the oxygen concentration in the silicon single crystal to be evaluated is evaluated. In this manner, various conditions can be addressed more appropriately, and the oxygen concentration can be evaluated with higher precision.
- the predetermined dose of the electron beam when irradiating the silicon single crystal is set to 1.0 ⁇ 10 15 (electrons/cm 2 )
- the predetermined temperature when measuring the intensity of the C line and the intensity of the G line is set to liquid helium temperature
- a unit of the carbon concentration is (atoms/cm 3 )
- a unit of the oxygen concentration is (ppma-JEITA)
- the C line intensity and the G line intensity are relative values
- a value of the proportionality constant ⁇ can be set to 2.25 ⁇ 10 -15 .
- the predetermined dose of the electron beam when irradiating the silicon single crystal is set to 1.0 ⁇ 10 15 (electrons/cm 2 )
- the predetermined temperature when measuring the intensity of the C line and the intensity of the G line is set to liquid nitrogen temperature
- a unit of the carbon concentration is (atoms/cm 3 )
- a unit of the oxygen concentration is (ppma-JEITA)
- the C line intensity and the G line intensity are relative values
- a value of the proportionality constant ⁇ can be set to 3.55 ⁇ 10 -15 .
- the oxygen concentration can be quantified immediately just by measuring the luminescence intensity of the carbon-related composite defects and the carbon concentration.
- the oxygen concentration can be evaluated more simply without preparing a calibration curve, etc.
- the ion beam for irradiating the silicon single crystal other than carbon or oxygen can be an ion beam of one or more of boron, phosphorus, arsenic, antimony, hydrogen, helium, argon, germanium, fluorine, nitrogen, silicon, aluminum, indium, and xenon.
- the carbon concentration in the silicon single crystal can be 1.0 ⁇ 10 14 (atoms/cm 3 ) or more.
- the carbon concentration in the silicon single crystal to be evaluated can be set within the above range so that the carbon concentration can be measured with more certainty by an FT-IR method or a SIMS method, for example, when determining the carbon concentration.
- an oxygen concentration can be evaluated by the inventive method for evaluating an oxygen concentration with higher sensitivity than by conventional methods.
- Non Patent Document 1 when a silicon single crystal substrate is irradiated with an electron beam having high energy, a silicon atom at a lattice position is flicked out, and pairs of an interstitial silicon (hereinafter, referred to as I) and a vacancy (hereinafter, referred to as V) which is an empty shell thereof are produced. Since the excessively produced I or V is unstable when alone, they recombine (V+I ⁇ 0), clustering of Is or clustering of Vs occurs, or they react with an impurity contained in the silicon substrate to form a composite.
- I interstitial silicon
- V vacancy
- interstitial carbon Ci is produced by I, which is produced by electron-beam irradiation, flicking out Cs. Furthermore, Ci forms Ci-Cs (G line) by reacting with other Cs, or forms Ci-Oi (C line) by reacting with interstitial oxygen Oi, which is another impurity contained in the silicon substrate.
- [Oi] indicates interstitial oxygen concentration (also referred to simply as oxygen concentration)
- [Cs] indicates substitutional carbon concentration (also referred to simply as carbon concentration)
- [Ci] indicates interstitial carbon concentration
- [CiCs] indicates G line intensity (Ci-Cs intensity)
- [CiOi] indicates C line intensity (Ci-Oi intensity).
- oxygen concentration relational equation (5) (hereinafter, also referred to simply as equation (5) or relational equation (5)) can be obtained by combining the like terms in the equations (3) and (4) and solving for [Oi].
- Oi ⁇ .
- Cs ⁇ K 1 K 2
- the proportionality constant ⁇ is a constant that varies depending on sample temperature, electron-beam irradiation conditions, and ion-beam irradiation conditions. This is because luminous efficiency of the G line and the C line change when the sample temperature is different, and the obtained G line intensity and C line intensity change. In addition, when the electron-beam irradiation conditions and the ion-beam irradiation conditions are different, the formation ratio of Ci-Cs and Ci-Oi becomes different, and therefore, the proportionality constant ⁇ changes.
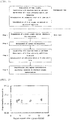
- FIG. 1 is a flow diagram showing the steps of the inventive method for evaluation.
- the example in FIG. 1 consists of a main test for evaluating a sample for evaluation and a preliminary test for determining the value of ⁇ in the equation (5) in advance.
- the preliminary test may be performed at any time as long as it is before the step 4 of the main test when carbon concentration, etc. are actually substituted into the equation (5).
- the value of the proportionality constant ⁇ in the equation (5) varies depending on sample temperature, electron-beam irradiation conditions, and ion-beam irradiation conditions. Therefore, firstly, a test crystal which is a silicon single crystal with a known oxygen concentration and a known carbon concentration is prepared, and irradiation and measurement are performed under the same conditions as the main test (a sample temperature at a predetermined temperature, and an electron beam or an ion beam (other than carbon or oxygen) at a predetermined dose) to determine the intensity ratio (Ci-Oi intensity/Ci-Cs intensity) of the C line and the G line. Next, the value of the proportionality constant ⁇ is determined from the oxygen concentration and the carbon concentration in the test crystal, the intensity ratio (Ci-Oi intensity/Ci-Cs intensity) of the C line and the G line in the test crystal, and the equation (5).
- a proportionality constant ⁇ can be obtained in advance in the preliminary test under the same conditions as the conditions of the main test, and in this manner, the oxygen concentration can be evaluated with higher precision in the main test.
- a reason for preparing silicon single crystal substrates with different carbon concentrations is to verify that the oxygen concentration can be quantified from one relational equation even when the carbon concentration is different. Note that in order to make it possible to detect the oxygen concentration with more certainty by FT-IR, and in order to prevent with more certainty the S/N ratio of the G line from being degraded due to increase of spending the Ci for the formation of a C line, the oxygen concentration range of the silicon single crystal substrates prepared here was 3 to 17 (ppma-JEITA).
- samples of 15 levels were prepared here, where at least 5 levels are desired, to improve the precision of the proportionality constant ⁇ to be obtained.
- each silicon single crystal substrate was irradiated with an electron beam of 1.0 ⁇ 10 15 (electrons/cm 2 ) at an acceleration voltage of 2 (MV) by an electron beam irradiation apparatus to form Ci-Cs and Ci-Oi in the silicon single crystal substrate, and the peak intensities thereof were measured by a photoluminescence method.
- the sample temperature at the time of this measurement was set to liquid helium temperature.
- the proportionality constant ⁇ showed an almost constant value
- the average of the 15 levels of sample was taken as the ⁇ , and 2.25 ⁇ 10 -15 was obtained.
- the units are each (atoms/cm 3 ) for the carbon concentration, (ppma-JEITA) for the oxygen concentration, and relative value (a.u.) for the G line intensity and the C line intensity.
- Oi ppma-JEITA 2.25 ⁇ 10 ⁇ 15 ⁇ CiOi a . u . CiCs a . u . ⁇ Cs atoms / cm 3
- a silicon single crystal substrate which is a sample for evaluation is prepared (step 1).
- This silicon single crystal substrate is not particularly limited, and may be made by a Czochralski method (CZ method) or a floating zone method (FZ method), for example.
- the carbon concentration will be measured and substituted into the relational equation described above in subsequent steps, and the carbon concentration is preferably 1.0 ⁇ 10 14 (atoms/cm 3 ) or more, for example, so that it can be detected and measured more certainly in the measurement by FT-IR or SIMS, for example. That is, when the carbon concentration is 1.0 ⁇ 10 14 (atoms/cm 3 ) or more, the carbon concentration can be determined with higher precision, and therefore, precision of the oxygen concentration determined in the present invention can also be raised.
- the upper limit of the carbon concentration is not limited, and can be any value as long as it can be measured.
- oxygen concentration itself is not particularly limited.
- the carbon concentration (substitutional carbon concentration) of the sample for evaluation is measured (step 2).
- the measurement can be by the FT-IR method or the SIMS method, for example.
- the method for measuring the carbon concentration can be any method as long as the carbon concentration in the sample for evaluation can be determined, and is not particularly limited.
- the sample for evaluation is irradiated with an electron beam or an ion beam other than carbon or oxygen, intensity of an emission line (C line) derived from formed composite defects Ci-Oi and emission intensity of an emission line (G line) derived from formed composite defects Ci-Cs are measured, and the intensity ratio of the C line and the G line is determined (step 3). The peak intensity of each is measured, and the ratio thereof is determined.
- the temperature of the sample for evaluation can be, for example, liquid helium temperature or liquid nitrogen temperature.
- the temperature is not particularly limited, but at such temperatures, the G line and the C line have broad peaks, and the correct intensity can be prevented more effectively from becoming impossible to measure.
- the electron beam dose can be set within the range of 2.5 ⁇ 10 14 to 2.5 ⁇ 10 16 (electrons/cm 2 ), for example.
- the dose is within this range, problems such as Ci-Cs or Ci-Oi not being formed due to the electron beam dose being too little can be prevented from occurring with more certainty.
- the measurement depth can be changed in the CL method by changing the acceleration voltage of electrons, and in the PL method by changing the wavelength of the laser light, and therefore, it is possible to evaluate up to a desired depth from the sample surface by adjusting these conditions.
- the value of the proportionality constant ⁇ in the equation (5) the value of the proportionality constant ⁇ determined in the preliminary test under the same conditions as the main test (the sample temperature at the predetermined temperature, the electron beam at the predetermined dose, or the ion beam other than carbon or oxygen at the predetermined dose) can be used.
- the predetermined dose of the electron beam when irradiating the silicon single crystal is set to 1.0 ⁇ 10 15 (electrons/cm 2 )
- the predetermined temperature when measuring the intensity of the C line and the intensity of the G line is set to liquid helium temperature
- the unit of the carbon concentration is (atoms/cm 3 )
- the unit of the oxygen concentration is (ppma-JEITA)
- the C line intensity and the G line intensity are relative values
- the value of the proportionality constant ⁇ can be set to 2.25 ⁇ 10 -15 without performing the preliminary test (that is, the equation (6)).
- the predetermined dose of the electron beam when irradiating the silicon single crystal is set to 1.0 ⁇ 10 15 (electrons/cm 2 )
- the predetermined temperature when measuring the intensity of the C line and the intensity of the G line is set to liquid nitrogen temperature
- the value of the proportionality constant ⁇ can be set to 3.55 ⁇ 10 -15 without performing the preliminary test.
- the proportionality constant ⁇ can be determined without the need for a preliminary test or preparation of a calibration curve, and the oxygen concentration can be evaluated more simply. Note that, as a matter of course, the proportionality constant ⁇ is not limited thereto.
- the proportionality constant ⁇ is different when the electron beam dose is not 1.0 ⁇ 10 15 (electrons/cm 2 ), or when ion beam irradiation is performed instead of the electron beam irradiation. In that case, it is possible to determine the proportionality constant ⁇ by substituting the oxygen concentration, the carbon concentration, the G line intensity, and the C line intensity obtained by a sample measurement into the relational equation (5) in the same manner, calculating the proportionality constant ⁇ for each sample, and determining the average thereof as the preliminary test.
- the dose can be within the range of 1 ⁇ 10 12 to 1 ⁇ 10 14 (atoms/cm 3 ), for example. In this range, sufficient carbon-related composite defects for measuring can be formed, and the time required for the ion-beam irradiation does not become too long.
- the oxygen concentration to be measured is affected, and therefore, the ion beam is preferably of an ion of one or more selected from boron, phosphorus, arsenic, antimony, hydrogen, helium, argon, germanium, fluorine, nitrogen, silicon, aluminum, indium, and xenon.
- the oxygen concentration can be quantified from the carbon concentration, the G line intensity, and the C line intensity in a silicon single crystal substrate with an unknown oxygen concentration.
- oxygen concentrations there are no limits to the oxygen concentration that can be quantified by this method, and oxygen concentrations of various ranges can be quantified.
- the lower detection limit of the oxygen concentration is 0.07 (ppma-JEITA) in the FT-IR method and 0.02 (ppma) in the SIMS method, but oxygen concentrations at or less than these lower detection limits can be quantified by the inventive method for evaluating an oxygen concentration.
- the inventive method for evaluating an oxygen concentration was performed to evaluate the oxygen concentration of the silicon single crystals for evaluation.
- the temperature of every sample handled here was liquid helium temperature, and electron-beam irradiation conditions were: an acceleration voltage of 2 (MV); and a dose of 1.0 ⁇ 10 15 (electrons/cm 2 ).
- the value of the ⁇ in the equation (5) can be determined by performing a preliminary test, but under the above conditions, the value of the proportionality constant ⁇ was set to 2.25 ⁇ 10 -15 as already made clear in the above specific example. That is, the equation (6) was used here.
- silicon single crystal wafers were cut out from silicon single crystal ingots with different carbon concentrations and oxygen concentrations pulled by a CZ method or an FZ method to fabricate 105 samples (hereinafter, referred to as samples for oxygen concentration measurement).
- the carbon concentrations of the samples for oxygen concentration measurement were measured by a SIMS method.
- the carbon concentrations of the 105 samples were within the range of 1.0 ⁇ 10 14 to 7.3 ⁇ 10 15 (atoms/cm 3 ) .
- the samples for oxygen concentration measurement were irradiated with an electron beam using an electron beam irradiation apparatus (an acceleration voltage of 2 (MV) and a dose of 1.0 ⁇ 10 15 (electrons/cm 2 )).
- Emission spectra of the samples for oxygen concentration measurement irradiated with the electron beam were measured using a photoluminescence measurement apparatus with the sample temperature as liquid helium temperature, and a G line intensity and a C line intensity were obtained.
- the relation between the oxygen concentrations (the oxygen concentrations in the Comparative Example) quantified by the FT-IR method, which is a conventional method, and the oxygen concentrations (the oxygen concentrations in the Example) quantified by the inventive method were plotted in FIG. 3 .
- the oxygen concentrations of 2 samples out of the samples shown in FIG. 4 were evaluated by the SIMS method (Comparative Example), the oxygen concentrations (0.022 ppma) of the samples that were detected by the SIMS method were extremely consistent with the oxygen concentrations (Example: 0.023 ppma) detected by the present invention, and the adequacy of the present invention was confirmed.
- the oxygen concentrations of the samples that were the lower detection limit (0.02 ppma) or less in the SIMS method (Comparative Example) were 0.013 ppma when detected by the present invention (Example), and there were no inconsistencies in the result.
- the inventive evaluation method makes it possible to quantify an oxygen concentration from the ratio of the luminescence intensities of a C line and a G line and from the carbon concentration in the silicon single crystal. Moreover, the evaluation can be performed with high sensitivity.
Landscapes
- Chemical & Material Sciences (AREA)
- Engineering & Computer Science (AREA)
- Organic Chemistry (AREA)
- Metallurgy (AREA)
- Materials Engineering (AREA)
- Crystallography & Structural Chemistry (AREA)
- Biochemistry (AREA)
- Life Sciences & Earth Sciences (AREA)
- Immunology (AREA)
- Pathology (AREA)
- General Health & Medical Sciences (AREA)
- Physics & Mathematics (AREA)
- Analytical Chemistry (AREA)
- General Physics & Mathematics (AREA)
- Health & Medical Sciences (AREA)
- Analysing Materials By The Use Of Radiation (AREA)
- Testing Or Measuring Of Semiconductors Or The Like (AREA)
- Investigating, Analyzing Materials By Fluorescence Or Luminescence (AREA)
- Crystals, And After-Treatments Of Crystals (AREA)
- Investigating Or Analysing Materials By Optical Means (AREA)
- Other Investigation Or Analysis Of Materials By Electrical Means (AREA)
Abstract
Description
- The present invention relates to a method for evaluating an oxygen concentration in a silicon single crystal.
- Methods for measuring an impurity concentration in a silicon single crystal with high sensitivity include low-temperature photoluminescence (PL) methods.
- Two kinds of method for quantifying an oxygen concentration by a low-temperature PL method are disclosed in
Patent Document 1. The first method is a method of irradiating a sample with an electron beam, and a carbon ion or an oxygen ion to form composite defects and measuring a luminescence intensity attributable to the composite defects to quantify the oxygen concentration from the intensity. The second method is a method of irradiating a sample with a large quantity of carbon ion beam to form composite defects and measuring a luminescence intensity attributable to the composite defects to quantify the oxygen concentration from the intensity. - In addition, as a method for quantifying a carbon concentration by a low-temperature PL method, for example,
Non Patent Document 1 andPatent Document 1 disclose a method of irradiating a sample with an electron beam, or an ion beam of a carbon ion or an oxygen ion to form composite defects and measuring a luminescence intensity attributable to the composite defects to quantify the carbon concentration from the intensity. -
Patent Document 2 discloses a method of preparing a calibration curve from a value obtained by standardizing, with the use of an emission line (TO line) derived from silicon, a luminescence spectrum (W line) derived from interstitial silicon (I) introduced by irradiating the silicon single crystal with an electron beam, and a carbon concentration in the silicon single crystal, and quantifying the carbon concentration from the W line/TO line obtained by a luminescence method. -
Patent Document 3 discloses a method of injecting ions other than carbon or oxygen into a silicon single crystal, preparing a calibration curve from a luminescence spectrum intensity of interstitial carbon, Ci-Cs, or Ci-Oi formed in this manner, and a carbon concentration, and quantifying the carbon concentration from a spectrum intensity of carbon-related composite defects. - An FT-IR method or a SIMS method is generally used as a method for measuring an oxygen concentration in a silicon single crystal. Lower detection limits thereof are 0.07 (ppma-JEITA) in the FT-IR method, and 0.02 (ppma) in the SIMS method.
-
- Patent Document 1: Japanese Unexamined Patent Application Publication No.
H04-344443 - Patent Document 2: Japanese Unexamined Patent Application Publication No.
2015-111615 - Patent Document 3: Japanese Unexamined Patent Application Publication No.
2015-156420 - Non Patent Document 1: M. Nakamura et al., J.Electochem.Soc.141,3576(1994)
- Methods for measuring an impurity concentration with high sensitivity by measuring an intensity of composite defects formed in a silicon single crystal include low-temperature PL methods, but as described above, many of the methods are methods for measuring a carbon concentration.
-
Patent Document 1 discloses a method for measuring an oxygen concentration by a low-temperature PL method, which is a method of determining the oxygen concentration by irradiating with a large quantity of carbon ion beam or both an electron beam and an ion beam. However, when irradiation is performed with an ion beam of oxygen or carbon, the ions for irradiation affect the formation of Ci-Cs and Ci-Oi, and therefore, the oxygen concentration determined using this photoluminescence intensity is inaccurate. - In addition, as described above, an FT-IR method and a SIMS method are common as methods for measuring an oxygen concentration in a silicon single crystal, but sensitivity is poor with these methods, and lower detection limits thereof are 0.07 (ppma-JEITA) in the FT-IR method, and 0.02 (ppma) in the SIMS method.
- When oxygen is present in a silicon single crystal, Ci-Oi is apt to be formed. Since these composite defects become lifetime killers, which shorten lifetime, low oxygen is desired particularly in power devices. Accordingly, it is important to measure oxygen with high sensitivity.
- The present invention has been made in view of the problems in the above-described conventional technology, and an object thereof is to provide a method for evaluating an oxygen concentration in a silicon single crystal with high sensitivity.
- To achieve the object, the present invention provides a method for evaluating an oxygen concentration of evaluating an oxygen concentration in a silicon single crystal by a photoluminescence method or a cathode luminescence method, wherein
the silicon single crystal is irradiated with an electron beam at a predetermined dose or an ion beam other than carbon or oxygen at a predetermined dose, intensity of an emission line (C line) derived from composite defects Ci-Oi of interstitial carbon Ci and interstitial oxygen Oi formed in the silicon single crystal and intensity of an emission line (G line) derived from composite defects Ci-Cs of interstitial carbon Ci and substitutional carbon Cs formed in the silicon single crystal are measured at a predetermined temperature, an intensity ratio of the C line and the G line (Ci-Oi intensity/Ci-Cs intensity) is determined, and
the oxygen concentration [Oi] is evaluated by
substituting the intensity ratio (Ci-Oi intensity/Ci-Cs intensity) and a carbon concentration [Cs] in the silicon single crystal into the following equation:
- The method for evaluating an oxygen concentration of the present invention by a photoluminescence method or a cathode luminescence (CL) method as described makes it possible to quantify oxygen concentration with high sensitivity from the ratio of the luminescence intensities of the carbon-related composite defects (the composite defects Ci-Oi and the composite defects Ci-Cs described above) in the silicon single crystal and the carbon concentration in the silicon single crystal.
- In this event, when evaluating the oxygen concentration, the following can be performed in advance:
- a test crystal which is a silicon single crystal with a known oxygen concentration and a known carbon concentration is prepared,
- the test crystal is irradiated with the electron beam at the predetermined dose or the ion beam other than carbon or oxygen at the predetermined dose, intensity of a C line and intensity of a G line formed in the test crystal are measured at a predetermined temperature, an intensity ratio of the C line and the G line (Ci-Oi intensity/Ci-Cs intensity) in the test crystal is determined, and
- a value of the proportionality constant α is determined from the oxygen concentration and the carbon concentration in the test crystal, the intensity ratio of the C line and the G line in the test crystal (Ci-Oi intensity/Ci-Cs intensity), and the equation.
- The proportionality constant α varies depending on the temperature (sample temperature) when measuring the luminescence intensity and the conditions (dose) of the electron-beam irradiation and the ion-beam irradiation, and therefore, when an oxygen concentration of a silicon single crystal substrate is measured at a different sample temperature, electron-beam irradiation conditions or ion-beam irradiation conditions, the proportionality constant α is more preferably determined for each case. Accordingly, as described above, the preliminary test described above can be performed using a test crystal to determine in advance the proportionality constant α under the same conditions as when the oxygen concentration in the silicon single crystal to be evaluated is evaluated. In this manner, various conditions can be addressed more appropriately, and the oxygen concentration can be evaluated with higher precision.
- Or else when the predetermined dose of the electron beam when irradiating the silicon single crystal is set to 1.0×10¹⁵ (electrons/cm2), the predetermined temperature when measuring the intensity of the C line and the intensity of the G line is set to liquid helium temperature, a unit of the carbon concentration is (atoms/cm3), a unit of the oxygen concentration is (ppma-JEITA), and the C line intensity and the G line intensity are relative values,
a value of the proportionality constant α can be set to 2.25×10⁻¹⁵. - Or, when the predetermined dose of the electron beam when irradiating the silicon single crystal is set to 1.0×10¹⁵ (electrons/cm2), the predetermined temperature when measuring the intensity of the C line and the intensity of the G line is set to liquid nitrogen temperature, a unit of the carbon concentration is (atoms/cm3), a unit of the oxygen concentration is (ppma-JEITA), and the C line intensity and the G line intensity are relative values,
a value of the proportionality constant α can be set to 3.55×10⁻¹⁵. - When a silicon single crystal substrate is evaluated in accordance with the above sample temperature and dose of the electron beam or the like, the oxygen concentration can be quantified immediately just by measuring the luminescence intensity of the carbon-related composite defects and the carbon concentration. By thus fixing the conditions of the sample temperature and the dose of the electron beam or the like, the oxygen concentration can be evaluated more simply without preparing a calibration curve, etc.
- Furthermore, the ion beam for irradiating the silicon single crystal other than carbon or oxygen can be an ion beam of one or more of boron, phosphorus, arsenic, antimony, hydrogen, helium, argon, germanium, fluorine, nitrogen, silicon, aluminum, indium, and xenon.
- In conventional methods that use an ion beam of oxygen or carbon, the ions for irradiation affect the formation of carbon-related composite defects, and this has an effect on the oxygen concentration to be evaluated. However, by using an ion beam of one or more of the above as in the present invention, such effects can be prevented more certainly from occurring.
- Furthermore, the carbon concentration in the silicon single crystal can be 1.0×10¹⁴ (atoms/cm3) or more.
- On substituting the carbon concentration into the equation, the carbon concentration in the silicon single crystal to be evaluated can be set within the above range so that the carbon concentration can be measured with more certainty by an FT-IR method or a SIMS method, for example, when determining the carbon concentration.
- As described above, an oxygen concentration can be evaluated by the inventive method for evaluating an oxygen concentration with higher sensitivity than by conventional methods.
-
-
FIG. 1 is a flow diagram showing an example of the steps of the inventive method for evaluating an oxygen concentration. -
FIG. 2 is a graph showing the relation of the proportionality constant α when the sample temperature is liquid helium temperature to the oxygen concentration in a silicon single crystal. -
FIG. 3 is a graph showing the relation between the oxygen concentrations evaluated in the Example and the Comparative Example (FT-IR method). -
FIG. 4 is a graph showing the evaluation data of the samples having oxygen concentrations of less than 0.07 (ppma-JEITA) in the Example. - Hereinafter, embodiments of the present invention will be described with reference to the figures, but the present invention is not limited thereto.
- Firstly, the process by which the present inventors have derived an equation (oxygen concentration relational equation) by which the oxygen concentration in the silicon single crystal can be evaluated from the carbon concentration in the silicon single crystal, and the intensity ratio (Ci-Oi intensity/Ci-Cs intensity) of the Ci-Oi (C line) and the Ci-Cs (G line), which are carbon-related composite defects, will be described.
- According to
Non Patent Document 1, when a silicon single crystal substrate is irradiated with an electron beam having high energy, a silicon atom at a lattice position is flicked out, and pairs of an interstitial silicon (hereinafter, referred to as I) and a vacancy (hereinafter, referred to as V) which is an empty shell thereof are produced. Since the excessively produced I or V is unstable when alone, they recombine (V+I→0), clustering of Is or clustering of Vs occurs, or they react with an impurity contained in the silicon substrate to form a composite. - When substitutional carbon Cs is present in the silicon single crystal substrate, interstitial carbon Ci is produced by I, which is produced by electron-beam irradiation, flicking out Cs. Furthermore, Ci forms Ci-Cs (G line) by reacting with other Cs, or forms Ci-Oi (C line) by reacting with interstitial oxygen Oi, which is another impurity contained in the silicon substrate.
- When the equilibrium constants in the formation of this Ci-Cs and Ci-Oi are defined as K1 and K2 (the following expressions (1) and (2), and equation [4] and equation [5] in Non Patent Document 1), the following equations (3) and (4) are obtained since the formation of Ci-Cs and the formation of Ci-Oi are competing reactions.
- Note that [Oi] indicates interstitial oxygen concentration (also referred to simply as oxygen concentration), [Cs] indicates substitutional carbon concentration (also referred to simply as carbon concentration), [Ci] indicates interstitial carbon concentration, [CiCs] indicates G line intensity (Ci-Cs intensity), and [CiOi] indicates C line intensity (Ci-Oi intensity).
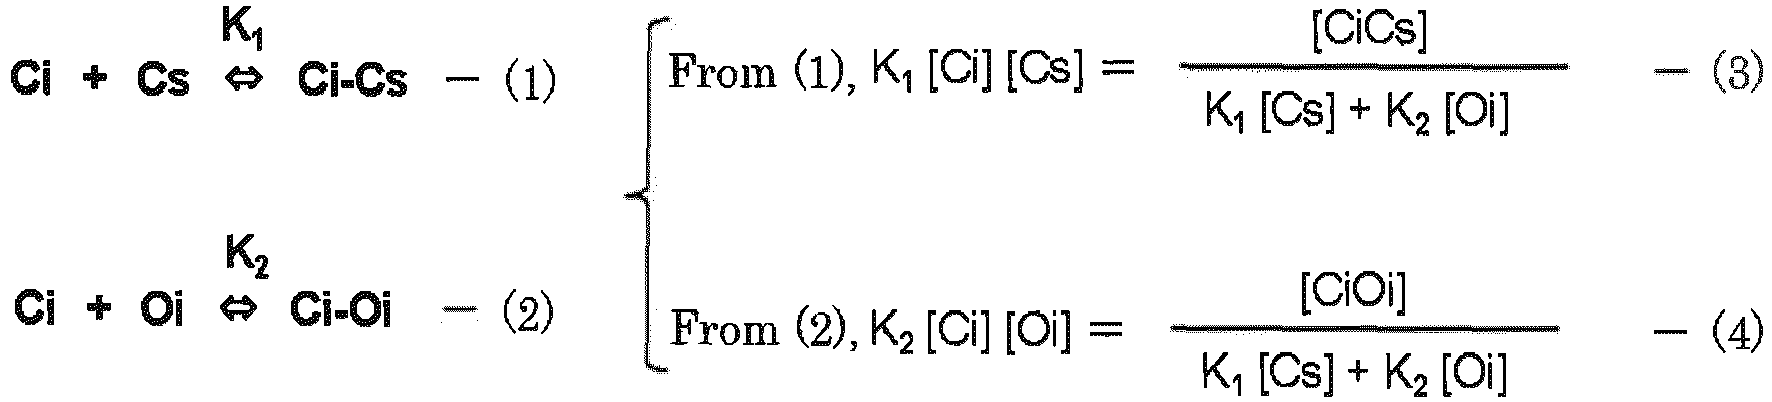
- Here, the following oxygen concentration relational equation (5) (hereinafter, also referred to simply as equation (5) or relational equation (5)) can be obtained by combining the like terms in the equations (3) and (4) and solving for [Oi].

- Here, the proportionality constant α is a constant that varies depending on sample temperature, electron-beam irradiation conditions, and ion-beam irradiation conditions. This is because luminous efficiency of the G line and the C line change when the sample temperature is different, and the obtained G line intensity and C line intensity change. In addition, when the electron-beam irradiation conditions and the ion-beam irradiation conditions are different, the formation ratio of Ci-Cs and Ci-Oi becomes different, and therefore, the proportionality constant α changes.
- Hereinafter, the inventive method for evaluating an oxygen concentration using the oxygen concentration relational equation (5) will be described.
FIG. 1 is a flow diagram showing the steps of the inventive method for evaluation. The example inFIG. 1 consists of a main test for evaluating a sample for evaluation and a preliminary test for determining the value of α in the equation (5) in advance. The preliminary test may be performed at any time as long as it is before thestep 4 of the main test when carbon concentration, etc. are actually substituted into the equation (5). - The preliminary test will be described.
- As stated above, the value of the proportionality constant α in the equation (5) varies depending on sample temperature, electron-beam irradiation conditions, and ion-beam irradiation conditions. Therefore, firstly, a test crystal which is a silicon single crystal with a known oxygen concentration and a known carbon concentration is prepared, and irradiation and measurement are performed under the same conditions as the main test (a sample temperature at a predetermined temperature, and an electron beam or an ion beam (other than carbon or oxygen) at a predetermined dose) to determine the intensity ratio (Ci-Oi intensity/Ci-Cs intensity) of the C line and the G line. Next, the value of the proportionality constant α is determined from the oxygen concentration and the carbon concentration in the test crystal, the intensity ratio (Ci-Oi intensity/Ci-Cs intensity) of the C line and the G line in the test crystal, and the equation (5).
- In accordance with various conditions of the main test, a proportionality constant α can be obtained in advance in the preliminary test under the same conditions as the conditions of the main test, and in this manner, the oxygen concentration can be evaluated with higher precision in the main test.
- Here, a more specific example will be given for explanation.
- 15 levels of silicon single crystal substrates (test crystal samples) with different carbon concentrations and oxygen concentrations were prepared by a CZ method.
- A reason for preparing silicon single crystal substrates with different carbon concentrations is to verify that the oxygen concentration can be quantified from one relational equation even when the carbon concentration is different. Note that in order to make it possible to detect the oxygen concentration with more certainty by FT-IR, and in order to prevent with more certainty the S/N ratio of the G line from being degraded due to increase of spending the Ci for the formation of a C line, the oxygen concentration range of the silicon single crystal substrates prepared here was 3 to 17 (ppma-JEITA).
- Furthermore, samples of 15 levels were prepared here, where at least 5 levels are desired, to improve the precision of the proportionality constant α to be obtained.
- Next, the carbon concentration of these samples was measured by a SIMS method and the oxygen concentration of these samples was measured by an FT-IR method.
- Subsequently, each silicon single crystal substrate was irradiated with an electron beam of 1.0×10¹⁵ (electrons/cm2) at an acceleration voltage of 2 (MV) by an electron beam irradiation apparatus to form Ci-Cs and Ci-Oi in the silicon single crystal substrate, and the peak intensities thereof were measured by a photoluminescence method. The sample temperature at the time of this measurement was set to liquid helium temperature.
- In these silicon single crystal substrates, the obtained oxygen concentration, carbon concentration, G line intensity, and C line intensity were substituted into the above equation (5), and the obtained proportionality constant α was plotted on the graph in relation to the oxygen concentration. The results are shown in
FIG. 2 . - Since the proportionality constant α showed an almost constant value, the average of the 15 levels of sample was taken as the α, and 2.25×10⁻¹⁵ was obtained. Here the units are each (atoms/cm3) for the carbon concentration, (ppma-JEITA) for the oxygen concentration, and relative value (a.u.) for the G line intensity and the C line intensity.
- The oxygen concentration relational equation (6) under these conditions was determined from the above.

- In addition, when the proportionality constant α with the sample temperature as liquid nitrogen was determined by the same method, 3.55×10⁻¹⁵ was obtained.
- Next, the main test will be described.
- Firstly, in the present invention, a silicon single crystal substrate, which is a sample for evaluation is prepared (step 1). This silicon single crystal substrate is not particularly limited, and may be made by a Czochralski method (CZ method) or a floating zone method (FZ method), for example.
- Note that on evaluating the oxygen concentration, the carbon concentration will be measured and substituted into the relational equation described above in subsequent steps, and the carbon concentration is preferably 1.0×10¹⁴ (atoms/cm3) or more, for example, so that it can be detected and measured more certainly in the measurement by FT-IR or SIMS, for example. That is, when the carbon concentration is 1.0×10¹⁴ (atoms/cm3) or more, the carbon concentration can be determined with higher precision, and therefore, precision of the oxygen concentration determined in the present invention can also be raised. The upper limit of the carbon concentration is not limited, and can be any value as long as it can be measured.
- In addition, the oxygen concentration itself is not particularly limited.
- Next, the carbon concentration (substitutional carbon concentration) of the sample for evaluation is measured (step 2). The measurement can be by the FT-IR method or the SIMS method, for example. The method for measuring the carbon concentration can be any method as long as the carbon concentration in the sample for evaluation can be determined, and is not particularly limited.
- Next, by the PL method or the CL method, the sample for evaluation is irradiated with an electron beam or an ion beam other than carbon or oxygen, intensity of an emission line (C line) derived from formed composite defects Ci-Oi and emission intensity of an emission line (G line) derived from formed composite defects Ci-Cs are measured, and the intensity ratio of the C line and the G line is determined (step 3). The peak intensity of each is measured, and the ratio thereof is determined.
- In this event, the temperature of the sample for evaluation can be, for example, liquid helium temperature or liquid nitrogen temperature. The temperature is not particularly limited, but at such temperatures, the G line and the C line have broad peaks, and the correct intensity can be prevented more effectively from becoming impossible to measure.
- In addition, the electron beam dose can be set within the range of 2.5×10¹⁴ to 2.5×10¹⁶ (electrons/cm2), for example. When the dose is within this range, problems such as Ci-Cs or Ci-Oi not being formed due to the electron beam dose being too little can be prevented from occurring with more certainty. Furthermore, it is possible to prevent more certainly, the silicon lattice from becoming disarranged due to the electron beam dose being too large and the S/N ratio of the G line or the C line from being degraded.
- In addition, the measurement depth can be changed in the CL method by changing the acceleration voltage of electrons, and in the PL method by changing the wavelength of the laser light, and therefore, it is possible to evaluate up to a desired depth from the sample surface by adjusting these conditions.
- Next, the carbon concentration and the intensity ratio of the C line and the G line are substituted into the above oxygen concentration relational equation (5) to evaluate the oxygen concentration (step 4).
- As the value of the proportionality constant α in the equation (5), the value of the proportionality constant α determined in the preliminary test under the same conditions as the main test (the sample temperature at the predetermined temperature, the electron beam at the predetermined dose, or the ion beam other than carbon or oxygen at the predetermined dose) can be used.
- Other than that, as already clarified in the above-described example, when the predetermined dose of the electron beam when irradiating the silicon single crystal is set to 1.0×10¹⁵ (electrons/cm2), the predetermined temperature when measuring the intensity of the C line and the intensity of the G line is set to liquid helium temperature, the unit of the carbon concentration is (atoms/cm3), the unit of the oxygen concentration is (ppma-JEITA), and the C line intensity and the G line intensity are relative values, the value of the proportionality constant α can be set to 2.25×10⁻¹⁵ without performing the preliminary test (that is, the equation (6)).
- On the other hand, when the predetermined dose of the electron beam when irradiating the silicon single crystal is set to 1.0×10¹⁵ (electrons/cm2), the predetermined temperature when measuring the intensity of the C line and the intensity of the G line is set to liquid nitrogen temperature, the value of the proportionality constant α can be set to 3.55×10⁻¹⁵ without performing the preliminary test.
- Under the above conditions, the proportionality constant α can be determined without the need for a preliminary test or preparation of a calibration curve, and the oxygen concentration can be evaluated more simply. Note that, as a matter of course, the proportionality constant α is not limited thereto.
- Furthermore, the proportionality constant α is different when the electron beam dose is not 1.0×10¹⁵ (electrons/cm2), or when ion beam irradiation is performed instead of the electron beam irradiation. In that case, it is possible to determine the proportionality constant α by substituting the oxygen concentration, the carbon concentration, the G line intensity, and the C line intensity obtained by a sample measurement into the relational equation (5) in the same manner, calculating the proportionality constant α for each sample, and determining the average thereof as the preliminary test.
- In addition, as the ion-beam irradiation conditions, the dose can be within the range of 1×10¹² to 1×10¹⁴ (atoms/cm3), for example. In this range, sufficient carbon-related composite defects for measuring can be formed, and the time required for the ion-beam irradiation does not become too long.
- In addition, if an ion beam of oxygen or carbon is used for irradiation, the oxygen concentration to be measured is affected, and therefore, the ion beam is preferably of an ion of one or more selected from boron, phosphorus, arsenic, antimony, hydrogen, helium, argon, germanium, fluorine, nitrogen, silicon, aluminum, indium, and xenon.
- By such an inventive method for evaluation, the oxygen concentration can be quantified from the carbon concentration, the G line intensity, and the C line intensity in a silicon single crystal substrate with an unknown oxygen concentration.
- Furthermore, there are no limits to the oxygen concentration that can be quantified by this method, and oxygen concentrations of various ranges can be quantified. For example, the lower detection limit of the oxygen concentration is 0.07 (ppma-JEITA) in the FT-IR method and 0.02 (ppma) in the SIMS method, but oxygen concentrations at or less than these lower detection limits can be quantified by the inventive method for evaluating an oxygen concentration.
- Hereinafter, the present invention will be described more specifically with reference to Examples of the present invention and Comparative Examples, but the present invention is not limited thereto.
- The inventive method for evaluating an oxygen concentration was performed to evaluate the oxygen concentration of the silicon single crystals for evaluation.
- The temperature of every sample handled here was liquid helium temperature, and electron-beam irradiation conditions were: an acceleration voltage of 2 (MV); and a dose of 1.0×10¹⁵ (electrons/cm2).
- The value of the α in the equation (5) can be determined by performing a preliminary test, but under the above conditions, the value of the proportionality constant α was set to 2.25×10⁻¹⁵ as already made clear in the above specific example. That is, the equation (6) was used here.
- Subsequently, silicon single crystal wafers were cut out from silicon single crystal ingots with different carbon concentrations and oxygen concentrations pulled by a CZ method or an FZ method to fabricate 105 samples (hereinafter, referred to as samples for oxygen concentration measurement).
- Next, the carbon concentrations of the samples for oxygen concentration measurement were measured by a SIMS method. As a result, the carbon concentrations of the 105 samples were within the range of 1.0×10¹⁴ to 7.3×10¹⁵ (atoms/cm3) .
- Subsequently, the samples for oxygen concentration measurement were irradiated with an electron beam using an electron beam irradiation apparatus (an acceleration voltage of 2 (MV) and a dose of 1.0×10¹⁵ (electrons/cm2)). Emission spectra of the samples for oxygen concentration measurement irradiated with the electron beam were measured using a photoluminescence measurement apparatus with the sample temperature as liquid helium temperature, and a G line intensity and a C line intensity were obtained.
- These values were substituted into the relational equation (6), and the oxygen concentration of each sample for oxygen concentration measurement was calculated.
- Note that the oxygen concentrations determined here were compared with values determined by an FT-IR method, which is a conventional method, to confirm the adequacy of the inventive evaluation method. Accordingly, the Comparative Examples performed by a conventional method will be described next.
- Samples for oxygen concentration measurement similar to those in the Example were prepared, and the oxygen concentrations thereof were evaluated by the FT-IR method and the SIMS method.
- Regarding the samples for oxygen concentration measurement, the relation between the oxygen concentrations (the oxygen concentrations in the Comparative Example) quantified by the FT-IR method, which is a conventional method, and the oxygen concentrations (the oxygen concentrations in the Example) quantified by the inventive method were plotted in
FIG. 3 . - Here, since oxygen concentrations of less than 0.07 (ppma-JEITA) cannot be quantified by the FT-IR method, the evaluation data of the samples in the Example with oxygen concentrations of less than 0.07 (ppma-JEITA) are shown separately in
FIG. 4 . - Since the oxygen concentrations evaluated by the inventive method (Example) were well consistent with the oxygen concentrations evaluated by the conventional method (Comparative Example) in
FIG. 3 , it was confirmed that the present invention was valid. - Furthermore, when the oxygen concentrations of 2 samples out of the samples shown in
FIG. 4 were evaluated by the SIMS method (Comparative Example), the oxygen concentrations (0.022 ppma) of the samples that were detected by the SIMS method were extremely consistent with the oxygen concentrations (Example: 0.023 ppma) detected by the present invention, and the adequacy of the present invention was confirmed. In addition, the oxygen concentrations of the samples that were the lower detection limit (0.02 ppma) or less in the SIMS method (Comparative Example) were 0.013 ppma when detected by the present invention (Example), and there were no inconsistencies in the result. - From the above results, it was confirmed that even oxygen concentrations in a range that cannot be quantified by the FT-IR method, whose lower detection limit is 0.07 (ppma-JEITA) or the SIMS method, whose lower detection limit is 0.02 (ppma) can be quantified by the inventive evaluation method, since the luminescence intensities of the C line and the G line can be obtained.
- In this manner, the inventive evaluation method makes it possible to quantify an oxygen concentration from the ratio of the luminescence intensities of a C line and a G line and from the carbon concentration in the silicon single crystal. Moreover, the evaluation can be performed with high sensitivity.
- In addition, when an oxygen concentration was determined in the same manner as in the Example except that the sample temperature at the time of the measurement by the PL method was set to liquid nitrogen temperature and that the value of the proportionality constant α in the equation for calculating the oxygen concentration was changed to 3.55×10⁻¹⁵, similar results to those in
FIGs. 3 and 4 were obtained. - Furthermore, when a preliminary test was performed under different electron-beam irradiation conditions and sample temperature to determine the proportionality constant α and a main test was performed to determine an oxygen concentration, again, similar results were obtained.
- It should be noted that the present invention is not limited to the above-described embodiments. The embodiments are just examples, and any examples that have substantially the same feature and demonstrate the same functions and effects as those in the technical concept disclosed in claims of the present invention are included in the technical scope of the present invention.
Claims (6)
- A method for evaluating an oxygen concentration of evaluating an oxygen concentration in a silicon single crystal by a photoluminescence method or a cathode luminescence method, wherein
the silicon single crystal is irradiated with an electron beam at a predetermined dose or an ion beam other than carbon or oxygen at a predetermined dose, intensity of an emission line (C line) derived from composite defects Ci-Oi of interstitial carbon Ci and interstitial oxygen Oi formed in the silicon single crystal and intensity of an emission line (G line) derived from composite defects Ci-Cs of interstitial carbon Ci and substitutional carbon Cs formed in the silicon single crystal are measured at a predetermined temperature, an intensity ratio of the C line and the G line (Ci-Oi intensity/Ci-Cs intensity) is determined, and
the oxygen concentration [Oi] is evaluated by substituting the intensity ratio (Ci-Oi intensity/Ci-Cs intensity) and a carbon concentration [Cs] in the silicon single crystal into the following equation:
- The method for evaluating an oxygen concentration according to claim 1, wherein
when evaluating the oxygen concentration, the following is performed in advance:a test crystal which is a silicon single crystal with a known oxygen concentration and a known carbon concentration is prepared,the test crystal is irradiated with the electron beam at the predetermined dose or the ion beam other than carbon or oxygen at the predetermined dose, intensity of a C line and intensity of a G line formed in the test crystal are measured at a predetermined temperature, an intensity ratio of the C line and the G line (Ci-Oi intensity/Ci-Cs intensity) in the test crystal is determined, anda value of the proportionality constant α is determined from the oxygen concentration and the carbon concentration in the test crystal, the intensity ratio of the C line and the G line in the test crystal (Ci-Oi intensity/Ci-Cs intensity), and the equation. - The method for evaluating an oxygen concentration according to claim 1, wherein
when the predetermined dose of the electron beam when irradiating the silicon single crystal is set to 1.0×10¹⁵ (electrons/cm2), the predetermined temperature when measuring the intensity of the C line and the intensity of the G line is set to liquid helium temperature, a unit of the carbon concentration is (atoms/cm3), a unit of the oxygen concentration is (ppma-JEITA), and the C line intensity and the G line intensity are relative values,
a value of the proportionality constant α is set to 2.25×10⁻¹⁵. - The method for evaluating an oxygen concentration according to claim 1, wherein
when the predetermined dose of the electron beam when irradiating the silicon single crystal is set to 1.0×10¹⁵ (electrons/cm2), the predetermined temperature when measuring the intensity of the C line and the intensity of the G line is set to liquid nitrogen temperature, a unit of the carbon concentration is (atoms/cm3), a unit of the oxygen concentration is (ppma-JEITA), and the C line intensity and the G line intensity are relative values,
a value of the proportionality constant α is set to 3.55×10⁻¹⁵. - The method for evaluating an oxygen concentration according to claim 1 or 2, wherein
the ion beam for irradiating the silicon single crystal other than carbon or oxygen is an ion beam of one or more of boron, phosphorus, arsenic, antimony, hydrogen, helium, argon, germanium, fluorine, nitrogen, silicon, aluminum, indium, and xenon. - The method for evaluating an oxygen concentration according to any one of claims 1 to 5, wherein
the carbon concentration in the silicon single crystal is 1.0×10¹⁴ (atoms/cm3) or more.
Applications Claiming Priority (2)
| Application Number | Priority Date | Filing Date | Title |
|---|---|---|---|
| JP2018042902A JP6844561B2 (en) | 2018-03-09 | 2018-03-09 | Oxygen concentration evaluation method |
| PCT/JP2019/004687 WO2019171880A1 (en) | 2018-03-09 | 2019-02-08 | Oxygen concentration evaluation method |
Publications (3)
| Publication Number | Publication Date |
|---|---|
| EP3764392A1 true EP3764392A1 (en) | 2021-01-13 |
| EP3764392A4 EP3764392A4 (en) | 2021-12-01 |
| EP3764392B1 EP3764392B1 (en) | 2023-08-09 |
Family
ID=67846013
Family Applications (1)
| Application Number | Title | Priority Date | Filing Date |
|---|---|---|---|
| EP19764636.7A Active EP3764392B1 (en) | 2018-03-09 | 2019-02-08 | Oxygen concentration evaluation method |
Country Status (6)
| Country | Link |
|---|---|
| EP (1) | EP3764392B1 (en) |
| JP (1) | JP6844561B2 (en) |
| CN (1) | CN111868902B (en) |
| DK (1) | DK3764392T3 (en) |
| TW (1) | TWI812675B (en) |
| WO (1) | WO2019171880A1 (en) |
Families Citing this family (1)
| Publication number | Priority date | Publication date | Assignee | Title |
|---|---|---|---|---|
| JP2025162887A (en) * | 2024-04-16 | 2025-10-28 | 信越半導体株式会社 | Measurement method for oxygen concentration of oxygen atom layer |
Family Cites Families (12)
| Publication number | Priority date | Publication date | Assignee | Title |
|---|---|---|---|---|
| JPH04344443A (en) | 1991-05-21 | 1992-12-01 | Hitachi Ltd | Measurement of carbon and oxygen density in silicon |
| JP5076326B2 (en) * | 2006-01-31 | 2012-11-21 | 株式会社Sumco | Silicon wafer and manufacturing method thereof |
| JP2010016169A (en) * | 2008-07-03 | 2010-01-21 | Shin Etsu Handotai Co Ltd | Epitaxial wafer and method for manufacturing epitaxial wafer |
| JP2010040587A (en) * | 2008-07-31 | 2010-02-18 | Covalent Materials Corp | Method of manufacturing silicon wafer |
| JP5993550B2 (en) * | 2011-03-08 | 2016-09-14 | 信越半導体株式会社 | Manufacturing method of silicon single crystal wafer |
| JP5772553B2 (en) * | 2011-12-06 | 2015-09-02 | 信越半導体株式会社 | Method for evaluating silicon single crystal and method for producing silicon single crystal |
| EP2779220B1 (en) * | 2013-03-12 | 2017-10-25 | GLobalWafers Japan Co., Ltd. | Saturation voltage estimation method and silicon epitaxial wafer manufaturing method |
| JP5921498B2 (en) * | 2013-07-12 | 2016-05-24 | グローバルウェーハズ・ジャパン株式会社 | Method for producing silicon single crystal |
| JP6098891B2 (en) * | 2013-11-28 | 2017-03-22 | 信越半導体株式会社 | Method for measuring carbon concentration in silicon single crystals |
| JP6048381B2 (en) | 2013-12-06 | 2016-12-21 | 信越半導体株式会社 | Method for evaluating carbon concentration in silicon single crystal and method for manufacturing semiconductor device |
| JP6036670B2 (en) * | 2013-12-10 | 2016-11-30 | 信越半導体株式会社 | Defect concentration evaluation method for silicon single crystal substrate |
| JP6075307B2 (en) | 2014-02-20 | 2017-02-08 | 信越半導体株式会社 | Method for evaluating carbon concentration in silicon single crystal and method for manufacturing semiconductor device |
-
2018
- 2018-03-09 JP JP2018042902A patent/JP6844561B2/en active Active
-
2019
- 2019-02-08 DK DK19764636.7T patent/DK3764392T3/en active
- 2019-02-08 CN CN201980018026.XA patent/CN111868902B/en active Active
- 2019-02-08 WO PCT/JP2019/004687 patent/WO2019171880A1/en not_active Ceased
- 2019-02-08 EP EP19764636.7A patent/EP3764392B1/en active Active
- 2019-02-19 TW TW108105410A patent/TWI812675B/en active
Also Published As
| Publication number | Publication date |
|---|---|
| JP6844561B2 (en) | 2021-03-17 |
| WO2019171880A1 (en) | 2019-09-12 |
| EP3764392B1 (en) | 2023-08-09 |
| CN111868902B (en) | 2024-07-05 |
| TW201939017A (en) | 2019-10-01 |
| JP2019160908A (en) | 2019-09-19 |
| EP3764392A4 (en) | 2021-12-01 |
| TWI812675B (en) | 2023-08-21 |
| DK3764392T3 (en) | 2023-09-04 |
| CN111868902A (en) | 2020-10-30 |
Similar Documents
| Publication | Publication Date | Title |
|---|---|---|
| Schaltegger et al. | Long-term repeatability and interlaboratory reproducibility of high-precision ID-TIMS U–Pb geochronology | |
| Fisher et al. | Guidelines for reporting zircon Hf isotopic data by LA-MC-ICPMS and potential pitfalls in the interpretation of these data | |
| JP6098891B2 (en) | Method for measuring carbon concentration in silicon single crystals | |
| US10330599B2 (en) | Calibration curve determination method, carbon concentration measurement method, and silicon wafer-manufacturing method | |
| EP2423956B1 (en) | Method of analyzing iron concentration of boron-doped p-type silicon wafer and method of manufacturing silicon wafer | |
| US8411263B2 (en) | Method of evaluating silicon wafer and method of manufacturing silicon wafer | |
| EP2779220B1 (en) | Saturation voltage estimation method and silicon epitaxial wafer manufaturing method | |
| US7145658B2 (en) | Apparatus and method for evaluating semiconductor material | |
| KR102029647B1 (en) | Defect density evaluation method for silicon single-crystal substrate | |
| Danby et al. | ESR of thermoluminescent centres in CaSO4 single crystals | |
| EP3764392B1 (en) | Oxygen concentration evaluation method | |
| Liu et al. | A practical guide to the double-spike technique for calcium isotope measurements by thermal ionization mass spectrometry (TIMS) | |
| JP6904313B2 (en) | Method for evaluating carbon concentration in silicon single crystal | |
| Sonder et al. | Impurities and secondary reactions in radiation defect production at liquid-nitrogen temperature in alkali halides | |
| EP3671817B1 (en) | Carbon concentration measurement method | |
| Qiu et al. | Calibration of thickness-dependent k-factors for germanium X-ray lines to improve energy-dispersive X-ray spectroscopy of SiGe layers in analytical transmission electron microscopy | |
| JP7218733B2 (en) | Oxygen concentration evaluation method for silicon samples | |
| JP2019124483A (en) | Carbon concentration evaluation method | |
| Barcz et al. | Extremely deep SIMS profiling: oxygen in FZ silicon | |
| JP6973361B2 (en) | Oxygen concentration measurement method | |
| JP6933201B2 (en) | Carbon concentration measurement method | |
| Wood et al. | An investigation of the structure of the F-band and envelope in LiF | |
| JP3319496B2 (en) | Method for detecting iron in silicon single crystal and evaluating iron contamination concentration | |
| JP2020092169A (en) | Method of evaluating nitrogen concentration in silicon single crystal substrate | |
| Maggiore et al. | Channeling and microactivation of materials |
Legal Events
| Date | Code | Title | Description |
|---|---|---|---|
| STAA | Information on the status of an ep patent application or granted ep patent |
Free format text: STATUS: THE INTERNATIONAL PUBLICATION HAS BEEN MADE |
|
| PUAI | Public reference made under article 153(3) epc to a published international application that has entered the european phase |
Free format text: ORIGINAL CODE: 0009012 |
|
| STAA | Information on the status of an ep patent application or granted ep patent |
Free format text: STATUS: REQUEST FOR EXAMINATION WAS MADE |
|
| 17P | Request for examination filed |
Effective date: 20200909 |
|
| AK | Designated contracting states |
Kind code of ref document: A1 Designated state(s): AL AT BE BG CH CY CZ DE DK EE ES FI FR GB GR HR HU IE IS IT LI LT LU LV MC MK MT NL NO PL PT RO RS SE SI SK SM TR |
|
| AX | Request for extension of the european patent |
Extension state: BA ME |
|
| DAV | Request for validation of the european patent (deleted) | ||
| DAX | Request for extension of the european patent (deleted) | ||
| A4 | Supplementary search report drawn up and despatched |
Effective date: 20211102 |
|
| RIC1 | Information provided on ipc code assigned before grant |
Ipc: G01N 23/2254 20180101ALI20211026BHEP Ipc: C30B 33/04 20060101ALI20211026BHEP Ipc: G01N 21/62 20060101ALI20211026BHEP Ipc: C30B 29/06 20060101ALI20211026BHEP Ipc: H01L 21/66 20060101AFI20211026BHEP |
|
| GRAP | Despatch of communication of intention to grant a patent |
Free format text: ORIGINAL CODE: EPIDOSNIGR1 |
|
| STAA | Information on the status of an ep patent application or granted ep patent |
Free format text: STATUS: GRANT OF PATENT IS INTENDED |
|
| RIC1 | Information provided on ipc code assigned before grant |
Ipc: G01N 23/2254 20180101ALI20230301BHEP Ipc: C30B 33/04 20060101ALI20230301BHEP Ipc: G01N 21/62 20060101ALI20230301BHEP Ipc: C30B 29/06 20060101ALI20230301BHEP Ipc: H01L 21/66 20060101AFI20230301BHEP |
|
| INTG | Intention to grant announced |
Effective date: 20230316 |
|
| GRAS | Grant fee paid |
Free format text: ORIGINAL CODE: EPIDOSNIGR3 |
|
| GRAA | (expected) grant |
Free format text: ORIGINAL CODE: 0009210 |
|
| STAA | Information on the status of an ep patent application or granted ep patent |
Free format text: STATUS: THE PATENT HAS BEEN GRANTED |
|
| AK | Designated contracting states |
Kind code of ref document: B1 Designated state(s): AL AT BE BG CH CY CZ DE DK EE ES FI FR GB GR HR HU IE IS IT LI LT LU LV MC MK MT NL NO PL PT RO RS SE SI SK SM TR |
|
| REG | Reference to a national code |
Ref country code: GB Ref legal event code: FG4D |
|
| REG | Reference to a national code |
Ref country code: CH Ref legal event code: EP |
|
| REG | Reference to a national code |
Ref country code: DE Ref legal event code: R096 Ref document number: 602019034647 Country of ref document: DE |
|
| REG | Reference to a national code |
Ref country code: IE Ref legal event code: FG4D |
|
| REG | Reference to a national code |
Ref country code: DK Ref legal event code: T3 Effective date: 20230830 |
|
| REG | Reference to a national code |
Ref country code: LT Ref legal event code: MG9D |
|
| REG | Reference to a national code |
Ref country code: NL Ref legal event code: MP Effective date: 20230809 |
|
| REG | Reference to a national code |
Ref country code: AT Ref legal event code: MK05 Ref document number: 1598523 Country of ref document: AT Kind code of ref document: T Effective date: 20230809 |
|
| PG25 | Lapsed in a contracting state [announced via postgrant information from national office to epo] |
Ref country code: GR Free format text: LAPSE BECAUSE OF FAILURE TO SUBMIT A TRANSLATION OF THE DESCRIPTION OR TO PAY THE FEE WITHIN THE PRESCRIBED TIME-LIMIT Effective date: 20231110 |
|
| PG25 | Lapsed in a contracting state [announced via postgrant information from national office to epo] |
Ref country code: IS Free format text: LAPSE BECAUSE OF FAILURE TO SUBMIT A TRANSLATION OF THE DESCRIPTION OR TO PAY THE FEE WITHIN THE PRESCRIBED TIME-LIMIT Effective date: 20231209 |
|
| PG25 | Lapsed in a contracting state [announced via postgrant information from national office to epo] |
Ref country code: SE Free format text: LAPSE BECAUSE OF FAILURE TO SUBMIT A TRANSLATION OF THE DESCRIPTION OR TO PAY THE FEE WITHIN THE PRESCRIBED TIME-LIMIT Effective date: 20230809 Ref country code: RS Free format text: LAPSE BECAUSE OF FAILURE TO SUBMIT A TRANSLATION OF THE DESCRIPTION OR TO PAY THE FEE WITHIN THE PRESCRIBED TIME-LIMIT Effective date: 20230809 Ref country code: PT Free format text: LAPSE BECAUSE OF FAILURE TO SUBMIT A TRANSLATION OF THE DESCRIPTION OR TO PAY THE FEE WITHIN THE PRESCRIBED TIME-LIMIT Effective date: 20231211 Ref country code: NO Free format text: LAPSE BECAUSE OF FAILURE TO SUBMIT A TRANSLATION OF THE DESCRIPTION OR TO PAY THE FEE WITHIN THE PRESCRIBED TIME-LIMIT Effective date: 20231109 Ref country code: NL Free format text: LAPSE BECAUSE OF FAILURE TO SUBMIT A TRANSLATION OF THE DESCRIPTION OR TO PAY THE FEE WITHIN THE PRESCRIBED TIME-LIMIT Effective date: 20230809 Ref country code: LV Free format text: LAPSE BECAUSE OF FAILURE TO SUBMIT A TRANSLATION OF THE DESCRIPTION OR TO PAY THE FEE WITHIN THE PRESCRIBED TIME-LIMIT Effective date: 20230809 Ref country code: LT Free format text: LAPSE BECAUSE OF FAILURE TO SUBMIT A TRANSLATION OF THE DESCRIPTION OR TO PAY THE FEE WITHIN THE PRESCRIBED TIME-LIMIT Effective date: 20230809 Ref country code: IS Free format text: LAPSE BECAUSE OF FAILURE TO SUBMIT A TRANSLATION OF THE DESCRIPTION OR TO PAY THE FEE WITHIN THE PRESCRIBED TIME-LIMIT Effective date: 20231209 Ref country code: HR Free format text: LAPSE BECAUSE OF FAILURE TO SUBMIT A TRANSLATION OF THE DESCRIPTION OR TO PAY THE FEE WITHIN THE PRESCRIBED TIME-LIMIT Effective date: 20230809 Ref country code: GR Free format text: LAPSE BECAUSE OF FAILURE TO SUBMIT A TRANSLATION OF THE DESCRIPTION OR TO PAY THE FEE WITHIN THE PRESCRIBED TIME-LIMIT Effective date: 20231110 Ref country code: FI Free format text: LAPSE BECAUSE OF FAILURE TO SUBMIT A TRANSLATION OF THE DESCRIPTION OR TO PAY THE FEE WITHIN THE PRESCRIBED TIME-LIMIT Effective date: 20230809 Ref country code: AT Free format text: LAPSE BECAUSE OF FAILURE TO SUBMIT A TRANSLATION OF THE DESCRIPTION OR TO PAY THE FEE WITHIN THE PRESCRIBED TIME-LIMIT Effective date: 20230809 |
|
| PG25 | Lapsed in a contracting state [announced via postgrant information from national office to epo] |
Ref country code: PL Free format text: LAPSE BECAUSE OF FAILURE TO SUBMIT A TRANSLATION OF THE DESCRIPTION OR TO PAY THE FEE WITHIN THE PRESCRIBED TIME-LIMIT Effective date: 20230809 |
|
| PG25 | Lapsed in a contracting state [announced via postgrant information from national office to epo] |
Ref country code: ES Free format text: LAPSE BECAUSE OF FAILURE TO SUBMIT A TRANSLATION OF THE DESCRIPTION OR TO PAY THE FEE WITHIN THE PRESCRIBED TIME-LIMIT Effective date: 20230809 |
|
| PG25 | Lapsed in a contracting state [announced via postgrant information from national office to epo] |
Ref country code: SM Free format text: LAPSE BECAUSE OF FAILURE TO SUBMIT A TRANSLATION OF THE DESCRIPTION OR TO PAY THE FEE WITHIN THE PRESCRIBED TIME-LIMIT Effective date: 20230809 Ref country code: RO Free format text: LAPSE BECAUSE OF FAILURE TO SUBMIT A TRANSLATION OF THE DESCRIPTION OR TO PAY THE FEE WITHIN THE PRESCRIBED TIME-LIMIT Effective date: 20230809 Ref country code: ES Free format text: LAPSE BECAUSE OF FAILURE TO SUBMIT A TRANSLATION OF THE DESCRIPTION OR TO PAY THE FEE WITHIN THE PRESCRIBED TIME-LIMIT Effective date: 20230809 Ref country code: EE Free format text: LAPSE BECAUSE OF FAILURE TO SUBMIT A TRANSLATION OF THE DESCRIPTION OR TO PAY THE FEE WITHIN THE PRESCRIBED TIME-LIMIT Effective date: 20230809 Ref country code: CZ Free format text: LAPSE BECAUSE OF FAILURE TO SUBMIT A TRANSLATION OF THE DESCRIPTION OR TO PAY THE FEE WITHIN THE PRESCRIBED TIME-LIMIT Effective date: 20230809 Ref country code: SK Free format text: LAPSE BECAUSE OF FAILURE TO SUBMIT A TRANSLATION OF THE DESCRIPTION OR TO PAY THE FEE WITHIN THE PRESCRIBED TIME-LIMIT Effective date: 20230809 |
|
| REG | Reference to a national code |
Ref country code: DE Ref legal event code: R097 Ref document number: 602019034647 Country of ref document: DE |
|
| PG25 | Lapsed in a contracting state [announced via postgrant information from national office to epo] |
Ref country code: IT Free format text: LAPSE BECAUSE OF FAILURE TO SUBMIT A TRANSLATION OF THE DESCRIPTION OR TO PAY THE FEE WITHIN THE PRESCRIBED TIME-LIMIT Effective date: 20230809 |
|
| PLBE | No opposition filed within time limit |
Free format text: ORIGINAL CODE: 0009261 |
|
| STAA | Information on the status of an ep patent application or granted ep patent |
Free format text: STATUS: NO OPPOSITION FILED WITHIN TIME LIMIT |
|
| 26N | No opposition filed |
Effective date: 20240513 |
|
| PG25 | Lapsed in a contracting state [announced via postgrant information from national office to epo] |
Ref country code: SI Free format text: LAPSE BECAUSE OF FAILURE TO SUBMIT A TRANSLATION OF THE DESCRIPTION OR TO PAY THE FEE WITHIN THE PRESCRIBED TIME-LIMIT Effective date: 20230809 |
|
| PG25 | Lapsed in a contracting state [announced via postgrant information from national office to epo] |
Ref country code: MC Free format text: LAPSE BECAUSE OF FAILURE TO SUBMIT A TRANSLATION OF THE DESCRIPTION OR TO PAY THE FEE WITHIN THE PRESCRIBED TIME-LIMIT Effective date: 20230809 |
|
| REG | Reference to a national code |
Ref country code: CH Ref legal event code: PL |
|
| PG25 | Lapsed in a contracting state [announced via postgrant information from national office to epo] |
Ref country code: LU Free format text: LAPSE BECAUSE OF NON-PAYMENT OF DUE FEES Effective date: 20240208 |
|
| PG25 | Lapsed in a contracting state [announced via postgrant information from national office to epo] |
Ref country code: CH Free format text: LAPSE BECAUSE OF NON-PAYMENT OF DUE FEES Effective date: 20240229 |
|
| GBPC | Gb: european patent ceased through non-payment of renewal fee |
Effective date: 20240208 |
|
| PG25 | Lapsed in a contracting state [announced via postgrant information from national office to epo] |
Ref country code: LU Free format text: LAPSE BECAUSE OF NON-PAYMENT OF DUE FEES Effective date: 20240208 Ref country code: CH Free format text: LAPSE BECAUSE OF NON-PAYMENT OF DUE FEES Effective date: 20240229 |
|
| PG25 | Lapsed in a contracting state [announced via postgrant information from national office to epo] |
Ref country code: BG Free format text: LAPSE BECAUSE OF FAILURE TO SUBMIT A TRANSLATION OF THE DESCRIPTION OR TO PAY THE FEE WITHIN THE PRESCRIBED TIME-LIMIT Effective date: 20230809 |
|
| PG25 | Lapsed in a contracting state [announced via postgrant information from national office to epo] |
Ref country code: BG Free format text: LAPSE BECAUSE OF FAILURE TO SUBMIT A TRANSLATION OF THE DESCRIPTION OR TO PAY THE FEE WITHIN THE PRESCRIBED TIME-LIMIT Effective date: 20230809 |
|
| REG | Reference to a national code |
Ref country code: BE Ref legal event code: MM Effective date: 20240229 |
|
| PG25 | Lapsed in a contracting state [announced via postgrant information from national office to epo] |
Ref country code: BE Free format text: LAPSE BECAUSE OF NON-PAYMENT OF DUE FEES Effective date: 20240229 |
|
| PG25 | Lapsed in a contracting state [announced via postgrant information from national office to epo] |
Ref country code: GB Free format text: LAPSE BECAUSE OF NON-PAYMENT OF DUE FEES Effective date: 20240208 |
|
| PG25 | Lapsed in a contracting state [announced via postgrant information from national office to epo] |
Ref country code: FR Free format text: LAPSE BECAUSE OF NON-PAYMENT OF DUE FEES Effective date: 20240229 |
|
| PG25 | Lapsed in a contracting state [announced via postgrant information from national office to epo] |
Ref country code: IE Free format text: LAPSE BECAUSE OF NON-PAYMENT OF DUE FEES Effective date: 20240208 |
|
| PG25 | Lapsed in a contracting state [announced via postgrant information from national office to epo] |
Ref country code: IE Free format text: LAPSE BECAUSE OF NON-PAYMENT OF DUE FEES Effective date: 20240208 Ref country code: GB Free format text: LAPSE BECAUSE OF NON-PAYMENT OF DUE FEES Effective date: 20240208 Ref country code: FR Free format text: LAPSE BECAUSE OF NON-PAYMENT OF DUE FEES Effective date: 20240229 Ref country code: BE Free format text: LAPSE BECAUSE OF NON-PAYMENT OF DUE FEES Effective date: 20240229 |
|
| PG25 | Lapsed in a contracting state [announced via postgrant information from national office to epo] |
Ref country code: CY Free format text: LAPSE BECAUSE OF FAILURE TO SUBMIT A TRANSLATION OF THE DESCRIPTION OR TO PAY THE FEE WITHIN THE PRESCRIBED TIME-LIMIT; INVALID AB INITIO Effective date: 20190208 |
|
| PG25 | Lapsed in a contracting state [announced via postgrant information from national office to epo] |
Ref country code: HU Free format text: LAPSE BECAUSE OF FAILURE TO SUBMIT A TRANSLATION OF THE DESCRIPTION OR TO PAY THE FEE WITHIN THE PRESCRIBED TIME-LIMIT; INVALID AB INITIO Effective date: 20190208 |
|
| REG | Reference to a national code |
Ref country code: DE Ref legal event code: R079 Ref document number: 602019034647 Country of ref document: DE Free format text: PREVIOUS MAIN CLASS: H01L0021660000 Ipc: H10P0074000000 |
|
| PG25 | Lapsed in a contracting state [announced via postgrant information from national office to epo] |
Ref country code: TR Free format text: LAPSE BECAUSE OF FAILURE TO SUBMIT A TRANSLATION OF THE DESCRIPTION OR TO PAY THE FEE WITHIN THE PRESCRIBED TIME-LIMIT Effective date: 20230809 |
|
| PGFP | Annual fee paid to national office [announced via postgrant information from national office to epo] |
Ref country code: DK Payment date: 20260220 Year of fee payment: 8 Ref country code: DE Payment date: 20260218 Year of fee payment: 8 |