EP3750060B1 - Vorhersage des ressourcenbedarfs in virtualisierten systemen: generische proaktive und selbstanpassende lösung. - Google Patents
Vorhersage des ressourcenbedarfs in virtualisierten systemen: generische proaktive und selbstanpassende lösung. Download PDFInfo
- Publication number
- EP3750060B1 EP3750060B1 EP19710134.8A EP19710134A EP3750060B1 EP 3750060 B1 EP3750060 B1 EP 3750060B1 EP 19710134 A EP19710134 A EP 19710134A EP 3750060 B1 EP3750060 B1 EP 3750060B1
- Authority
- EP
- European Patent Office
- Prior art keywords
- prediction
- data
- predicted data
- resource
- real
- Prior art date
- Legal status (The legal status is an assumption and is not a legal conclusion. Google has not performed a legal analysis and makes no representation as to the accuracy of the status listed.)
- Active
Links
Images


Classifications
-
- G—PHYSICS
- G06—COMPUTING OR CALCULATING; COUNTING
- G06F—ELECTRIC DIGITAL DATA PROCESSING
- G06F9/00—Arrangements for program control, e.g. control units
- G06F9/06—Arrangements for program control, e.g. control units using stored programs, i.e. using an internal store of processing equipment to receive or retain programs
- G06F9/46—Multiprogramming arrangements
- G06F9/50—Allocation of resources, e.g. of the central processing unit [CPU]
- G06F9/5005—Allocation of resources, e.g. of the central processing unit [CPU] to service a request
- G06F9/5011—Allocation of resources, e.g. of the central processing unit [CPU] to service a request the resources being hardware resources other than CPUs, Servers and Terminals
-
- G—PHYSICS
- G06—COMPUTING OR CALCULATING; COUNTING
- G06N—COMPUTING ARRANGEMENTS BASED ON SPECIFIC COMPUTATIONAL MODELS
- G06N3/00—Computing arrangements based on biological models
- G06N3/02—Neural networks
- G06N3/08—Learning methods
- G06N3/086—Learning methods using evolutionary algorithms, e.g. genetic algorithms or genetic programming
-
- G—PHYSICS
- G06—COMPUTING OR CALCULATING; COUNTING
- G06F—ELECTRIC DIGITAL DATA PROCESSING
- G06F9/00—Arrangements for program control, e.g. control units
- G06F9/06—Arrangements for program control, e.g. control units using stored programs, i.e. using an internal store of processing equipment to receive or retain programs
- G06F9/46—Multiprogramming arrangements
- G06F9/50—Allocation of resources, e.g. of the central processing unit [CPU]
- G06F9/5061—Partitioning or combining of resources
- G06F9/5077—Logical partitioning of resources; Management or configuration of virtualized resources
-
- G—PHYSICS
- G06—COMPUTING OR CALCULATING; COUNTING
- G06N—COMPUTING ARRANGEMENTS BASED ON SPECIFIC COMPUTATIONAL MODELS
- G06N20/00—Machine learning
- G06N20/10—Machine learning using kernel methods, e.g. support vector machines [SVM]
-
- G—PHYSICS
- G06—COMPUTING OR CALCULATING; COUNTING
- G06N—COMPUTING ARRANGEMENTS BASED ON SPECIFIC COMPUTATIONAL MODELS
- G06N3/00—Computing arrangements based on biological models
- G06N3/02—Neural networks
- G06N3/08—Learning methods
- G06N3/084—Backpropagation, e.g. using gradient descent
-
- G—PHYSICS
- G06—COMPUTING OR CALCULATING; COUNTING
- G06N—COMPUTING ARRANGEMENTS BASED ON SPECIFIC COMPUTATIONAL MODELS
- G06N3/00—Computing arrangements based on biological models
- G06N3/12—Computing arrangements based on biological models using genetic models
- G06N3/126—Evolutionary algorithms, e.g. genetic algorithms or genetic programming
-
- G—PHYSICS
- G06—COMPUTING OR CALCULATING; COUNTING
- G06N—COMPUTING ARRANGEMENTS BASED ON SPECIFIC COMPUTATIONAL MODELS
- G06N7/00—Computing arrangements based on specific mathematical models
- G06N7/01—Probabilistic graphical models, e.g. probabilistic networks
-
- G—PHYSICS
- G06—COMPUTING OR CALCULATING; COUNTING
- G06F—ELECTRIC DIGITAL DATA PROCESSING
- G06F2209/00—Indexing scheme relating to G06F9/00
- G06F2209/50—Indexing scheme relating to G06F9/50
- G06F2209/5019—Workload prediction
Definitions
- Prediction approaches can be principally categorized into two classes.
- the first class is based on models deduced from the analysis of the system behavior.
- Existing studies based on such analytical models rely mostly on auto-regression and moving averages (see, P. K Hoong, I. K. Tan and C. Y. Keong, "Bittorrent Network Traffic Forecasting With ARMA,” International Journal of Computer Networks & Communications, vol. 4, no 4, pp. 143-.156. 2012 ; M. F. Iqbal and L. K John, "Power and performance analysis of network traffic prediction techniques," Performance Analysis of Systems and Software (ISPASS), 2012 IEEE International Symposium, IEEE, 2012, pp. 112-113 ), multiple linear regression ( W. Lloyd, S. Pallickara, O. David, J.
- the second class of resource prediction approaches is based on online processing of the data through machine learning.
- This approach benefits from dynamic and adaptive machine learning methods. But it is less accurate when compared to the analytical-model-based approaches as it may be affected by the non-reliability of the data measurement tools.
- machine learning methods for dynamic prediction of the resource usage including Kalman filter ( See, D. Zhang-Jian, C. Lee and R. Hwang, "An energy-saving algorithm for cloud resource management using a Kalman filter," International Journal of Communications Systems, vol. 27, no 12, pp. 4078-4091, 2013 ; W.
- ANN Artificial Neural Network
- N. Tran N. Tran, B. M. Nguyen and H. Le, "PD-GABP - A novel prediction model applying for elastic applications in distributed environment," Information and Computer Science (NICS), 2016 3rd National Foundation for Science and Technology Development Conferenc , IEEE, 2016, pp. 240-245 ; K. Ma et al. "Spendthrift: Machine learning based resource and frequency scaling for ambient energy harvesting nonvolatile processors," Design Automation Conference (ASP-DAC), 2017 22nd Asia and South Pacific, IEEE, 2017, pp. 678-683 ), Bayesian models (See, G. K. Shyam and S. S.
- Certain previous prediction approaches use one or two methods (e.g., Kriging, Genetic Algorithm) for various purposes and in different contexts such as, for example, signal processing, telecommunication networks, oil drilling and Biocomputing.
- a number of patents propose to use Kriging method as a predictive model and Genetic algorithm (GA) for dataset training in order to select the best fit predictive model. They create different training datasets by resampling and replacing the original one.
- Certain other approaches have used linear regression as a prediction method. They propose to optimize regression coefficients using GA.
- Still other approaches use a search aggregator which gathers prediction and adjustment processes from real-time traffic. Using aggregated search results, prediction adjustment module determines the distinctive features to dynamically adjust video analytics in one or more camera views where the target subject is expected to appear.
- Still another approach includes using measured data from sensors in order to adjust the predicted operating conditions of a turbine component.
- a more recent approach defined a multivariable statistical model using Kriging regression method and GA which allows identification of optimal set of these variables.
- the approach allows dynamic selection of the optimal size of the sliding window and the optimal number of predicted data using GA.
- Kriging method is used as a dynamic machine learning-based prediction and GA results for dataset training and prediction process.
- an approach used GA to select the best candidates in testing procedures.
- This approach used GA for dynamic selection of the optimal size of the sliding window and the optimal number of predicted data.
- Yet another approach proposes to adjust predicted operating conditions of a turbine using predicted operating conditions and/or one or more measured data associated with the turbine operation. It uses estimated probability of the prediction errors and a variable padding for prediction adjustment.
- CHAUDHARI SHILPA SHASHIKANT ET AL "Traffic and mobility aware resource prediction using cognitive agent in mobile ad hoc networks " is relevant prior art for the present invention.
- a method includes determining a real-time prediction of resource demand by the system.
- Genetic Algorithm is used to dynamically determine an optimal size of a sliding window and an optimal number of predicted data within the real-time prediction of the resource demand.
- the data within the real-time prediction of the resource demand is adjusted based on an estimated probability of prediction errors and a variable padding, which is based on a mean of at least one previous standard deviation of the predicted data within the real-time prediction of the resource demand.
- a non-transitory computer-readable medium stores instructions for real-time prediction of resource consumption by a system.
- the instructions are executed by processing circuitry to determine a real-time prediction of resource demand by the system and use GA to dynamically determine an optimal size of a sliding window and an optimal number of predicted data within the real-time prediction of the resource demand.
- the data within the real-time prediction of the resource demand is adjusted based on an estimated probability of prediction errors and a variable padding.
- the variable padding is based on a mean of at least one previous standard deviation of the predicted data within the real-time prediction of the resource demand.
- an apparatus for real-time prediction of resource consumption by a system includes processing circuitry configured to determine a real-time prediction of resource demand by the system and use GA to dynamically determine an optimal size of a sliding window and an optimal number of predicted data within the real-time prediction of the resource demand.
- the data within the real-time prediction of the resource demand is adjusted based on an estimated probability of prediction errors and a variable padding.
- the variable padding is based on a mean of at least one previous standard deviation of the predicted data within the real-time prediction of the resource demand.
- Certain embodiments may provide one or more of the following technical advantage(s). For example, certain embodiments may provide a prediction algorithm that may be generic enough to be applied to any system since it is able to provide prediction without any prior knowledge or assumption on the system or on its behavior thanks to the usage of machine learning method and time series. As another example, certain embodiments may be adaptive to the changes that occur in the workload or in the system because it continuously provides the prediction of the future system state after the training phase (machine learning) using the real-time collected data (time series).
- a technical advantage may be that the prediction algorithm may be able to adapt dynamically the size of sliding window and the number of predicted data that minimize under and over estimation.
- the prediction algorithm may enable dynamic selection of the optimal size of the siding windows and find the optimal number of predated data using Genetic Algorithm (GA).
- GA Genetic Algorithm
- a technical advantage may be that certain embodiments provide a prediction algorithm that may be able to adapt to unexpected workload fluctuations with a relatively short delay.
- a technical advantage may be that certain embodiments provide a prediction algorithm that includes dynamic adjustment of the resource demand prediction using the estimated probability of the prediction errors and a variable padding.
- a technical advantage may be that certain embodiments use Kriging method for dynamic machine learning-based prediction and GA for determining the optimal size of training dataset and the optimal size of predicted data.
- GA may be used to determine the optimal size of a sliding window for a dataset.
- a technical advantage may be that certain embodiments use estimated probability of the prediction errors and a variable padding for prediction adjustment.
- a technical advantage may be that certain embodiments may provide a prediction algorithm that enables dynamic prediction adjustment, wherein, the error-adjustment value that reflects the current tendency for under/over estimation is added to the predicted data.
- the error-adjustment value that reflects the current tendency for under/over estimation is added to the predicted data.
- a padding may be added to the adjusted predicted data in order to prevent critical under-estimation and SLA violation.
- the padding value corresponds to the mean of previous standard deviations of observed data aiming to consider workload variability in adjustment process.
- Virtualization is one of the key technologies leveraged to provide scalability, better management flexibility, optimized resource sharing, and lower cost in data centers. To capitalize on this technology, it is essential to provision virtualized systems with resources dynamically according to their workload demands. However, the complexity of virtualized systems and applications, their fluctuating resource demands over time, their dynamic and heterogeneous environments, all impose a real challenge in resource management, which has to optimize resource utilization while avoiding service level agreements (SLA) violation. See, G. K. Shyam and S. S. Manvi, "Virtual resource prediction in cloud environment: A Bayesian approach," Journal of Network and Computer Applications, vol. 65, pp. 144-154, 2016 .
- SLA service level agreements
- Effective and accurate prediction of resource demands is fundamental to real-time capacity planning and virtualized resource management in data centers. It helps meet the service-level agreement (minimize under-provisioning), anticipate the needs in terms of middleboxes. (e.g., Load Balancer, Firewall) and proactive job scheduling, and consequently improve the usage of resources, the performance of services, and reduce costs (minimize over-provisioning).
- middleboxes e.g., Load Balancer, Firewall
- proactive job scheduling e.g., e.g., Load Balancer, Firewall
- Some of these approaches do not offer proactive and adaptive management of resources or even consider the SLA requirements.
- Proactive allocation is based on resource demand prediction, where utilization needs are anticipated in advance to be adjusted prior to the occurrence of any change, which is a fundamental requirement in dynamic virtualized systems.
- a prediction algorithm is proposed, which is generic enough to be applied to any virtualized system or application, able to dynamically generate and adjust prediction in real time, and offers proactivity to estimate the resource demand anticipating future changes in the system.
- the disclosed approach provides an algorithm for dynamic, accurate and effective prediction of resource needs by developing and leveraging different methods and techniques.
- Black-box prediction methods derive models from the system behavior without requiring any knowledge of the system internals. See, A. Gambi. "Kriging-based Self-Adaptive Controllers for the Cloud," PhD thesis, University of Lugano, http://doc.rero.ch/record/32769/files/2012INFO008.pdf, 2013.
- the adaptability and the efficiency of these methods make them appropriate for application to virtualized, dynamic and complex environments such as data centers.
- the proposed algorithm also employs machine learning method and time series to remain a few steps ahead in dynamic estimation of resource needs. Furthermore, as the accuracy of prediction is not always sufficient, adjustments are needed. Therefore, a dynamic adjustment technique is devised and employed in the prediction algorithm to reduce under and over estimation of resources.
- a prediction algorithm in order to realize generic, dynamic and adaptive prediction of resource consumption in virtualized systems, a prediction algorithm is proposed. Without any prior knowledge or assumption on the system or on its behavior, the algorithm aims to estimate accurately the resource demand and to minimize both service level agreement (SLA) violation and resource loss. None of the previous approaches and techniques use the combination proposed herein. Specifically, none of the previous approaches and techniques use: (1) Kriging method combined with Genetic Algorithm (GA) for predicting data and adapting the size of sliding window and number of predicted data dynamically, and (2) an adjustment of prediction based on estimated probability of the prediction errors, and mean of standard deviation-based padding.
- GA Genetic Algorithm
- the prediction algorithm is generic enough to be applied to any virtualized system, is able to dynamically generate and adjust prediction in real time, and may anticipate future changes in the system.
- the present invention comprises the following three aspects:
- the proposed prediction algorithm involves three main techniques.
- the first technique leverages the Kriging method for dynamic machine-learning-based prediction.
- the second technique is to apply the Genetic Algorithm (GA) to dynamically provide the optimal size of the sliding window and the optimal number of predicted data, helping to minimize the prediction errors of under and over-estimation.
- the third technique adjusts the prediction of resource demand based on the estimated probability of the prediction errors and a variable padding.
- the prediction algorithm approach described herein differs in many aspects, providing a generic, dynamic, and self-adaptive solution for resource prediction. Indeed, it is proposed to use dynamic selection of the optimal size of the sliding window (data used for training phase) and the optimal number of predicted data using Genetic Algorithm and Kriging method for dynamic machine learning-based prediction.
- the existing approaches create training data sets by re-sampling with replacement from the original training or determine the best fit predictive model by using Genetic algorithms for training phase or by optimizing linear regression coefficients.
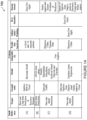
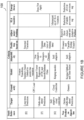
- FIGURES 1A and 1B illustrate a table classifying the following recent approaches:
- Time series is a collection of observations made chronologically, characterized by its large data size, high dimensionality and continuous update. See, T. Fu, "A review on time series data mining," Engineering Applications of Artificial Intelligence, vol. 24, no 1, pp. 164-181, 2011 .
- Fu has categorized the time series data into representation and indexing, similarity measure, segmentation, visualization and mining. He also considered the similarity measure and segmentation as the core tasks for various time series mining tasks.
- various methods and techniques have been used, namely, Support Vector Regression, auto-regression, Expectation Maximization Algorithm, hidden Markov models, and Fourier, transforms. When it comes to the segmentation of time series into subsequences for preprocessing or trend analysis, an important observation has proved the effectiveness of a dynamic approach that uses variable window size, rather than a fixed one, to flexibly identify the time points.
- Prediction approaches can be mainly categorized into two classes.
- the first category is based on models deduced from the system behavior analysis.
- Existing studies based on such analytical models focus mainly on auto-regression and moving averages (see, P. K Hoong, I. K. Tan and C. Y. Keong, "Bittorrent Network Traffic Forecasting With ARMA," International Journal of Computer Networks & Communications, vol. 4, no 4, pp. 143-.156, 2012 ; See also, Y. Yu, M. Song, Z. Ren, and J. Song, "Network Traffic Analysis and Prediction Based on APM,” Pervasive Computing and Applications (ICPCA), 2011, pp. 275-280, IEEE ; See also, M. F. Iqbal and L.
- the second category of resource prediction approaches is based on online processing of the data through machine-learning techniques. Such approach is dynamic and adaptive yet less accurate when compared to the model-based approaches as it may be affected by the non-reliability of the data measurement tools, which may lead to erroneous values.
- the authors in the latter proposed a Bayesian model to determine short and long-term virtual resource requirement of applications on the basis of workload patterns, at several data centers, during multiple time intervals.
- the proposed model was compared with other existing work based on linear regression and support vector regression, and the results showed better performance for Bayesian model in terms of mean squared error. Nevertheless, as the proposed model is based on workload patterns generated from resource usage information during weekdays and weekends, it may be unable to respond to quick and unexpected changes in the resource demands.
- KSSVR GPU Load Prediction Using Support Vector Regression and Kalman Smoother for Cloud
- ICDCSW Distributed Computing Systems Workshops
- BPNN Back-Propagation Neural Network
- AR Autoregressive model
- Gambi et al. have proposed self-adaptive cloud controllers, which are schedulers that allocate resources to applications running in the cloud based on Kriging models in order to meet the quality of service requirements while optimizing execution costs. See, A. Gambi M. Pezzè and G. Toffetti, "Kriging-based self-adaptive cloud controllers," IEEE Transactions on Services Computing, vol. 9, n° 3, pp. 368-381, 2016 .
- Kriging models were used to approximate the complex and a-priori unknown relationships between: (1) the non-functional system properties collected with runtime monitors (e.g., availability, and throughput), (2) the system configuration (e.g., number of virtual machines), and (3) the service environmental conditions (e.g., workload intensity, interferences).
- the adjustment was introduced as a padding to be added to the predicted data as a cap of prediction.
- This padding was prefixed (e.g., 5%) or calculated dynamically using various strategies. See, K. Qazi, Y. Li and A. Sohn, "Workload Prediction of Virtual Machines for Harnessing Data Center Resources," Cloud Computing (CLOUD), 2014 IEEE 7th International Conference, IEEE, 2014, pp. 522-529 .
- the latter include measuring the relationship between the padding value and the confidence interval, which is defined as the probability that real demand is less than the cap (See, J. Jiang, J. Lu, Zhang and G.
- FIGURES 1A-1B provides the taxonomy of the most recent relevant approaches in these contexts.
- the approach disclosed herein differs in many aspects, providing a generic, dynamic, and self-adaptive solution for resource prediction.
- black-box techniques are leveraged to provide a generic solution, which can be applied to any system with no assumptions or knowledge of the systems' internal functionalities being required.
- An adaptive solution is also provided to accommodate the changes in observed data, through real-time data analysis.
- a solution is provided with multi-step ahead prediction of resource demand by leveraging the Kriging machine learning method and time series, and proposing dynamic sliding window technique.
- dynamic adaptive padding and reactive error adjustment are able to mitigate under-estimations and over-estimations of resources to reduce SLA violation and reduce resource loss due to typical excessive allocation of resources.
- a generic, dynamic, and self-adaptive prediction of the resource needs in virtualized systems is proposed.
- the proposition aims to minimize under-estimation, which can lead to possible SLA violation, and reduce over-estimation that causes loss of resources, without any prior knowledge of the system or any assumption on its behavior or load profile.
- a novel prediction algorithm is proposed that involves three main techniques.
- the first technique leverages Kriging method for dynamic machine learning-based prediction.
- the second technique considers the input of the algorithm, namely, the resource utilization data collected from the system, as a time series with a variable sliding window and a variable size of predicted data.
- This technique benefits from Genetic Algorithm (GA) to dynamically provide the optimal size of the sliding window and the optimal number of predicted data, helping to minimize the prediction errors of under and over estimation. This enables our algorithm to process the data dynamically and provide the prediction based on the most recent data that reflect the current system state. Finally, the third technique adjusts the prediction based on the estimated probability of the prediction errors and a variable padding.
- GA Genetic Algorithm
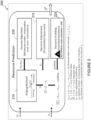
- FIGURE 2 is a block diagram showing the main components of prediction algorithm 200 according to a particular embodiment. The prediction of a case of time-series data of the resource consumption in virtualized systems will be described as an example.
- the prediction algorithm 200 begins by reading collected resource consumption data ( y j ). Further, it initializes the size of the sliding window ( n i ) and the number of predicted data ( m i ) to their maximums, while the error-adjustment coefficient and the padding values are set to zero. Then, an initialization phase is performed. It consists of consecutive training and prediction ( ⁇ i ) based on the Kriging method (step 210), gathering sufficient data (named historical data) to apply adjustment and optimization in next prediction steps.
- the prediction (step 210) and its adjustment (step 215) are applied for each pair ( n i , m i ) of the set of all possible combinations of n i , m i values.
- the obtained results are used by the Genetic Algorithm (step 220) to determine the optimal sizes for sliding window and prediction ( n s , m s ) that minimize under-estimation and over-estimation.
- the prediction of upcoming resource consumption is performed based on the Kriging method (step 210) as well as its adjustment (step 215) according to the two previous error-adjustment values. Then, the adjusted predicted data that estimate the future resource consumption are provided ( y ⁇ a ⁇ ).
- the first observed data is collected ( y i )
- it is compared to its corresponding adjusted predicted data ( y ⁇ a ⁇ ). If under-estimation is more than a giving threshold above which under-estimation is not tolerated (e.g., 10%, threshold defined based on empirical study), the padding value is evaluated (step 225) and the processes of prediction-adjustment are restarted taking padding into account. Otherwise, the observed data is gathered for the next prediction step.
- a giving threshold above which under-estimation is not tolerated e.g. 10%, threshold defined based on empirical study
- the prediction algorithm continues repeatedly to estimate the resource consumption while the system is monitored and its relevant data are collected.
- uptime i The i th uptime moment where there is no under-estimation.
- downtime The i th downtime moment where there is an under-estimation after the i th uptime moment.
- Algorithm 1 for resource consumption prediction ( y , n, m ) presents an example approach for resource needs prediction:
- the algorithm starts by initializing the size of the sliding window and the number of predicted data ( n i , m i ) to their maximums, while the error-adjustment coefficient and the padding values are set to zero (Line 1 to Line 4).
- an initialization phase (Line 5) is performed. It consists of consecutive training and prediction steps based on the Kriging method, gathering sufficient data (named historical data) to apply adjustment and optimization techniques. The prediction and its adjustment are applied based on the historical data for each pair ( n i , m i ) within the set of all possible combinations of n i , m i values (Line 6 to Line 10).
- the obtained results which form the adjusted predicted data and their corresponding combination of ( n i , m i ), are used by the Genetic Algorithm (Algorithm 4) to determine the optimal sizes for sliding window and prediction ( n s , m s ) that minimize under-estimation and over-estimation (Line 11).
- Algorithm 4 the Genetic Algorithm 4 to determine the optimal sizes for sliding window and prediction ( n s , m s ) that minimize under-estimation and over-estimation (Line 11).
- the prediction of upcoming resource consumption is performed based on the Kriging method (Line 12) as well as its adjustment (Line 13) according to the two previous error-adjustment values (Algorithm 2).
- the first observed data is collected, it is compared to its corresponding adjusted predicted data.
- the time complexity of proposed algorithm for resource consumption prediction depends essentially on three parts: (1) the time taken by the Kriging method to train and predict the next resource demand, (2) the time complexity of adjustment and padding, and (3) the time complexity of GA to provide the optimal sizes of the sliding window and the number of predicted data ( n s , m s ).
- the time complexities of each technique of our algorithm, namely, the Kriging method, adjustment, padding and GA are evaluated below.
- the initialization of parameters (the sliding window size, the number of predicted data, the error-adjustment value, the padding value) as well as the data collection (Line1-Line4) have time complexity O(1) .
- the initialization phase (Line 5)
- several training and prediction steps using Kriging method are performed with the time complexity of O k m i n i 3 where k is the number of repetitions used to collect sufficient data for adjustment and optimization.
- the assessment of the optimal ( n s , m s ) is performed using GA (Line 11) based on the results of the prediction and adjustment of the historical data (Line 7-10).
- the time complexity of Algorithm 1 is O 1 + O k m i n i 3 + O P m i n i 3 + O PN I + O IPL + O m s n s 3 + O N I + O 1 + O n s + O 1 which is equivalent to O P m i n i 3 due to the highest order of n i 3 .
- Kriging is a spatial interpolation procedure that uses statistical methods for prediction. It assumes a spatial correlation between observed data. See, D.G. Krige. "A Statistical Approach to Some Basic Mine Valuation Problems on the Witwatersrand," Journal of the Southern African Institute of Mining and Metallurgy, vol. 52, no.6, pp. 119 - 139, 1951 ; See also, G. Matheron. "Principles of Geostatistics," Economic Geology,vol. 58 no. 8, pp. 1246-1266,1963 . In other words, observed data close to each other in the input space are assumed to have similar output values. See, A. Gambi M. Pezzè and G.
- Kriging is able to model a system based on its external behavior (black-box model) and generic data. It also provides adaptability to linear, non-linear and multi-modal behavior of the system (i.e., runtime training) with a complexity that varies with the number of samples used for the model fitting. These characteristics are exactly what make Kriging method suitable for online adaptive and dynamic prediction, which has also been proved in the literature. According to certain embodiments described herein, however, Kriging is adapted in order to provide dynamic and adaptive prediction of resource consumption. In what follows, the proposed method is explained.
- the empirical semivariogram allows to derive a semivariogram model (e.g., Spherical, Gaussian, Exponential) to represent semi variance as a function of separation distance.
- the semivariogram model is used to define the weights ⁇ i and to evaluate the interpolated points (i.e., predicted data).
- the Kriging method is used to provide prediction of next m i values of CPU consumption ( y p ⁇ in Equation (1)) using n i observed values of CPU consumption ( y i in Equation (1)) as training data.
- the method determines the weights of observed data (i.e., training data) by solving the linear system in Equation (3), which has a time complexity of O n s 3 with n s being the number of training data. See, B. V Srinivasan, R. Duraiswami, and R. Murtugudde.
- this kriging method has a time complexity of O m s n s 3 , with m s is number of predicted values.
- a complexity of O m s n s 3 is acceptable as the size of the sliding window (training data) and the number of the predicted data are variable and relatively small values of these parameters are needed in order to closely track the system behavior.
- the dynamic prediction adjustment strategy is based on the estimated probability of the prediction errors and a variable padding technique.
- Algorithm 2 provides the adjustment of the prediction ( ⁇ , I i -2 , I i -1 , ⁇ i -1 , ⁇ i -2 , i ):
- the error-adjustment coefficient ⁇ i that reflects the current tendency for under/over estimation is determined and added to the predicted data.
- a padding is added to the adjusted predicted data in order to prevent critical under-estimation and SLA violation (Algorithm 2, line 14).
- 10% as a tolerance threshold may be a good value to be considered. Otherwise, the padding value is null.
- the prediction error e i is considered as a continuous random variable, denoted by X .
- Its probability density function (PDF), ⁇ ( x ), defines a probability distribution for X. See, P. F. Dunn. "Measurement and Data Analysis for Engineering and Science, " CRC Press, Taylor & Francis, 616 p. 2014 .
- the time complexity of the prediction adjustment (Algorithm 2) is influenced by the evaluation of the probabilities of two previous error intervals (Line 1) using numerical integration of probability density function (Equation (4)).
- the integral is computed via Simpson's rule ( See, M. Abramowitz and I. A. Stegun.
- padding strategies may be applied. For example, when the under-estimation is more than a tolerance threshold (e.g., 10%), an additional adjustment, called padding, is computed.
- Algorithm 3 is an example for calculating padding ( y ⁇ a ⁇ , y i , n s , m s , threshold ), according to a particular embodiment:
- the padding is added to the adjusted predicted data in the next prediction step in order to address quickly the gap between the observed data and the predicted data, and consequently, to prevent a long duration of under-estimation and SLA violation.
- padding r y ⁇ a ⁇ ⁇ y i
- r ⁇ y i / y ⁇ a ⁇ ⁇ ⁇ .
- padding mean ⁇ j y i ⁇ n s y i where j ⁇ ⁇ 1,..., l ⁇ , l is the number of under-estimations greater than 10% and n s is the optimal number of training data in the interval I i
- the time complexity of the padding in Algorithm 3 depends on the computation of standard deviation of the previous observed data (Line 2) which is O(n s ), and the mean of previous standard deviations of observed data (Line 4 or Line 6) corresponding to O(1) .
- the rest of the statements in this algorithm have, each, a time complexity O(1) .
- the time complexity of the padding algorithm is O(1) + O(n s ) + O(1) + O(l) + O(1) + O(1) which is equivalent to O(n s ) having n s > l.
- time series is an ordered collection of values obtained through repeated measurements, typically over equally-spaced time intervals, and their analysis allows the extraction of a model that describes particular patterns in the collected data. See, W. W. S. Wei. "Time series analysis: univariate and multivariate methods," Redwood City, Calif.; Don Mills, Ont.: Addison-Wesley, 478, p. 1990 .
- the performance of the typical fixed sliding window strategy was tested with respect to the mean absolute percentage error (MAPE) metric.
- MAPE mean absolute percentage error
- Different sliding windows were experimented, by varying both training data and predicted data numbers (e.g., (13-20), (10-15), (7-10) respectively), and the ratio between them.
- MAPE mean absolute percentage error
- the fixed sliding window strategy was able to provide efficient prediction results with MAPE ⁇ 10%, it requires a prior testing and evaluation phase to determine the best pair ( n s , m s ) .
- the results showed critical performance degradation when abnormal system behaviors are observed. Abnormal behavior might be for instance a sharp increase or sharp decrease of workload.
- the main objective in this part is to find the best size of sliding window ( n s ) and the best number of predicted data ( m s ) that minimize the over-estimation and the under-estimation of resource demand before each prediction process.
- constraints c 1, c2 ensure that the sizes of data and the sliding window belong to the set of natural numbers, while c3 confirms that the number of predicted data is less or equal to the sliding window size.
- constraints c4, c5 and c6 define the decision variables for padding, over-estimation and the sliding window size, respectively, as binary variables.
- the solution of this problem is the best combination of sliding window size ( n s ) and the predicted data number ( m s ) which minimizes over-estimation and under-estimation of the resource requirements, allows dynamic prediction and improves the latter's performance.
- Heuristic Algorithm-Genetic Algorithm form an abstraction of biological evolution, which imitate the natural evolution process to solve an optimization problem.
- X. Yang “Engineering optimization: an introduction with metaheuristic applications,” Hoboken, N.J.
- GAs are heuristic methods that aim to determine the best solution by simulating the propagation of the fittest individuals over consecutive generations. The fitness of a solution is based on a function that aims to minimize or maximize particular objective(s). Through crossover, mutation and selection operators, Genetic Algorithm is able to generate diversified individuals and find the best among them. This approach might be a good alternative to exhaustive search as shown in experimental evaluation section.
- GA is used to determine the optimal size of the sliding window and the optimal number of predicted data (n s , m s ).
- n s , m s the optimal number of predicted data
- the fitness of each individual is computed by evaluating both predefined objective functions that aim to minimize under and over estimations.
- the fittest individuals in the population are selected and inserted into next population.
- Crossover and mutation operators are applied to produce a new generation of solutions ( n s , m s ) and the fitness of these individuals is calculated. This process is repeated until the stopping condition is met.
- the latter can be defined as time constraint, number of generations, or any other adequate criterion.
- the fittest pairs ( n s , m s ) from the last generation are reported. If several solutions are provided by GA, the solution that most minimizes the under-estimation is selected for the next prediction because we consider that the under-estimation is more critical than the over-estimation in terms of cost of SLA violation.
- the complexity of Algorithm 4 depends on many factors, namely, the fitness function evaluation, the population size, the individuals' length (number of elements in each individual) and the number of generations (i.e., iterations).
- the initialization of parameters and the generation of initial population each has time complexity O(1) (Lines 1-3).
- the evaluation of the fitness function has time complexity O(N), where N is the size of population (Line 4-6).
- the return statement (Line 16) has time complexity O(1) .
- the time complexity of Algorithm 4 is O(1)+O(N)+O(INL)+O(1) which is equivalent to O(INL).
- the cost of the resource demand prediction was evaluated in terms of SLA violation and resource wasting by computing the probability of under-estimations (e.g., Pr UnderEstim PredictData ), the mean of over-estimations (e.g., E OverEstim PredictData ) and the mean time between under-estimations ( MTBUE ) for both predicted and adjusted data.
- the mean of over-estimations was considered in case of static provisioning of resources (threshold-based provisioning) that is an over-provisioning of resources applied in legacy systems. It represents the maximum of allocated resources for specific system and load profile. This metric was used to compare the gain of resources between our approach (prediction and adjustment) and the static provisioning approach. The details about the calculation of suggested metrics are presented in Table I, which is discussed above.
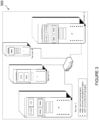
- the testbed is built with 4 servers, all connected to the same local area network.
- IMS Core components we used OpenIMS Core, which is an open source implementation of IMS Core developed by Fraunhofer FOKUS IMS Bench. See, Fraunhofer FOKUS, "Open Source IMS Core by end", Online http://www.openimscore.org/, accessed: 2017-06-06 .
- IMS Core The virtualization of IMS Core (CSCFs and HSS) is based on Linux container technology. See, Linux Containers. Online https://linuxcontainers.org/, accessed: 2017-06-06.
- SIPp version 591 (October 2010), which is a traffic generator. See, R. GAYRAUD et al. "SIPp”. Online http://sipp.sourceforge.net/, accessed: 2017-06-06.
- the Virtualized P-CSCF and HSS are hosted in Server 1; whereas, the Virtualized S-CSCF and I-CSCF are hosted in Server 2.
- the high-level monitoring of virtualized CSCF entities and the management of resources are done by the Host Monitoring Agent (HMA) and Resource Management Agent (RMA), respectively.
- HMA and RMA are deployed in both Server 1 and Server 2.
- Server 3 hosts SIPp and the Session Monitoring Engine (SME).
- DNS Domain Name System
- Each physical machine has an Intel core i7 3.6 GHz CPU, 24.576 GB of RAM, and a Linux Ubuntu operating system version 14.04.
- FIGURE 3 illustrates the example testbed, according to certain embodiments.
- the type was essentially set to universal Kriging and the variogram model to the spherical one with a range of 0.2 and a sill of 1. These parameters are set through tests trying to find the configuration that minimizes the prediction errors.
- the population is initialized as ⁇ (10,3), (10,5), (10,7), (20,5), (20,10), (20,14) ⁇
- the selection is based on tournament selection function (See, G. Mitsuo, R. Cheng, Genetic algorithms and engineering optimization, New York, N.Y. : J. Wiley and Sons. 495 p. 2000 .)
- the single-point crossover is used while random modification of n i or m i values is performed for the mutation.
- the crossover and the mutation probabilities are set to 0.8 and 0.2, respectively.
- the stopping criterion is set to the number of iterations needed to find the optimal solution.
- the data from the IMS service provider represent CPU consumption collected from multiple machines every 5 minutes during 16 hours.
- Dataset1 Dataset1
- Dataset2 Dataset2
- the Google cluster data trace (clusterdata-2011-2) represents 29 days' worth of cell information from May 2011, on a cluster of about 12500 machines (packed into racks, and connected by a high-bandwidth cluster network).
- a cell is a set of machines, typically all in a single cluster, that shares a common cluster-management system that allocates jobs to machines.
- a job is comprised of one or more tasks (accompanied by a set of resource requirements) ( See , C. Reiss et al. "Google cluster-usage traces: format + schema," https://drive.google.com/file/d/0B5g07T_gRDg9Z01sSTEtTWtpOW8/ view, 2014).
- Dataset3 (Dset3) and Dataset4 (Dset4) are presented, which denote the CPU consumption of tasks identified by 85 and 42, respectively, collected every 5 minutes.
- Load Profile Description Configuratio n1 (Conf1) start at 150 CPS, increment: 50 CPS/10 sec until 400 CPS, 400 CPS constant during 100 sec, 600 CPS constant during 300 sec, 200 CPS decrement : 50 CPS/50 sec until 50 CPS Configuratio n2 (Conf2) start at 150 CPS, increment: 50 CPS/10 sec until 400 CPS, 400 CPS constant during 100 sec, 600 CPS constant during 300 sec, 5 CPS during 60 sec, 400 CPS constant during 300 sec
- the prediction is dynamic and adaptive to the workload profile.
- the sliding window size and the number of predicted data are adaptive and dynamic only in the third scenario which represents our approach.
- the adjustment and the padding are dynamic and adaptive in the second and the third scenarios.
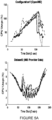
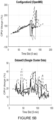
- FIGURES 5A-5C present the results of the predicting of CPU consumption for the defined scenarios and various systems and workload profiles, according to certain embodiments.
- several training and prediction steps using Kriging method are performed (without adjustment of the prediction results) until collecting sufficient data for applying adjustment and optimization. Therefore, under-estimation cases are observed before the time slot 60 in FIGURES 5A-5C .
- the results show that the prediction using Kriging method is able to follow the trend of workloads and to adapt to changes in case of all used configurations (OpenIMS) and datasets (IMS provider data and Google cluster data). But, it is less effective when large and unexpected variations (e.g., Configuration2) or a lot of fluctuations (e.g., Dataset4) occur in the workload, which cause long and significant under-estimations and SLA violations.
- OpenIMS OpenIMS
- IMS provider data and Google cluster data datasets
- it is less effective when large and unexpected variations (e.g., Configuration2) or a lot of fluctuations (e.g., Dataset4) occur in
- an adjustment of the prediction is proposed to reduce long or/and frequent under-estimations.
- the results of adjusted prediction and a variable padding show a clear improvement in prediction in terms of a significant reduction of under-estimations.
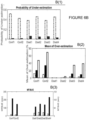
- FIGURE 6 summarizes the evaluation metrics for the defined scenarios, configurations and datasets.
- the prediction without any adjustment is characterized by a large probability of under-estimation (between 0.44 and 0.54) ( Fig 6.c1 ), a mean of over-estimation under 10% for all configurations and datasets ( Fig 6.c2 ), and a short MTBUE: less than 17 sec for all configurations and less than 21 min for all datasets ( Fig 6.c3 ).
- the main improvements given by GA to the proposed algorithm are the dynamic selection of the sliding window size and the number of predicted data, as well as the flexibility and the adaptability to changes in the workload while minimizing SLA violation and resource wasting.
- the probability of under-estimation decreases (see Table A(1) in FIGURE 6A and Table B(1) in FIGURE 6B ), and the MTBUE increases using GA in both Dataset3 and Dataset4 (see Table A(3) in FIGURE 6A and Table B(3) in FIGURE 6B ).
- the scenario without GA gives better results for Configuration 1, Configuration2, Dataset1 and Dataset2.
- Concerning over-estimation see Table A(2) in FIGURE 6A and Table B(2) in FIGURE 6B ), the scenario with GA improves results in almost all configurations and datasets, except Configuration1 and Dataset2.
- the probability of under-estimation as well as the mean of over-estimation remain close for the two scenarios (adjustment without vs with GA).
- the usage of GA enables to decrease the probability of under-estimation and the mean of over-estimation from 0.05 to 0.03 (see Table A(1) in FIGURE 6A and Table B(1) in FIGURE 6B ) and from 12% to 10% (see Table A(2) in FIGURE 6A and Table B(2) in FIGURE 6B ) respectively for Dataset3.
- the padding value was first computed dynamically based on the prediction error and the ratio r between the adjusted data and the observed data (see Equation 5). Good results were obtained in terms of under-estimation probability but the mean of over-estimation was observed to be significantly higher when the workload tends to fluctuate. Then, standard-deviation-based (std) padding was tested with different strategies by considering:
- the results of the std-based padding strategies show an improvement in terms of reducing over-estimation.
- the selected strategy namely, strategy 3 (see Algorithm 3) outperformed in almost all scenarios and for all datasets.
- the mean of over-estimations of adjusted data in case of Configuration2 with ratio-based padding is about 41.88
- the std-based padding reduced over-estimation mean to 31.26 (std3).
- Table IV presents the results of evaluation metrics of various padding strategies using Configuration2 data.
- the disclosed techniques provide a generic, dynamic and multi-step ahead prediction of resource demand in virtualized systems.
- the proposed algorithm is able to provide real-time prediction of resource needs without any prior knowledge or assumptions on the system or its internal behavior. When unexpected workload fluctuations occur, the proposed algorithm is capable of adapting to these changes with a relatively short delay.
- the techniques disclosed herein also include a dynamic adjustment based on the estimation of prediction error probability, and padding strategies to minimize SLA violation and reduce over-estimation.
- the proposed algorithm is able to generate dynamically the size of the sliding window and the number of predicted data for bringing flexibility of the prediction and improving its performance. Thorough experiments have been conducted using various virtualized systems and different workload profiles.
- the proposed algorithm is able to reduce the under-estimation average by 86% compared to prediction without adjustment. Further, the proposed algorithm decreases the over-estimation average by 67% against threshold-based provisioning. For future, additional experiments and analysis using datasets from different types of systems and applications would be valuable to reinforce the general characteristics of the disclosed algorithm. Additionally, further investigations and evaluations are to be conducted in order to improve the adjustment delay, as well as the trade-off between under-estimation and over-estimation. Moreover, study for abnormal behavior will be investigated.
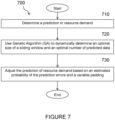
- FIGURE 7 depicts a method 700 for predicting resource consumption by a system.
- the system may be a virtualized system.
- the method begins at step 710 with determining a prediction of resource demand.
- the method proceeds to step 720 with using Genetic Algorithm (GA) to dynamically determine an optimal size of a sliding window and an optimal number of predicted data.
- the method proceeds to step 730 with adjusting the prediction of resource demand based on an estimated probability of the prediction errors and a variable padding.
- GA Genetic Algorithm
- the prediction of resource demand is determined using Kriging method and/or dynamic machine learning-based prediction.
- determining the prediction of the resource demand comprises reading collected resource consumption data ( y i ), initializing each of a size of the sliding window ( n i ) and a number of predicted data ( m i ) to a respective maximum, setting an error-adjustment coefficient and at least one padding value to zero, and performing an initialization phase.
- the initialization phase comprises performing consecutive training and prediction ( ⁇ i ) based on Kriging method, gathering historical data, and based on the historical data, applying adjustment and optimization during a prediction step.
- the prediction of the resource demand is determined, for each pair ( n i , m i ) of the set of all possible combinations of n i , m i values, based on the historical data.
- the prediction of resource demand may be adjusted for each pair ( n i , m i ) of the set of all possible combinations of n i , m i values.
- using the GA to dynamically determine the optimal size of the sliding window and the optimal number of predicted data comprises determining an optimal pair ( n s , m s ) that comprises the optimal size of the sliding window and the optimal number of predicted data.
- the method may further include using the optimal pair ( n s , m s ) to predict upcoming resource consumption based on the Kriging method and the adjustment of the prediction of resource demand according at least one error-adjustment values and outputting the adjusted predicted data ( y ⁇ a ⁇ ) that estimate the future resource consumption.
- the method may further include collecting observed data ( y i ), comparing the observed data ( y i ) to adjusted predicted data ( y ⁇ a ⁇ ), and determining whether an under-estimation is more than a threshold above which under-estimation is not tolerated (e.g., 10%, threshold defined based on empirical study). If the under-estimation is more than the threshold, the method may include evaluating the padding value and restarting the processes of prediction-adjustment taking padding into account. If the under-estimation is not more than the threshold, the method may include gathering the observed data for a subsequent prediction step.
- a threshold e.g. 10%, threshold defined based on empirical study
- steps 710, 720, and 730 may be repeatedly performed to continually or periodically estimate resource consumption.
- FIGURE 8 depicts another method 800 for real-time prediction of resource consumption by a system.
- the system is one or more virtualized systems.
- the method begins at step 810 with determining a real-time prediction of resource demand by a system.
- GA is used to dynamically determine an optimal size of a sliding window and an optimal number of predicted data within the real-time prediction of the resource demand.
- the data within the real-time prediction of the resource demand is adjusted based on an estimated probability of prediction errors and a variable padding.
- the variable padding is based on a mean of at least one previous standard deviation of the predicted data within the real-time prediction of the resource demand.
- the real-time prediction of the resource demand is determined using Kriging method.
- the real-time prediction of the resource demand is determined based on dynamic machine learning-based prediction and time series prediction.
- the initialization phase includes performing consecutive training and prediction ( ⁇ i ) based on Kriging method, gathering historical data and, based on the historical data, applying adjustment and optimization during a subsequent prediction of resource demand by the system.
- the prediction of the resource demand is determined, for each pair ( n i , m i ) of a set of all possible combinations of n i , m i values, based on the historical data, and the prediction of the resource demand is adjusted for each pair ( n i , m i ) of the set of all possible combinations of n i , m i values.
- using GA to dynamically determine the optimal size of the sliding window and the optimal number of the predicted data includes determining an optimal pair ( n s , m s ) that comprises the optimal size of the sliding window and the optimal number of the predicted data.
- the optimal pair ( n s , m s ) is used to predict a future resource consumption by the system based on the Kriging method, and the prediction of the resource demand is adjusted according to at least one error-adjustment value.
- the adjusted predicted data ( y ⁇ a ⁇ ) that estimates the future resource consumption by the system is output.
- the method further includes collecting real-time observed data ( y i ), comparing the observed data ( y i ) to adjusted predicted data ( y ⁇ a ⁇ ), and determining whether an under-estimation of resource demand is more than a threshold above which under-estimation is not tolerated. If the under-estimation is more than the threshold, a padding value is evaluated and the processes of prediction-adjustment is restarted taking the padding value into account. On the other hand, if the under-estimation is not more than the threshold, the observed data is gathered for a subsequent prediction step.
- any one or combination of the above-recited steps may be repeatedly performed to estimate the resource demand of the system.
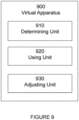
- FIGURE 9 illustrates a schematic block diagram of an apparatus 900 operable to carry out the example method described with reference to FIGURES 7 and/or 8 and possibly any other processes or methods disclosed herein. It is also to be understood that the method of FIGURES 7 and/or 8 are not necessarily carried out solely by apparatus 900. At least some operations of the method can be performed by one or more other entities.
- Virtual Apparatus 900 may comprise processing circuitry, which may include one or more microprocessor or microcontrollers, as well as other digital hardware, which may include digital signal processors (DSPs), special-purpose digital logic, and the like.
- the processing circuitry may be configured to execute program code stored in memory, which may include one or several types of memory such as read-only memory (ROM), random-access memory, cache memory, flash memory devices, optical storage devices, etc.
- Program code stored in memory includes program instructions for executing one or more telecommunications and/or data communications protocols as well as instructions for carrying out one or more of the techniques described herein, in several embodiments.
- the processing circuitry may be used to cause Determining Unit 910, Using Unit 920, Adjusting Unit 930, and any other suitable units of apparatus 900 to perform corresponding functions according one or more embodiments of the present disclosure.
- apparatus 900 includes Determining Unit 910, Using Unit 920, Adjusting Unit 930.
- Determining Unit 920 may operate to perform certain of the determining functions of apparatus 900. For example, Determining Unit 920 may determine a prediction of resource demand. As another example, Determining Unit 920 may determine a real-time prediction of resource demand by a system.
- Using Unit 920 may perform certain of the using functions of apparatus 900. For example, in a particular embodiment, Using Unit 920 may use GA to dynamically determine an optimal size of a sliding window and an optimal number of predicted data. As another example, in another particular embodiment, Using Unit 920 may use GA to dynamically determine an optimal size of a sliding window and an optimal number of predicted data within the real-time prediction of the resource demand.
- Adjusting Unit 930 may perform certain of the adjusting functions of apparatus 900. For example, in a particular embodiment, Adjusting Unit 930 may adjust the prediction of resource demand based on an estimated probability of the prediction errors and a variable padding. As another example, in a particular embodiment, Adjusting Unit 930 may adjust the data within the real-time prediction of the resource demand based on an estimated probability of prediction errors and a variable padding. According to certain embodiments, the variable padding is based on a mean of at least one previous standard deviation of the predicted data within the real-time prediction of the resource demand.
- the term unit may have conventional meaning in the field of electronics, electrical devices and/or electronic devices and may include, for example, electrical and/or electronic circuitry, devices, modules, processors, memories, logic solid state and/or discrete devices, computer programs or instructions for carrying out respective tasks, procedures, computations, outputs, and/or displaying functions, and so on, as such as those that are described herein.
- a computer program, computer program product or computer readable storage medium comprises instructions which when executed on a computer perform any of the embodiments disclosed herein.
- the instructions are carried on a signal or carrier and which are executable on a computer wherein when executed perform any of the embodiments disclosed herein.
Landscapes
- Engineering & Computer Science (AREA)
- Physics & Mathematics (AREA)
- Theoretical Computer Science (AREA)
- Software Systems (AREA)
- General Physics & Mathematics (AREA)
- Life Sciences & Earth Sciences (AREA)
- Health & Medical Sciences (AREA)
- General Engineering & Computer Science (AREA)
- Biophysics (AREA)
- Mathematical Physics (AREA)
- Computing Systems (AREA)
- Evolutionary Computation (AREA)
- Artificial Intelligence (AREA)
- Data Mining & Analysis (AREA)
- Bioinformatics & Cheminformatics (AREA)
- Evolutionary Biology (AREA)
- Bioinformatics & Computational Biology (AREA)
- Computational Linguistics (AREA)
- Biomedical Technology (AREA)
- General Health & Medical Sciences (AREA)
- Molecular Biology (AREA)
- Physiology (AREA)
- Genetics & Genomics (AREA)
- Computer Vision & Pattern Recognition (AREA)
- Medical Informatics (AREA)
- Probability & Statistics with Applications (AREA)
- Algebra (AREA)
- Computational Mathematics (AREA)
- Mathematical Analysis (AREA)
- Mathematical Optimization (AREA)
- Pure & Applied Mathematics (AREA)
- Management, Administration, Business Operations System, And Electronic Commerce (AREA)
- Debugging And Monitoring (AREA)
Claims (12)
- Verfahren für eine Echtzeitvorhersage eines Ressourcenverbrauchs durch ein System, das Verfahren umfassend:(a) Bestimmen einer Echtzeitvorhersage des Ressourcenbedarfs durch das System;(b) Verwenden eines genetischen Algorithmus (GA), um eine optimale Größe eines gleitenden Fensters und eine optimale Anzahl vorhergesagter Daten innerhalb der Echtzeitvorhersage des Ressourcenbedarfs dynamisch zu bestimmen; und(c) Anpassen der Daten innerhalb der Echtzeitvorhersage des Ressourcenbedarfs basierend auf einer geschätzten Wahrscheinlichkeit von Vorhersagefehlern und einem variablen Padding, undwobei das variable Padding auf einem Mittelwert von mindestens einer vorherigen Standardabweichung der vorhergesagten Daten innerhalb der Echtzeitvorhersage des Ressourcenbedarfs basiert,wobei das Bestimmen der Echtzeitvorhersage des Ressourcenbedarfs umfasst: Lesen erfasster Ressourcenverbrauchsdaten (yi );Initialisieren jeweils einer Größe des gleitenden Fensters (ni ) und der Anzahl vorhergesagter Daten (mi ) auf ein jeweiliges Maximum, sodass:
 Einstellen eines Fehleranpassungskoeffizienten, um die geschätzte Wahrscheinlichkeit der Vorhersagefehler zu minimieren, und Durchführen einer Fehleranpassung an den vorhergesagten Daten basierend auf dem Fehleranpassungskoeffizienten;nach dem Durchführen der Fehleranpassung an den vorhergesagten Daten, Bestimmen, ob die vorhergesagten Daten unterschätzt sind, und, falls die geschätzte Wahrscheinlichkeit der Vorhersagefehler unterschätzt ist, Hinzufügen von mindestens einem Padding-Wert; undDurchführen einer Initialisierungsphase;wobei das Verwenden des GA, um die optimale Größe des gleitenden Fensters und die optimale Anzahl der vorhergesagten Daten dynamisch zu bestimmen, das Bestimmen eines optimalen Paares (ns, ms ) umfasst, das die optimale Größe des gleitenden Fensters und die optimale Anzahl der vorhergesagten Daten umfasst; undVerwenden des optimalen Paares (ns, ms ), um einen zukünftigen Ressourcenverbrauch durch das System basierend auf der Kriging-Methode und der Anpassung der Vorhersage des Ressourcenbedarfs gemäß mindestens einem Fehleranpassungswert vorherzusagen; undAusgeben der angepassten Vorhersagedaten (
 wobei die optimale Größe des gleitenden Fensters und die optimale Anzahl von vorhergesagten Daten bestimmt wird, um den Vorhersagefehler zu minimieren,wobei das variable Padding so berechnet wird, dass das Padding = Mittelwert (σj (yi-ns ,yi )), wobei j ∈ {1,..., l}, l die Anzahl von Unterschätzungen größer als 10 % und σj die Standardabweichung der j-ten Unterschätzung ist,wobei die angepassten vorhergesagten Daten, die den zukünftigen Ressourcenverbrauch durch das System schätzen, zum Bereitstellen von Ressourcen für das System verwendet werden.
 - Verfahren nach Anspruch 1, wobei das System ein oder mehrere virtualisierte Systeme ist.
- Verfahren nach einem der Ansprüche 1 bis 2, wobei die Echtzeitvorhersage des Ressourcenbedarfs unter Verwendung der Kriging-Methode bestimmt wird.
- Verfahren nach einem der Ansprüche 1 bis 3, wobei die Initialisierungsphase umfasst:Durchführen von aufeinanderfolgendem Trainieren und Vorhersagen (ŷi ) basierend auf der Kriging-Methode; undSammeln historischer Daten;basierend auf den historischen Daten, Anwenden von Anpassung und Optimierung während einer späteren Vorhersage des Ressourcenbedarfs durch das System.
- Verfahren nach einem der Ansprüche 1 bis 4, wobei:die Vorhersage des Ressourcenbedarfs für jedes Paar (ni , mi ) eines Satzes aller möglichen Kombinationen von ni , mi -Werten basierend auf den historischen Daten bestimmt wird; unddie Vorhersage des Ressourcenbedarfs für jedes Paar (ni , mi ) des Satzes aller möglichen Kombinationen von ni , mi -Werten angepasst wird.
- Verfahren nach einem der Ansprüche 1 bis 5, ferner umfassend:Erfassen von beobachteten Echtzeitdaten (yi );Vergleichen der beobachteten Daten (yi ) mit angepassten vorhergesagten Daten (
 Bestimmen, ob eine Unterschätzung des Ressourcenbedarfs über einem Schwellenwert liegt, oberhalb dessen die Unterschätzung nicht toleriert wird; undfalls die Unterschätzung über dem Schwellenwert liegt, Auswerten eines Padding-Werts und Neustarten der Prozesse der Vorhersageanpassung unter Berücksichtigung des Padding-Werts; undfalls die Unterschätzung nicht über dem Schwellenwert liegt, Sammeln der beobachteten Daten für einen späteren Vorhersageschritt.
 - Verfahren nach einem der Ansprüche 1 bis 6, ferner umfassend das wiederholte Durchführen der Schritte (a)-(c), um den Ressourcenbedarf des Systems zu schätzen.
- Nicht flüchtiges, computerlesbares Medium, das Anweisungen für die Echtzeitvorhersage des Ressourcenverbrauchs durch ein System speichert, wobei die Anweisungen durch eine Verarbeitungsschaltlogik ausgeführt werden zum:(a) Bestimmen einer Echtzeitvorhersage des Ressourcenbedarfs durch das System,(b) Verwenden eines genetischen Algorithmus (GA), um eine optimale Größe eines gleitenden Fensters und eine optimale Anzahl vorhergesagter Daten innerhalb der Echtzeitvorhersage des Ressourcenbedarfs dynamisch zu bestimmen; und(c) Anpassen der Daten innerhalb der Echtzeitvorhersage des Ressourcenbedarfs basierend auf einer geschätzten Wahrscheinlichkeit von Vorhersagefehlern und einem variablen Padding, undwobei das variable Padding auf einem Mittelwert von mindestens einer vorherigen Standardabweichung der vorhergesagten Daten innerhalb der Echtzeitvorhersage des Ressourcenbedarfs basiert,wobei das Bestimmen der Echtzeitvorhersage des Ressourcenbedarfs umfasst: Lesen erfasster Ressourcenverbrauchsdaten (yi );Initialisieren jeweils einer Größe des gleitenden Fensters (ni ) und der Anzahl vorhergesagter Daten (mi ) auf ein jeweiliges Maximum, sodass:
 Einstellen eines Fehleranpassungskoeffizienten, um die geschätzte Wahrscheinlichkeit der Vorhersagefehler zu minimieren, und Durchführen einer Fehleranpassung an den vorhergesagten Daten basierend auf dem Fehleranpassungskoeffizienten;nach dem Durchführen der Fehleranpassung an den vorhergesagten Daten, Bestimmen, ob die vorhergesagten Daten unterschätzt sind, und, falls die geschätzte Wahrscheinlichkeit der Vorhersagefehler unterschätzt ist, Hinzufügen von mindestens einem Padding-Wert; undDurchführen einer Initialisierungsphase;wobei das Verwenden des GA, um die optimale Größe des gleitenden Fensters und die optimale Anzahl der vorhergesagten Daten dynamisch zu bestimmen, das Bestimmen eines optimalen Paares (ns, ms ) umfasst, das die optimale Größe des gleitenden Fensters und die optimale Anzahl der vorhergesagten Daten umfasst; undVerwenden des optimalen Paares (ns, ms ), um einen zukünftigen Ressourcenverbrauch durch das System basierend auf der Kriging-Methode und der Anpassung der Vorhersage des Ressourcenbedarfs gemäß mindestens einem Fehleranpassungswert vorherzusagen; undAusgeben der angepassten Vorhersagedaten (
 wobei die optimale Größe des gleitenden Fensters und die optimale Anzahl von vorhergesagten Daten bestimmt wird, um den Vorhersagefehler zu minimieren,wobei das variable Padding so berechnet wird, dass das Padding = Mittelwert (σj (yi-ns ,yi )), wobei j ∈ {1,..., l} , l die Anzahl von Unterschätzungen größer als 10 % und σj die Standardabweichung der j-ten Unterschätzung ist,wobei die angepassten vorhergesagten Daten, die den zukünftigen Ressourcenverbrauch durch das System schätzen, zum Bereitstellen von Ressourcen für das System verwendet werden.
 - Nichtflüchtiges computerlesbares Medium nach Anspruch 8, wobei das System ein oder mehrere virtualisierte Systeme ist.
- Einrichtung für die Echtzeitvorhersage des Ressourcenverbrauchs durch ein System, die Einrichtung umfassend:die Verarbeitungsschaltlogik, die konfiguriert ist zum:(a) Bestimmen einer Echtzeitvorhersage des Ressourcenbedarfs durch das System,;(b) Verwenden eines genetischen Algorithmus (GA), um eine optimale Größe eines gleitenden Fensters und eine optimale Anzahl vorhergesagter Daten innerhalb der Echtzeitvorhersage des Ressourcenbedarfs dynamisch zu bestimmen; und(c) Anpassen der Daten innerhalb der Echtzeitvorhersage des Ressourcenbedarfs basierend auf einer geschätzten Wahrscheinlichkeit von Vorhersagefehlern und einem variablen Padding, undwobei das variable Padding auf einem Mittelwert von mindestens einer vorherigen Standardabweichung der vorhergesagten Daten innerhalb der Echtzeitvorhersage des Ressourcenbedarfs basiert,wobei das Bestimmen der Echtzeitvorhersage des Ressourcenbedarfs umfasst: Lesen erfasster Ressourcenverbrauchsdaten (yi );Initialisieren jeweils einer Größe des gleitenden Fensters (ni ) und der Anzahl vorhergesagter Daten (mi ) auf ein jeweiliges Maximum, sodass:
 Einstellen eines Fehleranpassungskoeffizienten, um die geschätzte Wahrscheinlichkeit der Vorhersagefehler zu minimieren, und Durchführen einer Fehleranpassung an den vorhergesagten Daten basierend auf dem Fehleranpassungskoeffizienten;nach dem Durchführen der Fehleranpassung an den vorhergesagten Daten, Bestimmen, ob die vorhergesagten Daten unterschätzt sind, und, falls die geschätzte Wahrscheinlichkeit der Vorhersagefehler unterschätzt ist, Hinzufügen von mindestens einem Padding-Wert; undDurchführen einer Initialisierungsphase;wobei das Verwenden des GA, um die optimale Größe des gleitenden Fensters und die optimale Anzahl der vorhergesagten Daten dynamisch zu bestimmen, das Bestimmen eines optimalen Paares (ns, ms ) umfasst, das die optimale Größe des gleitenden Fensters und die optimale Anzahl der vorhergesagten Daten umfasst; undVerwenden des optimalen Paares (ns, ms ), um einen zukünftigen Ressourcenverbrauch durch das System basierend auf der Kriging-Methode und der Anpassung der Vorhersage des Ressourcenbedarfs gemäß mindestens einem Fehleranpassungswert vorherzusagen; undAusgeben der angepassten Vorhersagedaten (
 wobei die optimale Größe des gleitenden Fensters und die optimale Anzahl von vorhergesagten Daten bestimmt wird, um den Vorhersagefehler zu minimieren,wobei das variable Padding so berechnet wird, dass das Padding = Mittelwert (σj (yi-ns ,yi )), wobei j ∈ {1,..., l}, l die Anzahl von Unterschätzungen größer als 10 % und σj die Standardabweichung der j-ten Unterschätzung ist,wobei die angepassten vorhergesagten Daten, die den zukünftigen Ressourcenverbrauch durch das System schätzen, zum Bereitstellen von Ressourcen für das System verwendet werden.
 - Einrichtung nach Anspruch 10, wobei das System ein oder mehrere virtualisierte Systeme ist.
- Einrichtung nach einem der Ansprüche 10 bis 11, wobei die Echtzeitvorhersage des Ressourcenbedarfs unter Verwendung der Kriging-Methode bestimmt wird.
Applications Claiming Priority (2)
| Application Number | Priority Date | Filing Date | Title |
|---|---|---|---|
| US201862626206P | 2018-02-05 | 2018-02-05 | |
| PCT/IB2019/050907 WO2019150343A1 (en) | 2018-02-05 | 2019-02-05 | Resource needs prediction in virtualized systems: generic proactive and self-adaptive solution |
Publications (2)
| Publication Number | Publication Date |
|---|---|
| EP3750060A1 EP3750060A1 (de) | 2020-12-16 |
| EP3750060B1 true EP3750060B1 (de) | 2024-10-09 |
Family
ID=65724475
Family Applications (1)
| Application Number | Title | Priority Date | Filing Date |
|---|---|---|---|
| EP19710134.8A Active EP3750060B1 (de) | 2018-02-05 | 2019-02-05 | Vorhersage des ressourcenbedarfs in virtualisierten systemen: generische proaktive und selbstanpassende lösung. |
Country Status (3)
| Country | Link |
|---|---|
| US (1) | US12136040B2 (de) |
| EP (1) | EP3750060B1 (de) |
| WO (1) | WO2019150343A1 (de) |
Families Citing this family (23)
| Publication number | Priority date | Publication date | Assignee | Title |
|---|---|---|---|---|
| CN112311494B (zh) * | 2019-07-23 | 2023-12-08 | 华为技术有限公司 | 一种报文传输方法、装置及系统 |
| US11460584B2 (en) * | 2019-08-09 | 2022-10-04 | Orolia Usa Inc. | Methods for correcting for one or more errors when using mobile network communication signals to augment navigation and devices thereof |
| EP4029305B1 (de) * | 2019-09-13 | 2024-08-07 | Nokia Technologies Oy | Vorrichtung zur datenerfassung in einem funkzugangsnetz |
| US11398990B1 (en) * | 2019-09-27 | 2022-07-26 | Amazon Technologies, Inc. | Detecting and diagnosing anomalies in utilization levels of network-based resources |
| CN114787776B (zh) * | 2019-12-09 | 2026-01-09 | 恩梯梯株式会社 | 云服务的防违反用户需求装置、防违反用户需求方法及记录介质 |
| US11551172B2 (en) * | 2020-07-08 | 2023-01-10 | Accenture Global Solutions Limited | Solution architecture prediction |
| CN113971066B (zh) * | 2020-07-22 | 2024-11-26 | 中国科学院深圳先进技术研究院 | 一种Kubernetes集群资源动态调整方法及电子设备 |
| CN112016097B (zh) * | 2020-08-28 | 2024-02-27 | 深圳泓越信息科技有限公司 | 一种预测网络安全漏洞被利用时间的方法 |
| CN112799862B (zh) * | 2020-12-31 | 2022-09-06 | 南京航空航天大学 | 面向辐射环境的cpu抗seu效应的可靠性建模与评估方法 |
| US20220374570A1 (en) * | 2021-05-21 | 2022-11-24 | Raytheon Technologies Corporation | Gradient free design environment including adaptive design space |
| CN113434267B (zh) * | 2021-05-25 | 2022-12-02 | 深圳大学 | 云计算工作流动态调度方法、装置、设备及存储介质 |
| CN113806018B (zh) * | 2021-09-13 | 2023-08-01 | 北京计算机技术及应用研究所 | 基于神经网络和分布式缓存的Kubernetes集群资源混合调度方法 |
| CN113992525B (zh) | 2021-10-12 | 2024-06-21 | 支付宝(杭州)信息技术有限公司 | 一种应用的容器数量调节方法及装置 |
| CN114168419A (zh) * | 2021-12-09 | 2022-03-11 | 同济大学 | 负载预测方法、系统、设备及计算机可读存储介质 |
| CN114296872B (zh) * | 2021-12-23 | 2024-10-22 | 中国电信股份有限公司 | 用于容器集群管理系统的调度方法及装置 |
| US20230281052A1 (en) * | 2022-03-01 | 2023-09-07 | Hewlett Packard Enterprise Development Lp | Distributing workloads to hardware accelerators during transient workload spikes |
| CN116421457B (zh) * | 2023-02-28 | 2025-09-16 | 山东大学 | 一种基于无创预测冠状动脉灌注压的心肺复苏系统及方法 |
| EP4571508A1 (de) * | 2023-12-15 | 2025-06-18 | Siemens Aktiengesellschaft | Verfahren und system zum einsatz einer berechnungsaufgabe in einem verteilten rechnersystem |
| CN118353729B (zh) * | 2024-04-23 | 2024-11-05 | 中国标准化研究院 | 基于虚拟现实的智能家居安全评估方法和系统 |
| CN119028146B (zh) * | 2024-08-06 | 2025-06-27 | 蔡晓 | 一种地质灾害对公路交通影响程度的定量评估方法 |
| CN118760843B (zh) * | 2024-09-03 | 2024-12-31 | 佛山职业技术学院 | 一种物联网数据处理方法 |
| CN118863484B (zh) * | 2024-09-26 | 2025-01-07 | 晋江市数产互联科技有限公司 | 一种用于供应链平台的实时生产协同处理方法 |
| CN119760496B (zh) * | 2024-11-23 | 2025-10-17 | 西北工业大学 | 一种基于时空预测的imu感知资源运行时效能评估方法 |
Family Cites Families (10)
| Publication number | Priority date | Publication date | Assignee | Title |
|---|---|---|---|---|
| GB0426176D0 (en) * | 2004-11-29 | 2004-12-29 | Tang Bob | Immediate ready implementation of virtually congestion free guaranteed service capable network |
| US20050213586A1 (en) * | 2004-02-05 | 2005-09-29 | David Cyganski | System and method to increase network throughput |
| CN1980210B (zh) * | 2005-12-08 | 2010-11-10 | 北京邮电大学 | 在零前缀正交频分复用系统中实现符号盲同步的方法 |
| CN102855584B (zh) * | 2011-12-16 | 2015-07-01 | 淮阴工学院 | 一种基于线性插补与自适应滑动窗口的商品价格预测方法 |
| CN103093284A (zh) * | 2013-01-18 | 2013-05-08 | 杭州电子科技大学 | 一种海岛供水系统时用水量预测方法 |
| US9363190B2 (en) * | 2013-07-31 | 2016-06-07 | Manjrasoft Pty. Ltd. | System, method and computer program product for energy-efficient and service level agreement (SLA)-based management of data centers for cloud computing |
| JP6109037B2 (ja) * | 2013-10-23 | 2017-04-05 | 本田技研工業株式会社 | 時系列データ予測装置、時系列データ予測方法、及びプログラム |
| CN105227369B (zh) * | 2015-10-19 | 2016-06-22 | 南京华苏科技股份有限公司 | 基于众包模式的移动Apps对无线网路资源利用的分析方法 |
| JP6871010B2 (ja) * | 2016-03-04 | 2021-05-12 | キヤノンメディカルシステムズ株式会社 | 超音波診断装置及び超音波画像生成方法 |
| JP6562883B2 (ja) * | 2016-09-20 | 2019-08-21 | 株式会社東芝 | 特性値推定装置および特性値推定方法 |
-
2019
- 2019-02-05 EP EP19710134.8A patent/EP3750060B1/de active Active
- 2019-02-05 WO PCT/IB2019/050907 patent/WO2019150343A1/en not_active Ceased
- 2019-02-05 US US16/965,193 patent/US12136040B2/en active Active
Also Published As
| Publication number | Publication date |
|---|---|
| US20210064432A1 (en) | 2021-03-04 |
| WO2019150343A1 (en) | 2019-08-08 |
| US12136040B2 (en) | 2024-11-05 |
| EP3750060A1 (de) | 2020-12-16 |
Similar Documents
| Publication | Publication Date | Title |
|---|---|---|
| EP3750060B1 (de) | Vorhersage des ressourcenbedarfs in virtualisierten systemen: generische proaktive und selbstanpassende lösung. | |
| Masdari et al. | A survey and classification of the workload forecasting methods in cloud computing | |
| Subramanya et al. | Machine learning-driven scaling and placement of virtual network functions at the network edges | |
| CN112380044B (zh) | 数据异常检测方法、装置、计算机设备和存储介质 | |
| Jeong et al. | Proactive resource autoscaling scheme based on SCINet for high-performance cloud computing | |
| Shariffdeen et al. | Adaptive workload prediction for proactive auto scaling in PaaS systems | |
| Nangi et al. | Multi-Cloud Resource Stability Forecasting Using Temporal Fusion Transformers | |
| US20140351414A1 (en) | Systems And Methods For Providing Prediction-Based Dynamic Monitoring | |
| Ferdosian et al. | Autonomous intelligent VNF profiling for future intelligent network orchestration | |
| CN110796591A (zh) | 一种gpu卡的使用方法及相关设备 | |
| Chen et al. | An adaptive short-term prediction algorithm for resource demands in cloud computing | |
| Tamanampudi | AI-augmented continuous integration for dynamic resource allocation | |
| Berral et al. | Theta-scan: Leveraging behavior-driven forecasting for vertical auto-scaling in container cloud | |
| US20240004775A1 (en) | Methods and Devices for Anomaly Detection | |
| Xue et al. | Fill-in the gaps: Spatial-temporal models for missing data | |
| Gupta et al. | Online adaptation models for resource usage prediction in cloud network | |
| Djemame et al. | A machine learning based context-aware prediction framework for edge computing environments | |
| CN117081942A (zh) | 一种网络流量预测方法、装置、设备及介质 | |
| Saravanan et al. | Workload prediction for enhancing power efficiency of cloud data centers using optimized self‐attention‐based progressive generative adversarial network | |
| Jehangiri et al. | Distributed predictive performance anomaly detection for virtualised platforms | |
| Damaševičius et al. | Short time prediction of cloud server round-trip time using a hybrid neuro-fuzzy network | |
| Ullah et al. | Modified Neural Network Used for Host Utilization Predication in Cloud Computing Environment | |
| Daraghmeh et al. | Predictive Modeling of Resource Utilization in Cloud Data Centers Using Multi-Output Regression | |
| WO2022223094A1 (en) | Method and network device for determining causes of network slice performance degradation in an open radio access network, o-ran | |
| Ghasemloo et al. | Quantifying Uncertainty From Machine Learning Surrogate Models Embedded in Simulation Models |
Legal Events
| Date | Code | Title | Description |
|---|---|---|---|
| STAA | Information on the status of an ep patent application or granted ep patent |
Free format text: STATUS: UNKNOWN |
|
| STAA | Information on the status of an ep patent application or granted ep patent |
Free format text: STATUS: THE INTERNATIONAL PUBLICATION HAS BEEN MADE |
|
| PUAI | Public reference made under article 153(3) epc to a published international application that has entered the european phase |
Free format text: ORIGINAL CODE: 0009012 |
|
| STAA | Information on the status of an ep patent application or granted ep patent |
Free format text: STATUS: REQUEST FOR EXAMINATION WAS MADE |
|
| 17P | Request for examination filed |
Effective date: 20200902 |
|
| AK | Designated contracting states |
Kind code of ref document: A1 Designated state(s): AL AT BE BG CH CY CZ DE DK EE ES FI FR GB GR HR HU IE IS IT LI LT LU LV MC MK MT NL NO PL PT RO RS SE SI SK SM TR |
|
| AX | Request for extension of the european patent |
Extension state: BA ME |
|
| RIN1 | Information on inventor provided before grant (corrected) |
Inventor name: BENMAKRELOUF, SOUHILA Inventor name: KARA, NADJIA |
|
| DAV | Request for validation of the european patent (deleted) | ||
| DAX | Request for extension of the european patent (deleted) | ||
| STAA | Information on the status of an ep patent application or granted ep patent |
Free format text: STATUS: EXAMINATION IS IN PROGRESS |
|
| 17Q | First examination report despatched |
Effective date: 20220420 |
|
| GRAP | Despatch of communication of intention to grant a patent |
Free format text: ORIGINAL CODE: EPIDOSNIGR1 |
|
| STAA | Information on the status of an ep patent application or granted ep patent |
Free format text: STATUS: GRANT OF PATENT IS INTENDED |
|
| RIC1 | Information provided on ipc code assigned before grant |
Ipc: G06N 3/086 20230101ALI20240402BHEP Ipc: G06F 9/50 20060101AFI20240402BHEP |
|
| INTG | Intention to grant announced |
Effective date: 20240417 |
|
| GRAS | Grant fee paid |
Free format text: ORIGINAL CODE: EPIDOSNIGR3 |
|
| GRAA | (expected) grant |
Free format text: ORIGINAL CODE: 0009210 |
|
| STAA | Information on the status of an ep patent application or granted ep patent |
Free format text: STATUS: THE PATENT HAS BEEN GRANTED |
|
| AK | Designated contracting states |
Kind code of ref document: B1 Designated state(s): AL AT BE BG CH CY CZ DE DK EE ES FI FR GB GR HR HU IE IS IT LI LT LU LV MC MK MT NL NO PL PT RO RS SE SI SK SM TR |
|
| REG | Reference to a national code |
Ref country code: CH Ref legal event code: EP |
|
| REG | Reference to a national code |
Ref country code: DE Ref legal event code: R096 Ref document number: 602019060007 Country of ref document: DE |
|
| REG | Reference to a national code |
Ref country code: IE Ref legal event code: FG4D |
|
| REG | Reference to a national code |
Ref country code: LT Ref legal event code: MG9D |
|
| REG | Reference to a national code |
Ref country code: NL Ref legal event code: MP Effective date: 20241009 |
|
| REG | Reference to a national code |
Ref country code: AT Ref legal event code: MK05 Ref document number: 1731326 Country of ref document: AT Kind code of ref document: T Effective date: 20241009 |
|
| PG25 | Lapsed in a contracting state [announced via postgrant information from national office to epo] |
Ref country code: NL Free format text: LAPSE BECAUSE OF FAILURE TO SUBMIT A TRANSLATION OF THE DESCRIPTION OR TO PAY THE FEE WITHIN THE PRESCRIBED TIME-LIMIT Effective date: 20241009 |
|
| PG25 | Lapsed in a contracting state [announced via postgrant information from national office to epo] |
Ref country code: NL Free format text: LAPSE BECAUSE OF FAILURE TO SUBMIT A TRANSLATION OF THE DESCRIPTION OR TO PAY THE FEE WITHIN THE PRESCRIBED TIME-LIMIT Effective date: 20241009 |
|
| PG25 | Lapsed in a contracting state [announced via postgrant information from national office to epo] |
Ref country code: IS Free format text: LAPSE BECAUSE OF FAILURE TO SUBMIT A TRANSLATION OF THE DESCRIPTION OR TO PAY THE FEE WITHIN THE PRESCRIBED TIME-LIMIT Effective date: 20250209 Ref country code: HR Free format text: LAPSE BECAUSE OF FAILURE TO SUBMIT A TRANSLATION OF THE DESCRIPTION OR TO PAY THE FEE WITHIN THE PRESCRIBED TIME-LIMIT Effective date: 20241009 Ref country code: PT Free format text: LAPSE BECAUSE OF FAILURE TO SUBMIT A TRANSLATION OF THE DESCRIPTION OR TO PAY THE FEE WITHIN THE PRESCRIBED TIME-LIMIT Effective date: 20250210 |
|
| PGFP | Annual fee paid to national office [announced via postgrant information from national office to epo] |
Ref country code: DE Payment date: 20250227 Year of fee payment: 7 |
|
| PG25 | Lapsed in a contracting state [announced via postgrant information from national office to epo] |
Ref country code: FI Free format text: LAPSE BECAUSE OF FAILURE TO SUBMIT A TRANSLATION OF THE DESCRIPTION OR TO PAY THE FEE WITHIN THE PRESCRIBED TIME-LIMIT Effective date: 20241009 |
|
| PG25 | Lapsed in a contracting state [announced via postgrant information from national office to epo] |
Ref country code: BG Free format text: LAPSE BECAUSE OF FAILURE TO SUBMIT A TRANSLATION OF THE DESCRIPTION OR TO PAY THE FEE WITHIN THE PRESCRIBED TIME-LIMIT Effective date: 20241009 |
|
| PG25 | Lapsed in a contracting state [announced via postgrant information from national office to epo] |
Ref country code: ES Free format text: LAPSE BECAUSE OF FAILURE TO SUBMIT A TRANSLATION OF THE DESCRIPTION OR TO PAY THE FEE WITHIN THE PRESCRIBED TIME-LIMIT Effective date: 20241009 |
|
| PG25 | Lapsed in a contracting state [announced via postgrant information from national office to epo] |
Ref country code: NO Free format text: LAPSE BECAUSE OF FAILURE TO SUBMIT A TRANSLATION OF THE DESCRIPTION OR TO PAY THE FEE WITHIN THE PRESCRIBED TIME-LIMIT Effective date: 20250109 |
|
| PG25 | Lapsed in a contracting state [announced via postgrant information from national office to epo] |
Ref country code: LV Free format text: LAPSE BECAUSE OF FAILURE TO SUBMIT A TRANSLATION OF THE DESCRIPTION OR TO PAY THE FEE WITHIN THE PRESCRIBED TIME-LIMIT Effective date: 20241009 Ref country code: GR Free format text: LAPSE BECAUSE OF FAILURE TO SUBMIT A TRANSLATION OF THE DESCRIPTION OR TO PAY THE FEE WITHIN THE PRESCRIBED TIME-LIMIT Effective date: 20250110 Ref country code: AT Free format text: LAPSE BECAUSE OF FAILURE TO SUBMIT A TRANSLATION OF THE DESCRIPTION OR TO PAY THE FEE WITHIN THE PRESCRIBED TIME-LIMIT Effective date: 20241009 |
|
| PG25 | Lapsed in a contracting state [announced via postgrant information from national office to epo] |
Ref country code: PL Free format text: LAPSE BECAUSE OF FAILURE TO SUBMIT A TRANSLATION OF THE DESCRIPTION OR TO PAY THE FEE WITHIN THE PRESCRIBED TIME-LIMIT Effective date: 20241009 |
|
| PGFP | Annual fee paid to national office [announced via postgrant information from national office to epo] |
Ref country code: GB Payment date: 20250227 Year of fee payment: 7 |
|
| PG25 | Lapsed in a contracting state [announced via postgrant information from national office to epo] |
Ref country code: RS Free format text: LAPSE BECAUSE OF FAILURE TO SUBMIT A TRANSLATION OF THE DESCRIPTION OR TO PAY THE FEE WITHIN THE PRESCRIBED TIME-LIMIT Effective date: 20250109 |
|
| PG25 | Lapsed in a contracting state [announced via postgrant information from national office to epo] |
Ref country code: SM Free format text: LAPSE BECAUSE OF FAILURE TO SUBMIT A TRANSLATION OF THE DESCRIPTION OR TO PAY THE FEE WITHIN THE PRESCRIBED TIME-LIMIT Effective date: 20241009 |
|
| PG25 | Lapsed in a contracting state [announced via postgrant information from national office to epo] |
Ref country code: DK Free format text: LAPSE BECAUSE OF FAILURE TO SUBMIT A TRANSLATION OF THE DESCRIPTION OR TO PAY THE FEE WITHIN THE PRESCRIBED TIME-LIMIT Effective date: 20241009 |
|
| REG | Reference to a national code |
Ref country code: DE Ref legal event code: R097 Ref document number: 602019060007 Country of ref document: DE |
|
| PG25 | Lapsed in a contracting state [announced via postgrant information from national office to epo] |
Ref country code: EE Free format text: LAPSE BECAUSE OF FAILURE TO SUBMIT A TRANSLATION OF THE DESCRIPTION OR TO PAY THE FEE WITHIN THE PRESCRIBED TIME-LIMIT Effective date: 20241009 |
|
| PG25 | Lapsed in a contracting state [announced via postgrant information from national office to epo] |
Ref country code: RO Free format text: LAPSE BECAUSE OF FAILURE TO SUBMIT A TRANSLATION OF THE DESCRIPTION OR TO PAY THE FEE WITHIN THE PRESCRIBED TIME-LIMIT Effective date: 20241009 |
|
| PG25 | Lapsed in a contracting state [announced via postgrant information from national office to epo] |
Ref country code: SK Free format text: LAPSE BECAUSE OF FAILURE TO SUBMIT A TRANSLATION OF THE DESCRIPTION OR TO PAY THE FEE WITHIN THE PRESCRIBED TIME-LIMIT Effective date: 20241009 |
|
| PG25 | Lapsed in a contracting state [announced via postgrant information from national office to epo] |
Ref country code: CZ Free format text: LAPSE BECAUSE OF FAILURE TO SUBMIT A TRANSLATION OF THE DESCRIPTION OR TO PAY THE FEE WITHIN THE PRESCRIBED TIME-LIMIT Effective date: 20241009 |
|
| PG25 | Lapsed in a contracting state [announced via postgrant information from national office to epo] |
Ref country code: IT Free format text: LAPSE BECAUSE OF FAILURE TO SUBMIT A TRANSLATION OF THE DESCRIPTION OR TO PAY THE FEE WITHIN THE PRESCRIBED TIME-LIMIT Effective date: 20241009 |
|
| PLBE | No opposition filed within time limit |
Free format text: ORIGINAL CODE: 0009261 |
|
| STAA | Information on the status of an ep patent application or granted ep patent |
Free format text: STATUS: NO OPPOSITION FILED WITHIN TIME LIMIT |
|
| PG25 | Lapsed in a contracting state [announced via postgrant information from national office to epo] |
Ref country code: SE Free format text: LAPSE BECAUSE OF FAILURE TO SUBMIT A TRANSLATION OF THE DESCRIPTION OR TO PAY THE FEE WITHIN THE PRESCRIBED TIME-LIMIT Effective date: 20241009 |
|
| PG25 | Lapsed in a contracting state [announced via postgrant information from national office to epo] |
Ref country code: MC Free format text: LAPSE BECAUSE OF FAILURE TO SUBMIT A TRANSLATION OF THE DESCRIPTION OR TO PAY THE FEE WITHIN THE PRESCRIBED TIME-LIMIT Effective date: 20241009 |
|
| 26N | No opposition filed |
Effective date: 20250710 |
|
| REG | Reference to a national code |
Ref country code: CH Ref legal event code: PL |
|
| PG25 | Lapsed in a contracting state [announced via postgrant information from national office to epo] |
Ref country code: LU Free format text: LAPSE BECAUSE OF NON-PAYMENT OF DUE FEES Effective date: 20250205 |
|
| PG25 | Lapsed in a contracting state [announced via postgrant information from national office to epo] |
Ref country code: CH Free format text: LAPSE BECAUSE OF NON-PAYMENT OF DUE FEES Effective date: 20250228 |
|
| REG | Reference to a national code |
Ref country code: BE Ref legal event code: MM Effective date: 20250228 |
|
| PG25 | Lapsed in a contracting state [announced via postgrant information from national office to epo] |
Ref country code: FR Free format text: LAPSE BECAUSE OF NON-PAYMENT OF DUE FEES Effective date: 20250228 |
|
| PG25 | Lapsed in a contracting state [announced via postgrant information from national office to epo] |
Ref country code: BE Free format text: LAPSE BECAUSE OF NON-PAYMENT OF DUE FEES Effective date: 20250228 |
|
| PG25 | Lapsed in a contracting state [announced via postgrant information from national office to epo] |
Ref country code: IE Free format text: LAPSE BECAUSE OF NON-PAYMENT OF DUE FEES Effective date: 20250205 |