EP3735580B1 - Evaluation arrangement for a thermal gas sensor, method and computer program product - Google Patents
Evaluation arrangement for a thermal gas sensor, method and computer program product Download PDFInfo
- Publication number
- EP3735580B1 EP3735580B1 EP19700107.6A EP19700107A EP3735580B1 EP 3735580 B1 EP3735580 B1 EP 3735580B1 EP 19700107 A EP19700107 A EP 19700107A EP 3735580 B1 EP3735580 B1 EP 3735580B1
- Authority
- EP
- European Patent Office
- Prior art keywords
- information
- signal
- detector
- heater
- gas
- Prior art date
- Legal status (The legal status is an assumption and is not a legal conclusion. Google has not performed a legal analysis and makes no representation as to the accuracy of the status listed.)
- Active
Links
- 238000011156 evaluation Methods 0.000 title claims description 238
- 238000000034 method Methods 0.000 title claims description 64
- 238000004590 computer program Methods 0.000 title claims description 16
- 238000010438 heat treatment Methods 0.000 claims description 211
- 101100095804 Bacillus subtilis (strain 168) sigX gene Proteins 0.000 claims description 66
- 238000005259 measurement Methods 0.000 claims description 49
- 238000012937 correction Methods 0.000 claims description 36
- 239000012530 fluid Substances 0.000 claims description 19
- 238000004364 calculation method Methods 0.000 claims description 16
- 101100095802 Bacillus subtilis (strain 168) sigV gene Proteins 0.000 claims description 4
- 239000007789 gas Substances 0.000 description 493
- 239000012528 membrane Substances 0.000 description 120
- 239000000203 mixture Substances 0.000 description 87
- 238000005070 sampling Methods 0.000 description 86
- 230000006870 function Effects 0.000 description 42
- 239000000463 material Substances 0.000 description 35
- 238000012546 transfer Methods 0.000 description 34
- 238000010586 diagram Methods 0.000 description 33
- 230000001419 dependent effect Effects 0.000 description 31
- 230000000737 periodic effect Effects 0.000 description 30
- 229910052757 nitrogen Inorganic materials 0.000 description 25
- IJGRMHOSHXDMSA-UHFFFAOYSA-N Atomic nitrogen Chemical compound N#N IJGRMHOSHXDMSA-UHFFFAOYSA-N 0.000 description 24
- CURLTUGMZLYLDI-UHFFFAOYSA-N Carbon dioxide Chemical compound O=C=O CURLTUGMZLYLDI-UHFFFAOYSA-N 0.000 description 20
- 230000010363 phase shift Effects 0.000 description 19
- 239000010703 silicon Substances 0.000 description 19
- 229910052710 silicon Inorganic materials 0.000 description 19
- 230000008859 change Effects 0.000 description 16
- VNWKTOKETHGBQD-UHFFFAOYSA-N methane Chemical compound C VNWKTOKETHGBQD-UHFFFAOYSA-N 0.000 description 16
- 238000004868 gas analysis Methods 0.000 description 15
- 229910052760 oxygen Inorganic materials 0.000 description 15
- 230000003071 parasitic effect Effects 0.000 description 14
- 238000005516 engineering process Methods 0.000 description 13
- 239000010410 layer Substances 0.000 description 12
- 239000012876 carrier material Substances 0.000 description 11
- 229910002092 carbon dioxide Inorganic materials 0.000 description 10
- 230000000694 effects Effects 0.000 description 10
- 230000008569 process Effects 0.000 description 10
- 239000010409 thin film Substances 0.000 description 10
- XUIMIQQOPSSXEZ-UHFFFAOYSA-N Silicon Chemical compound [Si] XUIMIQQOPSSXEZ-UHFFFAOYSA-N 0.000 description 9
- 238000004458 analytical method Methods 0.000 description 9
- 230000005284 excitation Effects 0.000 description 9
- 239000000758 substrate Substances 0.000 description 9
- QVGXLLKOCUKJST-UHFFFAOYSA-N atomic oxygen Chemical compound [O] QVGXLLKOCUKJST-UHFFFAOYSA-N 0.000 description 8
- 239000004020 conductor Substances 0.000 description 8
- 239000001301 oxygen Substances 0.000 description 8
- 230000004044 response Effects 0.000 description 8
- 230000005540 biological transmission Effects 0.000 description 7
- 230000007423 decrease Effects 0.000 description 6
- 235000012431 wafers Nutrition 0.000 description 6
- 230000033228 biological regulation Effects 0.000 description 5
- 238000004422 calculation algorithm Methods 0.000 description 5
- 238000006243 chemical reaction Methods 0.000 description 5
- 230000001276 controlling effect Effects 0.000 description 5
- 230000007274 generation of a signal involved in cell-cell signaling Effects 0.000 description 5
- 230000035945 sensitivity Effects 0.000 description 5
- 238000003860 storage Methods 0.000 description 5
- ATUOYWHBWRKTHZ-UHFFFAOYSA-N Propane Chemical compound CCC ATUOYWHBWRKTHZ-UHFFFAOYSA-N 0.000 description 4
- 230000015572 biosynthetic process Effects 0.000 description 4
- 238000013461 design Methods 0.000 description 4
- 239000011521 glass Substances 0.000 description 4
- 238000002161 passivation Methods 0.000 description 4
- 230000035515 penetration Effects 0.000 description 4
- 230000009467 reduction Effects 0.000 description 4
- XAGFODPZIPBFFR-UHFFFAOYSA-N aluminium Chemical compound [Al] XAGFODPZIPBFFR-UHFFFAOYSA-N 0.000 description 3
- 229910052782 aluminium Inorganic materials 0.000 description 3
- 230000006399 behavior Effects 0.000 description 3
- 238000013016 damping Methods 0.000 description 3
- 238000001514 detection method Methods 0.000 description 3
- 238000009826 distribution Methods 0.000 description 3
- 230000007613 environmental effect Effects 0.000 description 3
- 239000002737 fuel gas Substances 0.000 description 3
- 238000004519 manufacturing process Methods 0.000 description 3
- 239000011159 matrix material Substances 0.000 description 3
- 230000010355 oscillation Effects 0.000 description 3
- 239000011241 protective layer Substances 0.000 description 3
- 230000000241 respiratory effect Effects 0.000 description 3
- 230000007704 transition Effects 0.000 description 3
- 238000009423 ventilation Methods 0.000 description 3
- 238000012795 verification Methods 0.000 description 3
- OTMSDBZUPAUEDD-UHFFFAOYSA-N Ethane Chemical compound CC OTMSDBZUPAUEDD-UHFFFAOYSA-N 0.000 description 2
- 230000008901 benefit Effects 0.000 description 2
- 238000009529 body temperature measurement Methods 0.000 description 2
- 229910052799 carbon Inorganic materials 0.000 description 2
- 239000003795 chemical substances by application Substances 0.000 description 2
- 238000011161 development Methods 0.000 description 2
- 230000018109 developmental process Effects 0.000 description 2
- 230000036961 partial effect Effects 0.000 description 2
- BASFCYQUMIYNBI-UHFFFAOYSA-N platinum Chemical compound [Pt] BASFCYQUMIYNBI-UHFFFAOYSA-N 0.000 description 2
- 238000012545 processing Methods 0.000 description 2
- 239000001294 propane Substances 0.000 description 2
- 230000001105 regulatory effect Effects 0.000 description 2
- 230000000630 rising effect Effects 0.000 description 2
- 239000004065 semiconductor Substances 0.000 description 2
- 241001136792 Alle Species 0.000 description 1
- OKTJSMMVPCPJKN-UHFFFAOYSA-N Carbon Chemical compound [C] OKTJSMMVPCPJKN-UHFFFAOYSA-N 0.000 description 1
- UFHFLCQGNIYNRP-UHFFFAOYSA-N Hydrogen Chemical compound [H][H] UFHFLCQGNIYNRP-UHFFFAOYSA-N 0.000 description 1
- 230000003321 amplification Effects 0.000 description 1
- 230000004888 barrier function Effects 0.000 description 1
- 238000011088 calibration curve Methods 0.000 description 1
- 239000003990 capacitor Substances 0.000 description 1
- 239000001569 carbon dioxide Substances 0.000 description 1
- 238000004891 communication Methods 0.000 description 1
- 238000010276 construction Methods 0.000 description 1
- 230000008878 coupling Effects 0.000 description 1
- 238000010168 coupling process Methods 0.000 description 1
- 238000005859 coupling reaction Methods 0.000 description 1
- 230000004069 differentiation Effects 0.000 description 1
- 238000009792 diffusion process Methods 0.000 description 1
- 229940079593 drug Drugs 0.000 description 1
- 239000003814 drug Substances 0.000 description 1
- 238000001312 dry etching Methods 0.000 description 1
- 239000001257 hydrogen Substances 0.000 description 1
- 229910052739 hydrogen Inorganic materials 0.000 description 1
- 238000002513 implantation Methods 0.000 description 1
- 238000009434 installation Methods 0.000 description 1
- 239000011810 insulating material Substances 0.000 description 1
- 239000012212 insulator Substances 0.000 description 1
- 230000007774 longterm Effects 0.000 description 1
- 238000012423 maintenance Methods 0.000 description 1
- 238000012986 modification Methods 0.000 description 1
- 230000004048 modification Effects 0.000 description 1
- 150000004767 nitrides Chemical class 0.000 description 1
- 238000001745 non-dispersive infrared spectroscopy Methods 0.000 description 1
- 238000010606 normalization Methods 0.000 description 1
- 238000003199 nucleic acid amplification method Methods 0.000 description 1
- 230000003287 optical effect Effects 0.000 description 1
- 229910052697 platinum Inorganic materials 0.000 description 1
- 230000001902 propagating effect Effects 0.000 description 1
- 238000004626 scanning electron microscopy Methods 0.000 description 1
- 238000000926 separation method Methods 0.000 description 1
- 239000002210 silicon-based material Substances 0.000 description 1
- 239000007787 solid Substances 0.000 description 1
- 230000003595 spectral effect Effects 0.000 description 1
- 238000001228 spectrum Methods 0.000 description 1
- 239000000126 substance Substances 0.000 description 1
- 239000000725 suspension Substances 0.000 description 1
- 238000010408 sweeping Methods 0.000 description 1
- 230000010512 thermal transition Effects 0.000 description 1
- 230000036962 time dependent Effects 0.000 description 1
Images


Classifications
-
- G—PHYSICS
- G01—MEASURING; TESTING
- G01N—INVESTIGATING OR ANALYSING MATERIALS BY DETERMINING THEIR CHEMICAL OR PHYSICAL PROPERTIES
- G01N25/00—Investigating or analyzing materials by the use of thermal means
- G01N25/18—Investigating or analyzing materials by the use of thermal means by investigating thermal conductivity
-
- G—PHYSICS
- G01—MEASURING; TESTING
- G01F—MEASURING VOLUME, VOLUME FLOW, MASS FLOW OR LIQUID LEVEL; METERING BY VOLUME
- G01F1/00—Measuring the volume flow or mass flow of fluid or fluent solid material wherein the fluid passes through a meter in a continuous flow
- G01F1/68—Measuring the volume flow or mass flow of fluid or fluent solid material wherein the fluid passes through a meter in a continuous flow by using thermal effects
- G01F1/684—Structural arrangements; Mounting of elements, e.g. in relation to fluid flow
- G01F1/688—Structural arrangements; Mounting of elements, e.g. in relation to fluid flow using a particular type of heating, cooling or sensing element
- G01F1/6888—Thermoelectric elements, e.g. thermocouples, thermopiles
-
- G—PHYSICS
- G01—MEASURING; TESTING
- G01N—INVESTIGATING OR ANALYSING MATERIALS BY DETERMINING THEIR CHEMICAL OR PHYSICAL PROPERTIES
- G01N33/00—Investigating or analysing materials by specific methods not covered by groups G01N1/00 - G01N31/00
- G01N33/48—Biological material, e.g. blood, urine; Haemocytometers
- G01N33/483—Physical analysis of biological material
- G01N33/497—Physical analysis of biological material of gaseous biological material, e.g. breath
Definitions
- Embodiments according to the invention relate to evaluation arrangements for a thermal gas sensor, methods and computer programs.
- Gases can currently be analyzed for their properties using a wide variety of sensors.
- various systems for patient ventilation on the market today are differentiated according to use in the clinical and in the home care area (e.g. systems from the companies Heinen+Löwenstein, Dräger and Stephan Medizintechnik).
- Only the top versions of the systems from these providers contain all the necessary measuring devices for determining pressure, respiratory flow and respiratory gas analysis. To do this, several devices must be combined, which mainly measure away from the patient.
- One embodiment relates to an evaluation arrangement for a thermal gas sensor with at least one heater (eg a heating element) and at least one detector (e.g. a thermal chain structure or "thermopile structure", temperature variable resistors or thermistors).
- the evaluation arrangement is z. B. designed to provide information about an amplitude of a detector signal of a first detector (e.g. D1.Uss) and information about a first phase difference between a heater signal and the detector signal of the first detector (e.g. (D1-Hz). phi) to get.
- the evaluation arrangement can also be designed to form a combination signal as an intermediate variable depending on the information about the amplitude of the detector signal (e.g.
- the evaluation arrangement is also designed to B. to determine information about a gas concentration or information about a thermal conductivity of a fluid (e.g. a gas or gas mixture) based on the combination signal (e.g. without considering the individual pieces of information flowing into the combination signal separately again as the calculations progress).
- a fluid e.g. a gas or gas mixture
- the heater and the at least one detector can be exchanged cyclically in order to minimize any (synchronization) errors.
- the detector can act as a heater and the heater as a detector and at a second point in time the detector can act as a detector and the heater as a heater.
- the evaluation arrangement includes two detectors, these two detectors being at the same distance from the heater.
- a sum of the information about the amplitudes of the two detector signals e.g. D1.Uss and D2.Uss
- a sum of the information about the two phase differences ((D1-Hz) .phi and (D2-Hz).phi) of the two detectors.
- One embodiment relates to an evaluation arrangement for a thermal gas sensor with at least one heater (e.g. a heating element) and two detectors arranged at different distances from the heater (e.g. a first thermocouple structure and a second thermocouple structure or temperature-variable resistors or thermistors), the evaluation arrangement being designed to provide information about an amplitude of a detector signal from a first detector (e.g. D1.Uss), information about an amplitude of a detector signal from a second detector (e.g. D2.Uss), information about a first phase difference between a heater signal and the detector signal of the first detector (e.g.
- the evaluation arrangement can be designed as an intermediate variable depending on the information about the amplitudes of the detector signals (e.g. D1.Uss of the first detector and D2.Uss of the second detector) and depending on the information about the first phase difference and depending on the Information about the second phase difference to form a combination signal that can summarize amplitude information and phase information.
- the evaluation arrangement is also designed to determine information about a gas concentration or information about a thermal conductivity of a fluid (e.g. a gas or gas mixture) based on the combination signal (e.g. without further processing of the calculations, the individual information flowing into the combination signal yet to be considered separately).
- gas can be arranged in the thermal gas sensor between the at least one heater and the detectors arranged at different distances or at equal distances (e.g. symmetrically) from the heater, which gas can be analyzed with the evaluation arrangement in cooperation with the thermal gas sensor can.
- heat is transported from the at least one heater to the first detector and the second detector via the gas or gas mixture located between them.
- a detector signal detected by the first detector or a detector signal detected by the second detector can indicate the heat transported from the heater to the respective detector. If a heating signal amplitude (e.g. heater amplitude) of the at least one heater varies (e.g.
- the detector signal from the first detector or the second detector can be sent to the evaluation arrangement.
- the evaluation arrangement can thus receive the respective information about the amplitude from the detector signal of the first detector and from the detector signal of the second detector, as well as information about the first phase difference between the heater signal and the detector signal of the first detector and the information about the second phase difference between the Get heater signal and the detector signal of the second detector.
- the evaluation arrangement can, for example, receive the heater signal from the thermal gas sensor in addition to the detector signals of the first detector or the second detector.
- the evaluation arrangement can, for example, receive the information about the amplitude directly from the thermal gas sensor of the detector signal of the first detector, the information about the amplitude of the detector signal of the second detector, the information about the first phase difference and the information about the second phase difference.
- This exemplary embodiment of the evaluation arrangement is based on the finding that the combination signal, based on the information about the amplitudes of the detector signals and depending on the information about the first phase difference and the information about the second phase difference, represents a very stable signal that is very can be further processed quickly, for example to determine a gas concentration or information about a thermal conductivity of the fluid.
- the evaluation arrangement thus allows rapid gas analysis.
- the evaluation arrangement can be designed to obtain information about a heater amplitude.
- the evaluation arrangement can also be designed to form a linear combination of the information about the heater amplitude, the information about amplitudes of the detector signals, the information about the first phase difference and the information about the second phase difference in order to determine the combination signal (sigX).
- the information about the heater amplitude can be information about a heating power, for example.
- the information about a heater amplitude can also be referred to as Hz.Uss.
- the evaluation arrangement can, for example, receive the information about the heater amplitude directly from the thermal gas sensor or, for example, from a heater signal sent by the thermal gas sensor to the evaluation arrangement.
- the linear combination can have, for example, a first term that has a first linear combination of the information about the heater amplitude and the information about amplitudes of the detector signals, and a second term that has a second linear combination of the information about the first phase difference and the information about the second has phase difference.
- the first term and the second term can be weighted with different constants in the linear combination in order to determine the combination signal. Since the evaluation arrangement takes the heater amplitude into account when determining the combination signal, the heater signal (e.g.
- a signal of periodic temperature waves emitted by the heater can be compared with the detector signal of the first detector or the second detector (e.g a received signal of periodic temperature waves) can be compared, whereby a heat transfer from the heater via the gas to be analyzed to the two detectors can be determined very accurately can. A very precise and rapid gas analysis is thus made possible with the evaluation arrangement.
- sigUss can be amplitude information or an amplitude signal that can be dependent on the information about the amplitude of the detector signal of the first detector and on the information about the amplitude of the detector signal of the second detector.
- the sigPhi term may be phase information or an added phase signal, which may depend on the first phase difference information and on the second phase difference information, and the factors Ka and Kp may be constants.
- Ka and Kp can weight the amplitude information or the phase information separately, so that the evaluation arrangement can receive the combination signal sigX.
- the amplitude information sigUss can be a linear combination of the information about the amplitude of the detector signal of the first detector and the information about the amplitude of the detector signal of the second detector.
- the phase information sigPhi can be a linear combination of the information about the first phase difference and the information about the second phase difference.
- the constants Ka and Kp can represent conversion factors, for example.
- Ka and Kp are weighting factors for an optimized combination signal, with the factors Ka and Kp being able to represent variables without units (for an embedded system such as that used here, which supplies a CO2 concentration, for example, this is not necessary, for example).
- a conversion to amplitude and time/angle is thus e.g. B. given by the technical data of a circuit and the embedded system ( ⁇ Controller) of the evaluation arrangement.
- the factors are e.g. B. selected so that over the measuring range of the CO2 calibration, both signal components (amplitude and phase) are included in the combination signal SigX in approximately equal proportions, so that e.g. B. the largest measurement resolution is obtained in SigX.
- the factors Ka and Kp are e.g. B. empirically determined to z. B. to get the best signal for SigX.
- the constants Ka and Kp can, for example, depend on a concentration, a Temperature or pressure of a gas to be analyzed.
- the amplitude information sigUss can thus be matched to the phase information sigPhi. It is made possible for the evaluation arrangement to be able to further process both amplitude information and phase information with the combination signal in one go, as a result of which, for example, the evaluation arrangement can analyze the gas detected by the gas sensor very quickly, efficiently and precisely.
- the Hz.Uss term can be information about a heater amplitude
- the term D1.Uss can be the information about the amplitude of the detector signal of the first detector
- D2.Uss can be the information about the amplitude of the detector signal of the second detector.
- the amplitude information sigUss can thus represent a relative amplitude signal.
- the amplitude information can be a difference between twice the heater amplitude and a sum of the information about the amplitude of the detector signal of the first detector and the information about the amplitude of the detector signal of the second detector.
- This special calculation of the amplitude information sigUss can ensure that the amplitude information sigUss depends essentially on heat transfer through the fluid and unknown heat transfers, for example from the at least one heater into the gas to be analyzed and from the gas to be analyzed into the first or second Detector are not or only rarely taken into account.
- the combination signal sigX which may depend on the amplitude information sigUss, e.g. B. not or only slightly affected by unknown heat transfer, whereby the evaluation very precisely properties of the gas to be analyzed, such. B can determine the information about the gas concentration or the information about the thermal conductivity of the fluid.
- the evaluation arrangement can be designed to calculate a polynomial (for example first degree, for example Ay(sigX)) of the combination signal in order to obtain information about the gas concentration or information about the thermal conductivity of the fluid.
- a drift correction of the combination signal can be carried out by the polynomial formation of the evaluation arrangement of the combination signal. For example, concentration drift, pressure drift and temperature drift can be corrected by forming polynomials.
- the evaluation arrangement can calculate three polynomials of the combination signal, where a first polynomial can represent a relationship between the gas concentration and the combination signal, a second polynomial can represent a relationship between pressure and signal shift (pressure drift of the combination signal) and a third polynomial can represent a relationship between a temperature and pressure shift can.
- a first polynomial can represent a relationship between the gas concentration and the combination signal
- a second polynomial can represent a relationship between pressure and signal shift (pressure drift of the combination signal)
- a third polynomial can represent a relationship between a temperature and pressure shift can.
- the evaluation arrangement can be designed to multiply a polynomial of the combination signal by a correction term in order to obtain information about the gas concentration or information about the thermal conductivity.
- the correction term can be dependent on the combination signal, information about a pressure (p) and information about a temperature (T).
- the correction term can thus, for example, compensate for a pressure and temperature dependency of the combination signal.
- a polynomial that represents a relationship between a gas concentration and the combination signal can be corrected for a pressure and temperature drift using the correction term.
- the evaluation arrangement can reduce possible error effects, as a result of which the evaluation arrangement can be designed to obtain very precise information about the gas concentration or information about the thermal conductivity. In this way, for example, pressure- and temperature-dependent errors that arise, for example, when a detector signal is detected by the first detector or the second detector of the gas sensor, can be minimized.
- sigX can be the combination signal
- pol(sigX) can be a polynomial of the combination signal sigX
- f(p) can be a function of the pressure p (or a measured pressure p in an environment of the thermal gas sensor)
- const1 can be a first constant
- f(T) can be a function of temperature T (or a measured temperature T in an environment of the thermal gas sensor)
- const2 can be a second constant.
- the function f(p) can be a polynomial, for example, which can represent a relationship between a pressure and a signal shift and f(T) can be a A polynomial that can represent a relationship between a temperature and a signal shift.
- the term sigX can be the combination signal, Ay(sigX) can be a polynomial (e.g.
- By(p) can be a function of the pressure p (or a measured pressure p in an environment of the thermal gas sensor)
- B.ref can be a constant
- Cy(T) can be a function of the temperature T (or a measured temperature T in an environment of the thermal gas sensor)
- C.ref can be a second constant.
- By(p) is, for example, a polynomial function (for example of the second order) which can represent a relationship between the pressure p and a signal shift (for example of the combination signal sigX).
- the function Cy(T) is, for example, a polynomial function (e.g. second order) which e.g. B.
- the evaluation arrangement is thus designed to very precisely determine, for example, information about the gas concentration of a fluid to be analyzed, since the function By(p) of the pressure p and the function Cy(T) of the temperature T can form a correction term that the combination signal sigX can correct.
- the evaluation arrangement can be designed to take into account a pressure and/or a temperature in an area surrounding the thermal gas sensor when determining the information about the gas concentration.
- the evaluation arrangement can receive information about the pressure and/or the temperature in the vicinity of the thermal gas sensor, for example.
- the pressure in the vicinity of the thermal gas sensor is determined, for example, by a pressure sensor and the temperature in the vicinity of the thermal gas sensor is determined, for example, by a temperature sensor and transmitted to the evaluation arrangement.
- the pressure sensor and/or the temperature sensor can be arranged in the vicinity of the thermal gas sensor. This enables the evaluation arrangement to be dependent of the pressure and / or the temperature carries out corrections, and thus can analyze the fluid very precisely and thus can receive very precise information, for example, about the gas concentration or a thermal conductivity of the fluid.
- the evaluation arrangement can be designed to use the combination signal, information about the temperature in an area surrounding the thermal gas sensor and information about a pressure in an area surrounding the thermal gas sensor as input variables for a drift correction when determining the information about the gas concentration and to get the information about the gas concentration as a result of the drift correction.
- the drift correction does not contain any further variables, for example, but only uses (eg additionally) previously obtained constants, for example those determined in the course of a calibration.
- the evaluation arrangement can thus be designed to calculate out possible errors in the calculation of the gas concentration caused by drift and thus carry out a drift correction.
- the drift can occur at different temperatures and pressures and thus falsify a determination of the gas concentration, which can be prevented or suppressed with this feature. It is thus possible to use the evaluation arrangement to determine information about the gas concentration very precisely.
- the evaluation arrangement is designed to calculate the combination signal or a further combination signal based on a quotient between amplitude information which is derived from the information about the amplitude of the detector signal at least from the first detector and optionally also from the information about the amplitude of the detector signal of the second detector and phase information dependent on the information on the first phase difference and optionally on the information on the second phase difference.
- the evaluation arrangement can be designed to provide information about a concentration of a gas, e.g. B. a third gas of a gas mixture to determine.
- the quotient is a ratio between the information about the amplitude and the phase information.
- the third gas shifts this ratio, as a result of which the evaluation arrangement can be designed to infer the concentration of the third gas component based on this ratio.
- sigUss can be an amplitude information dependent on the information on the amplitude of the detector signal of the first detector and optionally on the information on the amplitude of the detector signal of the second detector.
- sigPhi can be phase information that is dependent on the information about the first phase difference and optionally on the information about the second phase difference.
- Kav and Kpv represent constants.
- B. represents the relationship between the information about the amplitude and the phase information.
- the evaluation arrangement is designed to determine a further physical gas parameter by means of the ratio sigV from the amplitude and phase signal, with which the evaluation arrangement z. B. can be closed by correlation to the unknown concentration of a known third gas in the gas mixture to be analyzed.
- Kav and Kpv are new weighting factors that amplify changes in amplitude and phase ratios.
- the evaluation arrangement is designed to obtain information about how much heat is dissipated by the heater during a heating period and, depending on the information about how much energy is dissipated by the heater during the heating period, information about a concentration a gas, e.g. B. a third gas of a gas mixture to determine.
- a heating period can be understood to mean a period of time between a first zero crossing of a heating voltage and a second zero crossing of the heating voltage.
- the heating period can also be a period of time from a first point in time at which the heating voltage changes from zero volts to greater or less than zero volts to a second point in time at which the heating voltage changes from greater than or less than zero volts to zero volts will.
- the heating signal can e.g. B. have a sine signal, a cosine signal, a square wave, a triangle signal or a sawtooth signal.
- B. has a sine signal, a cosine signal, a square wave, a triangle signal or a sawtooth signal.
- the heat is dissipated to the gas mixture surrounding the heater. How much heat is dissipated from the heater to the surrounding gas is z. B. depends on a thermal conductivity of the surrounding gas, or on a thermal conductivity of gas components of the surrounding gas mixture.
- the evaluation arrangement can thus be designed to determine a thermal conductivity of the unknown gas or gas mixture by means of the heat dissipated by the heater.
- the evaluation arrangement is designed to obtain the information on how much heat is dissipated by the heater during a heating period, based on a measurement of a current flow through the heater at a predetermined heating voltage.
- the heating voltage applied to the heater is fixed during the heating period and the current flow changes depending on how much heat is given off to the gas or gas mixture. The more heat is given off, the less the temperature of the heater increases and thus, assuming a positive TKR (temperature coefficient of resistance), the value of the heater resistance increases, which means that the current flow decreases less.
- TKR temperature coefficient of resistance
- the evaluation arrangement is designed to obtain the current flow shortly after the specified heating voltage is switched on and shortly before the specified heating voltage is switched off.
- the evaluation arrangement can determine a change in the current flow during the heating period from a difference between these two current flow data. The greater the difference, the lower the thermal conductivity of the gas or gas mixture to be analyzed.
- the evaluation arrangement is thus designed to determine the thermal conductivity of the gas or gas mixture, e.g. B. as an additional parameter in an analysis of the gas or gas mixture.
- the evaluation arrangement can be designed to use the measurement of the thermal conductivity as a further physical parameter of the unknown gas mixture, in that the evaluation arrangement z. B.
- the heater current is designed to evaluate the difference in the heater current in an initial maxima shortly after switching on the heating voltage and just before switching off the heating voltage (per period). Shortly after the heating voltage is switched on can be a point in time in a period of 10 ⁇ s to 1 ms, 100 ⁇ s to 800 ⁇ s or 300 ⁇ s to 500 ⁇ s, such as e.g. B. at 400 ⁇ s after switching on.
- One embodiment provides a method for evaluating signals from a thermal gas sensor with at least one heater and at least one detector. For example, heat can be transferred from the heater to the detector via a gas to be analyzed.
- the method can include obtaining information about an amplitude of a detector signal of a first detector (e.g. D1.Uss) and information about a first phase difference between a heater signal and the detector signal of the first detector (e.g. (D1-Hz).phi).
- a combination signal can be formed as an intermediate variable depending on the information about the amplitude of the detector signal and depending on the information about the first phase difference.
- the combination signal can, for example, combine amplitude information and phase information.
- Information about a gas concentration or information about a thermal conductivity of a fluid can be determined based on the combination signal. This determination can be made, for example, without once again separately considering the individual items of information flowing into the combination signal in the further course of the calculations.
- One embodiment creates a method for evaluating signals from a thermal gas sensor with at least one heater and two detectors arranged at different distances or the same distances from the heater. For example, heat can be transferred from the heater to the two detectors via a gas to be analyzed.
- the method may include obtaining information about an amplitude of a detector signal of a first detector (e.g. D1.Uss), information about an amplitude of a detector signal of a second detector (e.g. D2.Uss), information about a first phase difference between a heater signal and the detector signal of the first detector (e.g. (D1-Hz).phi), and information about a second phase difference between the heater signal and the detector signal of the second detector (e.g. (D2-Hz).phi).
- a combination signal can be formed as an intermediate variable depending on the information about the amplitudes of the detector signals and depending on the information about the first phase difference and depending on the information about the second phase difference.
- the combination signal can, for example, combine amplitude information and phase information.
- Information about a gas concentration or information about a thermal conductivity of a fluid can be determined based on the combination signal. This determination can be made, for example, without once again separately considering the individual items of information flowing into the combination signal in the further course of the calculations.
- An embodiment relates to a computer program with a program code for carrying out a method when the program runs on a computer.
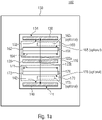
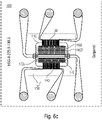
- the gas sensor 100 may include a membrane 110 (e.g., a thin film membrane), a heating element 120 , a first thermocouple structure 130 and a second thermocouple structure 140 .
- the gas sensor can also only have the first thermocouple structure 130 or the second thermocouple structure 140 .
- the membrane 110 can be spanned by a frame 150 and have a first interruption area 160 and a second interruption area 170 .
- the first discontinuous area 160 of the diaphragm 110 may include at least one discontinuous portion 162 and the second discontinuous portion 170 of the diaphragm 110 may include at least one discontinuous portion 172 as well.
- the heating element 120 can be arranged, for example, as a self-supporting bridge structure on the membrane 110 between the first interruption area 160 and the second interruption area 170 of the membrane 110 .
- the first thermocouple structure 130 may have a hot end 132 and a cold end 134 .
- the hot end 132 of the first thermocouple structure 130 may be disposed on the membrane 110 on an opposite side of the first interrupt region 160 from the heating element 120 .
- the second thermocouple structure 140 may also have a hot end 142 and a cold end 144 .
- the hot end 142 may be disposed on the membrane 110 on an opposite side of the second disconnect region 170 from the heating element 120 .
- the membrane 110 can be a thin-layer membrane with a thickness between 200 nm and 4000 nm, 300 nm and 3000 nm, 400 nm and 2000 nm or between 1 ⁇ m and 10 ⁇ m. According to one exemplary embodiment, the thickness of the entire membrane is around 2 ⁇ m (it consists, for example, of several membrane, sensor and passivation layers).
- the membrane layer can e.g. B. Si oxide and / or Si nitride.
- An extension of the membrane 110 into the plane of the page, that is, for example, perpendicular to a surface of the membrane 110 on which the heating element 120, the first thermocouple structure 130 and the second thermocouple structure 140 are arranged, can be defined as the thickness.
- the membrane 110 can comprise conductive material, insulating material or semiconductor material, with the material having a very low thermal conductivity, for example below 5W/(m*K), below 100 mW/(m*K) or below 50 mW/(m*K ), may have.
- a semiconductor with an adapted basic doping can serve as a cost-effective substrate for the production of the membrane 110 in a simple five-mask MEMS process.
- the heating element 120 (the heating element 120 may also be referred to as a heater in the following) may form a cantilevered bridge structure and/or comprise a wire.
- the heating element 120 can be spanned from one side of the frame 150 to an opposite side of the frame 150 .
- a voltage can be applied to the heating element 120, for example, whereby the heating element 120 can transfer heating power to a gas to be analyzed, located for example in the first interruption area 162 and/or in the second interruption area 172.
- the voltage applied to the heating element 120 can be, for example, a periodic voltage signal, such as. B. a sine signal or a periodic square-wave signal.
- the heating element 120 can provide a periodic heater signal (eg the heating power), for example.
- the heater signal may be transmitted to the first thermocouple structure 130 and/or the second thermocouple structure 140, for example, via the membrane 110 and/or via a gas located, for example, in the first break 162 or the second break 172.
- the first thermocouple structure 130 and/or the second thermocouple structure 140 are formed, for example, in a meandering shape, which can correspond, for example, to thermocouples connected in series, which form a thermocouple chain.
- the first thermocouple structure 130 and/or the second thermocouple structure 140 can thus serve as a detector, with the first thermocouple structure 130 and/or the second thermocouple structure 140 being able to detect the heater signal, for example.
- the first thermocouple structure 130 and/or the second thermocouple structure 140 can be completely arranged on the membrane 110 , or at least partially arranged on the membrane 110 and at least partially arranged on the frame 150 .
- a temperature of the frame 150 can serve as a comparison temperature (here, for example, the cold ends 134 of the first thermocouple structure 130 can be arranged and/or the cold ends 144 of the second thermocouple structure 140) and the part of the thermocouple structure that on the membrane 110 (e.g. the hot ends 132, 142) can detect a measurement temperature (e.g. the heater signal).
- the hot ends 132, 142 and the cold ends 134, 144 are connected to a conductor, for example.
- a conductor comprising a first material can connect a first cold end to a first hot end and a second conductor comprising a second material can connect the first hot end to a second cold end.
- a first conductor and a second conductor can represent a thermocouple, which can be connected in series to form a thermal chain, for example, and can thus represent the first thermocouple structure 130 or the second thermocouple structure 140, for example.
- a temperature difference e.g. between the reference temperature and the measurement temperature
- first thermocouple structure 130 and/or the second thermocouple structure 140 may be configured to convert heat into electrical energy.
- the first thermocouple structure 130 and/or the second thermocouple structure 140 may be a wire or a cantilever bridge structure.
- the membrane 110 can be stretched over the frame 150 made of carrier material, which is designed such that the coefficient of thermal expansion and/or a thermal conductivity of membrane material differs from the coefficient of thermal expansion and/or the thermal conductivity of the carrier material.
- the frame 150 may include support material or substrate material with which the membrane 110 may be supported, for example.
- a comparison temperature can be set on the frame 150 .
- the frame 150 and the membrane 110 can also have the same coefficient of thermal expansion.
- the membrane 110 can have a lower thermal conductivity than the frame 150.
- the membrane 110 in particular should have a very low thermal conductivity, for example, so that, for example, the heater signal from the heating element 120 mainly via the gas to be analyzed (arranged, for example, in the first interruption 162 and/or in the second interruption 172) to the first thermocouple structure 130 and/or the second thermocouple structure 140, instead of via the membrane 110.
- heat transport via the membrane 110 can be suppressed, reduced or be slowed down.
- the membrane 110 can thus be formed in order to suppress parasitic heat conduction from the heating element 120 to the first thermocouple structure 130 or to the second thermocouple structure 140 .
- the thermal conductivity of the membrane 110 can be selected, for example, so that little or no heat is conducted from the heating element 120 via the membrane 110 to the first thermocouple structure 130 or the second thermocouple structure 140 and a large part of the heat or the entire heat via the to be analyzed gas is conducted.
- the thermal conductivity of the carrier material of the frame 150 that holds the membrane 110 can be very high.
- a carrier material z. B. silicon with a thermal conductivity of 150 W / (m * K) can be used as a carrier material.
- the carrier material can thus serve as a heat sink.
- the first thermocouple structure 130 and the second thermocouple structure 140 is at least partially, z. B. with the hot ends 132, 142 on the membrane and at least partially, z. B. with the cold ends 134, 144, arranged on the carrier material, whereby a temperature difference can occur within the first thermocouple structure 130 or the second thermocouple structure 140, with the help of which the heat transport from the heating element 120 to the respective thermocouple structure 130, 140 can be detected.
- the cold ends of the first thermocouple structure 130 and the cold ends of the second thermocouple structure 140 can thus be arranged on the carrier material of the frame 150 . They are located, for example, where the membrane 110 is supported by the substrate.
- the first discontinuity region 160 of the membrane 110 can have a continuous discontinuity 162 whose longitudinal extent 164 is large enough to completely cover the region between the first thermocouple structure 130 and the heating element 120 .
- the second discontinuity area 170 of the membrane 110 may have a continuous discontinuity 172 whose longitudinal extent 174 is large enough to completely cover the area between the second thermocouple structure 140 and the heating element 120 .
- the longitudinal extension 164, 174 is, for example, as large as the entire length of the heating element 120 and/or at least as long as the entire length of the first thermocouple structure 130 and/or the second thermocouple structure 140.
- the transverse extent 166 of the at least one interruption 162 of the first interruption area 160 can be different from the transverse extent 176 of the at least one interruption 172 of the second interruption area 170 .
- the transverse extension 166, 176 of the first interruption 162 and the second interruption 172 can be, for example, in a direction perpendicular to a direction of maximum extension of the heating element 120 or in a direction from the heating element 120 to the respective thermocouple structures (e.g. the first thermocouple structure 130 and/or the second thermocouple structure 140).
- the first interruption 162 and the second interruption 172 have the same transverse extent 166, 176.
- the first break 162 may have a longitudinal extent 164 and a transverse extent 166 such that the first break 162 corresponds to the extents of the first break region 160 .
- the second interruption 172 can have a longitudinal extension 174 and a transverse extension 176, for example, so that the second interruption 172 corresponds to the extensions of the second interruption region 170.
- the complete first interruption area 160 can represent the first interruption 162 and the complete interruption area 170 can represent the interruption 172.
- the membrane 110 can have a third and/or a fourth interrupt region on the side of the cold ends 134, 144 of the first thermocouple structure 130 and/or the second thermocouple structure 140.
- the first thermocouple structure 130 can be arranged in the form of a wire or a cantilevered bridge structure between the first interruption area 160 and a third interruption area
- the second thermocouple structure 140 can be arranged, for example, as a wire or as a cantilevered bridge structure between the second interruption area 170 and be arranged in the fourth interruption area.
- the first thermocouple structure 130 and/or the second thermocouple structure 140 can be surrounded by the gas to be analyzed on two sides, for example.
- the first thermocouple structure 130 may have a different distance to the heating element 120 than the second thermocouple structure 140.
- the first thermocouple structure 130 has the same Distance to the heating element 120, like the second thermocouple structure 140.
- the heater signal from the heating element 120 detected by the first thermocouple structure 130 may be referred to as a first sensor signal and the heater signal from the heating element 120 detected by the second thermocouple structure 140 may be referred to as a second sensor signal, for example.
- the first sensor signal and/or the second sensor signal can have, for example, the two unknown heat transfers (e.g.: heating element -> gas, gas -> thermocouple structure) and a heat transfer via the gas to be analyzed.
- the first thermocouple structure 130 is at a different distance from the heating element 120 than the second thermocouple structure 140, then a difference signal can be created by the gas sensor from the first sensor signal and the second sensor signal, for example by using the unknown heat transitions (the first sensor signal can have the same heat transfers as the second sensor signal) can be calculated out and thus the difference signal only or to a large extent has the heat transfer via the gas to be analyzed from the heating element 120 to the respective thermocouple structure 130, 140, but not or to a very small extent Share which has unknown heat transfers.
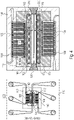
- first break area 160 and second break area 170 may include multiple breaks (e.g., break 162 and break 162 1 or break 172 and break 172 1 ) that may be arranged such that (e.g., by the remaining membrane material 110) creates a lattice structure (e.g. in the first discontinuity region 160 or the second discontinuity region 170) in which the discontinuities are arranged in rows parallel to the heating element 120 and the rows are arranged offset from one another.
- the interruptions in an interruption area 160, 170 can differ from one another both in the longitudinal extent 164, 174 and in the transverse extent 166, 176. According to Fig.
- the interruption 162 1 of the first interruption area 160 has a smaller longitudinal extension than the longitudinal extension 164 of the interruption 162 .
- the interruption 172 1 of the second interruption region 170 can have a smaller longitudinal extent than the longitudinal extent 174 of the interruption 172.
- the first discontinuity region 160 and the second discontinuity region 170 may include multiple discontinuities, which may be arranged to form a lattice structure in which a thermal conduction path through the membrane 110 is longer than a direct path 122a, 122b.
- the direct path 122a, 122b may be a straight path perpendicular to the heating element 120, from the heating element 120 to the thermocouple structure 130, 140, for example.
- the direct path 122a, 122b can run through the interruptions 162 and 162 1 or through the interruptions 172 and 172 1 , whereby thermal conduction through the gas to be analyzed from the first thermocouple structure 130 and/or the second thermocouple structure 140 can be detected.
- the direct path 122a, 122b would only take place via the membrane 110 and not via the gas to be analyzed, the gas sensor 100 cannot guarantee a meaningful analysis of the gas.
- the at least one interruption 162, 172 in the first interruption area 160 and in the second interruption area 170 can form rectangular sections with optionally rounded corners. This is, for example, a slot. This can also involve oval holes, for example. Even if in Fig. 1a while the discontinuity 162 of the first discontinuity region 160 and the discontinuity 172 of the second discontinuity region 170 are shown as rectangular discontinuities (holes), the discontinuities may have any shape (such as triangular, circular, square, polygonal, etc.).
- the shape of the interruptions 162, 172 can be adjusted so that a heat path from the heating element to the first thermocouple structure 130 and/or to the second thermocouple structure 140 via the membrane 110 is as long as possible and a path via the gas to be analyzed is one very way represents. This enables as much heat as possible to be transported via the gas to be analyzed and not via the membrane 110, as a result of which the gas sensor 100 can analyze the gas very precisely.
- the at least one interruption 162, 172 can be at least three times longer than it is wide.
- the longitudinal extent 164 of the break 162 can be three times longer than the transverse extent 166 or the longitudinal extent 174 of the break 172 can be three times longer than the transverse extent 176.
- the length represents, for example, the longitudinal dimension 164, 174 and the width, for example, the transverse dimension 166, 176.
- the length can be defined, for example, as a direction parallel to the heating element 120 (or to a direction of maximum expansion of the heating element 120) and the Width can be defined as a direction perpendicular to the heating element 120 (or to a direction of maximum extension of the heating element 120).
- a distance 168 between a plurality of interruptions 162, 162 1 in the first interruption region 160 and a distance 178 between a plurality of interruptions 172, 172 1 in the second interruption region 170 can correspond to the smallest structure width that can be realized, which results in a mechanically durable lattice structure.
- the distance 168, 178 can define a width of ridges between two interruptions consisting of membrane material of the membrane 110. FIG. The smaller the distance 168, 178, the less heat is transferred across the membrane 110 from the heating element 120 to the first thermocouple structure 130 and/or the second thermocouple structure 140 and the more heat is transferred via the gas to be analyzed.
- the first thermocouple structure 130 and the second thermocouple structure 140 may be passivated with a protective layer.
- the protective layer can protect the first thermocouple structure 130 and the second thermocouple structure 140 from damage caused by the gas to be analyzed and thus avoid possible inaccuracies in the gas sensor during the gas analysis due to damage to the first thermocouple structure 130 and the second thermocouple structure 140 .
- the hot end 132 of the first thermocouple structure may extend to an edge of the first open area 160 of the membrane 110 and the hot end 142 of the second thermocouple structure 140 may extend to an edge of the second open area 170 of the membrane 110 .
- the distance between the hot end 132 and the first interruption area 160 or the distance between the hot end 142 and the second interruption area 170 should not be greater than 0.5 mm, 100 nm or 10 ⁇ m, for example.
- the interruption 162 or the interruption 142 extends to this edge, the membrane 110 has only a very small distance between the respective hot ends and the respective interruption. This makes it possible for the membrane material of membrane 110 not to affect detection of the heater signal by first thermocouple structure 130 or by second thermocouple structure 140, or only slightly, so that gas sensor 100 can analyze the gas very precisely.
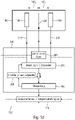
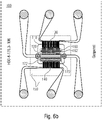
- Fig. 1b shows a schematic representation of an evaluation arrangement 200, which can also be referred to herein as an evaluation device, for a thermal gas sensor 100 with at least one heater 120 and two detectors arranged at different distances 180 1 , 180 2 from the heater 120 (a first detector 130 and a second detector 140).
- the first detector 130 may be spaced from the heater 120 by the distance 180 1 and the second detector 140 may be spaced from the heater 120 by the distance 180 2 .
- Evaluation arrangement 200 can be designed to display information 210 about an amplitude of a detector signal from a first detector 130, information 220 about an amplitude of a detector signal from a second detector 140, information 210 about a first phase difference between a heater signal and the detector signal of the first detector 130 and information 220 about a second phase difference between the heater signal and the detector signal of the second detector 140 to obtain.
- information 210 can include both the amplitude of the detector signal of first detector 130 and the first phase difference between the heater signal and the detector signal of first detector 130, just like information 220 can include both the amplitude of the detector signal of second detector 140 can also include the second phase difference between the heater signal and the detector signal of the second detector 140 .
- the amplitude of the detector signal of the respective detector (the first detector 130 or the second detector 140) to be sent from the thermal gas sensor to the evaluation arrangement separately from the first phase difference or the second phase difference.
- the information 210 and the information 220 not to be transmitted to the evaluation arrangement 200 via separate lines, but for example via a common line or wirelessly.
- the evaluation arrangement 200 can be designed to be an intermediate variable dependent on the information 210, 220 about the amplitudes of the detector signals and to form a combination signal 230 depending on the information 210, 220 about the first phase difference and the second phase difference.
- the combination signal 230 can combine amplitude information and phase information of the detector signal of the first detector 130 and of the detector signal of the second detector 140 .
- the evaluation arrangement 200 can be designed to determine information 240 about a gas concentration or a thermal conductivity of a fluid, for example a gas or gas mixture, based on the combination signal 230 . The evaluation arrangement 200 can carry out this determination, for example, without once again separately considering the individual items of information 210, 220 flowing into the combination signal 230 as the calculations continue.
- the amplitude of the detector signal can, for example, be provided directly as information 210, 220 by the respective detector 130, 140.
- the information 210, 220 about the first phase difference and second phase difference between the heater signal 122 and the detector signal of the respective detector 130, 140 can, for. B. are determined by the thermal gas sensor 100 and transmitted to the evaluation system 200.
- the detector signal of the first detector 130 or the detector signal of the second detector 140 can be transmitted to the evaluation arrangement 200 via the information 210 or the information 220 , and the heater signal 122 can also be transmitted directly to the evaluation arrangement 200 .
- the evaluation arrangement can be designed to determine the respective amplitude from the detector signal of the first detector 130 and from the detector signal of the second detector 140 and to determine the first phase difference and the second phase difference in order to generate the combination signal 230 depending on the information determined in this way form.
- the evaluation arrangement 200 can correct possible errors in the thermal gas sensor 100 very easily and much more quickly in order to obtain the information 240 about the gas concentration and thermal conductivity than if the evaluation arrangement 200 received the information 210 about the Corrected amplitude of the detector signal of the first detector 130 and the first phase difference and the information 220 on the amplitude of the detector signal of the second detector 140 and the second phase difference separately from one another.
- the combination signal 230 can thus make it easier to determine the information 240 about the gas concentration and the thermal conductivity of the gas to be analyzed enable errors generated by the thermal gas sensor 100 to be suppressed or reduced.
- the evaluation arrangement 200 can be designed to obtain information about a heater amplitude, for example information about a heating power from the heater signal 122, and to obtain a linear combination of the information about the heater amplitude, the information 210 and of the information 220 to determine the combination signal 230.
- the evaluation arrangement 200 can not only obtain information about the heater amplitude from the heater signal 122, but also, as already described above, calculate information about the first phase difference and the second phase difference if the information 210, for example, the detector signal of the first detector 130 and the information 220 includes the detector signal of the second detector 140 .
- the heater amplitude which enables the evaluation arrangement 200 as a function of the first distance 180 1 and the second distance 180 2 of the two detectors from the heater 120, which can determine information 240 about the gas concentration and the thermal diffusivity of the gas to be analyzed.
- the detector signal of the first detector 130 has a greater amplitude than the detector signal of the second detector 140, since the distance 180 2 of the second detector 140 from the heater 120 is greater than the distance 180 1 of the first detector 130 from the heater 120.
- the heater amplitude detected by the respective detector 130, 140 can decrease.
- the additional information about the heater amplitude allows the evaluation system 200 to determine the information 240 about the gas concentration and the thermal conductivity even more precisely, since the heater amplitude of the heater signal 122 can be considered as a reference, and the combination signal 230 can therefore be considered a relative May have amplitude signal. For example, a relative amplitude signal is less error-prone than an absolute amplitude signal.
- sigUss can be amplitude information or an amplitude signal that can be dependent on information 210 about the amplitude of the detector signal of first detector 130 and on information 220 about the amplitude of the detector signal of second detector 140 .
- sigUss can be a linear combination of the information 210 about the amplitude of the detector signal of the first detector 130 and the information 220 about the amplitude of the detector signal of the second detector 140 .
- sigPhi may be phase information or an added phase signal, which may be dependent on first phase difference information 210 and second phase difference information 220 .
- sigPhi can be an addition of the information 210 about the first phase difference and the information 220 about the second phase difference.
- Ka and Kp can be constants.
- the combination signal 230 determined in this way can include amplitude information sigUss and phase information sigPhi, whereby four pieces of information (e.g.
- information 210 about the amplitude of the detector signal of the first detector 130, information 220 about the amplitude of the detector signal of the second detector 140, the Information 210 about a first phase difference between the heater signal and the detector signal of the first detector 130 and information 220 about the second phase difference between the heater signal and the detector signal of the second detector 140) are combined in the combination signal 230, whereby the evaluation arrangement 200 can use less power to process the information 210,220.
- the evaluation arrangement 200 can thus be designed to determine information 240 about the gas concentration and thermal conductivity very efficiently, quickly and precisely.
- Hz.Uss can be information about the heater amplitude that can be obtained from the heater signal 122 .
- D1.Uss can be information 210 about the amplitude of the detector signal of the first detector 130 and D2.Uss can be information 220 about the amplitude of the detector signal of the second detector 140 .
- the amplitude information sigUss can thus represent a relative amplitude signal, since the information 210 about the amplitude of the detector signal of the first detector 130, the information 220 about the amplitude of the detector signal of the second detector 140 and the heater amplitude Hz.Uss are offset against each other, so that the detector signal amplitude information 210 of the first detector 130 and the detector signal amplitude information 220 of the second detector 140 can be viewed relative to the heater amplitude.
- the evaluation arrangement 200 can determine the information 240 about the gas concentration and thermal conductivity very precisely.
- the evaluation arrangement 200 can be designed to calculate a polynomial, for example of the first order, of the combination signal 230 in order to obtain the information 240 about the gas concentration or the thermal conductivity.
- the polynomial e.g. polynomial y
- y A0+A1*sigX+A2*sigX 2 , for example.
- the evaluation arrangement 200 can be designed to multiply the polynomial of the combination signal 230 by a correction term in order to obtain the information 240 about the gas concentration and/or the thermal conductivity.
- the correction term of the combination signal 230 can be dependent on information about a pressure and on information about a temperature and can compensate for a pressure and temperature dependency, for example. In other words, the correction term from the combination signal 230 can compensate for a pressure drift and/or a temperature drift. A possible misinterpretation by the evaluation arrangement 200 of the signals detected by the thermal gas sensor 100 is thus reduced.
- sigX can be the combination signal 230
- pol(sigX) can be a polynomial of the combination signal sigX 230
- f(p) can be a function of pressure p
- const1 can be a constant
- f(T) can be a function of temperature T
- const2 can be a second constant.
- f(p) may be a function of a measured pressure p in an environment of thermal gas sensor 100 and f(T) may be a function of a measured temperature T in an environment of thermal gas sensor 100 .
- the second term of the multiplication 1 ⁇ f p signX ⁇ const 1 ⁇ 1 ⁇ f T p ⁇ const 2 can also be used as a correction term of the combination signal 230 to be understood.
- the correction term can be dependent on measurement conditions of the gas sensor 100 (such as an ambient pressure/measurement pressure or an ambient temperature/measurement temperature).
- the correction term can thus correct possible influences of an ambient pressure or an ambient temperature of the thermal gas sensor 100 on the determination of the information 240 about the gas concentration. In this way, possible pressure drift or temperature drift can be suppressed.
- the sigX can be the combination signal 230
- Ay(sigX) can be a polynomial of the combination signal sigX 230 (e.g., first order)
- By(p) can be a function of the pressure p (e.g., a polynomial function, e.g., second order)
- B.ref can be a constant
- Cy(T) can be a function of the temperature T (e.g. a polynomial function, e.g. second order)
- C.ref can be a second constant.
- the function By(p) can be a function of a measured pressure p in an environment of the thermal gas sensor 100 and the function Cy(T) can be a function of a measured temperature T in an environment of the thermal gas sensor 100, for example.
- the second term 1 ⁇ B . y p ⁇ B . ref signX ⁇ B . ref ⁇ 1 ⁇ C . y T ⁇ C . ref p ⁇ C . ref of multiplication to calculate gas concentration information C 240 may define a correction term.
- the correction term can depend on the pressure p and the temperature T, for example.
- By(p) can be a polynomial function depending on the pressure p, whereby, for example, a correction of possible pressure influences on the calculation of the information 240 about the gas concentration can be taken into account.
- Cy(T) a possible influence of the temperature T on the calculation of the information 240 about the gas concentration can be taken into account very precisely.
- the evaluation arrangement 200 can be designed to take into account a pressure and/or a temperature in an environment of the thermal gas sensor 100 when determining the information 240 about the gas concentration and/or the thermal conductivity.
- the thermal gas sensor 100 can have pressure and temperature sensors with which it can detect the pressure and/or the temperature in the environment and transmit it to the evaluation arrangement 200 .
- the evaluation arrangement 200 can, for example, take into account and correct possible miscalculations of the information 240 about the gas concentration and/or the thermal conductivity due to different pressure and/or temperature conditions in the area surrounding the thermal gas sensor 100 .
- the evaluation arrangement 200 can thus react to the pressure and/or the temperature in the area surrounding the thermal gas sensor 100 and accordingly determine the information 240 about the gas concentration and/or the thermal conductivity very precisely.
- evaluation arrangement 200 can be designed to use combination signal 230, information about the temperature in an area surrounding thermal gas sensor 100, when determining information 240 about the gas concentration and/or the thermal conductivity as input variables for a drift correction and using information about a pressure in an environment of the thermal gas sensor 100 to obtain the information about the gas concentration and/or thermal diffusivity as a result of the drift correction.
- the drift correction can be applied to the combination signal depending on the information about the temperature and the pressure in order to obtain the information 240 about the gas concentration and/or the thermal diffusivity.
- the drift correction can, for example, not contain any further variables, but can only use constants previously obtained, for example determined in the course of a calibration.
- the constants can be specific to the thermal gas sensor 100 used.
- the evaluation arrangement 200 can thus be designed to take into account small differences between thermal gas sensors 100 in the calculation of the information 240 about the gas concentration and/or thermal conductivity in order to obtain a very precise result (information 240).
- the drift correction can correct a temperature drift and/or a pressure drift, for example.
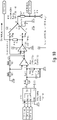
- 1c shows a schematic representation of an exemplary evaluation arrangement 200 for a thermal gas sensor 100 with at least one heater 120 and two detectors (a first detector 130 and a second detector 140).
- the first detector 130 can have a first distance 180 1 from the heater 120 and the second detector 140 can have a second distance 180 2 from the heater 120 .
- the first detector 130 and the second detector 140 have the same distance 180 1 , 180 2 to the heater 120 .
- the first distance 180 1 may differ from the second distance 180 2 .
- the first detector 130 may be spaced a different distance from the heater 120 than the second detector 140 .
- Evaluation arrangement 200 can be designed to calculate a heating power that can be applied to heater 120, depending on at least one sensor signal (e.g.
- a first sensor signal 210 and/or a second sensor signal 220 from at least one of the detectors (e.g. g. the first detector 130 and/or the second detector 140) (for example with a control unit 250 for controlling a heating output) in order to bring the at least one sensor signal 210, 220 into a predetermined value range.
- the detectors e.g. g. the first detector 130 and/or the second detector 140
- a control unit 250 for controlling a heating output
- the at least one sensor signal 210, 220 is brought into the predetermined value range by the evaluation arrangement 200. If the heating power is increased, for example, an amplitude or a frequency of the at least one sensor signal 210, 220 can also be increased, for example. This can be carried out, for example, by evaluation arrangement 200 if the at least one sensor signal 210, 220 is too small and the predetermined value range is very large. The new sensor signal 210, 220 can thus fill out the predetermined value range or lie within it after the heating output has been controlled by the control unit 250.
- the predetermined value range can, for example, depend on the components used in the evaluation arrangement 200, such as e.g. B. an analog-to-digital converter (ADC), be dependent.
- the ADC can, for example, further process the at least one sensor signal 210, 220 very well if the at least one sensor signal 210, 220 is adjusted in the predetermined value range adapted to the ADC (e.g. ADC working range).
- the evaluation arrangement 200 can also be designed to control the heat output of the heater 120 with the control unit 250 such that the heat output of the heater 120 is reduced.
- the at least one sensor signal 210, 220 can also be reduced. This can be advantageous, for example, if the at least one sensor signal 210, 220 exceeds the predetermined value range, ie is too large.
- the fact that the evaluation arrangement 200 is designed to regulate the heating power of the heater 120 with the control unit 250 makes it possible that when the at least one sensor signal 210, 220 is further processed by, for example, components of the evaluation arrangement 200, such as B. the ADC, no or only little information of the at least one sensor signal 210, 220 is lost.
- control unit 250 of the evaluation arrangement 200 can transmit a control signal 252 to the heater 120 in order to control the heating power of the heater 120 .
- control unit 250 can provide information 122 about the controlled heat output of the heater 120 to the evaluation arrangement 200 .
- Evaluation arrangement 200 can be designed to take information 122 about the heating power into account when deriving information 240 about a gas concentration and/or thermal conductivity from the at least one sensor signal 210, 220. It can thus be made possible for the control unit 250 to bring the sensor signal 210, 220 into the predetermined value range and also to take into account the information 122 about the heating power in the analysis, since the at least one sensor signal 210, 220 is dependent on the heating power.
- this evaluation arrangement 200 enables a sensor signal, e.g. B. the first sensor signal 210 or the second sensor signal 220, may be sufficient to derive the information 240 about the gas concentration and / or the thermal conductivity of a gas or fluid (z. B.
- the determination of the information 240 is overdetermined, as a result of which the information 240 can be determined very precisely by the evaluation arrangement 200. If the first distance 180 1 of the first detector 130 differs from the second distance 180 2 of the second detector 140 from the heater 120, then, for example, the information 240 about the gas concentration and/or the thermal conductivity of a gas can also only be obtained from the first sensor signal 210 and be derived from the second sensor signal 220, without the information 122 about the heating output of the heater 120.
- the evaluation arrangement 200 can also receive the information 122 about the heating output from the thermal gas sensor 100 instead of from the control unit 250.
- the evaluation arrangement 200 can be designed to apply a periodic signal (e.g. the control signal 252) to the heater 120 .
- the periodic signal can be a periodic square-wave signal or a sinusoidal signal, for example. If control signal 252, and thus the heat given off by heater 120 to the gas to be analyzed, is a periodic signal, first sensor signal 210 detected by first detector 130 and second sensor signal 220 detected by second detector 140 can also be periodic . Due to the first distance 180 1 and the second distance 180 2 , however, the first sensor signal 210 and/or the second sensor signal 220 can differ in phase from the periodic signal of the heater 120 and in amplitude from the periodic signal of the heater 120. The evaluation arrangement 200 can use these differences, for example, in order to very precisely determine the information 240 about the gas concentration and/or the thermal conductivity.
- the evaluation arrangement 200 can be designed to switch the heating power applied to the heater 120 (for example by the control signal 252) between two values.
- a periodic square-wave signal can be applied to the heater 120 .
- the heater 120 z. B. alternately transmit a first heat output and a second heat output to the gas to be analyzed.
- evaluation arrangement 200 can be designed to regulate an amplitude of the heating power (e.g. with control unit 250) in such a way that both a minimum value of the at least one sensor signal 210, 220 and a maximum value of the at least one sensor signal 210, 220 in the predetermined range of values. If the amplitude of the heating output of heater 120 is increased, for example by control signal 252, then the minimum value of the at least one sensor signal 210, 220 can be reduced and the maximum value of the at least one sensor signal 210, 220 can be increased, for example. If the amplitude of the heating output is reduced by control signal 252, for example, then the minimum value of the at least one sensor signal 210, 220 can be increased and the maximum value of the at least one sensor signal 210, 220 can be reduced.
- the predetermined range of values can be dependent on a range of values of a component, such as e.g. B. an ADC, the evaluation arrangement 200 to be.
- the predetermined value range can be determined as a function of a component value range (for example a component of the evaluation arrangement 200).
- the predetermined value range can specify that the minimum value of the at least one sensor signal 210, 220 should be in a range of 0% to 30%, 1% to 25% or 2% to 20% of the component value range and that the maximum value of the at least a sensor signal 210, 220 should be in a range of 70% to 100%, 75% to 99% or 80% to 98% of the component value range.
- the predetermined value range can thus have, for example, a lower value range in which the minimum value should lie and an upper value range in which the maximum value should lie.
- the evaluation arrangement 200 can be designed to set or regulate an amplitude of the heating power (for example with the control unit 250) such that an amplitude of the at least one sensor signal 210, 220 is in a predetermined amplitude range. If the at least one sensor signal 210, 220 has a periodic sinusoidal signal, for example, then the amplitude of the sensor signal should be within the specified amplitude range at all times. In this case, the amplitude of the at least one sensor signal should utilize the complete predetermined amplitude range.
- the predefined amplitude range can, for example, have/be subdivided into an upper, middle and lower amplitude range.
- the predefined amplitude range is utilized by the amplitude of the at least one sensor signal, a maximum amplitude of the at least one sensor signal should be in the upper range and a minimum amplitude in the lower range.
- the predetermined amplitude range can be dependent on the component area, for example.
- the predefined amplitude range can be determined such that the amplitude of the at least one sensor signal utilizes at least 50% or at least 65% or at least 75% of a component value range of an analog-to-digital converter, for example.
- the evaluation arrangement 200 can be designed to set or regulate sampling times at which a sensor signal 210, 220 can be sampled.
- the sensor signal 210, 220 can optionally be pre-processed, for example, by the evaluation arrangement 200 or the thermal gas sensor 100 and/or be subjected to a DC offset. It can be advantageous if the sensor signal 210, 220 is sampled at a point in time of maximum amplitude and at a point in time of minimum amplitude. These two sampling times can, for example, be set or readjusted by the evaluation system 200 if the evaluation system 200 determines that the sampling times have been selected incorrectly.
- Precise setting of the sampling times can make it possible, for example, for the evaluation arrangement to very easily detect a phase difference or amplitude difference between the first sensor signal 210 and a heater signal (e.g. emitted by the heater 120 and controlled by the control signal 252) or between the second Sensor signal 220 and the heater signal can be determined.
- the evaluation arrangement 200 can very precisely determine or derive the information 240 about the gas concentration and/or thermal conductivity of the gas to be analyzed.
- the evaluation arrangement 200 can be designed to set the sampling times in such a way that sampling, for example with a phase difference of maximum +/- 2°, takes place at a point in time at which the sensor signal 210, 220 reaches a maximum value, and so that the sampling takes place, for example, with a phase difference of maximum +/-2° at a point in time at which the sensor signal 210, 220 reaches a minimum value.
- the maximum value can define a maximum amplitude of the sensor signal 210, 220 and the minimum value can define a minimum amplitude of the sensor signal 210, 220, as already explained above.
- the evaluation device 200 can be designed to combine a sensor signal 210, 220 from at least one of the detectors 130, 140 with an offset signal generated by a digital-to-analog converter to form an input signal for the analog-to-digital converter to obtain.
- the evaluation device 200 can be designed to adjust the offset signal in order to ensure that the input signal of the analog/digital converter remains within a predetermined range over an entire period of the sensor signal 210, 220.
- the offset signal can thus be designed, for example, to adapt the sensor signal 210, 220 in such a way that the input signal that lies in a component value range of the analog/digital converter is produced.
- the offset signal can be adjusted/adapted in order to be able to react to different sensor signals 210, 220 from different gases to be analyzed.
- the offset signal can be designed to to reduce sensor signal 210, 220 that is too large, so that the resulting input signal is within the specified range.
- the offset signal can be designed to increase the sensor signal 210, 220 when the sensor signal 210, 220 is too small, so that an input signal is produced which lies in the predetermined range.
- evaluation arrangement 200 can be designed to bring the amplitude of sensor signal 210, 220 into the predetermined value range by controlling the heating power and to generate an offset of sensor signal 210, 220 by combining sensor signal 210, 220 with the offset signal to change that the sensor signal 210, 220 is in the predetermined value range.
- This makes it possible for the sensor signal 210, 220 to be analyzed very precisely and thus very precise information 240 about the gas concentration and/or thermal conductivity of the gas to be analyzed can be determined by the evaluation arrangement 200.
- the evaluation device 200 can be designed to regulate the heating power only when the sampling times are set or adjusted in a steady state and when the offset signal is adjusted in a steady state.
- a steady state can be understood to mean that the sampling times were determined by the evaluation device 200 in such a way that the sensor signal 210, 220 at predefined events (such as a maximum amplitude (maximum value), a zero crossing or a minimum amplitude (minimum value) ) can be sampled.
- the steady state can also mean that the offset signal has been adjusted in such a way that when the offset signal is combined with the sensor signal 210, 220, the sensor signal 210, 220 generates an input signal that is in the specified range, in order to thus generate the sensor signal 210, 220 can be analyzed very precisely, with little or no loss of information, by means of the evaluation arrangement.
- the evaluation device 200 can determine default settings (such as the sampling times in the steady state or the offset signal in the steady state), so that when the heating power is controlled by the control unit 250, the new sensor signal 210, 220 can be analyzed very precisely with the default settings and, under certain circumstances, no new control of the sampling times or the offset signal is necessary in order to derive the information 240 about the gas concentration and/or the thermal conductivity from the sensor signal 210, 220.
- default settings such as the sampling times in the steady state or the offset signal in the steady state
- the evaluation arrangement 200 can be designed to stop the control of the heating power (for example by the control unit 250) while the sampling times are being set or adjusted and/or while the offset signal is being adjusted. It can thus be ensured, for example, that no changes are made to the sensor signal 210, 220 while the sampling times and the offset signal are not yet in a steady state. It can thus be ensured that the sensor signal 210, 220 can be analyzed very precisely, since the sampling times and the offset signal can be determined very precisely with only very little or no susceptibility to error.
- control unit 250 can, for example, transmit a new heater signal for heater 120 to thermal gas sensor 100 as control signal 252.
- B. has a changed average heat output, maximum heat output or amplitude of the heat output.
- the control signal 152 includes information that states how the average heating power, the maximum heating power or the amplitude of the heating power from the thermal gas sensor for the heater 120 should be changed.
- Fig. 1d shows a schematic representation of an exemplary evaluation arrangement 200 for a thermal gas sensor 100 with at least one heater 120 and two detectors (e.g a first detector 130 and a second detector 140).
- the first detector 130 can have the first distance 180 1 from the heater 120 and the second detector 140 can have the second distance 180 2 from the heater 120 .
- the evaluation arrangement 200 can be designed to apply a periodic signal 260 with a predetermined period to the heater 120 .
- the periodic signal can be, for example, a square-wave signal, a pulsed signal with a known power, or a sinusoidal signal. Optionally, it can also be a sine signal with harmonics or a triangular signal.
- the periodic signal can also be referred to as a heater signal and can be transmitted from the heater 120 in the form of heat to the first detector 130 and/or to the second detector 140 via a gas to be analyzed.
- the transferred heat can be detected by the first detector 130 as the first sensor signal 210 are detected and are detected by the second detector 140 as a second sensor signal 220 .
- the first sensor signal 210 and the second sensor signal 220 can have a first periodic signal or a second periodic signal, each with the specified period. This makes it possible for the gas to be analyzed to be analyzed very precisely with regard to its gas concentration and/or thermal conductivity by the thermal gas sensor 100 or the evaluation arrangement 200 .
- Evaluation arrangement 200 can be designed to sample at least one sensor signal (e.g.
- a second sampling time can, for example, be offset in time by 90° relative to the period duration (for example by +/-2°) compared to a first sampling time.
- the second sampling time can be offset in time by 1/4 period, 5/4 period or by 9/4 period compared to the first sampling time.
- a third sampling time can be offset in time by 180° relative to the first sampling time or by 90° relative to the second sampling time, based on the period duration.
- the first sampling time, the second sampling time and the third sampling time can have a tolerance of +/- 2%.
- the third sampling time can therefore be offset in time by 1/2 period, 3/2 period or 5/2 period compared to the first sampling time.
- the sensor signal 210, 220 can be sampled at precisely defined points, as a result of which information 240 about a gas concentration and/or a thermal conductivity can be determined from the sensor signal 210, 220 very precisely.
- the evaluation arrangement 200 can be designed to recognize, based on three sampled values, which are based on a sampling of the sensor signal at the first sampling time, at the second sampling time and at the third sampling time (carried out by means of the sampling device 270, for example), whether a first sampled value and a third sample representing a maximum value and a minimum value of the sensor signal 210,220.
- Checking device 280 can ignore a DC offset, for example, and thus check, apart from a DC offset, whether the first sampled value represents a maximum value and the third sampled value represents a minimum value of sensor signal 210, 220, for example.
- the second sampling time can thus be a “zero crossing” of sensor signal 210, 220, for example, and can also be taken into account by checking device 280.
- the first sampling time, the second sampling time and/or the third sampling time as well as the first sensor signal 210 and the second sensor signal 220 can be used to provide the information 240 about the gas concentration and/or the thermal conductivity of a gas detected by the thermal gas sensor 100 determine.
- the heater signal 122 can also flow into the determination of the information 240 .
- a phase difference between the first sensor signal 210 and the second sensor signal 220 and an amplitude difference between the first sensor signal 210 and the second sensor signal 220 can be determined, for example, based on the sampling times/sampling values.
- a phase difference and/or an amplitude difference between first sensor signal 210 and heater signal 122 or between second sensor signal 220 and heater signal 122 can also be determined.
- the information 240 about the gas concentration and/or thermal conductivity can be determined from the phase differences and amplitude differences determined in this way.
- the evaluation arrangement 200 can be designed to change the sampling times depending on whether the first sample and the third sample represent a maximum value and/or a minimum value of the sensor signal 210, 220. This can be done by means of a sampling control device 290, for example. Thus, for example, new sampling times can be determined if the first sampling value and the third sampling value do not correspond to a maximum value and/or a minimum value of sensor signal 210, 220. By controlling the sampling times, it can be ensured that the sampled values correspond to predetermined values. If the verification device 280 z. If, for example, it is established that deviations occur outside of a tolerance (for example +/- 2°), the sampling times can be changed/adjusted by the sampling control device 290 .
- a tolerance for example +/- 2°
- evaluation system 200 can be designed to set or regulate the sampling times in such a way that the first sample represents a first extreme value of sensor signal 210, 220, for example a maximum value or minimum value, and the third sample represents a second extreme value, for example the minimum value or represents the maximum value of the sensor signal 210, 220.
- the second sample can, for example, represent an average value or a direct component of the sensor signal 210, 220, such as e.g. B. a "zero crossing".
- evaluation arrangement 200 can be designed to take into account information about a point in time at which sensor signal 210, 220 passes through a predefined threshold value when setting or adjusting the sampling times.
- This point in time can be the second point in time, for example, which can represent a direct component or an average value of sensor signal 210, 220, for example.
- the checking device 280 can use the second sampling time for checking the first sampling time and/or the second sampling time.
- the sampling control device 290 reset or adjust the sampling times.
- the predefined threshold value can, for example, define a "zero crossing" (for example up to a DC offset).
- the evaluation arrangement 200 can be designed to check whether a second sample value at the second sampling time is equal to an average value from the sample value at the first sampling time and the third sample value at the third sampling time and, depending on the check, to recognize whether the first sample and the third sample represent a maximum value and a minimum value of the sensor signal.
- the second sample should be, for example, within a tolerance of at most ⁇ 1% of a difference between the first sample and the third sample or equal to an average of the sample and the second sample. If this is not the case, the checking device 280 can recognize that the sampling times have been selected incorrectly.
- the second sample can lie exactly halfway between the first sample time and the second sample time.
- the second sample can correspond to the average of the other two samples.
- the evaluation arrangement 200 can be designed to apply a periodic square-wave signal 260 with a pulse duty factor of preferably 50% to the heater 120 .
- the periodic square-wave signal it is also possible for the periodic square-wave signal to have a pulse duty factor in the range from 5% to 50%, 8% to 48% or 10% to 45%. That
- the periodic square wave signal 260 applied to the heater 120 may have a tolerance of +/- 2%.
- the duty cycle gives z. B. for a periodic sequence of pulses, a ratio of a pulse duration to a period.
- the evaluation arrangement 200 can be designed to combine a sensor signal 210, 220 with an offset signal generated by a digital-to-analog converter in order to obtain an input signal for an analog-to-digital converter.
- the analog/digital converter can, for example, digitize the signal values present at the sampling times (eg the first sample, the second sample and/or the third sample) and thus sample the sensor signal 210, 220.
- the scanning device 270 can have the analog-to-digital converter, for example.
- the evaluation arrangement 200 can be designed to regulate the offset signal in order to ensure that the input signal of the analog-to-digital converter remains within a predetermined range during an entire period of the sensor signal 210, 220.
- the offset signal can change an offset of the sensor signal 210, 220 in such a way that an input signal is produced which lies within a working range (e.g. the specified range) of the analog/digital converter, so that no information of the sensor signal 210, 220 are lost during digitization or so that a loss of information is reduced.
- the scanning device 270 can check whether an input value of the analog/digital converter exceeds a specified upper threshold value, for example the specified range, or falls below a specified lower threshold value, for example the specified range.
- the sampling device 270 can generate the offset signal, which can be combined with the sensor signal 210, 220 so that the input value, for example a value of the input signal, remains in the predetermined range.
- the evaluation arrangement 200 can be designed to adjust the sampling times after the offset signal has been adjusted and to carry out a new check after a change in the sampling times to determine whether the sampled values obtained with the changed setting of the sampling times are still within the specified range.
- the offset signal can first be generated by means of the evaluation arrangement 200 for the sensor signal 210, 220 and then sampling times can be determined by means of the sampling device 270, checked and, if necessary, readjusted (this can represent a tracking of the sampling times, for example).
- This tracking can result in new sampling values, which can entail a renewed adjustment of the offset signal by the evaluation arrangement 200.
- the offset signal and the sampling times can always be adjusted or tracked alternately until, for example, the analog/digital converter can process the sensor signal 210, 220 further.
- the offset signal and the sampling times can be in a steady state.
- the settings of the sampling times changed by the sampling control device 290 generate new sample values, for example, which can be regarded as input values of the analog/digital converter.
- Both the offset signal and the heating power of the heater 120 can be readjusted so that the input signal of the analog/digital converter remains within the specified range.
- the offset signal can adjust an offset of the sensor signal 210, 220, for example, and the change in the heating power can adjust an amplitude of the sensor signal 210, 220, so that an input signal is produced that lies in the predetermined range.
- evaluation arrangement 200 can be designed to regulate a heating power applied to heater 120 as a function of at least one sensor signal 210, 220 from at least one of detectors 130, 140, in order to convert the at least one sensor signal 210, 220 in bring a predetermined range of values.
- the evaluation arrangement 200 can be designed to take into account information about the heating power (e.g. the heater signal 122) when deriving information 240 about a gas concentration and/or thermal conductivity from the sensor signals 210, 220.
- the sensor signal 210, 220 can experience an increase in the amplitude of the sensor signal 210, 220, or when the heating output decreases, the at least one sensor signal 210, 220 can experience a reduction in the amplitude of the sensor signal 210, 220 Experienced.
- the sensor signal 210, 220 can be brought into the predetermined value range by controlling the heat output of the heater 120.
- thermal gas sensor and the evaluation arrangement are described below with reference to further figures.
- FIG 2a and Figure 2b each show a schematic representation of a gas sensor 100 for measuring physical gas properties.
- the thermal gas sensor 100 can have a thin-film membrane 110 and a heating element 120, which can be arranged, for example, as a cantilevered bridge structure on the membrane 110 between a first interruption area 160 of the membrane 110 and a second interruption area 170 of the membrane 110.
- a thickness of the thin-film membrane 110 (it consists, for example, of several base, sensor and passivation layers) in the case of a wire sensor (an example of the temperature sensor structures 130, 140; see 2 and 3 ) e.g. B. between 1-10 microns.
- the heating element 120 can also be referred to as a heater.
- the complete first discontinuity area 160 may include a discontinuity 162 of the membrane 110 and the complete second discontinuity area 170 may include a discontinuity 172 of the membrane.
- the heating element 120 may be cantilevered between the first interruption 162 and the second interruption 172 .
- the first interruption 162 may be bounded by the heating element 120 and a first temperature sensor structure 130 in the form of a cantilever bridge structure.
- the second interruption 172 can be delimited by the heating element 120 and by a second temperature sensor structure 140, for example in the form of a cantilevered bridge structure.
- the first temperature sensor structure 130 and/or the second temperature sensor structure may be a wire sensor, thermopiles, temperature variable resistors, or thermistors.
- the gas sensor 100 may include a first outer break 192 and a second outer break 194 .
- the first thermocouple structure 130 may be a cantilevered bridge structure between the first interrupt 160 and the second outer interrupt 194 and the second thermocouple structure 140 may be a cantilevered bridge structure between the second interrupt 172 and the first outer interrupt 192.
- the first thermocouple structure 130 may also be referred to as a first detector or first sensor and the second thermocouple structure 140 may also be referred to as a second sensor or second detector.
- the gas sensor 100 includes, for example, a frame 150 made of carrier material.
- the frame 150 made of carrier material can span the membrane 110, for example.
- the membrane 110 may have a thickness 111 (e.g., an extent perpendicular to a surface of the membrane 110 on which the first thermocouple structure 130, the second thermocouple structure 140 and the heating element 120 are arranged) in a range of 1 ⁇ m to 50 ⁇ m, 2 ⁇ m to 25 ⁇ m or 3 ⁇ m to 10 ⁇ m ⁇ m, e.g. B. 8 microns.
- the membrane 110 can be implemented by a recess 190 in the frame 150 .
- the recess 190 can be chosen such that a membrane 110 with the desired thickness 111 can be realized.
- the recess 190 can be designed in such a way that only the heating element 120, the first thermocouple structure 130 and the second thermocouple structure 140 remain stretched between the frame 150.
- a surface of the membrane 110 on which the first thermocouple structure 130, the second thermocouple structure 140 and the heating element 120 are arranged has an expansion in a range from 200x200 ⁇ m 2 to 5x5 mm 2 , 500x500 ⁇ m 2 to 2000 ⁇ 2000 ⁇ m 2 or 800 ⁇ 800 ⁇ m 2 to 1200 ⁇ 1200 ⁇ m 2 , it being possible for the expansion to be a square or rectangular expansion.
- the gas sensor 100 can have a thickness 101 (e.g.
- An expansion of the gas sensor 100, parallel to the surface of the membrane 110 on which the heating element 120 is arranged, can be in a range from 1x1 mm 2 to 1x1 cm 2 , 1.5x1.5 mm 2 to 9x9 mm 2 or from 2x2 mm 2 to 8x8 mm 2 , such as B 6.5x2.5 mm 2 .
- the first thermocouple structure 130, the second thermocouple structure 140 and/or the heating element 120 can be part of the membrane 110.
- a microchip (example of the thermal gas sensor 100) with three filigree bridge structures (e.g. the heating element 120, the first thermocouple structure 130 and the second Thermocouple structure 140) are used, which can be surrounded as microwires from the gas to be analyzed.
- the gas to be analyzed may be located in the first break 162, the second break 172, the first outer break 192, and/or in the second outer break 194.
- a central bridge structure can be designed as a heater 120 and two on both sides in different ones Detector structures remote from heater 120 (e.g., first thermocouple structure 130 and second thermocouple structure 140) may be used as temperature sensors to measure a transmission response from the gas mixture.
- the central wire (the heating element 120) is supplied with a heating signal, for example a periodic one, whereby heat is radiated from the heating element, for example.
- a heat transfer can occur via unknown heat transfers from the heater 120 into the gas to be analyzed and from the gas into the sensor wire (e.g. into the first thermocouple structure 130 and/or the second thermocouple structure 140).
- the heat transfer thus detected by the first thermocouple structure 130 and/or the second thermocouple structure 140 can be understood as a transfer response or as a sensor signal (e.g. a first sensor signal detected by the first thermocouple structure 130 and a second sensor signal detected by the second thermocouple -Structure 140).
- a temperature response e.g.
- the transmission response with, for example, two identical sensors (e.g. the first thermocouple structure 130 and/or the second thermocouple structure 140) at different distances from the heater 120, the unknown heat transfers in of the measurement setup.
- the phase and amplitude of the two sensor signals can essentially depend on the heat transfer through the gas.
- a first variant of the thermal gas sensor 100 can be constructed on the basis of a silicon-on-insulator (SOI) wafer substrate. It consists, for example, of a microchip with self-supporting, filigree bridge structures made of silicon microwires (eg the first temperature sensor structure 130 and the second temperature sensor structure 140), which are spanned in the gas space to be analyzed.
- a middle wire can be designed as a heater 120 and two detector wires (e.g. the first temperature sensor structure 130 and the second temperature sensor structure 140) can serve as temperature sensors on either side of the heater at different distances from it (see Fig Figure 2a , Figure 2b ).
- Figure 2a shows, for example, a photo of the MEMS wire sensor chip (the gas sensor 100) on a light microscope (left)
- Figure 2b shows, for example, a close-up of structures in a scanning electron microscope (right).
- 3 12 shows a schematic representation of a silicon bridge 120/130/140, which can be used, for example, for a heating element, a first thermocouple structure and/or a second thermocouple structure of a gas sensor.
- a silicon bridge 120/130/140 shows 3 a detail of a micro-bridge (SEM, Scanning Electron Microscope) of a thermal MEMS wire sensor (e.g. a gas sensor).
- the silicon bridge 120/130/140 shown can be produced by SOI technology, for example.
- a substrate or support material of a frame 150 may include oxide 152 material, silicon 154 material, and aluminum 156 material.
- silicon material 154 can be at least partially removed, for example, in order to implement incisions 158 (for example trenches) in the carrier material of frame 150 and thereby implement silicon bridge 120/130/140.
- the silicon bridge 120/130/140 can be arranged on the membrane 110 (e.g. consisting of oxide material 152).
- the membrane 110 can have, for example, a first interruption area 160/162 and a second interruption area 170/172. Both the first interruption area 160/162 and the second interruption area 170/172 have an interruption, for example, which can be a cavity, for example.
- the membrane 110 can have a first interruption 162 and a second interruption 172 in which the gas to be analyzed can be arranged and receive heat transfer from the silicon bridge 120/130/140, for example, if the silicon bridge constitutes a heating element 120 or to the silicon bridge 120/130/140 when the silicon bridge 120/130/140 represents the first thermocouple structure 130 and/or the second thermocouple structure 140.
- the silicon bridge 120/130/140 can be contacted through the aluminum material 156, whereby the aluminum material 156 can serve as a bond pad, for example.
- an exciting heater signal can be applied to the heating element 120 through the bond pad or the first thermocouple structure 130 and/or the second thermocouple structure 140 can be read (for example a first or second sensor signal).
- the gas sensor 100 for example, as a MEMS thermopile sensor on a thin-film membrane in combination with the evaluation algorithm according to Section 1.3 (can be used optionally in combination with the signal generation and evaluation according to Section 1.2)
- FIG. 4 shows a schematic representation of a gas sensor 100 on the left side and a detailed view of the gas sensor 100 on the right side.
- the gas sensor 100 may include a membrane 110 and a heating element 120 that may be disposed on the membrane 110 between a first discontinuous area 160 of the membrane 110 and a second discontinuous area 170 of the membrane 110 .
- the first break area 160 may include a break 162 and the second break area 170 may include a break 172 .
- the first interruption 162 and/or the second interruption 172 may have a longitudinal dimension parallel to a direction of maximum extension of the heating element 120 (which may be referred to as a heater, for example) and a transverse dimension, for example in a direction perpendicular to a direction of maximum extension of the heating element 120 , exhibit. According to 4 the first interruption 162 can thus have a greater transverse extent than the second interruption 172. Furthermore, the first interruption 162 and the second interruption 172 according to FIG 4 have the same longitudinal extent. The first interruption 162 and the second interruption 172 have, for example, the longitudinal extent that is so large that the first interruption 162 and the second interruption 172 the area between the first thermocouple structure 130 and the second thermocouple structure 140 and the Cover heating element 120 completely.
- both the first interruption 162 and the second interruption 172 is along the entire length of the heating element 120. This can prevent a large part of the heat radiated from the heating element 120 from being transported across the membrane 110. It can thus be achieved that a large part of the heat is transferred to the respective thermocouple structure 130, 140 via the gas arranged in the first interruption 162 and in the second interruption 172.
- the first thermocouple structure 130 can have a different distance from the heating element 120 than the second thermocouple structure 140, for example 4 For example, the first thermocouple structure 130 has a greater distance to the heating element 120 than the second thermocouple structure 140.
- the first Thermocouple structure 130 can, for example, detect a first heat transfer 210, from the heating element 120 to the gas in the first interruption 162 and from the gas to the first thermocouple structure 130, and record it as the first sensor signal.
- the second thermocouple structure 140 can, for example, detect a second heat transfer 220 from the heating element 120 to the gas in the second interruption 172 and from the gas to the second thermocouple structure 140 and provide it as a second sensor signal.
- thermocouple structure 130 and the second thermocouple structure 140 Due to the different distance of the first thermocouple structure 130 and the second thermocouple structure 140 from the heating element 120, a difference signal can be formed from the first sensor signal and the second sensor signal, whereby unknown transitions (e.g. a transition from the heating element to the Gas or from the gas to the respective thermocouple structure) can be calculated and thus z.
- unknown transitions e.g. a transition from the heating element to the Gas or from the gas to the respective thermocouple structure
- the gas sensor 100 can also have a frame 150 that can span the membrane 110 .
- the first thermocouple structure 130 and the second thermocouple structure 140 may be at least partially disposed on the membrane 110 and at least partially disposed on the frame 150 .
- the first thermocouple structure 130 and the second thermocouple structure 140 can have hot ends 132, 142 which are arranged to face the heating element 120.
- the first thermocouple structure 130 and the second thermocouple structure 140 may have cold ends 134, 144 located on a side of the first thermocouple structure 130 and the second thermocouple structure 140, respectively, opposite the side having the hot ends 132, 142 can be arranged and are thus arranged away from the heating element 120 .
- hot ends 132, 142 may be located on diaphragm 110 and cold ends 134, 144 may be located on frame 150.
- the frame 150 can have a different material than the membrane 110.
- the cold ends 134, 144 can be subjected to a reference temperature through the frame material of the frame 150, in relation to a temperature measured by means of the hot ends 130, 142 transmitted from the heating element 120.
- the left representation of the gas sensor 100 can be a layout and the right side of the 4 a photo of the gas sensor 100 (z. B. a MEMS membrane sensor) for measuring, for example, a gas type-dependent heat transport (embodiment according to aspect 1).
- a variant of the gas sensor 100 with a constant break e.g., a first break 162 and a second break 172
- the constant interruption 162, 172 causes z. B. that a major portion of a heat transport between a heater 120 and the detectors (z. B. the first thermocouple structure 130 and the second thermocouple structure 140) z. B. necessarily takes place via the measurement gas volume enclosed between the two elements, for example via the measurement gas arranged in the first interruption 162 and in the second interruption 172.
- thermopile structures 130, 140 detectors
- the membrane sensor e.g., the gas sensor 100
- the membrane sensor requires only 1/3 of the heating energy with identical sensitivity to the gas concentration of a binary mixture.
- the heater structure e.g the heating element 120
- the heater structure is, for example, centered as a cantilever filigree bridge structure stretched in a measuring space of the gas to be detected.
- the two detector wires arranged on both sides of the heater 120 (for example) at different distances can be replaced by "thermopile" (thermo chain) structures (e.g.
- thermocouple structure 130 and/or the second thermocouple structure 140 which can lie on the laterally spanned membrane surfaces (of the membrane 110) and which can extend, for example, to the edge of the pit (eg an edge of the first interruption 162 or the second interruption 172).
- the cold ends 134, 144 of the thermal chains (thermopiles) 130, 140 should be the carrier material (e.g. of the frame 150), which can have a high thermal conductivity (e.g. silicon approx. 150 W/(m*K)) and as Heat sink can serve (heat sink close to room temperature), contact immediately.
- the carrier material e.g. of the frame 150
- the base membrane material material of the membrane 110
- the excess temperature e.g. measured using the hot ends 132, 142
- a measuring point for temperature compensation is mechanically connected, for example, directly on or with the silicon chip (eg the frame 150).
- membrane 110 can be consistently interrupted so that heat transport 210, 220 from heater 120 can be done to the detectors 130, 140 mainly over a shortest lateral distance and thus z.
- B. traverses a distance across an intermediate volume of the measurement gas (e.g., located in the first disruption 162 and the second disruption 172).
- the gas-type-dependent transmission response eg the first sensor signal and the second sensor signal
- FIG. 5 on the left side a schematic representation of the gas sensor 100 and on the right side an enlarged detailed view of the gas sensor 100.
- the gas sensor 100 from FIG figure 5 may have the same features and functionality as gas sensor 100 4 have, wherein the gas sensor 100 from figure 5 from the gas sensor 100 on 4 in an embodiment of the first interruption area 160 or the second interruption area 170.
- the first disconnection area 160 of the gas sensor 100 can be off figure 5 have a plurality of breaks 162 i and the second break region 170 can also have a plurality of breaks 172 i .
- the index i of the interruptions 162 i of the first interruption area 160 of the gas sensor 100 can go from 1 to 23, since the first interruption area 160 according to the exemplary embodiment in figure 5 23 may have interruptions.
- the index i of the interruptions 172 i of the second interruption area 170 of the gas sensor 100 can go from 1 to 14, for example, since the second interruption area 170 according to an exemplary embodiment of FIG figure 5 14 may have interruptions.
- the index i of both the breaks 162 i and the breaks 172 i can define a natural number, where the index i z. B. indicates how many interruptions 162 i , 172 i in an interruption area 160, 170 are present.
- the interruptions 162 i , 172 i can be arranged in rows parallel to a direction of maximum extension of the heating element 120 in the first interruption area 160 or in the second interruption area 170 and the rows can also be arranged offset in relation to one another.
- This has the effect, for example, that a parasitic heat conduction 114a, 114b in the membrane 110 runs through as long a path as possible.
- the interruptions 162 i , 172 i are arranged, for example, in such a way that a lattice structure is formed in the membrane 110, in which a path of a parasitic heat conduction 114a, 114b through the membrane 110 is longer than a direct path 210, 220.
- a direct path 210, 220 may be, for example, a straight path perpendicular to the heating element 120, from the heating element 120 to the respective thermocouple structure 130, 140, with the direct path 210, 220 passing through a gas to be analyzed located in the discontinuities 162 i , 172 i can.
- the path of parasitic heat conduction 114a, 114b through membrane 110 should not be a straight line, but rather a tortuous path as illustrated in FIG figure 5 , form.
- the interruptions 162 i , 172 i can be, for example, elongated interruptions that are perpendicular to a main direction of heat conduction, for example with a tolerance of +/- 20° (for example, the direct path 210, 220 from the heating element 120 to the thermocouple Structures 130, 140) may lie.
- the interruptions 162 i , 172 i can be rectangular cutouts with rounded corners. These can also be referred to as oblong holes, for example, and they can also be oval holes, for example.
- the interruptions 162 i , 172 i can be at least three times longer than they are wide.
- the length can be defined, for example, as a direction parallel to a maximum extension of the heating element 120 and the width, as a direction perpendicular to the maximum extension of the heating element 120.
- the interruptions 162 i , 172 i in the first interruption area 160 or the second interruption area 170 can be arranged in such a way that a distance 116a, 116b between the interruptions 162 i , 172 i has a smallest structure width that can be realized, which has a mechanically durable Lattice structure results corresponds to.
- the distance 116a, 116b is, for example, a width of webs made of membrane material of the membrane 110. The smaller the distance 116a, 116b is realized, the lower a parasitic heat conduction 114a, 114b can be, whereby the quality of an analysis of a gas by the gas sensor 100 is increased can be.
- the distance 116a, 116b should be selected in such a way that the lattice structure in the membrane 110 created by the interruptions 162i , 172i is mechanically stable in order to ensure a high quality of the gas analysis by the gas sensor 100.
- figure 5 show a layout of a MEMS membrane sensor (e.g. the gas sensor 100), for example for measuring the gas-type-dependent heat transport (e.g. via the direct path 210, 220) (embodiment according to aspect 1).
- the gas sensor 100 can be off figure 5 represent a variant with a lattice structure made of the membrane material of the membrane 110 to increase the mechanical stability of the gas sensor 100 .
- the geometric shape of the grid can be selected in such a way that the parasitic heat conduction 114a, 114b in the membrane material has to cover as long a path as possible.
- figure 5 shows another embodiment of the gas sensor 100, which shows a lattice structure between the heater 120 and detector elements (e.g. the first thermocouple structure 130 and the second thermocouple structure 140), which increases the mechanical stability of the gas sensor 100 in long-term operation should improve.
- detector elements e.g. the first thermocouple structure 130 and the second thermocouple structure 140
- Such an arrangement can reduce the gas-type-dependent sensitivity of the thermal gas sensor 100, since the thermal conduction can now also take place parasitically 114a, 114b via the lattice webs of the membrane material.
- some of the thermal energy periodically introduced into the heater 120 may arrive earlier in time to the detector structures (e.g., the first thermocouple structure 130 and the second thermocouple structure 140) than the portion of the thermal energy that is transported through the measurement gas over the laterally shortest distance 210, 220.
- thermocouple structure 130 Due to the thermal mass of the detectors (e.g. the first thermocouple structure 130 or the second thermocouple structure 140), which can respond to periodic excitation as a low-pass filter, e.g. B.
- Both heat wave propagation times e.g. the parasitic heat line 114a with the heat transfer via the direct path 210 or the parasitic heat line 114b with the heat transfer via the direct path 220
- a single sinusoidal detector signal e.g. to a first sensor signal or to a second sensor signal.
- the geometric shape of the grid is selected, for example, so that the parasitic heat conduction 114a, 114b in the membrane material has to cover as long a path as possible.
- the holes which are oval for example (for example the interruptions 162 i , 172 i ), are for example transverse to the main direction of heat conduction.
- the aspect ratio of the oval holes is, for example, at least three times longer than it is wide, the web width (e.g. the distance 116a, 116b) corresponds, for example, to the smallest structure width that can be realized, which results in a mechanically durable lattice structure with the existing layer technology.
- Figure 6a , Figure 6b and Figure 6c show schematic representations of further exemplary embodiments of a gas sensor 100.
- the gas sensor 100 can Figure 6a , Figure 6b and Figure 6c the same features and functionalities as the gas sensor 100 4 and or figure 5 exhibit. Differences between the gas sensors 100 may occur in the first disconnection area 160 and the second disconnection area 170 of the gas sensor 100 .
- the gas sensor 100 can turn off Figure 6a have, for example, eight interruptions 162 i in the first interruption area 160 and eight interruptions 172 i in the second interruption area 170 .
- the interruptions 162 i can have a greater transverse extent than the interruptions 172 i .
- the interruptions 162 i , 172 i can have different longitudinal extents within their respective interruption area 160 or 170 .
- the gas sensor 100 off Figure 6b has, for example, a first interruption area 160 with eight interruptions 162 i and a second interruption area 170 with a continuous interruption 172.
- a first interruption area 160 with eight interruptions 162 i and a second interruption area 170 with a continuous interruption 172.
- the variants Figure 6a respectively. figure 5 and from 4 combined with each other.
- the gas sensor 100 off Figure 6c has, for example, a first interruption area 160 and a second interruption area 170 with a plurality of interruptions 162 i , 172 i , wherein the first interruption area 160 can have, for example, 23 interruptions 162 i and the second interruption area 170 can have, for example, 14 interruptions 172 i .
- the interruptions 162 i , 172 i of an interruption region 160 or 170 can have the same transverse extent and/or the same longitudinal extent.
- Figure 6a , Figure 6b and 6c represent further layout variants of the MEMS membrane sensor (e.g. the gas sensor 100), which differ in the number and size of the perforations of the membrane (e.g. the interruptions 162 i , 172 i ) (embodiments according to aspect 1).
- the thermal sensor 100 (the gas sensor can also be referred to herein as a thermal sensor):
- the spatial separation between the heater 120 and sensor structures 130, 140 (the first temperature sensor structure and the second temperature sensor structure can also be referred to herein as sensor structures, detector structures, sensors, temperature sensors or detectors) with thermal coupling through the gas mixture to be analyzed; and the measurement with sensor structures 130, 140.
- the sensor structures 130, 140 can be arranged at different distances from the heater 120 or at the same distance.
- the sensor signals 210, 220 have a sinusoidal curve (see e.g. 9 ), which is strongly dependent on the thermal properties of the gas surrounding the sensor structures.
- transmitted and received periodic temperature waves are compared (see 9 ).
- the CO 2 content in air can be 0.2 vol%, z. B. by means of the gas sensor. Since gases are compressible and their density changes as a result of pressure and temperature, the corresponding drifts should be compensated for.
- the received sensor signals 210, 220 differ in amplitude, offset and phase position.
- the signals 210, 220 are difference signals from a signal of a first thermocouple structure and a second thermocouple structure of the gas sensor.
- Thermal conductivity, temperature conductivity and, if the density of the gas is known, the specific heat capacity can be determined by evaluating other measured variables supplied by the sensor - a possible way of also analyzing unknown gas mixtures.
- the parasitic thermal decoupling between heater and detector elements is largely achieved and the signal quality is significantly increased. Due to the heater's low thermal mass, it is possible to modulate the heater at frequencies up to 300 Hertz, as the heat can be supplied and removed quickly.
- a model according to [ Baehr 2008 ] can be used to determine the thermal conductivity with sinusoidal heating power 122 to describe the propagating temperature field.
- T x t T m + T A ⁇ n ⁇ e ⁇ k 1 ⁇ x ⁇ sin 2 ⁇ f ⁇ t ⁇ k 1 ⁇ x + e
- the temperature wave oscillates harmonically with the same angular frequency as its excitation and decays rapidly with increasing penetration depth in the medium, while the phase shift increases. Penetration depth and wavelength increase with increasing oscillation period and thermal conductivity of the medium.
- the damping of the amplitude is thus also a measure of the thermal conductivity of the medium.
- the thermal conductivity ⁇ of the medium is represented by the mean temperature distribution in the measuring room.
- an average temperature is set at the temperature detectors, which is in proportion to the heat flow that flows through the gaseous medium from the heater via the detectors to the housing wall flows.
- the temperatures of the heater and the detectors must be known. B. the control of a detector (preferably the one closer to the heater) to a constant (excessive) temperature if the required mean heating energy is determined as a measure for the thermal conductivity.
- the basic principle for measuring the thermal conductivity of gases is that in a flow-free measuring room with a free-standing heater element in the gas (e.g. a hot wire or a "hot plate” - hot plate) an excess temperature above the ambient temperature is generated.
- a condition for correct measurement is a still gas in the measuring room, e.g. B. in a dead volume or behind a diffusion barrier, since convective heat flow leads to a measurement error [Baar 2001] .
- the task of the electronics and signal evaluation is to use a miniaturized system that is as inexpensive as possible, e.g. B. to generate a reliable measurement result that is directly dependent on the gas concentration.
- the gas sensor according to the invention should be able to be used in a respiratory gas monitor in which the carbon concentration in the air mixture can change with high dynamics.
- the gas sensor should be able to resolve changes in the gas composition in the ventilation cycle of inspiration and expiration up to a rate of 60 strokes per minute. A rapid evaluation of the sensor signals is therefore desirable.
- 10 shows an electrical circuit diagram of a heater control for a thermal gas sensor.
- a CPU gives z. B. a lower and upper heater voltage and switches back and forth between these two values controlled by a timer.
- a CPU can measure the current heater current at specific times to calculate the heater power.
- 10 represents a heater supply with voltage specification and current measurement.
- a square-wave signal is generated on the developed ⁇ controller electronics (for example). Due to the timer structures in the processor, this can be generated much more precisely in terms of time than a synthetic sinusoidal signal that would be output by the processor on its digital/analog (DA) port.
- DA digital/analog
- 2 heater voltages are specified via a DA converter.
- the DA converter is controlled via SPI, and the time from which a new DA value is accepted is not exactly the same as the one selected Processor module (CPU) can be determined.
- this is a prerequisite for being able to determine the phase position of the sensor response.
- one of the two voltages is alternately applied to the heater amplifier via an analog switch, for example. So that the steep switching edges spread less in the system, they are smoothed out, for example, by a downstream low-pass filter.
- the operational amplifier (OP) circuit boosts the voltage to the voltage level required by the heater. Another OP compensates, for example, for the voltage drop that occurs at the current measuring resistor. Since the current is measured and the heater voltage is known, the heater power can be calculated. This is important because heater resistance can vary with temperature.
- a heater duty cycle of 50% may be used (eg, a periodic square wave having a duty cycle of, for example, 50% +/-2% is applied to the heater).
- shorter duty cycles can also be used, for example in the range of 5..50%.
- the heater output is not adjusted by controlling the duty cycle - this is more difficult on the MSP430, but interesting when using more powerful ⁇ controllers: You can work with a fixed operating voltage and only change the duty cycle (a kind of PWM control).
- the heater power can be adjusted by changing the voltage levels (the voltage applied to the heater) or the current levels (the current flowing through the heater or heating element). The two options can also be combined.
- FIG. 11 shows an electrical circuit diagram of a detector signal evaluation of a thermal gas sensor.
- Both a first thermocouple structure and a second thermocouple structure of the gas sensor can 11 shown detector signal evaluation, in order to detect heat transmitted from a heating element of the gas sensor to the first thermocouple structure and the second thermocouple structure via a gas to be analyzed in a respective detector signal (e.g. detected by means of the first thermocouple structure or the second thermocouple structure and can also be referred to herein as a sensor signal).
- a sensor signal e.g. detected by means of the first thermocouple structure or the second thermocouple structure and can also be referred to herein as a sensor signal.
- the detector signal evaluation of the sensor 1 shown.
- the detector signal evaluation z. B configured to receive a first input signal, z. B.
- a CPU controls a heater so that an amplitude of the sensor signal stays in an ADC range.
- a magnifying glass function z. B. kept the sensor signal within the ADC limits.
- a phase evaluation is carried out e.g. B. via the comparator using the MSP430 timer structures (time structures).
- a change in resistance of the sensor wire is very small. For this reason, a high gain amplifier is preferred or needed. Since an absolute value of an input voltage (e.g. the sensor signals) depends on many factors, it is advisable to compensate this value.
- a direct current (DC) amplifier was used, which has no phase shift.
- the negative input connection at the differential input of the operational amplifier (OP) is raised to the mean value of the detector signal and actively tracked using a software controller, the digital-to-analog converter (DAC) of the
- processor outputs this voltage directly. Due to the differential mode of operation of the differential input on the OP, the DC components of the input voltages are subtracted from one another and only the AC component of the signal is amplified. To do this, in one aspect, the analog-to-digital converted (ADC) signal is measured and checked to see if it is within reasonable limits detectable by the ADC. If the signal hits the upper or lower voltage limit of the OP, the DAC value is adjusted accordingly. The result is an amplifier in which the amplified signal is continuously kept in the optimal working range or working window, whereby the amplification factor on the OP can be increased by removing the DC component, a kind of "magnifying glass function". The DAC value required for compensation can be used as a further parameter for evaluation, with which the absolute mean detector temperature can be determined and the thermal conductivity of the gas mixture can be determined via the relationship from equation (5).
- ADC analog-to-digital converted
- a Schmitt trigger for example, was used to determine the phase position of the sensor signal. It is set to switch just above or below the zero crossing of the sensor signal. Here the signal is at its steepest and thus causes the smallest phase noise.
- the DC component is removed via a capacitor, for example. This makes it possible to determine the phase of the sensor response.
- FIG. 12 shows a schematic representation of nested software controllers for a thermal gas sensor.
- the innermost is the DC operating point controller. For example, only when this has settled (no adjustment of the DC offset was necessary), then the tracking of the sampling times takes place.
- the amplitude control loop the amplitude of S1 is kept constant, for example - but only if no adjustment of the DC offset and sampling time was necessary.
- the heating energy required to regulate the S1 amplitude can be regulated in such a way that the thermal System can dynamically adapt to a wide range of different gas mixtures.
- FIG. 12a A block diagram is shown in FIG. 12a, which represents an exemplary regulation and tracking of the DC operating points of the two detector amplifiers.
- FIG 13b a block diagram is shown which represents an exemplary tracking of the sampling times for the amplitude measurement of the detector signals and S1 amplitude controller.
- controllers e.g. B. the evaluation of the gas mixture with the measured values for amplitude and phase of the detectors.
- Figures 13a and 13b can be viewed as a block diagram, where Figure 13b With 13a is connected via the "Tracking of the sampling times" block.
- timing table e.g. B. for the gas sensor
- phase difference D1-Hz.dPhi red
- D2-Hz.dPhi blue
- phase difference D2-D1.dPhi green, right y-axis
- amplitudes measured at the detectors D1 and D2 as well as a sum signal of the amplitudes formed relative to the heater amplitude are shown as examples via the CO 2 dependence of the sensor.
- the amplitude D1.Uss (red) at detector 1 and the amplitude D2.Uss (blue) at detector 2 are displayed. Both amplitude signals fall z. B. with an increase in the CO2 concentration, ie with an increase in the thermal conductivity in the gas mixture.
- a sensor signal can be highly dependent on pressure and temperature. In order to correctly determine the gas properties, the transverse effects should therefore be known and corrected by the algorithms.
- the pressure influence shows a linear relationship
- the temperature influence a quadratic one, as calculated theoretically. Both cross-sensitivities are of the order of magnitude of the signal for the gas concentration itself.
- FIG. 12 shows a plot of a sensor signal for phase versus frequency when measured in CO 2 .
- Figure 17a a diagram of a phase shift in 100% CO 2 as a function of frequency. The phase goes into saturation.
- FIG. 12 shows a plot of a sensor signal for amplitude versus frequency when measured in CO 2 .
- Figure 17b a plot of amplitude in 100% CO 2 versus frequency. The amplitude drops towards zero.
- the heating power When measuring in combustible gases, the heating power should be slightly reduced compared to air, so that the system does not exceed its A/D range.
- the heating power it has been found that in practice it makes sense to operate the system with the largest possible sensor amplitudes and thus obtain more stable signals than to set the heating power to a minimum, at which the sample gas is thermally less influenced , but the signal-to-noise ratio also decreases.
- the heating energy periodically entered into the sensor must cover the sample volume within this period, e.g. B. can leave, so it does not heat up steadily. For example, a peak heat output of approx. 26 mW at 120 Hz was permanently set for three measuring systems that were set up.
- the sensor behavior represents an ideal first-order low-pass filter, there are no harmonic spectral components in the sensor signal. Because of this, actively sweeping through a frequency spectrum yields no additional information. So it was decided to operate the sensor at a fixed frequency, the electronics effort for the system could be reduced, the necessary measurement time to obtain a reliable value is significantly shorter. (all optional)
- phase resolution, phase difference and amplitude for different gas mixtures gave the best phase response at a frequency of e.g. B. 120 Hz at a heating power of 26 mW for the microwire sensor and 160 Hz at approx. 8 mW for the MEMS thermopile sensor on a thin-film membrane. (details optional)
- phase signal of a sensor for methane with increasing admixture of nitrogen As an almost linear behavior.
- it is the phase signal depending on the nitrogen concentration in methane as a phase difference D1-Hz.dPhi (red) between heater and detector 1, with a 200 ⁇ m distance, a phase difference D2-Hz.dPhi (blue) between heater and detector 2, with a 300 ⁇ m distance, and a phase difference D2-D1.dPhi (green, right y-axis) between detector 2 and detector 1 is shown.
- the relative amplitude signal sigUss 2*Hz.Uss-(D1.Uss+D2.Uss) (green, right y-axis) with increasing N 2 concentration.
- 20 shows a diagram of a calculated sensor signal sigX (an example for a combination signal of the gas sensor) from phase and amplitude for different combustible gas mixtures.
- 20 shows the sensor signal (an example of a combination signal of the gas sensor) for different fuel gases and their mixtures: methane, ethane and propane, as well as the mixtures: methane95-ethane05, methane93-ethane05-CO202, methane91-ethane05-CO204, methane91-ethane05- CO202-propane02, methane90-ethane10 and natural gas-L (the 2-digit numbers denote the percentage of the gas components by volume).
- Methane, ethane and propane show clear differences to each other, but the methane mixtures with shares of 2 vol% to 10 vol% of other gases also differ from each other.
- the sensor signal shows strong pressure and temperature dependencies.
- the cross effects are known and corrected.
- the pressure influence shows a linear correlation
- the temperature influence a quadratic one. Both cross-sensitivities are of the order of magnitude of the signal for the gas concentration itself.
- the factors Ka and Kp are constants with which both partial signals are multiplied.
- the added phase signal sigPhi is formed, for example, from the sum of the two phase differences for the propagation times between the rising edge of the heater pulse and the rising edges at the detectors.
- signPhi D 1 ⁇ Hz . phi + D 2 ⁇ Hz . phi where (D1-Hz).phi and (D2-Hz).phi are intended to represent the phase differences between the heater and the detectors.
- phase difference between the heater and the detectors increases with increasing CO 2 concentration, ie with increasing thermal diffusivity, but the two amplitudes at the detectors fall with increasing thermal diffusivity ( 15 ).
- the signal sigX calculated from phase and amplitude moves, for example, in the range between (1.7..2.0) for (0..6) vol% CO 2 .
- the device e.g. the gas sensor
- the device was measured in a temperature range between (16..28)°C and in the barometric pressure field between (900..1200) mbar.
- the strong pressure and temperature dependency of the sensor signal should be compensated in order to be able to deduce a gas concentration from the measured value.
- the green line 230b of the calibration curve can be shifted towards a current working pressure with the aid of a pressure-dependent polynomial function.
- the red line 230a corresponds to the average of all blue lines 230 1 to 230 16 and is a characteristic curve of the sensor signal to the gas concentration normalized to an average temperature and an average pressure.
- the characteristic curves of the sensor signal sigX are plotted from the measured variation for each temperature and an average gas concentration over the pressure (see 22 ), one also obtains a set of straight lines shifted parallel to each other. Higher pressures and cold gas, ie gas molecules lying closer together, result in a higher sensor signal, while low pressures and warm gas result in a lower signal sigX.
- the 22 thus shows a pressure dependency of the sensor signal sigX for a mean fixed gas concentration, family of curves from different temperatures.
- the bottom line 230 1 describes the connection at the highest temperature of 28°C in the variation and the top line 230 7 represents the pressure dependency of the signal at 16°C.
- Regression level A describes the relationship between the gas concentration of the calibration reference and the sensor signal sigX .
- the regression level B describes the pressure drift of the sensor signal sigX .
- the 1st derivative of the curve should be formed and the increase in the reference point should be calculated from this.
- CO 2 volume % A . y signX ⁇ 1 ⁇ B . y p ⁇ B . ref signX ⁇ B . ref ⁇ 1 ⁇ C . y T ⁇ C . ref p ⁇ C . ref
- Ay(sigX) , By(p) and Cy(T) correspond to the respective complete polynomials for the measurement signal, the gas pressure and the gas temperature.
- 24 shows a block diagram of a schematic procedure for determining a gas concentration, taking into account the influences of pressure and temperature from the sensor signal sigX formed.
- 24 shows 24 a schematic representation of the formation of the sensor signal sigX from amplitudes and phases as well as the determination of a gas concentration from sigX taking into account the influence of pressure and temperature (example).
- the thermal conductivity a of the gas mixture In addition to calibrating the sensor signal to the concentration of a known gas mixture, it is also possible to determine the thermal conductivity a of the gas mixture directly. In 25 the theoretically calculated thermal conductivity was plotted against the sensor signal sigX. In other words shows 25 the thermal conductivity versus the sensor signal sigX at constant pressure and constant temperature in a mixture of carbon dioxide CO 2 in nitrogen N 2 . The thermal diffusivity 240 1 (red line) falls with increasing CO 2 concentration 240 2 (green line).
- 26 , 27 and 28 show a diagram in which a heating voltage 300 applied to a heater of a gas sensor, a current flow 310 during a heating period 302, measuring times 320 for an optional ADC (analog-to-digital converter) of an exemplary evaluation arrangement and a comparator signal for a detector (e.g B. for a first detector or for a second detector).
- the evaluation arrangement is z. B. designed to obtain the information on how much heat is dissipated by the heater during the heating period 302, based on a measurement of the current flow 310 through the heater at a given heating voltage 300.
- the evaluation arrangement is designed to obtain the current flow 310 shortly after the specified heating voltage 300 is switched on and shortly before the specified heating voltage is switched off. This means e.g. B. that a start peak 312 of the heating current 310 and a heating current end value 314 of the current flow 310 can be processed by the evaluation arrangement.
- the starting peak 312 always has the same value for one and the same gas sensor (small fluctuations of less than 1%, 0.5% or 0.1% may possibly occur). According to the in the Figures 26 to 28 In the examples shown, the start peak 312 is always at 2.93V and approx. 400 ⁇ s after switching on. This value of the starting peak 312 is for a gas sensor in the Figures 26 to 28 shown. For other gas sensors, the value of the start peak 312 may differ from that shown in FIGS Figures 26 to 28 shown value. It should be noted here that the value of the start peak 312 can deviate not only between different gas sensors, but also between gas sensors of the same construction.
- a gas or gas mixture is analyzed by a gas sensor and/or an evaluation arrangement.
- a gas mixture with 10% CO 2 and 90% N 2 (nitrogen) according to the example 27 the gas is nitrogen (100% N 2 ) analyzed and according to the example 28 the gas oxygen (100% O 2 ) is analyzed.
- nitrogen 100% N 2
- the gas oxygen 100% O 2
- the evaluation arrangement processes (examines) the difference in the heating current (the current flow 310) between the switch-on and switch-off moment, ie between the cold and hot heater.
- the CO 2 mixture from 26 shows compared to the examples 27 and 28 the highest heater temperature and thus the lowest heating current (e.g. the lowest heating current final value 314) is reached here, since CO 2 has only half the thermal conductivity of N 2 and O 2 .
- the heater achieved according to 27 in 100 vol.% N 2 does not show the end temperature (e.g. the heating current end value 314) as in the 10% CO 2 -90% N 2 mixture 26 .
- the heater reaches according to 28 in 100 vol.% O 2 does not show the end temperature (e.g. the heating current end value 314) as in the 10% CO 2 -90% N 2 mixture 26 .
- the difference between turn-on and turn-off current in 28 is the lowest at 210 mV and accordingly the gas analyzed here also has the highest thermal conductivity in comparison to the 10%CO 2 -90%N 2 mixture (see 26 ) and the 100 vol.% N 2 (see 27 ) on.
- a measurement effect is minimal since the heater e.g. B. is highly doped to z. B. to be able to heat 3 V.
- the TKR (temperature coefficient) of the heater can be low (e.g. ⁇ 6*10 -3 1/K, ⁇ 4.1*10 -3 1/K, ⁇ 3.9*10 -3 1/K).
- a sensor signal (z. B. the current flow 310) used to distinguish the concentration of a third gas can.
- Emergency ventilation involves working with increased oxygen concentrations. So it is common to use a mixture of 50% by volume O 2 in N 2 . Without correction of the sensor signal at a higher oxygen concentration compared to the fresh gas during a calibration , the gas sensor (e.g. a CO 2 sensor ) shows a concentration of - 5% CO2 on. This means that the change in the third gas component, a change in the concentration of oxygen, in the mixture may lead to an error signal in the CO 2 sensor.
- a concentration mixture of about 56% oxygen and 5% CO 2 in nitrogen N 2 shows the sensor as z. For example, assume a CO 2 concentration of 0 vol.%, as in the fresh gas calibration with 21 vol.% O 2 and approx. 78 vol.% N 2 .
- the sensor would e.g. B. show erroneous values.
- the heater is operated with a constant voltage (which according to the Figures 26 to 28 corresponds to a value of 3000 digits at a D/A output, but this is only an example and can be freely selected).
- a constant voltage which according to the Figures 26 to 28 corresponds to a value of 3000 digits at a D/A output, but this is only an example and can be freely selected.
- a voltage signal is obtained which is proportional to the heating current.
- Screen shots of the signals recorded on the oscilloscope are shown, with the heater current curve (the current flow 310) being greatly enlarged (the noise can be reduced by shielding the measuring lines).
- a product of heating voltage 300 and measured heating current 310 enables z.
- B. a statement about the heating capacity.
- the heater current 310 decreases somewhat over time as the heater heats up and increases its internal resistance due to its resistance temperature gradient (TCR). Due to the higher internal resistance, less current can flow with the same heating voltage (I Hz ⁇ 1/R Hz ).
- phase signals can represent the phase information sigPhi for the evaluation arrangement according to an embodiment.
- the information 210 about the first phase difference the information 220 about the second phase difference, a phase sum 400 (information 210 + information 220) and a phase difference 410 (information 220 - information 210) are shown.
- the phase information 210, 220, 400 and 410 can also be recorded at other environmental parameter settings (different temperature, different pressure).
- a first section (e.g. measuring points 4520 to 4620) represents the respective phase information 210, 220, 400 and 410 for a 10 vol.% CO 2 in N 2 gas mixture
- a second section (e.g. measuring points 4670 to 4780 ) the respective phase information 210, 220, 400 and 410 for a 100 vol vol% O 2 Gas. Times between the individual sections are z. B. Waiting times until the respective mixture is adjusted.
- the phase sum 400 represents e.g. B. a stable sum signal D1+D2 (D1 corresponds to detector 1 and D2 corresponds to detector 2 ) of the phase positions. B. all phase information available. According to the exemplary embodiment, the largest signal difference occurs between 10% by volume of CO 2 and 0% by volume of CO 2 in N 2 . Since the phase difference signal 410 is currently very noisy, the phase sum 400 is preferred as phase information.
- information 210 about an amplitude of a detector signal of a first detector and information 220 about an amplitude of a detector signal of a second detector are displayed.
- the amplitude information 210 and 220 can also be acquired at other environmental parameter settings (different temperature, different pressure).
- a first section (e.g. measuring points 4520 to 4650) represents the respective amplitude information 210, 220 for a 10% by volume CO 2 in N 2 gas mixture
- a second section e.g. measuring points 4670 to 4810 the respective amplitude information 210, 220 for a 100% by volume N 2 gas
- a third section e.g. measuring points 4960 to 5120 the respective amplitude information 210, 220 for a 100% by volume O 2 gas. Times between the individual sections are z. B. Waiting times until the respective mixture is adjusted.
- the information 210 about the amplitude of the detector signal of the first detector and the information 220 about the amplitude of the detector signal of the second detector represent z. B. represent stable amplitude signals, wherein D2 (the second detector) according to this embodiment has a larger noise, since its amplitude is lower than the amplitude at D1 (the first detector) (about 5mV to 1.8mV in air).
- D2 the second detector
- D1 the first detector
- Figure 12 shows a combination signal sigX 230 (with the right y-axis) and a CO 2 reference signal 500 (with the left y-axis).
- a first section (e.g. measurement points 4610 to 4650) represents the combination signal sigX 230 for a 10% by volume CO 2 in N 2 gas mixture
- a second section (e.g. measurement points 4700 to 4810) represents the combination signal sigX 230 for a 100 vol.% N 2 gas
- a third section (e.g. measuring points 4960 to 5100) the combination signal sigX 230 for a 100 vol.% O 2 gas.
- Times between the individual sections are z. B. Waiting times until the respective mixture is adjusted.
- An NDIR reference detector detects z. B. only a CO 2 concentration and can not distinguish between N 2 and O 2 .
- the gas sensor is a membrane sensor.
- the thermal gas sensor based on membrane and thermopile technology with a perforated membrane can be designed to minimize the parasitic heat transport via the membrane or the suspension of the structures in order to obtain a higher gas-sensitive signal.
- the gas sensor can have electronics, wherein the electronics can have one or more of the following aspects, individually or in combination.
- the electronics can have a DC sensor amplifier with an operating point that is tracked via software.
- the electronics can be designed to carry out a measurement of the phase position via the internal timer structure of the ⁇ controller (MSP430), with z. B. the precise generation of the heater excitation signal via the analog switch is used via the internal timer structure of the ⁇ Controller (MSP430).
- the electronics can be designed to carry out a measurement of the phase position of the sensor signals via a Schmitt trigger, which measures the sensor signals freed from the DC offset in the zero point crossing, since the signals are steepest there and the phase noise is therefore minimized.
- the electronics include regulation of the heating power via S1 amplitude regulator and/or regulation of the timing of the sampling.
- the gas sensor can have a calibration.
- the calibration can be designed to form a pseudo signal from phase and amplitude, with the emphasis in signal formation and formula being able to be on a pseudo signal.
- aspects have been described in the context of a device, it is understood that these aspects also represent a description of the corresponding method, so that a block or a component of a device is also to be understood as a corresponding method step or as a feature of a method step. Similarly, aspects described in connection with or as a method step also constitute a description of a corresponding block or detail or feature of a corresponding device.
- Some or all of the method steps may be performed by hardware apparatus (or using a hardware Apparatus), such as a microprocessor, a programmable computer, or an electronic circuit. In some embodiments, some or more of the essential process steps can be performed by such an apparatus.
- embodiments of the invention may be implemented in hardware or in software. Implementation can be performed using a digital storage medium such as a floppy disk, DVD, Blu-ray Disc, CD, ROM, PROM, EPROM, EEPROM or FLASH memory, hard disk or other magnetic or optical memory, on which electronically readable control signals are stored, which can interact or interact with a programmable computer system in such a way that the respective method is carried out. Therefore, the digital storage medium can be computer-readable.
- a digital storage medium such as a floppy disk, DVD, Blu-ray Disc, CD, ROM, PROM, EPROM, EEPROM or FLASH memory, hard disk or other magnetic or optical memory, on which electronically readable control signals are stored, which can interact or interact with a programmable computer system in such a way that the respective method is carried out. Therefore, the digital storage medium can be computer-readable.
- some embodiments according to the invention comprise a data carrier having electronically readable control signals capable of interacting with a programmable computer system in such a way that one of the methods described herein is carried out.
- embodiments of the present invention can be implemented as a computer program product with a program code, wherein the program code is effective to perform one of the methods when the computer program product runs on a computer.
- the program code can also be stored on a machine-readable carrier, for example.
- exemplary embodiments include the computer program for performing one of the methods described herein, the computer program being stored on a machine-readable carrier.
- an exemplary embodiment of the method according to the invention is therefore a computer program that has a program code for performing one of the methods described herein when the computer program runs on a computer.
- a further exemplary embodiment of the method according to the invention is therefore a data carrier (or a digital storage medium or a computer-readable medium) on which the computer program for carrying out one of the methods described herein is recorded.
- the data carrier, digital storage medium, or computer-readable medium is typically tangible and/or non-transitory.
- a further exemplary embodiment of the method according to the invention is thus a data stream or a sequence of signals which represents the computer program for carrying out one of the methods described herein.
- the data stream or sequence of signals may be configured to be transferred over a data communication link, such as the Internet.
- Another embodiment includes a processing device, such as a computer or programmable logic device, configured or adapted to perform any of the methods described herein.
- a processing device such as a computer or programmable logic device, configured or adapted to perform any of the methods described herein.
- Another embodiment includes a computer on which the computer program for performing one of the methods described herein is installed.
- a further exemplary embodiment according to the invention comprises a device or a system which is designed to transmit a computer program for carrying out at least one of the methods described herein to a recipient.
- the transmission can take place electronically or optically, for example.
- the recipient may be a computer, mobile device, storage device, or similar device.
- the device or the system can, for example, comprise a file server for transmission of the computer program to the recipient.
- a programmable logic device e.g., a field programmable gate array, an FPGA
- a field programmable gate array may cooperate with a microprocessor to perform any of the methods described herein.
- the methods are performed on the part of any hardware device. This can be hardware that can be used universally, such as a computer processor (CPU), or hardware that is specific to the method, such as an ASIC.
- the devices described herein may be implemented, for example, using hardware apparatus, or using a computer, or using a combination of hardware apparatus and a computer.
- the devices described herein, or any components of the devices described herein may be implemented at least partially in hardware and/or in software (computer program).
- the methods described herein may be implemented, for example, using hardware apparatus, or using a computer, or using a combination of hardware apparatus and a computer.
Description
Ausführungsbeispiele gemäß der Erfindung beziehen sich auf Auswerteanordnungen für einen thermischen Gassensor, Verfahren und Computerprogramme.Embodiments according to the invention relate to evaluation arrangements for a thermal gas sensor, methods and computer programs.
Gase können derzeit mit unterschiedlichsten Sensoren auf ihre Eigenschaften hin analysiert werden. Am Markt existieren heute verschiedene Systeme zur Patientenbeatmung. Diese werden unterschieden nach Einsatz im klinischen und im Home Care-Bereich (z. B. Systeme der Firmen Heinen+Löwenstein, Dräger und Stephan Medizintechnik). Die Systeme dieser Anbieter beinhalten nur in ihren Top-Varianten alle notwendigen Messeinrichtungen zur Bestimmung von Druck, Atemfluss und Atemgasanalyse. Dazu müssen mehrere Geräte kombiniert werden, die überwiegend patientenfern messen.Gases can currently be analyzed for their properties using a wide variety of sensors. There are various systems for patient ventilation on the market today. These are differentiated according to use in the clinical and in the home care area (e.g. systems from the companies Heinen+Löwenstein, Dräger and Stephan Medizintechnik). Only the top versions of the systems from these providers contain all the necessary measuring devices for determining pressure, respiratory flow and respiratory gas analysis. To do this, several devices must be combined, which mainly measure away from the patient.
In Anbetracht dessen besteht ein Bedarf nach einem Konzept, das einen besseren Kompromiss zwischen einer Reduzierung eines Bauraums und einer Reduzierung eines Systemgewichts eines Gas-Mess-Systems ermöglicht und eine genaue Strömungsmessung sowie eine schnelle Gasanalyse bereitstellt.In view of this, there is a need for a concept that enables a better compromise between a reduction in installation space and a reduction in system weight of a gas measurement system and provides accurate flow measurement and rapid gas analysis.
Diese Aufgabe wird durch die unabhängigen Patentansprüche gelöst.This object is solved by the independent patent claims.
Erfindungsgemäße Weiterbildungen sind in den Unteransprüchen definiert.Developments according to the invention are defined in the dependent claims.
Ein Ausführungsbeispiel betrifft eine Auswerteanordnung für einen thermischen Gassensor mit zumindest einem Heizer (z. B. einem Heizelement) und zumindest einem Detektor (z. B. eine Thermokettenstruktur bzw. "Thermopile-Struktur", temperaturveränderliche Widerstände oder Thermistoren). Die Auswerteanordnung ist z. B. ausgelegt, um eine Information über eine Amplitude eines Detektorsignals eines ersten Detektors (z. B. D1.Uss) und eine Information über eine erste Phasendifferenz zwischen einem Heizer-Signal und dem Detektorsignal des ersten Detektors (beispielsweise (D1-Hz).phi) zu erhalten. Die Auswerteanordnung kann ferner ausgelegt sein, um als Zwischengröße abhängig von der Information über die Amplituden des Detektorsignals (z. B. D1.Uss und/oder D2.Uss) und abhängig von der Information über die erste Phasendifferenz ein Kombinationssignal zu bilden, das Amplitudeninformationen und Phaseninformationen zusammenfassen kann. Die Auswerteanordnung ist des Weiteren ausgelegt, um z. B. eine Information über eine Gaskonzentration oder eine Information über eine Temperaturleitfähigkeit eines Fluids (beispielsweise eines Gases oder Gasgemisches) basierend auf dem Kombinationssignal zu bestimmen (beispielsweise ohne im weiteren Fortgang der Berechnungen, die in das Kombinationssignal einfließenden Einzelinformationen noch einmal separat zu betrachten).One embodiment relates to an evaluation arrangement for a thermal gas sensor with at least one heater (eg a heating element) and at least one detector (e.g. a thermal chain structure or "thermopile structure", temperature variable resistors or thermistors). The evaluation arrangement is z. B. designed to provide information about an amplitude of a detector signal of a first detector (e.g. D1.Uss) and information about a first phase difference between a heater signal and the detector signal of the first detector (e.g. (D1-Hz). phi) to get. The evaluation arrangement can also be designed to form a combination signal as an intermediate variable depending on the information about the amplitude of the detector signal (e.g. D1.Uss and/or D2.Uss) and depending on the information about the first phase difference, the amplitude information and summarize phase information. The evaluation arrangement is also designed to B. to determine information about a gas concentration or information about a thermal conductivity of a fluid (e.g. a gas or gas mixture) based on the combination signal (e.g. without considering the individual pieces of information flowing into the combination signal separately again as the calculations progress).
Gemäß einem Ausführungsbeispiel kann der Heizer und der zumindest eine Detektor zyklisch getauscht werden, um evtl. (Gleichlauf-)Fehler zu minimieren. In anderen Worten kann zu einem ersten Zeitpunkt der Detektor als Heizer wirken und der Heizer als Detektor und zu einem zweiten Zeitpunkt kann der Detektor als Detektor dienen und der Heizer als Heizer.According to one exemplary embodiment, the heater and the at least one detector can be exchanged cyclically in order to minimize any (synchronization) errors. In other words, at a first point in time the detector can act as a heater and the heater as a detector and at a second point in time the detector can act as a detector and the heater as a heater.
Gemäß einem Ausführungsbeispiel umfasst die Auswerteanordnung zwei Detektoren, wobei diese beiden Detektoren einen gleichen Abstand zu dem Heizer aufweisen. In diesem Fall kann in das Kombinationssignal beispielsweise eine Summe der Information über die Amplituden der beiden Detektorsignale (z. B. D1.Uss und D2.Uss) von den beiden Detektoren und eine Summe der Information über die beiden Phasendifferenzen ((D1-Hz).phi und (D2-Hz).phi) der beiden Detektoren einfließen.According to one exemplary embodiment, the evaluation arrangement includes two detectors, these two detectors being at the same distance from the heater. In this case, a sum of the information about the amplitudes of the two detector signals (e.g. D1.Uss and D2.Uss) from the two detectors and a sum of the information about the two phase differences ((D1-Hz) .phi and (D2-Hz).phi) of the two detectors.
Ein Ausführungsbeispiel betrifft eine Auswerteanordnung für einen thermischen Gassensor mit zumindest einem Heizer (z. B. einem Heizelement) und zwei in unterschiedlichen Abständen von dem Heizer angeordneten Detektoren (z. B. eine erste Thermoelement-Struktur und eine zweite Thermoelement-Struktur oder temperaturveränderliche Widerstände oder Thermistoren), wobei die Auswerteanordnung ausgelegt ist, um eine Information über eine Amplitude eines Detektorsignals eines ersten Detektors (z. B. D1.Uss), eine Information über eine Amplitude eines Detektorsignals eines zweiten Detektors (z. B. D2.Uss), eine Information über eine erste Phasendifferenz zwischen einem Heizer-Signal und dem Detektorsignal des ersten Detektors (beispielsweise (D1-Hz).phi), und eine Information über eine zweite Phasendifferenz zwischen dem Heizer-Signal und dem Detektorsignal des zweiten Detektors (beispielsweise (D2-Hz).phi) zu erhalten. Die Auswerteanordnung kann ausgelegt sein, um als Zwischengröße abhängig von der Information über die Amplituden der Detektorsignale (z. B. D1.Uss des ersten Detektors und D2.Uss des zweiten Detektors) und abhängig von der Information über die erste Phasendifferenz und abhängig von der Information über die zweite Phasendifferenz ein Kombinationssignal zu bilden, das Amplitudeninformationen und Phaseninformationen zusammenfassen kann. Die Auswerteanordnung ist des Weiteren ausgelegt, um eine Information über eine Gaskonzentration oder eine Information über eine Temperaturleitfähigkeit eines Fluids (beispielsweise eines Gases oder Gasgemisches) basierend auf dem Kombinationssignal zu bestimmen (beispielsweise ohne im weiteren Fortgang der Berechnungen, die in das Kombinationssignal einfließenden Einzelinformationen noch einmal separat zu betrachten).One embodiment relates to an evaluation arrangement for a thermal gas sensor with at least one heater (e.g. a heating element) and two detectors arranged at different distances from the heater (e.g. a first thermocouple structure and a second thermocouple structure or temperature-variable resistors or thermistors), the evaluation arrangement being designed to provide information about an amplitude of a detector signal from a first detector (e.g. D1.Uss), information about an amplitude of a detector signal from a second detector (e.g. D2.Uss), information about a first phase difference between a heater signal and the detector signal of the first detector (e.g. (D1-Hz).phi), and information about a second phase difference between the heater signal and the detector signal of the second detector (e.g. (D2-Hz).phi). The evaluation arrangement can be designed as an intermediate variable depending on the information about the amplitudes of the detector signals (e.g. D1.Uss of the first detector and D2.Uss of the second detector) and depending on the information about the first phase difference and depending on the Information about the second phase difference to form a combination signal that can summarize amplitude information and phase information. The evaluation arrangement is also designed to determine information about a gas concentration or information about a thermal conductivity of a fluid (e.g. a gas or gas mixture) based on the combination signal (e.g. without further processing of the calculations, the individual information flowing into the combination signal yet to be considered separately).
Gemäß einem Ausführungsbeispiel kann in dem thermischen Gassensor zwischen dem zumindest einem Heizer und den in unterschiedlichen Abständen oder in gleichen Abständen (z. B. symmetrisch) von dem Heizer angeordneten Detektoren Gas angeordnet sein, das mit der Auswerteanordnung in Zusammenarbeit mit dem thermischen Gassensor analysiert werden kann. Hierfür wird beispielsweise von dem zumindest einen Heizer Wärme zu dem ersten Detektor und dem zweiten Detektor über das dazwischen befindliche Gas bzw. Gasgemisch transportiert. Dabei kann ein von dem ersten Detektor detektiertes Detektorsignal bzw. ein von dem zweiten Detektor detektiertes Detektorsignal die von dem Heizer zu dem jeweiligen Detektor transportierte Wärme anzeigen. Variiert eine Heizsignalamplitude (z. B. Heizer-Amplitude) des zumindest einen Heizers (z. B. periodische Anregung des Heizers), so kann auch von den zwei Detektoren eine zum Heizer korrespondierende variierende Amplitude detektiert werden. Das Detektorsignal des ersten Detektors bzw. des zweiten Detektors kann an die Auswerteanordnung gesendet werden. Somit kann die Auswerteanordnung aus dem Detektorsignal des ersten Detektors und aus dem Detektorsignal des zweiten Detektors die jeweilige Informationen über die Amplitude erhalten sowie Informationen über die erste Phasendifferenz zwischen dem Heizer-Signal und dem Detektorsignal des ersten Detektors und die Information über die zweite Phasendifferenz zwischen dem Heizer-Signal und dem Detektorsignal des zweiten Detektors erhalten. Hierfür kann die Auswerteanordnung beispielsweise von dem thermischen Gassensor zusätzlich zu den Detektorsignalen des ersten Detektors bzw. des zweiten Detektors das Heizer-Signal erhalten. Alternativ kann die Auswerteanordnung beispielsweise von dem thermischen Gassensor direkt die Information über die Amplitude des Detektorsignals des ersten Detektors, die Information über die Amplitude des Detektorsignals des zweiten Detektors, die Information über die erste Phasendifferenz und die Information über die zweite Phasendifferenz erhalten.According to one embodiment, gas can be arranged in the thermal gas sensor between the at least one heater and the detectors arranged at different distances or at equal distances (e.g. symmetrically) from the heater, which gas can be analyzed with the evaluation arrangement in cooperation with the thermal gas sensor can. For this purpose, for example, heat is transported from the at least one heater to the first detector and the second detector via the gas or gas mixture located between them. A detector signal detected by the first detector or a detector signal detected by the second detector can indicate the heat transported from the heater to the respective detector. If a heating signal amplitude (e.g. heater amplitude) of the at least one heater varies (e.g. periodic excitation of the heater), then a varying amplitude corresponding to the heater can also be detected by the two detectors. The detector signal from the first detector or the second detector can be sent to the evaluation arrangement. The evaluation arrangement can thus receive the respective information about the amplitude from the detector signal of the first detector and from the detector signal of the second detector, as well as information about the first phase difference between the heater signal and the detector signal of the first detector and the information about the second phase difference between the Get heater signal and the detector signal of the second detector. For this purpose, the evaluation arrangement can, for example, receive the heater signal from the thermal gas sensor in addition to the detector signals of the first detector or the second detector. Alternatively, the evaluation arrangement can, for example, receive the information about the amplitude directly from the thermal gas sensor of the detector signal of the first detector, the information about the amplitude of the detector signal of the second detector, the information about the first phase difference and the information about the second phase difference.
Dieses Ausführungsbeispiel der Auswerteanordnung basiert auf der Erkenntnis, dass das Kombinationssignal, basierend auf der Information über die Amplituden der Detektorsignale und abhängig von der Information über die erste Phasendifferenz und der Information über die zweite Phasendifferenz, ein sehr stabiles Signal darstellt, das von der Auswerteanordnung sehr schnell weiterverarbeitet werden kann, um beispielsweise eine Gaskonzentration oder eine Information über eine Temperaturleitfähigkeit des Fluids zu bestimmen. Somit erlaubt die Auswerteanordnung eine schnelle Gasanalyse.This exemplary embodiment of the evaluation arrangement is based on the finding that the combination signal, based on the information about the amplitudes of the detector signals and depending on the information about the first phase difference and the information about the second phase difference, represents a very stable signal that is very can be further processed quickly, for example to determine a gas concentration or information about a thermal conductivity of the fluid. The evaluation arrangement thus allows rapid gas analysis.
Gemäß einem Ausführungsbeispiel kann die Auswerteanordnung ausgelegt sein, um eine Information über eine Heizer-Amplitude zu erhalten. Die Auswerteanordnung kann zudem ausgelegt sein, um eine Linearkombination der Information über die Heizer-Amplitude, der Information über Amplituden der Detektorsignale, der Information über die erste Phasendifferenz und der Information über die zweite Phasendifferenz zu bilden, um das Kombinationssignal (sigX) zu bestimmen. Die Information über die Heizer-Amplitude kann beispielsweise eine Information über eine Heizleistung sein. Hierin kann die Information über eine Heizer-Amplitude auch als Hz.Uss bezeichnet werden. Die Auswerteanordnung kann beispielsweise die Information über die Heizer-Amplitude direkt von dem thermischen Gassensor erhalten oder beispielsweise aus einem von dem thermischen Gassensor an die Auswerteanordnung gesendeten Heizer-Signal erhalten. Die Linearkombination kann beispielsweise einen ersten Term, der eine erste Linearkombination der Information über die Heizer-Amplitude und der Information über Amplituden der Detektorsignale aufweist, und einen zweiten Term aufweisen, der eine zweite Linearkombination der Information über die erste Phasendifferenz und der Information über die zweite Phasendifferenz aufweist. Dabei können beispielsweise der erste Term und der zweite Term mit unterschiedlichen Konstanten in der Linearkombination gewichtet werden, um das Kombinationssignal zu bestimmen. Dadurch, dass die Auswerteanordnung die Heizer-Amplitude in der Bestimmung des Kombinationssignals berücksichtigt, kann das Heizer-Signal (z. B. ein vom Heizer ausgesendetes Signal von periodischen Temperaturwellen) mit dem Detektorsignal des ersten Detektors bzw. des zweiten Detektors (z. B. ein empfangenes Signal von periodischen Temperaturwellen) verglichen werden, wodurch ein Wärmeübertrag vom Heizer über das zu analysierende Gas zu den zwei Detektoren sehr genau bestimmt werden kann. Somit wird eine sehr genaue und schnelle Gasanalyse mit der Auswerteanordnung ermöglicht.According to one exemplary embodiment, the evaluation arrangement can be designed to obtain information about a heater amplitude. The evaluation arrangement can also be designed to form a linear combination of the information about the heater amplitude, the information about amplitudes of the detector signals, the information about the first phase difference and the information about the second phase difference in order to determine the combination signal (sigX). The information about the heater amplitude can be information about a heating power, for example. Here, the information about a heater amplitude can also be referred to as Hz.Uss. The evaluation arrangement can, for example, receive the information about the heater amplitude directly from the thermal gas sensor or, for example, from a heater signal sent by the thermal gas sensor to the evaluation arrangement. The linear combination can have, for example, a first term that has a first linear combination of the information about the heater amplitude and the information about amplitudes of the detector signals, and a second term that has a second linear combination of the information about the first phase difference and the information about the second has phase difference. In this case, for example, the first term and the second term can be weighted with different constants in the linear combination in order to determine the combination signal. Since the evaluation arrangement takes the heater amplitude into account when determining the combination signal, the heater signal (e.g. a signal of periodic temperature waves emitted by the heater) can be compared with the detector signal of the first detector or the second detector (e.g a received signal of periodic temperature waves) can be compared, whereby a heat transfer from the heater via the gas to be analyzed to the two detectors can be determined very accurately can. A very precise and rapid gas analysis is thus made possible with the evaluation arrangement.
Gemäß einem Ausführungsbeispiel kann die Auswerteanordnung ausgelegt sein, um das Kombinationssignal sigX gemäß ![]()
![]()
Gemäß einem Ausführungsbeispiel ist die Auswerteanordnung ausgelegt, um die Amplitudeninformation sigUss gemäß sigUss=2*Hz.Uss-(D1.Uss+D2.Uss) zu erhalten. Der Term Hz.Uss kann eine Information über eine Heizer-Amplitude sein, der Term D1.Uss kann die Information über die Amplitude des Detektorsignals des ersten Detektors sein und D2.Uss kann die Information über die Amplitude des Detektorsignals des zweiten Detektors sein. Somit kann die Amplitudeninformation sigUss ein relatives Amplituden-Signal darstellen. In anderen Worten kann die Amplitudeninformation eine Differenz aus der doppelten Heizer-Amplitude und einer Summe der Information über die Amplitude des Detektorsignals des ersten Detektors und der Information über die Amplitude des Detektorsignals des zweiten Detektors sein. Durch diese spezielle Berechnung der Amplitudeninformation sigUss kann erreicht werden, dass die Amplitudeninformation sigUss im Wesentlichen von einer Wärmeübertragung durch das Fluid abhängt und unbekannte Wärmeübergänge beispielsweise von dem zumindest einen Heizer in das zu analysierende Gas und von dem zu analysierenden Gas in den ersten bzw. zweiten Detektor nicht oder nur kaum berücksichtigt werden. Somit wird das Kombinationssignal sigX, das von der Amplitudeninformation sigUss abhängen kann, z. B. gar nicht oder nur kaum von unbekannten Wärmeübergängen beeinflusst, wodurch die Auswerteanordnung sehr genau Eigenschaften des zu analysierenden Gases, wie z. B die Information über die Gaskonzentration oder die Information über die Temperaturleitfähigkeit des Fluids, bestimmen kann.According to one exemplary embodiment, the evaluation arrangement is designed to receive the amplitude information sigUss according to sigUss=2*Hz.Uss-(D1.Uss+D2.Uss). The Hz.Uss term can be information about a heater amplitude, the term D1.Uss can be the information about the amplitude of the detector signal of the first detector and D2.Uss can be the information about the amplitude of the detector signal of the second detector. The amplitude information sigUss can thus represent a relative amplitude signal. In other words, the amplitude information can be a difference between twice the heater amplitude and a sum of the information about the amplitude of the detector signal of the first detector and the information about the amplitude of the detector signal of the second detector. This special calculation of the amplitude information sigUss can ensure that the amplitude information sigUss depends essentially on heat transfer through the fluid and unknown heat transfers, for example from the at least one heater into the gas to be analyzed and from the gas to be analyzed into the first or second Detector are not or only rarely taken into account. Thus, the combination signal sigX, which may depend on the amplitude information sigUss, e.g. B. not or only slightly affected by unknown heat transfer, whereby the evaluation very precisely properties of the gas to be analyzed, such. B can determine the information about the gas concentration or the information about the thermal conductivity of the fluid.
Gemäß einem Ausführungsbeispiel kann die Auswerteanordnung ausgelegt sein, um ein Polynom (beispielsweise ersten Grades, beispielsweise A.y(sigX)) des Kombinationssignals zu berechnen, um die Information über die Gaskonzentration oder die Information über die Temperaturleitfähigkeit des Fluids zu erhalten. Durch die Polynombildung der Auswerteanordnung des Kombinationssignals kann eine Drift-Korrektur des Kombinationssignals durchgeführt werden. So können beispielsweise Konzentrations-Drift, Druck-Drift und Temperatur-Drift durch die Polynombildung korrigiert werden. So kann die Auswerteanordnung beispielsweise drei Polynome des Kombinationssignals berechnen, wobei ein erstes Polynom einen Zusammenhang zwischen der Gaskonzentration und dem Kombinationssignal darstellen kann, ein zweites Polynom, einen Zusammenhang zwischen Druck zu Signal-Verschiebung (Druck-Drift des Kombinationssignals) darstellen kann und ein drittes Polynom, einen Zusammenhang zwischen einer Temperatur zu Druck-Verschiebung darstellen kann. Somit können durch dieses Merkmal mögliche Ungenauigkeiten korrigiert werden und somit kann die Auswerteanordnung ausgebildet sein, um sehr genau mit einer Reduzierung von möglichen Fehlern das Fluid zu analysieren.According to one exemplary embodiment, the evaluation arrangement can be designed to calculate a polynomial (for example first degree, for example Ay(sigX)) of the combination signal in order to obtain information about the gas concentration or information about the thermal conductivity of the fluid. A drift correction of the combination signal can be carried out by the polynomial formation of the evaluation arrangement of the combination signal. For example, concentration drift, pressure drift and temperature drift can be corrected by forming polynomials. For example, the evaluation arrangement can calculate three polynomials of the combination signal, where a first polynomial can represent a relationship between the gas concentration and the combination signal, a second polynomial can represent a relationship between pressure and signal shift (pressure drift of the combination signal) and a third polynomial can represent a relationship between a temperature and pressure shift can. Possible inaccuracies can thus be corrected by this feature and the evaluation arrangement can thus be designed to analyze the fluid very precisely with a reduction in possible errors.
Gemäß einem Ausführungsbeispiel kann die Auswerteanordnung ausgelegt sein, um ein Polynom des Kombinationssignals mit einem Korrekturterm zu multiplizieren, um die Information über die Gaskonzentration oder die Information über die Temperaturleitfähigkeit zu erhalten. Der Korrekturterm kann von dem Kombinationssignal, einer Information über einen Druck (p) und einer Information über eine Temperatur (T) abhängig sein. Somit kann der Korrekturterm beispielsweise eine Druck- und Temperaturabhängigkeit des Kombinationssignals kompensieren. So kann beispielsweise ein Polynom, das einen Zusammenhang zwischen einer Gaskonzentration und dem Kombinationssignal darstellt, mit dem Korrekturterm um eine Druck- und Temperatur-Drift korrigiert werden. Somit kann durch die Multiplikation des Korrekturterms mit dem Polynom des Kombinationssignals eine Reduzierung von möglichen Fehlereinflüssen von der Auswerteanordnung durchgeführt werden, wodurch die Auswerteanordnung ausgebildet sein kann, um sehr genau Informationen über die Gaskonzentration oder Informationen über die Temperaturleitfähigkeit zu erhalten. Hierdurch können beispielsweise druck- und temperaturabhängige Fehler, entstanden beispielsweise bei der Detektion eines Detektorsignals durch den ersten Detektor bzw. den zweiten Detektor des Gassensors, minimiert werden.According to one exemplary embodiment, the evaluation arrangement can be designed to multiply a polynomial of the combination signal by a correction term in order to obtain information about the gas concentration or information about the thermal conductivity. The correction term can be dependent on the combination signal, information about a pressure (p) and information about a temperature (T). The correction term can thus, for example, compensate for a pressure and temperature dependency of the combination signal. For example, a polynomial that represents a relationship between a gas concentration and the combination signal can be corrected for a pressure and temperature drift using the correction term. Thus, by multiplying the correction term with the polynomial of the combination signal, the evaluation arrangement can reduce possible error effects, as a result of which the evaluation arrangement can be designed to obtain very precise information about the gas concentration or information about the thermal conductivity. In this way, for example, pressure- and temperature-dependent errors that arise, for example, when a detector signal is detected by the first detector or the second detector of the gas sensor, can be minimized.
Gemäß einem Ausführungsbeispiel kann die Auswerteanordnung ausgelegt sein, um eine Berechnung gemäß ![]()
![]()
Gemäß einem Ausführungsbeispiel kann die Auswerteanordnung ausgelegt sein, um eine Berechnung gemäß 
Gemäß einem Ausführungsbeispiel kann die Auswerteanordnung ausgelegt sein, um einen Druck und/oder eine Temperatur in einer Umgebung des thermischen Gassensors bei der Bestimmung der Information über die Gaskonzentration zu berücksichtigen. Hierfür kann die Auswerteanordnung beispielsweise Informationen über den Druck und/oder die Temperatur in der Umgebung des thermischen Gassensors erhalten. Der Druck in der Umgebung des thermischen Gassensors wird beispielsweise durch einen Drucksensor und die Temperatur in der Umgebung des thermischen Gassensors wir beispielsweise durch einen Temperatursensor bestimmt und an die Auswerteanordnung zu übermittelt. Der Drucksensor und/oder der Temperatursensor kann in der Umgebung des thermischen Gassensors angeordnet sein. Somit wird ermöglicht, dass die Auswerteanordnung abhängig von dem Druck und/oder der Temperatur Korrekturen durchführt, und somit sehr genau das Fluid analysieren kann und somit sehr genau Informationen beispielsweise über die Gaskonzentration bzw. eine Temperaturleitfähigkeit des Fluids erhalten kann.According to one exemplary embodiment, the evaluation arrangement can be designed to take into account a pressure and/or a temperature in an area surrounding the thermal gas sensor when determining the information about the gas concentration. For this purpose, the evaluation arrangement can receive information about the pressure and/or the temperature in the vicinity of the thermal gas sensor, for example. The pressure in the vicinity of the thermal gas sensor is determined, for example, by a pressure sensor and the temperature in the vicinity of the thermal gas sensor is determined, for example, by a temperature sensor and transmitted to the evaluation arrangement. The pressure sensor and/or the temperature sensor can be arranged in the vicinity of the thermal gas sensor. This enables the evaluation arrangement to be dependent of the pressure and / or the temperature carries out corrections, and thus can analyze the fluid very precisely and thus can receive very precise information, for example, about the gas concentration or a thermal conductivity of the fluid.
Gemäß einem Ausführungsbeispiel kann die Auswerteanordnung ausgelegt sein, um bei der Bestimmung der Information über die Gaskonzentration als Eingangsgrößen einer Drift-Korrektur das Kombinationssignal, eine Information über die Temperatur in einer Umgebung des thermischen Gassensors und eine Information über einen Druck in einer Umgebung des thermischen Gassensors zu verwenden, und um die Information über die Gaskonzentration als Ergebnis der Drift-Korrektur zu erhalten. Die Drift-Korrektur erhält außer den drei genannten Eingangsvariablen beispielsweise keine weiteren Variablen mehr, sondern verwendet beispielsweise nur noch (z. B. zusätzlich) vorher erhaltene - beispielsweise im Rahmen einer Kalibration bestimmte - Konstanten. Somit kann die Auswerteanordnung ausgebildet sein, um mögliche Fehler in der Berechnung der Gaskonzentration, hervorgerufen durch Drift, herauszurechnen und somit eine Drift-Korrektur durchzuführen. Die Drift kann bei unterschiedlichen Temperaturen und Drücken entstehen und so eine Bestimmung der Gaskonzentration verfälschen, was mit diesem Merkmal verhindert werden kann bzw. unterdrückt werden kann. Somit wird ermöglicht mit der Auswerteanordnung sehr genau Informationen über die Gaskonzentration zu bestimmen.According to one exemplary embodiment, the evaluation arrangement can be designed to use the combination signal, information about the temperature in an area surrounding the thermal gas sensor and information about a pressure in an area surrounding the thermal gas sensor as input variables for a drift correction when determining the information about the gas concentration and to get the information about the gas concentration as a result of the drift correction. Apart from the three input variables mentioned, the drift correction does not contain any further variables, for example, but only uses (eg additionally) previously obtained constants, for example those determined in the course of a calibration. The evaluation arrangement can thus be designed to calculate out possible errors in the calculation of the gas concentration caused by drift and thus carry out a drift correction. The drift can occur at different temperatures and pressures and thus falsify a determination of the gas concentration, which can be prevented or suppressed with this feature. It is thus possible to use the evaluation arrangement to determine information about the gas concentration very precisely.
Gemäß einem Ausführungsbeispiel ist die Auswerteanordnung ausgelegt, um das Kombinationssignal, bzw. ein weiteres Kombinationssignal, basierend auf einem Quotienten zwischen einer Amplitudeninformation, die von der Information über die Amplitude des Detektorsignals zumindest des ersten Detektors und optional auch von der Information über die Amplitude des Detektorsignals des zweiten Detektors abhängig ist, und einer Phaseninformation, die von der Information über die erste Phasendifferenz und optional von der Information über die zweite Phasendifferenz abhängig ist, zu erhalten. Ferner kann die Auswerteanordnung ausgelegt sein, um abhängig von dem Kombinationssignal eine Information über eine Konzentration einen Gases, z. B. eines dritten Gases eines Gasgemisches, zu bestimmen. In anderen Worten handelt es sich bei dem Quotienten um ein Verhältnis zwischen der Information über die Amplitude und der Phaseninformation. Gemäß einem Ausführungsbeispiel verschiebt das dritte Gas dieses Verhältnis, wodurch die Auswerteanordnung ausgelegt sein kann, um basierend auf diesem Verhältnis auf die Konzentration der dritten Gaskomponente zu schließen.According to one exemplary embodiment, the evaluation arrangement is designed to calculate the combination signal or a further combination signal based on a quotient between amplitude information which is derived from the information about the amplitude of the detector signal at least from the first detector and optionally also from the information about the amplitude of the detector signal of the second detector and phase information dependent on the information on the first phase difference and optionally on the information on the second phase difference. Furthermore, the evaluation arrangement can be designed to provide information about a concentration of a gas, e.g. B. a third gas of a gas mixture to determine. In other words, the quotient is a ratio between the information about the amplitude and the phase information. According to one exemplary embodiment, the third gas shifts this ratio, as a result of which the evaluation arrangement can be designed to infer the concentration of the third gas component based on this ratio.
Gemäß einem Ausführungsbeispiel ist die Auswerteanordnung ausgelegt, um das Kombinationssignal sigV gemäß ![]()
![]()
Gemäß einem Ausführungsbeispiel ist die Auswerteanordnung ausgelegt, um eine Information darüber zu erhalten, wieviel Wärme von dem Heizer während einer Heizperiode abgeführt wird, und um abhängig von der Information darüber, wieviel Energie von dem Heizer während der Heizperiode abgeführt wird, eine Information über eine Konzentration eines Gases, z. B. eines dritten Gases eines Gasgemisches, zu bestimmen. Unter einer Heizperiode kann ein Zeitabschnitt zwischen einem ersten Nulldurchgang einer Heizspannung bis zu einem zweiten Nulldurchgang der Heizspannung verstanden werden. Alternativ kann unter der Heizperiode auch ein Zeitabschnitt ab einem ersten Zeitpunkt, an dem die Heizspannung von Null Volt zu größer oder kleiner Null Volt wechselt, bis zu einem zweiten Zeitpunkt, an dem die Heizspannung von größer oder kleiner Null Volt zu Null Volt wechselt, verstanden werden. Das Heizsignal kann z. B. ein Sinussignal, ein Cosinussignal, ein Rechtecksignal, ein Dreiecksignal oder ein Sägezahnsignal aufweisen. Die Wärme wird während der Heizperiode an das den Heizer umgebende Gasgemisch abgeführt. Wie viel Wärme von dem Heizer an das umliegende Gas abgeführt wird ist z. B. von einer Wärmeleitfähigkeit des umliegenden Gases, bzw. von einer Wärmeleitfähigkeit von Gaskomponenten des umliegenden Gasgemisches abhängig. Somit kann die Auswerteanordnung ausgelegt sein, um mittels der von dem Heizer abgeführten Wärme eine Wärmeleitfähigkeit des unbekannten Gases oder Gasgemisches zu ermitteln.According to one embodiment, the evaluation arrangement is designed to obtain information about how much heat is dissipated by the heater during a heating period and, depending on the information about how much energy is dissipated by the heater during the heating period, information about a concentration a gas, e.g. B. a third gas of a gas mixture to determine. A heating period can be understood to mean a period of time between a first zero crossing of a heating voltage and a second zero crossing of the heating voltage. Alternatively, the heating period can also be a period of time from a first point in time at which the heating voltage changes from zero volts to greater or less than zero volts to a second point in time at which the heating voltage changes from greater than or less than zero volts to zero volts will. The heating signal can e.g. B. have a sine signal, a cosine signal, a square wave, a triangle signal or a sawtooth signal. During the heating period, the heat is dissipated to the gas mixture surrounding the heater. How much heat is dissipated from the heater to the surrounding gas is z. B. depends on a thermal conductivity of the surrounding gas, or on a thermal conductivity of gas components of the surrounding gas mixture. The evaluation arrangement can thus be designed to determine a thermal conductivity of the unknown gas or gas mixture by means of the heat dissipated by the heater.
Gemäß einem Ausführungsbeispiel ist die Auswerteanordnung ausgelegt, um die Information, wieviel Wärme von dem Heizer während einer Heizperiode abgeführt wird, basierend auf einer Messung eines Stromflusses durch den Heizer bei vorgegebener Heizspannung zu erhalten. In anderen Worten ist während der Heizperiode die an den Heizer angelegte Heizspannung festgelegt und der Stromfluss ändert sich je nach dem wie viel Wärme an das Gas oder Gasgemisch abgegeben wird. Desto mehr Wärme abgegeben wird, desto weniger stark erhöht sich die Temperatur des Heizers und somit unter Voraussetzung eines positiven TKR (Temperaturkoeffizient des Widerstandes) der Wert des Heizerwiderstandes, wodurch der Stromfluss weniger sinkt. Somit kann durch eine Bestimmung des Stromflusses durch den Heizer mittels der Auswerteanordnung auf eine Zusammensetzung des zu analysierenden Gasgemisches geschlossen werden bzw. der Stromfluss als zusätzliche Information von der Auswerteanordnung genutzt werden, um eine Genauigkeit in der Gasanalyse weiter zu verbessern.According to one exemplary embodiment, the evaluation arrangement is designed to obtain the information on how much heat is dissipated by the heater during a heating period, based on a measurement of a current flow through the heater at a predetermined heating voltage. In other words, the heating voltage applied to the heater is fixed during the heating period and the current flow changes depending on how much heat is given off to the gas or gas mixture. The more heat is given off, the less the temperature of the heater increases and thus, assuming a positive TKR (temperature coefficient of resistance), the value of the heater resistance increases, which means that the current flow decreases less. Thus, by determining the current flow through the heater using the evaluation arrangement, conclusions can be drawn about the composition of the gas mixture to be analyzed or the current flow can be used as additional information by the evaluation arrangement in order to further improve accuracy in the gas analysis.
Gemäß einem Ausführungsbeispiel ist die Auswerteanordnung ausgelegt, um den Stromfluss kurz nach einem Einschalten der vorgegebenen Heizspannung und kurz vor einem Ausschalten der vorgegebenen Heizspannung zu erhalten. Aus einer Differenz dieser beiden Stromflussdaten kann die Auswerteanordnung eine Änderung des Stromflusses während der Heizperiode feststellen. Je größer die Differenz, desto geringer ist die Wärmeleitfähigkeit des zu analysierenden Gases oder Gasgemisches. Somit ist die Auswerteanordnung ausgebildet, um die Wärmeleitfähigkeit des Gases oder Gasgemisches z. B. als zusätzlichen Parameter in einer Analyse des Gases oder Gasgemisches zu nutzen. In anderen Worten kann die Auswerteanordnung ausgelegt sein, um die Messung der Wärmeleitfähigkeit als einen weiteren physikalischen Parameter des unbekannten Gasgemisches zu nutzen, indem die Auswerteanordnung z. B. ausgelegt ist, um die Differenz des Heizerstroms in einem Anfangsmaxima kurz nach Einschalten der Heizspannung und kurz vor dem Abschalten der Heizspannung (pro Periode) auszuwerten. Unter kurz nach dem Einschalten der Heizspannung kann ein Zeitpunkt in einer Zeitspanne von 10µs bis 1ms, 100µs bis 800µs oder 300µs bis 500µs, wie z. B. bei 400µs, nach dem Einschalten gemeint sein.According to one exemplary embodiment, the evaluation arrangement is designed to obtain the current flow shortly after the specified heating voltage is switched on and shortly before the specified heating voltage is switched off. The evaluation arrangement can determine a change in the current flow during the heating period from a difference between these two current flow data. The greater the difference, the lower the thermal conductivity of the gas or gas mixture to be analyzed. The evaluation arrangement is thus designed to determine the thermal conductivity of the gas or gas mixture, e.g. B. as an additional parameter in an analysis of the gas or gas mixture. In other words, the evaluation arrangement can be designed to use the measurement of the thermal conductivity as a further physical parameter of the unknown gas mixture, in that the evaluation arrangement z. B. is designed to evaluate the difference in the heater current in an initial maxima shortly after switching on the heating voltage and just before switching off the heating voltage (per period). Shortly after the heating voltage is switched on can be a point in time in a period of 10 μs to 1 ms, 100 μs to 800 μs or 300 μs to 500 μs, such as e.g. B. at 400µs after switching on.
Ein Ausführungsbeispiel schafft ein Verfahren zur Auswertung von Signalen eines thermischen Gassensors mit zumindest einem Heizer und zumindest einem Detektor. Wärme kann beispielsweise von dem Heizer über ein zu analysierendes Gas zu dem Detektor übertragen werden. Das Verfahren kann ein Erhalten einer Information über eine Amplitude eines Detektorsignals eines ersten Detektors (beispielsweise D1.Uss) und einer Information über eine erste Phasendifferenz zwischen einem Heizer-Signal und dem Detektorsignal des ersten Detektors (beispielsweise (D1-Hz).phi) umfassen. Als Zwischengröße abhängig von der Information über die Amplituden des Detektorsignals und abhängig von der Information über die erste Phasendifferenz kann ein Kombinationssignal gebildet werden. Das Kombinationssignal kann beispielsweise eine Amplitudeninformation und eine Phaseninformation zusammenfassen. Eine Information über eine Gaskonzentration oder eine Information über eine Temperaturleitfähigkeit eines Fluids (beispielsweise eines Gases oder Gasgemisches) kann basierend auf dem Kombinationssignal bestimmt werden. Diese Bestimmung kann beispielsweise ohne im weiteren Fortgang der Berechnungen die in das Kombinationssignal einfließenden Einzelinformationen noch einmal separat zu betrachten erfolgen.One embodiment provides a method for evaluating signals from a thermal gas sensor with at least one heater and at least one detector. For example, heat can be transferred from the heater to the detector via a gas to be analyzed. The method can include obtaining information about an amplitude of a detector signal of a first detector (e.g. D1.Uss) and information about a first phase difference between a heater signal and the detector signal of the first detector (e.g. (D1-Hz).phi). A combination signal can be formed as an intermediate variable depending on the information about the amplitude of the detector signal and depending on the information about the first phase difference. The combination signal can, for example, combine amplitude information and phase information. Information about a gas concentration or information about a thermal conductivity of a fluid (for example a gas or gas mixture) can be determined based on the combination signal. This determination can be made, for example, without once again separately considering the individual items of information flowing into the combination signal in the further course of the calculations.
Ein Ausführungsbeispiel schafft ein Verfahren zur Auswertung von Signalen eines thermischen Gassensors mit zumindest einem Heizer und zwei in unterschiedlichen Abständen oder gleichen Abständen von dem Heizer angeordneten Detektoren. Wärme kann beispielsweise von dem Heizer über ein zu analysierendes Gas zu den beiden Detektoren übertragen werden. Das Verfahren kann ein Erhalten einer Information über eine Amplitude eines Detektorsignals eines ersten Detektors (beispielsweise D1.Uss), einer Information über eine Amplitude eines Detektorsignals eines zweiten Detektors (beispielsweise D2.Uss), einer Information über eine erste Phasendifferenz zwischen einem Heizer-Signal und dem Detektorsignal des ersten Detektors (beispielsweise (D1-Hz).phi), und einer Information über eine zweite Phasendifferenz zwischen dem Heizer-Signal und dem Detektorsignal des zweiten Detektors (beispielsweise (D2-Hz).phi) umfassen. Als Zwischengröße abhängig von der Information über die Amplituden der Detektorsignale und abhängig von der Information über die erste Phasendifferenz und abhängig von der Information über die zweite Phasendifferenz kann ein Kombinationssignal gebildet werden. Das Kombinationssignal kann beispielsweise eine Amplitudeninformation und eine Phaseninformation zusammenfassen. Eine Information über eine Gaskonzentration oder eine Information über eine Temperaturleitfähigkeit eines Fluids (beispielsweise eines Gases oder Gasgemisches) kann basierend auf dem Kombinationssignal bestimmt werden. Diese Bestimmung kann beispielsweise ohne im weiteren Fortgang der Berechnungen die in das Kombinationssignal einfließenden Einzelinformationen noch einmal separat zu betrachten erfolgen.One embodiment creates a method for evaluating signals from a thermal gas sensor with at least one heater and two detectors arranged at different distances or the same distances from the heater. For example, heat can be transferred from the heater to the two detectors via a gas to be analyzed. The method may include obtaining information about an amplitude of a detector signal of a first detector (e.g. D1.Uss), information about an amplitude of a detector signal of a second detector (e.g. D2.Uss), information about a first phase difference between a heater signal and the detector signal of the first detector (e.g. (D1-Hz).phi), and information about a second phase difference between the heater signal and the detector signal of the second detector (e.g. (D2-Hz).phi). A combination signal can be formed as an intermediate variable depending on the information about the amplitudes of the detector signals and depending on the information about the first phase difference and depending on the information about the second phase difference. The combination signal can, for example, combine amplitude information and phase information. Information about a gas concentration or information about a thermal conductivity of a fluid (for example a gas or gas mixture) can be determined based on the combination signal. This determination can be made, for example, without once again separately considering the individual items of information flowing into the combination signal in the further course of the calculations.
Ein Ausführungsbeispiel betrifft ein Computerprogramm mit einem Programmcode zur Durchführung eines Verfahrens, wenn das Programm auf einem Computer abläuft.An embodiment relates to a computer program with a program code for carrying out a method when the program runs on a computer.
Alle hierin erläuterten Beispiele, die nicht alle Merkmale, oder Äquivalente derselben, eines der unabhängigen Ansprüche aufweisen, dienen dazu das Verständnis der Erfindung zu erleichtern.Any examples presented herein that do not have all the features, or equivalents thereof, of any of the independent claims are intended to facilitate understanding of the invention.
Ausführungsbeispiele gemäß der vorliegenden Erfindung werden nachfolgend Bezug nehmend auf die beiliegenden Figuren näher erläutert. Hinsichtlich der dargestellten schematischen Figuren wird darauf hingewiesen, dass die dargestellten Funktionsblöcke sowohl als Elemente oder Merkmale der erfindungsgemäßen Vorrichtung als auch als entsprechende Verfahrensschritte des erfindungsgemäßen Verfahrens zu verstehen sind, und auch entsprechende Verfahrensschritte des erfindungsgemäßen Verfahrens davon abgeleitet werden können. Es zeigen:
- Fig. 1a
- eine schematische Darstellung eines Gassensors gemäß einem Ausführungsbeispiel der vorliegenden Erfindung;
- Fig. 1b
- eine schematische Darstellung einer Auswerteanordnung für einen thermischen Gassensor gemäß einem Ausführungsbeispiel der vorliegenden Erfindung;
- Fig. 1c
- eine schematische Darstellung einer beispielhaften Auswerteanordnung für einen thermischen Gassensor mit einer Regelung einer Heizleistung;
- Fig. 1d
- eine schematische Darstellung einer beispielhaften Auswerteanordnung für einen thermischen Gassensor mit einer Abtastung eines Sensorsignals zu drei Zeitpunkten;
- Fig. 2a
- eine schematische Darstellung eines Gassensors am Lichtmikroskop gemäß einem Ausführungsbeispiel der vorliegenden Erfindung;
- Fig. 2b
- eine schematische Darstellung eines Gassensors im Raster-ElektronenMikroskop gemäß einem Ausführungsbeispiel der vorliegenden Erfindung;
- Fig. 3
- eine schematische Darstellung eines Ausschnittes einer Raster-ElektronenMikroskopie Aufnahme einer Mikro-Brücke für einen Gassensor gemäß einem Ausführungsbeispiel der vorliegenden Erfindung;
- Fig. 4
- eine schematische Darstellung eines Gassensors mit einer ersten Unterbrechung mit einer Ausdehnung senkrecht zu einem Heizer, unterschiedlich von einer Ausdehnung senkrecht zu einem Heizer einer zweiten Unterbrechung gemäß einem Ausführungsbeispiel der vorliegenden Erfindung;
- Fig. 5
- eine schematische Darstellung eines Gassensors mit einem ersten Unterbrechungsbereich sowie einem zweiten Unterbrechungsbereich, mit einer Mehrzahl an Unterbrechungen gemäß einem Ausführungsbeispiel der vorliegenden Erfindung;
- Fig. 6a
- eine schematische Darstellung eines Gassensors mit gleich vielen Unterbrechungen sowohl in einem ersten Unterbrechungsbereich als auch in einem zweiten Unterbrechungsbereich gemäß einem Ausführungsbeispiel der vorliegenden Erfindung;
- Fig. 6b
- eine schematische Darstellung eines Gassensors mit einer Vielzahl an Unterbrechungen in einem ersten Unterbrechungsbereich und einer einzigen Unterbrechung in einem zweiten Unterbrechungsbereich gemäß einem Ausführungsbeispiel der vorliegenden Erfindung;
- Fig. 6c
- eine schematische Darstellung eines Gassensors, wobei eine Vielzahl an Unterbrechungen in einem ersten Unterbrechungsbereich eine andere Ausdehnung senkrecht zu einem Heizer aufweisen als eine Vielzahl an Unterbrechungen in einem zweiten Unterbrechungsbereich gemäß einem Ausführungsbeispiel der vorliegenden Erfindung;
- Fig. 7
- eine schematische Darstellung eines Prinzips eines Gassensors gemäß einem Ausführungsbeispiel der vorliegenden Erfindung;
- Fig. 8
- eine schematische Darstellung eines Wärmetransports an einem Gassensor gemäß einem Ausführungsbeispiel der vorliegenden Erfindung;
- Fig. 9
- ein Diagramm eines beispielhaften Heizer-Signals, eines ersten Sensorsignals und eines zweiten Sensorsignals eines Gassensors;
- Fig. 10
- eine schematische Darstellung einer beispielhaften Heizer-Ansteuerung für einen Gassensor;
- Fig. 11
- eine schematische Darstellung einer beispielhaften Schaltung zur Auswertung eines Sensorsignals eines Gassensors;
- Fig. 12
- eine schematische Darstellung einer beispielhaften Regelung eines Gassensors;
- Fig.
- 13a ein Blockdiagramm eines beispielhaften Verfahrens zur Analyse eines Sensorsignals eines Gassensors;
- Fig.
- 13b ein Blockdiagramm eines beispielhaften Verfahrens zur Auswertung eines Sensorsignals eines Gassensors mit einer Nachführung von Abtastzeitpunkten;
- Fig. 14
- ein Diagramm einer Phasenverschiebung zwischen einem Heizer-Signal und zwei Sensorsignalen eines Gassensors gemäß einem Ausführungsbeispiel der vorliegenden Erfindung;
- Fig. 15
- ein Diagramm von Amplituden von zumindest einem Sensorsignal eines Gassensors gemäß einem Ausführungsbeispiel der vorliegenden Erfindung;
- Fig. 16
- ein Diagramm von Phasenverschiebungen zwischen einem ersten Sensorsignal und einem zweiten Sensorsignal eines Gassensors abhängig von einem Druck gemäß einem Ausführungsbeispiel der vorliegenden Erfindung;
- Fig. 17a
- ein Diagramm einer Phasenverschiebung eines Sensorsignals eines Gassensors in Abhängigkeit von einer Frequenz gemäß einem Ausführungsbeispiel der vorliegenden Erfindung;
- Fig.
- 17b ein Diagramm einer Amplitude eines Sensorsignals eines Gassensors in Abhängigkeit einer Frequenz gemäß einem Ausführungsbeispiel der vorliegenden Erfindung;
- Fig. 18
- ein Diagramm von Phasenverschiebungen eines ersten Sensorsignals, eines zweiten Sensorsignals und eines Heizer-Signals eines Gassensors in Abhängigkeit einer Stickstoffkonzentration gemäß einem Ausführungsbeispiel der vorliegenden Erfindung;
- Fig. 19
- ein Diagramm einer Amplitude eines ersten Sensorsignals und eines zweiten Sensorsignals eines Gassensors in Abhängigkeit einer Stickstoffkonzentration gemäß einem Ausführungsbeispiel der vorliegenden Erfindung;
- Fig. 20
- ein Diagramm eines Kombinationssignals eines Gassensors für verschiedene Gasgemische gemäß einem Ausführungsbeispiel der vorliegenden Erfindung;
- Fig. 21
- ein Diagramm eines Kombinationssignals eines Gassensors in Abhängigkeit einer CO2-Konzentration gemäß einem Ausführungsbeispiel der vorliegenden Erfindung;
- Fig. 22
- ein Diagramm eines Kombinationssignals eines Gassensors in Abhängigkeit eines Drucks gemäß einem Ausführungsbeispiel der vorliegenden Erfindung;
- Fig. 23
- ein Diagramm eines Zusammenhangs zwischen einem Gasdruck und einer Gastemperatur für einen Gassensor gemäß einem Ausführungsbeispiel der vorliegenden Erfindung;
- Fig. 24
- ein Blockdiagramm eines Verfahrens zur Erzeugung eines Kombinationssignals eines Gassensors gemäß einem Ausführungsbeispiel der vorliegenden Erfindung;
- Fig. 25
- ein Diagramm einer Temperaturleitfähigkeit in Abhängigkeit eines Kombinationssignals eines Gassensors gemäß einem Ausführungsbeispiel der vorliegenden Erfindung;
- Fig. 26
- ein Diagramm eines beispielhaften Stromflusses in einem Heizer während einer Heizperiode für ein erstes Gasgemisch;
- Fig. 27
- ein Diagramm eines beispielhaften Stromflusses in einem Heizer während einer Heizperiode für ein zweites Gasgemisch;
- Fig. 28
- ein Diagramm eines beispielhaften Stromflusses in einem Heizer während einer Heizperiode für ein drittes Gasgemisch;
- Fig. 29
- ein Diagramm unterschiedlicher Phaseninformationen für jeweils unterschiedliche Gasgemische gemäß einem Ausführungsbeispiel der vorliegenden Erfindung;
- Fig. 30
- ein Diagramm unterschiedlicher Amplitudeninformationen für jeweils unterschiedliche Gasgemische gemäß einem Ausführungsbeispiel der vorliegenden Erfindung; und
- Fig. 31
- ein Diagramm eines Kombinationssignals für unterschiedliche Gasgemische gemäß einem Ausführungsbeispiel der vorliegenden Erfindung.
- Fig. 1a
- a schematic representation of a gas sensor according to an embodiment of the present invention;
- Fig. 1b
- a schematic representation of an evaluation arrangement for a thermal gas sensor according to an embodiment of the present invention;
- 1c
- a schematic representation of an exemplary evaluation arrangement for a thermal gas sensor with a regulation of a heating output;
- Fig. 1d
- a schematic representation of an exemplary evaluation arrangement for a thermal gas sensor with a sampling of a sensor signal at three points in time;
- Figure 2a
- a schematic representation of a gas sensor on the light microscope according to an embodiment of the present invention;
- Figure 2b
- a schematic representation of a gas sensor in the scanning electron microscope according to an embodiment of the present invention;
- 3
- a schematic representation of a section of a scanning electron microscopy recording of a micro-bridge for a gas sensor according to an embodiment of the present invention;
- 4
- FIG. 12 is a schematic representation of a gas sensor having a first break with an extent perpendicular to a heater different from an extent perpendicular to a heater of a second break according to an embodiment of the present invention;
- figure 5
- a schematic representation of a gas sensor with a first interruption area and a second interruption area, with a plurality of interruptions according to an embodiment of the present invention;
- Figure 6a
- a schematic representation of a gas sensor with the same number of interruptions both in a first interruption area and in a second interruption area according to an embodiment of the present invention;
- Figure 6b
- a schematic representation of a gas sensor with a plurality of interruptions in a first interruption area and a single interruption in a second interruption area according to an embodiment of the present invention;
- Figure 6c
- a schematic representation of a gas sensor, wherein a plurality of interruptions in a first interruption area have a different extent perpendicular to a heater than a plurality of interruptions in a second interruption area according to an embodiment of the present invention;
- 7
- a schematic representation of a principle of a gas sensor according to an embodiment of the present invention;
- 8
- a schematic representation of a heat transport at a gas sensor according to an embodiment of the present invention;
- 9
- a diagram of an exemplary heater signal, a first sensor signal and a second sensor signal of a gas sensor;
- 10
- a schematic representation of an exemplary heater control for a gas sensor;
- 11
- a schematic representation of an exemplary circuit for evaluating a sensor signal of a gas sensor;
- 12
- a schematic representation of an exemplary regulation of a gas sensor;
- figure
- 13a shows a block diagram of an exemplary method for analyzing a sensor signal of a gas sensor;
- figure
- 13b shows a block diagram of an exemplary method for evaluating a sensor signal of a gas sensor with tracking of sampling times;
- 14
- a diagram of a phase shift between a heater signal and two sensor signals of a gas sensor according to an embodiment of the present invention;
- 15
- a diagram of amplitudes of at least one sensor signal of a gas sensor according to an embodiment of the present invention;
- 16
- a diagram of phase shifts between a first sensor signal and a second sensor signal of a gas sensor depending on a pressure according to an embodiment of the present invention;
- Figure 17a
- a diagram of a phase shift of a sensor signal of a gas sensor depending on a frequency according to an embodiment of the present invention;
- figure
- 17b shows a diagram of an amplitude of a sensor signal of a gas sensor as a function of a frequency according to an embodiment of the present invention;
- 18
- a diagram of phase shifts of a first sensor signal, a second sensor signal and a heater signal of a gas sensor as a function of a nitrogen concentration according to an embodiment of the present invention;
- 19
- a diagram of an amplitude of a first sensor signal and a second sensor signal of a gas sensor as a function of a nitrogen concentration according to an exemplary embodiment of the present invention;
- 20
- a diagram of a combination signal of a gas sensor for different gas mixtures according to an embodiment of the present invention;
- 21
- a diagram of a combination signal of a gas sensor as a function of a CO 2 concentration according to an exemplary embodiment of the present invention;
- 22
- a diagram of a combination signal of a gas sensor depending on a pressure according to an embodiment of the present invention;
- 23
- a diagram of a relationship between a gas pressure and a gas temperature for a gas sensor according to an embodiment of the present invention;
- 24
- a block diagram of a method for generating a combination signal of a gas sensor according to an embodiment of the present invention;
- 25
- a diagram of a thermal conductivity depending on a combination signal of a gas sensor according to an embodiment of the present invention;
- 26
- a diagram of an exemplary current flow in a heater during a heating period for a first gas mixture;
- 27
- a diagram of an exemplary current flow in a heater during a heating period for a second gas mixture;
- 28
- a diagram of an exemplary current flow in a heater during a heating period for a third gas mixture;
- 29
- a diagram of different phase information for respectively different gas mixtures according to an embodiment of the present invention;
- 30
- a diagram of different amplitude information for respectively different gas mixtures according to an embodiment of the present invention; and
- 31
- a diagram of a combination signal for different gas mixtures according to an embodiment of the present invention.
Bevor nachfolgend Ausführungsbeispiele der vorliegenden Erfindung im Detail anhand der Zeichnungen näher erläutert werden, wird darauf hingewiesen, dass identische, funktionsgleiche oder gleichwirkende Elemente, Objekte und/oder Strukturen in den unterschiedlichen Figuren mit den gleichen oder ähnlichen Bezugszeichen versehen sind, so dass die in unterschiedlichen Ausführungsbeispielen dargestellte Beschreibung dieser Elemente untereinander austauschbar ist bzw. aufeinander angewendet werden kann.Before exemplary embodiments of the present invention are explained in more detail below with reference to the drawings, it is pointed out that identical, functionally identical or equivalent elements, objects and/or structures in the different figures are provided with the same or similar reference symbols, so that the Embodiments illustrated description of these elements is interchangeable or can be applied to each other.
Bei der Membran 110 kann es sich um eine Dünnschichtmembran mit einer Dicke zwischen 200 nm und 4000 nm, 300 nm und 3000 nm, 400 nm und 2000 nm oder zwischen 1 µm und 10 µm handeln. Gemäß einem Ausführungsbeispiel liegt die Dicke der Gesamt-Membran bei ca. 2µm (sie besteht z. B. aus mehreren Membran-, Sensor- und Passivierungs-Schichten). Die Membranschicht kann z. B. Si-Oxid und/oder Si-Nitrid aufweisen. Als Dicke kann eine Ausdehnung der Membran 110 in die Blattebene hinein, also beispielsweise senkrecht zu einer Oberfläche der Membran 110, auf der das Heizelement 120, die erste Thermoelement-Struktur 130 und die zweite Thermoelement-Struktur 140 angeordnet sind, definiert sein. Die Membran 110 kann leitendes Material, isolierendes Material oder Halbleitermaterial aufweisen, wobei das Material eine sehr geringe Wärmeleitfähigkeit, von beispielsweise unter 5W/(m*K), unter 100 mW/(m*K) oder unter 50 mW/(m*K), aufweisen kann. So kann beispielsweise ein Halbleiter mit angepasster Grunddotierung in einem einfachen Fünfmasken-MEMS-Prozess als kostengünstiges Substrat für die Herstellung der Membran 110 dienen.The
Gemäß einem Ausführungsbeispiel kann das Heizelement 120 (das Heizelement 120 kann im Folgenden auch als Heizer bezeichnet werden) eine freitragende Brückenstruktur bilden und/oder einen Draht umfassen. Gemäß einem Ausführungsbeispiel kann das Heizelement 120 von einer Seite des Rahmens 150 zu einer gegenüberliegenden Seite des Rahmens 150 aufgespannt sein. An das Heizelement 120 kann beispielsweise eine Spannung angelegt sein, wodurch das Heizelement 120 Heizleistung an ein zu analysierendes Gas, befindlich beispielsweise in dem ersten Unterbrechungsbereich 162 und/oder in dem zweiten Unterbrechungsbereich 172, übertragen kann. Die an das Heizelement 120 angelegte Spannung kann beispielsweise ein periodisches Spannungssignal sein, wie z. B. ein Sinussignal oder ein periodisches Rechtecksignal. Somit kann das Heizelement 120 beispielsweise ein periodisches Heizer-Signal (beispielsweise die Heizleistung) bereitstellen. Das Heizer-Signal kann beispielsweise über die Membran 110 und/oder über ein Gas, befindlich beispielsweise in der ersten Unterbrechung 162 oder der zweiten Unterbrechung 172, zu der ersten Thermoelement-Struktur 130 und/oder der zweiten Thermoelement-Struktur 140 übertragen werden.According to an exemplary embodiment, the heating element 120 (the
Die erste Thermoelement-Struktur 130 und/oder die zweite Thermoelement-Struktur 140 sind beispielsweise mäanderförmig ausgebildet, was beispielsweise in Reihe geschalteten Thermoelementen entsprechen kann, die eine Thermokette bilden. Die erste Thermoelement-Struktur 130 und/oder die zweite Thermoelement-Struktur 140 können somit als Detektor dienen, wobei die erste Thermoelement-Struktur 130 und/oder die zweite Thermoelement-Struktur 140 beispielsweise das Heizer-Signal detektieren können.The
Gemäß einem Ausführungsbeispiel können die erste Thermoelement-Struktur 130 und/oder die zweite Thermoelement-Struktur 140 komplett auf der Membran 110 angeordnet sein, oder zumindest teilweise auf der Membran 110 und zumindest teilweise auf dem Rahmen 150 angeordnet sein. So kann beispielsweise eine Temperatur des Rahmens 150 als Vergleichstemperatur dienen (hier können beispielsweise die kalten Enden 134 der ersten Thermoelement-Struktur 130 angeordnet sein und/oder die kalten Enden 144 der zweiten Thermoelement-Struktur 140) und der Teil der Thermoelement-Struktur, der auf der Membran 110 angeordnet ist (z. B. die heißen Enden 132, 142) kann eine Messtemperatur (z. B. das Heizer-Signal) detektieren. Die heißen Enden 132, 142 und die kalten Enden 134, 144 sind beispielsweise mit einem Leiter verbunden. So kann beispielsweise ein Leiter, umfassend ein erstes Material, ein erstes kaltes Ende mit einem ersten heißen Ende verbinden und ein zweiter Leiter, umfassend ein zweites Material, kann das erste heiße Ende mit einem zweiten kalten Ende verbinden. Diese Verbindung eines ersten Leiters und eines zweiten Leiters kann ein Thermoelement darstellen, das beispielsweise in Reihe zu einer Thermokette geschaltet werden kann und somit beispielsweise die erste Thermoelement-Struktur 130 oder die zweite Thermoelement-Struktur 140 darstellen kann. Entlang dieser Leiter kann somit beispielsweise eine Temperaturdifferenz (z. B. zwischen der Vergleichstemperatur und der Messtemperatur) auftreten, wodurch beispielsweise eine elektrische Spannung an den Enden (z. B. den heißen Enden und/oder den kalten Enden) der metallischen Leiter induziert werden kann. Somit können die erste Thermoelement-Struktur 130 und/oder die zweite Thermoelement-Struktur 140 beispielsweise ausgebildet sein, um Wärme in elektrische Energie umzuwandeln. Gemäß einem Ausführungsbeispiel kann es sich bei der ersten Thermoelement-Struktur 130 und/oder der zweiten Thermoelement-Struktur 140 um einen Draht oder eine freitragende Brückenstruktur handeln.According to an exemplary embodiment, the
Gemäß einem Ausführungsbeispiel kann die Membran 110 durch den Rahmen 150 aus Trägermaterial aufgespannt sein, das so ausgelegt ist, dass der Temperaturausdehnungskoeffizient und/oder eine Wärmeleitfähigkeit von Membranmaterial von dem Temperaturausdehnungskoeffizient und/oder der Wärmeleitfähigkeit des Trägermaterials abweicht. Der Rahmen 150 kann Trägermaterial oder Substratmaterial aufweisen, mit dem die Membran 110 beispielsweise getragen werden kann. Somit kann beispielsweise an dem Rahmen 150 eine Vergleichstemperatur eingestellt werden. Gemäß einem Ausführungsbeispiel können der Rahmen 150 und die Membran 110 auch denselben Temperaturausdehnungskoeffizienten aufweisen.According to an exemplary embodiment, the
Gemäß einem Ausführungsbeispiel kann die Membran 110 eine geringere Wärmeleitfähigkeit aufweisen als der Rahmen 150. Hierbei sollte insbesondere die Membran 110 beispielsweise eine sehr geringe Wärmeleitfähigkeit aufweisen, damit beispielsweise das Heizer-Signal von dem Heizelement 120 hauptsächlich über das zu analysierende Gas (angeordnet beispielsweise in der ersten Unterbrechung 162 und/oder in der zweiten Unterbrechung 172) zu der ersten Thermoelement-Struktur 130 und/oder der zweiten Thermoelement-Struktur 140, übertragen wird, anstelle über die Membran 110. Somit kann beispielsweise ein Wärmetransport über die Membran 110 unterdrückt, reduziert oder verlangsamt werden.According to one embodiment, the
Die Membran 110 kann somit ausgebildet sein, um parasitäre Wärmeleitung von dem Heizelement 120 zu der ersten Thermoelement-Struktur 130 bzw. zu der zweiten Thermoelement-Struktur 140 zu unterdrücken. So kann die Wärmeleitfähigkeit der Membran 110 beispielsweise so gewählt sein, dass kaum bis keine Wärme von dem Heizelement 120 über die Membran 110 an die erste Thermoelement-Struktur 130 bzw. die zweite Thermoelement-Struktur 140 geleitet wird und ein Großteil der Wärme bzw. die komplette Wärme über das zu analysierende Gas geleitet wird.The
Hingegen kann die Wärmeleitfähigkeit des Trägermaterials des Rahmens 150, der die Membran 110 hält, sehr hoch sein. So kann als Trägermaterial z. B. Silizium mit einer Wärmeleitfähigkeit von 150 W/(m*K) verwendet werden. Das Trägermaterial kann somit als Wärmesenke dienen. So ist beispielsweise die erste Thermoelement-Struktur 130 bzw. die zweite Thermoelement-Struktur 140 zumindest teilweise, z. B. mit den heißen Enden 132, 142, auf der Membran und zumindest teilweise, z. B. mit den kalten Enden 134, 144, auf dem Trägermaterial angeordnet, wodurch innerhalb der ersten Thermoelement-Struktur 130 bzw. der zweiten Thermoelement-Struktur 140 eine Temperaturdifferenz auftreten kann, mithilfe derer der Wärmetransport von dem Heizelement 120 zu der jeweiligen Thermoelement-Struktur 130, 140 detektiert werden kann.On the other hand, the thermal conductivity of the carrier material of the
Gemäß einem Ausführungsbeispiel können somit die kalten Enden der ersten Thermoelement-Struktur 130 und die kalten Enden der zweiten Thermoelement-Struktur 140 auf dem Trägermaterial des Rahmens 150 angeordnet sein. Sie befinden sich beispielsweise dort, wo die Membran 110 durch das Trägermaterial getragen wird.According to one embodiment, the cold ends of the
Gemäß einem Ausführungsbeispiel kann der erste Unterbrechungsbereich 160 der Membran 110 eine durchgehende Unterbrechung 162 aufweisen, deren Längsausdehnung 164 so groß ist, dass sie den Bereich zwischen der ersten Thermoelement-Struktur 130 und dem Heizelement 120 vollständig abdeckt. Der zweite Unterbrechungsbereich 170 der Membran 110 kann eine durchgehende Unterbrechung 172 aufweisen, deren Längsausdehnung 174 so groß ist, dass sie den Bereich zwischen der zweiten Thermoelement-Struktur 140 und dem Heizelement 120 vollständig abdeckt. Somit ist die Längsausdehnung 164, 174 beispielsweise so groß wie die komplette Länge des Heizelements 120 und/oder mindestens so lang wie die komplette Länge der ersten Thermoelement-Struktur 130 und/oder der zweiten Thermoelement-Struktur 140. Somit wird ermöglicht, dass möglichst wenig Wärme von dem Heizelement 120 zu der ersten Thermoelement-Struktur 130 oder der zweiten Thermoelement-Struktur 140 über die Membran 110 übertragen wird, sondern ein Großteil über ein Gas in der ersten Unterbrechung 162 in dem ersten Unterbrechungsbereich 160 und/oder in der zweiten Unterbrechung 172 in dem zweiten Unterbrechungsbereich 170.According to an exemplary embodiment, the
Gemäß einem Ausführungsbeispiel kann die Querausdehnung 166 der zumindest einen Unterbrechung 162 des ersten Unterbrechungsbereichs 160 unterschiedlich zu der Querausdehnung 176 der zumindest einen Unterbrechung 172 des zweiten Unterbrechungsbereichs 170 sein. Die Querausdehnung 166, 176 der ersten Unterbrechung 162 bzw. der zweiten Unterbrechung 172 kann beispielsweise in einer Richtung senkrecht zu einer Richtung maximaler Ausdehnung des Heizelements 120 bzw. in einer Richtung von dem Heizelement 120 zu den jeweiligen Thermoelement-Strukturen (z. B. der ersten Thermoelement-Struktur 130 und/oder der zweiten Thermoelement-Struktur 140) ausgerichtet sein. Gemäß
Gemäß einem Ausführungsbeispiel kann die erste Unterbrechung 162 eine Längsausdehnung 164 und eine Querausdehnung 166 aufweisen, so dass die erste Unterbrechung 162 den Ausdehnungen des ersten Unterbrechungsbereichs 160 entspricht. Genauso kann die zweite Unterbrechung 172 beispielsweise eine Längsausdehnung 174 und eine Querausdehnung 176 aufweisen, so dass die zweite Unterbrechung 172 den Ausdehnungen des zweiten Unterbrechungsbereichs 170 entspricht. Somit kann beispielsweise der komplette erste Unterbrechungsbereich 160 die erste Unterbrechung 162 darstellen und der komplette Unterbrechungsbereich 170 die Unterbrechung 172.According to one embodiment, the
Optional kann die Membran 110 aufseiten der kalten Enden 134, 144 der ersten Thermoelement-Struktur 130 und/oder der zweiten Thermoelement-Struktur 140 einen dritten und/oder einen vierten Unterbrechungsbereich aufweisen. Somit kann beispielsweise die erste Thermoelement-Struktur 130 in Form eines Drahtes oder einer freitragenden Brückenstruktur zwischen dem ersten Unterbrechungsbereich 160 und einem dritten Unterbrechungsbereich angeordnet sein bzw. die zweite Thermoelement-Struktur 140 kann beispielsweise als Draht oder als freitragende Brückenstruktur zwischen dem zweiten Unterbrechungsbereich 170 und dem vierten Unterbrechungsbereich angeordnet sein. Somit können die erste Thermoelement-Struktur 130 und/oder die zweite Thermoelement-Struktur 140 beispielsweise von zwei Seiten mit dem zu analysierenden Gas umgeben sein.Optionally, the
Gemäß einem Ausführungsbeispiel kann die erste Thermoelement-Struktur 130 einen anderen Abstand zu dem Heizelement 120 aufweisen, als die zweite Thermoelement-Struktur 140. In
Das erste Sensorsignal und/oder das zweite Sensorsignal können beispielsweise die zwei unbekannten Wärmeübergänge (z. B.: Heizelement -> Gas, Gas -> Thermoelement-Struktur) und einen Wärmeübertrag über das zu analysierende Gas aufweisen. Ist die erste Thermoelement-Struktur 130 von dem Heizelement 120 anders beabstandet als die zweite Thermoelement-Struktur 140, so kann beispielsweise aus dem ersten Sensorsignal und dem zweiten Sensorsignal ein Differenzsignal von dem Gassensor erstellt werden, indem beispielsweise die unbekannten Wärmeübergänge (das erste Sensorsignal kann dieselben Wärmeübergänge wie das zweite Sensorsignal aufweisen) herausgerechnet sein können und somit das Differenzsignal nur oder zu einem großen Anteil den Wärmeübertrag über das zu analysierende Gas von dem Heizelement 120 zu der jeweiligen Thermoelement-Struktur 130, 140 aufweist, aber nicht oder zu einem sehr geringen Anteil die unbekannten Wärmeübergänge aufweist.The first sensor signal and/or the second sensor signal can have, for example, the two unknown heat transfers (e.g.: heating element -> gas, gas -> thermocouple structure) and a heat transfer via the gas to be analyzed. If the
Gemäß einem Ausführungsbeispiel können der erste Unterbrechungsbereich 160 und der zweite Unterbrechungsbereich 170 mehrere Unterbrechungen (z. B. die Unterbrechung 162 und die Unterbrechung 1621 oder die Unterbrechung 172 und die Unterbrechung 1721) aufweisen, die so angeordnet sein können, dass (beispielsweise durch das verbliebene Membranmaterial 110) eine Gitterstruktur (beispielsweise in dem ersten Unterbrechungsbereich 160 oder dem zweiten Unterbrechungsbereich 170) entsteht, bei der die Unterbrechungen in Reihen parallel zu dem Heizelement 120 angeordnet sind und die Reihen gegeneinander versetzt angeordnet sind. Dabei können sich die Unterbrechungen in einem Unterbrechungsbereich 160, 170 sowohl in der Längsausdehnung 164, 174 als auch in der Querausdehnung 166, 176 voneinander unterscheiden. Gemäß
Gemäß einem Ausführungsbeispiel können der erste Unterbrechungsbereich 160 und der zweite Unterbrechungsbereich 170 mehrere Unterbrechungen aufweisen, die so angeordnet sein können, dass eine Gitterstruktur entsteht, bei der ein Weg einer Wärmeleitung durch die Membran 110 länger ist als ein direkter Weg 122a, 122b. Der direkte Weg 122a, 122b kann beispielsweise ein gerader Weg senkrecht zu dem Heizelement 120, von dem Heizelement 120 zu der Thermoelement-Struktur 130, 140 sein. Der direkte Weg 122a, 122b kann dabei durch die Unterbrechungen 162 und 1621 bzw. durch die Unterbrechungen 172 und 1721 verlaufen, wodurch eine Wärmeleitung durch das zu analysierende Gas von der ersten Thermoelement-Struktur 130 und/oder der zweiten Thermoelement-Struktur 140 erfasst werden kann. Würde der direkte Weg 122a, 122b hingegen nur über die Membran 110 und nicht über das zu analysierende Gas erfolgen, so kann der Gassensor 100 keine aussagekräftige Analyse des Gases gewährleisten.According to one embodiment, the
Gemäß einem Ausführungsbeispiel kann die zumindest eine Unterbrechung 162, 172 in dem ersten Unterbrechungsbereich 160 und in dem zweiten Unterbrechungsbereich 170 rechteckige Ausschnitte mit optional abgerundeten Ecken bilden. Es handelt sich hierbei beispielsweise um ein Langloch. Es kann sich hierbei beispielsweise auch um ovale Löcher handeln. Auch wenn in
Gemäß einem Ausführungsbeispiel kann die zumindest eine Unterbrechung 162, 172 mindestens dreimal länger als breit sein. Somit kann beispielsweise die Längsausdehnung 164 der Unterbrechung 162 dreimal länger als die Querausdehnung 166 sein bzw. die Längsausdehnung 174 der Unterbrechung 172 kann dreimal länger als die Querausdehnung 176 sein. Somit stellt die Länge beispielsweise die Längsausdehnung 164, 174 und die Breite beispielsweise die Querausdehnung 166, 176 dar. Die Länge kann beispielsweise definiert sein, als eine Richtung parallel zu dem Heizelement 120 (bzw. zu einer Richtung maximaler Ausdehnung des Heizelements 120) und die Breite kann definiert sein als eine Richtung senkrecht zu dem Heizelement 120 (bzw. zu einer Richtung maximaler Ausdehnung des Heizelements 120).According to one embodiment, the at least one
Gemäß einem Ausführungsbeispiel können ein Abstand 168 zwischen mehreren Unterbrechungen 162, 1621 in dem ersten Unterbrechungsbereich 160 und ein Abstand 178 zwischen mehreren Unterbrechungen 172, 1721 in dem zweiten Unterbrechungsbereich 170 der kleinsten zu realisierenden Strukturbreite, die eine mechanisch haltbare Gitterstruktur ergibt, entsprechen. Der Abstand 168, 178 kann eine Breite von Stegen, zwischen zwei Unterbrechungen, bestehend aus Membranmaterial der Membran 110, definieren. Je geringer der Abstand 168, 178 ist, desto weniger Wärme wird über die Membran 110 von dem Heizelement 120 zu der ersten Thermoelement-Struktur 130 und/oder der zweiten Thermoelement-Struktur 140 übertragen und desto mehr Wärme wird über das zu analysierende Gas übertragen.According to one embodiment, a
Gemäß einem Ausführungsbeispiel können die erste Thermoelement-Struktur 130 und die zweite Thermoelement-Struktur 140 mit einer Schutzschicht passiviert sein. Die Schutzschicht kann die erste Thermoelement-Struktur 130 sowie die zweite Thermoelement-Struktur 140 vor Beschädigungen durch das zu analysierende Gas schützen und somit mögliche Ungenauigkeiten des Gassensors bei der Gasanalyse durch Beschädigungen der ersten Thermoelement-Struktur 130 bzw. der zweiten Thermoelement-Struktur 140 vermeiden.According to an embodiment, the
Gemäß einem Ausführungsbeispiel können das heiße Ende 132 der ersten Thermoelement-Struktur bis zu einem Rand des ersten Unterbrechungsbereichs 160 der Membran 110 reichen und das heiße Ende 142 der zweiten Thermoelement-Struktur 140 bis zu einem Rand des zweiten Unterbrechungsbereichs 170 der Membran 110 reichen. Der Abstand zwischen dem heißen Ende 132 und dem ersten Unterbrechungsbereich 160 bzw. der Abstand zwischen dem heißen Ende 142 und dem zweiten Unterbrechungsbereich 170 sollte beispielsweise nicht größer als 0,5 mm, 100 nm oder 10 µm betragen. Reicht beispielsweise die Unterbrechung 162 bzw. die Unterbrechung 142 bis zu diesem Rand heran, so weist die Membran 110 nur einen sehr geringen Abstand zwischen den jeweiligen heißen Enden und der jeweiligen Unterbrechung auf. Dadurch kann ermöglicht werden, dass das Membranmaterial der Membran 110 eine Detektion des Heizer-Signals durch die erste Thermoelement-Struktur 130 bzw. durch die zweite Thermoelement-Struktur 140 nicht oder nur geringfügig beeinträchtigt, wodurch der Gassensor 100 sehr genau das Gas analysieren kann.According to one embodiment, the
Gemäß einem Ausführungsbeispiel kann die Information 210 sowohl die Amplitude des Detektorsignals des ersten Detektors 130 als auch die erste Phasendifferenz zwischen dem Heizer-Signal und dem Detektorsignal des ersten Detektors 130 umfassen, genauso wie die Information 220 sowohl die Amplitude des Detektorsignals des zweiten Detektors 140 als auch die zweite Phasendifferenz zwischen dem Heizer-Signal und dem Detektorsignal des zweiten Detektors 140 umfassen kann. Es ist aber auch möglich, dass die Amplitude des Detektorsignals des jeweiligen Detektors (des ersten Detektors 130 bzw. des zweiten Detektors 140) getrennt von der ersten Phasendifferenz bzw. der zweiten Phasendifferenz von dem thermischen Gassensor an die Auswerteanordnung gesendet wird. Gemäß einem Ausführungsbeispiel ist es ebenso möglich, dass die Information 210 sowie die Information 220 nicht über getrennte Leitungen zu der Auswerteanordnung 200 übertragen werden, sondern beispielsweise über eine gemeinsame Leitung oder kabellos.According to one embodiment,
Gemäß einem Ausführungsbeispiel kann die Auswerteanordnung 200 ausgelegt sein, um als Zwischengröße abhängig von der Information 210, 220 über die Amplituden der Detektorsignale und abhängig von der Information 210, 220 über die erste Phasendifferenz und die zweite Phasendifferenz ein Kombinationssignal 230 zu bilden. Das Kombinationssignal 230 kann eine Amplitudeninformation und eine Phaseninformation des Detektorsignals des ersten Detektors 130 sowie des Detektorsignals des zweiten Detektors 140 zusammenfassen. Die Auswerteanordnung 200 kann ausgelegt sein, um eine Information 240 über eine Gaskonzentration oder eine Temperaturleitfähigkeit eines Fluids, beispielsweise eines Gases oder Gasgemisches, basierend auf dem Kombinationssignal 230 zu bestimmen. Diese Bestimmung kann die Auswerteanordnung 200 beispielsweise durchführen, ohne im weiteren Fortgang der Berechnungen, die in das Kombinationssignal 230 einfließenden Einzelinformationen 210, 220 noch einmal separat zu betrachten.According to one exemplary embodiment, the
Die Amplitude des Detektorsignals kann beispielsweise direkt als Information 210, 220 von dem jeweiligen Detektor 130, 140 bereitgestellt werden. Die Information 210, 220 über die erste Phasendifferenz und zweite Phasendifferenz zwischen dem Heizer-Signal 122 und dem Detektorsignal des jeweiligen Detektors 130, 140 kann z. B. von dem thermischen Gassensor 100 bestimmt werden und an die Auswerteanordnung 200 übertragen werden.The amplitude of the detector signal can, for example, be provided directly as
Alternativ kann über die Information 210 bzw. die Information 220 das Detektorsignal des ersten Detektors 130 bzw. das Detektorsignal des zweiten Detektors 140 an die Auswerteanordnung 200 übertragen werden und zusätzlich kann das Heizer-Signal 122 direkt an die Auswerteanordnung 200 übertragen werden. Dabei kann die Auswerteanordnung ausgebildet sein, um aus dem Detektorsignal des ersten Detektors 130 und aus dem Detektorsignal des zweiten Detektors 140 die jeweilige Amplitude zu bestimmen und die erste Phasendifferenz sowie die zweite Phasendifferenz zu bestimmen, um abhängig von den so bestimmten Informationen das Kombinationssignal 230 zu bilden.Alternatively, the detector signal of the
Dadurch dass die Auswerteanordnung 200 das Kombinationssignal 230 bildet, kann die Auswerteanordnung 200 mögliche Fehler des thermischen Gassensors 100 sehr leicht und viel schneller korrigieren, um die Information 240 über die Gaskonzentration und eine Temperaturleitfähigkeit zu erhalten, als wenn die Auswerteanordnung 200 die Information 210 über die Amplitude des Detektorsignals des ersten Detektors 130 und die erste Phasendifferenz sowie die Information 220 über die Amplitude des Detektorsignals des zweiten Detektors 140 sowie die zweite Phasendifferenz getrennt voneinander korrigiert. Das Kombinationssignal 230 kann somit erleichtern die Information 240 über die Gaskonzentration und die Temperaturleitfähigkeit des zu analysierenden Gases zu bestimmen sowie ermöglichen, Fehler erzeugt durch den thermischen Gassensor 100, zu unterdrücken oder zu reduzieren.Because the
Gemäß einem Ausführungsbeispiel kann die Auswerteanordnung 200 ausgelegt sein, um eine Information über eine Heizer-Amplitude, beispielsweise eine Information über eine Heizleistung aus dem Heizer-Signal 122, zu erhalten und um eine Linearkombination der Information über die Heizer-Amplitude, der Information 210 und der Information 220 zu bilden, um das Kombinationssignal 230 zu bestimmen.According to one embodiment, the
Alternativ kann die Auswerteanordnung 200 aus dem Heizer-Signal 122 nicht nur die Information über die Heizer-Amplitude erhalten, sondern auch, wie bereits oben beschrieben, eine Information über die erste Phasendifferenz sowie über die zweite Phasendifferenz berechnen, wenn die Information 210 beispielsweise das Detektorsignal des ersten Detektors 130 und die Information 220 das Detektorsignal des zweiten Detektors 140 umfasst.Alternatively, the
Somit geht in das Kombinationssignal 230 nicht nur die Phase des Heizer-Signals in Form der ersten Phasendifferenz und der zweiten Phasendifferenz ein, sondern zusätzlich die Heizer-Amplitude, die ermöglicht, dass die Auswerteanordnung 200 in Abhängigkeit des ersten Abstands 1801 und des zweiten Abstands 1802 der zwei Detektoren von dem Heizer 120, die Information 240 über die Gaskonzentration und die Temperaturleitfähigkeit des zu analysierenden Gases bestimmen kann. So weist beispielsweise das Detektorsignal des ersten Detektors 130 eine größere Amplitude auf als das Detektorsignal des zweiten Detektors 140, da der Abstand 1802 des zweiten Detektors 140 von dem Heizer 120 größer ist als der Abstand 1801 des ersten Detektors 130 von dem Heizer 120. Mit zunehmenden Abstand von dem Heizer 120 kann die Heizer-Amplitude, detektiert von dem jeweiligen Detektor 130, 140 abnehmen. Durch die zusätzliche Information über die Heizer-Amplitude kann die Auswerteanordnung 200 somit noch genauer die Information 240 über die Gaskonzentration und die Temperaturleitfähigkeit bestimmen, da die Heizer-Amplitude des Heizer-Signals 122 als Referenz betrachtet werden kann, und somit das Kombinationssignals 230 ein relatives Amplituden-Signal aufweisen kann. Ein relatives Amplituden-Signal ist beispielsweise weniger fehleranfällig als ein absolutes Amplituden-Signal.Thus, not only the phase of the heater signal in the form of the first phase difference and the second phase difference is included in the
Gemäß einem Ausführungsbeispiel kann die Auswerteanordnung 200 ausgelegt sein, um das Kombinationssignal sigX 230 gemäß sigX=sigUss*Ka+sigPhi*Kp zu erhalten. Der Term sigUss kann eine Amplitudeninformation oder ein Amplituden-Signal sein, das von der Information 210 über die Amplitude des Detektorsignals des ersten Detektors 130 und von der Information 220 über die Amplitude des Detektorsignals des zweiten Detektors 140 abhängig sein kann. So kann sigUss beispielsweise eine Linearkombination der Information 210 über die Amplitude des Detektorsignals des ersten Detektors 130 und der Information 220 über die Amplitude des Detektorsignals des zweiten Detektors 140 sein. sigPhi kann eine Phaseninformation oder ein addiertes Phasensignal sein, das von der Information 210 über eine ersten Phasendifferenz und von der Information 220 über die zweite Phasendifferenz abhängig sein kann. So kann sigPhi beispielsweise eine Addition der Information 210 über die erste Phasendifferenz und der Information 220 über die zweite Phasendifferenz sein. Ka und Kp können Konstanten sein. Das so bestimmte Kombinationssignal 230 kann eine Amplitudeninformation sigUss und eine Phaseninformation sigPhi umfassen, wodurch vier Informationen (z. B. die Information 210 über die Amplitude des Detektorsignals des ersten Detektors 130, die Information 220 über die Amplitude des Detektorsignals des zweiten Detektors 140, die Information 210 über eine erste Phasendifferenz zwischen dem Heizer-Signal und dem Detektorsignal des ersten Detektors 130 und die Information 220 über die zweite Phasendifferenz zwischen dem Heizer-Signal und dem Detektorsignal des zweiten Detektors 140) in dem Kombinationssignal 230 zusammengefasst werden, wodurch die Auswerteanordnung 200 weniger Leistung auf die Verarbeitung der Informationen 210, 220 verwenden kann. Somit kann die Auswerteanordnung 200 ausgelegt sein, um sehr effizient, schnell und genau eine Information 240 über die Gaskonzentration und Temperaturleitfähigkeit zu bestimmen.According to one embodiment, the
Gemäß einem Ausführungsbeispiel kann die Auswerteanordnung 200 ausgelegt sein, um die Amplitudeninformation sigUss gemäß sigUss=2*Hz.Uss-(D1.Uss+D2.Uss) zu erhalten. Hz.Uss kann eine Information über die Heizer-Amplitude sein, die aus dem Heizer-Signal 122 erhalten werden kann. D1.Uss kann eine Information 210 über die Amplitude des Detektorsignals des ersten Detektors 130 sein und D2.Uss kann eine Information 220 über die Amplitude des Detektorsignals des zweiten Detektors 140 sein. Somit kann die Amplitudeninformation sigUss ein relatives Amplituden-Signal darstellen, da die Information 210 über die Amplitude des Detektorsignals des ersten Detektors 130, die Information 220 über die Amplitude des Detektorsignals des zweiten Detektors 140 und die Heizer-Amplitude Hz.Uss miteinander verrechnet werden, so dass die Information 210 über die Amplitude des Detektorsignals des ersten Detektors 130 und die Information 220 über die Amplitude des Detektorsignals des zweiten Detektors 140 relativ zu der Heizer-Amplitude betrachtet werden können. Durch die relative Betrachtungsweise der Amplituden können mögliche Fehler von absoluten Amplitudenwerten vermieden werden, wodurch die Auswerteanordnung 200 sehr genau die Information 240 über die Gaskonzentration und Temperaturleitfähigkeit bestimmen kann.According to one exemplary embodiment, the
Gemäß einem Ausführungsbeispiel kann die Auswerteanordnung 200 ausgelegt sein, um ein Polynom, beispielsweise ersten Grades, des Kombinationssignals 230 zu berechnen, um die Information 240 über die Gaskonzentration oder die Temperaturleitfähigkeit zu erhalten. Das Polynom (z. B. Polynom y) kann beispielsweise gemäß y=A0+A1*sigX+A2*sigX2 erhalten werden. Durch die Polynombildung des Kombinationssignals 230 durch die Auswerteanordnung 200 kann das Kombinationssignal 230 sehr leicht und effizient um mögliche Druck-Drift bzw. Temperatur-Drift-Fehler korrigiert werden.According to one exemplary embodiment, the
Gemäß einem Ausführungsbeispiel kann die Auswerteanordnung 200 ausgelegt sein, um das Polynom des Kombinationssignals 230 mit einem Korrekturterm zu multiplizieren, um die Information 240 über die Gaskonzentration und/oder die Temperaturleitfähigkeit zu erhalten. Der Korrekturterm von dem Kombinationssignal 230, kann von einer Information über einen Druck und von einer Information über eine Temperatur abhängig sein und beispielsweise eine Druck- und Temperaturabhängigkeit kompensieren. In anderen Worten kann der Korrekturterm von dem Kombinationssignal 230 eine Druck-Drift und/oder eine Temperatur-Drift kompensieren. Somit wird eine mögliche Fehlinterpretation durch die Auswerteanordnung 200 der von dem thermischen Gassensor 100 detektierten Signale reduziert.According to one exemplary embodiment, the
Gemäß einem Ausführungsbeispiel kann die Auswerteanordnung 200 ausgelegt sein, um eine Berechnung gemäß ![]()
![]()
![]()
![]()
Gemäß einem Ausführungsbeispiel kann die Auswerteanordnung 200 ausgelegt sein, um eine Berechnung gemäß 

Gemäß einem Ausführungsbeispiel kann die Auswerteanordnung 200 ausgelegt sein, um einen Druck und/oder eine Temperatur in einer Umgebung des thermischen Gassensors 100 bei der Bestimmung der Information 240 über die Gaskonzentration und/oder die Temperaturleitfähigkeit zu berücksichtigen. Hierfür kann beispielsweise der thermische Gassensor 100 Druck- und Temperatursensoren aufweisen, mit denen er den Druck und/oder die Temperatur in der Umgebung detektieren kann und an die Auswerteanordnung 200 übertragen kann. Somit kann die Auswerteanordnung 200 beispielsweise mögliche Fehlberechnungen der Information 240 über die Gaskonzentration und/oder die Temperaturleitfähigkeit aufgrund unterschiedlicher Druck und/oder Temperaturbedingungen in der Umgebung des thermischen Gassensors 100 berücksichtigen und korrigieren. Somit kann die Auswerteanordnung 200 auf den Druck und/oder die Temperatur in der Umgebung des thermischen Gassensors 100 reagieren und dementsprechend die Information 240 über die Gaskonzentration und/oder die Temperaturleitfähigkeit sehr genau bestimmen.According to one exemplary embodiment, the
Gemäß einem Ausführungsbeispiel der vorliegenden Erfindung kann die Auswerteanordnung 200 ausgelegt sein, um bei der Bestimmung der Information 240 über die Gaskonzentration und/oder die Temperaturleitfähigkeit als Eingangsgrößen einer Drift-Korrektur das Kombinationssignal 230, eine Information über die Temperatur in einer Umgebung des thermischen Gassensors 100 und eine Information über einen Druck in einer Umgebung des thermischen Gassensors 100 zu verwenden, um die Information über die Gaskonzentration und/oder Temperaturleitfähigkeit als Ergebnis der Drift-Korrektur zu erhalten. Somit kann beispielsweise die Drift-Korrektur abhängig von der Information über die Temperatur und den Druck auf das Kombinationssignal angewendet werden, um die Information 240 über die Gaskonzentration und/oder die Temperaturleitfähigkeit zu erhalten. Die Drift-Korrektur kann beispielsweise außer den drei genannten Eingangsvariablen (das Kombinationssignal, die Information über die Temperatur und die Information über den Druck) keine weiteren Variablen mehr erhalten, sondern nur noch vorher erhaltene, beispielsweise im Rahmen einer Kalibration bestimmte, Konstanten verwenden. Die Konstanten können dabei spezifisch für den verwendeten thermischen Gassensor 100 sein. Somit kann die Auswerteanordnung 200 ausgelegt sein, um kleine Unterschiede zwischen thermischen Gassensoren 100 in der Berechnung der Information 240 über die Gaskonzentration und/oder Temperaturleitfähigkeit zu berücksichtigen, um ein sehr genaues Ergebnis (Information 240) zu erhalten. Die Drift-Korrektur kann beispielsweise eine Temperatur-Drift und/oder eine Druck-Drift korrigieren.According to an exemplary embodiment of the present invention,
Um das zumindest eine Sensorsignal 210, 220 durch die Auswerteanordnung beispielsweise zu analysieren bzw. weiterzuverarbeiten, ist es von Vorteil, wenn das zumindest eine Sensorsignal 210, 220 in den vorbestimmten Wertebereich durch die Auswerteanordnung 200 gebracht wird. Wird die Heizleistung beispielsweise erhöht, so kann beispielsweise eine Amplitude oder eine Frequenz des zumindest einen Sensorsignals 210, 220 ebenfalls erhöht werden. Dies kann beispielsweise durch die Auswerteanordnung 200 durchgeführt werden, wenn das zumindest eine Sensorsignal 210, 220 zu klein ist und der vorbestimmte Wertebereich sehr groß ist. Somit kann das neue Sensorsignal 210, 220 nach der Regelung der Heizleistung durch die Regeleinheit 250 den vorbestimmten Wertebereich ausfüllen bzw. in diesem liegen. Der vorbestimmte Wertebereich kann beispielsweise abhängig von verwendeten Bauteilen der Auswerteanordnung 200, wie z. B. einem Analog-Digital-Wandler (ADC), abhängig sein. So kann der ADC beispielsweise das zumindest eine Sensorsignal 210, 220 sehr gut weiterverarbeiten, wenn das zumindest eine Sensorsignal 210, 220 in dem auf den ADC angepassten vorbestimmten Wertebereich angepasst ist (z. B. ADC Arbeitsbereich).In order to analyze or further process the at least one
Die Auswerteanordnung 200 kann auch ausgelegt sein, um die Heizleistung des Heizers 120 mit der Regeleinheit 250 dahin gehend zu regeln, dass die Heizleistung des Heizers 120 reduziert wird. Dadurch kann das zumindest eine Sensorsignal 210, 220 ebenfalls reduziert werden. Dies kann beispielsweise vorteilhaft sein, wenn das zumindest eine Sensorsignal 210, 220 den vorbestimmten Wertebereich überschreitet, also zu groß ist. Dadurch, dass die Auswerteanordnung 200 ausgelegt ist, um mit der Regeleinheit 250 die Heizleistung des Heizers 120 zu regeln, wird ermöglicht, dass bei einer Weiterverarbeitung des zumindest einen Sensorsignals 210, 220 durch beispielsweise Bauelemente der Auswerteanordnung 200, wie z. B. dem ADC, keine oder nur kaum Informationen des zumindest einen Sensorsignals 210, 220 verlorengehen.The
Gemäß einem Beispiel kann die Regeleinheit 250 der Auswerteanordnung 200 zur Regelung der Heizleistung des Heizers 120 ein Regelungssignal 252 an den Heizer 120 übertragen. Zusätzlich kann die Regeleinheit 250 eine Information 122 über die geregelte Heizleistung des Heizers 120 der Auswerteanordnung 200 bereitstellen.According to one example, the
Die Auswerteanordnung 200 kann ausgelegt sein, um eine Information 122 über die Heizleistung bei einer Ableitung einer Information 240 über eine Gaskonzentration und/oder eine Temperaturleitfähigkeit von dem zumindest einen Sensorsignal 210, 220 zu berücksichtigen. Somit kann ermöglicht werden, dass durch die Regeleinheit 250 das Sensorsignal 210, 220 in den vorbestimmten Wertebereich gebracht wird und zusätzlich die Information 122 über die Heizleistung in der Analyse berücksichtigt wird, da das zumindest eine Sensorsignal 210, 220 von der Heizleistung abhängig ist. Zusätzlich ermöglicht diese Auswerteanordnung 200, dass ein Sensorsignal, z. B. das erste Sensorsignal 210 oder das zweite Sensorsignal 220, ausreichend sein kann, um mit einer gewissen Genauigkeit die Information 240 über die Gaskonzentration und/oder die Temperaturleitfähigkeit eines Gases oder Fluids (z. B. eines Gases oder Gasgemisches) abzuleiten. Wird sowohl das erste Sensorsignal 210 als auch das zweite Sensorsignal 220 und die Heizleistung 122 verwendet, um die Information 240 abzuleiten, so ist die Bestimmung der Information 240 überbestimmt, wodurch die Information 240 sehr genau durch die Auswerteanordnung 200 bestimmt werden kann. Unterscheidet sich der erste Abstand 1801 des ersten Detektors 130 von dem zweiten Abstand 1802 des zweiten Detektors 140 von dem Heizer 120, so kann beispielsweise die Information 240 über die Gaskonzentration und/oder die Temperaturleitfähigkeit eines Gases auch nur aus dem ersten Sensorsignal 210 und dem zweiten Sensorsignal 220 abgeleitet werden, ohne die Information 122 über die Heizleistung des Heizers 120.
Gemäß einem Beispiel kann die Auswerteanordnung 200 die Information 122 über die Heizleistung auch von dem thermischen Gassensor 100 erhalten anstelle von der Regelungseinheit 250.According to one example, the
Gemäß einem Beispiel kann die Auswerteanordnung 200 ausgelegt sein, um ein periodisches Signal (z. B. das Regelungssignal 252) an den Heizer 120 anzulegen. Bei dem periodischen Signal kann es sich beispielsweise um ein periodisches Rechtecksignal oder Sinussignal handeln. Ist das Regelungssignal 252, und damit die von dem Heizer 120 an das zu analysierende Gas abgegebene Wärme, ein periodisches Signal, so kann ebenfalls das von dem ersten Detektor 130 detektierte erste Sensorsignal 210 und das von dem zweiten Detektor 140 detektierte zweite Sensorsignal 220 periodisch sein. Aufgrund des ersten Abstands 1801 und des zweiten Abstands 1802 können allerdings das erste Sensorsignal 210 und/oder das zweite Sensorsignal 220 sich in der Phase von dem periodischen Signal des Heizers 120 als auch in der Amplitude von dem periodischen Signal des Heizers 120 unterscheiden. Diese Unterschiede kann beispielsweise die Auswerteanordnung 200 nutzen, um die Information 240 über die Gaskonzentration und/oder die Temperaturleitfähigkeit sehr genau zu bestimmen.According to one example, the
Gemäß einem Beispiel kann die Auswerteanordnung 200 ausgelegt sein, um die Heizleistung, mit der der Heizer 120 beaufschlagt wird, (beispielsweise durch das Regelungssignal 252) zwischen zwei Werten umzuschalten. Somit kann beispielsweise an den Heizer 120 ein periodisches Rechtecksignal angelegt sein. Somit kann der Heizer 120 z. B. abwechselnd eine erste Heizleistung und eine zweite Heizleistung an das zu analysierende Gas übertragen.According to one example, the
Gemäß einem Beispiel kann die Auswerteanordnung 200 ausgelegt sein, um eine Amplitude der Heizleistung so zu regeln (beispielsweise mit der Regelungseinheit 250), dass sowohl ein Minimalwert des zumindest einen Sensorsignals 210, 220 als auch ein Maximalwert des zumindest einen Sensorsignals 210, 220 in dem vorbestimmten Wertebereich liegt. Wird die Amplitude der Heizleistung des Heizers 120 beispielsweise durch das Regelungssignal 252 erhöht, so kann der Minimalwert des zumindest einen Sensorsignals 210, 220 gesenkt werden und der Maximalwert des zumindest einen Sensorsignals 210, 220 beispielsweise erhöht werden. Wird die Amplitude der Heizleistung durch das Regelungssignal 252 beispielsweise verringert, so kann der Minimalwert des zumindest einen Sensorsignals 210, 220 erhöht werden und der Maximalwert des zumindest einen Sensorsignals 210, 220 gesenkt werden.According to one example,
Gemäß einem Beispiel kann der vorbestimmte Wertebereich abhängig von einem Wertebereich eines Bauteils, wie z. B. einem ADC, der Auswerteanordnung 200 sein. Somit kann beispielsweise der vorbestimmte Wertebereich abhängig von einem Bauteilwertebereich (beispielsweise eines Bauteils der Auswerteanordnung 200) bestimmt werden. So kann der vorbestimmte Wertebereich beispielsweise vorgeben, dass der Minimalwert des zumindest einen Sensorsignals 210, 220 beispielsweise in einem Bereich von 0% bis 30%, 1% bis 25% oder 2% bis 20% des Bauteilwertebereichs liegen soll und dass der Maximalwert des zumindest einen Sensorsignals 210, 220 in einem Bereich von 70% bis 100%, 75% bis 99% oder 80% bis 98% des Bauteilwertebereichs liegen soll. Somit kann der vorbestimmte Wertebereich beispielsweise einen unteren Wertebereich, in dem der Minimalwert liegen soll und einen oberen Wertebereich, in dem der Maximalwert liegen soll, aufweisen.According to one example, the predetermined range of values can be dependent on a range of values of a component, such as e.g. B. an ADC, the
Gemäß einem Beispiel kann die Auswerteanordnung 200 ausgelegt sein, um eine Amplitude der Heizleistung so einzustellen oder einzuregeln (beispielsweise mit der Regelungseinheit 250), dass ein Amplitude des zumindest einen Sensorsignals 210, 220 in einem vorgegebenen Amplitudenbereich liegt. Weist das zumindest eine Sensorsignal 210, 220 beispielsweise ein periodisches Sinussignal auf, so sollte die Amplitude zu jedem Zeitpunkt des Sensorsignals in dem vorgegebenen Amplitudenbereich liegen. Hierbei sollte die Amplitude des zumindest einen Sensorsignals den kompletten vorgegebenen Amplitudenbereich ausnutzen. Der vorgegebene Amplitudenbereich kann beispielsweise einen oberen, mittleren und unteren Amplitudenbereich aufweisen/unterteilt sein. Damit der vorgegebene Amplitudenbereich durch die Amplitude des zumindest einen Sensorsignals ausgenutzt wird, sollte eine maximale Amplitude des zumindest einen Sensorsignals beispielsweise in dem oberen Bereich liegen und eine minimale Amplitude in dem unteren Bereich liegen. Der vorgegebene Amplitudenbereich kann beispielsweise von dem Bauteilbereich abhängig sein. So kann der vorgegebene Amplitudenbereich beispielsweise so bestimmt sein, dass die Amplitude des zumindest einen Sensorsignals beispielsweise zumindest 50% oder zumindest 65% oder zumindest 75% eines Bauteilwertebereichs eines beispielsweise Analog-Digital-Wandlers ausnutzt.According to one example, the
Gemäß einem Beispiel kann die Auswerteanordnung 200 ausgelegt sein, um Abtastzeitpunkte, zu denen ein Sensorsignal 210, 220 abgetastet werden kann, einzustellen oder einzuregeln. Das Sensorsignal 210, 220 kann optional beispielsweise von der Auswerteanordnung 200 oder dem thermischen Gassensor 100 vorverarbeitet und/oder mit einem DC-Offset beaufschlagt sein. Es kann vorteilhaft sein, wenn das Sensorsignal 210, 220 zu einem Zeitpunkt maximaler Amplitude und zu einem Zeitpunkt minimaler Amplitude abgetastet wird. Diese beide Abtastzeitpunkte können beispielsweise von der Auswerteanordnung 200 eingestellt bzw. nachgeregelt werden, falls die Auswerteanordnung 200 feststellt, dass die Abtastzeitpunkte falsch gewählt worden sind. Durch ein exaktes Einstellen der Abtastzeitpunkte kann ermöglicht werden, dass beispielsweise sehr leicht durch die Auswerteanordnung eine Phasendifferenz oder Amplitudendifferenz zwischen dem ersten Sensorsignal 210 und einem Heizer-Signal (beispielsweise ausgesendet von dem Heizer 120 und geregelt durch das Regelungssignal 252) bzw. zwischen dem zweiten Sensorsignal 220 und dem Heizer-Signal bestimmt werden können. Mittels der sehr genauen Phasendifferenz und/oder Amplitudendifferenzen kann die Auswerteanordnung 200 sehr genau die Information 240 über die Gaskonzentration und/oder Temperaturleitfähigkeit des zu analysierenden Gases bestimmen bzw. ableiten.According to one example, the
Gemäß einem Beispiel kann die Auswerteanordnung 200 ausgelegt sein, um die Abtastzeitpunkte so einzustellen, dass eine Abtastung, beispielsweise mit einer Phasendifferenz von maximal +/- 2° zu einem Zeitpunkt erfolgt, zu dem das Sensorsignal 210, 220 einen Maximalwert erreicht, und so dass die Abtastung, beispielsweise mit einer Phasendifferenz von maximal +/- 2° zu einem Zeitpunkt erfolgt, zu dem das Sensorsignal 210, 220 einen Minimalwert erreicht. Der Maximalwert kann beispielsweise eine maximale Amplitude des Sensorsignals 210, 220 definieren und der Minimalwert kann eine minimale Amplitude des Sensorsignals 210, 220 definieren, wie bereits weiter oben erklärt.According to one example, the
Gemäß einem Beispiel kann die Auswerteeinrichtung 200 ausgelegt sein, um ein Sensorsignal 210, 220 von zumindest einem der Detektoren 130, 140 mit einem durch einen Digital-Analog-Wandler erzeugten Offset-Signal zu kombinieren, um ein Eingangssignal für den Analog-Digital-Wandler zu erhalten. Die Auswerteeinrichtung 200 kann ausgelegt sein, um das Offset-Signal einzuregeln, um zu erreichen, dass das Eingangssignal des Analog-Digital-Wandlers während einer gesamten Periode des Sensorsignals 210, 220 innerhalb eines vorgegebenen Bereichs bleibt. Somit kann das Offset-Signal beispielsweise ausgelegt sein, um das Sensorsignal 210, 220 so anzupassen, dass das Eingangssignal entsteht, das in einem Bauteilwertebereich des Analog-Digital-Wandlers liegt. So kann das Offset-Signal beispielsweise eingeregelt/angepasst werden, um auf unterschiedliche Sensorsignale 210, 220 von unterschiedlichen zu analysierenden Gasen reagieren zu können. So kann das Offset-Signal beispielsweise ausgebildet sein, um ein zu großes Sensorsignal 210, 220 zu verkleinern, damit das so entstandene Eingangssignal in dem vorgegebenen Bereich liegt. Außerdem kann das Offset-Signal ausgebildet sein, um bei einem zu kleinen Sensorsignal 210, 220 das Sensorsignal 210, 220 zu erhöhen, damit ein Eingangssignal entsteht, das in dem vorgegebenen Bereich liegt.According to one example, the
Somit kann die Auswerteanordnung 200 einerseits ausgelegt sein, um die Amplitude des Sensorsignals 210, 220 durch die Regelung der Heizleistung in den vorbestimmten Wertebereich zu bringen und durch die Kombination des Sensorsignals 210, 220 mit dem Offset-Signal einen Offset des Sensorsignals 210, 220 so zu verändern, dass das Sensorsignal 210, 220 in dem vorbestimmten Wertebereich liegt. Hierdurch wird ermöglicht, dass das Sensorsignal 210, 220 sehr genau analysiert werden kann und somit eine sehr genaue Information 240 über die Gaskonzentration und/oder Temperaturleitfähigkeit des zu analysierenden Gases durch die Auswerteanordnung 200 ermittelt werden kann.Thus, on the one hand,
Gemäß einem Beispiel kann die Auswerteeinrichtung 200 ausgelegt sein, um die Heizleistung nur dann zu regeln, wenn eine Einstellung oder Einregelung der Abtastzeitpunkte sich in einem eingeschwungenen Zustand befindet und wenn sich eine Einregelung des Offset-Signals in einem eingeschwungenen Zustand befindet. Unter einem eingeschwungenen Zustand kann verstanden werden, dass die Abtastzeitpunkte von der Auswerteeinrichtung 200 so bestimmt wurden, dass das Sensorsignal 210, 220 an vordefinierten Ereignissen (wie z. B. eine maximale Amplitude (Maximalwert), ein Nulldurchgang oder eine minimale Amplitude (Minimalwert)) abgetastet werden kann. Genauso kann der eingeschwungene Zustand bedeuten, dass das Offset-Signal so eingeregelt wurde, dass das Sensorsignal 210, 220 bei einer Kombination des Offset-Signals mit dem Sensorsignal 210, 220 ein Eingangssignal erzeugt, das in dem vorgegebenen Bereich liegt, um somit das Sensorsignal 210, 220 sehr genau, ohne oder nur mit geringen Informationsverlusten, mittels der Auswerteanordnung zu analysieren. Somit können beispielsweise von der Auswerteeinrichtung 200 Voreinstellungen (wie z. B. die Abtastzeitpunkte in dem eingeschwungenen Zustand oder das Offset-Signal in dem eingeschwungenen Zustand) bestimmt werden, so dass bei einer Regelung der Heizleistung durch die Regelungseinheit 250 das neue Sensorsignal 210, 220 mit den Voreinstellungen sehr genau analysiert werden kann und unter Umständen keine neue Regelung der Abtastzeitpunkte bzw. des Offset-Signals mehr nötig ist, um aus dem Sensorsignal 210, 220 die Information 240 über die Gaskonzentration und/oder die Temperaturleitfähigkeit abzuleiten.According to one example, the
Gemäß einem Beispiel kann die Auswerteanordnung 200 ausgelegt sein, um die Regelung der Heizleistung (beispielsweise durch die Regelungseinheit 250) anzuhalten, während eine Einstellung oder Einregelung der Abtastzeitpunkte erfolgt und/oder während eine Einregelung des Offset-Signals erfolgt. Somit kann beispielsweise sichergestellt werden, dass keine Veränderungen des Sensorsignals 210, 220 durchgeführt werden, während die Abtastzeitpunkte und das Offset-Signal sich noch nicht in einem eingeschwungenen Zustand befinden. Somit kann sichergestellt werden, dass das Sensorsignal 210, 220 sehr genau analysiert werden kann, da die Abtastzeitpunkte und das Offset-Signal sehr genau mit nur sehr geringer oder keiner Fehleranfälligkeit bestimmt werden können.According to one example, the
Gemäß einem Beispiel kann die Auswerteanordnung 200 ausgelegt sein, um sowohl eine mittlere Heizleistung oder eine maximale Heizleistung als auch eine Amplitude der Heizleistung zu regeln. Somit kann die Regelungseinheit 250 beispielsweise als Regelungssignal 252 ein neues Heizer-Signal für den Heizer 120 an den thermischen Gassensor 100 übertragen, wobei das Regelungssignal z. B. eine geänderte mittlere Heizleistung, maximale Heizleistung oder Amplitude der Heizleistung aufweist. Es ist aber auch möglich, dass das Regelungssignal 152 eine Information umfasst, die besagt, wie die mittlere Heizleistung, die maximale Heizleistung oder die Amplitude der Heizleistung von dem thermischen Gassensor für den Heizer 120 geändert werden sollte.According to one example, the
Der erste Abtastzeitpunkt, der zweite Abtastzeitpunkt und/oder der dritte Abtastzeitpunkt sowie das erste Sensorsignal 210 und das zweite Sensorsignal 220 können verwendet werden, um die Information 240 über die Gaskonzentration und/oder die Temperaturleitfähigkeit eines Gases, detektiert durch den thermischen Gassensor 100, zu bestimmen. Optional kann zusätzlich das Heizer-Signal 122 in die Bestimmung der Information 240 miteinfließen. Somit können beispielsweise eine Phasendifferenz zwischen dem ersten Sensorsignal 210 und dem zweiten Sensorsignal 220 sowie eine Amplitudendifferenz zwischen dem ersten Sensorsignal 210 und dem zweiten Sensorsignal 220 beispielsweise anhand der Abtastzeitpunkte/Abtastwerte bestimmt werden. Optional können auch eine Phasendifferenz und/oder eine Amplitudendifferenz zwischen dem ersten Sensorsignal 210 und dem Heizer-Signal 122 bzw. zwischen dem zweiten Sensorsignal 220 und dem Heizer-Signal 122 ermittelt werden. Aus den so ermittelten Phasendifferenzen und Amplitudendifferenzen kann die Information 240 über die Gaskonzentration und/oder Temperaturleitfähigkeit bestimmt werden.The first sampling time, the second sampling time and/or the third sampling time as well as the
Gemäß einem Beispiel kann die Auswerteanordnung 200 ausgelegt sein, um die Abtastzeitpunkte abhängig von einer Erkennung, ob der erste Abtastwert und der dritte Abtastwert einen Maximalwert und/oder einen Minimalwert des Sensorsignals 210, 220 darstellen, zu verändern. Dies kann beispielsweise mittels einer Abtastregelungseinrichtung 290 erfolgen. Somit können beispielsweise neue Abtastzeitpunkte bestimmt werden, wenn der erste Abtastwert und der dritte Abtastwert nicht einen Maximalwert und/oder einen Minimalwert des Sensorsignals 210, 220 entsprechen. Durch die Regelung der Abtastzeitpunkte kann sichergestellt werden, dass die Abtastwerte vorbestimmten Werten entsprechen. Stellt die Überprüfungseinrichtung 280 z. B. fest, dass Abweichungen außerhalb einer Toleranz auftreten (beispielsweise +/- 2°), so können die Abtastzeitpunkte durch die Abtastregelungseinrichtung 290 verändert/nachgeregelt werden.According to one example, the
Gemäß einem Beispiel kann die Auswerteanordnung 200 ausgelegt sein, um die Abtastzeitpunkte so einzustellen oder einzuregeln, dass der erste Abtastwert einen ersten Extremwert des Sensorsignals 210, 220, beispielsweise einen Maximalwert oder Minimalwert, darstellt und der dritte Abtastwert einen zweiten Extremwert, beispielsweise den Minimalwert oder den Maximalwert des Sensorsignals 210, 220 darstellt. Der zweite Abtastwert kann beispielsweise einen Mittelwert oder Gleichanteil des Sensorsignals 210, 220 darstellen, wie z. B. einen "Nulldurchgang".According to one example,
Gemäß einem Beispiel kann die Auswerteanordnung 200 ausgelegt sein, um bei der Einstellung oder Einregelung der Abtastzeitpunkte eine Information über einen Zeitpunkt eines Durchgangs des Sensorsignals 210, 220 durch einen vorgegebenen Schwellwert zu berücksichtigen. Dieser Zeitpunkt kann beispielsweise der zweite Zeitpunkt sein, der beispielsweise einen Gleichanteil oder einen Mittelwert des Sensorsignals 210, 220 darstellen kann. So kann beispielsweise die Überprüfungseinrichtung 280 den zweiten Abtastzeitpunkt für die Überprüfung des ersten Abtastzeitpunktes und/oder des zweiten Abtastzeitpunktes verwenden. Stellt somit die Überprüfungseinrichtung 280 basierend auf dem zweiten Abtastzeitpunkt fest, dass der erste Abtastwert nicht einen Maximalwert oder Minimalwert des Sensorsignals 210, 220 entspricht und/oder der dritte Abtastwert nicht dem Minimalwert oder dem Maximalwert des Sensorsignals 210, 220 entspricht, so kann die Abtastregelungsvorrichtung 290 die Abtastzeitpunkte neu einstellen oder einregeln. Der vorgegebene Schwellwert kann beispielsweise einen "Nulldurchgang" (beispielsweise bis auf einen DC-Offset) definieren.According to one example,
Gemäß einem Beispiel kann die Auswerteanordnung 200 ausgelegt sein, um zu überprüfen, ob ein zweiter Abtastwert zu dem zweiten Abtastzeitpunkt gleich einem Mittelwert aus dem Abtastwert zu dem ersten Abtastzeitpunkt und dem dritten Abtastwert zu dem dritten Abtastzeitpunkt ist und um abhängig von der Überprüfung zu erkennen, ob der erste Abtastwert und der dritte Abtastwert einen Maximalwert und einen Minimalwert des Sensorsignals darstellen. Der zweite Abtastwert sollte beispielsweise mit einer Toleranz von höchstens ±1% einer Differenz zwischen dem ersten Abtastwert und dem dritten Abtastwert oder gleich einem Mittelwert aus dem Abtastwert und dem zweiten Abtastwert sein. Ist dies nicht der Fall, so kann die Überprüfungsvorrichtung 280 erkennen, dass die Abtastzeitpunkte falsch gewählt sind. Da der erste Abtastwert einen ersten Extremwert darstellt und der dritte Abtastwert um 180° bezogen auf die Periodendauer zeitversetzt einen zweiten Extremwert des Sensorsignals 210, 220 darstellt, kann der zweite Abtastwert, genau zur halben Zeit zwischen dem ersten Abtastzeitpunkt und dem zweiten Abtastzeitpunkt liegen. Somit kann der zweite Abtastwert dem Mittelwert aus den anderen beiden Abtastwerten entsprechen. Somit kann dies eine effiziente und genaue Methode darstellen, um mithilfe der Überprüfungsvorrichtung 280 die Abtastwerte zu überprüfen.According to one example, the
Gemäß einem Beispiel kann die Auswerteanordnung 200 ausgelegt sein, um ein periodisches Rechtecksignal 260 mit einem Tastverhältnis von bevorzugt 50% an den Heizer 120 anzulegen. Es ist aber auch möglich, dass das periodische Rechtecksignal ein Tastverhältnis im Bereich von 5% bis 50%, 8% bis 48% oder 10% bis 45% aufweist. Das an den Heizer 120 angelegte periodische Rechtecksignal 260 kann eine Toleranz von +/- 2% aufweisen. Das Tastverhältnis gibt z. B. für eine periodische Folge von Impulsen ein Verhältnis einer Impulsdauer zu einer Periodendauer an.According to one example, the
Gemäß einem Beispiel kann die Auswerteanordnung 200 ausgelegt sein, um ein Sensorsignal 210, 220 mit einem durch einen Digital-Analog-Wandler erzeugten Offset-Signal zu kombinieren, um ein Eingangssignal für einen Analog-Digital-Wandler zu erhalten. Der Analog-Digital-Wandler kann beispielsweise die zu den Abtastzeitpunkten anliegenden Signalwerte (z. B. den ersten Abtastwert, den zweiten Abtastwert und/oder den dritten Abtastwert) digitalisieren und damit das Sensorsignal 210, 220 abtasten. Die Abtastvorrichtung 270 kann beispielsweise den Analog-Digital-Wandler aufweisen.According to one example, the
Gemäß einem Beispiel kann die Auswerteanordnung 200 ausgelegt sein, um das Offset-Signal einzuregeln, um zu erreichen, dass das Eingangssignal des Analog-Digital-Wandlers während einer gesamten Periode des Sensorsignals 210, 220 innerhalb eines vorgegebenen Bereichs bleibt. So kann das Offset-Signal beispielsweise einen Offset des Sensorsignals 210, 220 so verändern, dass ein Eingangssignal entsteht, das in einem Arbeitsbereich (z. B. dem vorgegebenen Bereich) des Analog-Digital-Wandlers liegt, damit keine Informationen des Sensorsignals 210, 220 bei der Digitalisierung verlorengehen bzw. damit ein Informationsverlust reduziert wird. So kann beispielsweise die Abtastvorrichtung 270 überprüfen, ob ein Eingangswert des Analog-Digital-Wandlers einen vorgegebenen oberen Schwellwert, beispielsweise des vorgegebenen Bereichs, überschreitet, oder einen vorgegebenen unteren Schwellwert, beispielsweise des vorgegebenen Bereichs, unterschreitet. Dementsprechend kann die Abtastvorrichtung 270 das Offset-Signal erzeugen, das mit dem Sensorsignal 210, 220 kombiniert werden kann, damit der Eingangswert, beispielsweise ein Wert des Eingangssignals, in dem vorgegebenen Bereich bleibt. Die Auswerteanordnung 200 kann ausgelegt sein, um die Abtastzeitpunkte nach einer Einregelung des Offset-Signals einzuregeln und um nach einer Veränderung der Abtastzeitpunkte eine erneute Überprüfung durchzuführen, ob mit der veränderten Einstellung der Abtastzeitpunkte erhaltene Abtastwerte weiterhin innerhalb des vorgegebenen Bereichs liegen. Somit kann beispielsweise zunächst das Offset-Signal mittels der Auswerteanordnung 200 für das Sensorsignal 210, 220 erzeugt werden und daraufhin Abtastzeitpunkte mittels der Abtastvorrichtung 270 bestimmt werden, überprüft werden und ggf. nachgeregelt werden (dies kann beispielsweise eine Nachführung der Abtastzeitpunkte darstellen). Durch diese Nachführung können neue Abtastwerte entstehen, die eine erneute Einregelung des Offset-Signals durch die Auswerteanordnung 200 nach sich ziehen können. Somit können beispielsweise das Offset-Signal und die Abtastzeitpunkte immer abwechselnd so lange eingeregelt bzw. nachgeführt werden, bis beispielsweise der Analog-Digital-Wandler das Sensorsignal 210, 220 weiterverarbeiten kann. Somit können sich zu diesem Zeitpunkt das Offset-Signal und die Abtastzeitpunkte in einem eingeschwungenen Zustand befinden.According to one example, the
Die durch die Abtastregelungseinrichtung 290 veränderten Einstellungen der Abtastzeitpunkte erzeugen beispielsweise neue Abtastwerte, die als Eingangswerte des Analog-Digital-Wandlers angesehen werden können. Damit das Eingangssignal des Analog-Digital-Wandlers in dem vorgegebenen Bereich bleibt, kann sowohl das Offset-Signal als auch die Heizleistung des Heizers 120 nachgeregelt werden. Das Offset-Signal kann beispielsweise einen Offset des Sensorsignals 210, 220 anpassen und die Veränderung der Heizleistung kann eine Amplitude des Sensorsignals 210, 220 anpassen, so dass ein Eingangssignal entsteht, das in dem vorgegebenen Bereich liegt.The settings of the sampling times changed by the
Gemäß einem Beispiel kann die Auswerteanordnung 200 ausgelegt sein, um eine Heizleistung, mit der der Heizer 120 beaufschlagt wird, abhängig von zumindest einem Sensorsignal 210, 220 von zumindest einem der Detektoren 130, 140 zu regeln, um das zumindest eine Sensorsignal 210, 220 in einen vorbestimmten Wertebereich zu bringen. Die Auswerteanordnung 200 kann ausgelegt sein, um eine Information über die Heizleistung (z. B. das Heizer-Signal 122) bei einer Ableitung einer Information 240 über eine Gaskonzentration und/oder Temperaturleitfähigkeit von den Sensorsignalen 210, 220 zu berücksichtigen. So kann beispielsweise bei einer Erhöhung der Heizleistung des Heizers 120 das Sensorsignal 210, 220 eine Erhöhung einer Amplitude des Sensorsignals 210, 220 erfahren bzw. bei einer Reduktion der Heizleistung kann das zumindest eine Sensorsignal 210, 220 eine Verkleinerung einer Amplitude des Sensorsignals 210, 220 erfahren. Somit kann beispielsweise das Sensorsignal 210, 220 durch eine Regelung der Heizleistung des Heizers 120 in den vorbestimmten Wertebereich gebracht werden.According to one example,
Im Folgenden werden anhand weiterer Figuren Ausführungsbeispiele des thermischen Gassensors und der Auswerteanordnung beschrieben.Exemplary embodiments of the thermal gas sensor and the evaluation arrangement are described below with reference to further figures.
Optional kann der Gassensor 100 eine erste äußere Unterbrechung 192 und eine zweite äußere Unterbrechung 194 aufweisen. Somit kann beispielsweise die erste Thermoelement-Struktur 130 eine freitragende Brückenstruktur zwischen der ersten Unterbrechung 160 und der zweiten äußeren Unterbrechung 194 sein und die zweite Thermoelement-Struktur 140 kann eine freitragende Brückenstruktur zwischen der zweiten Unterbrechung 172 und der ersten äußeren Unterbrechung 192 sein. Die erste Thermoelement-Struktur 130 kann auch als erster Detektor oder erster Sensor bezeichnet werden und die zweite Thermoelement-Struktur 140 kann auch als zweiter Sensor bzw. zweiter Detektor bezeichnet werden.Optionally, the
Oberhalb
Gemäß dem Ausführungsbeispiel in
Gemäß einem Ausführungsbeispiel kann die erste Thermoelement-Struktur 130, die zweite Thermoelement-Struktur 140 und/oder das Heizelement 120 Teil der Membran 110 sein.According to an embodiment, the
Zur Messung eines von der Gasart bzw. vom Gasgemisch abhängigen Wärmetransports kann ein Mikrochip (Beispiels für den thermischen Gassensor 100) mit drei zwischen einem Rahmen freitragend gespannten filigranen Brückenstrukturen (z. B. dem Heizelement 120, der ersten Thermoelement-Struktur 130 und der zweiten Thermoelement-Struktur 140) verwendet werden, die als Mikrodrähte vom zu analysierenden Gas umgeben sein können. Das zu analysierende Gas kann beispielsweise in der ersten Unterbrechung 162, der zweiten Unterbrechung 172, der ersten äußeren Unterbrechung 192 und/oder in der zweiten äußeren Unterbrechung 194 angeordnet sein. Eine mittlere Brückenstruktur kann als Heizer 120 ausgelegt sein und zwei beidseitig in unterschiedlichen Abständen zum Heizer 120 liegende Detektor-Strukturen (z. B. die erste Thermoelement-Struktur 130 und die zweite Thermoelement-Struktur 140) können als Temperatursensoren zur Messung einer Übertragungsantwort aus dem Gasgemisch verwendet werden.A microchip (example of the thermal gas sensor 100) with three filigree bridge structures (e.g. the
Der mittlere Draht (das Heizelement 120) wird mit einem beispielsweise periodischen Heizsignal beaufschlagt, wodurch beispielsweise Wärme von dem Heizelement ausgestrahlt wird. Ein Wärmeübertrag kann über unbekannte Wärmeübergänge vom Heizer 120 ins zu analysierende Gas und vom Gas in den Sensor-Draht (z. B. in die erste Thermoelement-Struktur 130 und/oder die zweite Thermoelement-Struktur 140) erfolgen. Der so von der ersten Thermoelement-Struktur 130 und/oder der zweiten Thermoelement-Struktur 140 detektierte Wärmeübertrag kann als Übertragungsantwort oder als Sensorsignal verstanden werden (beispielsweise ein erstes Sensorsignal detektiert von der ersten Thermoelement-Struktur 130 und ein zweites Sensorsignal detektiert von der zweiten Thermoelement-Struktur 140). Durch eine Messung einer Temperatur-Antwort (beispielsweise die Übertragungsantwort) mit beispielsweise zwei identischen Sensoren (z. B. die erste Thermoelement-Struktur 130 und/oder die zweite Thermoelement-Struktur 140) in unterschiedlichen Abständen zum Heizer 120 lassen sich die unbekannten Wärmeübergänge in der Messanordnung eliminieren. Phase und Amplitude der beiden Sensorsignale können im Wesentlichen von der Wärmeübertragung durch das Gas abhängig sein.The central wire (the heating element 120) is supplied with a heating signal, for example a periodic one, whereby heat is radiated from the heating element, for example. A heat transfer can occur via unknown heat transfers from the
Eine erste Variante des thermischen Gassensors 100 kann auf Basis eines Silicon-On-Insulator (SOI) Wafer-Substrates aufgebaut sein. Sie besteht beispielsweise aus einem Mikrochip mit freitragenden filigranen Brückenstrukturen aus Silizium-Mikrodrähten (z. B. die erste Temperatursensor-Struktur 130 und die zweite Temperatursensor-Struktur 140), die im zu analysierenden Gasraum aufgespannt sind. Ein mittlerer Draht kann als Heizer 120 ausgelegt sein und zwei Detektor-Drähte (z. B. die erste Temperatursensor-Struktur 130 und die zweite Temperatursensor-Struktur 140) können beidseits zum Heizer in unterschiedlichen Abständen davon als Temperatursensoren dienen (siehe
Die Membran 110 kann beispielsweise einen ersten Unterbrechungsbereich 160/162 und einen zweiten Unterbrechungsbereich 170/172 aufweisen. Sowohl der erste Unterbrechungsbereich 160/162 als auch der zweite Unterbrechungsbereich 170/172 weisen beispielsweise eine Unterbrechung auf, die beispielsweise eine Kavität sein kann. Somit kann die Membran 110 eine erste Unterbrechung 162 und eine zweite Unterbrechung 172 aufweisen, in der das zu analysierende Gas angeordnet sein kann und beispielsweise von der Silizium-Brücke 120/130/140 Wärme übertragen bekommt, wenn die Silizium-Brücke ein Heizelement 120 darstellt bzw. an die Silizium-Brücke 120/130/140 übertragen kann, wenn die Silizium-Brücke 120/130/140 die erste Thermoelement-Struktur 130 und/oder die zweite Thermoelement-Struktur 140 darstellt. Die Silizium-Brücke 120/130/140 kann durch das Aluminiummaterial 156 kontaktiert werden, wodurch das Aluminiummaterial 156 beispielsweise als Bond-Pad dienen kann. Durch das Bond-Pad kann beispielsweise an das Heizelement 120 ein anregendes Heizer-Signal angelegt werden bzw. die erste Thermoelement-Struktur 130 und/oder die zweite Thermoelement-Struktur 140 ausgelesen werden (beispielsweise ein erstes oder zweites Sensorsignal).The
-
kristalline Widerstandbahnen, der Temperaturkoeffizient des Widerstandes (TKR) für die Detektoren (z. B. für die erste Thermoelement-Struktur 130 und die zweite Thermoelement-Struktur 140) kann allein von der Grunddotierung des Wafer-Materials (im Active Layer) abhängig seincrystalline resistance tracks, the temperature coefficient of resistance (TCR) for the detectors (e.g. for the
first thermocouple structure 130 and the second thermocouple structure 140) can depend solely on the basic doping of the wafer material (in the active layer). -
ähnlich hoher TKR wie bei Platin bei hohem Grundwiderstand der Widerstände der Temperatur-Detektoren (z. B. die erste Thermoelement-Struktur 130 und die zweite Thermoelement-Struktur 140) ermöglicht miniaturisierte Sensor-Dimensionen (z. B. Dimensionen der ersten Thermoelement-Struktur 130 und der zweiten Thermoelement-Struktur 140) aufgrund kurzer (Beispielsweise von einer Rahmenseite des Rahmens 150 zu einer gegenüberliegenden Rahmenseite des Rahmens 150) Widerstandsbahnen der Brückenstrukturen 120, 130, 140 (kleiner als 1 mm) sowie für den Bereich der Resistance Temperatur Detektoren (RTD) (z. B. die erste Thermoelement-Struktur 130 und die zweite Thermoelement-Struktur 140) vergleichbar geringen Temperatur-Mess-Fehlern aufgrund von Eigenerwärmung, da z. B. mit Grundwiderstandswerten größer 8 kOhm gearbeitet werden kann, die im Messbetrieb weniger als 360 µW Leistungsaufnahme benötigen können.A similarly high TKR as with platinum with a high basic resistance of the resistances of the temperature detectors (e.g. the
first thermocouple structure 130 and the second thermocouple structure 140) enables miniaturized sensor dimensions (e.g. dimensions of thefirst thermocouple structure 130 and the second thermocouple structure 140) due to short (e.g. from one frame side of theframe 150 to an opposite frame side of the frame 150) resistance paths of thebridge structures first thermocouple structure 130 and the second thermocouple structure 140) comparably low temperature measurement errors due to self-heating, since z. B. you can work with basic resistance values greater than 8 kOhm, which can require less than 360 µW power consumption in measuring mode. - Heizer-Widerstand (z. B. des Heizers 120) durch Implantation auf niedrige Betriebsspannung anpassbar (vorzugsweise 3,3V)Heater resistance (e.g. of heater 120) adjustable by implantation to low operating voltage (preferably 3.3V)
-
sehr homogene Verteilung der ohmschen Sensor-Widerstände, z. B. der Widerstand der ersten Thermoelement-Struktur 130 und/oder der zweiten Thermoelement-Struktur 140, über dem Wafer (z. B. dem Rahmen 150) in einem engen Prozessfeld, insbesondere die Toleranzen der Detektorwiderstände (z. B. Sensor-Widerstände) sind z. B. durch Toleranzen des SOI-Materials in einer aktiven Schicht (Active Layer, Grunddotierung und Materialdicke) sowie durch die laterale Struktur-Genauigkeit der Trockenätzung (Deep-RIE) bestimmt.Very homogeneous distribution of the ohmic sensor resistances, e.g. B. the resistance of the
first thermocouple structure 130 and/or thesecond thermocouple structure 140, over the wafer (e.g. the frame 150) in a narrow process field, in particular the tolerances of the detector resistances (e.g. sensor resistances ) are e.g. B. determined by tolerances of the SOI material in an active layer (active layer, basic doping and material thickness) and by the lateral structural accuracy of the dry etching (deep RIE).
- µ vergleichbar teures SOI-Substrat Material beim Wafer Einkaufµ comparably expensive SOI substrate material when purchasing wafers
- µ Verfügbarkeit meist nicht in den Wunsch-Spezifikationen vorrätig (Wafer Durchmesser, Materialdicken von Handle und Active Layer, Dotierung des Active Layer)µ Availability usually not in stock in the desired specifications (wafer diameter, material thicknesses of handle and active layer, doping of the active layer)
- µ derzeit keine Passivierung der Strukturen, eine Passivierung führt u. U. zu Bimetall-Effekten aufgrund der unterschiedlichen Materialdehnung der Schichten bei Wärmeeintrag, Veränderung der Kennlinie des TKRµ currently no passivation of the structures, passivation may lead to bimetal effects due to the different material expansion of the layers when heat is applied, change in the characteristic curve of the TKR
Gemäß einem Ausführungsbeispiel kann der Gassensor 100 eine Membran 110 und ein Heizelement 120 aufweisen, das auf der Membran 110 zwischen einem ersten Unterbrechungsbereich 160 der Membran 110 und einem zweiten Unterbrechungsbereich 170 der Membran 110 angeordnet sein kann. Der erste Unterbrechungsbereich 160 kann eine Unterbrechung 162 aufweisen und der zweite Unterbrechungsbereich 170 kann eine Unterbrechung 172 aufweisen.According to one embodiment, the
Die erste Unterbrechung 162 und/oder die zweite Unterbrechung 172 können eine Längsausdehnung parallel zu einer Richtung maximaler Ausdehnung des Heizelements 120 (das beispielsweise als Heizer bezeichnet werden kann) aufweisen und eine Querausdehnung, beispielsweise in einer Richtung senkrecht zu einer Richtung maximaler Ausdehnung des Heizelements 120, aufweisen. Gemäß
Die erste Thermoelement-Struktur 130 kann beispielsweise einen anderen Abstand zu dem Heizelement 120 aufweisen, als die zweite Thermoelement-Struktur 140. So weist gemäß
Gemäß einem Ausführungsbeispiel kann der Gassensor 100 außerdem einen Rahmen 150 aufweisen, der die Membran 110 aufspannen kann. Die erste Thermoelement-Struktur 130 und die zweite Thermoelement-Struktur 140 können zumindest teilweise auf der Membran 110 und zumindest teilweise auf dem Rahmen 150 angeordnet sein. Dabei können die erste Thermoelement-Struktur 130 und die zweite Thermoelement-Struktur 140 heiße Enden 132, 142 aufweisen, die dem Heizelement 120 zugewandt angeordnet sind. Zudem können die erste Thermoelement-Struktur 130 und die zweite Thermoelement-Struktur 140 kalte Enden 134, 144 aufweisen, die auf einer Seite der ersten Thermoelement-Struktur 130 bzw. der zweiten Thermoelement-Struktur 140 gegenüber der Seite mit den heißen Enden 132, 142 angeordnet sein können und somit dem Heizelement 120 abgewandt angeordnet sind. So können beispielsweise die heißen Enden 132, 142 auf der Membran 110 angeordnet sein und die kalten Enden 134, 144 auf dem Rahmen 150 angeordnet sein. Dabei kann beispielsweise der Rahmen 150 ein anderes Material aufweisen als die Membran 110. Dadurch können beispielsweise die kalten Enden 134, 144 mit einer Referenztemperatur, durch das Rahmenmaterial des Rahmens 150, beaufschlagt werden, in Bezug zu einer Temperatur gemessen mittels der heißen Enden 130, 142, übertragen von dem Heizelement 120.According to one exemplary embodiment, the
In anderen Worten kann die linke Darstellung des Gassensors 100 ein Layout und die rechte Seite der
Zur Reduzierung des Prozessaufwandes bei der technologischen Herstellung z. B. des Gassensors 100 und zur Erhöhung der Sensitivität bei der Messung des gasartabhängigen Wärmetransports 210, 220 kann ein Mikrochip auf Basis einer Dünnschicht-Membran 110 mit Heizer- 120 und Thermopile-Strukturen 130, 140 (Detektoren) realisiert werden, bei dem die Dünnschicht-Membran 110 in einem lateralen Gebiet zwischen Heizer 120 und Detektoren 130, 140 herausgeätzt werden können.To reduce the process costs in the technological production z. B. the
In einem Vergleich zu einem Drahtsensor (wie z. B. in Abschnitt 1.1.1 beschrieben) benötigt der Membran-Sensor (z. B. der Gassensor 100) nur 1/3 der Heizenergie bei identischer Sensitivität zur Gaskonzentration eines binären Gemisches. Wie bei dem Draht-Sensor liegt die Heizerstruktur (z. B. das Heizelement 120) beispielsweise mittig als freitragende filigrane Brückenstruktur aufgespannt in einem Messraum des zu detektierenden Gases. Die zwei zum Heizer 120 beidseitig (beispielsweise) in unterschiedlichen Abständen angeordneten Detektor-Drähte können durch "Thermopile" (Thermokette) Strukturen (z. B. der ersten Thermoelement-Struktur 130 und/oder der zweiten Thermoelement-Struktur 140) ersetzt werden, die auf den seitlich aufgespannten Membranflächen (der Membran 110) liegen können und die beispielsweise bis an den Grubenrand (z. B. ein Rand der ersten Unterbrechung 162 bzw. der zweiten Unterbrechung 172) reichen können.In a comparison to a wire sensor (as described, for example, in Section 1.1.1), the membrane sensor (e.g., the gas sensor 100) requires only 1/3 of the heating energy with identical sensitivity to the gas concentration of a binary mixture. As in the case of the wire sensor, the heater structure (eg the heating element 120) is, for example, centered as a cantilever filigree bridge structure stretched in a measuring space of the gas to be detected. The two detector wires arranged on both sides of the heater 120 (for example) at different distances can be replaced by "thermopile" (thermo chain) structures (e.g. the
Beispielsweise sollten die kalten Enden 134, 144 der Thermoketten (Thermopiles) 130, 140 das Trägermaterial (z. B. des Rahmens 150), das eine hohe Wärmeleitfähigkeit besitzen kann (beispielsweise Silizium ca. 150 W/(m*K)) und als Wärmesenke dienen kann (Kühlkörper nahe Raumtemperatur), unmittelbar kontaktieren. Zwischen den kalten Enden 134, 144 der Thermopiles und dem Silizium liegt z. B. das Grund-Membran-Material (Material der Membran 110), das die Kontakte vom Silizium elektrisch isoliert. Da diese Schicht aber sehr dünn ist, kann die Wärme aus den Thermopiles gut ins Silizium über-tragen werden. So kann die Übertemperatur (z. B. gemessen mittels der heißen Enden 132, 142) als direkte Differenz zur Raumtemperatur (z. B. gemessen mittels der kalten Enden 134, 144) gemessen werden. Eine Mess-Stelle zur Temperatur-Kompensation ist beispielsweise direkt auf oder mit dem Siliziumchip (z. B. der Rahmen 150) mechanisch verbunden.For example, the cold ends 134, 144 of the thermal chains (thermopiles) 130, 140 should be the carrier material (e.g. of the frame 150), which can have a high thermal conductivity (e.g. silicon approx. 150 W/(m*K)) and as Heat sink can serve (heat sink close to room temperature), contact immediately. Between the cold ends 134, 144 of the thermopiles and the silicon is z. B. the base membrane material (material of the membrane 110), which electrically isolates the contacts from the silicon. However, since this layer is very thin, the heat from the thermopiles can easily be transferred to the silicon will. Thus, the excess temperature (e.g. measured using the hot ends 132, 142) can be measured as a direct difference to room temperature (e.g. measured using the cold ends 134, 144). A measuring point for temperature compensation is mechanically connected, for example, directly on or with the silicon chip (eg the frame 150).
Um einen parasitären Effekt des Wärmetransports 210, 220 zwischen Heizer 120 und Detektor-Strukturen 130, 140 aufgrund einer Wärmeleitung in dem Membranmaterial der Membran 110 zu reduzieren, kann die Membran 110 konsequent unterbrochen werden, so dass der Wärmetransport 210, 220 von dem Heizer 120 zu den Detektoren 130, 140 hauptsächlich über eine kürzeste laterale Distanz erfolgen kann und somit z. B. eine Strecke über ein dazwischen liegendes Volumen des Messgases (z. B. angeordnet in der ersten Unterbrechung 162 und der zweiten Unterbrechung 172) durchläuft. Dadurch kann die gasartabhängige Übertragungsantwort (z. B. das erste Sensorsignal und das zweite Sensorsignal) des Sensors 130, 140 auf periodische Wärmepulse des Heizers 120 entscheidend erhöht werden.In order to reduce a parasitic effect of
Gemäß einem Ausführungsbeispiel zeigt
Die Unterbrechungen 162i, 172i können in dem ersten Unterbrechungsbereich 160 bzw. in dem zweiten Unterbrechungsbereich 170 in Reihen parallel zu einer Richtung maximaler Ausdehnung des Heizelements 120 angeordnet sein und zusätzlich können die Reihen gegeneinander versetzt angeordnet sein. Das bedeutet beispielsweise, dass durch Membranmaterial gebildete Querstege 112 (verlaufen beispielsweise in einer Richtung senkrecht zu einer Richtung maximaler Ausdehnung des Heizelements 120, von dem Heizelement 120 zu der jeweiligen Thermoelement-Struktur 130, 140) aufeinanderfolgender Reihen versetzt zueinander angeordnet sind. Dies bewirkt beispielsweise, dass eine parasitäre Wärmeleitung 114a, 114b in der Membran 110 einen möglichst langen Weg durchläuft.The
Die Unterbrechungen 162i, 172i sind beispielsweise so angeordnet, dass eine Gitterstruktur in der Membran 110 entsteht, bei der ein Weg einer parasitären Wärmeleitung 114a, 114b durch die Membran 110 länger ist als ein direkter Weg 210, 220. Ein direkter Weg 210, 220 kann beispielsweise ein gerader Weg senkrecht zu dem Heizelement 120, von dem Heizelement 120 zu der jeweiligen Thermoelement-Struktur 130, 140 sein, wobei der direkte Weg 210, 220 ein zu analysierendes Gas, angeordnet in den Unterbrechungen 162i, 172i, durchlaufen kann. Der Weg der parasitären Wärmeleitung 114a, 114b durch die Membran 110 sollte beispielsweise nicht geradlinig verlaufen, sondern einen gewundenen Weg, wie dargestellt in
Bei den Unterbrechungen 162i, 172i kann es sich beispielsweise um längliche Unterbrechungen handeln, die beispielsweise mit einer Toleranz von +/- 20° senkrecht zu einer Hauptrichtung der Wärmeleitung (beispielsweise der direkter Weg 210, 220 von dem Heizelement 120 zu den Thermoelement-Strukturen 130, 140) liegen können.The
Gemäß einem Ausführungsbeispiel kann es sich bei den Unterbrechungen 162i, 172i um rechteckige Ausschnitte mit abgerundeten Ecken handeln. Diese können beispielsweise auch als Langloch bezeichnet werden und es kann sich hierbei beispielsweise auch um ovale Löcher handeln. Dabei können die Unterbrechungen 162i, 172i mindestens dreimal länger als breit sein. Die Länge kann beispielsweise definiert sein, als eine Richtung parallel zu einer maximalen Ausdehnung des Heizelements 120 und die Breite, als eine Richtung senkrecht zu der maximalen Ausdehnung des Heizelements 120. Durch dieses Merkmal kann der Weg der parasitären Wärmeleitung 114a, 114b sehr lang realisiert werden, wodurch eine Qualität der Gasanalyse durch den Gassensor 100 gesteigert werden kann.According to one embodiment, the
Gemäß einem Ausführungsbeispiel können die Unterbrechungen 162i, 172i in dem ersten Unterbrechungsbereich 160 bzw. dem zweiten Unterbrechungsbereich 170 so angeordnet sein, dass ein Abstand 116a, 116b zwischen den Unterbrechungen 162i, 172i einer kleinsten zu realisierenden Strukturbreite, die eine mechanisch haltbare Gitterstruktur ergibt, entspricht. Der Abstand 116a, 116b ist beispielsweise eine Breite von Stegen aus Membranmaterial der Membran 110. Je kleiner der Abstand 116a, 116b realisiert wird, desto geringer kann eine parasitäre Wärmeleitung 114a, 114b sein, wodurch eine Qualität einer Analyse eines Gases durch den Gassensor 100 gesteigert werden kann. Dabei sollte der Abstand 116a, 116b so gewählt sein, dass die durch die Unterbrechungen 162i, 172i entstehende Gitterstruktur in der Membran 110 mechanisch haltbar ist, um eine hohe Qualität der Gasanalyse durch den Gassensor 100 zu gewährleisten.According to one embodiment, the
In anderen Worten kann
Die geometrische Form des Gitters ist beispielsweise so gewählt, dass die parasitäre Wärmeleitung 114a, 114b im Membranmaterial einen möglichst langen Weg durchlaufen muss. Die beispielsweise ovalen Löcher (z. B. die Unterbrechungen 162i, 172i) liegen beispielsweise quer zur Hauptrichtung der Wärmeleitung. Das Aspektverhältnis der ovalen Löcher ist beispielsweise wenigstens dreimal länger als breit, die Stegbreite (z. B. der Abstand 116a, 116b) entspricht beispielsweise der kleinsten zu realisierenden Strukturbreite, die mit der vorhandenen Schichttechnologie eine mechanisch haltbare Gitterstruktur ergibt.The geometric shape of the grid is selected, for example, so that the
So kann der Gassensor 100 aus
Der Gassensor 100 aus
Der Gassensor 100 aus
In anderen Worten kann somit
- einfacher 5 Masken MEMS Prozess auf kostengünstigen Substraten möglich, da die Eigenschaften des Wafermaterials z. B. nur in Dicke, Oberflächengüte und für die Strukturierung der Grube in angepasster Grunddotierung spezifiziert sein sollten.simple 5 mask MEMS process possible on inexpensive substrates, since the properties of the wafer material z. B. should only be specified in terms of thickness, surface quality and for the structuring of the pit in an adapted basic doping.
- gegenüber dem Gassensor auf SOI Strukturierung einer Grube (z. B. für die Membran 110) in angepasster Grunddotierung spezifiziert sein müssen.compared to the gas sensor on SOI structuring of a pit (z. B. for the membrane 110) must be specified in adapted basic doping.
-
Die Strukturen (z. B. das Heizelement 120, die Membran 110, die erste Thermoelement-Struktur 130, die zweite Thermoelement-Struktur 140) sind beispielsweise mit Schutzschichten passiviert und bieten eine bessere Resistenz gegenüber freien Radikalen, die sich im Messgas befinden können und die aktiven Sensor-Strukturen (z. B. die erste Thermoelement-Struktur 130 und/oder die zweite Thermoelement-Struktur 140) anätzen und damit mechanisch schwächen oder thermisch verändern können.The structures (e.g. the
heating element 120, themembrane 110, thefirst thermocouple structure 130, the second thermocouple structure 140) are passivated with protective layers, for example, and offer better resistance to free radicals that can be found in the measurement gas and etch the active sensor structures (e.g. thefirst thermocouple structure 130 and/or the second thermocouple structure 140) and thus mechanically weaken them or thermally change them. -
Substrat benötigt der Gassensor 100 auf Dünnschicht-Membran 110 beispielsweise nur ein Drittel der Heizleistung, um dieselbe Gas-Sensitivität zu erreichen, die Leistungsaufnahme beträgt ca. 12 mW gegenüber 36 mW bei der SOI Technologie.Substrate requires the
gas sensor 100 on thin-film membrane 110, for example, only a third of the heating power to achieve the same gas sensitivity that Power consumption is approx. 12 mW compared to 36 mW with SOI technology. -
Thermopiles (Thermoketten) 130, 140 können statt temperaturveränderliche Widerstandsstrukturen (RTD) als Detektoren eines Wärmeverteilungsfeldes im Messraum realisiert werden: Die elektronische Signalauswertung der Thermopiles 130, 140 ist mit z. B. 0,6 µW nahezu leistungslos, während die Detektoren (z. B. die erste Thermoelement-Struktur 130, die zweite Thermoelement-Struktur 140 aus
Fig. 2a ,Fig. 2b oderFig. 3 ) auf Basis von Widerstandsstrukturen der SOI-Technologie für eine stabile Signalgenerierung einen Stromfluss benötigen aufgrund dessen eine Heizleistung in den Detektor eingetragen wird, die mit ca. 140 µW zwar gering ist, jedoch gegenüber der Thermopile-Technologie 200-fach größer ist und zur Eigenerwärmung der RTD-Detektoren beiträgt und damit parasitär die Gasselektivität verringern kann.Thermopiles (thermo chains) 130, 140 can be implemented as detectors of a heat distribution field in the measuring room instead of temperature-variable resistance structures (RTD). B. 0.6 µW almost without power, while the detectors (e.g. thefirst thermocouple structure 130, thesecond thermocouple structure 140Figure 2a ,Figure 2b or3 ) based on resistance structures of SOI technology require a current flow for stable signal generation due to which a heating power is introduced into the detector, which is low at approx. 140 µW, but is 200 times greater than that of thermopile technology and for self-heating of the RTD detectors and can thus parasitically reduce the gas selectivity.
-
filigrane perforierte Membranen 110 können im Produktionsprozess sowie im Dauerbetrieb brechen, ein optimiertes Design (siehe z. B.
Fig. 4 ,Fig. 5 ,Fig. 6a ,Fig. 6b oderFig. 6c ) ist empfehlenswert.Filigree perforatedmembranes 110 can break in the production process and in continuous operation, an optimized design (see e.g.4 ,figure 5 ,Figure 6a ,Figure 6b orFigure 6c ) is recommended.
In anderen Worten zeigt
Heizer 120und Sensoren
Heizer 120 und Sensor(en) 130, 140 sind im Medium getrennt angeordnet und vom zu analysierenden Gas umgeben.Der Wärmestrom 122b vom Heizer 120zu den Temperatursensoren - Messung in mehreren Abständen
Der Wärmetransport Struktur zwei Abständen Wärmeübergänge - Messung in gleichen Abständen
- Analog zu der Messung mit mehreren Abständen treten hier ebenfalls unbekannte Wärmeübergänge 122a1, 122b1, 122a2, 122b2 auf. Mittels einer Auswertung einer Summe der beiden Sensorsignale kann ebenfalls eine sehr genaue Gasanalyse durchgeführt werden und unter Umständen können die unbekannten Wärmeübergänge 122a1, 122b1, 122a2, 122b2 ebenfalls in der Analyse beachtet werden.
- Hierbei ist anzumerken, dass bei der Messung mit mehrere Abständen alternativ ebenso eine Auswertung eines Summensignals erfolgen kann.
- Ferner ist anzumerken, dass eine Auswertung eines Summensignal gegenüber einer Auswertung eines Differenzsignals bevorzugt wird, da ein Signal-Rausch-Abstand des Differenzsignals kleiner ist, als bei dem Summensignal.
- Optional kann ein Quotient aus Differenzsignal und Summensignal (das ist eine übliche Normierung) zur Auswertung verwendet werden. Der Messeffekt wird damit z. B. stärker hervorgehoben als wenn nur das Summensignal oder nur das Differenzsignal ausgewertet wird.
- Elektrische Analogie
- Um die Wärmeströme zu identifizieren und abzuschätzen, wurde eine elektrische Analogie erstellt (siehe z. B.
Fig. 8 ). Die Optimierung des Wärmeverlusts ist ein wesentlicher Faktor, um die Empfindlichkeit desSensors über das Heizelement 120, einspeisen zu müssen. - Gemäß einem Ausführungsbeispiel weist
Fig. 8 Merkmale und Funktionalitäten desGassensors 100 ausFig. 7 auf. In anderen Worten zeigtFig. 8 eine schematische Darstellung des Wärmetransports andem Gassensor 100. Der Wärmetransport vom Heizer 120 (Temperatur TH) zumSensor 130, 140 (Temperatur TS) findet im Wesentlichen durch das zu messenden Gas statt.
- Um die Wärmeströme zu identifizieren und abzuschätzen, wurde eine elektrische Analogie erstellt (siehe z. B.
-
Heater 120 andsensors
Heater 120 and sensor(s) 130, 140 are arranged separately in the medium and are surrounded by the gas to be analyzed. Theheat flow heater 120 to thetemperature sensors - Measurement at several intervals
Theheat transport unknown heat transfers heater 120 into the gas to be analyzed and viaunknown heat transfers sensor structure distances thermal transitions - measurement at equal intervals
- Analogously to the measurement with several distances,
unknown heat transfers unknown heat transfers - It should be noted here that when measuring with several distances, an evaluation of a sum signal can also take place as an alternative.
- It should also be noted that an evaluation of a sum signal is preferred to an evaluation of a difference signal, since the signal-to-noise ratio of the difference signal is smaller than that of the sum signal.
- Optionally, a quotient of difference signal and sum signal (this is a normal normalization) can be used for the evaluation. The measuring effect is thus z. B. more emphasized than if only the sum signal or only the difference signal is evaluated.
- Analogously to the measurement with several distances,
- Electrical analogy
- To identify and estimate the heat flows, an electrical analogy was made (see e.g.
8 ). Optimizing the heat loss is an essential factor in increasing the sensitivity of thesensor heating element 120 to have to feed. - According to one
embodiment 8 Features and functionalities of thegas sensor 100 from7 on. In other words shows8 a schematic representation of the heat transport at thegas sensor 100. The heat transport from the heater 120 (temperature T H ) to thesensor 130, 140 (temperature T S ) takes place essentially through the gas to be measured.
- To identify and estimate the heat flows, an electrical analogy was made (see e.g.
Bei sinusförmiger Heizleistung 122 ergibt sich ein sinusförmiger Verlauf der Sensorsignale 210, 220 (siehe z. B.
Zur Auswertung werden ausgesendete und empfangene periodische Temperaturwellen verglichen (siehe
Über die Auswertung weiterer Messgrößen, die der Sensor liefert, lassen sich Wärmeleitfähigkeit, Temperaturleitfähigkeit und bei bekannter Dichte des Gases auch die spezifische Wärmekapazität bestimmen - ein möglicher Weg, um auch unbekannte Gasgemische zu analysieren.Thermal conductivity, temperature conductivity and, if the density of the gas is known, the specific heat capacity can be determined by evaluating other measured variables supplied by the sensor - a possible way of also analyzing unknown gas mixtures.
Durch den konstruktiven Unterschied freitragender Brückenstrukturen gegenüber geschlossener Dünnschicht-Membranen wird weitgehend die parasitäre thermische Entkopplung zwischen Heizer und Detektor-Elementen erreicht und die Signalqualität deutlich erhöht. Aufgrund der geringen thermischen Masse des Heizers ist es möglich, den Heizer mit Frequenzen bis zu 300 Hertz zu modulieren, da die Wärme schnell zu- und abgeführt werden kann.Due to the structural difference between self-supporting bridge structures and closed thin-film membranes, the parasitic thermal decoupling between heater and detector elements is largely achieved and the signal quality is significantly increased. Due to the heater's low thermal mass, it is possible to modulate the heater at frequencies up to 300 Hertz, as the heat can be supplied and removed quickly.
Zur Bestimmung der Temperaturleitfähigkeit bei sinusförmiger Heizleistung 122 kann zur Beschreibung des sich ausbreitenden Temperaturfeldes ein Modell nach [ Baehr 2008 ] herangezogen werden.A model according to [ Baehr 2008 ] can be used to determine the thermal conductivity with
Folgende Gleichung beschreibt die zeitabhängige (Zeit t) Temperaturausbreitung entlang der Längenachse x in einen Stab, der an einem Ende mit einer sinusförmigen Temperatur beaufschlagt wird (Mittelwert Tm, Amplitude TA, Winkelfrequenz ω): ![]()
![]()
Beim Eintritt vom Heizer ins gasförmige Medium erfährt das Temperaturfeld die Phasenverschiebung ε 0 und die Dämpfung η 0. ![]()
![]()
Das Temperaturfeld erfährt abhängig vom durch das Medium zurückgelegten Weg x die Phasenverschiebung ε(x) = k 1 · x und die Dämpfung η(x) = e -k1· x. Der wesentliche Faktor für die Änderung der wegabhängigen Größen, k 1, hängt nach [ Baehr 2008 ] von der Temperaturleitfähigkeit a, der Kreisfrequenz ω und somit von der Anregungsfrequenz ƒ ab: 
Der Faktor zur Berücksichtigung der Einflüsse beim Wärmeübergang zwischen Festkörper und Gas ergibt sich aus dem Faktor k 1, dem Wärmeübergangskoeffizienten α und der Wärmeleitfähigkeit λ: ![]()
![]()
Um die Temperaturleitfähigkeit nach dem oben genannten Modell zu bestimmen, ist die Auswertung der Phasenverschiebung ausreichend. Die gesamte Phasenverschiebung in Gleichung (1) beträgt: ![]()
![]()
Werden zwei Temperatur-Messungen in zwei verschiedenen Abständen miteinander verglichen, so kürzen sich die konstanten Wärmeübergangseffekte heraus: ![]()
![]()
Vereinfacht mit den Differenzen Δϕ 12 = Δϕ(x 2) - Δ ϕ (x1) und Δx12 = x2 - x 1 ![]()

![]()
Für die Temperaturleitfähigkeit α (mit Winkeln im Bogenmaß) gilt: ![]()
![]()
Liegen die Phasenverschiebungen im Gradmaß vor, so gilt für die Temperaturleitfähigkeit α: ![]()
![]()
Die Temperaturwelle schwingt harmonisch mit derselben Kreisfrequenz wie ihre Anregung und klingt rasch mit zunehmender Eindringtiefe im Medium stark gedämpft ab, während die Phasenverschiebung zunimmt. Eindringtiefe und Wellenlänge wachsen mit Erhöhung von Schwingdauer und Temperaturleitfähigkeit des Mediums. Bei Betrachtung der Wellenlänge Λ der Temperaturschwingung, die sich aus dem Abstand zweier Messpunkte x1 und x2 ergibt, bei denen sich der Phasenwinkel um 2π unterscheidet, lässt sich die Eindringtiefe der Temperaturwelle herleiten, bei der die Temperaturamplitude auf den n-ten Teil ihres Wertes an dem Eintrittspunkt ins Medium x=0 gesunken ist. Es gilt: aus ![]()

![]()
Die Dämpfung der Amplitude ist somit ebenfalls ein Maß für die Temperaturleitfähigkeit des Mediums.The damping of the amplitude is thus also a measure of the thermal conductivity of the medium.
Die Wärmeleitfähigkeit λ des Mediums wird durch die mittlere Temperaturverteilung im Messraum abgebildet. In Abhängigkeit der mittleren Heizertemperatur und der Gasart bzw. Gemisch-Konzentration im Volumen des Messraumes stellt sich an den Temperatur-Detektoren eine mittlere Temperatur ein, die in einem Verhältnis zum Wärmestrom steht, der durch das gasförmige Medium vom Heizer über die Detektoren bis zur Gehäusewandung fließt. Zur Bestimmung der Wärmeleitfähigkeit müssen die Temperaturen des Heizers und der Detektoren bekannt sein, bei entsprechender Kalibrierung genügt z. B. die Regelung eines Detektors (bevorzugt des zum Heizer näher liegenden Detektors) auf eine konstante (Über-)Temperatur, wenn als Maß für die Wärmeleitfähigkeit die benötigte mittlere Heizenergie ermittelt wird.The thermal conductivity λ of the medium is represented by the mean temperature distribution in the measuring room. Depending on the average heater temperature and the type of gas or mixture concentration in the volume of the measuring chamber, an average temperature is set at the temperature detectors, which is in proportion to the heat flow that flows through the gaseous medium from the heater via the detectors to the housing wall flows. To determine the thermal conductivity, the temperatures of the heater and the detectors must be known. B. the control of a detector (preferably the one closer to the heater) to a constant (excessive) temperature if the required mean heating energy is determined as a measure for the thermal conductivity.
Nach [Simon 2002] und [Baar 2001] besteht das grundlegende Prinzip zur Messung der Wärmeleitfähigkeit von Gasen darin, dass in einem strömungsfreien Messraum mit einem im Gas freistehenden Heizer-Element (z. B. ein Hitzdraht oder eine "Hot Plate" - heiße Platte) eine Übertemperatur über der Umgebungstemperatur erzeugt wird. Die benötigte Heizleistung, um diese Übertemperatur ΔT aufrechtzuerhalten, ist das direkte Maß der Wärmeleitfähigkeit λ und kann mit folgendem Zusammenhang beschrieben werden: ![]()
![]()
Aufgabe der Elektronik und Signalauswertung ist, mit einem möglichst preisgünstigen miniaturisierten System z. B. ein zuverlässiges von der Gaskonzentration direkt abhängiges Messergebnis zu generieren. Zudem soll der erfindungsgemäße Gassensor in einem Atemgasmonitor einsetzbar sein, bei dem sich mit hoher Dynamik die Kohlenstoffkonzentration im Luftgemisch ändern kann. So soll der Gassensor Änderungen der Gaszusammensetzung im Beatmungszyklus der Inspiration und Exspiration bis zu einer Rate von 60 Hüben pro Minute auflösen können. Es ist somit eine schnelle Auswertung der Sensorsignale wünschenswert.The task of the electronics and signal evaluation is to use a miniaturized system that is as inexpensive as possible, e.g. B. to generate a reliable measurement result that is directly dependent on the gas concentration. In addition, the gas sensor according to the invention should be able to be used in a respiratory gas monitor in which the carbon concentration in the air mixture can change with high dynamics. The gas sensor should be able to resolve changes in the gas composition in the ventilation cycle of inspiration and expiration up to a rate of 60 strokes per minute. A rapid evaluation of the sensor signals is therefore desirable.
Gegenüber der in der weiter oben theoretisch betrachteten Analogie bei der Übertragung der Gesetzmäßigkeiten für eine gedämpfte Schwingung auf ein Wärmetransport-Phänomen am Beispiel einer sinusförmigen Heizer-Anregung wird auf der entwickelten µController Elektronik (beispielsweise) ein Rechtecksignal erzeugt. Dieses lässt sich aufgrund der im Prozessor vorhandenen Timer-Strukturen zeitlich wesentlich präziser erzeugen, als ein synthetisches Sinussignal, dass vom Prozessor auf dessen Digital/Analog (DA) Port ausgegeben würde.In contrast to the analogy theoretically considered above when transferring the laws for a damped oscillation to a heat transport phenomenon using the example of a sinusoidal heater excitation, a square-wave signal is generated on the developed µcontroller electronics (for example). Due to the timer structures in the processor, this can be generated much more precisely in terms of time than a synthetic sinusoidal signal that would be output by the processor on its digital/analog (DA) port.
Über einen DA-Wandler werden beispielsweise 2 Heizer-Spannungen vorgegeben. Dies ist der Tatsache geschuldet, dass der DA-Wandler über SPI angesteuert wird, und der Zeitpunkt, ab dem ein neuer DA-Wert übernommen wird, nicht exakt mit dem gewählten Prozessor-Baustein (CPU) bestimmbar ist. Das ist aber Voraussetzung um die Phasenlage der Sensor-Antwort bestimmen zu können. Deshalb wird beispielsweise über einen Analog-Schalter abwechselnd eine der beiden Spannungen auf den Heizer-Verstärker gegeben. Damit die steilen Schaltflanken sich weniger im System ausbreiten, werden diese beispielsweise durch einen nachgeschalteten Tiefpass verschliffen. Die Operationsverstärker (OP) Schaltung hebt die Spannung auf den vom Heizer benötigten Spannungspegel an. Ein weiterer OP kompensiert beispielsweise den am Strom-Messwiderstand entstehenden Spannungsabfall. Da der Strom gemessen und die Heizer-Spannung bekannt ist, kann die Heizer-Leistung berechnet werden. Dies ist insofern wichtig, als sich der Heizer-Widerstand mit der Temperatur verändern kann.For example, 2 heater voltages are specified via a DA converter. This is due to the fact that the DA converter is controlled via SPI, and the time from which a new DA value is accepted is not exactly the same as the one selected Processor module (CPU) can be determined. However, this is a prerequisite for being able to determine the phase position of the sensor response. For this reason, one of the two voltages is alternately applied to the heater amplifier via an analog switch, for example. So that the steep switching edges spread less in the system, they are smoothed out, for example, by a downstream low-pass filter. The operational amplifier (OP) circuit boosts the voltage to the voltage level required by the heater. Another OP compensates, for example, for the voltage drop that occurs at the current measuring resistor. Since the current is measured and the heater voltage is known, the heater power can be calculated. This is important because heater resistance can vary with temperature.
Beispielsweise kann ein Heizer-Tastverhältnis von 50% verwendet werden (wobei beispielsweise ein periodisches Rechtecksignal mit einem Tastverhältnis von beispielsweise 50% +/-2% an den Heizer angelegt wird).For example, a heater duty cycle of 50% may be used (eg, a periodic square wave having a duty cycle of, for example, 50% +/-2% is applied to the heater).
Alternativ können aber auch kürzere Tastverhältnisse verwendet werden, zum Beispiel im Bereich 5..50%.Alternatively, however, shorter duty cycles can also be used, for example in the range of 5..50%.
Um eine gleiche Leistung zwischen einem Sinus (Offset bei Upp/2, beide Halbwellen im positiven Bereich) und einem Rechteck zu erhalten, benötigt man beispielsweise für den gleichwertigen Rechteck bzw. für ein "gleichwertiges" oder leistungsgleiches Rechtecksignal ein Tastverhältnis von 42%.In order to obtain the same power between a sine (offset at Upp/2, both half-waves in the positive range) and a square, you need a duty cycle of 42% for the equivalent square or for a square-wave signal of "equivalent" or the same power.
In einigen Beispielen ist die Anpassung der Heizerleistung durch Regelung des Tastverhältnisses nicht realisiert- dies ist schwieriger auf dem MSP430, doch interessant bei Verwendung leistungsfähigerer µController: Man kann mit fester Betriebsspannung arbeiten und ändert nur das Tastverhältnis (eine Art PWM-Ansteuerung).In some examples, the heater output is not adjusted by controlling the duty cycle - this is more difficult on the MSP430, but interesting when using more powerful µcontrollers: You can work with a fixed operating voltage and only change the duty cycle (a kind of PWM control).
In anderen Worten, optional ist es möglich, die (mittlere) Heizerleistung durch Änderung des Tastverhältnisses einzustellen. Alternativ dazu kann die Heizerleistung durch Änderung der Spannungspegel (der an den Heizer angelegten Spannung) bzw. der Strompegel (des durch den Heizer bzw. das Heizelement fließenden Stromes) einzustellen. Die beiden Möglichkeiten sind auch kombinierbar.In other words, it is optionally possible to adjust the (average) heater power by changing the duty cycle. Alternatively, the heater power can be adjusted by changing the voltage levels (the voltage applied to the heater) or the current levels (the current flowing through the heater or heating element). The two options can also be combined.
Gemäß einem Beispiel steuert eine CPU einen Heizer, so dass eine Amplitude des Sensorsignals in einem ADC-Bereich bleibt. Über eine Lupenfunktion wird z. B. das Sensorsignal innerhalb der ADC-Grenzen gehalten. Eine Phasenauswertung erfolgt z. B. über den Komparator unter Ausnutzung der MSP430 Timer-Strukturen (Zeitstrukturen).According to one example, a CPU controls a heater so that an amplitude of the sensor signal stays in an ADC range. A magnifying glass function z. B. kept the sensor signal within the ADC limits. A phase evaluation is carried out e.g. B. via the comparator using the MSP430 timer structures (time structures).
Eine Widerstandsänderung des Sensor-Drahts (z. B. der Thermoelement-Struktur) ist sehr gering. Aus diesem Grund wird ein Verstärker mit hohem Verstärkungsfaktor bevorzugt oder benötigt. Da ein Absolut-Wert einer Eingangsspannung (z. B. der Sensorsignale) von vielen Faktoren abhängt, ist es empfehlenswert, diesen Wert zu kompensieren.A change in resistance of the sensor wire (e.g. the thermocouple structure) is very small. For this reason, a high gain amplifier is preferred or needed. Since an absolute value of an input voltage (e.g. the sensor signals) depends on many factors, it is advisable to compensate this value.
Eine Möglichkeit wäre einen Wechselstrom (AC) Verstärker zu verwenden. Nachteil ist, dass dieser eine unbekannte Phasenverschiebung verursacht.One possibility would be to use an alternating current (AC) amplifier. The disadvantage is that this causes an unknown phase shift.
Deshalb wurde beispielsweise ein Gleichstrom (DC) Verstärker verwendet, der keine Phasenverschiebung aufweist. Um nun den Gleichanteil des Signals zu kompensieren, wird beispielsweise am Differenzeingang des Operationsverstärkers (OP) der negative Eingangsanschluss auf den Mittelwert des Detektor-Signals angehoben und mithilfe eines Software-Reglers aktiv nachgeführt, der Digital-Analog-Umsetzer (DAC) desTherefore, for example, a direct current (DC) amplifier was used, which has no phase shift. In order to compensate for the DC component of the signal, the negative input connection at the differential input of the operational amplifier (OP), for example, is raised to the mean value of the detector signal and actively tracked using a software controller, the digital-to-analog converter (DAC) of the
Prozessors gibt diese Spannung direkt aus. Durch die differentielle Arbeitsweise des Differenzeinganges am OP werden die Gleichanteile der Eingangsspannungen voneinander subtrahiert und allein der Wechselanteil des Signals verstärkt. Dazu wird gemäß einem Aspekt das von Analog zu Digital umgesetzte (ADC) Signal gemessen und überprüft, ob dieses innerhalb vernünftiger, vom ADC erfassbaren Grenzen liegt. Stößt das Signal an die obere oder untere Spannungsgrenze des OPs an, so wird der DAC-Wert entsprechend angepasst. Es entsteht also ein Verstärker, bei dem das verstärkte Signal kontinuierlich im optimalen Arbeitsbereich oder Arbeitsfenster gehalten wird, wobei durch Entfernung des Gleichanteils der Verstärkungsfaktor am OP erhöht werden kann, eine Art "Lupenfunktion". Der zur Kompensation notwendige DAC-Wert kann als weiterer Parameter zur Auswertung dienen, mit dem die absolute mittlere Detektor-Temperatur bestimmt werden kann und über den Zusammenhang aus Gleichung (5) die Bestimmung der Wärmeleitfähigkeit des Gasgemisches erfolgen kann.processor outputs this voltage directly. Due to the differential mode of operation of the differential input on the OP, the DC components of the input voltages are subtracted from one another and only the AC component of the signal is amplified. To do this, in one aspect, the analog-to-digital converted (ADC) signal is measured and checked to see if it is within reasonable limits detectable by the ADC. If the signal hits the upper or lower voltage limit of the OP, the DAC value is adjusted accordingly. The result is an amplifier in which the amplified signal is continuously kept in the optimal working range or working window, whereby the amplification factor on the OP can be increased by removing the DC component, a kind of "magnifying glass function". The DAC value required for compensation can be used as a further parameter for evaluation, with which the absolute mean detector temperature can be determined and the thermal conductivity of the gas mixture can be determined via the relationship from equation (5).
Um die Phasenlage des Sensor-Signals zu bestimmen, wurde beispielsweise ein Schmitt Trigger verwendet. Er ist so eingestellt, dass er kurz über bzw. unter dem Nulldurchgang des Sensor-Signals schaltet. Hier ist das Signal am steilsten und verursacht damit das kleinste Phasenrauschen. Der DC-Anteil wird beispielsweise über einen Kondensator entfernt. Damit ist eine Phasenbestimmung der Sensor-Antwort möglich.A Schmitt trigger, for example, was used to determine the phase position of the sensor signal. It is set to switch just above or below the zero crossing of the sensor signal. Here the signal is at its steepest and thus causes the smallest phase noise. The DC component is removed via a capacitor, for example. This makes it possible to determine the phase of the sensor response.
Durch die Verwendung der internen Timer-Strukturen des Prozessors (MSP430, Texas Instruments) ist eine theoretische Phasenauflösung von 0,009° möglich. Diese wird jedoch durch Rauschen der Schaltung nicht erreicht.By using the processor's internal timer structures (MSP430, Texas Instruments), a theoretical phase resolution of 0.009° is possible. However, this is not achieved due to circuit noise.
Die Software hat z. B. verschiedene Aufgaben:
- Setzen der Start-Werte für Heizer-Spannung, Abtastzeitpunkte der Sensor-Signale und des Startwerts für den DC-Arbeitspunkt (Lupen-Funktion).
- Zuerst wird beispielsweise versucht, den DC-Arbeitspunkt zu finden. Dazu werden die DAC-Werte der beiden Sensoren so eingestellt, dass sich das Sensor-Signal beispielsweise mittig im ADC-Range befindet.
- Messen der Sensorspannung zu bestimmten Zeitpunkten. Um die Amplitude zu ermitteln, wird die Spannung im vermuteten Maximum und Minimum erfasst. Um zu erkennen, dass der Abtastzeitpunkt falsch gewählt ist, erfolgt noch eine Messung im vermuteten "Nulldurchgang". Stimmen die Abtastzeitpunkte, so gilt z. B.:

- Ist der Amplitudenregler aktiv, so wird beispielsweise versucht, die Amplitude vom Sensor1-Signal auf einem gewissen Sollwert zu halten. Die Heizer-Energie wird beispielsweise derart geregelt, dass die S1-Amplitude den ADC-Range um wenigstens 3/4 ausfüllt. Der Regler kann optional per Software abgeschaltet werden. Zudem ist er beispielsweise nur aktiv, wenn keine Abtastzeitpunkte oder DC-Offsets geändert wurden. Dies stellt optional sicher, dass dieser Regelkreis nur im eingeschwungenen Zustand aktiv ist.
- Bestimmung der Phasenlage des Sensorsignals mit Hilfe der Schmitt-TriggerSchaltung (Optional). Je nach Einstellung erfolgt dabei auch die
Berechnung der 3 Abtastzeitpunkte des Sensorsignals für die nächste Abtast-Periode. - Über weitere Sensoren wird der Umgebungsdruck und die Temperatur erfasst (optional)
- Setting the start values for heater voltage, sampling times of the sensor signals and the start value for the DC operating point (magnifying glass function).
- First, for example, an attempt is made to find the DC operating point. To do this, the DAC values of the two sensors are set in such a way that the sensor signal is, for example, in the middle of the ADC range.
- Measuring the sensor voltage at specific points in time. In order to determine the amplitude, the voltage is recorded at the presumed maximum and minimum. Around to recognize that the sampling time has been selected incorrectly, another measurement is carried out at the presumed "zero crossing". If the sampling times are correct, e.g. e.g.:
- If the amplitude controller is active, an attempt is made, for example, to keep the amplitude of the Sensor1 signal at a certain setpoint. The heater energy is regulated, for example, in such a way that the S1 amplitude fills the ADC range by at least 3/4. The controller can optionally be switched off via software. In addition, it is only active, for example, if no sampling times or DC offsets have been changed. This optionally ensures that this control loop is only active in the steady state.
- Determination of the phase position of the sensor signal using the Schmitt trigger circuit (optional). Depending on the setting, the 3 sampling times of the sensor signal are also calculated for the next sampling period.
- The ambient pressure and temperature are recorded via additional sensors (optional)
In der Software arbeiten mehrere ineinander geschachtelte Regler. Der innerste ist der DC-Arbeitspunkt-Regler. Beispielsweise nur wenn dieser eingeschwungen ist (keine Anpassung des DC-Offsets notwendig war), dann erfolgt die Nachführung der Abtastzeitpunkte. Im Amplituden-Regelkreis wird die Amplitude von S1 beispielsweise konstant gehalten - aber beispielsweise nur wenn keine Anpassung des DC-Offsets und Abtastzeitpunkts notwendig war. Im äußeren Regelkreis kann (optional) die benötigte Heizenergie zur Ausregelung der S1-Amplitude derart eingeregelt werden, dass sich das thermische System auf eine große Bandbreite verschiedener Gasgemische dynamisch adaptieren kann.Several nested controllers work in the software. The innermost is the DC operating point controller. For example, only when this has settled (no adjustment of the DC offset was necessary), then the tracking of the sampling times takes place. In the amplitude control loop, the amplitude of S1 is kept constant, for example - but only if no adjustment of the DC offset and sampling time was necessary. In the outer control circuit (optional), the heating energy required to regulate the S1 amplitude can be regulated in such a way that the thermal System can dynamically adapt to a wide range of different gas mixtures.
Für die Amplituden-Bestimmung werden beispielsweise 3 A/D-Samples pro Sensor-Draht benötigt: Minimum im unteren Scheitelpunkt, Nulldurchgang und Maximum im oberen Scheitelpunkt, Der Ablauf ist beispielsweise folgendermaßen:
- Alle AD-Werte werden beispielsweise zunächst mit der aktuellen Einstellung gemessen.
- Nun wird beispielsweise geprüft, ob die Min/Max-A/D-Werte für S1 und S2 im gültigen Bereich liegen. Falls nicht, erfolgt eine Nachstellung des DC-Arbeitspunktes des Verstärkers (über DAC) und alle weiteren Regler werden vorübergehend abgeschaltet. Erst wenn beide Sensor-Kanäle im erlaubten Arbeitsbereich liegen (A/Dmax < 3900 bzw. A/Dmin > 200, d. h.
im Bereich von 5..95% des A/D-Ranges von 4096 digits), werden die weiteren Regler wieder aktiv. - Damit die Amplitude richtig gemessen werden kann, sollte die A/D-Wandlung zur richtigen Zeit erfolgen (oberer/unterer Scheitelpunkt und zur Überprüfung noch den Nulldurchgang). Dazu gibt es derzeit beispielsweise zwei Wege:
- ∘ Über die A/D-Wandlung selbst: Der Zeitpunkt des Nulldurchganges wird in der halben Zeit zwischen den beiden gemessenen Zeitpunkten für die minimalen und maximalen Scheitelpunkt der A/D-Werte erwartet, d. h., (Min+Max)/2 sollte gleich dem A/D-Wert beim Nulldurchgang entsprechen. Bei Abweichungen wird der Sample-Zeitpunkt für die nächste Messung angepasst. Eine Abweichung von beispielsweise rund 0,625° (Grad) oder 14,47 µs wird toleriert.
- ∘ Über das Komparator-Signal: Da der Komparator zum Zeitpunkt des Nulldurchgangs des Sensor-Signals schaltet, kann beispielsweise der Zeitpunkt, an der die A/D-Messungen stattfinden sollen, ermittelt werden: Zum Messwert des Umschaltzeitpunktes der positiven Flanke werden 90° (bzw. 2,0833 ms für den oberen Scheitelpunkt), 180° (4,1666 ms für den Nulldurchgang der negativen Flanke) und 270° (6,2499 ms für den unteren Scheitelpunkt) addiert. Auch hier wird eine Abweichung von 0,625° toleriert.
- Beispielsweise nur wenn beide Regler (DC-Arbeitspunkt und Phase) keine Stellwert-Änderung benötigt hatten, sich demnach im eingeschwungen Zustand befanden, dann erst greift der Amplituden-Regler. Dieser stellt den Heizer-Wert so nach, dass die gewünschte Amplitude von S1 erreicht wird.
- For example, all AD values are initially measured with the current setting.
- For example, it is now checked whether the min/max A/D values for S1 and S2 are in the valid range. If not, the DC operating point of the amplifier is adjusted (via DAC) and all other controllers are temporarily switched off. Only when both sensor channels are within the permitted working range (A/Dmax < 3900 or A/D min > 200, ie in the range of 5..95% of the A/D range of 4096 digits) do the other controllers become active again active.
- In order for the amplitude to be measured correctly, the A/D conversion should take place at the correct time (upper/lower peak and, for verification, the zero crossing). There are currently two ways to do this:
- ∘ About the A/D conversion itself: The zero crossing time is expected to be halfway between the two measured times for the minimum and maximum peaks of the A/D values, ie, (Min+Max)/2 should equal that A/D value at zero crossing. In the event of deviations, the sample time for the next measurement is adjusted. A deviation of around 0.625° (degrees) or 14.47 µs, for example, is tolerated.
- ∘ Via the comparator signal: Since the comparator switches at the time of the zero crossing of the sensor signal, the point in time at which the A/D measurements should take place can be determined, for example: 90° ( and 2.0833 ms for the upper peak), 180° (4.1666 ms for the zero crossing of the negative edge) and 270° (6.2499 ms for the lower peak). A deviation of 0.625° is also tolerated here.
- For example, only if both controllers (DC operating point and phase) did not require a change in the control value, i.e. were in a steady state, then the amplitude controller only takes effect. This adjusts the heater value so that the desired amplitude of S1 is reached.
In Fig. 12a wird ein Blockdiagramm gezeigt, das eine beispielhafte Regelung und Nachführung der DC-Arbeitspunkte der beiden Detektor-Verstärker darstellt.A block diagram is shown in FIG. 12a, which represents an exemplary regulation and tracking of the DC operating points of the two detector amplifiers.
In
Gemäß einem Beispiel können die
Die ADC-Messzeitpunkte, an denen der Analog-Digital-Wandler des µControllers die Stromaufnahme des Heizers und die Detektor-Spannungen (ein Beispiel für die Sensorsignale) misst, sind z. B. in einer Timing-Tabelle der Software definiert, die sich über zwei Heizer-Puls-Perioden erstreckt. Diese zwei Perioden werden deshalb zum Beispiel benötigt, weil auf dem verwendeten Prozessor z. B. nur ein Timer (Zeitgeber) zur variablen ADC-Steuerung zur Verfügung steht. Bei Betrieb des Heizers mit 120 Hz erhält man nach Ablauf von 2 Perioden alle zur Gasgemisch-Auswertung relevanten Messwerte, d. h. mit einer Frequenz von 60Hz. Da die Pulsform des Heizers über die Periode stabil ist, kann der aufgenommene Heizer-Strom zu festen Zeitpunkten gemessen werden: Bei 45° für den Spitzen-Wert und bei 170° für den unteren Heizstrom-Wert (im allgemeinen Null). Die jeweils 3 ADC-Messwerte pro Detektor (oberer und unterer Scheitelpunkt sowie der Nulldurchgang) werden als variable Messwerte in Zeitfenstern erwartet, die in der Timing-Tabelle definiert sind:
- ADC_SENSOR1:
- ∘ CO2-S1-min: 33,6° .. 123,6° (778 µs .. 2861 µs)
- ∘ CO2-S1-Null: 123,6° .. 213,6° (2861 µs .. 4944 µs)
- ∘ CO2-S1-max: 213,6° .. 303,6° (4944 µs .. 7028 µs)
- ADC_SENSOR2:
- ∘ CO2-S2-min: 68,6°-141,4° (1588 µs .. 3273 µs)
- ∘ CO2-S2-Null: 158,6°-231,4° (3671 µs .. 5356 µs)
- ∘ CO2-S2-max: 248,6° .. 321,4° (5755 µs .. 7440 µs)
- ADC_SENSOR1:
- ∘ CO2-S1-min: 33.6° .. 123.6° (778 µs .. 2861 µs)
- ∘ CO2-S1 zero: 123.6° .. 213.6° (2861 µs .. 4944 µs)
- ∘ CO2-S1-max: 213.6° .. 303.6° (4944 µs .. 7028 µs)
- ADC_SENSOR2:
- ∘ CO2-S2-min: 68.6°-141.4° (1588 µs .. 3273 µs)
- ∘ CO2-S2 zero: 158.6°-231.4° (3671 µs .. 5356 µs)
- ∘ CO2-S2-max: 248.6° .. 321.4° (5755 µs .. 7440 µs)
In
In
Ein Sensorsignal kann stark von Druck und Temperatur abhängig sein. Zur korrekten Bestimmung der Gaseigenschaften sollten deshalb die Quereffekte bekannt sein und von den Algorithmen korrigiert werden. In
Der Druck-Einfluss zeigt einen linearen Zusammenhang, der Temperatur-Einfluss einen quadratischen wie theoretisch berechnet. Beide Querempfindlichkeiten liegen in der Größenordnung des Signals für die Gaskonzentration selbst.The pressure influence shows a linear relationship, the temperature influence a quadratic one, as calculated theoretically. Both cross-sensitivities are of the order of magnitude of the signal for the gas concentration itself.
Verglichen mit Luft sollte bei Messungen in Brenngasen die Heizleistung etwas reduziert werden, damit das System nicht seinen A/D Bereich überschreitet. Bei der Heizleistungs-Variation hat sich herausgestellt, dass es in der Praxis sinnvoll ist, das System mit größtmöglichen Sensor-Amplituden zu betreiben und somit stabilere Signale zu erhalten, als die Heizleistung auf ein Minimum einzustellen, bei der das Probegas zwar thermisch weniger beeinflusst wird, jedoch auch der Signal-Rausch-Abstand sinkt. Die in den Sensor periodisch eingetragene Heizenergie muss das Probevolumen innerhalb dieser Periode z. B. verlassen können, damit es sich nicht stetig aufheizt. Bei drei aufgebauten Mess-Systemen wurde beispielsweise eine Spitzen-Heizleistung von ca. 26 mW bei 120 Hz fest eingestellt.When measuring in combustible gases, the heating power should be slightly reduced compared to air, so that the system does not exceed its A/D range. When varying the heating power, it has been found that in practice it makes sense to operate the system with the largest possible sensor amplitudes and thus obtain more stable signals than to set the heating power to a minimum, at which the sample gas is thermally less influenced , but the signal-to-noise ratio also decreases. The heating energy periodically entered into the sensor must cover the sample volume within this period, e.g. B. can leave, so it does not heat up steadily. For example, a peak heat output of approx. 26 mW at 120 Hz was permanently set for three measuring systems that were set up.
Das Sensorverhalten stellt einen idealen Tiefpass 1. Ordnung dar, es existieren keine oberwelligen Spektralanteile im Sensorsignal. Aus diesem Grund ergibt ein aktives Wobbeln durch ein Frequenzspektrum keine zusätzliche Information. So wurde beschlossen, den Sensor bei einer fixen Frequenz zu betreiben, der Elektronik-Aufwand für das System konnte reduziert werden, die notwendige Messzeit bis zum Erhalt eines gesicherten Wertes ist deutlich kürzer. (alles optional)The sensor behavior represents an ideal first-order low-pass filter, there are no harmonic spectral components in the sensor signal. Because of this, actively sweeping through a frequency spectrum yields no additional information. So it was decided to operate the sensor at a fixed frequency, the electronics effort for the system could be reduced, the necessary measurement time to obtain a reliable value is significantly shorter. (all optional)
Je höher die Anregungsfrequenz am Heizer wird, desto weniger Energie kann zwischen Heizer und Detektor durch das Gas übertragen werden, weil die thermischen Massen des Sensors selbst die Übertragungsgeschwindigkeiten zwischen Festkörper und Gas begrenzen. Die Amplitude sinkt mit zunehmender Frequenz zu einem verschwindenden Signal gegen Null (siehe
Die Bildung eines Optimums aus Phasenauflösung, Phasendifferenz und Amplitude für verschiedene Gasgemische ergab die beste Phasenantwort bei einer Frequenz von z. B. 120 Hz bei einer Heizleistung von 26 mW für den Mikrodraht-Sensor und von 160 Hz bei ca. 8 mW für den MEMS Thermopile-Sensor auf Dünnschicht-Membran. (Details optional)Forming an optimum of phase resolution, phase difference and amplitude for different gas mixtures gave the best phase response at a frequency of e.g. B. 120 Hz at a heating power of 26 mW for the microwire sensor and 160 Hz at approx. 8 mW for the MEMS thermopile sensor on a thin-film membrane. (details optional)
Auf einem Messplatz wurden unterschiedliche Gas-Zusammensetzungen untersucht.
Das Sensorsignal zeigt starke Druck- und Temperatur-Abhängigkeiten. Zur korrekten Bestimmung der Gaseigenschaften eines bekannten Gemisches mit Rückführung auf Standardbedingungen und dem Vergleich aus Tabellenwerken sollten deshalb z. B. die Quereffekte bekannt sein und korrigiert werden. Der Druck-Einfluss zeigt einen linearen Zusammenhang, der Temperatur-Einfluss einen quadratischen. Beide Querempfindlichkeiten liegen in der Größenordnung des Signals für die Gaskonzentration selbst.The sensor signal shows strong pressure and temperature dependencies. For the correct determination of the gas properties of a known mixture with traceability to standard conditions and comparison from tables, e.g. B. the cross effects are known and corrected. The pressure influence shows a linear correlation, the temperature influence a quadratic one. Both cross-sensitivities are of the order of magnitude of the signal for the gas concentration itself.
Als besonders stabiles Sensor-Signal hat sich eine Kombination aus Phasen- und Amplituden-Messung erwiesen (Kombinationssignal). Beide Signale werden beispielsweise mithilfe separater Konstanten gewichtet und beispielsweise miteinander addiert und somit zu einem einzigen Sensor-Signal zusammengeführt: ![]()
![]()
Das addierte Phasensignal sigPhi wird beispielsweise aus der Summe der beiden Phasendifferenzen für die Laufzeiten zwischen der steigenden Flanke des Heizer-Impulses und den steigenden Flanken an den Detektoren gebildet. Es gilt beispielsweise: ![]()
![]()
Wie in
Beispielsweise durch Differenzbildung aus Heizer-Amplitude und der Summe der Detektor-Amplituden wird das relative Amplituden-Signal mit Erhöhung des CO2-Gehalts im Gasgemisch steigend: ![]()
![]()
Das aus Phase und Amplitude berechnete Signal sigX bewegt sich beispielsweise im Bereich zwischen (1,7..2,0) für (0..6) vol% CO2. Das Device (z. B. der Gassensor) wurde in einem Temperatur-Bereich zwischen (16..28)°C und im barometrischen Druckfeld zwischen (900..1200) mbar vermessen.The signal sigX calculated from phase and amplitude moves, for example, in the range between (1.7..2.0) for (0..6) vol% CO 2 . The device (e.g. the gas sensor) was measured in a temperature range between (16..28)°C and in the barometric pressure field between (900..1200) mbar.
Bei der Kalibration des Sensors auf ein bekanntes Gasgemisch sollte die starke Druck- und Temperaturabhängigkeit des Sensor-Signals kompensiert werden, um vom Messwert auf eine Gas-Konzentration schließen zu können.When calibrating the sensor to a known gas mixture, the strong pressure and temperature dependency of the sensor signal should be compensated in order to be able to deduce a gas concentration from the measured value.
Es ergibt sich daraus beispielsweise ein 4-dimensionales Vektorfeld (Matrix), das sich aus Gas-Konzentration (CO2 [vol%]), dem Sensorsignal sigX (Summensignal aus Phase und Amplitude), der Druckdrift und der Temperatur-Drift zusammensetzt. Auffällig ist, dass die einzelnen Graphen im Diagramm aus
Werden die Kennlinien des Sensorsignals sigX aus der gemessenen Variation für jede Temperatur und eine mittlere Gaskonzentration über dem Druck aufgetragen (siehe
Legt man in die parallele Geradenschar in
Bei der Kalibration des Gassensors auf ein bestimmtes Gasgemisch werden aus der Variationsmatrix nacheinander Regressionen über die oben beschriebenen Zusammenhänge gebildet. Regressions-Ebene A beschreibt den Zusammenhang zwischen der Gaskonzentration der Kalibrier-Referenz und dem Sensorsignal sigX. Die einzelnen Kurven pro Druck- und Temperatur werden jeweils in einer quadratischen Regression nach der Form: y = A.c0 + A.c1*sigX + A.c2*sigX^2 angenähert. Da der Anstieg aller Kurven nahezu konstant ist und der quadratische Koeffizient c2 gegen Null geht, wird aus allen Werten für die Koeffizienten A.c0, A.c1 und A.c2 jeweils der Mittelwert gebildet, man erhält die in
Die Regressions-Ebene B beschreibt die Druck-Drift des Sensorsignals sigX. Der Offset A.c0 wird in Abhängigkeit der Druck-Drift neu berechnet: A.c0 = sigX.y0 - B.c1*Druck.x0 - B.c2*Druck.x0^2. Kann sigX.y0 = 0 gesetzt werden, vereinfacht sich die Gleichung zu: A.c0 = -(B.c1*Druck.x0 + B.c2*Druck.x0^2). Der (nun) druckabhängige Polynom-Koeffizient A.c0=f(p) wird z. B. in der Regressionsgleichung der Ebene A ersetzt (substituiert).The regression level B describes the pressure drift of the sensor signal sigX . The offset A.c0 is recalculated depending on the pressure drift: A.c0 = sigX. y 0 - B . c1* pressure. x 0 - B.c2* print. x 0 ^2. Can sigX. If y 0 = 0 are set, the equation simplifies to: A.c0 = -(B.c1* pressure .x 0 + B.c2* pressure .x 0 ^2) . The (now) pressure-dependent polynomial coefficient A.c0=f(p) is e.g. B. replaced (substituted) in the regression equation of level A.
Der ermittelte druckabhängige Offset für das Polynom der Regressions-Ebene A errechnet sich z. B. aus dem Cosinus Zusammenhang der Winkel-Beziehung zwischen Offset und Anstieg mit: A.c1 = A.c0/sigX0; sigXo = f(p) und A.c0 = (-1)* sigX * A.c1. Bei Polynomen mit höherer Ordnung sollte die 1. Ableitung der Kurve gebildet und daraus der Anstieg im Referenz-Punkt berechnet werden.
Der berechnete Wert für die Gas-Konzentration aus dem Polynom der Regressions-Ebene A wird beispielsweise um die Druck- und Temperatur-Drift korrigiert: 
Werden die festen Referenzen, die die geometrische Mitte des Variationsbereiches darstellen, in die Formel eingesetzt und die Polynome entsprechend aufgelöst, so ergeben sich folgende Gleichungen. Mit B.ref = B.y( c.ref) folgt: 
Für C.ref = 1050 mbar eingesetzt ergibt sich: 
Neben der Kalibration des Sensorsignals auf die Konzentration eines bekannten Gasgemisches, ist es außerdem möglich, die Temperaturleitfähigkeit a des Gasgemisches direkt zu bestimmen. In
Somit wird hierin ein Design uns eine Auswertung eines thermischer Gassensor zur Messung physikalischer Gaseigenschaften beschrieben. Mit dieser Erfindung wird folgendes vorgeschlagen (Aspekte sind unabhängig voneinander und in Kombination einsetzbar):
- Sensor-Design auf Basis zweier Technologie-Varianten: MEMS Draht-Sensor auf SOI-Substrat und Thermopile-Sensor auf Dünnschicht-Membran
- Betrieb des Gassensors: Signal-Generierung und -Auswertung auf einem embedded System
- Auswertealgorithmus zur Kalibration auf ein Gasgemisch mit Drift-Korrektur gegenüber Gas-Druck und -Temperatur
- Sensor design based on two technology variants: MEMS wire sensor on SOI substrate and thermopile sensor on thin-film membrane
- Operation of the gas sensor: signal generation and evaluation on an embedded system
- Evaluation algorithm for calibration to a gas mixture with drift correction in relation to gas pressure and temperature
Gemäß einem Beispiel weist der Start-Peak 312 für ein und denselben Gassensor immer den gleichen Wert auf (evtl. können geringe Schwankungen von weniger als 1%, 0.5% oder 0.1% auftreten). Gemäß den in den
Der Heizer erwärmt sich während der Heizperiode 302, wodurch ein Heizer-Widerstand entsprechend einem positiven TKR (Temperaturkoeffizienten) steigt und der Heizer eine Endtemperatur im Abschalt-Moment erreicht (Ihz=U/RHz → Ihz ≈ 1/RHz). Je kleiner der Heiz-Strom-Endwert 314, desto heißer der Heizer, desto weniger Wärme wurde an ein den Heizer umgebendes zu analysierendes Gas oder Gasgemisch abgegeben und desto geringer ist die Wärmeleitfähigkeit des Gases oder Gasgemisches.The heater heats up during the
In den Beispielen gemäß den
Gemäß dem Beispiel aus
Das CO2-Gemisch aus
Gemäß einem Beispiel ist ein Messeffekt minimal, da der Heizer z. B. hoch dotiert ist, um mit z. B. 3 V heizen zu können. Ferner kann der TKR (Temperaturkoeffizient) des Heizers niedrig sein (z. B. ≤ 6*10-3 1/K, ≤ 4.1*10-3 1/K, ≤ 3.9*10-3 1/K).According to one example, a measurement effect is minimal since the heater e.g. B. is highly doped to z. B. to be able to heat 3 V. Furthermore, the TKR (temperature coefficient) of the heater can be low (e.g. ≤ 6*10 -3 1/K, ≤ 4.1*10 -3 1/K, ≤ 3.9*10 -3 1/K).
Somit wird mit dem Gassensor und/oder der Auswerteanordnung z. B. ein Sensorsignal (z. B. der Stromfluss 310) genutzt, um die Konzentration eines dritten Gases unterscheiden zu können. Bei einer Notfallbeatmung wird mit erhöhten Sauerstoff-Konzentrationen gearbeitet. So ist es üblich, ein Gemisch aus 50 vol.% O2 in N2 zu verwenden. Ohne Korrektur des Sensor-Signals bei höherer Sauerstoff-Konzentration gegenüber dem Frischgas bei einer Kalibrierung zeigt der Gassensor (z. B. ein CO2-Sensor) z.B. bei 50 vol.% O2 im N2-O2 Gasgemisch eine Konzentration von -5% CO2 an. D.h. die Änderung der dritten Gaskomponente, eine Konzentrations-Änderung von Sauerstoff, im Gemisch führt unter Umständen zu einem Fehlersignal in dem CO2-Sensor. Ein Konzentrationsgemisch von etwa 56% Sauerstoff und 5% CO2 in Stickstoff N2 zeigt am Sensor ebenso z. B. eine CO2-Konzentration von 0 vol.% an, wie bei der Frischgas-Kalibrierung mit 21 vol.% O2 und ca. 78 vol.% N2.Thus, with the gas sensor and / or the evaluation z. B. a sensor signal (z. B. the current flow 310) used to distinguish the concentration of a third gas can. Emergency ventilation involves working with increased oxygen concentrations. So it is common to use a mixture of 50% by volume O 2 in N 2 . Without correction of the sensor signal at a higher oxygen concentration compared to the fresh gas during a calibration , the gas sensor (e.g. a CO 2 sensor ) shows a concentration of - 5% CO2 on. This means that the change in the third gas component, a change in the concentration of oxygen, in the mixture may lead to an error signal in the CO 2 sensor. A concentration mixture of about 56% oxygen and 5% CO 2 in nitrogen N 2 shows the sensor as z. For example, assume a CO 2 concentration of 0 vol.%, as in the fresh gas calibration with 21 vol.% O 2 and approx. 78 vol.% N 2 .
Besteht technisch keine Möglichkeit, die Sauerstoff-Konzentration des Inhalationsgases dem Sensor mitzuteilen, so dass eine Konzentrationsanzeige des Gassensors entsprechend korrigiert werden kann, so würde der Sensor z. B. fehlerhafte Werte anzeigen.If there is no technical way of communicating the oxygen concentration of the inhalation gas to the sensor so that a concentration display of the gas sensor can be corrected accordingly, the sensor would e.g. B. show erroneous values.
Wie in den
Gemäß einem Beispiel wird der Heizer mit einer konstanten Spannung betrieben (die gemäß den
Wieviel Energie der Heizer in das ihn umgebende Gas abgeben kann, ist unter anderem auch abhängig von der Wärmeleitfähigkeit des Gases. Bei 10% CO2 in N2 zum Beispiel kann der Heizer nicht so viel Wärme abgeben, weil CO2 eine Wärmeleitfähigkeit von λ=0,0168 W/(m*K) besitzt, der Heizer erreicht demnach einer höhere Endtemperatur vorm Abschalten gegenüber einem 100% N2 Gas. Bei der Messung wurde eine Differenz von deltaU = 220mV ermittelt. Stickstoff N2 besitzt eine Wärmeleitfähigkeit von λ=0,0260 W/(m*K), der Heizer könnte gegenüber einem 100% CO2 Gas fast doppelt so viel Wärme abgeben. Bei der Messung wurde ein deltaU von 214mV ermittelt. Der Unterschied der Wärmeleitfähigkeiten zwischen Stickstoff und Sauerstoff O2 ist nicht sehr groß. Dennoch kann mit dem hierin beschriebenen Gassensor und/oder der Auswerteanordnung ein deltaU von 210mV ermittelt werden, das etwas kleiner ist als bei der Messung in N2.How much energy the heater can release into the gas surrounding it depends, among other things, on the thermal conductivity of the gas. With 10% CO 2 in N 2 , for example, the heater cannot emit as much heat because CO 2 has a thermal conductivity of λ=0.0168 W/(m*K), so the heater reaches a higher final temperature before switching off compared to one 100% N2 gas. During the measurement, a difference of deltaU = 220mV was determined. Nitrogen N 2 has a thermal conductivity of λ=0.0260 W/(m*K), the heater could emit almost twice as much heat compared to 100% CO 2 gas. A deltaU of 214mV was determined during the measurement. The difference in thermal conductivities between nitrogen and oxygen O 2 is not very large. Nevertheless, with the gas sensor and/or the evaluation arrangement described here, a deltaU of 210 mV can be determined, which is somewhat smaller than when measuring in N 2 .
In
Gemäß dem in
Die Phasen-Summe 400 stellt z. B. ein stabiles Summen-Signal D1+D2 (D1 entspricht Detektor 1 und D2 entspricht Detektor 2) der Phasen-Lagen dar. Eine Unterscheidbarkeit zwischen 100 vol.% O2 und 100 vol.% N2 ist für z. B. alle Phaseninformationen vorhanden. Der größte Signal-Unterschied tritt gemäß dem Ausführungsbeispiel zwischen 10 vol.% CO2 und 0 vol.% CO2 in N2 auf. Da das Phasen-Differenz-Signal 410, derzeit stark verrauscht ist wird als Phaseninformation die Phasen-Summe 400 bevorzugt.The
In
Gemäß dem in
Die Information 210 über die Amplitude des Detektorsignals des ersten Detektors und die Information 220 über die Amplitude des Detektorsignals des zweiten Detektors stellen z. B. stabile Amplituden-Signale dar, wobei D2 (der zweite Detektor) gemäß diesem Ausführungsbeispiel ein größeres Rauschen aufweist, da dessen Amplitude geringer ist als die Amplitude an D1 (der erste Detektor) (ca. 5mV zu 1,8mV in Luft). Bei beiden Amplitudeninformationen 210, 220 tritt eine klarere Unterscheidbarkeit zwischen 100 vol.% O2 und 100 vol.% N2 als bei den Phasen-Signalen (siehe 210, 220, 400 und 410 in
Gemäß dem in
Alle 3 Gasgemische sind mit dem Kombinationssignal 230 deutlich voneinander unterscheidbar. Somit wird vorgeschlagen Verhältnisse zwischen Phase und Amplitude zu vergleichen, um auf eine Konzentration des dritten Gases O2 zu schließen.All 3 gas mixtures can be clearly distinguished from each other with the
Während sich der Unterschied zwischen 100% N2 und 100% O2 nur gering auf das Phasen-Signal auswirkt (
Im Folgenden werden weitere Beispiele dargestellt, die Merkmale und Funktionalitäten des Gassensors in anderen Worten beschreiben. Diese Beispiele können mit den oben beschriebenen Ausführungsbeispielen kombiniert werden oder Alternativen darstellen.Further examples are presented below, which describe features and functionalities of the gas sensor in other words. These examples can be combined with the exemplary embodiments described above or represent alternatives.
Gemäß einem Beispiel handelt es sich bei dem Gassensor um einen Membran-Sensor. Der thermische Gassensor auf Basis von Membran- und Thermopile-Technologie mit perforierter Membran, kann ausgelegt sein um den parasitären Wärmetransport über die Membran oder die Aufhängungen der Strukturen zu minimieren, um ein höheres gassensitives Signal zu erhalten.According to one example, the gas sensor is a membrane sensor. The thermal gas sensor based on membrane and thermopile technology with a perforated membrane can be designed to minimize the parasitic heat transport via the membrane or the suspension of the structures in order to obtain a higher gas-sensitive signal.
Gemäß einem Ausführungsbeispiel kann der Gassensor Elektronik aufweisen, wobei die Elektronik einen oder mehrere der folgenden Aspekte, einzeln oder in Kombination aufweisen kann. Die Elektronik kann einen DC-Sensorverstärker mit über Software nachgeführtem Arbeitspunkt aufweisen. Ferner kann die Elektronik ausgelegt sein, um eine Messung der Phasenlage über die interne Timer-Struktur des µControllers (MSP430) durchzuführen, wobei dazu z. B. die genaue Erzeugung des Heizer-Anregungssignals über den Analog-Schalter über die interne Timer-Struktur des µControllers (MSP430) verwendet wird. Des Weiteren kann die Elektronik ausgelegt sein, um eine Messung der Phasenlage der Sensorsignale über einen Schmitt-Trigger, der die vom DC-Offset befreiten Sensorsignale im Nullpunktdurchgang misst durchzuführen, da dort die Signale am steilsten sind und somit das Phasenrauschen minimiert ist. Optional umfasst die Elektronik eine Regelung der Heizleistung über S1-Amplitudenregler und/oder eine Regelung von Timing der Abtastung.According to one embodiment, the gas sensor can have electronics, wherein the electronics can have one or more of the following aspects, individually or in combination. The electronics can have a DC sensor amplifier with an operating point that is tracked via software. Furthermore, the electronics can be designed to carry out a measurement of the phase position via the internal timer structure of the µcontroller (MSP430), with z. B. the precise generation of the heater excitation signal via the analog switch is used via the internal timer structure of the µController (MSP430). Furthermore, the electronics can be designed to carry out a measurement of the phase position of the sensor signals via a Schmitt trigger, which measures the sensor signals freed from the DC offset in the zero point crossing, since the signals are steepest there and the phase noise is therefore minimized. Optionally, the electronics include regulation of the heating power via S1 amplitude regulator and/or regulation of the timing of the sampling.
Gemäß einem Beispiel kann der Gassensor eine Kalibration aufweisen. Die Kalibration kann hierbei ausgebildet sein, um ein Pseudo-Signal aus Phase und Amplitude zu bilden, wobei bei Signalbildung und Formel der Schwerpunkt auf einem Pseudo-Signal liegen kann.According to an example, the gas sensor can have a calibration. In this case, the calibration can be designed to form a pseudo signal from phase and amplitude, with the emphasis in signal formation and formula being able to be on a pseudo signal.
Es sei darauf hingewiesen, dass die Ausführungsbeispiele gemäß den Ansprüchen mit allen Merkmalen, Funktionalitäten und Details ergänzt werden können, die hierin beschrieben sind (soweit dies nicht zu irgendwelchen Widersprüchen führt).It should be noted that the embodiments according to the claims can be supplemented with all the features, functionality and details described herein (as far as this does not lead to any contradictions).
Merkmale, Funktionalitäten und Details der Ansprüche können auch mit den hierin beschriebenen Ausführungsbeispielen kombiniert werden, um zusätzliche Ausführungsbeispiele zu erhalten.Features, functionalities and details of the claims can also be combined with the embodiments described herein to obtain additional embodiments.
Es sei darauf hingewiesen, dass Merkmale und Funktionalitäten, die in einzelnen oder einigen der Ausführungsbeispielen gezeigt sind, auch in anderen der Ausführungsbeispiele eingesetzt werden können, soweit dem keine gravierenden technischen Gründe entgegenstehen.It should be pointed out that features and functionalities that are shown in individual or some of the exemplary embodiments can also be used in other exemplary embodiments, provided there are no serious technical reasons to the contrary.
Weiterhin sei darauf hingewiesen, dass auch Teil-Funktionalitäten der hierin beschriebenen Ausführungsbeispiele eingesetzt werden können, sofern dem keine wesentlichen technischen Gründe entgegenstehen.Furthermore, it should be pointed out that partial functionalities of the exemplary embodiments described herein can also be used, provided there are no significant technical reasons to the contrary.
Obwohl manche Aspekte im Zusammenhang mit einer Vorrichtung beschrieben wurden, versteht es sich, dass diese Aspekte auch eine Beschreibung des entsprechenden Verfahrens darstellen, sodass ein Block oder ein Bauelement einer Vorrichtung auch als ein entsprechender Verfahrensschritt oder als ein Merkmal eines Verfahrensschrittes zu verstehen ist. Analog dazu stellen Aspekte, die im Zusammenhang mit einem oder als ein Verfahrensschritt beschrieben wurden, auch eine Beschreibung eines entsprechenden Blocks oder Details oder Merkmals einer entsprechenden Vorrichtung dar. Einige oder alle der Verfahrensschritte können durch einen Hardware-Apparat (oder unter Verwendung eines Hardware-Apparats), wie zum Beispiel einen Mikroprozessor, einen programmierbaren Computer oder eine elektronische Schaltung ausgeführt werden. Bei einigen Ausführungsbeispielen können einige oder mehrere der wichtigsten Verfahrensschritte durch einen solchen Apparat ausgeführt werden.Although some aspects have been described in the context of a device, it is understood that these aspects also represent a description of the corresponding method, so that a block or a component of a device is also to be understood as a corresponding method step or as a feature of a method step. Similarly, aspects described in connection with or as a method step also constitute a description of a corresponding block or detail or feature of a corresponding device. Some or all of the method steps may be performed by hardware apparatus (or using a hardware Apparatus), such as a microprocessor, a programmable computer, or an electronic circuit. In some embodiments, some or more of the essential process steps can be performed by such an apparatus.
Je nach bestimmten Implementierungsanforderungen können Ausführungsbeispiele der Erfindung in Hardware oder in Software implementiert sein. Die Implementierung kann unter Verwendung eines digitalen Speichermediums, beispielsweise einer Floppy-Disk, einer DVD, einer Blu-ray Disc, einer CD, eines ROM, eines PROM, eines EPROM, eines EEPROM oder eines FLASH-Speichers, einer Festplatte oder eines anderen magnetischen oder optischen Speichers durchgeführt werden, auf dem elektronisch lesbare Steuersignale gespeichert sind, die mit einem programmierbaren Computersystem derart zusammenwirken können oder zusammenwirken, dass das jeweilige Verfahren durchgeführt wird. Deshalb kann das digitale Speichermedium computerlesbar sein.Depending on particular implementation requirements, embodiments of the invention may be implemented in hardware or in software. Implementation can be performed using a digital storage medium such as a floppy disk, DVD, Blu-ray Disc, CD, ROM, PROM, EPROM, EEPROM or FLASH memory, hard disk or other magnetic or optical memory, on which electronically readable control signals are stored, which can interact or interact with a programmable computer system in such a way that the respective method is carried out. Therefore, the digital storage medium can be computer-readable.
Manche Ausführungsbeispiele gemäß der Erfindung umfassen also einen Datenträger, der elektronisch lesbare Steuersignale aufweist, die in der Lage sind, mit einem programmierbaren Computersystem derart zusammenzuwirken, dass eines der hierin beschriebenen Verfahren durchgeführt wird.Thus, some embodiments according to the invention comprise a data carrier having electronically readable control signals capable of interacting with a programmable computer system in such a way that one of the methods described herein is carried out.
Allgemein können Ausführungsbeispiele der vorliegenden Erfindung als Computerprogrammprodukt mit einem Programmcode implementiert sein, wobei der Programmcode dahin gehend wirksam ist, eines der Verfahren durchzuführen, wenn das Computerprogrammprodukt auf einem Computer abläuft.In general, embodiments of the present invention can be implemented as a computer program product with a program code, wherein the program code is effective to perform one of the methods when the computer program product runs on a computer.
Der Programmcode kann beispielsweise auch auf einem maschinenlesbaren Träger gespeichert sein.The program code can also be stored on a machine-readable carrier, for example.
Andere Ausführungsbeispiele umfassen das Computerprogramm zum Durchführen eines der hierin beschriebenen Verfahren, wobei das Computerprogramm auf einem maschinenlesbaren Träger gespeichert ist.Other exemplary embodiments include the computer program for performing one of the methods described herein, the computer program being stored on a machine-readable carrier.
Mit anderen Worten ist ein Ausführungsbeispiel des erfindungsgemäßen Verfahrens somit ein Computerprogramm, das einen Programmcode zum Durchführen eines der hierin beschriebenen Verfahren aufweist, wenn das Computerprogramm auf einem Computer abläuft.In other words, an exemplary embodiment of the method according to the invention is therefore a computer program that has a program code for performing one of the methods described herein when the computer program runs on a computer.
Ein weiteres Ausführungsbeispiel der erfindungsgemäßen Verfahren ist somit ein Datenträger (oder ein digitales Speichermedium oder ein computerlesbares Medium), auf dem das Computerprogramm zum Durchführen eines der hierin beschriebenen Verfahren aufgezeichnet ist. Der Datenträger, das digitale Speichermedium oder das computerlesbare Medium sind typischerweise gegenständlich und/oder nichtvergänglich bzw. nichtvorübergehend.A further exemplary embodiment of the method according to the invention is therefore a data carrier (or a digital storage medium or a computer-readable medium) on which the computer program for carrying out one of the methods described herein is recorded. The data carrier, digital storage medium, or computer-readable medium is typically tangible and/or non-transitory.
Ein weiteres Ausführungsbeispiel des erfindungsgemäßen Verfahrens ist somit ein Datenstrom oder eine Sequenz von Signalen, der bzw. die das Computerprogramm zum Durchführen eines der hierin beschriebenen Verfahren darstellt bzw. darstellen. Der Datenstrom oder die Sequenz von Signalen kann bzw. können beispielsweise dahin gehend konfiguriert sein, über eine Datenkommunikationsverbindung, beispielsweise über das Internet, transferiert zu werden.A further exemplary embodiment of the method according to the invention is thus a data stream or a sequence of signals which represents the computer program for carrying out one of the methods described herein. For example, the data stream or sequence of signals may be configured to be transferred over a data communication link, such as the Internet.
Ein weiteres Ausführungsbeispiel umfasst eine Verarbeitungseinrichtung, beispielsweise einen Computer oder ein programmierbares Logikbauelement, die dahin gehend konfiguriert oder angepasst ist, eines der hierin beschriebenen Verfahren durchzuführen.Another embodiment includes a processing device, such as a computer or programmable logic device, configured or adapted to perform any of the methods described herein.
Ein weiteres Ausführungsbeispiel umfasst einen Computer, auf dem das Computerprogramm zum Durchführen eines der hierin beschriebenen Verfahren installiert ist.Another embodiment includes a computer on which the computer program for performing one of the methods described herein is installed.
Ein weiteres Ausführungsbeispiel gemäß der Erfindung umfasst eine Vorrichtung oder ein System, die bzw. das ausgelegt ist, um ein Computerprogramm zur Durchführung zumindest eines der hierin beschriebenen Verfahren zu einem Empfänger zu übertragen. Die Übertragung kann beispielsweise elektronisch oder optisch erfolgen. Der Empfänger kann beispielsweise ein Computer, ein Mobilgerät, ein Speichergerät oder eine ähnliche Vorrichtung sein. Die Vorrichtung oder das System kann beispielsweise einen Datei-Server zur Übertragung des Computerprogramms zu dem Empfänger umfassen.A further exemplary embodiment according to the invention comprises a device or a system which is designed to transmit a computer program for carrying out at least one of the methods described herein to a recipient. The transmission can take place electronically or optically, for example. For example, the recipient may be a computer, mobile device, storage device, or similar device. The device or the system can, for example, comprise a file server for transmission of the computer program to the recipient.
Bei manchen Ausführungsbeispielen kann ein programmierbares Logikbauelement (beispielsweise ein feldprogrammierbares Gatterarray, ein FPGA) dazu verwendet werden, manche oder alle Funktionalitäten der hierin beschriebenen Verfahren durchzuführen. Bei manchen Ausführungsbeispielen kann ein feldprogrammierbares Gatterarray mit einem Mikroprozessor zusammenwirken, um eines der hierin beschriebenen Verfahren durchzuführen. Allgemein werden die Verfahren bei einigen Ausführungsbeispielen seitens einer beliebigen Hardwarevorrichtung durchgeführt. Diese kann eine universell einsetzbare Hardware wie ein Computerprozessor (CPU) sein oder für das Verfahren spezifische Hardware, wie beispielsweise ein ASIC.In some embodiments, a programmable logic device (e.g., a field programmable gate array, an FPGA) may be used to perform some or all of the functionality of the methods described herein. In some embodiments, a field programmable gate array may cooperate with a microprocessor to perform any of the methods described herein. In general, in some embodiments, the methods are performed on the part of any hardware device. This can be hardware that can be used universally, such as a computer processor (CPU), or hardware that is specific to the method, such as an ASIC.
Die hierin beschriebenen Vorrichtungen können beispielsweise unter Verwendung eines Hardware-Apparats, oder unter Verwendung eines Computers, oder unter Verwendung einer Kombination eines Hardware-Apparats und eines Computers implementiert werden.The devices described herein may be implemented, for example, using hardware apparatus, or using a computer, or using a combination of hardware apparatus and a computer.
Die hierin beschriebenen Vorrichtungen, oder jedwede Komponenten der hierin beschriebenen Vorrichtungen können zumindest teilweise in Hardware und/oder in Software (Computerprogramm) implementiert sein.The devices described herein, or any components of the devices described herein, may be implemented at least partially in hardware and/or in software (computer program).
Die hierin beschriebenen Verfahren können beispielsweise unter Verwendung eines Hardware-Apparats, oder unter Verwendung eines Computers, oder unter Verwendung einer Kombination eines Hardware-Apparats und eines Computers implementiert werden.The methods described herein may be implemented, for example, using hardware apparatus, or using a computer, or using a combination of hardware apparatus and a computer.
Die hierin beschriebenen Verfahren, oder jedwede Komponenten der hierin beschriebenen Verfahren können zumindest teilweise durch Hardware und/oder durch Software ausgeführt werden.The methods described herein, or any components of the methods described herein, may be performed at least in part by hardware and/or by software.
Die oben beschriebenen Ausführungsbeispiele stellen lediglich eine Veranschaulichung der Prinzipien der vorliegenden Erfindung dar. Es versteht sich, dass Modifikationen und Variationen der hierin beschriebenen Anordnungen und Einzelheiten anderen Fachleuten einleuchten werden. Deshalb ist beabsichtigt, dass die Erfindung lediglich durch den Schutzumfang der nachstehenden Patentansprüche und nicht durch die spezifischen Einzelheiten, die anhand der Beschreibung und der Erläuterung der Ausführungsbeispiele hierin präsentiert wurden, beschränkt sei.The embodiments described above are merely illustrative of the principles of the present invention. It is understood that modifications and variations to the arrangements and details described herein will occur to those skilled in the art. Therefore, it is intended that the invention be limited only by the scope of the following claims and not by the specific details presented in the description and explanation of the embodiments herein.
-
[Baehr 2008]
H. D. Baehr and K. Stephan, Wärme- und Stoffübertragung, 6. neu bearbeitete Auflage ed Springer-Verlag, 2008 HD Baehr and K. Stephan, Heat and Mass Transfer, 6th revised edition ed Springer-Verlag, 2008 -
[Simon 2002]
I. Simon and M. Arndt. Thermal and gas-sensing properties of a micromachined thermal conductivity sensor for the detection of hydrogen in automotive applications. Sensors and Actuators A: Physical, 97-98, pp. 104-108, April 2002. doi: 10.1016/S0924-4247(01)00825-1 I. Simon and M. Arndt. Thermal and gas-sensing properties of a micromachined thermal conductivity sensor for the detection of hydrogen in automotive applications. Sensors and Actuators A: Physical, 97-98, pp. 104-108, April 2002. doi: 10.1016/S0924-4247(01)00825-1 -
[Baar 2001]
J. J. van Baar, R. J. Wiegerink, T. S. J. Lammerink, G. J. M. Krijnen, and M. Elwenspoek. Micromachined structures for thermal measurements of fluid and flow parameters. Journal of Micromechanics and Microengineering, 11(4), pp. 311-318, July 2001. doi: 10.1088/0960-1317/11/4/304 JJ van Baar, RJ Wiegerink, TSJ Lammerink, GJM Krijnen, and M. Elwenspoek. Micromachined structures for thermal measurements of fluid and flow parameters. Journal of Micromechanics and Microengineering, 11(4), pp. 311-318, July 2001. doi: 10.1088/0960-1317/11/4/304 -
[IST AG 2011] German patent: reference
DE 10 2011 075 519 A1 reference DE 10 2011 075 519 A1 -
[IST AG 2013] Applied for a German patent under reference
DE 10 2013 102 2309.3 reference DE 10 2013 102 2309.3 -
[IST AG 2015] Applied for a German patent under reference
DE 10 2015 107 584.9 reference DE 10 2015 107 584.9 -
[Grien 2012]
H. Grienauer - AMS GmbH, Dielheim: Gasanalyse mit thermisch modulierten Wärmeleitfähigkeits-Sensoren mit Fourier-Analyse des Messsignals; 16. GMA/ITG-Fachtagung Sensoren und Messsysteme 2012; 22.-23.05.2012; Nürnberg, Germany; Chapter 1.2 Chemische Sensoren; pp 54-61; DOI: 10.5162/sensoren2012/1.2.2; ISBN: 978-3-9813484-0-8 H. Grienauer - AMS GmbH, Dielheim: Gas analysis with thermally modulated thermal conductivity sensors with Fourier analysis of the measurement signal; 16th GMA/ITG Conference on Sensors and Measuring Systems 2012; May 22-23, 2012; Nuremberg, Germany; Chapter 1.2 Chemical Sensors; pp 54-61; DOI: 10.5162/sensoren2012/1.2.2; ISBN: 978-3-9813484-0-8 -
[2003]
A. Al-Salaymeh, M. Alhusein, F. Durst, (2003) "Development of a twowire thermal flow sensor for industrial applications", Journal of Quality in Maintenance Engineering, Vol. 9 Issue: 2, pp. 113-131, https://doi.org/10.1108/13552510310482370 A Al-Salaymeh, M Alhusein, F Durst, (2003) "Development of a two-wire thermal flow sensor for industrial applications", Journal of Quality in Maintenance Engineering, Vol. 9 Issue: 2, pp. 113-131, https://doi.org/10.1108/13552510310482370 -
[2009]
DE 10 2008 047 511 A1 DE 10 2008 047 511 A1 -
[2011]
Kliche, Billat, Messner, Zengerle: Sensorsystem zur thermischen Gasanalyse von Gasgemischen, Konferenzbeitrag in Proc. of Mikrosystemtechnik Kongress 2011, Darmstadt, Deutschland, (Poster), 10. Oktober 2011, Seite 875-878, ISBN: 978-3-8007-3367-5 (2011 Kliche, Billat, Messner, Zengerle: Sensor system for thermal gas analysis of gas mixtures, conference paper in Proc. of Mikrosystemtechnik Kongress 2011, Darmstadt, Germany, (poster), October 10, 2011, pages 875-878, ISBN: 978-3-8007-3367-5 (2011 -
[2011]
Sensor for gas analysis based on thermal conductivity, specific heat capacity and thermal diffusivity; K Kliche, S Billat, F Hedrich, C Ziegler, R Zengerle; Micro Electro Mechanical Systems (MEMS), 2011 IEEE 24th International Conference on Micro Electro Mechanical Systems Sensor for gas analysis based on thermal conductivity, specific heat capacity and thermal diffusivity; Kliche, S Billat, F Hedrich, C Ziegler, R Zengerle; Micro Electro Mechanical Systems (MEMS), 2011 IEEE 24th International Conference on Micro Electro Mechanical Systems -
[2012]
DE 10 2011 075519 A1 DE 10 2011 075519 A1 -
[2013]
Sensor for thermal gas analysis based on micromachined siliconmicrowires; K Kliche, G Kattinger, S Billat, L Shen, S Messner, R Zengerle, IEEE Sensors Journal 13 (7), 2626-2635; 2013 Sensor for thermal gas analysis based on micromachined silicon microwires; Kliche K, Kattinger G, Billat S, Shen L, Messner S, Zengerle R, IEEE Sensors Journal 13 (7), 2626-2635; 2013
Claims (19)
- Evaluation arrangement (200) for a thermal gas sensor (100) having at least one heater (120) and at least one detector (130, 140),wherein the evaluation arrangement (200) is configured to obtain- information (210) about an amplitude of a detector signal of a first detector (130), and- information (210) about a first phase difference between a heater signal and the detector signal of the first detector (130); andwherein the evaluation arrangement (200) is configured to form a combination signal (230) as an intermediate quantity in dependence on the information (210, 220) about the amplitudes of the detector signal and in dependence on the information (210, 220) about the first phase difference, andwherein the evaluation arrangement (200) is configured to determine information (240) about a gas concentration or information (240) about a thermal diffusivity of a fluid on the basis of the combination signal (230).
- Evaluation arrangement (200) as claimed in claim 1, comprising a second detector, the two detectors (130, 140) being arranged at different distances from the heater (120),wherein the evaluation arrangement (200) is configured to obtain- the information (210) about the amplitude of the detector signal of the first detector (130),- information (220) about an amplitude of a detector signal of the second detector (140),- the information (210) about the first phase difference between the heater signal and the detector signal of the first detector (130), and- information (220) about a second phase difference between the heater signal and the detector signal of the second detector (140); andwherein the evaluation arrangement (200) is configured to form the combination signal (230) as an intermediate quantity in dependence on the information (210, 220) about the amplitudes of the detector signals and in dependence on the information (210, 220) about the first phase difference and in dependence on the information about the second phase difference, andwherein the evaluation arrangement (200) is configured to determine the information (240) about the gas concentration or the information (240) about the thermal diffusivity of the fluid on the basis of the combination signal (230).
- Evaluation arrangement (200) as claimed in claim 2,wherein the evaluation arrangement (200) is configured to obtain information (122) about a heater amplitude, andwherein the evaluation arrangement (200) is configured to form a linear combination of the information (122) about the heater amplitude, of the information (210, 220) about the amplitudes of the detector signals, of the information (210) about the first phase difference, and of the information (220) about the second phase difference in order to determine the combination signal (230).
- Evaluation arrangement (200) as claimed in claim 2 or claim 3,wherein the evaluation arrangement (200) is configured to obtain the combination signal sigX (230) according to
 wherein sigUss is amplitude information that depends on the information (210) about the amplitude of the detector signal of the first detector (130) and on the information (220) about the amplitude of the detector signal of the second detector (140); andwherein sigPhi is phase information that depends on the information (210) about the first phase difference and on the information (220) about the second phase difference; andwherein Ka and Kp are constants.
 - Evaluation arrangement (200) as claimed in claim 4,wherein the evaluation arrangement (200) is configured to obtain the amplitude information sigUss according to
 wherein Hz.Uss is information (122) about a heater amplitude,wherein D1.Uss is the information (210) about the amplitude of the detector signal of the first detector (130), andwherein D2.Uss is the information (210) about the amplitude of the detector signal of the second detector (140).
 - Evaluation arrangement (200) as claimed in any of claims 1 to 5, wherein the evaluation arrangement (200) is configured to calculate a polynomial of the combination signal (230) in order to obtain the information (240) about the gas concentration.
- Evaluation arrangement (200) as claimed in any of claims 1 to 6, wherein the evaluation arrangement (200) is configured to multiply a polynomial of the combination signal (230) by a correction term in order to obtain the information (240) about the gas concentration, wherein the correction term depends on the combination signal (230), on information about a pressure, and on information about a temperature.
- Evaluation arrangement (200) as claimed in any of claims 1 to 7, wherein the evaluation arrangement (200) is configured to perform a calculation according to
 in order to obtain the information C (240) about the gas concentration,wherein sigX is the combination signal (230),wherein pol(sigX) is a polynomial of the combination signal sigX (230);wherein f(p) is a function of the pressure p;wherein const1 is a first constant;wherein f(T) is a function of the temperature T; andwherein const2 is a second constant.
 - Evaluation arrangement (200) as claimed in any of claims 1 to 8, wherein the evaluation arrangement (200) is configured to perform a calculation according to
 in order to obtain the information C (240) about the gas concentration,wherein sigX is the combination signal (230),wherein A.y(sigX) is a polynomial of the combination signal sigX (230);wherein B.y(p) is a function of the pressure p;wherein B.ref is a constant;wherein C.y(T) is a function of the temperature T; andwherein C.ref is a second constant.
 - Evaluation arrangement (200) as claimed in any of claims 1 to 9, wherein the evaluation arrangement (200) is configured to consider a pressure and/or a temperature in a surrounding area of the gas sensor (100) when determining the information (240) about the gas concentration.
- Evaluation arrangement (200) as claimed in any of claims 1 to 10, wherein the evaluation arrangement (200) is configured, when determining the information (240) about the gas concentration, to use as input quantities of a drift correction the combination signal (230), information about the temperature in a surrounding area of the thermal gas sensor (100), and information about a pressure in a surrounding area of the thermal gas sensor (100), and to obtain the information (240) about the gas concentration as a result of the drift correction.
- Evaluation arrangement (200) as claimed in any of claims 1 to 11,wherein the evaluation arrangement (200) is configured to obtain the combination signal (230) on the basis of a quotient between amplitude information (210, 220) that depends on the information (210) about the amplitude of the detector signal at least of the first detector (130); and phase information (210, 220, 400, 410) that depends on the information (210) about the first phase difference; andwherein the evaluation arrangement (200) is configured to determine the information (240) about a concentration of a gas in dependence on the combination signal (230).
- Evaluation arrangement (200) as claimed in any of claims 1 to 12, wherein the evaluation arrangement (200) is configured to obtain the combination signal sigV (230) according to
 wherein sigUss is amplitude information (210, 220) that depends on the information (210) about the amplitude of the detector signal of the first detector (130); andwherein sigPhi is phase information (210, 220, 400, 410) that depends on the information (210) about the first phase difference; andwherein Kav and Kpv are constants.
 - Evaluation arrangement (200) as claimed in any of claims 1 to 13,
wherein the evaluation arrangement (200) is configured to obtain information as to how much heat is dissipated by the heater during a heating period (302), and to determine, in dependence on the information as to how much energy is dissipated by the heater during the heating period (302), the information (240) about a concentration of a gas. - Evaluation arrangement (200) as claimed in claim 14, wherein the evaluation arrangement (200) is configured to obtain the information as to how much heat is dissipated by the heater during a heating period (302) on the basis of a measurement of a current flow (310) through the heater at a specified heating voltage (300).
- Evaluation arrangement (200) as claimed in claim 15, wherein the evaluation arrangement (200) is configured to obtain the current flow (310) shortly after switching on the specified heating voltage (300) and shortly after switching off the specified heating voltage (300).
- Method of evaluating signals of a thermal gas sensor having at least one heater and at least one detector,wherein the method includes obtaining- information about an amplitude of a detector signal of the first detector, and- information about a first phase difference between a heater signal and the detector signal of the first detector; andwherein a combination signal is formed as an intermediate quantity in dependence on the information about the amplitudes of the detector signal and in dependence on the information about the first phase difference, andwherein information about a gas concentration or information about a thermal diffusivity of a fluid is determined on the basis of the combination signal.
- Method as claimed in claim 17 of evaluating signals of a thermal gas sensor having at least one heater and two detectors arranged at different distances from the heater,wherein the method includes obtaining- the information about the amplitude of the detector signal of the first detector,- information about an amplitude of a detector signal of a second detector,- the information about the first phase difference between the heater signal and the detector signal of the first detector, and- information about a second phase difference between the heater signal and the detector signal of the second detector; andwherein a combination signal is formed as an intermediate quantity in dependence on the information about the amplitudes of the detector signals and in dependence on the information about the first phase difference and in dependence on the information about the second phase difference, andwherein the information about the gas concentration or the information about the thermal diffusivity of the fluid is determined on the basis of the combination signal.
- Computer program having a program code for performing the method as claimed in claim 17 or claim 18 when the program runs on a computer.
Priority Applications (2)
| Application Number | Priority Date | Filing Date | Title |
|---|---|---|---|
| EP22196711.0A EP4141430A1 (en) | 2018-01-05 | 2019-01-07 | Evaluation arrangement for a thermal gas sensor, method and computer program |
| EP21190705.0A EP3926335B1 (en) | 2018-01-05 | 2019-01-07 | Evaluation assembly for a thermal gas sensor, method and computer program |
Applications Claiming Priority (2)
| Application Number | Priority Date | Filing Date | Title |
|---|---|---|---|
| EP18150496 | 2018-01-05 | ||
| PCT/EP2019/050261 WO2019135002A2 (en) | 2018-01-05 | 2019-01-07 | Evaluation arrangement for a thermal gas sensor, method and computer program product |
Related Child Applications (3)
| Application Number | Title | Priority Date | Filing Date |
|---|---|---|---|
| EP21190705.0A Division EP3926335B1 (en) | 2018-01-05 | 2019-01-07 | Evaluation assembly for a thermal gas sensor, method and computer program |
| EP21190705.0A Division-Into EP3926335B1 (en) | 2018-01-05 | 2019-01-07 | Evaluation assembly for a thermal gas sensor, method and computer program |
| EP22196711.0A Division EP4141430A1 (en) | 2018-01-05 | 2019-01-07 | Evaluation arrangement for a thermal gas sensor, method and computer program |
Publications (2)
| Publication Number | Publication Date |
|---|---|
| EP3735580A2 EP3735580A2 (en) | 2020-11-11 |
| EP3735580B1 true EP3735580B1 (en) | 2022-04-27 |
Family
ID=60990632
Family Applications (3)
| Application Number | Title | Priority Date | Filing Date |
|---|---|---|---|
| EP21190705.0A Active EP3926335B1 (en) | 2018-01-05 | 2019-01-07 | Evaluation assembly for a thermal gas sensor, method and computer program |
| EP19700107.6A Active EP3735580B1 (en) | 2018-01-05 | 2019-01-07 | Evaluation arrangement for a thermal gas sensor, method and computer program product |
| EP22196711.0A Pending EP4141430A1 (en) | 2018-01-05 | 2019-01-07 | Evaluation arrangement for a thermal gas sensor, method and computer program |
Family Applications Before (1)
| Application Number | Title | Priority Date | Filing Date |
|---|---|---|---|
| EP21190705.0A Active EP3926335B1 (en) | 2018-01-05 | 2019-01-07 | Evaluation assembly for a thermal gas sensor, method and computer program |
Family Applications After (1)
| Application Number | Title | Priority Date | Filing Date |
|---|---|---|---|
| EP22196711.0A Pending EP4141430A1 (en) | 2018-01-05 | 2019-01-07 | Evaluation arrangement for a thermal gas sensor, method and computer program |
Country Status (8)
| Country | Link |
|---|---|
| US (2) | US11686695B2 (en) |
| EP (3) | EP3926335B1 (en) |
| JP (3) | JP2021515882A (en) |
| KR (2) | KR102400465B1 (en) |
| CN (2) | CN112055811B (en) |
| AU (2) | AU2019205103B2 (en) |
| CA (2) | CA3088990C (en) |
| WO (1) | WO2019135002A2 (en) |
Families Citing this family (4)
| Publication number | Priority date | Publication date | Assignee | Title |
|---|---|---|---|---|
| EP3926335B1 (en) * | 2018-01-05 | 2022-10-26 | Hahn-Schickard-Gesellschaft für angewandte Forschung e.V. | Evaluation assembly for a thermal gas sensor, method and computer program |
| JP7452323B2 (en) * | 2020-08-18 | 2024-03-19 | 株式会社デンソー | Gas concentration detection device |
| DE102022209905A1 (en) * | 2022-09-20 | 2024-03-21 | Hahn-Schickard-Gesellschaft für angewandte Forschung e.V. | Sensor arrangement |
| DE102022209906A1 (en) | 2022-09-20 | 2024-03-21 | Hahn-Schickard-Gesellschaft für angewandte Forschung e.V. | Sensor arrangement |
Citations (7)
| Publication number | Priority date | Publication date | Assignee | Title |
|---|---|---|---|---|
| US20080044939A1 (en) * | 2002-01-24 | 2008-02-21 | Nassiopoulou Androula G | Low power silicon thermal sensors and microfluidic devices based on the use of porous sealed air cavity technology or microchannel technology |
| EP2175246A1 (en) * | 2008-10-09 | 2010-04-14 | Sensirion AG | A method for measuring a fluid composition parameter by means of a flow sensor |
| EP1840535B1 (en) * | 2006-03-31 | 2011-01-12 | Sensirion Holding AG | Flow sensor with thermocouples |
| EP2348292A1 (en) * | 2010-01-13 | 2011-07-27 | Sensirion AG | Sensor device |
| EP2869041A1 (en) * | 2011-08-31 | 2015-05-06 | Hahn-Schickard-Gesellschaft für angewandte Forschung e.V. | Flow sensor for monitoring a flow parameter and method of determining the same |
| EP2887057A1 (en) * | 2013-12-17 | 2015-06-24 | Sensirion AG | Device and method of humidity compensated gas concentration monitoring by thermal conductivity measurements |
| WO2019034570A1 (en) * | 2017-08-14 | 2019-02-21 | Hahn-Schickard-Gesellschaft für angewandte Forschung e.V. | Sensor assembly comprising a pressure sensor and a thermal gas sensor |
Family Cites Families (44)
| Publication number | Priority date | Publication date | Assignee | Title |
|---|---|---|---|---|
| JPH0493648A (en) | 1990-08-03 | 1992-03-26 | Yamatake Honeywell Co Ltd | Gas chromatograph |
| DE4338200A1 (en) * | 1993-11-09 | 1995-05-11 | Efu Ges Fuer Ur Umformtechnik | Method for measuring the temperature of metallic workpieces or their solid content in the partially solidified state |
| JP3370801B2 (en) | 1994-11-02 | 2003-01-27 | リコーエレメックス株式会社 | Atmosphere detector with temperature compensation |
| US10130787B2 (en) | 1997-06-17 | 2018-11-20 | Fisher & Paykel Healthcare Limited | Humidity controller |
| US6019505A (en) | 1997-12-31 | 2000-02-01 | Honeywell Inc. | Time lag approach for measuring thermal conductivity and specific heat |
| US6169965B1 (en) | 1997-12-31 | 2001-01-02 | Honeywell International Inc. | Fluid property and flow sensing via a common frequency generator and FFT |
| US6079253A (en) | 1997-12-31 | 2000-06-27 | Honeywell Inc. | Method and apparatus for measuring selected properties of a fluid of interest using a single heater element |
| JP4093333B2 (en) * | 1998-07-08 | 2008-06-04 | アルバック理工株式会社 | Thermophysical property measuring method and apparatus |
| WO2000037895A1 (en) | 1998-12-22 | 2000-06-29 | Sensirion Ag | Method and sensor for measuring a mass flow |
| DE19949327A1 (en) * | 1999-10-13 | 2001-04-19 | Grunewald Axel Ulrich | Method and device for determining the gas concentrations in a gas mixture |
| JP3843880B2 (en) | 2001-05-31 | 2006-11-08 | 株式会社デンソー | Gas concentration sensor heater control device |
| GR1004040B (en) | 2001-07-31 | 2002-10-31 | Method for the fabrication of suspended porous silicon microstructures and application in gas sensors | |
| JP4500904B2 (en) * | 2005-01-31 | 2010-07-14 | 一平 鳥越 | Heat transfer characteristic measuring method and apparatus |
| JP4662339B2 (en) | 2005-02-04 | 2011-03-30 | エプソンイメージングデバイス株式会社 | LCD panel |
| DE102006054505A1 (en) | 2006-11-20 | 2008-05-29 | Escube Gmbh & Co. Kg | Material concentration determining device for detecting e.g. hydrogen leakage, has sensor arrangement with two different characteristics which are considered for determining concentration of material in gas in two measuring areas |
| US7780343B2 (en) | 2007-07-09 | 2010-08-24 | Siargo Ltd. | Micromachined gas and liquid concentration sensor and method of making the same |
| DE102008047511A1 (en) | 2007-09-13 | 2009-03-19 | Weinmann Geräte für Medizin GmbH + Co. KG | Gas i.e. respiratory gas, analyzing device for optimal treatment of patient, has evaluation device to provide data considering current in conducting units and measured values, where carbon dioxide concentration is determined from data |
| US8174416B2 (en) | 2007-09-28 | 2012-05-08 | Nxp B.V. | Automatic common-mode rejection calibration |
| US8331892B2 (en) | 2008-03-29 | 2012-12-11 | Qualcomm Incorporated | Method and system for DC compensation and AGC |
| JP4983726B2 (en) | 2008-05-29 | 2012-07-25 | トヨタ自動車株式会社 | Gas concentration sensor warm-up control device |
| JP5745205B2 (en) | 2008-08-22 | 2015-07-08 | 木村 光照 | Thermal conductivity type barometric sensor using heating excitation |
| FR2949155B1 (en) * | 2009-08-14 | 2012-04-06 | Neosens | METHOD FOR MEASURING OR DETECTING THE REINFORCEMENT OF A REACTOR |
| JP5055349B2 (en) | 2009-12-28 | 2012-10-24 | 日立オートモティブシステムズ株式会社 | Thermal gas sensor |
| DE102011075519A1 (en) | 2011-05-09 | 2012-11-15 | Innovative Sensor Technology Ist Ag | Method for determining mass flow rate of e.g. gas in main pipe, involves determining value of thermal characteristics of medium, so that flow rate value is determined based on amplitudes under consideration of thermal characteristics value |
| US8907803B2 (en) | 2012-01-09 | 2014-12-09 | Intwine Energy | Networked air quality monitoring |
| US20130234330A1 (en) | 2012-03-08 | 2013-09-12 | Infineon Technologies Ag | Semiconductor Packages and Methods of Formation Thereof |
| JP5779131B2 (en) | 2012-03-27 | 2015-09-16 | アズビル株式会社 | Calorific value measuring system and calorific value measuring method |
| DE102012102979A1 (en) * | 2012-04-05 | 2013-10-24 | Endress + Hauser Flowtec Ag | Flow meter, meter tube, and method of making a flow meter |
| JP5782406B2 (en) | 2012-06-14 | 2015-09-24 | 日本特殊陶業株式会社 | Gas sensor system |
| DE102013102398B4 (en) * | 2013-03-11 | 2024-05-02 | Innovative Sensor Technology Ist Ag | Thermal flow sensor for determining the composition of a gas mixture and its flow velocity |
| DE102014000939A1 (en) | 2013-06-20 | 2014-12-24 | Hydrometer Gmbh | Method for determining at least one gas parameter of a flowing gas |
| EP2840385A1 (en) * | 2013-08-23 | 2015-02-25 | DCG Systems, Inc. | Lock-in thermography method and system for determining material layer parameters of a sample |
| JP2015064305A (en) | 2013-09-25 | 2015-04-09 | 木村 光照 | Thermal type sensor and heat measurement module using the same |
| EP3071936B1 (en) * | 2013-11-19 | 2020-07-15 | Endress+Hauser Flowtec AG | Measuring device and method for determining a corrected mass flow, and uses of the measuring device |
| DE102014106729A1 (en) * | 2014-05-13 | 2015-11-19 | Endress + Hauser Flowtec Ag | Method for operating a measuring device and measuring device |
| US9453807B2 (en) | 2014-04-08 | 2016-09-27 | Ams International Ag | Thermal conductivity gas sensor with amplification material |
| JP6470985B2 (en) | 2015-01-27 | 2019-02-13 | 日本特殊陶業株式会社 | Micro heater and sensor |
| US10211673B2 (en) | 2015-03-04 | 2019-02-19 | Siemens Industry, Inc. | Apparatus and methods for timestamping electrical data in a panel meter |
| DE102015107584A1 (en) | 2015-05-13 | 2016-11-17 | Innovative Sensor Technology Ist Ag | Method for determining a product of heat capacity and density |
| JP6459788B2 (en) | 2015-06-12 | 2019-01-30 | 株式会社デンソー | Sensor applied voltage control device |
| GB2545426B (en) | 2015-12-14 | 2021-08-04 | Sciosense Bv | Sensing Layer Formation |
| EP3502687B1 (en) * | 2017-12-20 | 2022-06-29 | Sensirion AG | Determination of gas parameters |
| EP3926335B1 (en) | 2018-01-05 | 2022-10-26 | Hahn-Schickard-Gesellschaft für angewandte Forschung e.V. | Evaluation assembly for a thermal gas sensor, method and computer program |
| JP7130290B2 (en) | 2020-10-27 | 2022-09-05 | 株式会社I’mbesideyou | information extractor |
-
2019
- 2019-01-07 EP EP21190705.0A patent/EP3926335B1/en active Active
- 2019-01-07 JP JP2020537150A patent/JP2021515882A/en active Pending
- 2019-01-07 CA CA3088990A patent/CA3088990C/en active Active
- 2019-01-07 WO PCT/EP2019/050261 patent/WO2019135002A2/en active Search and Examination
- 2019-01-07 KR KR1020207022725A patent/KR102400465B1/en active IP Right Grant
- 2019-01-07 EP EP19700107.6A patent/EP3735580B1/en active Active
- 2019-01-07 EP EP22196711.0A patent/EP4141430A1/en active Pending
- 2019-01-07 CN CN201980017444.7A patent/CN112055811B/en active Active
- 2019-01-07 KR KR1020227016489A patent/KR102558160B1/en active IP Right Grant
- 2019-01-07 CA CA3185299A patent/CA3185299A1/en active Pending
- 2019-01-07 CN CN202310885655.0A patent/CN117309929A/en active Pending
- 2019-01-07 AU AU2019205103A patent/AU2019205103B2/en active Active
-
2020
- 2020-07-06 US US16/921,407 patent/US11686695B2/en active Active
-
2022
- 2022-01-21 AU AU2022200416A patent/AU2022200416B2/en active Active
- 2022-05-02 JP JP2022075661A patent/JP7460682B2/en active Active
- 2022-08-16 US US17/820,164 patent/US11874242B2/en active Active
-
2023
- 2023-11-20 JP JP2023196781A patent/JP2024020474A/en active Pending
Patent Citations (7)
| Publication number | Priority date | Publication date | Assignee | Title |
|---|---|---|---|---|
| US20080044939A1 (en) * | 2002-01-24 | 2008-02-21 | Nassiopoulou Androula G | Low power silicon thermal sensors and microfluidic devices based on the use of porous sealed air cavity technology or microchannel technology |
| EP1840535B1 (en) * | 2006-03-31 | 2011-01-12 | Sensirion Holding AG | Flow sensor with thermocouples |
| EP2175246A1 (en) * | 2008-10-09 | 2010-04-14 | Sensirion AG | A method for measuring a fluid composition parameter by means of a flow sensor |
| EP2348292A1 (en) * | 2010-01-13 | 2011-07-27 | Sensirion AG | Sensor device |
| EP2869041A1 (en) * | 2011-08-31 | 2015-05-06 | Hahn-Schickard-Gesellschaft für angewandte Forschung e.V. | Flow sensor for monitoring a flow parameter and method of determining the same |
| EP2887057A1 (en) * | 2013-12-17 | 2015-06-24 | Sensirion AG | Device and method of humidity compensated gas concentration monitoring by thermal conductivity measurements |
| WO2019034570A1 (en) * | 2017-08-14 | 2019-02-21 | Hahn-Schickard-Gesellschaft für angewandte Forschung e.V. | Sensor assembly comprising a pressure sensor and a thermal gas sensor |
Non-Patent Citations (2)
| Title |
|---|
| BILLAT S ET AL: "Convection-based micromachined inclinometer using SOI technology", PROCEEDINGS OF THE IEEE 14TH. ANNUAL INTERNATIONAL CONFERENCE ON MICRO ELECTRO MECHANICAL SYSTEMS. MEMS 2001. INTERLAKEN, SWITZERLAND, JAN. 21 - 25, 2001; [IEEE INTERNATIONAL MICRO ELECTRO MECHANICAL SYSTEMS CONFERENCE], NEW YORK, NY : IEEE, US, 25 January 2001 (2001-01-25), pages 159 - 161, XP032403321, ISBN: 978-0-7803-5998-7, DOI: 10.1109/MEMSYS.2001.906504 * |
| KLICHE K ET AL: "Sensor for gas analysis based on thermal conductivity, specific heat capacity and thermal diffusivity", IEEE 24TH INTERNATIONAL CONFERENCE ON MICRO ELECTRO MECHANICAL SYSTEMS (MEMS 2011), IEEE, US, 23 January 2011 (2011-01-23), pages 1189 - 1192, XP031982631, ISBN: 978-1-4244-9632-7, DOI: 10.1109/MEMSYS.2011.5734644 * |
Also Published As
| Publication number | Publication date |
|---|---|
| AU2022200416A1 (en) | 2022-02-17 |
| EP3926335A1 (en) | 2021-12-22 |
| WO2019135002A2 (en) | 2019-07-11 |
| JP7460682B2 (en) | 2024-04-02 |
| AU2019205103B2 (en) | 2021-11-04 |
| KR20200101988A (en) | 2020-08-28 |
| CN117309929A (en) | 2023-12-29 |
| WO2019135002A3 (en) | 2019-08-29 |
| JP2021515882A (en) | 2021-06-24 |
| CA3088990A1 (en) | 2019-07-11 |
| KR102400465B1 (en) | 2022-05-20 |
| AU2019205103A1 (en) | 2020-07-23 |
| AU2022200416B2 (en) | 2023-06-15 |
| EP3926335B1 (en) | 2022-10-26 |
| CA3088990C (en) | 2023-12-19 |
| JP2022119773A (en) | 2022-08-17 |
| CN112055811B (en) | 2023-12-26 |
| KR102558160B1 (en) | 2023-07-21 |
| US11874242B2 (en) | 2024-01-16 |
| US20220390397A1 (en) | 2022-12-08 |
| EP3735580A2 (en) | 2020-11-11 |
| CN112055811A (en) | 2020-12-08 |
| US20200333273A1 (en) | 2020-10-22 |
| KR20220069122A (en) | 2022-05-26 |
| US11686695B2 (en) | 2023-06-27 |
| CA3185299A1 (en) | 2019-07-11 |
| EP4141430A1 (en) | 2023-03-01 |
| JP2024020474A (en) | 2024-02-14 |
Similar Documents
| Publication | Publication Date | Title |
|---|---|---|
| EP3735580B1 (en) | Evaluation arrangement for a thermal gas sensor, method and computer program product | |
| EP3735581B1 (en) | Gas sensor, and method for operating the gas sensor | |
| DE10191578B4 (en) | Device for measuring the flow of a liquid | |
| DE2900382A1 (en) | VOLTAGE METER PRESSURE TRANSDUCER DEVICE | |
| DE102014115566A1 (en) | Measuring device and method for determining a corrected mass flow and uses of the measuring device | |
| DE102019113539B9 (en) | Method and device for operating a multi-gas sensor | |
| US8659349B1 (en) | Control circuit for use with a four terminal sensor, and measurement system including such a control circuit | |
| DE19639627A1 (en) | Compensation for spatial and temporal temperature fluctuations in a thermal conductivity detector | |
| DE102009000067A1 (en) | Device for determining and/or monitoring mass flow rate of e.g. liquid, has evaluation unit determining information about measurement of measuring units and correction value for determination of values | |
| DE102011120899A1 (en) | Apparatus and method for determining the mass flow of a fluid | |
| DE4320326A1 (en) | Device for measuring a radial gas or liquid flow with a Wheatstone bridge of four temperature-sensitive resistors | |
| EP3887770B1 (en) | Thermal flow sensor and method for operating same | |
| DE10230198A1 (en) | Sensor with a heater and method | |
| DE202007019316U1 (en) | Temperature Sensor Adapters | |
| DE102010030952A1 (en) | Device for determining and monitoring e.g. volume flow rate of biological fluid, calculates correction value based on flow rate values determined using measured temperatures, and power required to maintain temperature of heating element | |
| DE112017004753T5 (en) | Mass flow meter with thermal dispersion technology | |
| EP3390976B1 (en) | Method for determining a flow rate of a medium | |
| DE19908360A1 (en) | Method for operating an eddy current sensor and eddy current sensor | |
| EP0861419B1 (en) | Method and device for simultaneous measurement of a volume flow and of at least one partial pressure | |
| WO2017174410A1 (en) | Calorimetric determining of a gas concentration | |
| EP3588081B1 (en) | Device and method for calibrating a fluid detector with pre-concentrator | |
| DE10332540B3 (en) | Method for temperature measurement and device for carrying out the method | |
| WO2024061957A1 (en) | Sensor arrangement | |
| WO2024061903A1 (en) | Sensor arrangement | |
| WO2002059588A1 (en) | Device and method for measuring a thermal conductivity |
Legal Events
| Date | Code | Title | Description |
|---|---|---|---|
| STAA | Information on the status of an ep patent application or granted ep patent |
Free format text: STATUS: UNKNOWN |
|
| STAA | Information on the status of an ep patent application or granted ep patent |
Free format text: STATUS: THE INTERNATIONAL PUBLICATION HAS BEEN MADE |
|
| PUAI | Public reference made under article 153(3) epc to a published international application that has entered the european phase |
Free format text: ORIGINAL CODE: 0009012 |
|
| STAA | Information on the status of an ep patent application or granted ep patent |
Free format text: STATUS: REQUEST FOR EXAMINATION WAS MADE |
|
| 17P | Request for examination filed |
Effective date: 20200805 |
|
| AK | Designated contracting states |
Kind code of ref document: A2 Designated state(s): AL AT BE BG CH CY CZ DE DK EE ES FI FR GB GR HR HU IE IS IT LI LT LU LV MC MK MT NL NO PL PT RO RS SE SI SK SM TR |
|
| AX | Request for extension of the european patent |
Extension state: BA ME |
|
| DAV | Request for validation of the european patent (deleted) | ||
| DAX | Request for extension of the european patent (deleted) | ||
| GRAP | Despatch of communication of intention to grant a patent |
Free format text: ORIGINAL CODE: EPIDOSNIGR1 |
|
| STAA | Information on the status of an ep patent application or granted ep patent |
Free format text: STATUS: GRANT OF PATENT IS INTENDED |
|
| INTG | Intention to grant announced |
Effective date: 20210525 |
|
| GRAJ | Information related to disapproval of communication of intention to grant by the applicant or resumption of examination proceedings by the epo deleted |
Free format text: ORIGINAL CODE: EPIDOSDIGR1 |
|
| STAA | Information on the status of an ep patent application or granted ep patent |
Free format text: STATUS: REQUEST FOR EXAMINATION WAS MADE |
|
| GRAP | Despatch of communication of intention to grant a patent |
Free format text: ORIGINAL CODE: EPIDOSNIGR1 |
|
| STAA | Information on the status of an ep patent application or granted ep patent |
Free format text: STATUS: GRANT OF PATENT IS INTENDED |
|
| INTC | Intention to grant announced (deleted) | ||
| INTG | Intention to grant announced |
Effective date: 20211110 |
|
| GRAS | Grant fee paid |
Free format text: ORIGINAL CODE: EPIDOSNIGR3 |
|
| GRAA | (expected) grant |
Free format text: ORIGINAL CODE: 0009210 |
|
| STAA | Information on the status of an ep patent application or granted ep patent |
Free format text: STATUS: THE PATENT HAS BEEN GRANTED |
|
| AK | Designated contracting states |
Kind code of ref document: B1 Designated state(s): AL AT BE BG CH CY CZ DE DK EE ES FI FR GB GR HR HU IE IS IT LI LT LU LV MC MK MT NL NO PL PT RO RS SE SI SK SM TR |
|
| REG | Reference to a national code |
Ref country code: GB Ref legal event code: FG4D Free format text: NOT ENGLISH |
|
| REG | Reference to a national code |
Ref country code: CH Ref legal event code: EP |
|
| REG | Reference to a national code |
Ref country code: AT Ref legal event code: REF Ref document number: 1487300 Country of ref document: AT Kind code of ref document: T Effective date: 20220515 |
|
| REG | Reference to a national code |
Ref country code: DE Ref legal event code: R096 Ref document number: 502019004193 Country of ref document: DE |
|
| REG | Reference to a national code |
Ref country code: IE Ref legal event code: FG4D Free format text: LANGUAGE OF EP DOCUMENT: GERMAN |
|
| REG | Reference to a national code |
Ref country code: NL Ref legal event code: FP |
|
| REG | Reference to a national code |
Ref country code: SE Ref legal event code: TRGR |
|
| REG | Reference to a national code |
Ref country code: LT Ref legal event code: MG9D |
|
| PG25 | Lapsed in a contracting state [announced via postgrant information from national office to epo] |
Ref country code: PT Free format text: LAPSE BECAUSE OF FAILURE TO SUBMIT A TRANSLATION OF THE DESCRIPTION OR TO PAY THE FEE WITHIN THE PRESCRIBED TIME-LIMIT Effective date: 20220829 Ref country code: NO Free format text: LAPSE BECAUSE OF FAILURE TO SUBMIT A TRANSLATION OF THE DESCRIPTION OR TO PAY THE FEE WITHIN THE PRESCRIBED TIME-LIMIT Effective date: 20220727 Ref country code: LT Free format text: LAPSE BECAUSE OF FAILURE TO SUBMIT A TRANSLATION OF THE DESCRIPTION OR TO PAY THE FEE WITHIN THE PRESCRIBED TIME-LIMIT Effective date: 20220427 Ref country code: HR Free format text: LAPSE BECAUSE OF FAILURE TO SUBMIT A TRANSLATION OF THE DESCRIPTION OR TO PAY THE FEE WITHIN THE PRESCRIBED TIME-LIMIT Effective date: 20220427 Ref country code: GR Free format text: LAPSE BECAUSE OF FAILURE TO SUBMIT A TRANSLATION OF THE DESCRIPTION OR TO PAY THE FEE WITHIN THE PRESCRIBED TIME-LIMIT Effective date: 20220728 Ref country code: FI Free format text: LAPSE BECAUSE OF FAILURE TO SUBMIT A TRANSLATION OF THE DESCRIPTION OR TO PAY THE FEE WITHIN THE PRESCRIBED TIME-LIMIT Effective date: 20220427 Ref country code: BG Free format text: LAPSE BECAUSE OF FAILURE TO SUBMIT A TRANSLATION OF THE DESCRIPTION OR TO PAY THE FEE WITHIN THE PRESCRIBED TIME-LIMIT Effective date: 20220727 |
|
| PG25 | Lapsed in a contracting state [announced via postgrant information from national office to epo] |
Ref country code: RS Free format text: LAPSE BECAUSE OF FAILURE TO SUBMIT A TRANSLATION OF THE DESCRIPTION OR TO PAY THE FEE WITHIN THE PRESCRIBED TIME-LIMIT Effective date: 20220427 Ref country code: PL Free format text: LAPSE BECAUSE OF FAILURE TO SUBMIT A TRANSLATION OF THE DESCRIPTION OR TO PAY THE FEE WITHIN THE PRESCRIBED TIME-LIMIT Effective date: 20220427 Ref country code: LV Free format text: LAPSE BECAUSE OF FAILURE TO SUBMIT A TRANSLATION OF THE DESCRIPTION OR TO PAY THE FEE WITHIN THE PRESCRIBED TIME-LIMIT Effective date: 20220427 Ref country code: IS Free format text: LAPSE BECAUSE OF FAILURE TO SUBMIT A TRANSLATION OF THE DESCRIPTION OR TO PAY THE FEE WITHIN THE PRESCRIBED TIME-LIMIT Effective date: 20220827 |
|
| REG | Reference to a national code |
Ref country code: DE Ref legal event code: R097 Ref document number: 502019004193 Country of ref document: DE |
|
| PG25 | Lapsed in a contracting state [announced via postgrant information from national office to epo] |
Ref country code: SM Free format text: LAPSE BECAUSE OF FAILURE TO SUBMIT A TRANSLATION OF THE DESCRIPTION OR TO PAY THE FEE WITHIN THE PRESCRIBED TIME-LIMIT Effective date: 20220427 Ref country code: SK Free format text: LAPSE BECAUSE OF FAILURE TO SUBMIT A TRANSLATION OF THE DESCRIPTION OR TO PAY THE FEE WITHIN THE PRESCRIBED TIME-LIMIT Effective date: 20220427 Ref country code: RO Free format text: LAPSE BECAUSE OF FAILURE TO SUBMIT A TRANSLATION OF THE DESCRIPTION OR TO PAY THE FEE WITHIN THE PRESCRIBED TIME-LIMIT Effective date: 20220427 Ref country code: ES Free format text: LAPSE BECAUSE OF FAILURE TO SUBMIT A TRANSLATION OF THE DESCRIPTION OR TO PAY THE FEE WITHIN THE PRESCRIBED TIME-LIMIT Effective date: 20220427 Ref country code: EE Free format text: LAPSE BECAUSE OF FAILURE TO SUBMIT A TRANSLATION OF THE DESCRIPTION OR TO PAY THE FEE WITHIN THE PRESCRIBED TIME-LIMIT Effective date: 20220427 Ref country code: DK Free format text: LAPSE BECAUSE OF FAILURE TO SUBMIT A TRANSLATION OF THE DESCRIPTION OR TO PAY THE FEE WITHIN THE PRESCRIBED TIME-LIMIT Effective date: 20220427 Ref country code: CZ Free format text: LAPSE BECAUSE OF FAILURE TO SUBMIT A TRANSLATION OF THE DESCRIPTION OR TO PAY THE FEE WITHIN THE PRESCRIBED TIME-LIMIT Effective date: 20220427 |
|
| PLBE | No opposition filed within time limit |
Free format text: ORIGINAL CODE: 0009261 |
|
| STAA | Information on the status of an ep patent application or granted ep patent |
Free format text: STATUS: NO OPPOSITION FILED WITHIN TIME LIMIT |
|
| PG25 | Lapsed in a contracting state [announced via postgrant information from national office to epo] |
Ref country code: AL Free format text: LAPSE BECAUSE OF FAILURE TO SUBMIT A TRANSLATION OF THE DESCRIPTION OR TO PAY THE FEE WITHIN THE PRESCRIBED TIME-LIMIT Effective date: 20220427 |
|
| 26N | No opposition filed |
Effective date: 20230130 |
|
| PGFP | Annual fee paid to national office [announced via postgrant information from national office to epo] |
Ref country code: IE Payment date: 20230119 Year of fee payment: 5 Ref country code: FR Payment date: 20230123 Year of fee payment: 5 |
|
| PG25 | Lapsed in a contracting state [announced via postgrant information from national office to epo] |
Ref country code: SI Free format text: LAPSE BECAUSE OF FAILURE TO SUBMIT A TRANSLATION OF THE DESCRIPTION OR TO PAY THE FEE WITHIN THE PRESCRIBED TIME-LIMIT Effective date: 20220427 |
|
| PGFP | Annual fee paid to national office [announced via postgrant information from national office to epo] |
Ref country code: SE Payment date: 20230123 Year of fee payment: 5 Ref country code: GB Payment date: 20230124 Year of fee payment: 5 Ref country code: DE Payment date: 20230216 Year of fee payment: 5 |
|
| PGFP | Annual fee paid to national office [announced via postgrant information from national office to epo] |
Ref country code: NL Payment date: 20230124 Year of fee payment: 5 |
|
| REG | Reference to a national code |
Ref country code: CH Ref legal event code: PL |
|
| PG25 | Lapsed in a contracting state [announced via postgrant information from national office to epo] |
Ref country code: LU Free format text: LAPSE BECAUSE OF NON-PAYMENT OF DUE FEES Effective date: 20230107 |
|
| REG | Reference to a national code |
Ref country code: BE Ref legal event code: MM Effective date: 20230131 |
|
| PG25 | Lapsed in a contracting state [announced via postgrant information from national office to epo] |
Ref country code: LI Free format text: LAPSE BECAUSE OF NON-PAYMENT OF DUE FEES Effective date: 20230131 Ref country code: CH Free format text: LAPSE BECAUSE OF NON-PAYMENT OF DUE FEES Effective date: 20230131 |
|
| PG25 | Lapsed in a contracting state [announced via postgrant information from national office to epo] |
Ref country code: BE Free format text: LAPSE BECAUSE OF NON-PAYMENT OF DUE FEES Effective date: 20230131 |
|
| PG25 | Lapsed in a contracting state [announced via postgrant information from national office to epo] |
Ref country code: IT Free format text: LAPSE BECAUSE OF FAILURE TO SUBMIT A TRANSLATION OF THE DESCRIPTION OR TO PAY THE FEE WITHIN THE PRESCRIBED TIME-LIMIT Effective date: 20220427 |
|
| PGFP | Annual fee paid to national office [announced via postgrant information from national office to epo] |
Ref country code: NL Payment date: 20240123 Year of fee payment: 6 |
|
| PGFP | Annual fee paid to national office [announced via postgrant information from national office to epo] |
Ref country code: IE Payment date: 20240118 Year of fee payment: 6 |