EP3623782B1 - Überwachung der thermischen leistung eines stromzählers - Google Patents
Überwachung der thermischen leistung eines stromzählers Download PDFInfo
- Publication number
- EP3623782B1 EP3623782B1 EP18194512.2A EP18194512A EP3623782B1 EP 3623782 B1 EP3623782 B1 EP 3623782B1 EP 18194512 A EP18194512 A EP 18194512A EP 3623782 B1 EP3623782 B1 EP 3623782B1
- Authority
- EP
- European Patent Office
- Prior art keywords
- electricity meter
- temperature
- thermal
- electricity
- meter
- Prior art date
- Legal status (The legal status is an assumption and is not a legal conclusion. Google has not performed a legal analysis and makes no representation as to the accuracy of the status listed.)
- Active
Links
- 230000005611 electricity Effects 0.000 title claims description 351
- 238000012544 monitoring process Methods 0.000 title claims description 46
- 238000000034 method Methods 0.000 claims description 90
- 230000006399 behavior Effects 0.000 claims description 60
- 230000008859 change Effects 0.000 claims description 54
- 238000012545 processing Methods 0.000 claims description 33
- 238000010438 heat treatment Methods 0.000 claims description 30
- 238000004590 computer program Methods 0.000 claims description 23
- 230000004044 response Effects 0.000 claims description 11
- 238000010801 machine learning Methods 0.000 claims description 9
- 238000001816 cooling Methods 0.000 claims description 8
- 230000007613 environmental effect Effects 0.000 claims description 8
- 230000005612 types of electricity Effects 0.000 claims description 8
- 238000005096 rolling process Methods 0.000 claims description 3
- 238000012546 transfer Methods 0.000 description 94
- 238000013461 design Methods 0.000 description 47
- 238000004891 communication Methods 0.000 description 37
- 238000004377 microelectronic Methods 0.000 description 31
- 230000007423 decrease Effects 0.000 description 21
- 230000020169 heat generation Effects 0.000 description 20
- 230000007935 neutral effect Effects 0.000 description 20
- 238000009434 installation Methods 0.000 description 19
- 230000005540 biological transmission Effects 0.000 description 16
- 230000008569 process Effects 0.000 description 15
- 230000000694 effects Effects 0.000 description 13
- 238000010586 diagram Methods 0.000 description 12
- 230000000875 corresponding effect Effects 0.000 description 11
- 239000004020 conductor Substances 0.000 description 7
- 230000009471 action Effects 0.000 description 6
- 230000006870 function Effects 0.000 description 6
- 238000005259 measurement Methods 0.000 description 6
- 238000012806 monitoring device Methods 0.000 description 6
- 230000005855 radiation Effects 0.000 description 6
- 230000001052 transient effect Effects 0.000 description 5
- 230000032683 aging Effects 0.000 description 4
- 238000013021 overheating Methods 0.000 description 4
- 239000000758 substrate Substances 0.000 description 4
- 230000001419 dependent effect Effects 0.000 description 3
- 238000001514 detection method Methods 0.000 description 3
- 230000000630 rising effect Effects 0.000 description 3
- 238000009529 body temperature measurement Methods 0.000 description 2
- 230000003139 buffering effect Effects 0.000 description 2
- 238000004422 calculation algorithm Methods 0.000 description 2
- 238000004364 calculation method Methods 0.000 description 2
- 239000000969 carrier Substances 0.000 description 2
- 230000001276 controlling effect Effects 0.000 description 2
- 231100001261 hazardous Toxicity 0.000 description 2
- 230000017525 heat dissipation Effects 0.000 description 2
- 230000007257 malfunction Effects 0.000 description 2
- 239000000463 material Substances 0.000 description 2
- 230000009467 reduction Effects 0.000 description 2
- 206010073306 Exposure to radiation Diseases 0.000 description 1
- 230000005856 abnormality Effects 0.000 description 1
- 238000010521 absorption reaction Methods 0.000 description 1
- 230000006978 adaptation Effects 0.000 description 1
- 230000002730 additional effect Effects 0.000 description 1
- 230000008901 benefit Effects 0.000 description 1
- 238000006243 chemical reaction Methods 0.000 description 1
- 230000000052 comparative effect Effects 0.000 description 1
- 230000002596 correlated effect Effects 0.000 description 1
- 238000007405 data analysis Methods 0.000 description 1
- 238000013500 data storage Methods 0.000 description 1
- 238000009795 derivation Methods 0.000 description 1
- 230000006866 deterioration Effects 0.000 description 1
- 238000011161 development Methods 0.000 description 1
- 230000018109 developmental process Effects 0.000 description 1
- 238000005516 engineering process Methods 0.000 description 1
- 238000011156 evaluation Methods 0.000 description 1
- 238000001914 filtration Methods 0.000 description 1
- 230000004907 flux Effects 0.000 description 1
- 238000005338 heat storage Methods 0.000 description 1
- 239000011810 insulating material Substances 0.000 description 1
- 238000009413 insulation Methods 0.000 description 1
- 230000007774 longterm Effects 0.000 description 1
- 238000002844 melting Methods 0.000 description 1
- 230000008018 melting Effects 0.000 description 1
- 238000010295 mobile communication Methods 0.000 description 1
- 230000003287 optical effect Effects 0.000 description 1
- 230000035484 reaction time Effects 0.000 description 1
- 230000001105 regulatory effect Effects 0.000 description 1
- 238000005070 sampling Methods 0.000 description 1
- 230000001932 seasonal effect Effects 0.000 description 1
- 125000006850 spacer group Chemical group 0.000 description 1
- 230000003068 static effect Effects 0.000 description 1
- 230000002123 temporal effect Effects 0.000 description 1
Images


Classifications
-
- G—PHYSICS
- G01—MEASURING; TESTING
- G01R—MEASURING ELECTRIC VARIABLES; MEASURING MAGNETIC VARIABLES
- G01R22/00—Arrangements for measuring time integral of electric power or current, e.g. electricity meters
- G01R22/06—Arrangements for measuring time integral of electric power or current, e.g. electricity meters by electronic methods
- G01R22/061—Details of electronic electricity meters
- G01R22/068—Arrangements for indicating or signaling faults
-
- G—PHYSICS
- G01—MEASURING; TESTING
- G01K—MEASURING TEMPERATURE; MEASURING QUANTITY OF HEAT; THERMALLY-SENSITIVE ELEMENTS NOT OTHERWISE PROVIDED FOR
- G01K3/00—Thermometers giving results other than momentary value of temperature
- G01K3/005—Circuits arrangements for indicating a predetermined temperature
-
- G—PHYSICS
- G01—MEASURING; TESTING
- G01M—TESTING STATIC OR DYNAMIC BALANCE OF MACHINES OR STRUCTURES; TESTING OF STRUCTURES OR APPARATUS, NOT OTHERWISE PROVIDED FOR
- G01M99/00—Subject matter not provided for in other groups of this subclass
- G01M99/002—Thermal testing
Definitions
- the present invention relates to a method of monitoring a functional state of an electricity meter. Further, the present invention relates to a computer program for monitoring a functional state of an electricity meter. Furthermore, the present invention relates to a computer-readable data carrier having stored thereon a computer program according to the present invention, and to a data carrier signal carrying a computer program according to the present invention. Moreover, the present invention relates to an electricity meter configured to carry out the computer program according to the present invention. Finally, the present invention relates to an electricity metering system, in particular an Advanced Metering Infrastructure (AMI), comprising at least one electricity meter according to the present invention.
- AMI Advanced Metering Infrastructure
- faulty conditions of electricity meters should be identified in order to prevent hazardous events. Faulty conditions may occur, e.g. by self-heating of the electricity meter due to overload or malfunction in micro-electronic circuits of the electricity meter, due to excessive current flow or malfunction in a main internal busbar and associated electrical terminals of the electricity meter, or due to environmental impacts on the electricity meter, such as excessive temperatures in the surroundings of the electricity meter, which may be caused by sunlight or other heat sources, such as pipes of heating systems, or alike.
- WO 2013 006901 A1 on behalf of the applicant of the present invention describes a method and apparatus for monitoring the condition of a utility meter by obtaining a temperature value associated with the meter, determining whether the temperature value crosses a threshold, triggering an action if the threshold value is crossed.
- the temperature can be used as a fault parameter to determine the condition of a utility meter.
- WO 2016 066373 A1 on behalf of the applicant of the present invention relates to a method of determining a reduction of remaining service lifetime of an electrical device during a specific time period.
- a measurement system comprising a temperature measurement device, a current measurement device and a voltage measurement device.
- a temperature value, voltage values and current values are measured by using the measurement device.
- a harmonic load is determined based on the current values.
- a reduced maximum operating temperature is determined based on the harmonic load.
- An amount of transient over-voltages is determined based on the voltage values.
- a transient aging factor is determined based on the amount of transient over-voltages.
- a temperature dependent aging factor is determined based on the temperature value and the reduced maximum operating temperature.
- the reduction of remaining service life is determined based on the specific time period, the transient aging factor and the temperature dependent aging factor.
- US 6,847,300 B2 describes an electric power meter including a temperature sensor and a controller.
- the controller is operable, based on the temperature reported from the temperature sensor, to generate alarm(s) when the temperature exceeds certain alarm threshold(s), and to activate a power disconnect switch, thereby shutting off power to customer premises, when the temperature exceeds a shut off threshold.
- the controller is operable to activate the power disconnect switch for non-payment of electricity cost, subject to secondary criteria based on regulatory requirements.
- a customer terminal may be used to notify a customer of an alarm condition, to provide information regarding electrical power usage or to provide information regarding disconnection of electrical power.
- EP 1 980 862 A2 describes a meter having an interface that is connected to a temperature sensor, i.e. temperature-dependent resistor, by a wireless transmission circuit.
- a processor includes a saving unit for saving temperature data into a memory at pre-set time intervals or based on events registered in the processor, where the temperature data are provided with time information.
- the processor produces an alarm signal, which is applied to an interface or an interface contact, if a maximum temperature value is exceeded.
- US 7,716,012 B2 deals with a process monitoring method that aggregates monitoring devices and optionally sensors into one or more groups that are each related to a process of a utility system.
- the monitoring devices are organised into a monitoring system hierarchy manually or automatically.
- a process algorithm determines from the hierarchy which monitoring devices are connected to a load. Monitored data from load-connected monitoring device pairs are correlated to produce a correlation coefficient that is compared against a correlation threshold selected between 0 and 1. When the correlation coefficient exceeds the threshold, the device pair is grouped into a process group. Other device pairs exceeding the threshold are likewise grouped into the process group. Multiple processes may be determined with the process algorithm.
- Sensors may also be grouped manually with the process group containing monitoring devices, which may include virtual monitoring devices. Alarms associated with monitoring devices and sensors are aggregated into one process alarm.
- US 2014 225737 A1 describes a method and apparatus that monitors and controls the operation of an electricity meter, and modifies at least one temperature threshold for determining when an alarm message should be transmitted or an electrical connection in the meter should be disconnected.
- the method and apparatus include a plurality of sensors that detect temperatures in various locations within the electricity meter.
- the method and apparatus compare at least one detected temperature to at least one threshold and operate an alarm or a switch when the detected temperature exceeds the threshold.
- the method and apparatus determines an average rate of change for at least one temperature according to a short-term temperature average over a first number of samples of the temperature, and a long term-term temperature average over a second number of samples of the temperature. The second number of samples is different from the first number of samples.
- the method and apparatus reduce the threshold when the average rate of change exceeds a predetermined amount.
- US 2013 088799 A1 relates to a motor monitoring system using several calculated monitoring values to determine a status of a motor and take a predetermined action when a threshold corresponding with the monitoring value is exceeded.
- the threshold may be calculated by an intelligent electronic device (IED) monitoring the motor.
- the predetermined action may include further monitoring of the motor.
- the predetermined action may include monitoring equipment not directly monitored by the IED.
- US 2008/094231 A1 relates to monitoring the bearing temperature of an electrical machine that has a plurality of machine components.
- a temperature module is defined, simulating the thermal behavior in the electric motor based on a multi-mass model.
- the rotational speed and the current for the electric motor are continuously recorded as input parameters for the temperature model and at least one bearing power loss and/or bearing inner temperature, corresponding to a bearing, is continuously derived from the temperature model.
- a first warning signal is given when a computer-determined bearing power loss exceeds a given comparative value.
- a second warning signal is given when a computer-determined bearing inner ring temperature exceeds a given temperature difference from a corresponding computed bearing outer ring temperature.
- the thermal behavior of non-accessible components as the bearing can be determined by mere evaluation of the current and the rotational speed.
- An object of the present invention is to solve or at least mitigate disadvantages of methods for monitoring functional states of electricity meters according to the prior art.
- the object is achieved by a method of monitoring a functional state of an electricity meter, in that the method comprises the steps of:
- the object is achieved in that the computer program comprises instructions which, when the computer program is executed by an electricity meter and/or an administration device in an electricity metering system, cause the electricity meter and/or the administration device to carry out the steps of a method according to the present invention.
- a computer-readable data carrier according to the present invention has stored thereon a computer program according to the present invention.
- a data carrier signal according to the present invention is carrying a computer program according to the present invention.
- An electricity meter according to the present invention achieves the object in that the electricity meter is configured to carry out a method according to the present invention.
- an electricity metering system in particular an AMI, in that the metering system comprising at least one electricity meter according to the present invention and/or at least one administration device configured to carry out a method according to the present invention.
- a change of the respective temperature value can be monitored over time according to an individual performance of an electricity meter as it may change over time, instead of assuming general or common performance parameters of electricity meters as done according to the prior art.
- the present invention allows for considering certain timespans of the course of temperature values and/or temperature gradients to be monitored, and thus allows to adapt the threshold values according to certain events, load conditions, operational conditions, and/or environmental conditions of the electricity meter within these time spans.
- the solutions according to the present invention enable to increase accuracy of the monitoring in that the dynamic consideration of predefined temperature curves allows for setting tighter thresholds for temperature values and/or gradients than possible with static thresholds as used according to the prior art.
- the solutions according to the present invention enable to increase accuracy of the monitoring in that the thermal behaviour itself and thus the at least one predefined temperature curve may be readjusted over time, thereby providing moving or rolling thresholds or limits for respective temperature values and/or temperature gradients in a manner like moving means or averages are applied to time series of data points.
- the solutions are not limited to monitoring electricity meters themselves but are also directed to a detection of faulty electrical lines or cabling connected to electricity meters. Such conditions can occur, when fixing elements, such as screws, in electrical terminals to which the electrical lines are attached, are overtightened, not tightened well enough, or an insulation of the electrical lines is not removed properly. In case of overtightening, the electrical lines may be damaged e.g. such that their diameter is significantly reduced, and/or their strands are disrupted. In case of not well enough tightened or stripped electrical lines, the contact area between the line and the terminal can be significantly reduced. Both cases may result in high resistance contacts, which can cause an overheating that can be detected by solutions according to the present invention.
- the method further comprises the step of generating a trigger signal if the actual temperature value and/or a gradient thereof exceeds the at least one threshold value.
- the trigger signal may be used to influence the operational state or operational conditions of the electricity meter, and may be further used to signalise a faulty state of the electricity meter, e.g. by creating an error signal.
- the operational state may be influenced by switching off an electrical load applied to the electricity meter, in order to reduce heat generation within and/or around the electricity meter.
- An operational condition of electricity meter may be influenced for example by providing an interior and/or exterior heat sink for the electricity meter, e.g. in the form of a cooling fan, in order to lower an actual temperature within and/or around the electricity meter to a desired value.
- Respective signals representing the change in the operational state and/or operational condition, as well as error signals may be logged within the electricity meter and/or send to a higher instance administration device, such as a data concentrator or Head-End System (HES) of an electricity metering system, in order to be processed and made available for data analysis and decision-making.
- a higher instance administration device such as a data concentrator or Head-End System (HES) of an electricity metering system, in order to be processed and made available for data analysis and decision-making.
- HES Head-End System
- the electricity meter may send or receive information to or from a higher instance device, respectively, such as instructions for changing the operational state or operational conditions, the adjustment of temperature curves and/or threshold values, or alike. This helps in further improving flexibility and accuracy of monitoring functional states of electricity meters.
- thresholds are set such that they allow for detecting a worst-case thermal perform for a normally functioning meter, and hence, triggering signals will not be generated until a worst case normal condition is exceeded.
- varying thresholds are being continually computed for any given instant in time.
- the present invention allows for detecting a fault condition sooner as the prior art, when a measured performance of the electricity meter exceeds an expected performance for a given set of operational parameters of the electricity meter.
- the method further comprises the step of adjusting the at least one temperature curve and/or to select the temperature curve from a set of predefined temperature curves according to a certain operational state and/or according to a certain operational condition of the electricity meter. Adjustment of the at least one temperature curve may involve calculating intermediate values between two adjacent predefined temperature curves.
- Different operational states may include various modes of operating the electricity meter, for example whether the electricity meter is in an idle mode, a standby mode, a standard mode, a data receiving and/or sending mode, a data processing mode, a firmware update mode, or alike.
- Different operational conditions may also include different environmental conditions of electricity meter, in particular an ambient temperature, airflow, and/or thermal radiation in the surroundings of the electricity meter.
- Operational states may further be distinguished from faulty states of the electricity meter, such as when an error in hardware and/or software of the electricity meter occurs.
- the functional state of the electricity meter may be assessed.
- the determination of whether a threshold value is exceeded can be based on a specific temperature curve representing a respective operational state and/or respective operational conditions. Threshold values for determining, whether the electricity meter has entered a faulty state can be adjusted accordingly. This helps in further improving accuracy and reliability of the monitoring of functional states of the electricity meter.
- the method further comprises the step of identifying at least one point of interest in the at least one temperature curve.
- Points of interest may relate to certain operational conditions of the electricity meter, such as a steady state, load changes, heating or cooling conditions and large variations in thermal energy generation.
- specific thermal behaviours of the electricity meter may be closely monitored, such as by an increased density of predefined temperature values of the at least one predefined temperature curve and/or an increased rate of sampling temperature signals, which helps to better define and detect certain thermal phenomena in a differentiated manner. Thereby, accuracy and reliability of the monitoring of the functional state of the electricity meter can be further improved.
- an electrical resistance in a primary current path within the meter is associated to the at least one predefined temperature curve and/or derived from the actual temperature value and/or gradient thereof.
- the primary current path may comprise a bus bar a shunt, a switch or alike.
- the electrical resistance in the primary current path determines heat generation along the primary current path according to a respective electrical load on the primary current path.
- the at least one predefined temperature curve may become a function of the electrical load on the primary current path under the respective electrical resistance.
- the actual temperature value and/or gradient thereof can be used to determine the electrical resistance of the primary current path.
- the method further comprises the step of establishing at least one thermal model for modelling the thermal behaviour of the electricity meter, the at least one thermal model comprising the at least one predefined temperature curve.
- a thermal model may be implemented in any kind of computer software, such as a firmware of an electricity meter and/or an operating software of an administration device in an electricity metering system.
- the thermal model is used to model thermal behaviour of the electricity meter or any other electrical device and may comprise one or more thermally active elements or components of the electricity meter, the thermal behaviour of which is modelled in order to estimate power dissipation and therefore the amount of heating due to both micro-electronic circuits and heating due to current flow in main current paths.
- Machine learning may then be applied to the output of the model to tune configuration parameters of the thermal model in order to adapt the thermal model to certain operation conditions and operational states of the electricity meter.
- input parameters of the thermal model comprise the following:
- output parameters of the thermal model comprise the following:
- Such outputs of the thermal model are preferably continuously calculated, for example every tenth of a second, every second and/or every minute. Due to variability in estimated input parameters, the thermal model may be calculated multiple times with different possible minimum and maximum values to determine a range of possible output parameters. The output parameters may be used to perform certain actions in the course of determining whether the actual temperature value and/or a gradient thereof exceeds at least one threshold value.
- the electricity meter when the electricity meter is in a steady state with a low load condition, it may be determined whether:
- Any deviations or differences between actual values and predefined values, i.e. between model output parameters and measured and/or estimated values of the respective parameters may indicate a modelling error and/or a faulty condition of the electricity meter, and are tracked over time, preferably long term, to determine based on further processing of the parameters, if any kind of trend, pattern or correlation hinting to a specific modelling, software and/or hardware error, can be identified.
- At least one parameter of the thermal model is automatically adjusted by machine learning.
- errors due to faulty conditions are distinguished from incorrectly set configuration parameters or external effects and operating conditions, such as heating from sources outside of the electricity meter.
- a logic implemented for identifying and distinguishing certain errors, trends, patterns or correlations from each other in a machine learning process to be carried out as a part of a method according to the present invention may be based on the following:
- the machine learning process will involve adjustment and/or change of parameters of the model in such a way that the respective error or an unwanted trend is reduced.
- the step of establishing the at least one thermal model includes the step of defining at least one equilibrium state which the electricity meter assumes during operation, the at least one equilibrium state representing a thermal equilibrium of the electricity meter in dependence of at least one electrical load running through the electricity meter, and of environmental conditions existing in an environment of the electricity meter.
- the at least one equilibrium state may be based on a certain operational state of the electricity meter, e. g. an electrical power condition of the electricity meter based on a certain current flowing through the electricity meter at a certain phase and voltage.
- Environmental conditions may in particular refer to a temperature in the surroundings of the electricity meter and/or to thermal radiation to which the electricity meter is exposed or which is emitted from the electricity meter.
- the at least one temperature curve can then be adjusted according to the at least one equilibrium state.
- an equilibrium temperature corresponding to the at least one equilibrium state may be identified and/or defined.
- Threshold values to be monitored may then be defined based on the respective equilibrium temperature. This helps in further adapting the threshold values to respective operational conditions of the electricity meter, and thus to improve flexibility and accuracy of the monitoring of the functional state of the electricity meter.
- the step of establishing the at least one thermal model includes the step of defining at least one heating behaviour and/or at least one cooling behaviour of the electricity meter based on at least one step response of the electricity meter to a change in an operational and/or functional state of the electricity meter.
- Step responses particularly occur when operational conditions of the electricity meter suddenly change, such as when electrical power applied to the electricity meter suddenly rises or falls, either when the electrical load to be measured by the electricity meter changes, or when electronic circuitry of the electricity meter itself performs certain operations, including power on or power off.
- the at least one heating behaviour commonly relates to a rise in electrical power
- the at least one cooling behaviour relates to a drop of electrical power applied to the electricity meter.
- respective thresholds values to be monitored can be adjusted, which helps in further improving flexibility and accuracy of the monitoring of the functional state of the electricity meter.
- the at least one functional step response relates to a change of an electrical load on a bus bar of the electricity meter.
- the bus bar or collecting bar of the electricity meter carries the electrical power to be metered and is thus exposed to relatively high maximal currents and voltages. Consequently, the bus bar is a critical component to be monitored, since due to the relatively high loads, failures on the busbar and related terminals can cause hazardous conditions, including overheating, melting, arcing or alike, of respective components, which on the one hand may cause power failures, and on the other hand can ignite fires.
- involving changes of the electrical loads on the bus bar in the temperature model helps to further improve accuracy and reliability of the monitoring of the functional state of the electricity meter.
- the step of establishing the thermal model involves the step of determining at least one thermal resistance value and/or the step of determining at least one thermal capacitance value of the electricity meter.
- the at least one thermal resistance value serves for defining temperature differences across the structure of the electricity meter, and to model the thermal behaviour, e.g. a heat sink behaviour, of the electricity meter and its ability to conduct thermal energy as a reaction to being exposed to thermal energy which may be generated on the inside of the electricity meter or in the surroundings thereof.
- the at least one thermal capacitance value helps to define a thermal mass of the electricity meter, and to model the thermal behaviour thereof, in particular its ability to store thermal energy.
- the at least one thermal resistance value and/or the at least one thermal capacitance value may be applied to each thermally active element or component of the electricity meter as a respective modelling parameter of the thermal model to be established.
- the at least one thermal resistance value and at least one thermal capacitance value help to refine the thermal model of the electricity meter to provide a precise understanding of the thermal behaviour of the electricity meter and thus generate the at least one predefined temperature curve. Consequently, the at least one thermal resistance value and at least one thermal capacitance value help to further improve accuracy and reliability of the monitoring of functional states of the electricity meter.
- the step of establishing at least one thermal model is carried out for at least two different types of operating conditions of the electricity meter and/or at least two different types of electricity meters.
- the at least two different types of operating conditions may relate to different load conditions and operational states of the electricity meter and/or to different functional states of the electricity meter. In the different load conditions, different electrical loads on the electricity meter may be considered.
- different operational states may include various modes of operating the electricity meter, for example an idle mode, a standby mode, a standard mode, a data receiving and/or sending mode, a data processing mode, a firmware update mode, or alike, and may further include different environmental conditions of electricity meter, in particular temperature, airflow, and/or thermal radiation in the surroundings of the electricity meter.
- Operational states are to be distinguished from faulty states of the electricity meter, such as when an error in hardware and/or software of the electricity meter occurs. This helps in further improving accuracy and reliability of the monitoring of functional states of the electricity meter.
- establishing at least one thermal model for at least two different types of electricity meters may involve establishing a general thermal model for the at least two different types of electricity meters.
- an individual thermal model may be established for each one of the at least two different types of electricity meters.
- a set of predefined temperature curves may be generated, comprising temperature curves for respective different operating conditions and/or different electricity meters.
- Each of the predefined temperature curves of the set of predefined temperature curves may represent a specific thermal behaviour of an electricity meter or of different electricity meters under respective operating conditions.
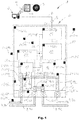
- Fig. 1 shows a schematic diagram illustrating an exemplary schematic architectural front view of an electricity metering system 1 comprising an electricity meter 2 according to an embodiment of the present invention.
- the electricity metering system 1 further comprises an administration device 3, such as a data concentrator or Head-End system (HES) in the form of a computer, or alike, for administrating and controlling the electricity metering system 1.
- an administration device 3 such as a data concentrator or Head-End system (HES) in the form of a computer, or alike, for administrating and controlling the electricity metering system 1.
- Control and administration of the electricity metering system 1, in particular of the electricity meter 2 and the administration device 3, is performed with the help of a computer program 4.
- HES Head-End system
- the computer program 4 can be provided on a computer-readable data carrier 5 configured to be accessed by the electricity meter 2 and/or the administration device 3. Alternatively, or additionally, the computer program 4 can be provided as being carried on a data carrier signal 6.
- the data carrier signal 6 or any other kind of data and/or information can be exchanged between the electricity meter 2 and the administration device 3 via energy and/or information transmission lines 7.
- the energy and/or information transmission lines 7 may be established in a wired and/or wireless manner.
- the electricity meter 1 is provided with a transmission means 8, in the form of a wired or wireless communication line, antenna, or alike.
- the electricity metering system 1 comprises electrical lines 9 in the form of cables or wires for transmitting electrical power to be metered by the electricity meter 2.
- the electricity meter 2 comprises an enclosure 10, in the form of a housing, case, shell or alike, for housing in various components of the electricity meter 1.
- the electricity meter 2 is provided with electrical terminals 12 for connecting the electrical lines 9 to the electricity meter 2 in an electrically conductive manner.
- an active input terminal 12a is configured to be connected to a phase input line 9a
- a neutral input terminal 12b is configured to be connected to a neutral input line 9b
- an active output terminal 12c is configured to be connected to a phase output line 9c
- a neutral output terminal 12d is configured to be connected to a neutral output line 9d.
- the terminals 12 are mounted on a terminal block 13 of the electricity meter 2.
- the terminal block 13 is held by the enclosure 10 and is formed of a highly insulating material and supports the terminals 12.
- a bus bar 14 with high current carrying capacity and low electrical resistance is provided within the electricity meter 2 as a primary current path for conducting electrical loads from the input terminals 12a, 12b to the output terminals 12c, 12d.
- the bus bar 14 has an active input section 14a, an active linking section 14b, an active output section 14c, and a neutral linking section 14d.
- the active input section 14a connects the active input terminal 12a to a resistive shunt 15.
- the active linking section 14b connects the resistive shunt 15 to a supply disconnect switch 16, in particular a switch input line 16a thereof.
- the active output section 14c connects the supply disconnect switch 16, in particular a switch output line 16b thereof, to the active output terminal 12c.
- the neutral linking section 14d connects the neutral input terminal 12b to the neutral output terminal 12d.
- a metering unit 17 of the electricity meter 2 comprising metering means in the form of microelectronics is connected to the busbar 14 in the region of the resistive shunt 15 used for measuring current flow through the busbar 14 by converting current to a proportional voltage.
- a metering input line 17a of the metering means 17 is connected to the resistive shunt 15 close to where the active input section 14a is connected to the resistive shunt 15.
- a metering output line 17b is connected to the resistive shunt 15 close to where the active linking section 14b is connected to the resistive shunt 15.
- a processing unit 18 of the electricity meter 2 comprises at least one microelectronic primary processor, memory, oscillator and/or supporting circuitry.
- a communications unit 19 comprises communications microelectronics, such as at least one transceiver or radio transmitter for communication via the transmission means 8.
- a power supply unit 20 of the electricity meter 2 comprises a power supply circuitry and microelectronics for converting grid supply voltage to voltages suitable for operating internal meter circuitry and components, such as the supply disconnect switch 16, the metering means 17, the processing unit 18, and the communications unit 19.
- Temperature sensors 21 are provided for generating temperature signals and/or temperature values.
- the temperature sensors 21 comprise a remote sensor 21a, external sensor 21b, internal top sensor 21c, internal front sensor 21d, internal back sensor 21e, internal side sensor 21f, terminal region sensor 21g, terminal block sensor 21h, supply line sensor 21i, input section sensor 21j, output section sensor 21k, linking section sensor l, switch sensor 21m, metering unit sensor 21n, processing unit sensor 21o, communications unit sensor 21p, and/or power supply unit sensor 21q.
- the remote sensor 21a is arranged and configured to measure an ambient temperature in the surroundings of the electricity meter 2 and is therefore preferably not physically connected to the electricity meter 2 in order to avoid a conductive thermal energy transfer between the remote sensor 21a and the electricity meter 2.
- the external sensor 21b is arranged and configured to measure an external temperature of the electricity meter 2, in particular of the enclosure 10.
- the internal sensors 21c to 21f are arranged and configured to measure internal temperatures of the electricity meter 2 at a top wall, a front wall, a back wall, and a side wall, respectively (see Fig. 3 ), on the inside of the enclosure 10.
- the terminal region sensor 21g is arranged and configured to measure a temperature in the region near or around the electrical terminals 12 on the inside of the enclosure 10.
- the supply line sensor 21i is arranged and configured to measure a temperature of the electrical lines 9, in particular of the phase input line 9a.
- the terminal block sensor 21h is arranged and configured to measure a temperature of the terminal block 13.
- the input section sensor 21j, output section sensor 21k, and linking section sensor 211 are arranged and configured to measure a temperature of the busbar 14, in particular of the active input section 14a, preferably in the vicinity of the resistive shunt 15, the active output section 14c, and the neutral linking section 14d, respectively.
- the switch sensor 21m, the metering unit sensor 21n, the processing unit sensor 21o, the communications unit sensor 21p, and the supply unit sensor 21q are arranged and configured to measure a temperature of the supply disconnect switch 16, the metering unit 17, the processing unit 18, the communications unit 19, and the power supply unit 20, respectively.
- internal conductors 22 of the electricity meter are provided in the form of cables, wires, conducting paths, conductor tracks, strip conductors, or alike, in order to connect the transmission means 8, bus bar 14, in particular the active input section 14a and the neutral linking section 14d thereof, the supply disconnect switch 16, the metering unit 17, the processing unit 18, the communications unit 19, the power supply unit 20, and/or the temperature sensors 21 to each other, whenever and exchange of information and/or energy between these components and elements of the electricity meter 2 is required.
- Fig. 1 an explicit illustration of internal conductors 22 connected to the temperature sensors 21 has been omitted in Fig. 1 .
- Fig. 2 shows a schematic cross-sectional side view of the electricity meter 2 in an operating environment 100 of the electricity meter 2.
- the enclosure 10 of the electricity meter 2 comprises a top wall section 10a, a bottom wall section 10b, a front wall section 10c, and a back wall section 10d.
- the enclosure 10 is provided or complemented with terminal cover 10e covering the electrical terminals 12.
- the electrical terminals 12 are each provided with at least one fixing elements 13a, such as a terminal screw, clamp, latch, or alike for fixing the electrical lines 9 to the electrical terminals 12 while establishing in electrical contact between the electrical lines 9 and the busbar 14.
- the supply disconnect switch 16, metering unit 17, processing unit 18, communications unit 19, and power supply unit 20 are mounted on a substrate 23, such as a printed circuit board (PCB).
- the substrate 23 is mounted to the enclosure 10, in particular the back wall section 10d thereof, by means of mounting elements 24.
- the mounting elements 24 may be embodied as mounting pegs, studs, spacer bolts, or alike.
- the operating environment 100 typically comprises a mounting structure 150 such as a wall of e.g. a building structure an electric cabinet, or alike, an air mass 160, and external heat sources 170, such as the sun, piping, conducts, exhausts, or alike.
- a mounting structure 150 such as a wall of e.g. a building structure an electric cabinet, or alike
- an air mass 160 such as the sun, piping, conducts, exhausts, or alike.
- An envelope boundary 200 for defining a thermal balance of the electricity meter 2 with respect to the operating environment 100 is defined in order to establish a thermal model in line with a method according to the present invention.
- the envelope boundary 200 extends along the walls of the enclosure 10, in particular runs within the top wall section 10a, the front wall section 10c, the back wall section 10d, and the terminal cover 10e which enclose an inner space 25 of the electricity meter 2.
- the thermal energy flows in the form of negative or positive conduction, convection, and/or radiation heat transfers comprise a heat transfer 209 across the envelope boundary 200 via the electrical lines 9, a heat transfer 210 across the envelope boundary 200 from the enclosure 10 to the air mass 160 and the operating environment 100, a heat transfer 210d across the envelope boundary 200 from the back wall section 10d to the mounting structure 150, a heat transfer 214 within the envelope boundary 200 from the busbar 14 to the inner space 25 of the electricity meter 2, a heat transfer 216 within the envelope boundary 200 from the supply disconnect switch 16 to the inner space 25 of the electricity meter 2, a heat transfer 217 within the envelope boundary 200 from the metering unit to the inner space 25 of the electricity meter 2, a heat transfer 218 within the envelope boundary 200 from the processing unit 18 to the inner space 25 of the electricity meter 2, a
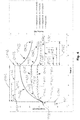
- Fig. 3 shows an exemplary thermal performance plot 300 of a thermal model according to the present invention for modelling a thermal behaviour the electricity meter 2.
- a temperature curve T300 for example representing inner temperature T25 as a temperature of air within the inner space 25 of the electricity meter 2 is determined.
- heat transfers from internal microelectronic circuits of the electricity meter 2 which for example comprise heat transfers 216, 217, 218, 219, 220 pertaining to the supply disconnect switch 16, metering unit 17, processing unit 18, communications unit 19, and/or power supply unit 20, respectively, amounting to approx. 3 W, and lead to a slow temperature increase T301 starting from an external ambient temperature T100 representing the temperature of the operating environment 100.
- a sudden rise in heat generation by the bus bar 14 sets in due to a current load of 100 A being applied to the bus bar 14 and associated parts and the primary current path of the electricity meter 2.
- a rapid temperature increase T302 takes place due to the respective heat transfer 214 of approx. 50 W in addition to the heat transfers 216, 217, 218, 219, 220.
- a first steady-state Q302 representing a thermal equilibrium state between the electricity meter 2 and the operating environment 100 is reached at a temperature of approx. 78°C after a time period d302 of approx. 24 s between the first step change C301 and the first steady state Q302.
- a sudden drop of the electrical load of the bus bar 14 takes place in that the current drops from 100 A to 50 A. Accordingly, the heat transfer 214 drops to approx. 12 W in addition to the heat transfers 216, 217, 218, 219, 220. Consequently, during a third phase 303 of the thermal performance plot, a rapid temperature decrease 303 takes place from the approx. 78°C in the first steady-state Q302 to a temperature of approximately 42°C in a second steady-state Q303.
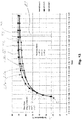
- Fig. 4 shows an exemplary diagram illustrating effects of thermal resistance in a thermal model according to the present invention for modelling a thermal behaviour of the electricity meter 2.
- the modelled thermal behaviour leads to three different temperature curves T410, T420, and T430 which are based on three different thermal resistance values Rth of 0.5 K/W, 1 K/W, and 2 K/W, respectively, assumed for the electricity meter 2.
- the thermal resistance values Rth are determined by the enclosure 10 of the electricity meter 2, in particular by the thickness and material properties of the wall sections 10a, 10b, 10c, 10d, and of the terminal cover 10e with their specific heat transfer coefficients.
- the temperature curves T410, T420, and T430 for example represent the inner temperature T25 of the electricity meter 2.
- a heat transfer from internal microelectronic circuits of the electricity meter 2 which for example again comprises heat transfers 216, 217, 218, 219, 220 pertaining to the supply disconnect switch 16, metering unit 17, processing unit 18, communications unit 19, and/or power supply unit 20, respectively, amounting to approx. 3 W, leads to a slow temperature increase T411, T421, and T431 in the temperature curves T410, T420, and T430, respectively, starting from the external ambient temperature T100 of approx. 25°C representing the temperature of the operating environment 100.
- a sudden rise in heat generation of approx. 10 W e.g. by the bus bar 14 due to a respective current load being applied to the bus bar 14 and associated parts in the primary current path of the electricity meter 2, sets in.
- rapid temperature increases T412, T422, and T432 take place in the in the temperature curves T410, T420, and T430, respectively, due to the respective heat transfer 214 of approx. 10 W in addition to the heat transfers 216, 217, 218, 219, 220.
- first steady-states Q412, Q422 and Q432 representing thermal equilibrium states between the electricity meter 2 and the operating environment 100 are reached at temperatures of approx. 31°C, 38°C and 50°C in the temperature curves T410, T420, and T430, respectively.
- the first steady-states Q412, Q422 and Q432 are reached after time periods d412, d422 and d432 of approx. 8s, 22s and 40s, respectively, after the first step change C401.
- a sudden drop of the electrical load of the bus bar 14 takes place. Accordingly, the heat transfer 214 drops to approx. 1.5 W in addition to the heat transfers 216, 217, 218, 219, 220. Consequently, during a third phase 403 of the thermal performance plot, rapid temperature decreases T413, T423, and T433 take place in the in the temperature curves T410, T420, and T430, respectively.
- temperatures drop from temperatures of approx. 31°C, 38°C and 50°C in the first steady-states Q412, Q422 and Q432 to temperatures of approx.
- Fig. 5 shows an exemplary diagram illustrating effects of thermal capacitance in a thermal model according to the present invention for modelling a thermal behaviour of the electricity meter 2.
- the modelled thermal behaviour leads to three different temperature curves T510, T520, and T530 which are based on three different thermal capacitance values Cth of 2 J/K, 5 J/K, and 10 J/K, respectively, assumed for the electricity meter 2.
- the temperature curves T510, T520, and T530 for example represent the inner temperature T25 of the electricity meter 2.
- a thermal resistance Rth of 1K/W is assumed for the modelled thermal behaviour leads to three different temperature curves T510, T520, and T530.
- the thermal performance plot 500 and the temperature curve T520 equal the thermal performance plot 400 and temperature curve T420, respectively, illustrated in Fig. 4 .
- a heat transfer from internal microelectronic circuits of the electricity meter 2 which for example again comprises heat transfers 216, 217, 218, 219, 220, pertaining to the supply disconnect switch 16, metering unit 17, processing unit 18, communications unit 19, and/or power supply unit 20, respectively, amounting to approx. 3 W, leads to a slow temperature increase T511, T521, and T531 in the temperature curves T510, T520, and T530, respectively, starting from the external ambient temperature T100 of approx. 25°C representing the temperature of the operating environment 100.
- a sudden rise in heat generation of approx. 10 W e.g. by the bus bar 14 due to a respective current load being applied to the bus bar 14 and associated parts and the primary current path of the electricity meter 2, sets in.
- rapid temperature increases T512, T522, and T532 take place in the in the temperature curves T510, T520, and T530, respectively, due to the respective heat transfer 214 of approx. 10 W in addition to the heat transfers 216, 217, 218, 219, 220.
- first steady-states Q512, Q522 and Q532 representing thermal equilibrium states between the electricity meter 2 and the operating environment 100 are reached at a temperature of approx. 38°C in the temperature curves T510, T520, and T530, respectively.
- the first steady-states Q512, Q522 and Q532 are reached after time periods d512, d522 and d532 of approx. 8s, 22s and 37s, respectively, after the first step change C501.
- a sudden drop of the electrical load of the bus bar 14 takes place. Accordingly, the heat transfer 214 drops to approx. 1.5 W in addition to the heat transfers 216, 217, 218, 219, 220. Consequently, during a third phase 503 of the thermal performance plot, rapid temperature decreases T513, T523, and T533 take place in the in the temperature curves T510, T520, and T530, respectively.
- temperatures drop from temperatures of approx. 38°C in the first steady-states Q512, Q522 and Q532 to temperatures of approx. 31°C in second steady-states Q513, Q523 and Q533 for the temperature curves T510, T520, and T530, respectively.
- the second steady-states Q513, Q523 and Q533 are reached after time periods d513, d523 and d533 of approx. 11 s, 18 s and 24 s, respectively, after the first step change C501.
- Fig. 6 shows an exemplary diagram illustrating effects of electrical resistance in a primary current path of the electricity meter 2 considered in a thermal model according to the present invention for modelling a thermal behaviour of an electricity meter 2.
- the modelled thermal behaviour leads to three different temperature curves T610, T620, and T630, pertaining to the electrical capacitance values R of 0.0002 Ohm, 0.001 Ohm, and 0.005 Ohm, respectively.
- the temperature curves T610, T620, and T630 for example represent the inner temperature T25 of the electricity meter 2.
- first step changes C611, C621, and C631 in the thermal performance plots 610, 620, and 630, sudden rises in heat generation of approx. 2 W, 10 W, and 50 W, respectively, e.g. by the bus bar 14 due to a respective current load being applied to the bus bar 14 and associated parts in the primary current path of the electricity meter 2, set in.
- second phases 612, 622, and 632 of the thermal performance plots 610, 620, and 630 respectively, rapid temperature increases T612, T622, and T632, take place in the in the temperature curves T610, T620, and T630 due to the respective heat transfers 214 of approx. 2 W, 10 W, and 50 W, respectively, in addition to the heat transfers 216, 217, 218, 219, 220.
- first steady-states Q612, Q622 and Q632 representing thermal equilibrium states between the electricity meter 2 and the operating environment 100 are reached at temperatures of approx. 29°C, 38°C, and 78°C in the temperature curves T610, T620, and T630, respectively.
- the first steady-states Q612, Q622 and Q632 are reached after time periods d612, d622 and d632 of approx. 12 s, 18 s and 37 s, respectively, after the first step change C601.
- a heat generating performance of the electricity meter 2 increases, i.e. after a step change with rising heat generation, equilibrium temperatures with corresponding steady heat transfers 209, 210, 210d, 260 crossing the envelope boundary 200 towards the operating environment 100 are reached later and at higher temperatures, the higher, the electrical resistance value R is.
- a sudden drop of the electrical load of the bus bar 14 takes place. Accordingly, the heat transfers 214 drop to approx. 1.5 W, 2 W, and 12 W in the thermal performance plots 610, 620, and 630, respectively, in addition to the heat transfers 216, 217, 218, 219, 220. Consequently, during third phases 613, 623, and 633, of the thermal performance plots 610, 620, and 630, rapid temperature decreases T613, T623, and T633 take place in the in the temperature curves T610, T620, and T630, respectively. In the present example, temperatures drop from temperatures of approx.
- the second steady-states Q613, Q623 and Q633 are reached after time periods d613, d623 and d633 of approx. 9 s, 18 s and 24 s, respectively, after the first step change C601.
- Fig. 7 shows an exemplary diagram illustrating modelling deviations which may occur when establishing a thermal model according to the present invention for modelling a thermal behaviour of the electricity meter 2.
- the modelled thermal behaviour leads to three different temperature curves T710, T720, and T730 which are based on nominal parameters for thermal resistance as well as thermal capacity, incorrect thermal resistance, and incorrect thermal capacity, respectively, assumed for the electricity meter 2.
- the temperature curves T710, T720, and T730 for example each represent the inner temperature T25 of the electricity meter 2.
- the heat transfer from internal microelectronic circuits of the electricity meter 2 which for example again comprises heat transfers 216, 217, 218, 219, 220, pertaining to the supply disconnect switch 16, metering unit 17, processing unit 18, communications unit 19, and/or power supply unit 20, respectively, amounting to approx. 3 W, leads to slow temperature increases T711, T721, and T731 in the temperature curves T710, T720, and T730, respectively, starting from the external ambient temperature T100 of approx. 25°C representing the temperature of the operating environment 100.
- the sudden rise in heat generation of approx. 50 W e.g. by the bus bar 14 due to the respective current load being applied to the bus bar 14 and associated parts and the primary current path of the electricity meter 2, sets in.
- rapid temperature increases T712, T722, and T732 take place in the in the temperature curves T710, T720, and T730, respectively, due to the respective heat transfer 214 of approx. 50 W in addition to the heat transfers 216, 217, 218, 219, 220.
- first steady-states Q712, Q722 and Q732 representing thermal equilibrium states between the electricity meter 2 and the operating environment 100 are reached at a temperature of approx. 78°C, 71°C, and 78°C in the temperature curves T710, T720, and T730, respectively.
- the first steady-states Q712, Q722 and Q732 are reached after time periods d712, d722 and d732 of approx. 24s, 20s and 12s, respectively, after the first step change C301.
- the sudden drop of the electrical load of the bus bar 14 takes place. Accordingly, the heat transfer 214 drops to approx. 12 W in addition to the heat transfers 216, 217, 218, 219, 220. Consequently, during the third phase 303 of the thermal performance plot 300, rapid temperature decreases T713, T723, and T733 take place in the in the temperature curves T710, T720, and T730, respectively. In the present example, temperatures drop from temperatures of approx. 78°C, 71°C, and 78°C in the first steady-states Q712, Q722 and Q732 to temperatures of approx.
- Fig. 8 shows an exemplary flowchart illustrating steps of establishing a thermal model according to the present invention for modelling a thermal behaviour of the electricity meter 2.
- a first step S1 heat generation within the electricity meter 2 is calculated.
- heat generation in microelectronic components and units is calculated, e.g. heat transfers 216, 217, 218, 219, 220, pertaining to the supply disconnect switch 16, metering unit 17, processing unit 18, communications unit 19, and/or power supply unit 20, respectively, based on a configuration status CON, a CPU load CPU and a communications status COM of the electricity meter 2.
- a second substep S1b heat generation by the bus bar 14 and associated parts and the primary current path of the electricity meter 2 is calculated while taking into account a current load A being applied to the busbar 14, temperature T of the busbar 14 and/or the inner temperature T25 of the electricity meter 2, and electrical resistance R of primary current path.
- heat dissipation from the electricity meter 2 due to heat transfer 210 and alike crossing the envelope boundary 200 is calculated for both, the microelectronic components and the primary current path of the electricity meter 2.
- heat dissipation and/or absorption due to heat transfer 209 and alike crossing the envelope boundary 200 is calculated for the primary current path of the electricity meter 2.
- step S2 the output values of step S1 along with minimum and maximum values of the ambient temperature T100 and heat transfer 270 from external heat sources 170, temperature gradients characterising the thermal behaviour of the electricity meter 2 are calculated as a computed or emulated gradient Gc based on the thermal modelling and a measured gradient Gm making use of temperature sensors 21.
- Output values of the second step are minimum and maximum values for the computed gradient Gc and the measured gradient Gm.
- a third step S3 as input values, the minimum and maximum values for the computed gradient Gc and the measured gradient Gm are used for computing respective temperature gradient and/or temperature value errors and/or deviations.
- a fourth step S4 the temperature gradient errors and/or deviations computed in the third step S3 are checked against respective error ranges and/or threshold values used as limits L. If such limits L are exceeded, then in the fifth step S5, respective triggering signal S is generated, such that a respective event is logged, an alarm is initiated, and/or the supply disconnect switch 16 is actuated.
- a sixth step S6 follows the fourth step S4 if it has been decided in the fourth step S4 that the respective limits L were not exceeded. Then, in the sixth step S6 it is checked if any temperature gradient and/or temperature value errors and/or deviations are due to self heating of the electricity meter 2 as a result of heat generation in microelectronic components, e.g. by heat transfers 216, 217, 218, 219, 220, for instance by taking into account the configuration status CON, the CPU load CPU and the communications status COM as well as any required temperature value T derived from temperature sensors 21.
- step S6 If it is decided in the sixth step S6 that temperature gradient and/or temperature value errors and/or deviations are due to self heating of the electricity meter 2, then in a seventh step S7, respective parameters, in particular heat transfers 216, 217, 218, 219, 220, the configuration status CON, the CPU load CPU and/or the communications status COM, used as input values in step 1, are adjusted accordingly.
- An eighth step S8 follows the sixth step S6 if it has been decided in the sixth step S6 that temperature gradient and/or temperature value errors and/or deviations are not due to self heating of the electricity meter 2. Then, in the eighth step S8 it is decided, if any temperature gradient and/or temperature value errors and/or deviations are due to heating of the primary current path, in particular the busbar 14 of the electricity meter 2, e.g. by taking into account respective heat transfers 214 and any one of temperature sensors 21 associated to the busbar 14.
- step S9 If it is decided in the eighth step S8 that temperature gradient and/or temperature value errors and/or deviations are due to heating of the primary current path, in particular the busbar 14, then in a ninth step S9, the value of the electrical resistance R associated to the primary current path, in particular the busbar 14, used as input value in step 1 is adjusted accordingly.
- a tenth step S10 follows the eighth step S8, if it has been decided in the eighth step S8 that temperature gradient and/or temperature value errors and/or deviations are not due to heating of the primary current path, in particular the busbar 14, of the electricity meter 2. Then, in the tenth step S10 it is decided, if any temperature gradient and/or temperature value errors and/or deviations are due to the heat transfer 270 from external heat sources 170, in particular by using respective temperature sensors 21 associated thereto.
- step S8 If it is decided in the eighth step S8 that temperature gradient and/or temperature value errors and/or deviations are due to heating the heat transfer 270 from external heat sources 170, then in an eleventh step S11, the values considered for computing the respective heat transfer 270, in particular outside temperatures T used as input values in step 1, are adjusted accordingly.
- a tenth step S10 follows the eighth step S8, if it has been decided in the eighth step S8 that temperature gradient and/or temperature value errors and/or deviations are not due to heating of the primary current path, in particular the busbar 14, of the electricity meter 2. Then, in the tenth step S10 it is decided, if any temperature gradient and/or temperature value errors and/or deviations are due to the heat transfer 270 from external heat sources 170, in particular by using respective temperature sensors 21 associated thereto. If it is decided in the tenth step S10 that temperature gradient and/or temperature value errors and/or deviations are due the heat transfer 270 from external heat sources 170, then in the eleventh step S11, the values considered for computing the respective heat transfer 270 are adjusted accordingly.
- a twelfth step S12 follows the tenth step S10, if it has been decided in the tenth step S10 that temperature gradient and/or temperature value errors and/or deviations are not due to heat transfer 270 from external heat sources 170. Then, in the twelfth step S12 it is decided, if any temperature gradient and/or temperature value errors and/or deviations are due to the heat transfer 209 via the electrical lines 9, in particular by using respective temperature sensors 21 associated thereto. If it is decided in the twelfth step S12 that temperature gradient and/or temperature value errors and/or deviations are due to the heat transfer 270 from external heat sources 170, then in a thirteenth step S13, the values considered for computing the respective heat transfer 209 are adjusted accordingly.
- a fourteenth step S14 following the fifth step S5, the seventh step S7, the ninth step S9, the eleventh step S11, the twelfth step 12, and/or the thirteenth step 13, the procedure shown in Fig. 8 is terminated and/or repeated in beginning again from the first step S1.
- Fig. 9 shows an exemplary flowchart illustrating steps of a runtime logic of the electricity meter 2 when establishing a thermal model according to the present invention for modelling a thermal behaviour of the electricity meter 2.
- the runtime logic are computer-readable instructions, such as software and/or firmware, constituting at least a part of the computer program 4, to be executed by the supply disconnect switch 16, metering unit 17, processing unit 18, communications unit 19, and/or power supply unit 20.
- instantaneous temperature values T and computed temperature gradient values Gc are continuously generated under using formulas for thermal capacitance Cth and thermal resistance Rth to model the electricity meter 2, while using readings from at least one of the temperature sensors 21, measurements of current load A, and/or microelectronic heating estimates, in particular for heat transfers 216, 217, 218, 219, and 220, pertaining to the metering unit 17, processing unit 18, communications unit 19, and/or power supply unit 20, respectively.
- a second runtime step RS2 multiple results for slight variations in model parameters over a range of potential model parameters, such as thermal capacitance Cth, thermal resistance Rth, electrical resistance R, and/or microelectronic heating factors, in particular for heat transfers 216, 217, 218, 219, and 220, pertaining to the metering unit 17, processing unit 18, communications unit 19, and/or power supply unit 20, respectively, are calculated.
- potential model parameters such as thermal capacitance Cth, thermal resistance Rth, electrical resistance R, and/or microelectronic heating factors
- a third runtime step RS3 errors and/or deviations between measured results and model results, i.e. measured temperatures gradients thereof versus emulated temperatures and gradients thereof, are calculated.
- model parameters are identified, that yield the smallest error/deviation between measured results and emulated results.
- a fifth runtime step RS5 small incremental changes are made to the model parameters identified in the fourth runtime step RS4, in the direction and proportional to the identified model parameters that yielded the smallest error or deviation.
- filtering may be used, for example by applying a finite impulse response filter and/or infinite impulse response filter.
- a sixth runtime step RS6 the identified and adjusted model parameters from runtime step 5 are compared to pre-configured range limitations to detect when the thermal model being established is normalising to a certain thermal model that is indicate if of an error or fault condition, such as excessive electrical resistance in the primary current path, in particular the bus bar 14, and/or faults in microelectronic components.
- an error or fault condition such as excessive electrical resistance in the primary current path, in particular the bus bar 14, and/or faults in microelectronic components.
- a seventh runtime step RS7 it is decided, whether parameters of certain thermal model from the sixth runtime step RS6, that indicate an error or fault condition, are out of a particular parameter range. Therefore, the respective model results are compared to respective threshold values. If the respective model parameters exceed the respective threshold values, then and error, fault and/or alarm event is recorded, and/or an additional action is taken, such as actuation of the supply disconnect switch 16, or alike.
- a ninth runtime step RS9 following the seventh runtime step RS7, points of interest are determined, such as steady-states, heating conditions, cooling conditions, and/or any relatively large variations in thermal energy generation.
- a tenth runtime step RS10 when the points of interest are identified in the ninth runtime step RS9, then corresponding information, including underlying thermal model parameters, such as instantaneous temperature T and temperature gradients G, current loads A, microelectronic heating estimates, and alike, are recorded.
- thermal model parameters such as instantaneous temperature T and temperature gradients G, current loads A, microelectronic heating estimates, and alike
- an eleventh runtime step RS11 information and parameters characterising points of interest recorded during the tenth runtime step RS 10, are used for adjusting model parameters and weighting of respective filter values of the finite impulse response filter and/or the infinite impulse response filter applied. For example, from a certain steady state, a sudden step change in load current A to near zero and the associated cooling provides an excellent opportunity to adjust the thermal capacitance Cth free from any error in estimated electrical resistance R in the primary current path. Alternatively, or additionally, a steady state condition provides an opportunity to adjust the thermal resistance Rth without the effect of thermal capacitance Cth complicating the calculation.
- a change in temperature T during a certain steady state while load current A and heating due to microelectronic heating factors, in particular heat transfers 216, 217, 218, 219, and 220, pertaining to the metering unit 17, processing unit 18, communications unit 19, and/or power supply unit 20, respectively, is relatively stable over time t, could be an indication of thermal changes in the operating environment 100.
- thermal model results are again being computed, as done in the first runtime step RS 1, but now based on information and parameters recorded in runtime step R10 during points of interest, if applicable, as adjusted in the eleventh runtime step RS11.
- respective errors and/or deviations between measured results and emulated results i.e. measured temperatures gradients thereof versus emulated temperatures and gradients thereof, are calculated, similar to as done in the third runtime step RS3.
- the adjusted filter values may be used, as obtained by weighting of respective filter values in runtime step 11, for example when applying a finite impulse response filter and/or infinite impulse response filter.
- information and parameters may be fed back to the first runtime steps RS1, the third runtime step RS3, and/or the fifth runtime step RS5, so that these steps are carried out in an iterative manner.
- model parameters obtained in previous runtime steps in particular the twelfth runtime step RS12, are recorded as historical values of model parameters.
- a fourteenth runtime step RS 14 the historical model parameters recorded in the thirteenth runtime step RS13 are scanned in order to identify any large answers or suspicious value and/or parameter variations.
- a fifteenth runtime step RS15 variations in the historical model parameters recorded in the fourteenth runtime step RS14 are used to incrementally adjust range limits of model parameters. Respective adjusted range limits can be fed back to the sixth runtime step RS6 for the detection of error or fault conditions based on the respective range limits.
- a seventeenth runtime step RS17 the first to sixteenth runtime steps RS1 to RS16, as described above, can be repeated in order to compute thermal model results of multiple thermal models used to represent different parts, elements and/or components, within the electricity meter 2.
- a single thermal model comprising a single thermal capacitance Cth and thermal resistance Rth is required and should be sufficient for modelling thermal behaviour of the electricity meter 2.
- thermal behaviour of different parts, element and/or components within the electricity meter 2 can be modelled as described herein.
- Fig. 10 shows an exemplary flowchart illustrating steps of a design time course thermal model discovery procedure when establishing a thermal model according to the present invention for modelling a thermal behaviour of the electricity meter 2.
- the steps illustrated in Fig. 10 serve for providing initial parameters and values to be implemented in the method steps as described above with reference to Figs. 8 and 9 .
- a first design step DS1 of the design time course thermal model discovery procedure illustrated in Fig. 10 the electricity meter 2 in an un-energised state, i.e. the electricity meter is not electrically powered, is placed in a controlled temperature chamber (not illustrated) and allowed to reach a thermal equilibrium state with respect to the temperature chamber having the ambient temperature T100.
- the meter is energised without any load being applied to the primary current path, and with unvarying, i.e. steady micro-electronic behaviour to ensure that heating due to microelectronic heating factors, in particular heat transfers 216, 217, 218, 219, and 220, pertaining to the metering unit 17, processing unit 18, communications unit 19, and/or power supply unit 20, respectively, is relatively stable, preferably constant over time.
- microelectronic heating factors turned on in the second design step DS2 in particular heat transfers 216, 217, 218, 219, and 220, pertaining to the metering unit 17, processing unit 18, communications unit 19, and/or power supply unit 20, respectively, are abruptly eliminated by de-energising the electricity meter 2.
- a fifth design step DS5 the supply disconnect switch 16 is activated under various load conditions with altered magnitude and phase of electrical power applied to the primary current path, i.e. different load currents A are applied to the active and neutral input terminals 12a, 12b of the electricity meter 2.
- different load currents A are applied to the active and neutral input terminals 12a, 12b of the electricity meter 2.
- a range of respective relay contact resistances of the supply disconnect switch 16 is measured and/or derived therefrom.
- impedance of the primary current path running through the electricity meter 2 from the active input terminal 12a to the active output terminal 12c thereof is measured after each switching operation of the supply disconnect switch 16 carried out in the fifth design step DS5.
- the first design step DS1 to the sixth design step DS6 as described above are then repeated.
- a seventh design step DS7 the electrical lines 9 are disconnected and reattached to the electrical terminals 12 numerous times using different wire diameters for the electrical lines 9.
- impedance of the primary current path running through the electricity meter 2 from the active input terminal 12a to the active output terminal 12c thereof is measured after each change of the electrical lines 9 carried out in the seventh design step DS7.
- impedance of the primary current path running through the electricity meter 2 from the neutral input terminal 12b to the neutral output terminal 12d thereof is measured after each change of the electrical lines 9 carried out in the seventh design step DS7 and/or after each switching operation of the supply disconnect switch 16 carried out in the fifth design step DS5.
- the first design step DS1 to the ninth design step DS9 as described above are then repeated.
- a tenth design step DS10 the temperature of the controlled temperature chamber representing the ambient temperature T100 is altered.
- the first design step DS1 to the tenth design step DS10 as described above are then repeated.
- different external heat sources 170 such as direct radiation from light and/or heat sources for simulating solar radiation, and/or controlled air flows are applied to the electricity meter 2, in particular to the enclosure 10 thereof.
- the type of material of the mounting structure 150 to which the electricity meter 2 is attached and/or a certain location of the electricity meter 2 in an electrical closet and/or at an electrical switchboard, are or is, respectively, altered.
- the first design step DS1 to the eleventh design step DS11 as described above are then repeated.
- a behaviour of the microelectronic components of the electricity meter 2 is a varied, in particular for varying heat transfers 216, 217, 218, 219, and 220, pertaining to the metering unit 17, processing unit 18, communications unit 19, and/or power supply unit 20, respectively.
- Such variations can be achieved e.g. by changing sample rates of the metering unit 17, changing processing loads, i.e. CPU loads, of the processing unit 18, and/or changing communication frequencies applied by the complications unit 19, etc.
- the first design step DS1 to the eleventh design step DS12 as described above are then repeated for the electricity meter 2. Additionally, after a desired number of repetitions of the first design step DS1 to the eleventh design step DS12, these steps of the design time course thermal model discovery procedure carried out when establishing a thermal model according to the present invention for modelling a thermal behaviour of the electricity meter 2 can be carried out for multiple different electricity meters 2 of the same kind and/or of different kinds in order to provide respective model parameters and values for a range of multiple different electricity meters 2.
- Fig. 11 shows an exemplary flowchart illustrating possible steps of an installation time course thermal model discovery procedure when establishing a thermal model according to the present invention for modelling a thermal behaviour of the electricity meter 2.
- a first installation step IS1 of the installation time course thermal model discovery procedure when establishing a thermal model according to the present invention impedance of the primary current path running through the electricity meter 2 from the active input terminal 12a to the active output terminal 12c thereof is measured.
- a type of the electrical lines 9 attached to the terminals 12 of the electricity meter 2 is specified, e.g. recorded and/or selected from a predefined list of possible types and/or diameters of the electrical lines 9 as enabled by the firmware of the electricity meter 2.
- a type of installation of the electricity meter 2 i.e. the type of operating environment 100, mounting structure 150 and/or external heat sources 170, for example in an electrical closet, on a wall, an exposure to radiation sources, etc., is specified, e.g. recorded and/or selected from a predefined list of possible types of operating environments 100, mounting structures 150 and/or external heat sources 170, respectively, as enabled by the firmware of the electricity meter 2.
- a current ambient temperature T100 is recorded in the electricity meter 2 as enabled by the firmware of the electricity meter 2.
- a current time, date, and/or weather conditions at the installation site of the electricity meter 2 are or is, respectively, recorded in the electricity meter 2 as enabled by the firmware of the electricity meter 2.
- Fig. 12 shows an exemplary diagram illustrating actual temperature curves TA, TB, and TC of three different electricity meters 2a, 2b, and 2c, respectively, to be emulated with a thermal model according to the present invention.
- the three temperature curves TA, TB, and TC are emulated in line with a method according to the present invention by carrying out respective method steps as described above while assuming the same operational states, i.e. current load A, configuration status CON, communications status COM, CPU load CPU, thermal capacitance Cth, and thermal resistance Rth, for each of the electricity meters 2. Consequently, any differences in temperature values and temperature gradients shown in Fig. 12 should be due to different electrical resistances R of the current paths and/or different environmental conditions of the electricity meters 2a, 2b, and 2c.
- Fig. 12 shows maximum slopes, i.e.
- an acceptable range of measured gradients Gm under the respective operating conditions extends from 4.3 °C/min to 4.7 °C/min, the latter constituting an upper range limit, both constituting thresholds, i.e. an upper threshold and a lower threshold, respectively, of a range of maximum values of emulated gradients dGc of 0.2 °C/min.
- an acceptable range of temperature rises dT under the respective operating conditions extends from 47.1 °C to 49.2 °C, the later constituting an upper range limit, both constituting thresholds, i.e.
- temperature curve TA is based on temperature measurements carried out by utilising at least one of the temperature sensors 21 after a certain load current A has been applied to the primary path of the electricity meter 2 at the step change C.
- Temperature curve TB could be an emulated temperature curve computed for an alternative load current A, which is higher than the load current underlying temperature curve TA.
- Temperature curve TC could be an emulated temperature curve computed for the same load current A underlying temperature curve TA.
- the maximum measured temperature rise dT of 47.5 °C at a time t of 4:20 in temperature curve A lies well within the two emulated temperature rises 47.1 °C and 49.2 °C at that point of time in the two emulated temperature curves TA and TC, respectively.
- temperature curve TA has been measured with the same current load A as underlying the emulated temperature curve TC, then the higher measured temperature rise dT of 47.5 °C in temperature curve TA at the time of 4:20 exceeding the emulated temperature rise dT of 47.1 °C at that point of time in temperature curve TC by a relative temperature difference ⁇ T of 0.4°C between the two temperature curves at that point of time could hint to a faulty state or could at least indicate a tendency towards the development of a faulty state.
- the excessive heat rise in temperature curve TA indicates an increase in electrical resistance R of the primary current path of the electricity meter and/or microelectronic components, which may be due to a deterioration of electrical connections within the primary current path and/or the microelectronic components, respectively, and could therefore constitute a faulty state of the electricity meter 2.
- the electricity metering system 1 may comprise electricity meters 2, 2a, 2b, 2c, administration devices 3, computer programs 4, computer-readable data carriers 5, data carrier signal 6, energy and/or information transmission lines 7, transmission means 8, and/or electrical lines 9, 9a, 9b, 9c, 9d in any number and form required for implementing a desired configuration for operating, monitoring and/or controlling the electricity metering system 1 and in particular any electricity meters 2, 2a, 2b, 2c therein.
- the electricity meter 2 may be provided with an enclosure 10 having wall sections 10a, 10b, 10c, 10d, terminal covers 10e, bottom sections 11, electrical terminals 12, 12a, 12b, 12c, 12d, terminal blocks 13, fixing element 13a, bus bars 14 with sections 14a, 14b, 14c, 14d, resistive shunts 15, supply disconnect switches 16, switch input lines 16a, switch output line 16b, metering unit 17, metering input lines 17a, metering output lines 17b, processing unit 18, communications units 19, power supply units 20, temperature sensors 21, 21a to 21q, internal conductors 22, substrates 23, mounting elements 24, and/or inner spaces 25 in any number and form required for performing desired functions.
- the present invention is not limited to electricity meters 2 with electrical terminals 12, 12a, 12b, 12c, 12d as described herein, but can also applied to e.g. so-called socket meters having contact elements or terminals embodied as blades that slot into a socket that is part of a base assembly affixed to the wall or distribution board, which allows a fast replacement of such socket meters and avoids cabling adjustments.
- the present invention can be implemented within the socket meter, the base assembly including the socket, or a combination thereof. Socket meters may suffer from high resistance contacts on the blades and/or sockets interfacing the socket meter.
- the administration device 3, transmission means 8, metering unit 17, processing unit 18, communication unit 19, power supply units 20 and/or temperature sensors 21, 21a to 21q may comprise any kind of electronic data processing, storage, interface and/or operation means in any number and form desired.
- the energy and/or information transmission lines 7, transmission means 8 and/or internal conductors 22 can be embodied as any kind of wired and/or wireless means for transferring energy, in particular electrical energy, and/or information, such as analogue and/or digital data, including any kind of computer software programs, interfaces, modules and/or functions, as well as communication systems, such as e.g. the Global System for Mobile Communications (GSM), DLMS/COSEM, Power-line communication (PLC), and alike.
- GSM Global System for Mobile Communications
- DLMS/COSEM DLMS/COSEM
- PLC Power-line communication
- the functions performed by the elements, units and modules of the metering system 1 may be implemented as hardware and/or software in order to be carried out by a single entity and/or multiple entities within the electricity meter 2 and/or the administration device 3.
- the electricity meter 2 and/or administration device 3 may therefore comprise at least one computer, (micro)processor or other type of processor, and at least one computer-readable medium, such as the computer readable data carrier 5, which may be embodied as any kind of internal and/or external RAM and/or ROM memory device or data storage as well as corresponding permanent or non-permanent computer and/or machine-readable media, including but not limited to e.g.
- the electricity meter 2 and/or the administration device 3 may be configured to perform any kind of measurement, computation, calculation, processing, generation, determination, decision, monitoring and/or control step as described herein.
- the at least one thermal model according to the present invention may comprise simplified thermal models and/or sophisticated thermal models as required for modelling thermal performance of the electricity meter 2 and/or of elements, parts and/or components thereof, as well as of the operating environment 100 with respective mounting structures 150, air mass 160, and/or external heat sources 170.
- the envelope boundary 200 and respective heat transfers 209, 210, 210d, 214, 216, 217, 218, 219, 220, 260, 270 may be considered for any of the elements, parts, and/or components of the electricity meter 2.
- any kind of thermal performance plots with respective phases, step changes, steady states, periods of time, as well as temperature values, gradients, and temperature curves with respective temperature increases and/or temperature decreases may be used, while any combination of the temperature curves may constitute a set of temperature curves.
- a method according to the present invention may comprise steps S1 to S14, design steps DS1 to DS12, installation steps IS1 to IS6, and/or runtime steps RS1 to RS17 as required and in any number and form desired to model thermal behaviour of the electricity meter 2, 2a, 2b, 2c as well as of the operating environment 100 in order to monitor a functional state of the electricity meter 2.
- a method according to the present invention as well as corresponding systems 1 comprising administration devices 3, computer programs 4, computer readable data carriers 5, data carrier signal is 6, energy and/or information transmission lines 7, transmission means 8, and/or electrical lines 9 may be used to monitor a functional state of any kind of electrical appliances, apparatuses, and/or devices, such as household devices, computers, transformers, generators, motors, or alike, in particular devices with a relatively large power input, throughput and/or output.
- Respective electrical appliances, apparatuses, and/or devices themselves and/or respective administration devices may be configured to carry out a method according to the present invention.
Landscapes
- Physics & Mathematics (AREA)
- General Physics & Mathematics (AREA)
- Engineering & Computer Science (AREA)
- Power Engineering (AREA)
- Remote Monitoring And Control Of Power-Distribution Networks (AREA)
- Testing Or Calibration Of Command Recording Devices (AREA)
- Testing And Monitoring For Control Systems (AREA)
Claims (16)
- Verfahren zur Überwachung eines Funktionszustandes eines Elektrizitätszählers (2), umfassend die folgenden Schritte:Erzeugen mindestens eines Temperatursignals, aus dem ein Temperatur-Istwert (T) des Elektrizitätszählers (2) abgeleitet werden kann;Bestimmen, ob der Temperatur-Istwert (T) und/oder ein Gradient (Gm) davon mindestens einen Schwellenwert (L) überschreitet,dadurch gekennzeichnet, dassder mindestens eine Schwellenwert (L) von mindestens einer vordefinierten Temperaturkurve (T300) abgeleitet wird, die vordefinierte Temperaturwerte (T) des Elektrizitätszählers (2) über die Zeit gemäss einem modellierten thermischen Verhalten des Elektrizitätszählers (2) repräsentiert, wobei die mindestens eine vordefinierte Temperaturkurve (T300) über die Zeit angepasst wird, wodurch gleitende oder rollende Schwellenwerte oder Grenzen für entsprechende Temperaturwerte und/oder Gradienten bereitgestellt werden.
- Verfahren nach Anspruch 1, dadurch gekennzeichnet, dass das Verfahren ferner den Schritt der Erzeugung eines Auslösesignals (S) umfasst, wenn der tatsächliche Temperaturwert (T) und/oder ein Gradient (Gm) davon den mindestens einen Schwellenwert (L) überschreitet.
- Verfahren nach Anspruch 1 oder 2, dadurch gekennzeichnet, dass das Verfahren ferner den Schritt des Einstellens der mindestens einen Temperaturkurve (T300) und/oder des Auswählens der Temperaturkurve (T300) aus einem Satz von vordefinierten Temperaturkurven (T300) entsprechend einem bestimmten Betriebszustand und/oder entsprechend einem bestimmten Betriebszustand des Elektrizitätszählers (2) umfasst.
- Verfahren nach einem der vorhergehenden Ansprüche, dadurch gekennzeichnet, dass das Verfahren ferner den Schritt des Identifizierens mindestens eines interessierenden Punktes in der mindestens einen Temperaturkurve (T300) umfasst, wobei sich der mindestens eine interessierende Punkt auf bestimmte Betriebsbedingungen des Stromzählers (2) bezieht.
- Verfahren nach einem der vorhergehenden Ansprüche, dadurch gekennzeichnet, dass ein elektrischer Widerstand (R) in einem primären Strompfad innerhalb des Zählers der mindestens einen vordefinierten Temperaturkurve (T300) zugeordnet und/oder aus dem aktuellen Temperaturwert (T) und/oder dessen Gradient (Gm) abgeleitet wird.
- Verfahren nach einem der vorhergehenden Ansprüche, dadurch gekennzeichnet, dass das Verfahren ferner den Schritt der Erstellung mindestens eines thermischen Modells zur Modellierung des thermischen Verhaltens des Elektrizitätszählers (2) umfasst, wobei das mindestens eine thermische Modell die mindestens eine vordefinierte Temperaturkurve (T300) umfasst.
- Verfahren nach Anspruch 6, dadurch gekennzeichnet, dass bei Identifizierung bestimmter Fehler, Trends, Muster oder Korrelationen zwischen dem tatsächlichen Temperaturwert (T) und/oder dessen Gradienten (Gm) und der mindestens einen vordefinierten Temperaturkurve (T300) mindestens ein Parameter des thermischen Modells durch maschinelles Lernen automatisch angepasst wird.
- Verfahren nach Anspruch 6 oder 7, dadurch gekennzeichnet, dass der Schritt des Aufstellens des mindestens einen thermischen Modells den Schritt des Definierens mindestens eines Gleichgewichtszustandes (Q302, Q303) umfasst, den der Elektrizitätszähler (2) im Betrieb einnimmt, wobei der mindestens eine Gleichgewichtszustand (Q302, Q303) ein thermisches Gleichgewicht des Elektrizitätszählers (2) in Abhängigkeit von mindestens einer den Elektrizitätszähler (2) durchlaufenden elektrischen Last (A) und von in einer Umgebung (100) des Elektrizitätszählers (2) herrschenden Umweltbedingungen darstellt.
- Verfahren nach einem der Ansprüche 6 bis 8, dadurch gekennzeichnet, dass der Schritt des Erstellens des mindestens einen thermischen Modells den Schritt des Definierens mindestens eines Heizverhaltens und/oder mindestens eines Kühlverhaltens des Elektrizitätszählers (2) auf der Grundlage mindestens einer funktionalen Sprungantwort (C) des Elektrizitätszählers (2) auf eine Änderung eines Funktionszustandes und/oder Betriebszustandes des Elektrizitätszählers (2) einschliesst.
- Verfahren nach einem der Ansprüche 6 bis 9, dadurch gekennzeichnet, dass der Schritt des Erstellens des thermischen Modells den Schritt des Bestimmens mindestens eines thermischen Widerstandswerts (Rth) und/oder den Schritt des Bestimmens mindestens eines thermischen Kapazitätswerts (Cth) des Elektrizitätszählers (2) umfasst.
- Verfahren nach einem der Ansprüche 6 bis 10, dadurch gekennzeichnet, dass der Schritt des Erstellens mindestens eines thermischen Modells für mindestens zwei verschiedene Arten von Betriebsbedingungen des Elektrizitätszählers (2) und/oder mindestens zwei verschiedene Arten von Elektrizitätszählern (2) durchgeführt wird.
- Computerprogramm (4) zur Überwachung eines Funktionszustandes eines Elektrizitätszählers, umfassend Anweisungen, die bei Ausführung des Computerprogramms (4) durch einen Elektrizitätszähler (2) und/oder eine Verwaltungseinrichtung (3) in einem Elektrizitätsmesssystem (1) den Elektrizitätszähler (2) und/oder die Verwaltungseinrichtung (3) veranlassen, die Schritte eines Verfahrens nach einem der Ansprüche 1 bis 11 auszuführen.
- Computerlesbarer Datenträger (7), auf dem das Computerprogramm (4) nach Anspruch 12 gespeichert ist.
- Ein Datenträgersignal (5), das das Computerprogramm nach Anspruch 12 trägt.
- Ein Elektrizitätszähler (2), der eine Verarbeitungseinheit (18) und einen Temperatursensor (21) umfasst, wobei der Elektrizitätszähler (2) konfiguriert ist, dass das Verfahren nach einem der Ansprüche 1 bis 11 auszuführen.
- Elektrizitätsmesssystem (1), insbesondere Advanced Metering Infrastructure (AMI), umfassend mindestens einen Elektrizitätszähler (2) nach Anspruch 15 und/oder mindestens eine Verwaltungseinrichtung (3), die zur Durchführung des Verfahrens nach einem der Ansprüche 1 bis 11 konfiguriert ist.
Priority Applications (8)
| Application Number | Priority Date | Filing Date | Title |
|---|---|---|---|
| EP18194512.2A EP3623782B1 (de) | 2018-09-14 | 2018-09-14 | Überwachung der thermischen leistung eines stromzählers |
| PCT/EP2019/073811 WO2020053085A1 (en) | 2018-09-14 | 2019-09-06 | Electricity meter thermal performance monitoring |
| BR112021004438-8A BR112021004438A2 (pt) | 2018-09-14 | 2019-09-06 | método de monitoramento de um estado funcional de um medidor de eletricidade, portadora de dados legível por computador, sinal da portadora de dados, medidor de eletricidade e sistema de medição de eletricidade |
| SG11202102211RA SG11202102211RA (en) | 2018-09-14 | 2019-09-06 | Electricity meter thermal performance monitoring |
| CN201980059956.XA CN112703380A (zh) | 2018-09-14 | 2019-09-06 | 电仪表热性能监测 |
| AU2019338643A AU2019338643A1 (en) | 2018-09-14 | 2019-09-06 | Electricity meter thermal performance monitoring |
| US17/273,367 US11644492B2 (en) | 2018-09-14 | 2019-09-06 | Electricity meter thermal performance monitoring |
| ZA2021/01923A ZA202101923B (en) | 2018-09-14 | 2021-03-23 | Electricity meter thermal performance monitoring |
Applications Claiming Priority (1)
| Application Number | Priority Date | Filing Date | Title |
|---|---|---|---|
| EP18194512.2A EP3623782B1 (de) | 2018-09-14 | 2018-09-14 | Überwachung der thermischen leistung eines stromzählers |
Publications (2)
| Publication Number | Publication Date |
|---|---|
| EP3623782A1 EP3623782A1 (de) | 2020-03-18 |
| EP3623782B1 true EP3623782B1 (de) | 2021-11-10 |
Family
ID=63592599
Family Applications (1)
| Application Number | Title | Priority Date | Filing Date |
|---|---|---|---|
| EP18194512.2A Active EP3623782B1 (de) | 2018-09-14 | 2018-09-14 | Überwachung der thermischen leistung eines stromzählers |
Country Status (8)
| Country | Link |
|---|---|
| US (1) | US11644492B2 (de) |
| EP (1) | EP3623782B1 (de) |
| CN (1) | CN112703380A (de) |
| AU (1) | AU2019338643A1 (de) |
| BR (1) | BR112021004438A2 (de) |
| SG (1) | SG11202102211RA (de) |
| WO (1) | WO2020053085A1 (de) |
| ZA (1) | ZA202101923B (de) |
Families Citing this family (3)
| Publication number | Priority date | Publication date | Assignee | Title |
|---|---|---|---|---|
| FR3101154B1 (fr) * | 2019-09-25 | 2021-08-20 | Schneider Electric Ind Sas | Système de surveillance des décharges partielles dans un appareillage électrique via les émissions gazeuses |
| CA3121378A1 (en) | 2020-06-09 | 2021-12-09 | Sensus Spectrum, Llc | System for detecting temperature and current events in a power grid and related methods |
| CN116930819B (zh) * | 2023-09-18 | 2023-12-08 | 云南电网有限责任公司 | 基于热成像的电流端子排温度在线监测方法及系统 |
Citations (1)
| Publication number | Priority date | Publication date | Assignee | Title |
|---|---|---|---|---|
| US20080094231A1 (en) * | 2005-02-02 | 2008-04-24 | Siemens Aktiengesellschaft | Monitoring the Bearing Temperature of an Electrical Machine |
Family Cites Families (25)
| Publication number | Priority date | Publication date | Assignee | Title |
|---|---|---|---|---|
| WO2002010693A1 (fr) * | 2000-07-31 | 2002-02-07 | Mitsui Mining & Smelting Co., Ltd. | Procede de mesure de debit et debitmetre |
| US6847300B2 (en) | 2001-02-02 | 2005-01-25 | Motorola, Inc. | Electric power meter including a temperature sensor and controller |
| DE10224354C1 (de) * | 2002-05-29 | 2003-10-02 | Siemens Metering Ag Zug | Schaltungsanordnung und Verfahren zur Kompensation von Änderungen eines Übertragungsfaktors einer Magnetfeldsensoranordnung |
| DE102004015044B4 (de) * | 2004-03-26 | 2012-04-26 | Daimler Ag | Verfahren und Vorrichtung zur Ermittlung des Vorhandenseins eines vorgeschriebenen Wärmetauschers |
| US7318004B2 (en) * | 2005-04-01 | 2008-01-08 | Cardinal Health 303, Inc. | Temperature prediction system and method |
| US7802917B2 (en) * | 2005-08-05 | 2010-09-28 | Lam Research Corporation | Method and apparatus for chuck thermal calibration |
| US7925389B2 (en) * | 2006-06-15 | 2011-04-12 | International Business Machines Corporation | Method of detecting recirculation of heated air within a rack enclosure |
| DE102007013729A1 (de) | 2007-03-22 | 2008-09-25 | EMH Elektrizitätszähler GmbH & Co. KG | Elektronischer Elektrizitätszähler |
| US7716012B2 (en) | 2008-02-13 | 2010-05-11 | Bickel Jon A | Method for process monitoring in a utility system |
| DE102008039334B4 (de) * | 2008-08-22 | 2016-01-14 | Airbus Defence and Space GmbH | Verfahren und Vorrichtung zum optimierten Energiemanagement |
| CN102192845B (zh) * | 2010-03-18 | 2014-04-16 | 施耐德东芝换流器欧洲公司 | 散热系统诊断方法 |
| AU2011101045B4 (en) | 2011-07-08 | 2012-04-12 | Landis & Gyr Pty Ltd | Method and apparatus for monitoring a condition of a meter |
| US8981697B2 (en) * | 2011-10-07 | 2015-03-17 | Schweitzer Engineering Laboratories, Inc. | Asset condition monitoring in an electric motor |
| US10013725B2 (en) * | 2012-04-02 | 2018-07-03 | Carrier Corporation | Architecture for energy management of multi customer multi time zone distributed facilities |
| EP2701478A1 (de) * | 2012-08-20 | 2014-02-26 | Siemens Aktiengesellschaft | Baugruppe für ein modulares Automatisierungsgerät |
| DE102013100686B3 (de) * | 2013-01-24 | 2014-05-15 | Netzsch - Gerätebau Gesellschaft mit beschränkter Haftung | Verfahren zur Durchführung einer Differenz-Thermo-Analyse |
| US8854217B2 (en) * | 2013-02-13 | 2014-10-07 | Sensus Spectrum Llc | Method and apparatus for operating an electricity meter |
| CN103323703B (zh) * | 2013-05-30 | 2015-07-15 | 武汉大学 | 一种电缆接头故障诊断方法 |
| US9651929B2 (en) * | 2014-09-29 | 2017-05-16 | International Business Machines Corporation | HVAC system control integrated with demand response, on-site energy storage system and on-site energy generation system |
| ES2698534T3 (es) | 2014-10-27 | 2019-02-05 | Landis & Gyr Ag | Procedimiento, sistema y conjunto para determinar una reducción de la vida útil de servicio restante de un dispositivo eléctrico durante un período de tiempo específico de operación del dispositivo eléctrico |
| US9903737B2 (en) * | 2016-06-15 | 2018-02-27 | Honeywell International Inc. | Multi-tenant customer portal |
| US20180003572A1 (en) * | 2016-07-01 | 2018-01-04 | Exotag Inc. | Sensor-Based Systems and Methods for Monitoring Temperature Sensitive Products |
| EP3299783B1 (de) * | 2016-09-23 | 2020-11-04 | ABB Power Grids Switzerland AG | Thermische überwachung einer leistungsvorrichtung |
| CN107342576A (zh) * | 2017-06-05 | 2017-11-10 | 江苏尚坤电力安装有限公司 | 一种高压开关柜在线监测与预警保护方法及其系统 |
| KR102200550B1 (ko) * | 2017-10-10 | 2021-01-07 | 주식회사 엘지화학 | 이차 전지의 충전 상태를 추정하기 위한 장치 |
-
2018
- 2018-09-14 EP EP18194512.2A patent/EP3623782B1/de active Active
-
2019
- 2019-09-06 CN CN201980059956.XA patent/CN112703380A/zh active Pending
- 2019-09-06 SG SG11202102211RA patent/SG11202102211RA/en unknown
- 2019-09-06 AU AU2019338643A patent/AU2019338643A1/en active Pending
- 2019-09-06 BR BR112021004438-8A patent/BR112021004438A2/pt unknown
- 2019-09-06 WO PCT/EP2019/073811 patent/WO2020053085A1/en active Application Filing
- 2019-09-06 US US17/273,367 patent/US11644492B2/en active Active
-
2021
- 2021-03-23 ZA ZA2021/01923A patent/ZA202101923B/en unknown
Patent Citations (1)
| Publication number | Priority date | Publication date | Assignee | Title |
|---|---|---|---|---|
| US20080094231A1 (en) * | 2005-02-02 | 2008-04-24 | Siemens Aktiengesellschaft | Monitoring the Bearing Temperature of an Electrical Machine |
Also Published As
| Publication number | Publication date |
|---|---|
| ZA202101923B (en) | 2022-08-31 |
| EP3623782A1 (de) | 2020-03-18 |
| BR112021004438A2 (pt) | 2021-05-25 |
| US20210341520A1 (en) | 2021-11-04 |
| SG11202102211RA (en) | 2021-04-29 |
| CN112703380A (zh) | 2021-04-23 |
| AU2019338643A1 (en) | 2021-04-29 |
| US11644492B2 (en) | 2023-05-09 |
| WO2020053085A1 (en) | 2020-03-19 |
Similar Documents
| Publication | Publication Date | Title |
|---|---|---|
| US10527704B2 (en) | Detection of deteriorated electrical connections in a meter using adjusted temperature sensing | |
| US11644492B2 (en) | Electricity meter thermal performance monitoring | |
| US20230254697A1 (en) | Communication enabled circuit breakers | |
| CN108351376B (zh) | 电熔丝电流感测系统和监视方法 | |
| US10788542B2 (en) | Detection of deteriorated electrical connections in a meter using temperature sensing and time variable thresholds | |
| RU2532417C2 (ru) | Контроль температуры для шинной распределительной системы | |
| US11085955B2 (en) | Energy metering system with temperature monitoring based on circuit breakers of power panel likely to trip | |
| WO2017155785A1 (en) | Systems and methods for testing ground fault circuit interrupter breakers | |
| CN110753955A (zh) | 具有集成状态监测的电源连接器 | |
| US10466277B1 (en) | Scaled and precise power conductor and current monitoring | |
| CN110411894B (zh) | 一种气体密度监测系统 | |
| JP2021083293A (ja) | 異常検知システム、分電盤システム、異常検知方法及びプログラム | |
| Gates et al. | Survey of electronic environmental controllers. | |
| JP7394372B2 (ja) | 監視システム、監視方法、プログラム及び分電盤 | |
| KR102579966B1 (ko) | Ai에 기반한 모니터링 기능이 내장된 전력기기 | |
| US20230120453A1 (en) | Integrated home energy management, home monitoring, and automated fault mitigation | |
| Solheim et al. | Geomagnetically induced currents in a Norwegian transformer station | |
| CN117930071A (zh) | 熔断器故障预测方法、装置和储能系统 | |
| Sandberg et al. | Electrical heat tracing: international harmonization-now and in the future | |
| JP2020195244A (ja) | 監視システム、監視方法、プログラム及び分電盤 | |
| CN116137395A (zh) | 接触细长dc配电母线的电力连接器及监测连接的方法 | |
| CA3206962A1 (en) | Device for the measurement of power in electrical protection panels in buildings, by means of temperature measurement |
Legal Events
| Date | Code | Title | Description |
|---|---|---|---|
| PUAI | Public reference made under article 153(3) epc to a published international application that has entered the european phase |
Free format text: ORIGINAL CODE: 0009012 |
|
| STAA | Information on the status of an ep patent application or granted ep patent |
Free format text: STATUS: THE APPLICATION HAS BEEN PUBLISHED |
|
| AK | Designated contracting states |
Kind code of ref document: A1 Designated state(s): AL AT BE BG CH CY CZ DE DK EE ES FI FR GB GR HR HU IE IS IT LI LT LU LV MC MK MT NL NO PL PT RO RS SE SI SK SM TR |
|
| AX | Request for extension of the european patent |
Extension state: BA ME |
|
| STAA | Information on the status of an ep patent application or granted ep patent |
Free format text: STATUS: REQUEST FOR EXAMINATION WAS MADE |
|
| 17P | Request for examination filed |
Effective date: 20200916 |
|
| RBV | Designated contracting states (corrected) |
Designated state(s): AL AT BE BG CH CY CZ DE DK EE ES FI FR GB GR HR HU IE IS IT LI LT LU LV MC MK MT NL NO PL PT RO RS SE SI SK SM TR |
|
| STAA | Information on the status of an ep patent application or granted ep patent |
Free format text: STATUS: EXAMINATION IS IN PROGRESS |
|
| STAA | Information on the status of an ep patent application or granted ep patent |
Free format text: STATUS: EXAMINATION IS IN PROGRESS |
|
| REG | Reference to a national code |
Ref country code: HK Ref legal event code: DE Ref document number: 40026454 Country of ref document: HK |
|
| 17Q | First examination report despatched |
Effective date: 20201214 |
|
| RAP1 | Party data changed (applicant data changed or rights of an application transferred) |
Owner name: LANDIS+GYR AG |
|
| GRAP | Despatch of communication of intention to grant a patent |
Free format text: ORIGINAL CODE: EPIDOSNIGR1 |
|
| STAA | Information on the status of an ep patent application or granted ep patent |
Free format text: STATUS: GRANT OF PATENT IS INTENDED |
|
| INTG | Intention to grant announced |
Effective date: 20210614 |
|
| GRAS | Grant fee paid |
Free format text: ORIGINAL CODE: EPIDOSNIGR3 |
|
| GRAA | (expected) grant |
Free format text: ORIGINAL CODE: 0009210 |
|
| STAA | Information on the status of an ep patent application or granted ep patent |
Free format text: STATUS: THE PATENT HAS BEEN GRANTED |
|
| AK | Designated contracting states |
Kind code of ref document: B1 Designated state(s): AL AT BE BG CH CY CZ DE DK EE ES FI FR GB GR HR HU IE IS IT LI LT LU LV MC MK MT NL NO PL PT RO RS SE SI SK SM TR |
|
| REG | Reference to a national code |
Ref country code: GB Ref legal event code: FG4D |
|
| REG | Reference to a national code |
Ref country code: AT Ref legal event code: REF Ref document number: 1446506 Country of ref document: AT Kind code of ref document: T Effective date: 20211115 Ref country code: CH Ref legal event code: EP |
|
| REG | Reference to a national code |
Ref country code: DE Ref legal event code: R096 Ref document number: 602018026368 Country of ref document: DE |
|
| REG | Reference to a national code |
Ref country code: IE Ref legal event code: FG4D |
|
| REG | Reference to a national code |
Ref country code: FI Ref legal event code: FGE |
|
| REG | Reference to a national code |
Ref country code: NL Ref legal event code: FP |
|
| REG | Reference to a national code |
Ref country code: SE Ref legal event code: TRGR |
|
| REG | Reference to a national code |
Ref country code: LT Ref legal event code: MG9D |
|
| REG | Reference to a national code |
Ref country code: AT Ref legal event code: MK05 Ref document number: 1446506 Country of ref document: AT Kind code of ref document: T Effective date: 20211110 |
|
| PG25 | Lapsed in a contracting state [announced via postgrant information from national office to epo] |
Ref country code: RS Free format text: LAPSE BECAUSE OF FAILURE TO SUBMIT A TRANSLATION OF THE DESCRIPTION OR TO PAY THE FEE WITHIN THE PRESCRIBED TIME-LIMIT Effective date: 20211110 Ref country code: LT Free format text: LAPSE BECAUSE OF FAILURE TO SUBMIT A TRANSLATION OF THE DESCRIPTION OR TO PAY THE FEE WITHIN THE PRESCRIBED TIME-LIMIT Effective date: 20211110 Ref country code: BG Free format text: LAPSE BECAUSE OF FAILURE TO SUBMIT A TRANSLATION OF THE DESCRIPTION OR TO PAY THE FEE WITHIN THE PRESCRIBED TIME-LIMIT Effective date: 20220210 Ref country code: AT Free format text: LAPSE BECAUSE OF FAILURE TO SUBMIT A TRANSLATION OF THE DESCRIPTION OR TO PAY THE FEE WITHIN THE PRESCRIBED TIME-LIMIT Effective date: 20211110 |
|
| PG25 | Lapsed in a contracting state [announced via postgrant information from national office to epo] |
Ref country code: IS Free format text: LAPSE BECAUSE OF FAILURE TO SUBMIT A TRANSLATION OF THE DESCRIPTION OR TO PAY THE FEE WITHIN THE PRESCRIBED TIME-LIMIT Effective date: 20220310 Ref country code: PT Free format text: LAPSE BECAUSE OF FAILURE TO SUBMIT A TRANSLATION OF THE DESCRIPTION OR TO PAY THE FEE WITHIN THE PRESCRIBED TIME-LIMIT Effective date: 20220310 Ref country code: PL Free format text: LAPSE BECAUSE OF FAILURE TO SUBMIT A TRANSLATION OF THE DESCRIPTION OR TO PAY THE FEE WITHIN THE PRESCRIBED TIME-LIMIT Effective date: 20211110 Ref country code: NO Free format text: LAPSE BECAUSE OF FAILURE TO SUBMIT A TRANSLATION OF THE DESCRIPTION OR TO PAY THE FEE WITHIN THE PRESCRIBED TIME-LIMIT Effective date: 20220210 Ref country code: LV Free format text: LAPSE BECAUSE OF FAILURE TO SUBMIT A TRANSLATION OF THE DESCRIPTION OR TO PAY THE FEE WITHIN THE PRESCRIBED TIME-LIMIT Effective date: 20211110 Ref country code: HR Free format text: LAPSE BECAUSE OF FAILURE TO SUBMIT A TRANSLATION OF THE DESCRIPTION OR TO PAY THE FEE WITHIN THE PRESCRIBED TIME-LIMIT Effective date: 20211110 Ref country code: GR Free format text: LAPSE BECAUSE OF FAILURE TO SUBMIT A TRANSLATION OF THE DESCRIPTION OR TO PAY THE FEE WITHIN THE PRESCRIBED TIME-LIMIT Effective date: 20220211 Ref country code: ES Free format text: LAPSE BECAUSE OF FAILURE TO SUBMIT A TRANSLATION OF THE DESCRIPTION OR TO PAY THE FEE WITHIN THE PRESCRIBED TIME-LIMIT Effective date: 20211110 |
|
| PG25 | Lapsed in a contracting state [announced via postgrant information from national office to epo] |
Ref country code: SM Free format text: LAPSE BECAUSE OF FAILURE TO SUBMIT A TRANSLATION OF THE DESCRIPTION OR TO PAY THE FEE WITHIN THE PRESCRIBED TIME-LIMIT Effective date: 20211110 Ref country code: SK Free format text: LAPSE BECAUSE OF FAILURE TO SUBMIT A TRANSLATION OF THE DESCRIPTION OR TO PAY THE FEE WITHIN THE PRESCRIBED TIME-LIMIT Effective date: 20211110 Ref country code: RO Free format text: LAPSE BECAUSE OF FAILURE TO SUBMIT A TRANSLATION OF THE DESCRIPTION OR TO PAY THE FEE WITHIN THE PRESCRIBED TIME-LIMIT Effective date: 20211110 Ref country code: EE Free format text: LAPSE BECAUSE OF FAILURE TO SUBMIT A TRANSLATION OF THE DESCRIPTION OR TO PAY THE FEE WITHIN THE PRESCRIBED TIME-LIMIT Effective date: 20211110 Ref country code: DK Free format text: LAPSE BECAUSE OF FAILURE TO SUBMIT A TRANSLATION OF THE DESCRIPTION OR TO PAY THE FEE WITHIN THE PRESCRIBED TIME-LIMIT Effective date: 20211110 Ref country code: CZ Free format text: LAPSE BECAUSE OF FAILURE TO SUBMIT A TRANSLATION OF THE DESCRIPTION OR TO PAY THE FEE WITHIN THE PRESCRIBED TIME-LIMIT Effective date: 20211110 |
|
| REG | Reference to a national code |
Ref country code: DE Ref legal event code: R097 Ref document number: 602018026368 Country of ref document: DE |
|
| PLBE | No opposition filed within time limit |
Free format text: ORIGINAL CODE: 0009261 |
|
| STAA | Information on the status of an ep patent application or granted ep patent |
Free format text: STATUS: NO OPPOSITION FILED WITHIN TIME LIMIT |
|
| 26N | No opposition filed |
Effective date: 20220811 |
|
| REG | Reference to a national code |
Ref country code: DE Ref legal event code: R082 Ref document number: 602018026368 Country of ref document: DE Representative=s name: PROCK, THOMAS, DR., GB Ref country code: DE Ref legal event code: R082 Ref document number: 602018026368 Country of ref document: DE |
|
| PG25 | Lapsed in a contracting state [announced via postgrant information from national office to epo] |
Ref country code: AL Free format text: LAPSE BECAUSE OF FAILURE TO SUBMIT A TRANSLATION OF THE DESCRIPTION OR TO PAY THE FEE WITHIN THE PRESCRIBED TIME-LIMIT Effective date: 20211110 |
|
| REG | Reference to a national code |
Ref country code: DE Ref legal event code: R082 Ref document number: 602018026368 Country of ref document: DE Representative=s name: PROCK, THOMAS, DR., GB |
|
| PG25 | Lapsed in a contracting state [announced via postgrant information from national office to epo] |
Ref country code: SI Free format text: LAPSE BECAUSE OF FAILURE TO SUBMIT A TRANSLATION OF THE DESCRIPTION OR TO PAY THE FEE WITHIN THE PRESCRIBED TIME-LIMIT Effective date: 20211110 |
|
| REG | Reference to a national code |
Ref country code: DE Ref legal event code: R082 Ref document number: 602018026368 Country of ref document: DE |
|
| PG25 | Lapsed in a contracting state [announced via postgrant information from national office to epo] |
Ref country code: MC Free format text: LAPSE BECAUSE OF FAILURE TO SUBMIT A TRANSLATION OF THE DESCRIPTION OR TO PAY THE FEE WITHIN THE PRESCRIBED TIME-LIMIT Effective date: 20211110 |
|
| PG25 | Lapsed in a contracting state [announced via postgrant information from national office to epo] |
Ref country code: IT Free format text: LAPSE BECAUSE OF FAILURE TO SUBMIT A TRANSLATION OF THE DESCRIPTION OR TO PAY THE FEE WITHIN THE PRESCRIBED TIME-LIMIT Effective date: 20211110 |
|
| P01 | Opt-out of the competence of the unified patent court (upc) registered |
Effective date: 20230517 |
|
| PG25 | Lapsed in a contracting state [announced via postgrant information from national office to epo] |
Ref country code: LU Free format text: LAPSE BECAUSE OF NON-PAYMENT OF DUE FEES Effective date: 20220914 |
|
| PGFP | Annual fee paid to national office [announced via postgrant information from national office to epo] |
Ref country code: NL Payment date: 20230920 Year of fee payment: 6 Ref country code: IE Payment date: 20230920 Year of fee payment: 6 Ref country code: GB Payment date: 20230920 Year of fee payment: 6 Ref country code: FI Payment date: 20230920 Year of fee payment: 6 |
|
| PGFP | Annual fee paid to national office [announced via postgrant information from national office to epo] |
Ref country code: SE Payment date: 20230920 Year of fee payment: 6 Ref country code: FR Payment date: 20230928 Year of fee payment: 6 Ref country code: DE Payment date: 20230920 Year of fee payment: 6 Ref country code: BE Payment date: 20230920 Year of fee payment: 6 |
|
| PGFP | Annual fee paid to national office [announced via postgrant information from national office to epo] |
Ref country code: CH Payment date: 20231001 Year of fee payment: 6 |
|
| PG25 | Lapsed in a contracting state [announced via postgrant information from national office to epo] |
Ref country code: HU Free format text: LAPSE BECAUSE OF FAILURE TO SUBMIT A TRANSLATION OF THE DESCRIPTION OR TO PAY THE FEE WITHIN THE PRESCRIBED TIME-LIMIT; INVALID AB INITIO Effective date: 20180914 |
|
| PG25 | Lapsed in a contracting state [announced via postgrant information from national office to epo] |
Ref country code: CY Free format text: LAPSE BECAUSE OF FAILURE TO SUBMIT A TRANSLATION OF THE DESCRIPTION OR TO PAY THE FEE WITHIN THE PRESCRIBED TIME-LIMIT Effective date: 20211110 |