EP3561078A1 - Method to use gene expression to determine likelihood of clinical outcome of renal cancer - Google Patents
Method to use gene expression to determine likelihood of clinical outcome of renal cancer Download PDFInfo
- Publication number
- EP3561078A1 EP3561078A1 EP19173150.4A EP19173150A EP3561078A1 EP 3561078 A1 EP3561078 A1 EP 3561078A1 EP 19173150 A EP19173150 A EP 19173150A EP 3561078 A1 EP3561078 A1 EP 3561078A1
- Authority
- EP
- European Patent Office
- Prior art keywords
- expression
- gene
- expression level
- genes
- tumor
- Prior art date
- Legal status (The legal status is an assumption and is not a legal conclusion. Google has not performed a legal analysis and makes no representation as to the accuracy of the status listed.)
- Withdrawn
Links
Images


Classifications
-
- C—CHEMISTRY; METALLURGY
- C12—BIOCHEMISTRY; BEER; SPIRITS; WINE; VINEGAR; MICROBIOLOGY; ENZYMOLOGY; MUTATION OR GENETIC ENGINEERING
- C12Q—MEASURING OR TESTING PROCESSES INVOLVING ENZYMES, NUCLEIC ACIDS OR MICROORGANISMS; COMPOSITIONS OR TEST PAPERS THEREFOR; PROCESSES OF PREPARING SUCH COMPOSITIONS; CONDITION-RESPONSIVE CONTROL IN MICROBIOLOGICAL OR ENZYMOLOGICAL PROCESSES
- C12Q1/00—Measuring or testing processes involving enzymes, nucleic acids or microorganisms; Compositions therefor; Processes of preparing such compositions
- C12Q1/68—Measuring or testing processes involving enzymes, nucleic acids or microorganisms; Compositions therefor; Processes of preparing such compositions involving nucleic acids
- C12Q1/6876—Nucleic acid products used in the analysis of nucleic acids, e.g. primers or probes
- C12Q1/6883—Nucleic acid products used in the analysis of nucleic acids, e.g. primers or probes for diseases caused by alterations of genetic material
- C12Q1/6886—Nucleic acid products used in the analysis of nucleic acids, e.g. primers or probes for diseases caused by alterations of genetic material for cancer
-
- G—PHYSICS
- G01—MEASURING; TESTING
- G01N—INVESTIGATING OR ANALYSING MATERIALS BY DETERMINING THEIR CHEMICAL OR PHYSICAL PROPERTIES
- G01N33/00—Investigating or analysing materials by specific methods not covered by groups G01N1/00 - G01N31/00
- G01N33/48—Biological material, e.g. blood, urine; Haemocytometers
- G01N33/50—Chemical analysis of biological material, e.g. blood, urine; Testing involving biospecific ligand binding methods; Immunological testing
- G01N33/53—Immunoassay; Biospecific binding assay; Materials therefor
- G01N33/574—Immunoassay; Biospecific binding assay; Materials therefor for cancer
- G01N33/57407—Specifically defined cancers
- G01N33/57438—Specifically defined cancers of liver, pancreas or kidney
-
- G—PHYSICS
- G06—COMPUTING; CALCULATING OR COUNTING
- G06N—COMPUTING ARRANGEMENTS BASED ON SPECIFIC COMPUTATIONAL MODELS
- G06N7/00—Computing arrangements based on specific mathematical models
- G06N7/01—Probabilistic graphical models, e.g. probabilistic networks
-
- G—PHYSICS
- G16—INFORMATION AND COMMUNICATION TECHNOLOGY [ICT] SPECIALLY ADAPTED FOR SPECIFIC APPLICATION FIELDS
- G16B—BIOINFORMATICS, i.e. INFORMATION AND COMMUNICATION TECHNOLOGY [ICT] SPECIALLY ADAPTED FOR GENETIC OR PROTEIN-RELATED DATA PROCESSING IN COMPUTATIONAL MOLECULAR BIOLOGY
- G16B25/00—ICT specially adapted for hybridisation; ICT specially adapted for gene or protein expression
- G16B25/10—Gene or protein expression profiling; Expression-ratio estimation or normalisation
-
- G—PHYSICS
- G16—INFORMATION AND COMMUNICATION TECHNOLOGY [ICT] SPECIALLY ADAPTED FOR SPECIFIC APPLICATION FIELDS
- G16B—BIOINFORMATICS, i.e. INFORMATION AND COMMUNICATION TECHNOLOGY [ICT] SPECIALLY ADAPTED FOR GENETIC OR PROTEIN-RELATED DATA PROCESSING IN COMPUTATIONAL MOLECULAR BIOLOGY
- G16B99/00—Subject matter not provided for in other groups of this subclass
-
- G—PHYSICS
- G16—INFORMATION AND COMMUNICATION TECHNOLOGY [ICT] SPECIALLY ADAPTED FOR SPECIFIC APPLICATION FIELDS
- G16H—HEALTHCARE INFORMATICS, i.e. INFORMATION AND COMMUNICATION TECHNOLOGY [ICT] SPECIALLY ADAPTED FOR THE HANDLING OR PROCESSING OF MEDICAL OR HEALTHCARE DATA
- G16H50/00—ICT specially adapted for medical diagnosis, medical simulation or medical data mining; ICT specially adapted for detecting, monitoring or modelling epidemics or pandemics
- G16H50/20—ICT specially adapted for medical diagnosis, medical simulation or medical data mining; ICT specially adapted for detecting, monitoring or modelling epidemics or pandemics for computer-aided diagnosis, e.g. based on medical expert systems
-
- C—CHEMISTRY; METALLURGY
- C12—BIOCHEMISTRY; BEER; SPIRITS; WINE; VINEGAR; MICROBIOLOGY; ENZYMOLOGY; MUTATION OR GENETIC ENGINEERING
- C12Q—MEASURING OR TESTING PROCESSES INVOLVING ENZYMES, NUCLEIC ACIDS OR MICROORGANISMS; COMPOSITIONS OR TEST PAPERS THEREFOR; PROCESSES OF PREPARING SUCH COMPOSITIONS; CONDITION-RESPONSIVE CONTROL IN MICROBIOLOGICAL OR ENZYMOLOGICAL PROCESSES
- C12Q2600/00—Oligonucleotides characterized by their use
- C12Q2600/112—Disease subtyping, staging or classification
-
- C—CHEMISTRY; METALLURGY
- C12—BIOCHEMISTRY; BEER; SPIRITS; WINE; VINEGAR; MICROBIOLOGY; ENZYMOLOGY; MUTATION OR GENETIC ENGINEERING
- C12Q—MEASURING OR TESTING PROCESSES INVOLVING ENZYMES, NUCLEIC ACIDS OR MICROORGANISMS; COMPOSITIONS OR TEST PAPERS THEREFOR; PROCESSES OF PREPARING SUCH COMPOSITIONS; CONDITION-RESPONSIVE CONTROL IN MICROBIOLOGICAL OR ENZYMOLOGICAL PROCESSES
- C12Q2600/00—Oligonucleotides characterized by their use
- C12Q2600/118—Prognosis of disease development
-
- C—CHEMISTRY; METALLURGY
- C12—BIOCHEMISTRY; BEER; SPIRITS; WINE; VINEGAR; MICROBIOLOGY; ENZYMOLOGY; MUTATION OR GENETIC ENGINEERING
- C12Q—MEASURING OR TESTING PROCESSES INVOLVING ENZYMES, NUCLEIC ACIDS OR MICROORGANISMS; COMPOSITIONS OR TEST PAPERS THEREFOR; PROCESSES OF PREPARING SUCH COMPOSITIONS; CONDITION-RESPONSIVE CONTROL IN MICROBIOLOGICAL OR ENZYMOLOGICAL PROCESSES
- C12Q2600/00—Oligonucleotides characterized by their use
- C12Q2600/158—Expression markers
Definitions
- the present disclosure relates to molecular diagnostic assays that provide information concerning prognosis in renal cancer patients.
- Renal cell carcinoma represents about 3 percent of all cancers in the United States. Predictions for the United States for the year 2007 were that 40,000 new patients would be diagnosed with RCC and that 13,000 would die from this disease.
- Surgical resection is the most common treatment for this disease as systemic therapy has demonstrated only limited effectiveness. However, approximately 30% of patients with localized tumors will experience a relapse following surgery, and only 40% of all patients with renal cell carcinoma survive for 5 years.
- the present disclosure provides biomarkers, the expression of which has prognostic value in renal cancer.
- tumor is used herein to refer to all neoplastic cell growth and proliferation, and all pre-cancerous and cancerous cells and tissues.
- primary tumor is used herein to refer to a tumor that is at the original site where it first arose.
- a primary renal cell carcinoma tumor is one that arose in the kidney.
- metal tumor is used herein to refer to a tumor that develops away from the site of origin.
- renal cell carcinoma metastasis most commonly affects the spine, ribs, pelvis, and proximal long bones.
- cancer and “carcinoma” refer to or describe the physiological condition in mammals that is typically characterized by unregulated cell growth.
- the pathology of cancer includes, for example, abnormal or uncontrollable cell growth, metastasis, interference with the normal functioning of neighboring cells, release of cytokines or other secretory products at abnormal levels, suppression or aggravation of inflammatory or immunological response, neoplasia, premalignancy, malignancy, invasion of surrounding or distant tissues or organs, such as lymph nodes, blood vessels, etc.
- renal cancer or "renal cell carcinoma” refer to cancer that has arisen from the kidney.
- renal cell cancer or "renal cell carcinoma” (RCC), as used herein, refer to cancer which originates in the lining of the proximal convoluted tubule. More specifically, RCC encompasses several relatively common histologic subtypes: clear cell renal cell carcinoma, papillary (chromophil), chromophobe, collecting duct carcinoma, and medullary carcinoma. Further information about renal cell carcinoma may be found in Y. Thyavihally, et al., Int Semin Surg Oncol 2:18 (2005 ), the contents of which are incorporated by reference herein. Clear cell renal cell carcinoma (ccRCC) is the most common subtype of RCC. Incidence of ccRCC is increasing, comprising 80% of localized disease and more than 90% of metastatic disease.
- the staging system for renal cell carcinoma is based on the degree of tumor spread beyond the kidney. According to the tumor, node, metastasis (TNM) staging system of the American Joint Committee on Cancer (AJCC) ( Greene, et al., AJCC Cancer Staging Manual,pp. 323-325 (6th Ed. 2002 ), the various stages of renal cell carcinoma are provided below.
- "Increased stage” as used herein refers to classification of a tumor at a stage that is more advanced, e.g., Stage 4 is an increased stage relative to Stages 1, 2, and 3.
- T1 Tumor 7 cm or less in greatest dimension and limited to the kidney
- T1b Tumor 4 cm or less in greatest dimension and limited to the kidney
- T2 Tumor larger than 7 cm in greatest dimension and limited to the kidney
- T3 Tumor extends into major veins or invades adrenal gland or perinephric tissues but not beyond Gerota fascia T3a: Tumor directly invades adrenal gland or
- stage renal cancer refers to Stages 1-3, as defined in the American Joint Committee on Cancer (AJCC) Cancer Staging Manual, pp. 323-325 (6th Ed. 2002 ).
- Reference to tumor "grade” for renal cell carcinoma as used herein refers to a grading system based on microscopic appearance of tumor cells. According to the TNM staging system of the AJCC, the various grades of renal cell carcinoma are:
- necrosis or "histologic necrosis” as used herein refer to the death of living cells or tissues.
- the presence of necrosis may be a prognostic factor in cancer.
- necrosis is commonly seen in renal cell carcinoma (RCC) and has been shown to be an adverse prognostic factor in certain RCC subtypes.
- RCC renal cell carcinoma
- nodal invasion or "node-positive (N+)" as used herein refer to the presence of cancer cells in one or more lymph nodes associated with the organ (e.g., drain the organ) containing a primary tumor. Nodal invasion is part of tumor staging for most cancers, including renal cell carcinoma.
- prognostic gene when used in the single or plural, refers to a gene, the expression level of which is correlated with a good or bad prognosis for a cancer patient.
- a gene may be both a prognostic and predictive gene, depending on the association of the gene expression level with the corresponding endpoint.
- correlated and “associated” are used interchangeably herein to refer to the strength of association between two measurements (or measured entities).
- the disclosure provides genes and gene subsets, the expression levels of which are associated with a particular outcome measure, such as between the expression level of a gene and the likelihood of a recurrence event or relapse.
- the increased expression level of a gene may be positively correlated (positively associated) with an increased likelihood of good clinical outcome for the patient, such as a decreased likelihood of recurrence of cancer.
- Such a positive correlation may be demonstrated statistically in various ways, e.g. by a hazard ratio less than 1.0.
- the increased expression level of a gene may be negatively correlated (negatively associated) with an increased likelihood of good clinical outcome for the patient.
- a patient with a high expression level of a gene may have an increased likelihood of recurrence of the cancer.
- Such a negative correlation could indicate that the patient with a high expression level of a gene likely has a poor prognosis, or might respond poorly to a chemotherapy, and this may be demonstrated statistically in various ways, e.g., a hazard ratio greater than 1.0.
- Co-expression is used herein to refer to strength of association between the expression levels of two different genes that are biologically similar, such that expression level of a first gene may be substituted with an expression level of a second gene in a given analysis in view of their correlation of expression.
- co-expressed genes or correlated expression indicates that these two genes are substitutable in an expression algorithm, for example, if a first gene is highly correlated, positively or negatively, with increased likelihood of a good clinical outcome for renal cell carcinoma, then the second co-expressed gene also correlates, in the same direction as the first gene, with the same outcome.
- Pairwise co-expression may be calculated by various methods known in the art, e.g., by calculating Pearson correlation coefficients or Spearman correlation coefficients or by clustering methods.
- the methods described herein may incorporate one or more genes that co-express, with a Pearson correlation co-efficient of at least 0.5. Co-expressed gene cliques may also be identified using graph theory. An analysis of co-expression may be calculated using normalized or standardized and normalized expression data.
- prognosis and “clinical outcome” are used interchangeably herein to refer to an estimate of the likelihood of cancer-attributable death or progression, including recurrence, and metastatic spread of a neoplastic disease, such as renal cell carcinoma.
- good prognosis or “positive clinical outcome” mean a desired clinical outcome.
- a good prognosis may be an expectation of no local recurrences or metastasis within two, three, four, five or more years of the initial diagnosis of renal cell carcinoma.
- poor prognosis or “negative clinical outcome” are used herein interchangeably to mean an undesired clinical outcome.
- a poor prognosis may be an expectation of a local recurrence or metastasis within two, three, four, five or more years of the initial diagnosis of renal cell carcinoma.
- predictive gene is used herein to refer to a gene, the expression of which is correlated, positively or negatively, with likelihood of beneficial response to treatment.
- a "clinical outcome” can be assessed using any endpoint, including, without limitation, (1) aggressiveness of tumor growth (e.g., movement to higher stage); (2) metastasis; (3) local recurrence; (4) increase in the length of survival following treatment; and/or (5) decreased mortality at a given point of time following treatment.
- Clinical response may also be expressed in terms of various measures of clinical outcome.
- Clinical outcome can also be considered in the context of an individual's outcome relative to an outcome of a population of patients having a comparable clinical diagnosis, and can be assessed using various endpoints such as an increase in the duration of Recurrence-Free interval (RFI), an increase in the duration of Overall Survival (OS) in a population, an increase in the duration of Disease-Free Survival (DFS), an increase in the duration of Distant Recurrence-Free Interval (DRFI), and the like.
- RFI Recurrence-Free interval
- OS Overall Survival
- DFS Disease-Free Survival
- DRFI Distant Recurrence-Free Interval
- treatment refers to therapeutic compounds administered to patients to cease or reduce proliferation of cancer cells, shrink the tumor, avoid progression and metastasis, or cause primary tumor or metastases regression.
- treatments include, for example, cytokine therapy, progestational agents, anti-angiogenic therapy, hormonal therapy, and chemotherapy (including small molecules and biologics).
- surgical resection are used herein to refer to surgical removal of some or all of a tumor, and usually some of the surrounding tissue.
- surgical techniques include laproscopic procedures, biopsy, or tumor ablation, such as cryotherapy, radio frequency ablation, and high intensity ultrasound.
- the extent of tissue removed during surgery depends on the state of the tumor as observed by a surgeon. For example, a partial nephrectomy indicates that part of one kidney is removed; a simple nephrectomy entails removal of all of one kidney; a radical nephrectomy, all of one kidney and neighboring tissue (e.g., adrenal gland, lymph nodes) removed; and bilateral nephrectomy, both kidneys removed.
- recurrence and “relapse” are used herein, in the context of potential clinical outcomes of cancer, to refer to a local or distant metastases. Identification of a recurrence could be done by, for example, CT imaging, ultrasound, arteriogram, or X-ray, biopsy, urine or blood test, physical exam, or research center tumor registry.
- recurrence-free interval refers to the time from surgery to first recurrence or death due to recurrence of renal cancer. Losses to follow-up, second primary cancers, other primary cancers, and deaths prior to recurrence are considered censoring events.
- overall survival is defined as the time from surgery to death from any cause. Losses to follow-up are considered censoring events. Recurrences are ignored for the purposes of calculating overall survival (OS).
- disease-free survival is defined as the time from surgery to first recurrence or death from any cause, whichever occurs first. Losses to follow-up are considered censoring events.
- Hazard Ratio refers to the effect of an explanatory variable on the hazard or risk of an event (i.e. recurrence or death).
- the HR is the ratio of the predicted hazard for two groups (e.g. patients with or without necrosis) or for a unit change in a continuous variable (e.g. one standard deviation change in gene expression).
- OR Odds Ratio
- prognostic clinical and/or pathologic covariate refers to clinical and/or prognostic covariates that are significantly associated (p ⁇ 0.05) with clinical outcome.
- prognostic clinical and pathologic covariates in renal cell carcinoma include tumor stage (e.g. size, nodal invasion, etc.), and grade (e.g., Fuhrman grade), histologic necrosis, and gender.
- proxy gene refers to a gene, the expression of which is correlated (positively or negatively) with one or more prognostic clinical and/or pathologic covariates.
- the expression level(s) of one or more proxy genes may be used instead of, or in addition to, classification of a tumor by physical or mechanical examination in a pathology laboratory.
- microarray refers to an ordered arrangement of hybridizable array elements, preferably polynucleotide probes, on a substrate.
- polynucleotide when used in singular or plural, generally refers to any polyribonucleotide or polydeoxribonucleotide, which may be unmodified RNA or DNA or modified RNA or DNA.
- polynucleotides as defined herein include, without limitation, single- and double-stranded DNA, DNA including single- and double-stranded regions, single- and double-stranded RNA, and RNA including single- and double-stranded regions, hybrid molecules comprising DNA and RNA that may be single-stranded or, more typically, double-stranded or include single- and double-stranded regions.
- polynucleotide refers to triple-stranded regions comprising RNA or DNA or both RNA and DNA.
- the strands in such regions may be from the same molecule or from different molecules.
- the regions may include all of one or more of the molecules, but more typically involve only a region of some of the molecules.
- One of the molecules of a triple-helical region often is an oligonucleotide.
- polynucleotide specifically includes DNAs (e.g., cDNAs) and RNAs that contain one or more modified bases.
- DNAs or RNAs with backbones modified for stability or for other reasons are "polynucleotides" as that term is intended herein.
- DNAs or RNAs comprising unusual bases, such as inosine, or modified bases, such as tritiated bases are included within the term “polynucleotides” as defined herein.
- polynucleotide embraces all chemically, enzymatically and/or metabolically modified forms of unmodified polynucleotides, as well as the chemical forms of DNA and RNA characteristic of viruses and cells, including simple and complex cells.
- oligonucleotide refers to a relatively short polynucleotide, including, without limitation, single-stranded deoxyribonucleotides, single- or double-stranded ribonucleotides, RNA:DNA hybrids and double-stranded DNAs. Oligonucleotides, such as single-stranded DNA probe oligonucleotides, are often synthesized by chemical methods, for example using automated oligonucleotide synthesizers that are commercially available. However, oligonucleotides can be made by a variety of other methods, including in vitro recombinant DNA-mediated techniques and by expression of DNAs in cells and organisms.
- expression level refers to the normalized level of a gene product.
- RNA transcript RNA transcription products
- a gene product can be, for example, an unspliced RNA, an mRNA, a splice variant mRNA, a microRNA, a fragmented RNA, a polypeptide, a post-translationally modified polypeptide, a splice variant polypeptide, etc.
- “Stringency” of hybridization reactions is readily determinable by one of ordinary skill in the art, and generally is an empirical calculation dependent upon probe length, washing temperature, and salt concentration. In general, longer probes require higher temperatures for proper annealing, while shorter probes need lower temperatures. Hybridization generally depends on the ability of denatured DNA to re-anneal when complementary strands are present in an environment below their melting temperature. The higher the degree of desired homology between the probe and hybridizable sequence, the higher the relative temperature that can be used. As a result, it follows that higher relative temperatures would tend to make the reaction conditions more stringent, while lower temperatures less so. For additional details and explanation of stringency of hybridization reactions, see Ausubel et al., Current Protocols in Molecular Biology,(Wiley Interscience, 1995 ).
- “Stringent conditions” or “high stringency conditions”, as defined herein, typically: (1) employ low ionic strength solutions and high temperature for washing, for example 0.015 M sodium chloride/0.0015 M sodium citrate/0.1% sodium dodecyl sulfate at 50°C; (2) employ during hybridization a denaturing agent, such as formamide, for example, 50% (v/v) formamide with 0.1% bovine serum albumin/0.1% Ficoll/0.1% polyvinylpyrrolidone/50mM sodium phosphate buffer at pH 6.5 with 750 mM sodium chloride, 75 mM sodium citrate at 42°C; or (3) employ 50% formamide, 5 x SSC (0.75 M NaCl, 0.075 M sodium citrate), 50 mM sodium phosphate (pH 6.8), 0.1% sodium pyrophosphate, 5 x Denhardt's solution, sonicated salmon sperm DNA (50 ⁇ g/ml), 0.1% SDS, and 10% dextran sulfate at 42
- Modely stringent conditions may be identified as described by Sambrook et al., Molecular Cloning: A Laboratory Manual (Cold Spring Harbor Press, 1989 ), and include the use of washing solution and hybridization conditions (e.g., temperature, ionic strength and %SDS) less stringent that those described above.
- moderately stringent condition is overnight incubation at 37°C in a solution comprising: 20% formamide, 5 x SSC (150 mM NaCl, 15 mM trisodium citrate), 50 mM sodium phosphate (pH 7.6), 5 x Denhardt's solution, 10% dextran sulfate, and 20 mg/ml denatured sheared salmon sperm DNA, followed by washing the filters in 1 x SSC at about 37-50°C.
- the skilled artisan will recognize how to adjust the temperature, ionic strength, etc. as necessary to accommodate factors such as probe length and the like.
- references to “at least one,” “at least two,” “at least five,” etc. of the genes listed in any particular gene set means any one or any and all combinations of the genes listed.
- splicing and "RNA splicing” are used interchangeably and refer to RNA processing that removes introns and joins exons to produce mature mRNA with continuous coding sequence that moves into the cytoplasm of an eukaryotic cell.
- exon refers to any segment of an interrupted gene that is represented in a mature RNA product ( B. Lewin, Genes IV(Cell Press, 1990 )).
- intron refers to any segment of DNA that is transcribed but removed from within the transcript by splicing together the exons on either side of it.
- exon sequences occur in the mRNA sequence of a gene as defined by Ref. SEQ ID numbers.
- intron sequences are the intervening sequences within the genomic DNA of a gene, bracketed by exon sequences and usually having GT and AG splice consensus sequences at their 5' and 3' boundaries.
- a "computer-based system” refers to a system of hardware, software, and data storage medium used to analyze information.
- the minimum hardware of a patient computer-based system comprises a central processing unit (CPU), and hardware for data input, data output (e.g., display), and data storage.
- CPU central processing unit
- the data storage medium may comprise any manufacture comprising a recording of the present information as described above, or a memory access device that can access such a manufacture.
- Record data programming or other information on a computer readable medium refers to a process for storing information, using any such methods as known in the art. Any convenient data storage structure may be chosen, based on the means used to access the stored information. A variety of data processor programs and formats can be used for storage, e.g. word processing text file, database format, etc.
- a "processor” or “computing means” references any hardware and/or software combination that will perform the functions required of it.
- a suitable processor may be a programmable digital microprocessor such as available in the form of an electronic controller, mainframe, server or personal computer (desktop or portable).
- suitable programming can be communicated from a remote location to the processor, or previously saved in a computer program product (such as a portable or fixed computer readable storage medium, whether magnetic, optical or solid state device based).
- a magnetic medium or optical disk may carry the programming, and can be read by a suitable reader communicating with each processor at its corresponding station.
- the present disclosure provides methods for assessing a patient's risk of recurrence of cancer, which methods comprise assaying an expression level of at least one gene, or its gene product, in a biological sample obtained from the patient.
- the biological sample can be a tumor sample obtained from the kidney, or surrounding tissues, of the patient.
- the biological sample is obtained from a bodily fluid, such as blood or urine.
- genes useful in the methods disclosed herein are listed in Tables 3a and 3b, wherein increased expression of genes listed in Table 3a is significantly associated with a lower risk of cancer recurrence, and increased expression of genes listed in Table 3b is significantly associated with a higher risk of cancer recurrence.
- a co-expressed gene may be used in conjunction with, or substituted for, a gene listed in Tables 3a or 3b with which it co-expresses.
- the present disclosure further provides genes significantly associated, positively or negatively, with renal cancer recurrence after adjusting for clinical/pathologic covariates (stage, tumor grade, tumor size, nodal status, and presence of necrosis).
- Table 8a lists genes wherein increased expression is significantly associated with lower risk of renal cancer recurrence after adjusting for clinical/pathologic covariates
- Table 8b lists genes wherein increased expression is significantly associated with a higher risk of renal cancer recurrence after adjusting for clinical/pathologic covariates.
- 16 genes with significant association, positively or negatively, with good prognosis after adjusting for clinical/pathologic covariates and controlling the false discovery rate at 10% are listed in Table 9.
- One or more of these genes may be used separately, or in addition to, at least one of the genes listed in Tables 3a and 3b, to provide information concerning a patient's prognosis.
- Proxy genes for tumor stage are listed in Tables 4a and 4b, wherein increased expression of genes listed in Table 4a is significantly associated with higher tumor stage, and increased expression of genes listed in Table 4b is significantly associated with lower tumor stage.
- Proxy genes for tumor grade are listed in Tables 5a and 5b wherein increased expression of genes listed in Table 5a is significantly associated with higher tumor grade, and increased expression of genes listed in Table 5b is significantly associated with lower tumor grade.
- Proxy genes for the presence of necrosis are listed in Tables 6a and 6b, wherein expression of genes listed in Table 6a is significantly associated with the presence of necrosis, and increased expression of genes listed in Table 6b is significantly associated with the absence of necrosis.
- Proxy genes for nodal involvement are listed in Tables 7a and 7b wherein higher expression of genes listed in Table 7a are significantly associated with the presence of nodal invasion, and increased expression of genes listed in Table 7b are significantly associated with the absence of nodal invasion.
- One or more proxy genes may be used separately, or in addition to, at least one of the genes listed in Tables 3a and 3b, to provide information concerning a patient's prognosis.
- proxy genes are used to provide information concerning the patient's prognosis: TSPAN7, TEK, LDB2, TIMP3, SHANK3, RGS5, KDR, SDPR, EPAS1, ID1, TGFBR2, FLT4, SDPR, ENDRB, JAG1, DLC1, and KL.
- a co-expressed gene may be used in conjunction with, or substituted for, a proxy gene with which it co-expresses.
- the present disclosure also provides sets of genes in biological pathways that are useful for assessing the likelihood that a cancer patient is likely to have a positive clinical outcome, which sets of genes are referred to herein as "gene subsets".
- the gene subsets include angiogenesis, immune response, transport, cell adhesion/extracellular matrix, cell cycle, and apoptosis.
- the angiogenesis gene subset includes ADD1, ANGPTL3, APOLD1, CEACAM1, EDNRB, EMCN, ENG, EPAS1, FLT1, JAG1, KDR, KL, LDB2, NOS3, NUDT6, PPAP2B, PRKCH, PTPRB, RGS5, SHANK3, SNRK, TEK, ICAM2, and VCAM1;
- the immune response gene subset includes CCL5, CCR7, CD8A, CX3CL1, CXCL10, CXCL9, HLA-DPB1, IL6, IL8, and SPP1, and
- the transport gene subset includes AQP1 and SGK1;
- the cell adhesion/extracellular matrix gene subset includes ITGB1, A2M, ITGB5, LAMB1, LOX, MMP14, TGFBR2, TIMP3, and TSPAN7;
- the cell cycle gene subset includes BUB1, C13orf15, CCNB1, PTTG1, TPX2, LMNB1, and TUBB
- the present disclosure also provides genes in biological pathways targeted by chemotherapy that are correlated, positively or negatively, to a risk of cancer recurrence. These genes include KIT, PDGFA, PDGFB, PDGFC, PDGFD, PDGFRb, KRAS, RAF1, MTOR, HIF1AN, VEGFA, VEGFB, and FLT4.
- the chemotherapy is cytokine and/or anti-angiogenic therapy.
- the chemotherapy is sunitinib, sorafenib, temsirolimus, bevacizumab, everolimus, and/or pazopanib.
- a co-expressed gene may be used in conjunction with, or substituted for, a gene with which it co-expresses.
- the cancer is renal cell carcinoma. In other embodiments, the cancer is clear cell renal cell carcinoma (ccRCC), papillary, chromophobe, collecting duct carcinoma, and/or medullary carcinoma.
- ccRCC clear cell renal cell carcinoma
- RT-PCR reverse-transciption polymerase chain reaction
- SAGE serial analysis of gene expression
- DGE Digital Gene Expression
- the expression level of each gene may be determined in relation to various features of the expression products of the gene, including exons, introns, protein epitopes, and protein activity.
- the expression levels of genes identified herein may be measured in tumor tissue.
- the tumor tissue may be obtained upon surgical resection of the tumor, or by tumor biopsy.
- the expression level of the identified genes may also be measured in tumor cells recovered from sites distant from the tumor, including circulating tumor cells or body fluid (e.g., urine, blood, blood fraction, etc.).
- the expression product that is assayed can be, for example, RNA or a polypeptide.
- the expression product may be fragmented.
- the assay may use primers that are complementary to target sequences of an expression product and could thus measure full transcripts as well as those fragmented expression products containing the target sequence. Further information is provided in Tables A and B, which provide examples of sequences of forward primers, reverse primers, probes and amplicons generated by use of the primers.
- RNA expression product may be assayed directly or by detection of a cDNA product resulting from a PCR-based amplification method, e.g., quantitative reverse transcription polymerase chain reaction (qRT-PCR).
- qRT-PCR quantitative reverse transcription polymerase chain reaction
- Polypeptide expression product may be assayed using immunohistochemistry (IHC). Further, both RNA and polypeptide expression products may also be is assayed using microarrays.
- RCC therapies including adjuvant radiation and chemotherapies. It would be useful to have a genomic test able to identify high-risk patients more accurately than standard clinical criteria, thereby further enriching an adjuvant RCC population for study. This would reduce the number of patients needed for an adjuvant trial and the time needed for definitive testing of these new agents in the adjuvant setting.
- a "report,” as described herein, is an electronic or tangible document that includes report elements that provide information of interest relating to a likelihood assessment and its results.
- a subject report includes at least a likelihood assessment, e.g., an indication as to the risk of recurrence for a subject with renal cell carcinoma.
- a subject report can be completely or partially electronically generated, e.g., presented on an electronic display (e.g., computer monitor).
- a report can further include one or more of: 1) information regarding the testing facility; 2) service provider information; 3) patient data; 4) sample data; 5) an interpretive report, which can include various information including: a) indication; b) test data, where test data can include a normalized level of one or more genes of interest, and 6) other features.
- the present disclosure thus provides for methods of creating reports and the reports resulting therefrom.
- the report may include a summary of the expression levels of the RNA transcripts, or the expression products of such RNA transcripts, for certain genes in the cells obtained from the patient's tumor.
- the report can include information relating to prognostic covariates of the patient.
- the report may include an estimate that the patient has an increased risk of recurrence. That estimate may be in the form of a score or patient stratifier scheme (e.g., low, intermediate, or high risk of recurrence).
- the report may include information relevant to assist with decisions about the appropriate surgery (e.g., partial or total nephrectomy) or treatment for the patient.
- the methods of the present disclosure further include generating a report that includes information regarding the patient's likely clinical outcome, e.g. risk of recurrence.
- the methods disclosed herein can further include a step of generating or outputting a report providing the results of a subject risk assessment, which report can be provided in the form of an electronic medium (e.g., an electronic display on a computer monitor), or in the form of a tangible medium (e.g., a report printed on paper or other tangible medium).
- a report that includes information regarding the patient's likely prognosis (e.g., the likelihood that a patient having renal cell carcinoma will have a good prognosis or positive clinical outcome in response to surgery and/or treatment) is provided to a user.
- An assessment as to the likelihood is referred to below as a "risk report” or, simply, “risk score.”
- a person or entity that prepares a report (“report generator”) may also perform the likelihood assessment.
- the report generator may also perform one or more of sample gathering, sample processing, and data generation, e.g., the report generator may also perform one or more of: a) sample gathering; b) sample processing; c) measuring a level of a risk gene; d) measuring a level of a reference gene; and e) determining a normalized level of a risk gene.
- an entity other than the report generator can perform one or more sample gathering, sample processing, and data generation.
- the term "user,” which is used interchangeably with “client,” is meant to refer to a person or entity to whom a report is transmitted, and may be the same person or entity who does one or more of the following: a) collects a sample; b) processes a sample; c) provides a sample or a processed sample; and d) generates data (e.g., level of a risk gene; level of a reference gene product(s); normalized level of a risk gene for use in the likelihood assessment.
- data e.g., level of a risk gene; level of a reference gene product(s); normalized level of a risk gene for use in the likelihood assessment.
- the person(s) or entity(ies) who provides sample collection and/or sample processing and/or data generation, and the person who receives the results and/or report may be different persons, but are both referred to as "users” or “clients” herein to avoid confusion.
- the user or client provides for data input and review of data output.
- a "user” can be a health professional (e.g., a clinician, a laboratory technician, a physician (e.g., an oncologist, surgeon, pathologist), etc.).
- the individual who, after computerized data processing according to the methods of the present disclosure, reviews data output is referred to herein as a "reviewer.”
- the reviewer may be located at a location remote to the user (e.g., at a service provided separate from a healthcare facility where a user may be located).
- assay methods for measuring an expression level of a gene product including assay methods for measuring an expression level of a nucleic acid gene product (e.g., an mRNA), and assay methods for measuring an expression level of a polypeptide gene product.
- a nucleic acid gene product e.g., an mRNA
- assay methods for measuring an expression level of a polypeptide gene product include assay methods for measuring an expression level of a polypeptide gene product.
- methods of measuring a level of a nucleic acid gene product include methods involving hybridization analysis of polynucleotides, and methods involving amplification of polynucleotides.
- a nucleic acid gene product e.g., an mRNA
- methods of measuring a level of a nucleic acid gene product include methods involving hybridization analysis of polynucleotides, and methods involving amplification of polynucleotides.
- Commonly used methods known in the art for the quantification of mRNA expression in a sample include northern blotting and in situ hybridization (See for example, Parker & Barnes, Methods in Molecular Biology 106:247-283 (1999 )); RNAse protection assays ( Hod, Biotechniques 13:852-854 (1992 )); and reverse transcription polymerase chain reaction (RT-PCR) ( Weis et al., Trends in Genetics 8:263-264 (1992 )).
- antibodies may be employed that can recognize specific duplexes, including DNA duplexes, RNA duplexes, and DNA-RNA hybrid duplexes or DNA-protein duplexes.
- Representative methods for sequencing-based gene expression analysis include Serial Analysis of Gene Expression (SAGE), and gene expression analysis by massively parallel signature sequencing (MPSS).
- the level of a target nucleic acid can be measured using a probe that hybridizes to the target nucleic acid.
- the target nucleic acid could be, for example, a RNA expression product of a response indicator gene associated with response to a VEGF/VEGFR Inhibitor, or a RNA expression product of a reference gene.
- the target nucleic acid is first amplified, for example using a polymerase chain reaction (PCR) method.
- mRNA may be assayed directly or reverse transcribed into cDNA for analysis.
- the method involves contacting a sample (e.g., a sample derived from a cancer cell) under stringent hybridization conditions with a nucleic acid probe and detecting binding, if any, of the probe to a nucleic acid in the sample.
- a sample e.g., a sample derived from a cancer cell
- a nucleic acid probe e.g., a sample derived from a cancer cell
- the nucleic acid probe will be detectably labeled.
- a target mRNA can be amplified by reverse transcribing the mRNA into cDNA, and then performing PCR (reverse transcription-PCR or RT-PCR).
- PCR reverse transcription-PCR or RT-PCR
- a single enzyme may be used for both steps as described in U.S. Pat. No. 5,322,770 .
- the fluorogenic 5' nuclease assay known as the TaqMan® assay (Roche Molecular Systems, Inc.), is a powerful and versatile PCR-based detection system for nucleic acid targets.
- TaqMan assay reagents and conditions for use therein, see, e.g., Holland et al., Proc. Natl. Acad. Sci., U.S.A. (1991) 88:7276-7280 ; U.S. Pat. Nos. 5,538,848 , 5,723,591 , and 5,876,930 , all incorporated herein by reference in their entireties.
- primers and probes derived from regions of a target nucleic acid as described herein can be used in TaqMan analyses to detect a level of target mRNA in a biological sample. Analysis is performed in conjunction with thermal cycling by monitoring the generation of fluorescence signals.
- TaqMan is a registered trademark of Roche Molecular Systems.
- the fluorogenic 5' nuclease assay is conveniently performed using, for example, AmpliTaq Gold® DNA polymerase, which has endogenous 5' nuclease activity, to digest an internal oligonucleotide probe labeled with both a fluorescent reporter dye and a quencher (see, Holland et al., Proc Nat Acad Sci USA (1991) 88:7276-7280 ; and Lee et al., Nucl. Acids Res. (1993) 21:3761-3766 ).
- Assay results are detected by measuring changes in fluorescence that occur during the amplification cycle as the fluorescent probe is digested, uncoupling the dye and quencher labels and causing an increase in the fluorescent signal that is proportional to the amplification of target nucleic acid.
- AmpliTaq Gold is a registered trademark of Roche Molecular Systems.
- the amplification products can be detected in solution or using solid supports.
- the TaqMan probe is designed to hybridize to a target sequence within the desired PCR product.
- the 5' end of the TaqMan probe contains a fluorescent reporter dye.
- the 3' end of the probe is blocked to prevent probe extension and contains a dye that will quench the fluorescence of the 5' fluorophore.
- the 5' fluorescent label is cleaved off if a polymerase with 5' exonuclease activity is present in the reaction. Excision of the 5' fluorophore results in an increase in fluorescence that can be detected.
- the first step for gene expression analysis is the isolation of mRNA from a target sample.
- the starting material is typically total RNA isolated from human tumors or tumor cell lines, and corresponding normal tissues or cell lines, respectively.
- RNA can be isolated from a variety of primary tumors, including breast, lung, colon, prostate, brain, liver, kidney, pancreas, spleen, thymus, testis, ovary, uterus, head and neck, etc., tumor, or tumor cell lines, with pooled DNA from healthy donors.
- mRNA can be extracted, for example, from frozen or archived paraffin-embedded and fixed (e.g., formalin-fixed) tissue samples.
- RNA isolation can be performed using kits and reagents from commercial manufacturers according to the manufacturer's instructions. For example, total RNA from cells in culture can be isolated using RNeasy® mini-columns (Qiagen GmbH Corp.).
- RNA isolation kits include MasterPureTM Complete DNA and RNA Purification Kit (EPICENTRE® Biotechnologies, Madison, WI), mirVana (Applied Biosystems, Inc.), and Paraffin Block RNA Isolation Kit (Ambion, Inc.).
- Total RNA from tissue samples can be isolated using RNA STAT-60TM (IsoTex Diagnostics, Inc., Friendswood TX).
- RNA prepared from tumor can be isolated, for example, by cesium chloride density gradient centrifugation. (RNeasy is a registered trademark of Qiagen GmbH Corp.; MasterPure is a trademark of EPICENTRE Biotechnologies; RNA STAT-60 is a trademark of Tel-Test Inc.)
- RNA cannot serve as a template for PCR
- the first step in gene expression profiling by RT-PCR is the reverse transcription of the RNA template into cDNA, followed by its exponential amplification in a PCR reaction.
- the two most commonly used reverse transcriptase enzymes are avilo myeloblastosis virus reverse transcriptase (AMV-RT) and Moloney murine leukemia virus reverse transcriptase (MMLV-RT).
- AMV-RT avilo myeloblastosis virus reverse transcriptase
- MMLV-RT Moloney murine leukemia virus reverse transcriptase
- the reverse transcription step is typically primed using specific primers, random hexamers, or oligo-dT primers, depending on the circumstances and the goal of expression profiling.
- extracted RNA can be reverse-transcribed using a GeneAmp® RNA PCR kit (Applied Biosystems Inc., Foster City, CA) according to the manufacturer's instructions.
- the derived cDNA can then be used as a template in a subsequent PCR reaction.
- GeneAmp is a registered trademark of Applied Biosystems Inc.
- the PCR step can use a variety of thermostable DNA-dependent DNA polymerases, it typically employs the Taq DNA polymerase, which has a 5'-3' nuclease activity but lacks a 3'-5' proofreading endonuclease activity.
- TaqMan PCR typically utilizes the 5'-nuclease activity of Taq or Tth polymerase to hydrolyze a hybridization probe bound to its target amplicon, but any enzyme with equivalent 5' nuclease activity can be used.
- Two oligonucleotide primers are used to generate an amplicon.
- a third oligonucleotide, or probe is designed to detect nucleotide sequence located between the two PCR primers.
- the probe is non-extendible by Taq DNA polymerase enzyme, and is labeled with a reporter fluorescent dye and a quencher fluorescent dye. Any laser-induced emission from the reporter dye is quenched by the quenching dye when the two dyes are located close together as they are on the probe.
- the Taq DNA polymerase enzyme cleaves the probe in a template-dependent manner. The resultant probe fragments disassociate in solution, and signal from the released reporter dye is free from the quenching effect of the second fluorophore.
- One molecule of reporter dye is liberated for each new molecule synthesized, and detection of the unquenched reporter dye provides the basis for quantitative interpretation of the data. (TaqMan is a registered mark of Applied Biosystems.)
- TaqMan RT-PCR can be performed using commercially available equipment, such as, for example, the ABI PRISM 7700® Sequence Detection System (Applied Biosystems, Foster City, CA, USA), or the Lightcycler® (Roche Molecular Biochemicals, Mannheim, Germany).
- the 5' nuclease procedure is run on a real-time quantitative PCR device such as the ABI PRISM 7900TM Sequence Detection SystemTM.
- the system consists of a thermocycler, laser, charge-coupled device (CCD), camera and computer. The system amplifies samples in a 96-well format on a thermocycler.
- laser-induced fluorescent signal is collected in real-time through fiber optics cables for all 96 wells, and detected at the CCD.
- the system includes software for running the instrument and for analyzing the data.
- PRISM 7700 is a registered trademark of Applied Biosystems; Lightcycler is a registered trademark of Roche Diagnostics GmbH LLC.
- 5'-Nuclease assay data are initially expressed as C t , or the threshold cycle.
- Ct threshold cycle
- RNAs that can be used to normalize patterns of gene expression include, e.g., mRNAs for the reference genes glyceraldehyde-3-phosphate-dehydrogenase (GAPDH) and ⁇ -actin.
- GPDH glyceraldehyde-3-phosphate-dehydrogenase
- RT-PCR A more recent variation of the RT-PCR technique is the real time quantitative PCR, which measures PCR product accumulation through a dual-labeled fluorogenic probe (i.e., TaqMan® probe).
- Real time PCR is compatible both with quantitative competitive PCR, where internal competitor for each target sequence is used for normalization, and with quantitative comparative PCR using a normalization gene contained within the sample, or a reference gene for RT-PCR.
- quantitative competitive PCR where internal competitor for each target sequence is used for normalization
- quantitative comparative PCR using a normalization gene contained within the sample, or a reference gene for RT-PCR.
- PCR primer design Factors considered in PCR primer design include primer length, melting temperature (Tm), and G/C content, specificity, complementary primer sequences, and 3'-end sequence.
- optimal PCR primers are generally 17-30 bases in length, and contain about 20-80%, such as, for example, about 50-60% G+C bases. Tm's between 50 and 80 °C, e.g., about 50 to 70 °C can be used.
- Suitable methods for assaying a level of a nucleic acid gene product include, e.g., microarrays; serial analysis of gene expression (SAGE); MassARRAY® analysis; digital gene expression (DGE) ( J. Marioni, Genome Research 18(9):1509-1517 (2008 ), gene expression by massively parallel signature sequencing (see, e.g., Ding and Cantor, Proc. Nat'l Acad Sci 100:3059-3064 (2003 ); differential display ( Liang and Pardee, Science 257:967-971 (1992 )); amplified fragment length polymorphism (iAFLP) ( Kawamoto et al., Genome Res.
- SAGE serial analysis of gene expression
- MassARRAY® analysis digital gene expression
- DGE digital gene expression
- iAFLP amplified fragment length polymorphism
- BeadArrayTM technology (Illumina, San Diego, CA; Oliphant et al., Discovery of Markers for Disease (Supplement to Biotechniques), June 2002 ; Ferguson et al., Analytical Chemistry 72:5618 (2000 )); BeadsArray for Detection of Gene Expression (BADGE), using the commercially available Luminex100 LabMAP system and multiple color-coded microspheres (Luminex Corp., Austin, TX) in a rapid assay for gene expression ( Yang et al., Genome Res. 11:1888-1898 (2001 )); and high coverage expression profiling (HiCEP) analysis ( Fukumura et al., Nucl. Acids. Res. 31(16) e94 (2003 )).
- Assays to measure the amount of an RNA gene expression product can be targeted to intron sequences or exon sequences of the primary transcript.
- the amount of a spliced intron that is measured in human tissue samples is generally indicative of the amount of a corresponding exon (i.e. an exon from the same gene) present in the samples.
- Polynucleotides that consist of or are complementary to intron sequences can be used, e.g., in hybridization methods or amplification methods to assay the expression level of response indicator genes.
- Methods of measuring a level of a polypeptide gene product include antibody-based methods such as enzyme-linked immunoabsorbent assay (ELISA), radioimmunoassay (RIA), protein blot analysis, immunohistochemical analysis and the like.
- the measure of a polypeptide gene product may also be measured in vivo in the subject using an antibody that specifically binds a target polypeptide, coupled to a paramagnetic label or other label used for in vivo imaging, and visualizing the distribution of the labeled antibody within the subject using an appropriate in vivo imaging method, such as magnetic resonance imaging.
- Such methods also include proteomics methods such as mass spectrometric methods, which are known in the art.
- RNA for expression analysis from blood, plasma and serum See for example, Tsui NB et al. (2002) 48,1647-53 and references cited therein
- urine See for example, Boom R et al. (1990) J Clin Microbiol. 28, 495-503 and reference cited therein) have been described.
- the methods and systems described herein can be implemented in numerous ways. In one embodiment of particular interest, the methods involve use of a communications infrastructure, for example the Internet. Several embodiments are discussed below. It is also to be understood that the present disclosure may be implemented in various forms of hardware, software, firmware, processors, or a combination thereof. The methods and systems described herein can be implemented as a combination of hardware and software.
- the software can be implemented as an application program tangibly embodied on a program storage device, or different portions of the software implemented in the user's computing environment (e.g., as an applet) and on the reviewer's computing environment, where the reviewer may be located at a remote site associated (e.g., at a service provider's facility).
- portions of the data processing can be performed in the user-side computing environment.
- the user-side computing environment can be programmed to provide for defined test codes to denote a likelihood "risk score," where the score is transmitted as processed or partially processed responses to the reviewer's computing environment in the form of test code for subsequent execution of one or more algorithms to provide a results and/or generate a report in the reviewer's computing environment.
- the risk score can be a numerical score (representative of a numerical value) or a non-numerical score representative of a numerical value or range of numerical values (e.g., low, intermediate, or high).
- the application program for executing the algorithms described herein may be uploaded to, and executed by, a machine comprising any suitable architecture.
- the machine involves a computer platform having hardware such as one or more central processing units (CPU), a random access memory (RAM), and input/output (I/O) interface(s).
- the computer platform also includes an operating system and microinstruction code.
- the various processes and functions described herein may either be part of the microinstruction code or part of the application program (or a combination thereof) that is executed via the operating system.
- various other peripheral devices may be connected to the computer platform such as an additional data storage device and a printing device.
- the system generally includes a processor unit.
- the processor unit operates to receive information, which can include test data (e.g., level of a risk gene, level of a reference gene product(s); normalized level of a gene; and may also include other data such as patient data.
- This information received can be stored at least temporarily in a database, and data analyzed to generate a report as described above.
- Part or all of the input and output data can also be sent electronically; certain output data (e.g., reports) can be sent electronically or telephonically (e.g., by facsimile, e.g., using devices such as fax back).
- Exemplary output receiving devices can include a display element, a printer, a facsimile device and the like.
- Electronic forms of transmission and/or display can include email, interactive television, and the like.
- all or a portion of the input data and/or all or a portion of the output data (e.g., usually at least the final report) are maintained on a web server for access, preferably confidential access, with typical browsers. The data may be accessed or sent to health professionals as desired.
- the input and output data, including all or a portion of the final report can be used to populate a patient's medical record which may exist in a confidential database at the healthcare facility.
- a system for use in the methods described herein generally includes at least one computer processor (e.g., where the method is carried out in its entirety at a single site) or at least two networked computer processors (e.g., where data is to be input by a user (also referred to herein as a "client") and transmitted to a remote site to a second computer processor for analysis, where the first and second computer processors are connected by a network, e.g., via an intranet or internet).
- the system can also include a user component(s) for input; and a reviewer component(s) for review of data, generated reports, and manual intervention.
- Additional components of the system can include a server component(s); and a database(s) for storing data (e.g., as in a database of report elements, e.g., interpretive report elements, or a relational database (RDB) which can include data input by the user and data output.
- the computer processors can be processors that are typically found in personal desktop computers (e.g., IBM, Dell, Macintosh), portable computers, mainframes, minicomputers, or other computing devices.
- the networked client/server architecture can be selected as desired, and can be, for example, a classic two or three tier client server model.
- a relational database management system (RDMS), either as part of an application server component or as a separate component (RDB machine) provides the interface to the database.
- RDMS relational database management system
- the architecture is provided as a database-centric client/server architecture, in which the client application generally requests services from the application server which makes requests to the database (or the database server) to populate the report with the various report elements as required, particularly the interpretive report elements, especially the interpretation text and alerts.
- the server(s) e.g., either as part of the application server machine or a separate RDB/relational database machine responds to the client's requests.
- the input client components can be complete, stand-alone personal computers offering a full range of power and features to run applications.
- the client component usually operates under any desired operating system and includes a communication element (e.g., a modem or other hardware for connecting to a network), one or more input devices (e.g., a keyboard, mouse, keypad, or other device used to transfer information or commands), a storage element (e.g., a hard drive or other computer-readable, computer-writable storage medium), and a display element (e.g., a monitor, television, LCD, LED, or other display device that conveys information to the user).
- the user enters input commands into the computer processor through an input device.
- the user interface is a graphical user interface (GUI) written for web browser applications.
- GUI graphical user interface
- the server component(s) can be a personal computer, a minicomputer, or a mainframe and offers data management, information sharing between clients, network administration and security.
- the application and any databases used can be on the same or different servers.
- client and server(s) including processing on a single machine such as a mainframe, a collection of machines, or other suitable configuration are contemplated.
- client and server machines work together to accomplish the processing of the present disclosure.
- the database(s) is usually connected to the database server component and can be any device that will hold data.
- the database can be a any magnetic or optical storing device for a computer (e.g., CDROM, internal hard drive, tape drive).
- the database can be located remote to the server component (with access via a network, modem, etc.) or locally to the server component.
- the database can be a relational database that is organized and accessed according to relationships between data items.
- the relational database is generally composed of a plurality of tables (entities). The rows of a table represent records (collections of information about separate items) and the columns represent fields (particular attributes of a record).
- the relational database is a collection of data entries that "relate" to each other through at least one common field.
- Additional workstations equipped with computers and printers may be used at point of service to enter data and, in some embodiments, generate appropriate reports, if desired.
- the computer(s) can have a shortcut (e.g., on the desktop) to launch the application to facilitate initiation of data entry, transmission, analysis, report receipt, etc. as desired.
- the present disclosure also contemplates a computer-readable storage medium (e.g. CD-ROM, memory key, flash memory card, diskette, etc.) having stored thereon a program which, when executed in a computing environment, provides for implementation of algorithms to carry out all or a portion of the results of a response likelihood assessment as described herein.
- a computer-readable storage medium e.g. CD-ROM, memory key, flash memory card, diskette, etc.
- the program includes program instructions for collecting, analyzing and generating output, and generally includes computer readable code devices for interacting with a user as described herein, processing that data in conjunction with analytical information, and generating unique printed or electronic media for that user.
- the storage medium provides a program that provides for implementation of a portion of the methods described herein (e.g., the user-side aspect of the methods (e.g., data input, report receipt capabilities, etc.))
- the program provides for transmission of data input by the user (e.g., via the internet, via an intranet, etc.) to a computing environment at a remote site. Processing or completion of processing of the data is carried out at the remote site to generate a report. After review of the report, and completion of any needed manual intervention, to provide a complete report, the complete report is then transmitted back to the user as an electronic document or printed document (e.g., fax or mailed paper report).
- the storage medium containing a program according to the present disclosure can be packaged with instructions (e.g., for program installation, use, etc.) recorded on a suitable substrate or a web address where such instructions may be obtained.
- the computer-readable storage medium can also be provided in combination with one or more reagents for carrying out response likelihood assessment (e.g., primers, probes, arrays, or other such kit components).
- raw expression level data measured for a gene product may be normalized relative to the mean expression level data obtained for one or more reference genes.
- Ct cycle threshold
- a small number of genes are used as reference genes; the genes chosen for reference genes typically show a minimal amount of variation in expression from sample to sample and the expression level of other genes is compared to the relatively stable expression of the reference genes.
- the expression level of each gene in a sample is compared to an average expression level in the sample of all genes in order to compare the expression of a particular gene to the total amount of material.
- Unprocessed data from qRT-PCR is expressed as cycle threshold (C t ), the number of amplification cycles required for the detectable signal to exceed a defined threshold. High C t is indicative of low expression since more cycles are required to detect the amplification product.
- Normalization may be carried out such that a one-unit increase in normalized expression level of a gene product generally reflects a 2-fold increase in quantity of expression product present in the sample.
- Gene expression may then be standardized by dividing the normalized gene expression by the standard deviation of expression across all patients for that particular gene. By standardizing normalized gene expression the hazard ratios across genes are comparable and reflect the relative risk for each standard deviation of gene expression.
- Cox proportional hazards regression model may be fit to a particular clinical time-to-event endpoint (e.g., RFI, OS).
- RFI clinical time-to-event endpoint
- One assumption of the Cox proportional hazards regression model is the proportional hazards assumption, i.e. the assumption that model effects multiply the underlying hazard.
- Assessments of model adequacy may be performed including, but not limited to, examination of the cumulative sum of martingale residuals.
- One skilled in the art would recognize that there are numerous statistical methods that may be used (e.g., Royston and Parmer (2002), smoothing spline, etc.) to fit a flexible parametric model using the hazard scale and the Weibull distribution with natural spline smoothing of the log cumulative hazards function, with effects allowed to be time-dependent. (See, P. Royston, M.
- results were adjusted for multiple hypothesis tests, and allowed for a 10% false discovery rate (FDR), using Storey's procedure, and using TDRAS with separate classes ( M. Crager, Gene identification using true discovery rate degree of association sets and estimates corrected for regression to the mean, Statistics in Medicine (published online Dec. 2009 ).
- FDR 10% false discovery rate
- TDRAS TDRAS with separate classes
- genes with significant association with RFI were identified through cross-validation techniques in which forward stepwise Cox PH regression was employed using a subset of factors identified through Principal Component Analysis (PCA).
- PCA Principal Component Analysis
- co-expression analysis methods now known or later developed will fall within the scope and spirit of the present invention. These methods may incorporate, for example, correlation coefficients, co-expression network analysis, clique analysis, etc., and may be based on expression data from RT-PCR, microarrays, sequencing, and other similar technologies.
- gene expression clusters can be identified using pair-wise analysis of correlation based on Pearson or Spearman correlation coefficients. (See, e.g., Pearson K. and Lee A., Biometrika 2, 357 (1902 ); C. Spearman, Amer. J. Psychol 15:72-101 (1904 ); J. Myers, A. Well, Research Design and Statistical Analysis, p.
- a correlation coefficient of equal to or greater than 0.3 is considered to be statistically significant in a sample size of at least 20. (See, e.g., G. Norman, D. Streiner, Biostatistics: The Bare Essentials, 137-138 (3rd Ed. 2007 ).)
- Renal tumor tissue was obtained from approximately 1200 patients from the Cleveland Clinic Foundation (CCF) database. This database consists of patients who were diagnosed with renal carcinoma, clear cell type, stage I, II and III between the years of 1985 and 2003, who had available paraffin-embedded tumor (PET) blocks and adequate clinical follow-up, and who were not treated with adjuvant/neo-adjuvant systemic therapy. Patients with inherited VHL disease or bilateral tumors were also excluded. Tumors were graded using (1) Fuhrman grading system as noted in the World Health Organization Classification of Tumours: Pathology and Genetics: Tumours of the Urinary System and Male Genital Organs; and (2) the modified Fuhrman grading system (Table 1).
- Nx was treated as N0 for purposes of stage classification.
- the expression of 732 genes was quantitatively assessed for each patient tissue sample.
- RNA from paraffin embedded tissue (PET) samples obtained from 942 patients who met all inclusion/exclusion criteria was extracted using protocols optimized for fixed renal tissue and perform molecular assays of quantitative gene expression using TaqMan® RT-PCR.
- RT-PCR was performed with RNA input at 1.0 ng per 5 ⁇ L-reaction volume using two 384 well plates.
- RT-PCR analysis of PET samples was conducted using 732 genes. These genes were evaluated for association with the primary and secondary endpoints, recurrence-free interval (RFI), disease-free survival (DFS) and overall survival (OS).
- RFID recurrence-free interval
- DFS disease-free survival
- OS overall survival
- PCA principal component analysis
- MLB maximum lower bound
- TDRDAS TDRDAS analysis
- Genes that had a significant association (p ⁇ 0.05) with risk of recurrence are listed in Tables 3a and 3b, wherein genes that are positively associated with a good prognosis (i.e., increased expression indicates a lower risk of recurrence) are listed in Table 3a. Genes that are negatively associated with a good prognosis (i.e., increased expression indicates a higher risk of recurrence) are listed in Table 3b. Genes that were associated, positively or negatively, with a good prognosis but not associated with clinical/pathologic covariates are BBC3, CCR7, CCR4, and VCAN.
- genes associated positively with a good prognosis after adjusting for clinical and pathologic covariates stage, tumor grade, tumor size, nodal status, and presence of necrosis
- genes associated negatively with a good prognosis after adjusting for clinical/pathologic covariates are listed in Table 8b.
- 16 genes with significant association, positively or negatively, with a good prognosis after adjusting for clinical and pathologic covariates and controlling the false discovery rate at 10% are listed in Table 9.
- angiogenesis genes e.g., EMCN, PPAP2B, NOS3, NUDT6, PTPRB, SNRK, APOLD1, PRKCH, and CEACAM1
- cell adhesion/extracellular matrix genes e.g., ITGB5, ITGB1, A2M, TIMP3
- immune response genes e.g., CCL5, CCXL9, CCR7, IL8, IL6, and CX3CL1
- cell cycle e.g., BUB1, TPX2
- apoptosis e.g., CASP10
- transport genes AQP1 were strongly associated, positively or negatively, with RFI.
- genes that are associated with pathway targets for renal cancer drugs were identified as having a significant association with outcome, including: KIT, PDGFA, PDGFB, PDGFC, PDGFD, PDGFRb, KRAS, RAF1, MTOR, HIF1AN, VEGFA, VEGFB, and FLT4.
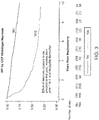
- necrosis in these tumors was associated with a higher risk of recurrence, at least in the first 4 years after surgery. See Figure 3 . However, the prognostic effect of necrosis after year 4 was negligible.
- proxy genes genes that correlate, positively or negatively, with pathologic and/or clinical factors.
- pathologic and/or clinical factors pathologic and/or clinical factors.
- proxy genes pathologic and/or clinical factors
- increased expression of the proxy genes listed in Tables 4a-7b correlate, positively or negatively, with tumor stage, tumor grade, presence of necrosis, and nodal invasion, respectively.
- gene expression was normalized and then standardized such that the odds ratio (OR) reflects a one standard deviation change in gene expression.
- Figures 4 - 7 provide a comparison of patient stratification (Low, Intermediate, or High Risk) obtained by applying the Mayo prognostic tool (described in Leibovich et al. "prediction of progression after radical nephrectomy for patients with clear cell renal cell carcinoma” (2003) Cancer 97:1663-1671 ) CCF expression data.
- the Mayo prognostic tool alone provides for stratification into three populations Low Risk (93% recurrence free at 5 years), Intermediate Risk (79% recurrence free at 5 years), and High Risk (36% recurrence free at 5 years).
- use of expression data from even one gene as exemplified by EMCN ( Fig.
- Table 3a Genes for which increased expression is associated with lower risk of cancer recurrence (p-value ⁇ .05) Gene Official Symbol Univariate Cox Analyses (No Covariate Adjustment) with RFI Gene Official Symbol Univariate Cox Analyses (No Covariate Adjustment) with RFI p-value for HR HR p-value for HR HR YB-1.2 YBX1 ⁇ 0.0001 0.75 IGF1R.3 IGF1R ⁇ 0.0001 0.58 XIAP.1 XIAP 0.0009 0.81 IFI27.1 IFI27 0.0205 0.85 WWOX.5 WWOX ⁇ 0.0001 0.71 ID3.1 ID3 ⁇ 0.0001 0.69 VWF.1 VWF ⁇ 0.0001 0.61 ID2.4 ID2 ⁇ 0.0001 0.75 VEGF.1 VEGFA ⁇ 0.0001 0.75 ID1.1 ID
Abstract
Description
- The present application claims priority benefit of
U.S. provisional application serial no. 61/294,038, filed January 11, 2010 U.S. provisional application serial no. 61/346,230, filed May 19, 2010 - The present disclosure relates to molecular diagnostic assays that provide information concerning prognosis in renal cancer patients.
- Each year in the United States there are approximately 51,000 cases of renal cell carcinoma (kidney cancer) and upper urinary tract cancer, resulting in more than 12,900 deaths. These tumors account for approximately 3% of adult malignancies. Renal cell carcinoma (RCC) represents about 3 percent of all cancers in the United States. Predictions for the United States for the year 2007 were that 40,000 new patients would be diagnosed with RCC and that 13,000 would die from this disease.
- The clinical outcome for a renal cell carcinoma patient depends largely on the aggressiveness of their particular cancer. Surgical resection is the most common treatment for this disease as systemic therapy has demonstrated only limited effectiveness. However, approximately 30% of patients with localized tumors will experience a relapse following surgery, and only 40% of all patients with renal cell carcinoma survive for 5 years.
- In the US, the number of adjuvant treatment decisions that will be made by patients with early stage renal cell carcinoma in 2005 exceeded 25,000. The rates in the European Union are expected to be similar. Physicians require prognostic information to help them make informed treatment decisions for patients with renal cell carcinoma and recruit appropriate high-risk patients for clinical trials. Surgeons must decide how much kidney and surrounding tissue to remove based, in part, on predicting the aggressiveness of a particular tumor. Today, cancer tumors are generally classified based on clinical and pathological features, such as stage, grade, and the presence of necrosis. These designations are made by applying standardized criteria, the subjectivity of which has been demonstrated by a lack of concordance amongst pathology laboratories.
- The present disclosure provides biomarkers, the expression of which has prognostic value in renal cancer.
-
-
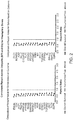
Figures 1a-1c : Consistency between Stage I and III for exemplary genes associated with RFI -
Figure 2 : Consistent results across endpoints (OS and RFI) for exemplary genes -
Figure 3 : Kaplan-Meier curve: Recurrence Free Internal (RFI) by Cleveland Clinic Foundation (CCF) histologic necrosis -
Figure 4 : Performance of Mayo prognostic tool applied to CCF data -
Figure 5 : Example of using one gene to improve estimate: EMCN in addition to Mayo Criteria -
Figure 6 : Example of using one gene to improve estimate: AQP1 in addition to Mayo Criteria -
Figure 7 : Example of using one gene to improve estimate: PPAP2B in addition to Mayo Criteria - Unless defined otherwise, technical and scientific terms used herein have the same meaning as commonly understood by one of ordinary skill in the art to which this invention belongs. Singleton et al., Dictionary of Microbiology and Molecular Biology 2nd ed., J. Wiley & Sons (New York, NY 1994), and March, Advanced Organic Chemistry Reactions, Mechanisms and Structure 4th ed., John Wiley & Sons (New York, NY 1992), provide one skilled in the art with a general guide to many of the terms used in the present application.
- One skilled in the art will recognize many methods and materials similar or equivalent to those described herein, which could be used in the practice of the present invention. Indeed, the present invention is in no way limited to the methods and materials described. For purposes of the present invention, the following terms are defined below.
- The term "tumor" is used herein to refer to all neoplastic cell growth and proliferation, and all pre-cancerous and cancerous cells and tissues. The term "primary tumor" is used herein to refer to a tumor that is at the original site where it first arose. For example, a primary renal cell carcinoma tumor is one that arose in the kidney. The term "metastatic tumor" is used herein to refer to a tumor that develops away from the site of origin. For example, renal cell carcinoma metastasis most commonly affects the spine, ribs, pelvis, and proximal long bones.
- The terms "cancer" and "carcinoma" refer to or describe the physiological condition in mammals that is typically characterized by unregulated cell growth. The pathology of cancer includes, for example, abnormal or uncontrollable cell growth, metastasis, interference with the normal functioning of neighboring cells, release of cytokines or other secretory products at abnormal levels, suppression or aggravation of inflammatory or immunological response, neoplasia, premalignancy, malignancy, invasion of surrounding or distant tissues or organs, such as lymph nodes, blood vessels, etc.
- As used herein, the terms "renal cancer" or "renal cell carcinoma" refer to cancer that has arisen from the kidney.
- The terms "renal cell cancer" or "renal cell carcinoma" (RCC), as used herein, refer to cancer which originates in the lining of the proximal convoluted tubule. More specifically, RCC encompasses several relatively common histologic subtypes: clear cell renal cell carcinoma, papillary (chromophil), chromophobe, collecting duct carcinoma, and medullary carcinoma. Further information about renal cell carcinoma may be found in Y. Thyavihally, et al., Int Semin Surg Oncol 2:18 (2005), the contents of which are incorporated by reference herein. Clear cell renal cell carcinoma (ccRCC) is the most common subtype of RCC. Incidence of ccRCC is increasing, comprising 80% of localized disease and more than 90% of metastatic disease.
- The staging system for renal cell carcinoma is based on the degree of tumor spread beyond the kidney. According to the tumor, node, metastasis (TNM) staging system of the American Joint Committee on Cancer (AJCC) (Greene, et al., AJCC Cancer Staging Manual,pp. 323-325 (6th Ed. 2002), the various stages of renal cell carcinoma are provided below. "Increased stage" as used herein refers to classification of a tumor at a stage that is more advanced, e.g.,
Stage 4 is an increased stage relative toStages Description of RCC Stages Stages for Renal Cell Carcinoma Stage 1: T1, N0, M0 Stage 2: T2, N0, M0 Stage 3: T1-T2, N1, M0; T3, N0-1, M0; T3a, N0-1, M0; T3b, N0-1, M0; and T3c, N0-1, M0 Stage 4: T4, N0-1, M0; Any T, N2, M0; and Any T, any N, M1 Primary tumor (T) TX: Primary tumor cannot be assessed T0: No evidence of primary tumor T1: Tumor 7 cm or less in greatest dimension and limited to the kidneyT1a: Tumor 4 cm or less in greatest dimension and limited to the kidneyT1b: Tumor larger than 4 cm but 7 cm or less in greatest dimension and limited to the kidney T2: Tumor larger than 7 cm in greatest dimension and limited to the kidney T3: Tumor extends into major veins or invades adrenal gland or perinephric tissues but not beyond Gerota fascia T3a: Tumor directly invades adrenal gland or perirenal and/or renal sinus fat but not beyond Gerota fascia T3b: Tumor grossly extends into the renal vein or its segmental (i.e., muscle-containing) branches, or it extends into the vena cava below the diaphragm T3c: Tumor grossly extends into the vena cava above the diaphragm or invades the wall of the vena cava T4: Tumor invades beyond Gerota fascia Regional lymph nodes (N) NX: Regional lymph nodes cannot be assessed N0: No regional lymph node metastasis N1: Metastasis in a single regional lymph node N2: Metastasis in more than one regional lymph node Distant metastasis (M) MX: Distant metastasis cannot be assessed M0: No distant metastasis M1: Distant metastasis - The term "early stage renal cancer", as used herein, refers to Stages 1-3, as defined in the American Joint Committee on Cancer (AJCC) Cancer Staging Manual, pp. 323-325 (6th Ed. 2002).
- Reference to tumor "grade" for renal cell carcinoma as used herein refers to a grading system based on microscopic appearance of tumor cells. According to the TNM staging system of the AJCC, the various grades of renal cell carcinoma are:
- GX (grade of differentiation cannot be assessed);
- G1 (well differentiated);
- G2 (moderately differentiated); and
- G3-G4 (poorly differentiated/undifferentiated).
- The terms "necrosis" or "histologic necrosis" as used herein refer to the death of living cells or tissues. The presence of necrosis may be a prognostic factor in cancer. For example, necrosis is commonly seen in renal cell carcinoma (RCC) and has been shown to be an adverse prognostic factor in certain RCC subtypes. V. Foria, et al., J Clin Pathol 58(1):39-43 (2005).
- The terms "nodal invasion" or "node-positive (N+)" as used herein refer to the presence of cancer cells in one or more lymph nodes associated with the organ (e.g., drain the organ) containing a primary tumor. Nodal invasion is part of tumor staging for most cancers, including renal cell carcinoma.
- The term "prognostic gene," when used in the single or plural, refers to a gene, the expression level of which is correlated with a good or bad prognosis for a cancer patient. A gene may be both a prognostic and predictive gene, depending on the association of the gene expression level with the corresponding endpoint.
- The terms "correlated" and "associated" are used interchangeably herein to refer to the strength of association between two measurements (or measured entities). The disclosure provides genes and gene subsets, the expression levels of which are associated with a particular outcome measure, such as between the expression level of a gene and the likelihood of a recurrence event or relapse. For example, the increased expression level of a gene may be positively correlated (positively associated) with an increased likelihood of good clinical outcome for the patient, such as a decreased likelihood of recurrence of cancer. Such a positive correlation may be demonstrated statistically in various ways, e.g. by a hazard ratio less than 1.0. In another example, the increased expression level of a gene may be negatively correlated (negatively associated) with an increased likelihood of good clinical outcome for the patient. In that case, for example, a patient with a high expression level of a gene may have an increased likelihood of recurrence of the cancer. Such a negative correlation could indicate that the patient with a high expression level of a gene likely has a poor prognosis, or might respond poorly to a chemotherapy, and this may be demonstrated statistically in various ways, e.g., a hazard ratio greater than 1.0.
- "Co-expression" is used herein to refer to strength of association between the expression levels of two different genes that are biologically similar, such that expression level of a first gene may be substituted with an expression level of a second gene in a given analysis in view of their correlation of expression. Such co-expressed genes (or correlated expression) indicates that these two genes are substitutable in an expression algorithm, for example, if a first gene is highly correlated, positively or negatively, with increased likelihood of a good clinical outcome for renal cell carcinoma, then the second co-expressed gene also correlates, in the same direction as the first gene, with the same outcome. Pairwise co-expression may be calculated by various methods known in the art, e.g., by calculating Pearson correlation coefficients or Spearman correlation coefficients or by clustering methods. The methods described herein may incorporate one or more genes that co-express, with a Pearson correlation co-efficient of at least 0.5. Co-expressed gene cliques may also be identified using graph theory. An analysis of co-expression may be calculated using normalized or standardized and normalized expression data.
- The terms "prognosis" and "clinical outcome" are used interchangeably herein to refer to an estimate of the likelihood of cancer-attributable death or progression, including recurrence, and metastatic spread of a neoplastic disease, such as renal cell carcinoma. The terms "good prognosis" or "positive clinical outcome" mean a desired clinical outcome. For example, in the context of renal cell carcinoma, a good prognosis may be an expectation of no local recurrences or metastasis within two, three, four, five or more years of the initial diagnosis of renal cell carcinoma. The terms "poor prognosis" or "negative clinical outcome" are used herein interchangeably to mean an undesired clinical outcome. For example, in the context of renal cell carcinoma, a poor prognosis may be an expectation of a local recurrence or metastasis within two, three, four, five or more years of the initial diagnosis of renal cell carcinoma.
- The term "predictive gene" is used herein to refer to a gene, the expression of which is correlated, positively or negatively, with likelihood of beneficial response to treatment.
- A "clinical outcome" can be assessed using any endpoint, including, without limitation, (1) aggressiveness of tumor growth (e.g., movement to higher stage); (2) metastasis; (3) local recurrence; (4) increase in the length of survival following treatment; and/or (5) decreased mortality at a given point of time following treatment. Clinical response may also be expressed in terms of various measures of clinical outcome. Clinical outcome can also be considered in the context of an individual's outcome relative to an outcome of a population of patients having a comparable clinical diagnosis, and can be assessed using various endpoints such as an increase in the duration of Recurrence-Free interval (RFI), an increase in the duration of Overall Survival (OS) in a population, an increase in the duration of Disease-Free Survival (DFS), an increase in the duration of Distant Recurrence-Free Interval (DRFI), and the like.
- The term "treatment", as used herein, refers to therapeutic compounds administered to patients to cease or reduce proliferation of cancer cells, shrink the tumor, avoid progression and metastasis, or cause primary tumor or metastases regression. Examples of treatment include, for example, cytokine therapy, progestational agents, anti-angiogenic therapy, hormonal therapy, and chemotherapy (including small molecules and biologics).
- The terms "surgery" or "surgical resection" are used herein to refer to surgical removal of some or all of a tumor, and usually some of the surrounding tissue. Examples of surgical techniques include laproscopic procedures, biopsy, or tumor ablation, such as cryotherapy, radio frequency ablation, and high intensity ultrasound. In cancer patients, the extent of tissue removed during surgery depends on the state of the tumor as observed by a surgeon. For example, a partial nephrectomy indicates that part of one kidney is removed; a simple nephrectomy entails removal of all of one kidney; a radical nephrectomy, all of one kidney and neighboring tissue (e.g., adrenal gland, lymph nodes) removed; and bilateral nephrectomy, both kidneys removed.
- The terms "recurrence" and "relapse" are used herein, in the context of potential clinical outcomes of cancer, to refer to a local or distant metastases. Identification of a recurrence could be done by, for example, CT imaging, ultrasound, arteriogram, or X-ray, biopsy, urine or blood test, physical exam, or research center tumor registry.
- The term "recurrence-free interval" as used herein refers to the time from surgery to first recurrence or death due to recurrence of renal cancer. Losses to follow-up, second primary cancers, other primary cancers, and deaths prior to recurrence are considered censoring events.
- The term "overall survival" is defined as the time from surgery to death from any cause. Losses to follow-up are considered censoring events. Recurrences are ignored for the purposes of calculating overall survival (OS).
- The term "disease-free survival" is defined as the time from surgery to first recurrence or death from any cause, whichever occurs first. Losses to follow-up are considered censoring events.
- The term "Hazard Ratio (HR)" as used herein refers to the effect of an explanatory variable on the hazard or risk of an event (i.e. recurrence or death). In proportional hazards regression models, the HR is the ratio of the predicted hazard for two groups (e.g. patients with or without necrosis) or for a unit change in a continuous variable (e.g. one standard deviation change in gene expression).
- The term "Odds Ratio (OR)" as used herein refers to the effect of an explanatory variable on the odds of an event (e.g. presence of necrosis). In logistic regression models, the OR is the ratio of the predicted odds for a unit change in a continuous variable (e.g. one standard deviation change in gene expression).
- The term "prognostic clinical and/or pathologic covariate" as used herein refers to clinical and/or prognostic covariates that are significantly associated (p≤0.05) with clinical outcome. For example, prognostic clinical and pathologic covariates in renal cell carcinoma include tumor stage (e.g. size, nodal invasion, etc.), and grade (e.g., Fuhrman grade), histologic necrosis, and gender.
- The term "proxy gene" refers to a gene, the expression of which is correlated (positively or negatively) with one or more prognostic clinical and/or pathologic covariates. The expression level(s) of one or more proxy genes may be used instead of, or in addition to, classification of a tumor by physical or mechanical examination in a pathology laboratory.
- The term "microarray" refers to an ordered arrangement of hybridizable array elements, preferably polynucleotide probes, on a substrate.
- The term "polynucleotide," when used in singular or plural, generally refers to any polyribonucleotide or polydeoxribonucleotide, which may be unmodified RNA or DNA or modified RNA or DNA. Thus, for instance, polynucleotides as defined herein include, without limitation, single- and double-stranded DNA, DNA including single- and double-stranded regions, single- and double-stranded RNA, and RNA including single- and double-stranded regions, hybrid molecules comprising DNA and RNA that may be single-stranded or, more typically, double-stranded or include single- and double-stranded regions. In addition, the term "polynucleotide" as used herein refers to triple-stranded regions comprising RNA or DNA or both RNA and DNA. The strands in such regions may be from the same molecule or from different molecules. The regions may include all of one or more of the molecules, but more typically involve only a region of some of the molecules. One of the molecules of a triple-helical region often is an oligonucleotide. The term "polynucleotide" specifically includes DNAs (e.g., cDNAs) and RNAs that contain one or more modified bases. Thus, DNAs or RNAs with backbones modified for stability or for other reasons are "polynucleotides" as that term is intended herein. Moreover, DNAs or RNAs comprising unusual bases, such as inosine, or modified bases, such as tritiated bases, are included within the term "polynucleotides" as defined herein. In general, the term "polynucleotide" embraces all chemically, enzymatically and/or metabolically modified forms of unmodified polynucleotides, as well as the chemical forms of DNA and RNA characteristic of viruses and cells, including simple and complex cells.
- The term "oligonucleotide" refers to a relatively short polynucleotide, including, without limitation, single-stranded deoxyribonucleotides, single- or double-stranded ribonucleotides, RNA:DNA hybrids and double-stranded DNAs. Oligonucleotides, such as single-stranded DNA probe oligonucleotides, are often synthesized by chemical methods, for example using automated oligonucleotide synthesizers that are commercially available. However, oligonucleotides can be made by a variety of other methods, including in vitro recombinant DNA-mediated techniques and by expression of DNAs in cells and organisms.
- The term "expression level" as applied to a gene refers to the normalized level of a gene product.
- The terms "gene product" or "expression product" are used herein interchangeably to refer to the RNA transcription products (RNA transcript) of a gene, including mRNA, and the polypeptide translation product of such RNA transcripts. A gene product can be, for example, an unspliced RNA, an mRNA, a splice variant mRNA, a microRNA, a fragmented RNA, a polypeptide, a post-translationally modified polypeptide, a splice variant polypeptide, etc.
- "Stringency" of hybridization reactions is readily determinable by one of ordinary skill in the art, and generally is an empirical calculation dependent upon probe length, washing temperature, and salt concentration. In general, longer probes require higher temperatures for proper annealing, while shorter probes need lower temperatures. Hybridization generally depends on the ability of denatured DNA to re-anneal when complementary strands are present in an environment below their melting temperature. The higher the degree of desired homology between the probe and hybridizable sequence, the higher the relative temperature that can be used. As a result, it follows that higher relative temperatures would tend to make the reaction conditions more stringent, while lower temperatures less so. For additional details and explanation of stringency of hybridization reactions, see Ausubel et al., Current Protocols in Molecular Biology,(Wiley Interscience, 1995).
- "Stringent conditions" or "high stringency conditions", as defined herein, typically: (1) employ low ionic strength solutions and high temperature for washing, for example 0.015 M sodium chloride/0.0015 M sodium citrate/0.1% sodium dodecyl sulfate at 50°C; (2) employ during hybridization a denaturing agent, such as formamide, for example, 50% (v/v) formamide with 0.1% bovine serum albumin/0.1% Ficoll/0.1% polyvinylpyrrolidone/50mM sodium phosphate buffer at pH 6.5 with 750 mM sodium chloride, 75 mM sodium citrate at 42°C; or (3) employ 50% formamide, 5 x SSC (0.75 M NaCl, 0.075 M sodium citrate), 50 mM sodium phosphate (pH 6.8), 0.1% sodium pyrophosphate, 5 x Denhardt's solution, sonicated salmon sperm DNA (50 µg/ml), 0.1% SDS, and 10% dextran sulfate at 42°C, with washes at 42°C in 0.2 x SSC (sodium chloride/sodium citrate) and 50% formamide at 55°C, followed by a high-stringency wash consisting of 0.1 x SSC containing EDTA at 55°C.
- "Moderately stringent conditions" may be identified as described by Sambrook et al., Molecular Cloning: A Laboratory Manual (Cold Spring Harbor Press, 1989), and include the use of washing solution and hybridization conditions (e.g., temperature, ionic strength and %SDS) less stringent that those described above. An example of moderately stringent condition is overnight incubation at 37°C in a solution comprising: 20% formamide, 5 x SSC (150 mM NaCl, 15 mM trisodium citrate), 50 mM sodium phosphate (pH 7.6), 5 x Denhardt's solution, 10% dextran sulfate, and 20 mg/ml denatured sheared salmon sperm DNA, followed by washing the filters in 1 x SSC at about 37-50°C. The skilled artisan will recognize how to adjust the temperature, ionic strength, etc. as necessary to accommodate factors such as probe length and the like.
- In the context of the present invention, reference to "at least one," "at least two," "at least five," etc. of the genes listed in any particular gene set means any one or any and all combinations of the genes listed.
- The terms "splicing" and "RNA splicing" are used interchangeably and refer to RNA processing that removes introns and joins exons to produce mature mRNA with continuous coding sequence that moves into the cytoplasm of an eukaryotic cell.
- In theory, the term "exon" refers to any segment of an interrupted gene that is represented in a mature RNA product (B. Lewin, Genes IV(Cell Press, 1990)). In theory the term "intron" refers to any segment of DNA that is transcribed but removed from within the transcript by splicing together the exons on either side of it. Operationally, exon sequences occur in the mRNA sequence of a gene as defined by Ref. SEQ ID numbers. Operationally, intron sequences are the intervening sequences within the genomic DNA of a gene, bracketed by exon sequences and usually having GT and AG splice consensus sequences at their 5' and 3' boundaries.
- A "computer-based system" refers to a system of hardware, software, and data storage medium used to analyze information. The minimum hardware of a patient computer-based system comprises a central processing unit (CPU), and hardware for data input, data output (e.g., display), and data storage. An ordinarily skilled artisan can readily appreciate that any currently available computer-based systems and/or components thereof are suitable for use in connection with the methods of the present disclosure. The data storage medium may comprise any manufacture comprising a recording of the present information as described above, or a memory access device that can access such a manufacture.
- To "record" data, programming or other information on a computer readable medium refers to a process for storing information, using any such methods as known in the art. Any convenient data storage structure may be chosen, based on the means used to access the stored information. A variety of data processor programs and formats can be used for storage, e.g. word processing text file, database format, etc.
- A "processor" or "computing means" references any hardware and/or software combination that will perform the functions required of it. For example, a suitable processor may be a programmable digital microprocessor such as available in the form of an electronic controller, mainframe, server or personal computer (desktop or portable). Where the processor is programmable, suitable programming can be communicated from a remote location to the processor, or previously saved in a computer program product (such as a portable or fixed computer readable storage medium, whether magnetic, optical or solid state device based). For example, a magnetic medium or optical disk may carry the programming, and can be read by a suitable reader communicating with each processor at its corresponding station.
- The present disclosure provides methods for assessing a patient's risk of recurrence of cancer, which methods comprise assaying an expression level of at least one gene, or its gene product, in a biological sample obtained from the patient. In some embodiments, the biological sample can be a tumor sample obtained from the kidney, or surrounding tissues, of the patient. In other embodiments, the biological sample is obtained from a bodily fluid, such as blood or urine.
- The present disclosure provides genes useful in the methods disclosed herein. The genes are listed in Tables 3a and 3b, wherein increased expression of genes listed in Table 3a is significantly associated with a lower risk of cancer recurrence, and increased expression of genes listed in Table 3b is significantly associated with a higher risk of cancer recurrence. In some embodiments, a co-expressed gene may be used in conjunction with, or substituted for, a gene listed in Tables 3a or 3b with which it co-expresses.
- The present disclosure further provides genes significantly associated, positively or negatively, with renal cancer recurrence after adjusting for clinical/pathologic covariates (stage, tumor grade, tumor size, nodal status, and presence of necrosis). For example, Table 8a lists genes wherein increased expression is significantly associated with lower risk of renal cancer recurrence after adjusting for clinical/pathologic covariates, and Table 8b lists genes wherein increased expression is significantly associated with a higher risk of renal cancer recurrence after adjusting for clinical/pathologic covariates. Of those genes listed in Tables 8a and 8b, 16 genes with significant association, positively or negatively, with good prognosis after adjusting for clinical/pathologic covariates and controlling the false discovery rate at 10% are listed in Table 9. One or more of these genes may be used separately, or in addition to, at least one of the genes listed in Tables 3a and 3b, to provide information concerning a patient's prognosis.
- The present disclosure also provides proxy genes that are useful for assessing the status of clinical and/or pathologic covariates for a cancer patient. Proxy genes for tumor stage are listed in Tables 4a and 4b, wherein increased expression of genes listed in Table 4a is significantly associated with higher tumor stage, and increased expression of genes listed in Table 4b is significantly associated with lower tumor stage. Proxy genes for tumor grade are listed in Tables 5a and 5b wherein increased expression of genes listed in Table 5a is significantly associated with higher tumor grade, and increased expression of genes listed in Table 5b is significantly associated with lower tumor grade. Proxy genes for the presence of necrosis are listed in Tables 6a and 6b, wherein expression of genes listed in Table 6a is significantly associated with the presence of necrosis, and increased expression of genes listed in Table 6b is significantly associated with the absence of necrosis. Proxy genes for nodal involvement are listed in Tables 7a and 7b wherein higher expression of genes listed in Table 7a are significantly associated with the presence of nodal invasion, and increased expression of genes listed in Table 7b are significantly associated with the absence of nodal invasion. One or more proxy genes may be used separately, or in addition to, at least one of the genes listed in Tables 3a and 3b, to provide information concerning a patient's prognosis. In some embodiments, at least two of the following proxy genes are used to provide information concerning the patient's prognosis: TSPAN7, TEK, LDB2, TIMP3, SHANK3, RGS5, KDR, SDPR, EPAS1, ID1, TGFBR2, FLT4, SDPR, ENDRB, JAG1, DLC1, and KL. In some embodiments, a co-expressed gene may be used in conjunction with, or substituted for, a proxy gene with which it co-expresses.
- The present disclosure also provides sets of genes in biological pathways that are useful for assessing the likelihood that a cancer patient is likely to have a positive clinical outcome, which sets of genes are referred to herein as "gene subsets". The gene subsets include angiogenesis, immune response, transport, cell adhesion/extracellular matrix, cell cycle, and apoptosis. In some embodiments, the angiogenesis gene subset includes ADD1, ANGPTL3, APOLD1, CEACAM1, EDNRB, EMCN, ENG, EPAS1, FLT1, JAG1, KDR, KL, LDB2, NOS3, NUDT6, PPAP2B, PRKCH, PTPRB, RGS5, SHANK3, SNRK, TEK, ICAM2, and VCAM1; the immune response gene subset includes CCL5, CCR7, CD8A, CX3CL1, CXCL10, CXCL9, HLA-DPB1, IL6, IL8, and SPP1, and; the transport gene subset includes AQP1 and SGK1; the cell adhesion/extracellular matrix gene subset includes ITGB1, A2M, ITGB5, LAMB1, LOX, MMP14, TGFBR2, TIMP3, and TSPAN7; the cell cycle gene subset includes BUB1, C13orf15, CCNB1, PTTG1, TPX2, LMNB1, and TUBB2A; the apoptosis gene subset includes CASP10; the early response gene subset includes EGR1 and CYR61; the metabolic signaling gene subset includes CA12, ENO2, UGCG, and SDPR; and the signaling gene subset includes ID1 and MAP2K3.
- The present disclosure also provides genes in biological pathways targeted by chemotherapy that are correlated, positively or negatively, to a risk of cancer recurrence. These genes include KIT, PDGFA, PDGFB, PDGFC, PDGFD, PDGFRb, KRAS, RAF1, MTOR, HIF1AN, VEGFA, VEGFB, and FLT4. In some embodiments, the chemotherapy is cytokine and/or anti-angiogenic therapy. In other embodiments, the chemotherapy is sunitinib, sorafenib, temsirolimus, bevacizumab, everolimus, and/or pazopanib.
- In some embodiments, a co-expressed gene may be used in conjunction with, or substituted for, a gene with which it co-expresses.
- In some embodiments, the cancer is renal cell carcinoma. In other embodiments, the cancer is clear cell renal cell carcinoma (ccRCC), papillary, chromophobe, collecting duct carcinoma, and/or medullary carcinoma.
- Various technological approaches for determination of expression levels of the disclosed genes are set forth in this specification, including, without limitation, reverse-transciption polymerase chain reaction (RT-PCR), microarrays, high-throughput sequencing, serial analysis of gene expression (SAGE), and Digital Gene Expression (DGE), which will be discussed in detail below. In particular aspects, the expression level of each gene may be determined in relation to various features of the expression products of the gene, including exons, introns, protein epitopes, and protein activity.
- The expression levels of genes identified herein may be measured in tumor tissue. For example, the tumor tissue may be obtained upon surgical resection of the tumor, or by tumor biopsy. The expression level of the identified genes may also be measured in tumor cells recovered from sites distant from the tumor, including circulating tumor cells or body fluid (e.g., urine, blood, blood fraction, etc.).
- The expression product that is assayed can be, for example, RNA or a polypeptide. The expression product may be fragmented. For example, the assay may use primers that are complementary to target sequences of an expression product and could thus measure full transcripts as well as those fragmented expression products containing the target sequence. Further information is provided in Tables A and B, which provide examples of sequences of forward primers, reverse primers, probes and amplicons generated by use of the primers.
- The RNA expression product may be assayed directly or by detection of a cDNA product resulting from a PCR-based amplification method, e.g., quantitative reverse transcription polymerase chain reaction (qRT-PCR). (See e.g., U.S. Pub. No.
US2006-0008809A1 .) Polypeptide expression product may be assayed using immunohistochemistry (IHC). Further, both RNA and polypeptide expression products may also be is assayed using microarrays. - Currently, of the expected clinical outcome for RCC patients is based on subjective determinations of a tumor's clinical and pathologic features. For example, physicians make decisions about the appropriate surgical procedures and adjuvant therapy based on a renal tumor's stage, grade, and the presence of necrosis. Although there are standardized measures to guide pathologists in making these decisions, the level of concordance between pathology laboratories is low. (See Al-Ayanti M et al. (2003) Arch Pathol Lab Med 127, 593-596) It would be useful to have a reproducible molecular assay for determining and/or confirming these tumor characteristics.
- In addition, standard clinical criteria, by themselves, have limited ability to accurately estimate a patient's prognosis. It would be useful to have a reproducible molecular assay to assess a patient's prognosis based on the biology of his or her tumor. Such information could be used for the purposes of patient counseling, selecting patients for clinical trials (e.g., adjuvant trials), and understanding the biology of renal cell carcinoma. In addition, such a test would assist physicians in making surgical and treatment recommendations based on the biology of each patient's tumor. For example, a genomic test could stratify RCC patients based on risk of recurrence and/or likelihood of long-term survival without recurrence (relapse, metastasis, etc.). There are several ongoing and planned clinical trials for RCC therapies, including adjuvant radiation and chemotherapies. It would be useful to have a genomic test able to identify high-risk patients more accurately than standard clinical criteria, thereby further enriching an adjuvant RCC population for study. This would reduce the number of patients needed for an adjuvant trial and the time needed for definitive testing of these new agents in the adjuvant setting.
- Finally, it would be useful to have a molecular assay that could predict a patient's likelihood to respond to treatment, such as chemotherapy. Again, this would facilitate individual treatment decisions and recruiting patients for clinical trials, and increase physician and patient confidence in making healthcare decisions after being diagnosed with cancer.
- The methods of the present disclosure are suited for the preparation of reports summarizing the expected clinical outcome resulting from the methods of the present disclosure. A "report," as described herein, is an electronic or tangible document that includes report elements that provide information of interest relating to a likelihood assessment and its results. A subject report includes at least a likelihood assessment, e.g., an indication as to the risk of recurrence for a subject with renal cell carcinoma. A subject report can be completely or partially electronically generated, e.g., presented on an electronic display (e.g., computer monitor). A report can further include one or more of: 1) information regarding the testing facility; 2) service provider information; 3) patient data; 4) sample data; 5) an interpretive report, which can include various information including: a) indication; b) test data, where test data can include a normalized level of one or more genes of interest, and 6) other features.
- The present disclosure thus provides for methods of creating reports and the reports resulting therefrom. The report may include a summary of the expression levels of the RNA transcripts, or the expression products of such RNA transcripts, for certain genes in the cells obtained from the patient's tumor. The report can include information relating to prognostic covariates of the patient. The report may include an estimate that the patient has an increased risk of recurrence. That estimate may be in the form of a score or patient stratifier scheme (e.g., low, intermediate, or high risk of recurrence). The report may include information relevant to assist with decisions about the appropriate surgery (e.g., partial or total nephrectomy) or treatment for the patient.
- Thus, in some embodiments, the methods of the present disclosure further include generating a report that includes information regarding the patient's likely clinical outcome, e.g. risk of recurrence. For example, the methods disclosed herein can further include a step of generating or outputting a report providing the results of a subject risk assessment, which report can be provided in the form of an electronic medium (e.g., an electronic display on a computer monitor), or in the form of a tangible medium (e.g., a report printed on paper or other tangible medium).
- A report that includes information regarding the patient's likely prognosis (e.g., the likelihood that a patient having renal cell carcinoma will have a good prognosis or positive clinical outcome in response to surgery and/or treatment) is provided to a user. An assessment as to the likelihood is referred to below as a "risk report" or, simply, "risk score." A person or entity that prepares a report ("report generator") may also perform the likelihood assessment. The report generator may also perform one or more of sample gathering, sample processing, and data generation, e.g., the report generator may also perform one or more of: a) sample gathering; b) sample processing; c) measuring a level of a risk gene; d) measuring a level of a reference gene; and e) determining a normalized level of a risk gene. Alternatively, an entity other than the report generator can perform one or more sample gathering, sample processing, and data generation.
- For clarity, it should be noted that the term "user," which is used interchangeably with "client," is meant to refer to a person or entity to whom a report is transmitted, and may be the same person or entity who does one or more of the following: a) collects a sample; b) processes a sample; c) provides a sample or a processed sample; and d) generates data (e.g., level of a risk gene; level of a reference gene product(s); normalized level of a risk gene for use in the likelihood assessment. In some cases, the person(s) or entity(ies) who provides sample collection and/or sample processing and/or data generation, and the person who receives the results and/or report may be different persons, but are both referred to as "users" or "clients" herein to avoid confusion. In certain embodiments, e.g., where the methods are completely executed on a single computer, the user or client provides for data input and review of data output. A "user" can be a health professional (e.g., a clinician, a laboratory technician, a physician (e.g., an oncologist, surgeon, pathologist), etc.).
- In embodiments where the user only executes a portion of the method, the individual who, after computerized data processing according to the methods of the present disclosure, reviews data output (e.g., results prior to release to provide a complete report, a complete, or reviews an "incomplete" report and provides for manual intervention and completion of an interpretive report) is referred to herein as a "reviewer." The reviewer may be located at a location remote to the user (e.g., at a service provided separate from a healthcare facility where a user may be located).
- Where government regulations or other restrictions apply (e.g., requirements by health, malpractice, or liability insurance), all results, whether generated wholly or partially electronically, are subjected to a quality control routine prior to release to the user.
- Numerous assay methods for measuring an expression level of a gene product are known in the art, including assay methods for measuring an expression level of a nucleic acid gene product (e.g., an mRNA), and assay methods for measuring an expression level of a polypeptide gene product.
- In general, methods of measuring a level of a nucleic acid gene product (e.g., an mRNA) include methods involving hybridization analysis of polynucleotides, and methods involving amplification of polynucleotides. Commonly used methods known in the art for the quantification of mRNA expression in a sample include northern blotting and in situ hybridization (See for example, Parker & Barnes, Methods in Molecular Biology 106:247-283 (1999)); RNAse protection assays (Hod, Biotechniques 13:852-854 (1992)); and reverse transcription polymerase chain reaction (RT-PCR) (Weis et al., Trends in Genetics 8:263-264 (1992)). Alternatively, antibodies may be employed that can recognize specific duplexes, including DNA duplexes, RNA duplexes, and DNA-RNA hybrid duplexes or DNA-protein duplexes. Representative methods for sequencing-based gene expression analysis include Serial Analysis of Gene Expression (SAGE), and gene expression analysis by massively parallel signature sequencing (MPSS).
- The level of a target nucleic acid can be measured using a probe that hybridizes to the target nucleic acid. The target nucleic acid could be, for example, a RNA expression product of a response indicator gene associated with response to a VEGF/VEGFR Inhibitor, or a RNA expression product of a reference gene. In some embodiments, the target nucleic acid is first amplified, for example using a polymerase chain reaction (PCR) method.
- A number of methods are available for analyzing nucleic acid mixtures for the presence and/or level of a specific nucleic acid. mRNA may be assayed directly or reverse transcribed into cDNA for analysis.
- In some embodiments, the method involves contacting a sample (e.g., a sample derived from a cancer cell) under stringent hybridization conditions with a nucleic acid probe and detecting binding, if any, of the probe to a nucleic acid in the sample. A variety of nucleic acid hybridization methods are well known to those skilled in the art, and any known method can be used. In some embodiments, the nucleic acid probe will be detectably labeled.
- Methods of amplifying (e.g., by PCR) nucleic acid, methods of performing primers extension, and methods of assessing nucleic acids are generally well known in the art. (See e.g., Ausubel, et al, Short Protocols in Molecular Biology, 3rd ed., Wiley & Sons, 1995 and Sambrook, et al, Molecular Cloning: A Laboratory Manual, Third Edition, (2001) Cold Spring Harbor, N.Y.)
- A target mRNA can be amplified by reverse transcribing the mRNA into cDNA, and then performing PCR (reverse transcription-PCR or RT-PCR). Alternatively, a single enzyme may be used for both steps as described in
U.S. Pat. No. 5,322,770 . - The fluorogenic 5' nuclease assay, known as the TaqMan® assay (Roche Molecular Systems, Inc.), is a powerful and versatile PCR-based detection system for nucleic acid targets. For a detailed description of the TaqMan assay, reagents and conditions for use therein, see, e.g., Holland et al., Proc. Natl. Acad. Sci., U.S.A. (1991) 88:7276-7280;
U.S. Pat. Nos. 5,538,848 ,5,723,591 , and5,876,930 , all incorporated herein by reference in their entireties. Hence, primers and probes derived from regions of a target nucleic acid as described herein can be used in TaqMan analyses to detect a level of target mRNA in a biological sample. Analysis is performed in conjunction with thermal cycling by monitoring the generation of fluorescence signals. (TaqMan is a registered trademark of Roche Molecular Systems.) - The fluorogenic 5' nuclease assay is conveniently performed using, for example, AmpliTaq Gold® DNA polymerase, which has endogenous 5' nuclease activity, to digest an internal oligonucleotide probe labeled with both a fluorescent reporter dye and a quencher (see, Holland et al., Proc Nat Acad Sci USA (1991) 88:7276-7280; and Lee et al., Nucl. Acids Res. (1993) 21:3761-3766). Assay results are detected by measuring changes in fluorescence that occur during the amplification cycle as the fluorescent probe is digested, uncoupling the dye and quencher labels and causing an increase in the fluorescent signal that is proportional to the amplification of target nucleic acid. (AmpliTaq Gold is a registered trademark of Roche Molecular Systems.)
- The amplification products can be detected in solution or using solid supports. In this method, the TaqMan probe is designed to hybridize to a target sequence within the desired PCR product. The 5' end of the TaqMan probe contains a fluorescent reporter dye. The 3' end of the probe is blocked to prevent probe extension and contains a dye that will quench the fluorescence of the 5' fluorophore. During subsequent amplification, the 5' fluorescent label is cleaved off if a polymerase with 5' exonuclease activity is present in the reaction. Excision of the 5' fluorophore results in an increase in fluorescence that can be detected.
- The first step for gene expression analysis is the isolation of mRNA from a target sample. The starting material is typically total RNA isolated from human tumors or tumor cell lines, and corresponding normal tissues or cell lines, respectively. Thus RNA can be isolated from a variety of primary tumors, including breast, lung, colon, prostate, brain, liver, kidney, pancreas, spleen, thymus, testis, ovary, uterus, head and neck, etc., tumor, or tumor cell lines, with pooled DNA from healthy donors. If the source of mRNA is a primary tumor, mRNA can be extracted, for example, from frozen or archived paraffin-embedded and fixed (e.g., formalin-fixed) tissue samples.
- General methods for mRNA extraction are well known in the art and are disclosed in standard textbooks of molecular biology, including Ausubel et al., Current Protocols of Molecular Biology (Wiley and Sons, 1997). Methods for RNA extraction from paraffin embedded tissues are disclosed, for example, M. Cronin, Am J. Pathol 164(1):35-42 (2004), the contents of which are incorporated herein. In particular, RNA isolation can be performed using kits and reagents from commercial manufacturers according to the manufacturer's instructions. For example, total RNA from cells in culture can be isolated using RNeasy® mini-columns (Qiagen GmbH Corp.). Other commercially available RNA isolation kits include MasterPure™ Complete DNA and RNA Purification Kit (EPICENTRE® Biotechnologies, Madison, WI), mirVana (Applied Biosystems, Inc.), and Paraffin Block RNA Isolation Kit (Ambion, Inc.). Total RNA from tissue samples can be isolated using RNA STAT-60™ (IsoTex Diagnostics, Inc., Friendswood TX). RNA prepared from tumor can be isolated, for example, by cesium chloride density gradient centrifugation. (RNeasy is a registered trademark of Qiagen GmbH Corp.; MasterPure is a trademark of EPICENTRE Biotechnologies; RNA STAT-60 is a trademark of Tel-Test Inc.)
- As RNA cannot serve as a template for PCR, the first step in gene expression profiling by RT-PCR is the reverse transcription of the RNA template into cDNA, followed by its exponential amplification in a PCR reaction. The two most commonly used reverse transcriptase enzymes are avilo myeloblastosis virus reverse transcriptase (AMV-RT) and Moloney murine leukemia virus reverse transcriptase (MMLV-RT). The reverse transcription step is typically primed using specific primers, random hexamers, or oligo-dT primers, depending on the circumstances and the goal of expression profiling. For example, extracted RNA can be reverse-transcribed using a GeneAmp® RNA PCR kit (Applied Biosystems Inc., Foster City, CA) according to the manufacturer's instructions. The derived cDNA can then be used as a template in a subsequent PCR reaction. (GeneAmp is a registered trademark of Applied Biosystems Inc.)
- Although the PCR step can use a variety of thermostable DNA-dependent DNA polymerases, it typically employs the Taq DNA polymerase, which has a 5'-3' nuclease activity but lacks a 3'-5' proofreading endonuclease activity. Thus, TaqMan PCR typically utilizes the 5'-nuclease activity of Taq or Tth polymerase to hydrolyze a hybridization probe bound to its target amplicon, but any enzyme with equivalent 5' nuclease activity can be used. Two oligonucleotide primers are used to generate an amplicon. A third oligonucleotide, or probe, is designed to detect nucleotide sequence located between the two PCR primers. The probe is non-extendible by Taq DNA polymerase enzyme, and is labeled with a reporter fluorescent dye and a quencher fluorescent dye. Any laser-induced emission from the reporter dye is quenched by the quenching dye when the two dyes are located close together as they are on the probe. During the amplification reaction, the Taq DNA polymerase enzyme cleaves the probe in a template-dependent manner. The resultant probe fragments disassociate in solution, and signal from the released reporter dye is free from the quenching effect of the second fluorophore. One molecule of reporter dye is liberated for each new molecule synthesized, and detection of the unquenched reporter dye provides the basis for quantitative interpretation of the data. (TaqMan is a registered mark of Applied Biosystems.)
- TaqMan RT-PCR can be performed using commercially available equipment, such as, for example, the ABI PRISM 7700® Sequence Detection System (Applied Biosystems, Foster City, CA, USA), or the Lightcycler® (Roche Molecular Biochemicals, Mannheim, Germany). In a preferred embodiment, the 5' nuclease procedure is run on a real-time quantitative PCR device such as the ABI PRISM 7900™ Sequence Detection System™. The system consists of a thermocycler, laser, charge-coupled device (CCD), camera and computer. The system amplifies samples in a 96-well format on a thermocycler. During amplification, laser-induced fluorescent signal is collected in real-time through fiber optics cables for all 96 wells, and detected at the CCD. The system includes software for running the instrument and for analyzing the data. (PRISM 7700 is a registered trademark of Applied Biosystems; Lightcycler is a registered trademark of Roche Diagnostics GmbH LLC.)
- 5'-Nuclease assay data are initially expressed as Ct, or the threshold cycle. As discussed above, fluorescence values are recorded during every cycle and represent the amount of product amplified to that point in the amplification reaction. The point when the fluorescent signal is first recorded as statistically significant is the threshold cycle (Ct).
- To minimize the effect of sample-to-sample variation, quantitative RT-PCR is usually performed using an internal standard, or one or more reference genes. The ideal internal standard is expressed at a constant level among different tissues, and is unaffected by the experimental treatment. RNAs that can be used to normalize patterns of gene expression include, e.g., mRNAs for the reference genes glyceraldehyde-3-phosphate-dehydrogenase (GAPDH) and β-actin.
- A more recent variation of the RT-PCR technique is the real time quantitative PCR, which measures PCR product accumulation through a dual-labeled fluorogenic probe (i.e., TaqMan® probe). Real time PCR is compatible both with quantitative competitive PCR, where internal competitor for each target sequence is used for normalization, and with quantitative comparative PCR using a normalization gene contained within the sample, or a reference gene for RT-PCR. For further details see, e.g., Held et al., Genome Research 6:986-994 (1996).
- Factors considered in PCR primer design include primer length, melting temperature (Tm), and G/C content, specificity, complementary primer sequences, and 3'-end sequence. In general, optimal PCR primers are generally 17-30 bases in length, and contain about 20-80%, such as, for example, about 50-60% G+C bases. Tm's between 50 and 80 °C, e.g., about 50 to 70 °C can be used.
- For further guidelines for PCR primer and probe design see, e.g., Dieffenbach, C.W. et al., "General Concepts for PCR Primer Design" in: PCR Primer, A Laboratory Manual, Cold Spring Harbor Laboratory Press, New York, 1995, pp. 133-155; Innis and Gelfand, "Optimization of PCRs" in: PCR Protocols, A Guide to Methods and Applications, CRC Press, London, 1994, pp. 5-11; and Plasterer, T.N. PrimerSelect: Primer and probe design. Methods Mol. Biol. 70:520-527 (1997), the entire disclosures of which are hereby expressly incorporated by reference.
- Other suitable methods for assaying a level of a nucleic acid gene product include, e.g., microarrays; serial analysis of gene expression (SAGE); MassARRAY® analysis; digital gene expression (DGE) (J. Marioni, Genome Research 18(9):1509-1517 (2008), gene expression by massively parallel signature sequencing (see, e.g., Ding and Cantor, Proc. Nat'l Acad Sci 100:3059-3064 (2003); differential display (Liang and Pardee, Science 257:967-971 (1992)); amplified fragment length polymorphism (iAFLP) (Kawamoto et al., Genome Res. 12:1305-1312 (1999)); BeadArray™ technology (Illumina, San Diego, CA; Oliphant et al., Discovery of Markers for Disease (Supplement to Biotechniques), June 2002; Ferguson et al., Analytical Chemistry 72:5618 (2000)); BeadsArray for Detection of Gene Expression (BADGE), using the commercially available Luminex100 LabMAP system and multiple color-coded microspheres (Luminex Corp., Austin, TX) in a rapid assay for gene expression (Yang et al., Genome Res. 11:1888-1898 (2001)); and high coverage expression profiling (HiCEP) analysis (Fukumura et al., Nucl. Acids. Res. 31(16) e94 (2003)).
- Assays to measure the amount of an RNA gene expression product can be targeted to intron sequences or exon sequences of the primary transcript. The amount of a spliced intron that is measured in human tissue samples is generally indicative of the amount of a corresponding exon (i.e. an exon from the same gene) present in the samples. Polynucleotides that consist of or are complementary to intron sequences can be used, e.g., in hybridization methods or amplification methods to assay the expression level of response indicator genes.
- Methods of measuring a level of a polypeptide gene product are known in the art and include antibody-based methods such as enzyme-linked immunoabsorbent assay (ELISA), radioimmunoassay (RIA), protein blot analysis, immunohistochemical analysis and the like. The measure of a polypeptide gene product may also be measured in vivo in the subject using an antibody that specifically binds a target polypeptide, coupled to a paramagnetic label or other label used for in vivo imaging, and visualizing the distribution of the labeled antibody within the subject using an appropriate in vivo imaging method, such as magnetic resonance imaging. Such methods also include proteomics methods such as mass spectrometric methods, which are known in the art.
- Methods of isolating RNA for expression analysis from blood, plasma and serum (See for example, Tsui NB et al. (2002) 48,1647-53 and references cited therein) and from urine (See for example, Boom R et al. (1990) J Clin Microbiol. 28, 495-503 and reference cited therein) have been described.
- The steps of a representative protocol for profiling gene expression using fixed, paraffin-embedded tissues as the RNA source, including mRNA isolation, purification primer extension and amplification are provided in various published journal articles. (See, e.g., T.E. Godfrey et al,. J. Molec. Diagnostics 2: 84-91 (2000); K. Specht et al., Am. J. Pathol. 158: 419-29 (2001), M. Cronin, et al., Am J Pathol 164:35-42 (2004)).
- The methods and systems described herein can be implemented in numerous ways. In one embodiment of particular interest, the methods involve use of a communications infrastructure, for example the Internet. Several embodiments are discussed below. It is also to be understood that the present disclosure may be implemented in various forms of hardware, software, firmware, processors, or a combination thereof. The methods and systems described herein can be implemented as a combination of hardware and software. The software can be implemented as an application program tangibly embodied on a program storage device, or different portions of the software implemented in the user's computing environment (e.g., as an applet) and on the reviewer's computing environment, where the reviewer may be located at a remote site associated (e.g., at a service provider's facility).
- For example, during or after data input by the user, portions of the data processing can be performed in the user-side computing environment. For example, the user-side computing environment can be programmed to provide for defined test codes to denote a likelihood "risk score," where the score is transmitted as processed or partially processed responses to the reviewer's computing environment in the form of test code for subsequent execution of one or more algorithms to provide a results and/or generate a report in the reviewer's computing environment. The risk score can be a numerical score (representative of a numerical value) or a non-numerical score representative of a numerical value or range of numerical values (e.g., low, intermediate, or high).
- The application program for executing the algorithms described herein may be uploaded to, and executed by, a machine comprising any suitable architecture. In general, the machine involves a computer platform having hardware such as one or more central processing units (CPU), a random access memory (RAM), and input/output (I/O) interface(s). The computer platform also includes an operating system and microinstruction code. The various processes and functions described herein may either be part of the microinstruction code or part of the application program (or a combination thereof) that is executed via the operating system. In addition, various other peripheral devices may be connected to the computer platform such as an additional data storage device and a printing device.
- As a computer system, the system generally includes a processor unit. The processor unit operates to receive information, which can include test data (e.g., level of a risk gene, level of a reference gene product(s); normalized level of a gene; and may also include other data such as patient data. This information received can be stored at least temporarily in a database, and data analyzed to generate a report as described above.
- Part or all of the input and output data can also be sent electronically; certain output data (e.g., reports) can be sent electronically or telephonically (e.g., by facsimile, e.g., using devices such as fax back). Exemplary output receiving devices can include a display element, a printer, a facsimile device and the like. Electronic forms of transmission and/or display can include email, interactive television, and the like. In an embodiment of particular interest, all or a portion of the input data and/or all or a portion of the output data (e.g., usually at least the final report) are maintained on a web server for access, preferably confidential access, with typical browsers. The data may be accessed or sent to health professionals as desired. The input and output data, including all or a portion of the final report, can be used to populate a patient's medical record which may exist in a confidential database at the healthcare facility.
- A system for use in the methods described herein generally includes at least one computer processor (e.g., where the method is carried out in its entirety at a single site) or at least two networked computer processors (e.g., where data is to be input by a user (also referred to herein as a "client") and transmitted to a remote site to a second computer processor for analysis, where the first and second computer processors are connected by a network, e.g., via an intranet or internet). The system can also include a user component(s) for input; and a reviewer component(s) for review of data, generated reports, and manual intervention. Additional components of the system can include a server component(s); and a database(s) for storing data (e.g., as in a database of report elements, e.g., interpretive report elements, or a relational database (RDB) which can include data input by the user and data output. The computer processors can be processors that are typically found in personal desktop computers (e.g., IBM, Dell, Macintosh), portable computers, mainframes, minicomputers, or other computing devices.
- The networked client/server architecture can be selected as desired, and can be, for example, a classic two or three tier client server model. A relational database management system (RDMS), either as part of an application server component or as a separate component (RDB machine) provides the interface to the database.
- In one example, the architecture is provided as a database-centric client/server architecture, in which the client application generally requests services from the application server which makes requests to the database (or the database server) to populate the report with the various report elements as required, particularly the interpretive report elements, especially the interpretation text and alerts. The server(s) (e.g., either as part of the application server machine or a separate RDB/relational database machine) responds to the client's requests.
- The input client components can be complete, stand-alone personal computers offering a full range of power and features to run applications. The client component usually operates under any desired operating system and includes a communication element (e.g., a modem or other hardware for connecting to a network), one or more input devices (e.g., a keyboard, mouse, keypad, or other device used to transfer information or commands), a storage element (e.g., a hard drive or other computer-readable, computer-writable storage medium), and a display element (e.g., a monitor, television, LCD, LED, or other display device that conveys information to the user). The user enters input commands into the computer processor through an input device. Generally, the user interface is a graphical user interface (GUI) written for web browser applications.
- The server component(s) can be a personal computer, a minicomputer, or a mainframe and offers data management, information sharing between clients, network administration and security. The application and any databases used can be on the same or different servers.
- Other computing arrangements for the client and server(s), including processing on a single machine such as a mainframe, a collection of machines, or other suitable configuration are contemplated. In general, the client and server machines work together to accomplish the processing of the present disclosure.
- Where used, the database(s) is usually connected to the database server component and can be any device that will hold data. For example, the database can be a any magnetic or optical storing device for a computer (e.g., CDROM, internal hard drive, tape drive). The database can be located remote to the server component (with access via a network, modem, etc.) or locally to the server component.
- Where used in the system and methods, the database can be a relational database that is organized and accessed according to relationships between data items. The relational database is generally composed of a plurality of tables (entities). The rows of a table represent records (collections of information about separate items) and the columns represent fields (particular attributes of a record). In its simplest conception, the relational database is a collection of data entries that "relate" to each other through at least one common field.
- Additional workstations equipped with computers and printers may be used at point of service to enter data and, in some embodiments, generate appropriate reports, if desired. The computer(s) can have a shortcut (e.g., on the desktop) to launch the application to facilitate initiation of data entry, transmission, analysis, report receipt, etc. as desired.
- The present disclosure also contemplates a computer-readable storage medium (e.g. CD-ROM, memory key, flash memory card, diskette, etc.) having stored thereon a program which, when executed in a computing environment, provides for implementation of algorithms to carry out all or a portion of the results of a response likelihood assessment as described herein. Where the computer-readable medium contains a complete program for carrying out the methods described herein, the program includes program instructions for collecting, analyzing and generating output, and generally includes computer readable code devices for interacting with a user as described herein, processing that data in conjunction with analytical information, and generating unique printed or electronic media for that user.
- Where the storage medium provides a program that provides for implementation of a portion of the methods described herein (e.g., the user-side aspect of the methods (e.g., data input, report receipt capabilities, etc.)), the program provides for transmission of data input by the user (e.g., via the internet, via an intranet, etc.) to a computing environment at a remote site. Processing or completion of processing of the data is carried out at the remote site to generate a report. After review of the report, and completion of any needed manual intervention, to provide a complete report, the complete report is then transmitted back to the user as an electronic document or printed document (e.g., fax or mailed paper report). The storage medium containing a program according to the present disclosure can be packaged with instructions (e.g., for program installation, use, etc.) recorded on a suitable substrate or a web address where such instructions may be obtained. The computer-readable storage medium can also be provided in combination with one or more reagents for carrying out response likelihood assessment (e.g., primers, probes, arrays, or other such kit components).
- In order to minimize expression measurement variations due to non-biological variations in samples, e.g., the amount and quality of expression product to be measured, raw expression level data measured for a gene product (e.g., cycle threshold (Ct) measurements obtained by qRT-PCR) may be normalized relative to the mean expression level data obtained for one or more reference genes. In one approach to normalization, a small number of genes are used as reference genes; the genes chosen for reference genes typically show a minimal amount of variation in expression from sample to sample and the expression level of other genes is compared to the relatively stable expression of the reference genes. In the global normalization approach, the expression level of each gene in a sample is compared to an average expression level in the sample of all genes in order to compare the expression of a particular gene to the total amount of material.
- Unprocessed data from qRT-PCR is expressed as cycle threshold (Ct), the number of amplification cycles required for the detectable signal to exceed a defined threshold. High Ct is indicative of low expression since more cycles are required to detect the amplification product. Normalization may be carried out such that a one-unit increase in normalized expression level of a gene product generally reflects a 2-fold increase in quantity of expression product present in the sample. For further information on normalization techniques applicable to qRT-PCR data from tumor tissue, see, e.g., Silva S et al. (2006) ; de Kok J et al. (2005) . Gene expression may then be standardized by dividing the normalized gene expression by the standard deviation of expression across all patients for that particular gene. By standardizing normalized gene expression the hazard ratios across genes are comparable and reflect the relative risk for each standard deviation of gene expression.
- One skilled in the art will recognize that variety of statistical methods are available that are suitable for comparing the expression level of a gene (or other variable) in two groups and determining the statistical significance of expression level differences that are found. (See e.g., H. Motulsky, Intuitive Biostatistics(Oxford University Press, 1995); D. Freedman, Statistics (W.W. Norton & Co, 4th Ed., 2007). For example, a Cox proportional hazards regression model may be fit to a particular clinical time-to-event endpoint (e.g., RFI, OS). One assumption of the Cox proportional hazards regression model is the proportional hazards assumption, i.e. the assumption that model effects multiply the underlying hazard. Assessments of model adequacy may be performed including, but not limited to, examination of the cumulative sum of martingale residuals. One skilled in the art would recognize that there are numerous statistical methods that may be used (e.g., Royston and Parmer (2002), smoothing spline, etc.) to fit a flexible parametric model using the hazard scale and the Weibull distribution with natural spline smoothing of the log cumulative hazards function, with effects allowed to be time-dependent. (See, P. Royston, M. Parmer, Statistics in Medicine 21(15:2175-2197 (2002).) The relationship between recurrence risk and (1) recurrence risk groups; and (2) clinical/pathologic covariates (e.g., tumor stage, tumor grade, presence of necrosis, lymphatic or vascular invasion, etc.) may also be tested for significance. Additional examples of models include logistic or ordinal logistic regression models in which the association between gene expression and dichotomous (for logistic) or ordinal (for ordinal logistic) clinical endpoints (i.e. stage, necrosis, grade) may be evaluated. (See e.g., D. Hosmer and S. Lemeshow, Applied Logistic Regression (John Wiley and Sons, 1989).
- In an exemplary embodiment, results were adjusted for multiple hypothesis tests, and allowed for a 10% false discovery rate (FDR), using Storey's procedure, and using TDRAS with separate classes (M. Crager, Gene identification using true discovery rate degree of association sets and estimates corrected for regression to the mean, Statistics in Medicine (published online Dec. 2009). In another embodiment, genes with significant association with RFI were identified through cross-validation techniques in which forward stepwise Cox PH regression was employed using a subset of factors identified through Principal Component Analysis (PCA).
- Methods for calculating correlation coefficients, particularly the Pearson product-moment correlation coefficient are known in the art. (See e.g., J. Rodgers and W. Nicewander, The American Statistician, 42, 59-66 (1988); H. Motulsky, H., Intuitive Biostatistics (Oxford University Press, 1995).To perform particular biological processes, genes often work together in a concerted way, i.e. they are co-expressed. Co-expressed gene groups identified for a disease process like cancer can serve as biomarkers for disease progression and response to treatment. Such co-expressed genes can be assayed in lieu of, or in addition to, assaying of the prognostic and/or predictive gene with which they are co-expressed.
- One skilled in the art will recognize that many co-expression analysis methods now known or later developed will fall within the scope and spirit of the present invention. These methods may incorporate, for example, correlation coefficients, co-expression network analysis, clique analysis, etc., and may be based on expression data from RT-PCR, microarrays, sequencing, and other similar technologies. For example, gene expression clusters can be identified using pair-wise analysis of correlation based on Pearson or Spearman correlation coefficients. (See, e.g., Pearson K. and Lee A., ); C. Spearman, Amer. J. Psychol 15:72-101 (1904); J. Myers, A. Well, Research Design and Statistical Analysis, p. 508 (2nd Ed., 2003).) In general, a correlation coefficient of equal to or greater than 0.3 is considered to be statistically significant in a sample size of at least 20. (See, e.g., G. Norman, D. Streiner, Biostatistics: The Bare Essentials, 137-138 (3rd Ed. 2007).)
- All aspects of the present disclosure may also be practiced such that a limited number of additional genes that are co-expressed with the disclosed genes, for example as evidenced by high Pearson correlation coefficients, are included in a prognostic or predictive test in addition to and/or in place of disclosed genes.
- Having described the invention, the same will be more readily understood through reference to the following Examples, which are provided by way of illustration, and are not intended to limit the invention in any way. All citations throughout the disclosure are hereby expressly incorporated by reference.
- Two studies were performed to demonstrate the feasibility of gene expression profiling from renal tumors obtained from renal cell carcinoma patients. (See Abstract by M. Zhou, et al., Optimized RNA extraction and RT-PCR assays provide successful molecular analysis on a wide variety of archival fixed tissues, AACR Annual Meeting (2007)).
- Renal tumor tissue was obtained from approximately 1200 patients from the Cleveland Clinic Foundation (CCF) database. This database consists of patients who were diagnosed with renal carcinoma, clear cell type, stage I, II and III between the years of 1985 and 2003, who had available paraffin-embedded tumor (PET) blocks and adequate clinical follow-up, and who were not treated with adjuvant/neo-adjuvant systemic therapy. Patients with inherited VHL disease or bilateral tumors were also excluded. Tumors were graded using (1) Fuhrman grading system as noted in the World Health Organization Classification of Tumours: Pathology and Genetics: Tumours of the Urinary System and Male Genital Organs; and (2) the modified Fuhrman grading system (Table 1). In general, if no nodal involvement is expected or observed for patients, inspection of nodal involvement is not conducted and Nx is noted. In this study, Nx was treated as N0 for purposes of stage classification. The expression of 732 genes was quantitatively assessed for each patient tissue sample.
Table 1: Fuhrman Grading Systems Fuhrman Grade (Modified) Fuhrman Grade (WHO) 1 Nuclei small as lymphocyte with condensed chromatin Small, round, uniform nuclei (∼ 10 um); nucleoli absent or inconspicuous (at 400x) 2 Nuclei both small as lymphocytes with condensed chromatin and other nuclei demonstrating enlarged, open chromatin Larger nuclei (∼ 15um) with irregular outline; small nucleoli present (at 400x) 3 All nuclei enlarged with open chromatin Larger nuclei (approaching 20um) with more irregular outline; prominent nucleoli present (at 100x) 4 Large bizarre nuclei Grade 3 features with pleomorphic or multilobed nuclei, with or without spindle cells -
- (1) Patients who underwent nephrectomy at CCF and who have a minimum of 6 months clinical follow-up or have recurrent RCC, documented in the clinical chart, database or registry.
- (2) Diagnosed with RCC, clear cell type, stage I, II, or III.
- (3) Renal blocks fixed in Formalin, Hollandes fluid or Zenkers fixative.
-
- (1) No tumor block available from initial diagnosis in the Cleveland Clinic archive.
- (2) No tumor or very little tumor (<5% of invasive cancer cell area) in block as assessed by examination of the Hollandes and/or hematoxylin and eosin stained (H&E) slide.
- (3) High cycle threshold (Ct) values of reference genes. All samples regardless of their RNA amount will be tested by RT-qPCR, but only plates where the average Ct of reference genes is less than 35 will be analyzed.
- (4) Patients with inherited VHL disease and/or bilateral tumors
- (5) Patients who received neo-adjuvant or adjuvant systemic therapy
- Two separate pathology laboratories conducted analyses of several clinical and pathologic factors using the same standardized measures. The level of concordance, by covariate, is provided in Table 2, below. For purposes of the statistical analysis, the determination of only one of the central laboratories was used.
Table 2: Concordance between two central laboratories for clinical/pathologic covariates Covariate Method of analysis Concordance Presence of necrosis Microscopic technique per Leibovich BC et al. (2003) Cancer 97(3), 1663-1671. 47% Tumor grade Fuhrman 65% - The RNA from paraffin embedded tissue (PET) samples obtained from 942 patients who met all inclusion/exclusion criteria was extracted using protocols optimized for fixed renal tissue and perform molecular assays of quantitative gene expression using TaqMan® RT-PCR. RT-PCR was performed with RNA input at 1.0 ng per 5 µL-reaction volume using two 384 well plates.
- RT-PCR analysis of PET samples was conducted using 732 genes. These genes were evaluated for association with the primary and secondary endpoints, recurrence-free interval (RFI), disease-free survival (DFS) and overall survival (OS).
- All primary and secondary analyses were conducted on reference normalized gene expression levels using the mean of the reference genes for normalization. Three normalization schemes were tested using AAMP, ARF1, ATP5E, EEF1A1, GPX1, RPS23, SDHA, UBB, and RPLP1. Some or all of the other genes in the test panel were used in analyses of alternative normalization schemes.
- Of the 732 genes, 647 were deemed evaluable for further consideration. The outcome analyses of the 647 evaluable genes were adjusted for multiple hypothesis tests, by allowing for a 10% false discovery rate (FDR), using Storey's procedure, and using True Discovery Rate Degree of Association Sets (TDRDAS) with separate classes (M. Crager, Gene identification using true discovery rate degree of association sets and estimates corrected for regression to the mean, Statistics in Medicine 29:33-45 (2009)). Unadjusted for baseline covariates and without controlling the FDR, a subset of 448 (69%) of genes were identified as significantly associated with RFI (p≤0.05). Additional analysis was conducted using a supervised principal component analysis (PCA) on a subset of 188 genes that have maximum lower bound (MLB) > 1.2 using TDRDAS analysis, controlling the FDR but not taking into account the separate classes. The top 10 factors were modified by keeping the genes with high factor loadings (loading/max loading > 0.7) were kept. The modified top 10 factors were put into a 5-fold cross validation to assess performance of the gene groups and identify factors that were appearing most frequently.
- Genes that had a significant association (p ≤ 0.05) with risk of recurrence are listed in Tables 3a and 3b, wherein genes that are positively associated with a good prognosis (i.e., increased expression indicates a lower risk of recurrence) are listed in Table 3a. Genes that are negatively associated with a good prognosis (i.e., increased expression indicates a higher risk of recurrence) are listed in Table 3b. Genes that were associated, positively or negatively, with a good prognosis but not associated with clinical/pathologic covariates are BBC3, CCR7, CCR4, and VCAN. In addition, genes associated positively with a good prognosis after adjusting for clinical and pathologic covariates (stage, tumor grade, tumor size, nodal status, and presence of necrosis) are listed in Table 8a. Genes associated negatively with a good prognosis after adjusting for clinical/pathologic covariates are listed in Table 8b. Of those genes listed in Tables 8a and 8b, 16 genes with significant association, positively or negatively, with a good prognosis after adjusting for clinical and pathologic covariates and controlling the false discovery rate at 10% are listed in Table 9.
- For the majority of these genes significantly associated with RFI (p≤0.05) (82%), increased expression is associated with a good prognosis. Most of the genes significantly associated with RFI showed consistency between (1) between stages (I-III); (2) primary and secondary endpoints (RFI and OS). See, e.g.,
Figures 1 and2 , respectively. - From this analysis, certain gene subsets emerged as significantly associated with recurrence and overall survival. For example, increased expression of angiogenesis genes (e.g., EMCN, PPAP2B, NOS3, NUDT6, PTPRB, SNRK, APOLD1, PRKCH, and CEACAM1), cell adhesion/extracellular matrix genes (e.g., ITGB5, ITGB1, A2M, TIMP3), immune response genes (e.g., CCL5, CCXL9, CCR7, IL8, IL6, and CX3CL1), cell cycle (e.g., BUB1, TPX2), apoptosis (e.g., CASP10), and transport genes (AQP1) were strongly associated, positively or negatively, with RFI.
- Also, certain genes that are associated with pathway targets for renal cancer drugs (sunitinib, sorafenib, temsirolimus, bevacizumab, everolimus, pazopanib) were identified as having a significant association with outcome, including: KIT, PDGFA, PDGFB, PDGFC, PDGFD, PDGFRb, KRAS, RAF1, MTOR, HIF1AN, VEGFA, VEGFB, and FLT4.
- It was determined that the presence of necrosis in these tumors was associated with a higher risk of recurrence, at least in the first 4 years after surgery. See
Figure 3 . However, the prognostic effect of necrosis afteryear 4 was negligible. - It was also determined that expression of certain genes was correlated, positively or negatively, with pathologic and/or clinical factors ("proxy genes"). For example, increased expression of the proxy genes listed in Tables 4a-7b correlate, positively or negatively, with tumor stage, tumor grade, presence of necrosis, and nodal invasion, respectively. In Tables 4a-7b, gene expression was normalized and then standardized such that the odds ratio (OR) reflects a one standard deviation change in gene expression.
- From these, key genes were identified as good proxies for baseline covariates (stage, grade, necrosis), including TSPAN7, TEK, LDB2, TIMP3, SHANK3, RGS5, KDR, SDPR, EPAS1, ID1, TGFBR2, FLT4, SDPR, ENDRB, JAG1, DLC1, and KL. Several of these genes are in the hypoxia-induced pathway: SHANK3, RGS5, EPAS1, KDR, JAG1, TGFBR2, FLT4, SDPR, DLC1, EDNRB.
-
Figures 4 - 7 provide a comparison of patient stratification (Low, Intermediate, or High Risk) obtained by applying the Mayo prognostic tool (described in Leibovich et al. "prediction of progression after radical nephrectomy for patients with clear cell renal cell carcinoma" (2003) Cancer 97:1663-1671) CCF expression data. As shown inFigure 4 , the Mayo prognostic tool alone provides for stratification into three populations Low Risk (93% recurrence free at 5 years), Intermediate Risk (79% recurrence free at 5 years), and High Risk (36% recurrence free at 5 years). In contrast, use of expression data from even one gene (as exemplified by EMCN (Fig. 5 .), AQP1 (Fig. 6 ), or PPAP2B (Fig. 7 )) allowed for more detailed stratification of patients according to risk.Table 3a: Genes for which increased expression is associated with lower risk of cancer recurrence (p-value ≤ .05) Gene Official Symbol Univariate Cox Analyses (No Covariate Adjustment) with RFI Gene Official Symbol Univariate Cox Analyses (No Covariate Adjustment) with RFI p-value for HR HR p-value for HR HR YB-1.2 YBX1 <0.0001 0.75 IGF1R.3 IGF1R <0.0001 0.58 XIAP.1 XIAP 0.0009 0.81 IFI27.1 IFI27 0.0205 0.85 WWOX.5 WWOX <0.0001 0.71 ID3.1 ID3 <0.0001 0.69 VWF.1 VWF <0.0001 0.61 ID2.4 ID2 <0.0001 0.75 VEGF.1 VEGFA <0.0001 0.75 ID1.1 ID1 <0.0001 0.55 VCAM1.1 VCAM1 <0.0001 0.66 ICAM2.1 ICAM2 <0.0001 0.64 USP34.1 USP34 0.0003 0.79 HYAL2.1 HYAL2 <0.0001 0.60 UMOD.1 UMOD <0.0001 0.68 HYAL1.1 HYAL1 <0.0001 0.58 UGCG.1 UGCG <0.0001 0.71 HSPG2.1 HSPG2 <0.0001 0.60 UBB.1 UBB <0.0001 0.62 HSD11B2.1 HSD11B2 <0.0001 0.63 UBE1C.1 UBA3 0.0003 0.79 Hepsin.1 HPN 0.0001 0.76 TS.1 TYMS 0.0056 0.83 HPCAL1.1 HPCAL1 0.0031 0.82 tusc4.2 TUSC4 <0.0001 0.76 HMGB1.1 HMGB1 <0.0001 0.67 TSPAN7.2 TSPAN7 <0.0001 0.52 HLA-DPB1.1 HLA-DPB1 <0.0001 0.70 TSC2.1 TSC2 0.0043 0.82 HIF1AN.1 HIF1AN <0.0001 0.77 TSC1.1 TSC1 <0.0001 0.71 HDAC1.1 HDAC1 0.0003 0.78 P53.2 TP53 0.0008 0.81 HAVCR1.1 HAVCR1 0.0003 0.79 TOP2B.2 TOP2B 0.0001 0.80 HADH.1 HADH <0.0001 0.68 TNFSF12.1 TNFSF12 <0.0001 0.68 GZMA.1 GZMA 0.0125 0.84 TRAIL.1 TNFSF10 0.0065 0.83 GSTp.3 GSTP1 <0.0001 0.76 TNFRSF11B.1 TNFRSF11B 0.0002 0.78 GSTM3.2 GSTM3 <0.0001 0.70 TNFRSF10D.1 TNFRSF10D <0.0001 0.76 GSTM1.1 GSTM1 <0.0001 0.72 DR5.2 TNFRSF10B <0.0001 0.75 GRB7.2 GRB7 <0.0001 0.74 TNFAIP6.1 TNFAIP6 0.0005 0.79 GPX3.1 GPX3 <0.0001 0.75 TMEM47.1 TMEM47 <0.0001 0.57 GJA1.1 GJA1 0.0049 0.84 TMEM27.1 TMEM27 <0.0001 0.58 GFRA1.1 GFRA1 0.0003 0.77 TLR3.1 TLR3 <0.0001 0.72 GCLC.3 GCLC <0.0001 0.68 TIMP3.3 TIMP3 <0.0001 0.50 GBP2.2 GBP2 0.0156 0.85 TIMP2.1 TIMP2 <0.0001 0.73 GATM.1 GATM <0.0001 0.66 THBS1.1 THBS1 0.0002 0.79 GATA3.3 GATA3 0.0001 0.75 TGFBR2.3 TGFBR2 <0.0001 0.54 FOS.1 FOS <0.0001 0.74 Table 3a: Genes for which increased expression is associated with lower risk of cancer recurrence (p-value ≤.05) Gene Official Symbol Univariate Cox Analyses (No Covariate Adjustment) with RFI Gene Official Symbol Univariate Cox Analyses (No Covariate Adjustment) with RFI p-value for HR HR p-value for HR HR TGFBR1.1 TGFBR1 <0.0001 0.71 FOLR1.1 FOLR1 0.0003 0.79 TGFB2.2 TGFB2 <0.0001 0.65 FLT4.1 FLT4 <0.0001 0.54 TGFA.2 TGFA <0.0001 0.70 FLT3LG.1 FLT3LG 0.0001 0.73 TEK.1 TEK <0.0001 0.47 FLT1.1 FLT1 <0.0001 0.59 TCF4.1 TCF4 <0.0001 0.62 FILIP1.1 FILIP1 <0.0001 0.72 TAP1.1 TAP1 0.0024 0.82 FIGF.1 FIGF 0.0014 0.76 TAGLN.1 TAGLN <0.0001 0.70 FHL1.1 FHL1 <0.0001 0.68 TACSTD2.1 TACSTD2 <0.0001 0.72 FHIT.1 FHIT <0.0001 0.73 SUCLG1.1 SUCLG1 <0.0001 0.72 FH.1 FH <0.0001 0.73 STK11.1 STK11 <0.0001 0.76 FGFR2 isoform 1.1 FGFR2 <0.0001 0.70 STAT5B.2 STAT5B <0.0001 0.71 FGFR1.3 FGFR1 0.0001 0.77 STAT5A.1 STAT5A <0.0001 0.72 FGF2.2 FGF2 <0.0001 0.73 STAT3.1 STAT3 0.0016 0.80 FGF1.1 FGF1 0.0015 0.78 SPRY1.1 SPRY1 <0.0001 0.68 FDPS.1 FDPS <0.0001 0.69 SPARCL1.1 SPARCL1 <0.0001 0.71 FBXW7.1 FBXW7 0.0001 0.75 SPARC.1 SPARC 0.0009 0.80 fas.1 FAS <0.0001 0.73 SOD1.1 SOD1 0.0114 0.84 FABP1.1 FABP1 0.0455 0.86 SNRK.1 SNRK <0.0001 0.54 ESRRG.3 ESRRG 0.0008 0.79 SNAI1.1 SNAI1 0.0055 0.82 ERG.1 ERG <0.0001 0.60 MADH4.1 SMAD4 <0.0001 0.60 ERCC1.2 ERCC1 <0.0001 0.78 MADH2.1 SMAD2 <0.0001 0.64 ErbB3.1 ERBB3 0.0001 0.77 SLC34A1.1 SLC34A1 0.0004 0.76 HER2.3 ERBB2 <0.0001 0.65 SLC22A6.1 SLC22A6 0.0003 0.77 EPHB4.1 EPHB4 <0.0001 0.64 SKIL.1 SKIL 0.0004 0.79 EPHA2.1 EPHA2 <0.0001 0.58 SHANK3.1 SHANK3 <0.0001 0.53 EPAS1.1 EPAS1 <0.0001 0.55 SGK.1 SGK1 <0.0001 0.67 ENPP2.1 ENPP2 0.0090 0.84 FRP1.3 SFRP1 0.0355 0.86 ENPEP.1 ENPEP <0.0001 0.74 SEMA3F.3 SEMA3F <0.0001 0.67 CD105.1 ENG <0.0001 0.60 SELENBP1.1 SELENBP1 0.0016 0.81 EMP1.1 EMP1 <0.0001 0.71 SDPR.1 SDPR <0.0001 0.51 EMCN.1 EMCN <0.0001 0.43 SDHA.1 SDHA 0.0003 0.77 ELTD1.1 ELTD1 <0.0001 0.76 SCNN1A.2 SCNN1A 0.0134 0.83 EIF2C1.1 EIF2C1 <0.0001 0.67 SCN4B.1 SCN4B <0.0001 0.68 EGR1.1 EGR1 <0.0001 0.72 KIAA1303 raptor. 1 RPTOR <0.0001 0.77 EGLN3.1 EGLN3 0.0002 0.80 RPS6KB1.3 RPS6KB1 <0.0001 0.73 EGFR.2 EGFR 0.0005 0.80 RPS6KAI.1 RPS6KA1 0.0291 0.86 EFNB2.1 EFNB2 <0.0001 0.64 RPS23.1 RPS23 <0.0001 0.73 EFNB1.2 EFNB1 <0.0001 0.68 ROCK2.1 ROCK2 <0.0001 0.66 EEF1A1.1 EEF1A1 <0.0001 0.64 ROCK1.1 ROCK1 <0.0001 0.58 EDNRB.1 EDNRB <0.0001 0.56 RIPK1.1 RIPK1 <0.0001 0.64 EDN2.1 EDN2 0.0005 0.77 rhoC.1 RHOC 0.0213 0.86 EDN1 endothelin.1 EDN1 <0.0001 0.62 RhoB.1 RHOB <0.0001 0.63 EBAG9.1 EBAG9 0.0041 0.82 ARHA.1 RHOA <0.0001 0.64 DUSP1.1 DUSP1 0.0029 0.82 RGS5.1 RGS5 <0.0001 0.52 DPYS.1 DPYS 0.0112 0.84 FLJ22655.1 RERGL <0.0001 0.51 DPEP1.1 DPEP1 <0.0001 0.64 NFKBp65.3 RELA 0.0027 0.82 DLL4.1 DLL4 <0.0001 0.76 RB1.1 RB1 <0.0001 0.73 DLC1.1 DLC1 <0.0001 0.55 RASSF1.1 RASSF1 0.0040 0.83 DKFZP564O082 3.1 DKFZP564 O0823 <0.0001 0.62 RARB.2 RARB <0.0001 0.57 DICER1.2 DICER1 <0.0001 0.71 RALBP1.1 RALBP1 <0.0001 0.73 DIAPH1.1 DIAPH1 0.0009 0.80 RAF1.3 RAF1 0.0008 0.81 DIABLO.1 DIABLO 0.0134 0.84 PTPRG.1 PTPRG <0.0001 0.57 DHPS.3 DHPS <0.0001 0.70 PTPRB.1 PTPRB <0.0001 0.51 DET1.1 DET1 <0.0001 0.74 PTN.1 PTN <0.0001 0.71 DEFB1.1 DEFB1 0.0025 0.81 PTK2.1 PTK2 <0.0001 0.61 DDC.1 DDC <0.0001 0.68 PTHR1.1 PTH1R <0.0001 0.55 DCXR.1 DCXR 0.0081 0.83 PTEN.2 PTEN <0.0001 0.74 DAPK1.3 DAPK1 <0.0001 0.60 PSMB9.1 PSMB9 0.0025 0.82 CYR61.1 CYR61 <0.0001 0.70 PSMB8.1 PSMB8 0.0239 0.85 CYP3A4.2 CYP3A4 0.0380 0.86 PRSS8.1 PRSS8 <0.0001 0.71 CXCL9.1 CXCL9 0.0362 0.87 PRPS2.1 PRPS2 0.0156 0.85 CXCL12.1 CXCL12 <0.0001 0.69 Table 3a: Genes for which increased expression is associated with lower risk of cancer recurrence (p-value ≤ .05) Gene Official Symbol Univariate Cox Analyses (No Covariate Adjustment) with RFI Gene Official Symbol Univariate Cox Analyses (No Covariate Adjustment) with RFI p-value for HR HR p-value for HR HR PRKCH.1 PRKCH <0.0001 0.63 CX3CR1.1 CX3CR1 <0.0001 0.72 PPP2CA.1 PPP2CA <0.0001 0.77 CX3CL1.1 CX3CL1 <0.0001 0.58 PPARG.3 PPARG <0.0001 0.59 CUL1.1 CUL1 0.0003 0.80 PPAP2B.1 PPAP2B <0.0001 0.50 CUBN.1 CUBN <0.0001 0.61 PLG.1 PLG <0.0001 0.70 CTSS.1 CTSS 0.0016 0.82 PLAT. 1 PLAT <0.0001 0.64 CTSH.2 CTSH <0.0001 0.78 PLA2G4C.1 PLA2G4C <0.0001 0.67 B-Catenin.3 CTNNB1 <0.0001 0.74 PIK3CA.1 PIK3CA <0.0001 0.75 A-Catenin.2 CTNNA1 <0.0001 0.77 PI3K.2 PIK3C2B <0.0001 0.56 CTGF.1 CTGF 0.0004 0.79 PFKP. 1 PFKP 0.0067 0.84 CSF1R.2 CSF1R 0.0015 0.82 CD31.3 PECAM1 <0.0001 0.60 CSF1.1 CSF1 0.0016 0.81 PDZK3.1 PDZK3 0.0005 0.77 CRADD.1 CRADD 0.0021 0.81 PDZK1.1 PDZK1 <0.0001 0.69 COL4A2.1 COL4A2 0.0016 0.80 PDGFRb.3 PDGFRB <0.0001 0.74 COL18A1.1 COL18A1 0.0007 0.79 PDGFD.2 PDGFD <0.0001 0.58 CLU.3 CLU 0.0151 0.85 PDGFC.3 PDGFC <0.0001 0.66 CLDN7.2 CLDN7 0.0023 0.81 PDGFB.3 PDGFB <0.0001 0.63 CLDN10.1 CLDN10 <0.0001 0.69 PDGFA.3 PDGFA <0.0001 0.75 CLCNKB.1 CLCNKB 0.0002 0.74 PCK1.1 PCK1 <0.0001 0.65 CFLAR.1 CFLAR <0.0001 0.65 PCCA.1 PCCA <0.0001 0.66 CEACAM1.1 CEACAM1 <0.0001 0.59 PARD6A.1 PARD6A 0.0001 0.76 p27.3 CDKN1B 0.0018 0.83 Pak1.2 PAK1 0.0011 0.81 p21.3 CDKN1A 0.0027 0.81 PAH.1 PAH 0.0296 0.86 CDH6.1 CDH6 <0.0001 0.75 OGG1.1 OGG1 0.0051 0.84 CDH5.1 CDH5 <0.0001 0.59 BFGF.3 NUDT6 <0.0001 0.54 CDH16.1 CDH16 <0.0001 0.75 NRG1.3 NRG1 0.0049 0.81 CDH13.1 CDH13 <0.0001 0.66 NPR1.1 NPR1 <0.0001 0.73 CD4.1 CD4 0.0009 0.81 NPM1.2 NPM1 <0.0001 0.73 CD36.1 CD36 <0.0001 0.65 NOTCH3.1 NOTCH3 <0.0001 0.70 CD34.1 CD34 <0.0001 0.62 NOTCH2.1 NOTCH2 0.0040 0.84 CCR7.1 CCR7 0.0271 0.86 NOTCH1.1 NOTCH 1 <0.0001 0.64 CCR4.2 CCR4 0.0106 0.83 NOS3.1 NOS3 <0.0001 0.55 CCND1.3 CCND1 <0.0001 0.70 NOS2A.3 NOS2 <0.0001 0.66 CCL4.2 CCL4 0.0012 0.80 NOL3.1 NOL3 0.0132 0.85 MCP1.1 CCL2 <0.0001 0.75 NFX1.1 NFX1 <0.0001 0.67 CAT.1 CAT <0.0001 0.72 NFKBp50.3 NFKB1 0.0001 0.77 CASP6.1 CASP6 0.0369 0.87 NFATC2.1 NFATC2 0.0003 0.78 CASP10.1 CASP10 <0.0001 0.69 NFAT5.1 NFAT5 0.0010 0.82 CALD1.2 CALD1 <0.0001 0.61 MYRIP.2 MYRIP 0.0002 0.75 CA9.3 CA9 0.0035 0.84 MYH11.1 MYH11 <0.0001 0.61 CA2.1 CA2 0.0006 0.79 cMYC.3 MYC 0.0002 0.79 C7.1 C7 0.0030 0.82 MVP.1 MVP 0.0052 0.83 ECRG4.1 C2orf40 <0.0001 0.57 MUC1.2 MUC1 0.0405 0.87 C13orf15.1 C13orf15 <0.0001 0.57 FRAP1.1 MTOR <0.0001 0.75 BUB3.1 BUB3 0.0002 0.77 MSH3.2 MSH3 <0.0001 0.75 BTRC.1 BTRC 0.0006 0.81 MSH2.3 MSH2 <0.0001 0.71 CIAP1.2 BIRC2 0.0030 0.82 GBL.1 MLST8 0.0246 0.87 BIN1.3 BIN1 0.0005 0.80 MIF.2 MIF 0.0012 0.80 BGN.1 BGN <0.0001 0.76 MICA.1 MICA <0.0001 0.71 BCL2L12.1 BCL2L12 0.0322 0.86 MGMT.1 MGMT <0.0001 0.68 Bclx.2 BCL2L1 <0.0001 0.74 MCM3.3 MCM3 0.0188 0.85 Bcl2.2 BCL2 <0.0001 0.57 MCAM.1 MCAM <0.0001 0.71 BBC3.2 BBC3 0.0449 0.87 MARCKS. 1 MARCKS 0.0301 0.87 BAG1.2 BAG1 <0.0001 0.64 ERK1.3 MAPK3 <0.0001 0.65 BAD.1 BAD 0.0076 0.85 ERK2.3 MAPK1 0.0005 0.79 ATP6V1 B1.1 ATP6V1B1 0.0001 0.71 MAP4.1 MAP4 <0.0001 0.65 ASS1.1 ASS1 <0.0001 0.75 MAP2K3.1 MAP2K3 <0.0001 0.69 ARRB1.1 ARRB1 <0.0001 0.62 MAP2K1.1 MAP2K1 0.0046 0.83 ARHGDIB.1 ARHGDIB <0.0001 0.66 MAL2.1 MAL2 0.0001 0.76 AQP1.1 AQP1 <0.0001 0.50 MAL.1 MAL <0.0001 0.66 APOLD1.1 APOLD1 <0.0001 0.57 LYZ.1 LYZ 0.0458 0.88 APC.4 APC <0.0001 0.73 LTF.1 LTF 0.0005 0.76 ANXA4.1 ANXA4 0.0018 0.81 LRP2.1 LRP2 <0.0001 0.67 ANXA1.2 ANXA1 0.0009 0.80 LMO2.1 LMO2 <0.0001 0.74 ANTXR1.1 ANTXR1 0.0043 0.82 Table 3a: Genes for which increased expression is associated with lower risk of cancer recurrence (p-value ≤.05) Gene Official Symbol Univariate Cox Analyses (No Covariate Adjustment) with RFI Gene Official Symbol Univariate Cox Analyses (No Covariate Adjustment) with RFI p-value for HR HR p-value for HR HR LDB2.1 LDB2 <0.0001 0.52 ANGPTL4.1 ANGPTL4 0.0033 0.84 LDB1.2 LDB1 <0.0001 0.71 ANGPTL3.3 ANGPTL3 0.0003 0.75 LAMA4.1 LAMA4 0.0279 0.86 ANGPT1.1 ANGPT1 <0.0001 0.57 KRT7.1 KRT7 <0.0001 0.68 ALDOB.1 ALDOB <0.0001 0.62 K-ras.10 KRAS <0.0001 0.72 ALDH6A1.1 ALDH6A1 <0.0001 0.63 KL.1 KL <0.0001 0.55 ALDH4.2 ALDH4A1 0.0172 0.85 Kitlng.4 KITLG <0.0001 0.67 AKT3.2 AKT3 <0.0001 0.57 c-kit.2 KIT <0.0001 0.72 AKT2.3 AKT2 <0.0001 0.75 KDR.6 KDR <0.0001 0.54 AKT1.3 AKT1 <0.0001 0.71 KCNJ15.1 KCNJ15 <0.0001 0.63 AIF1.1 AIF1 0.0349 0.87 HTATIP.1 KAT5 <0.0001 0.64 AHR.1 AHR <0.0001 0.74 G-Catenin.1 JUP <0.0001 0.64 AGTR1.1 AGTR1 <0.0001 0.57 AP-1 (JUN official).2 JUN 0.0001 0.76 ADH1B.1 ADH1B 0.0002 0.77 JAG1.1 JAG1 <0.0001 0.55 ADFP.1 ADFP 0.0332 0.88 ITGB1.1 ITGB1 0.0085 0.83 ADD1.1 ADD1 <0.0001 0.58 ITGA7.1 ITGA7 <0.0001 0.66 ADAMTS5.1 ADAMTS5 0.0010 0.78 ITGA6.2 ITGA6 <0.0001 0.63 ADAMTS1.1 ADAMTS1 0.0056 0.83 ITGA4.2 ITGA4 <0.0001 0.74 ACE2.1 ACE2 <0.0001 0.62 ITGA3.2 ITGA3 0.0002 0.79 ACADSB.1 ACADSB <0.0001 0.71 IQGAP2.1 IQGAP2 <0.0001 0.69 BCRP.1 ABCG2 <0.0001 0.58 INSR.1 INSR <0.0001 0.67 MRP4.2 ABCC4 <0.0001 0.74 IMP3.1 IMP3 <0.0001 0.69 MRP3.1 ABCC3 0.0107 0.85 IL6ST.3 IL6ST <0.0001 0.66 MRP1.1 ABCC1 <0.0001 0.75 IL15.1 IL15 <0.0001 0.70 ABCB1.5 ABCB1 0.0093 0.84 IGFBP6.1 IGFBP6 0.0004 0.79 NPD009 (ABAT official).3 ABAT 0.0001 0.76 IGFBP3.1 IGFBP3 0.0394 0.87 AAMP.1 AAMP 0.0008 0.80 IGFBP2.1 IGFBP2 0.0134 0.84 A2M.1 A2M <0.0001 0.56 Table 3b: Genes for which increased expression is associated with higher risk of cancer recurrence (p-value ≤ .05) Gene Official Symbol Univariate Cox Analyses (No Covariate Adjustment) with RFI Gene Official Symbol Univariate Cox Analyses (No Covariate Adjustment) with RFI p-value for HR HR p-value for HR HR WT1.1 WT1 0.0002 1.25 LGALS1.1 LGALS1 0.0017 1.25 VTN.1 VTN 0.0097 1.17 LAMB3.1 LAMB3 <0.0001 1.34 VDR.2 VDR 0.0031 1.22 LAMB1.1 LAMB1 0.0014 1.25 VCAN.1 VCAN 0.0036 1.22 L1CAM.1 L1CAM 0.0199 1.16 UBE2T.1 UBE2T <0.0001 1.38 IL-8.1 IL8 <0.0001 1.53 C20 orf1.1 TPX2 <0.0001 1.76 IL6.3 IL6 <0.0001 1.41 TOP2A.4 TOP2A <0.0001 1.39 ICAM1.1 ICAM1 0.0013 1.23 TK1.2 TK1 0.0018 1.22 HIST1H1D.1 HIST1H1D 0.0066 1.21 TIMP1.1 TIMP1 0.0259 1.16 FN1.1 FN1 0.0105 1.19 TGFBI.1 TGFBI 0.0004 1.26 F3.1 F3 <0.0001 1.31 SQSTM1.1 SQSTM1 0.0089 1.20 F2.1 F2 <0.0001 1.30 OPN, osteopontin.3 SPP1 <0.0001 1.43 ESPL1.3 ESPL1 0.0155 1.17 SPHK1.1 SPHK1 0.0025 1.22 EPHB2.1 EPHB2 0.0456 1.14 SLC7A5.2 SLC7A5 <0.0001 1.38 EPHB1.3 EPHB1 0.0007 1.22 SLC2A1.1 SLC2A1 0.0010 1.26 ENO2.1 ENO2 <0.0001 1.38 SLC16A3.1 SLC16A3 <0.0001 1.38 EIF4EBP1.1 EIF4EBP1 0.0098 1.19 SLC13A3.1 SLC13A3 0.0192 1.16 CXCR4.3 CXCR4 0.0066 1.21 SHC1.1 SHC1 0.0086 1.19 GRO1.2 CXCL1 <0.0001 1.30 SFN.1 SFN 0.0001 1.26 CTSB.1 CTSB 0.0233 1.17 SERPINA5.1 SERPINA5 0.0462 1.13 CRP.1 CRP 0.0314 1.13 SEMA3C.1 SEMA3C <0.0001 1.45 CP.1 CP 0.0002 1.32 SAA2.2 SAA2 <0.0001 1.59 COL7A1.1 COL7A1 0.0003 1.24 S100A1.1 S100A1 0.0348 1.16 COL1A1.1 COL1A1 0.0029 1.23 RRM2.1 RRM2 0.0002 1.27 Chk1.2 CHEK1 0.0002 1.26 RPLP1.1 RPLP1 0.0049 1.22 CENPF.1 CENPF <0.0001 1.36 PTTG1.2 PTTG1 <0.0001 1.45 CD82.3 CD82 0.0009 1.25 COX2.1 PTGS2 0.0013 1.22 CD44s.1 CD44_s 0.0065 1.21 PLAUR.3 PLAUR <0.0001 1.33 CCNE1.1 CCNE1 0.0098 1.17 PF4.1 PF4 0.0034 1.20 CCNB1.2 CCNB1 <0.0001 1.42 PCSK6.1 PCSK6 0.0269 1.17 CCL20.1 CCL20 0.0029 1.22 MYBL2.1 MYBL2 <0.0001 1.33 CA12.1 CA12 <0.0001 1.48 MT1X.1 MT1X 0.0070 1.20 C3.1 C3 0.0176 1.18 MMP9.1 MMP9 <0.0001 1.54 BUB1.1 BUB1 <0.0001 1.59 MMP7.1 MMP7 0.0312 1.15 SURV.2 BIRC5 <0.0001 1.37 MMP14.1 MMP14 <0.0001 1.47 clAP2.2 BIRC3 0.0484 1.15 Ki-67.2 MKI67 <0.0001 1.33 BCL2A1.1 BCL2A1 0.0483 1.11 mGST1.2 MGST1 <0.0001 1.38 STK15.2 AURKA 0.0002 1.28 MDK.1 MDK 0.0001 1.31 ANXA2.2 ANXA2 0.0315 1.16 LOX.1 LOX <0.0001 1.42 ALOX5.1 ALOX5 0.0473 1.14 LMNB1.1 LMNB1 <0.0001 1.40 ADAM8.1 ADAM8 0.0002 1.29 LIMK1.1 LIMK1 <0.0001 1.43 MRP2.3 ABCC2 0.0004 1.28 Table 4a: Proxy genes for which increased expression is associated with higher tumor stage (p-value ≤ .05) Gene Official Symbol Stage 3 vs. 1 Gene Official Symbol Stage 3 vs. 1 p-value OR p-value OR WT1.1 WT1 <0.0001 1.41 LAMA3.1 LAMA3 0.0121 1.22 VTN.1 VTN 0.0007 1.29 L1CAM.1 L1CAM 0.0091 1.22 VDR.2 VDR 0.0065 1.25 ISG20.1 ISG20 0.0006 1.34 UBE2T.1 UBE2T <0.0001 1.61 IL-8.1 IL8 <0.0001 1.89 TSPAN8.1 TSPAN8 0.0072 1.23 IL6.3 IL6 <0.0001 1.68 C20 orf1.1 TPX2 <0.0001 1.89 IGF1.2 IGF1 0.0214 1.20 TOP2A.4 TOP2A <0.0001 1.55 ICAM1.1 ICAM1 <0.0001 1.42 TK1.2 TK1 0.0001 1.34 HIST1H1D.1 HIST1H1D 0.0005 1.33 TIMP1.1 TIMP1 0.0021 1.29 GPX2.2 GPX2 0.0129 1.22 TGFBI.1 TGFBI 0.0001 1.39 FN1.1 FN1 0.0002 1.36 OPN, osteopontin.3 SPP1 0.0001 1.38 FAP.1 FAP 0.0455 1.18 SLC7A5.2 SLC7A5 <0.0001 1.51 F3.1 F3 <0.0001 1.52 SLC2A1.1 SLC2A1 0.0081 1.24 F2.1 F2 <0.0001 1.79 SLC16A3.1 SLC16A3 <0.0001 1.46 ESPL1.3 ESPL1 0.0001 1.35 SFN.1 SFN 0.0001 1.36 EPB41L3.1 EPB41L3 0.0067 1.24 SEMA3C.1 SEMA3C <0.0001 1.42 ENO2.1 ENO2 0.0016 1.31 SELL.1 SELL 0.0313 1.19 EIF4EBP1.1 EIF4EBP1 0.0036 1.27 SAA2.2 SAA2 <0.0001 2.04 E2F1.3 E2F1 0.0017 1.27 RRM2.1 RRM2 <0.0001 1.47 DCN.1 DCN 0.0152 1.22 RPLP1.1 RPLP1 0.0007 1.33 CXCR6.1 CXCR6 0.0013 1.30 RAD51.1 RAD51 0.0010 1.31 BLR1.1 CXCR5 0.0232 1.19 PTTG1.2 PTTG1 <0.0001 1.61 CXCR4.3 CXCR4 0.0003 1.35 COX2.1 PTGS2 0.0011 1.29 GRO1.2 CXCL1 0.0005 1.31 PTGIS.1 PTGIS 0.0034 1.27 CTSB.1 CTSB 0.0110 1.24 PLAUR.3 PLAUR <0.0001 1.51 CRP.1 CRP 0.0002 1.31 PF4.1 PF4 0.0027 1.26 CP.1 CP 0.0008 1.34 PDGFRa.2 PDGFRA 0.0480 1.17 COL7A1.1 COL7A1 0.0010 1.28 PCSK6.1 PCSK6 0.0041 1.27 COL1A1.1 COL1A1 0.0001 1.40 NNMT.1 NNMT 0.0003 1.34 Chk2.3 CHEK2 0.0050 1.27 NME2.1 NME2 0.0028 1.28 Chk1.2 CHEK1 <0.0001 1.43 MYBL2.1 MYBL2 <0.0001 1.50 CENPF.1 CENPF <0.0001 1.55 MT1X.1 MT1X 0.0192 1.21 CD82.3 CD82 0.0001 1.38 MMP9.1 MMP9 <0.0001 1.79 CD44s.1 CD44_s 0.0060 1.25 MMP7.1 MMP7 0.0252 1.20 CCNE2.2 CCNE2_2 0.0229 1.19 MMP14.1 MMP14 <0.0001 1.88 CCNB1.2 CCNB1 <0.0001 1.60 Ki-67.2 MKI67 <0.0001 1.48 CCL20.1 CCL20 0.0010 1.30 mGST1.2 MGST1 0.0004 1.37 CA12.1 CA12 <0.0001 1.66 MDK.1 MDK <0.0001 1.42 C3.1 C3 0.0009 1.32 MDH2.1 MDH2 0.0321 1.19 BUB1.1 BUB1 <0.0001 1.82 LRRC2.1 LRRC2 0.0259 1.19 SURV.2 BIRC5 <0.0001 1.46 LOX.1 LOX <0.0001 1.78 BCL2A1.1 BCL2A1 <0.0001 1.44 LMNB1.1 LMNB1 <0.0001 1.82 STK15.2 AURKA 0.0002 1.36 LIMK1.1 LIMK1 <0.0001 1.46 APOL1.1 APOL1 0.0028 1.27 LAPTM5.1 LAPTM5 0.0102 1.23 ANXA2.2 ANXA2 0.0174 1.21 LAMB3.1 LAMB3 <0.0001 1.53 ADAM8.1 ADAM8 <0.0001 1.58 LAMB1.1 LAMB1 0.0452 1.18 MRP2.3 ABCC2 <0.0001 1.45 Table 4b: Proxy genes for which increased expression is associated with lower tumor stage (p-value ≤ .05) Gene Official Symbol Stage 3 vs. 1 Gene Official Symbol Stage 3 vs. 1 p-value OR p-value OR YB-1.2 YBX1 <0.0001 0.63 IL-7.1 IL7 0.0444 0.85 XIAP.1 XIAP <0.0001 0.62 IL6ST.3 IL6ST <0.0001 0.50 WWOX.5 WWOX 0.0042 0.79 IL15.1 IL15 <0.0001 0.67 WISP1.1 WISP1 0.0096 0.81 IGFBP6.1 IGFBP6 0.0001 0.73 VWF.1 VWF <0.0001 0.46 IGFBP3.1 IGFBP3 0.0191 0.83 VEGF.1 VEGFA <0.0001 0.63 IGF1R.3 IGF1R <0.0001 0.48 VCAM1.1 VCAM1 <0.0001 0.55 ID3.1 ID3 <0.0001 0.54 USP34.1 USP34 0.0001 0.72 ID2.4 ID2 0.0008 0.77 UMOD.1 UMOD <0.0001 0.47 ID1.1 ID1 <0.0001 0.34 UGCG.1 UGCG <0.0001 0.68 ICAM2.1 ICAM2 <0.0001 0.58 UBB.1 UBB <0.0001 0.54 HYAL2.1 HYAL2 <0.0001 0.41 UBE1C.1 UBA3 <0.0001 0.62 HYAL1.1 HYAL1 <0.0001 0.44 TS.1 TYMS 0.0010 0.76 HSPG2.1 HSPG2 <0.0001 0.44 tusc4.2 TUSC4 <0.0001 0.57 HSD11B2.1 HSD11B2 <0.0001 0.47 TUSC2.1 TUSC2 0.0295 0.83 Hepsin.1 HPN 0.0031 0.79 TSPAN7.2 TSPAN7 <0.0001 0.35 HPCAL1.1 HPCAL1 0.0004 0.75 TSC2.1 TSC2 <0.0001 0.66 HNRPAB.3 HNRNPAB 0.0039 0.78 TSC1.1 TSC1 <0.0001 0.56 HMGB1.1 HMGB1 <0.0001 0.46 P53.2 TP53 <0.0001 0.67 HLA-DPB1.1 HLA-DPB1 <0.0001 0.55 TOP2B.2 TOP2B <0.0001 0.69 HIF1AN.1 HIF1AN <0.0001 0.57 TNIP2.1 TNIP2 0.0359 0.85 HIF1A.3 HIF1A 0.0076 0.80 TNFSF12.1 TNFSF12 <0.0001 0.50 HGF.4 HGF 0.0067 0.80 TRAIL.1 TNFSF10 0.0011 0.77 HDAC1.1 HDAC1 <0.0001 0.61 TNFRSF11B.1 TNFRSF11B <0.0001 0.63 HAVCR1.1 HAVCR1 0.0001 0.73 TNFRSF10D.1 TNFRSF10D <0.0001 0.57 HADH.1 HADH <0.0001 0.62 DR5.2 TNFRSF10B <0.0001 0.64 GSTT1.3 GSTT1 0.0112 0.82 TNFAIP6.1 TNFAIP6 0.0001 0.74 GSTp.3 GSTP1 <0.0001 0.64 TNF.1 TNF 0.0138 0.80 GSTM3.2 GSTM3 <0.0001 0.57 TMEM47.1 TMEM47 <0.0001 0.41 GSTM1.1 GSTM1 <0.0001 0.55 TMEM27.1 TMEM27 <0.0001 0.53 GRB7.2 GRB7 <0.0001 0.66 TLR3.1 TLR3 <0.0001 0.68 GRB14.1 GRB14 0.0123 0.81 TIMP3.3 TIMP3 <0.0001 0.39 GPX3.1 GPX3 0.0120 0.82 TIMP2.1 TIMP2 <0.0001 0.68 GNAS.1 GNAS 0.0003 0.74 THBS1.1 THBS1 <0.0001 0.65 GJA1.1 GJA1 0.0034 0.79 TGFBR2.3 TGFBR2 <0.0001 0.41 GFRA1.1 GFRA1 0.0164 0.82 TGFBR1.1 TGFBR1 <0.0001 0.59 GCLM.2 GCLM 0.0056 0.80 TGFB2.2 TGFB2 <0.0001 0.50 GCLC.3 GCLC <0.0001 0.49 TGFb1.1 TGFB1 <0.0001 0.67 GBP2.2 GBP2 0.0388 0.84 TGFA.2 TGFA <0.0001 0.63 GATM.1 GATM <0.0001 0.59 TEK.1 TEK <0.0001 0.34 GATA3.3 GATA3 0.0002 0.72 TCF4.1 TCF4 <0.0001 0.47 FOS.1 FOS <0.0001 0.65 TAP1.1 TAP1 0.0017 0.77 FOLR1.1 FOLR1 <0.0001 0.65 TAGLN.1 TAGLN 0.0001 0.72 FLT4.1 FLT4 <0.0001 0.37 TACSTD2.1 TACSTD2 <0.0001 0.58 FLT3LG.1 FLT3LG <0.0001 0.61 SUCLG1.1 SUCLG1 <0.0001 0.56 FLT1.1 FLT1 <0.0001 0.40 STK11.1 STK11 <0.0001 0.58 FILIP1.1 FILIP1 <0.0001 0.47 STAT5B.2 STAT5B <0.0001 0.50 FIGF.1 FIGF <0.0001 0.53 STAT5A.1 STAT5A <0.0001 0.60 FHL1.1 FHL1 <0.0001 0.52 STAT3.1 STAT3 0.0001 0.72 FHIT.1 FHIT <0.0001 0.54 STAT1.3 STAT1 0.0344 0.84 FH.1 FH <0.0001 0.67 SPRY1.1 SPRY1 <0.0001 0.57 FGFR2 isoform 1.1 FGFR2 <0.0001 0.62 SPAST.1 SPAST 0.0142 0.82 FGFR1.3 FGFR1 <0.0001 0.63 SPARCL1.1 SPARCL1 <0.0001 0.59 FGF2.2 FGF2 <0.0001 0.58 SPARC.1 SPARC <0.0001 0.69 FGF1.1 FGF1 <0.0001 0.66 SOD1.1 SOD1 0.0245 0.83 FDPS.1 FDPS <0.0001 0.47 SNRK.1 SNRK <0.0001 0.35 FBXW7.1 FBXW7 <0.0001 0.66 SNAI1.1 SNAI1 <0.0001 0.70 fas.1 FAS <0.0001 0.66 MADH4.1 SMAD4 <0.0001 0.47 ESRRG.3 ESRRG 0.0001 0.72 MADH2.1 SMAD2 <0.0001 0.50 ERG.1 ERG <0.0001 0.44 SLC9A1.1 SLC9A1 0.0207 0.82 ERCC1.2 ERCC1 <0.0001 0.60 SLC34A1.1 SLC34A1 <0.0001 0.63 ERBB4.3 ERBB4 0.0018 0.74 SLC22A6.1 SLC22A6 0.0010 0.76 ErbB3.1 ERBB3 0.0031 0.79 SKIL.1 SKIL <0.0001 0.64 HER2.3 ERBB2 <0.0001 0.53 PTPNS1.1 SIRPA 0.0075 0.81 EPHB4.1 EPHB4 <0.0001 0.51 SHANK3.1 SHANK3 <0.0001 0.37 EPHA2.1 EPHA2 <0.0001 0.40 SGK.1 SGK1 <0.0001 0.55 EPAS1.1 EPAS1 <0.0001 0.38 FRP1.3 SFRP1 0.0156 0.82 ENPP2.1 ENPP2 0.0001 0.72 SEMA3F.3 SEMA3F <0.0001 0.50 ENPEP.1 ENPEP <0.0001 0.65 SELPLG.1 SELPLG 0.0022 0.78 CD105.1 ENG <0.0001 0.38 SELENBP1.1 SELENBP1 0.0003 0.75 EMP1.1 EMP1 <0.0001 0.64 SDPR.1 SDPR <0.0001 0.42 EMCN.1 EMCN <0.0001 0.27 SDHA.1 SDHA <0.0001 0.65 ELTD1.1 ELTD1 <0.0001 0.67 SCNN1A.2 SCNN1A 0.0024 0.77 EIF2C1.1 EIF2C1 <0.0001 0.51 SCN4B.1 SCN4B <0.0001 0.50 EGR1.1 EGR1 <0.0001 0.59 S100A2.1 S100A2 0.0008 0.75 EGLN3.1 EGLN3 0.0002 0.75 KIAA1303 raptor.1 RPTOR <0.0001 0.60 EGFR.2 EGFR 0.0072 0.81 RPS6KB1.3 RPS6KB1 <0.0001 0.60 EGF.3 EGF 0.0051 0.77 RPS6KAI.1 RPS6KA1 0.0002 0.71 EFNB2.1 EFNB2 <0.0001 0.45 RPS23.1 RPS23 0.0002 0.73 EFNB1.2 EFNB1 <0.0001 0.55 ROCK2.1 ROCK2 <0.0001 0.52 EEF1A1.1 EEF1A1 <0.0001 0.55 ROCK1.1 ROCK1 <0.0001 0.37 EDNRB.1 EDNRB <0.0001 0.44 RIPK1.1 RIPK1 <0.0001 0.55 EDN2.1 EDN2 0.0012 0.74 rhoC.1 RHOC <0.0001 0.66 EDN1 endothelin.1 EDN1 <0.0001 0.53 RhoB.1 RHOB <0.0001 0.57 EBAG9.1 EBAG9 0.0240 0.83 ARHA.1 RHOA <0.0001 0.50 DUSP1.1 DUSP1 0.0130 0.82 RHEB.2 RHEB <0.0001 0.61 DPYS.1 DPYS 0.0355 0.85 RGS5.1 RGS5 <0.0001 0.37 DPEP1.1 DPEP1 <0.0001 0.66 FLJ22655.1 RERGL <0.0001 0.33 DLL4.1 DLL4 <0.0001 0.66 RB1.1 RB1 <0.0001 0.61 DLC1.1 DLC1 <0.0001 0.42 RASSF1.1 RASSF1 0.0002 0.75 DKFZP564O08 23.1 DKFZP564O 0823 <0.0001 0.51 RARB.2 RARB <0.0001 0.37 DICER1.2 DICER1 <0.0001 0.50 RALBP1.1 RALBP1 <0.0001 0.43 DIAPH1.1 DIAPH1 0.0219 0.83 RAF1.3 RAF1 <0.0001 0.59 DIABLO.1 DIABLO 0.0022 0.78 RAC1.3 RAC1 0.0356 0.84 DHPS.3 DHPS <0.0001 0.55 PTPRG.1 PTPRG <0.0001 0.35 DET1.1 DET1 0.0005 0.74 PTPRB.1 PTPRB <0.0001 0.31 DEFB1.1 DEFB1 0.0002 0.73 PTN.1 PTN <0.0001 0.56 DDC.1 DDC <0.0001 0.72 PTK2.1 PTK2 <0.0001 0.45 DAPK1.3 DAPK1 <0.0001 0.42 PTHR1.1 PTH1R <0.0001 0.45 CYR61.1 CYR61 <0.0001 0.59 PTEN.2 PTEN <0.0001 0.51 CXCL12.1 CXCL12 <0.0001 0.62 PSMB9.1 PSMB9 0.0139 0.82 CX3CR1.1 CX3CR1 <0.0001 0.46 PSMB8.1 PSMB8 0.0243 0.83 CX3CL1.1 CX3CL1 <0.0001 0.47 PSMA7.1 PSMA7 0.0101 0.81 CUL1.1 CUL1 <0.0001 0.64 PRSS8.1 PRSS8 0.0025 0.78 CUBN.1 CUBN <0.0001 0.55 PRPS2.1 PRPS2 0.0190 0.82 CTSS.1 CTSS 0.0007 0.76 PRKCH.1 PRKCH <0.0001 0.48 CTSH.2 CTSH <0.0001 0.64 PRKCD.2 PRKCD 0.0001 0.72 B-Catenin.3 CTNNB1 <0.0001 0.54 PPP2CA.1 PPP2CA <0.0001 0.58 A-Catenin.2 CTNNA1 <0.0001 0.65 PPARG.3 PPARG <0.0001 0.40 CTGF.1 CTGF <0.0001 0.71 PPAP2B.1 PPAP2B <0.0001 0.31 CSF2RA.2 CSF2RA 0.0037 0.78 PLG.1 PLG <0.0001 0.53 CSF1R.2 CSF1R <0.0001 0.67 PLAT.1 PLAT <0.0001 0.54 CSF1.1 CSF1 <0.0001 0.65 PLA2G4C.1 PLA2G4C <0.0001 0.65 CRADD.1 CRADD 0.0032 0.79 PIK3CA.1 PIK3CA <0.0001 0.53 COL4A2.1 COL4A2 <0.0001 0.65 PI3K.2 PIK3C2B <0.0001 0.40 COL4A1.1 COL4A1 0.0067 0.80 PFKP.1 PFKP 0.0124 0.82 COL18A1.1 COL18A1 0.0001 0.72 CD31.3 PECAM1 <0.0001 0.42 CLU.3 CLU 0.0004 0.75 PDZK3.1 PDZK3 0.0003 0.72 CLDN10.1 CLDN10 <0.0001 0.65 PDZK1.1 PDZK1 <0.0001 0.58 CLCNKB.1 CLCNKB <0.0001 0.52 PDGFRb.3 PDGFRB <0.0001 0.62 CFLAR.1 CFLAR <0.0001 0.60 PDGFD.2 PDGFD <0.0001 0.43 CEACAM1.1 CEACAM1 <0.0001 0.55 PDGFC.3 PDGFC <0.0001 0.51 p21.3 CDKN1A 0.0002 0.73 PDGFB.3 PDGFB <0.0001 0.40 CDH6.1 CDH6 <0.0001 0.72 PDGFA.3 PDGFA <0.0001 0.57 CDH5.1 CDH5 <0.0001 0.44 PCK1.1 PCK1 <0.0001 0.60 CDH2.1 CDH2 0.0392 0.85 PCCA.1 PCCA <0.0001 0.58 CDH16.1 CDH16 <0.0001 0.70 PARD6A.1 PARD6A 0.0042 0.79 CDH13.1 CDH13 <0.0001 0.53 Pak1.2 PAK1 <0.0001 0.69 CDC25B.1 CDC25B 0.0037 0.79 PAH.1 PAH 0.0309 0.84 CD4.1 CD4 <0.0001 0.72 OGG1.1 OGG1 0.0024 0.78 CD36.1 CD36 <0.0001 0.51 BFGF.3 NUDT6 <0.0001 0.46 CD34.1 CD34 <0.0001 0.48 NPR1.1 NPR1 <0.0001 0.58 CD24.1 CD24 0.0206 0.83 NPM1.2 NPM1 <0.0001 0.65 CD14.1 CD14 0.0152 0.82 NOTCH3.1 NOTCH3 <0.0001 0.58 CCND1.3 CCND1 <0.0001 0.51 NOTCH2.1 NOTCH2 <0.0001 0.64 CCL4.2 CCL4 0.0017 0.77 NOTCH1.1 NOTCH1 <0.0001 0.44 MCP1.1 CCL2 <0.0001 0.66 NOS3.1 NOS3 <0.0001 0.44 CAT.1 CAT <0.0001 0.53 NOS2A.3 NOS2 <0.0001 0.49 CASP10.1 CASP10 0.0001 0.72 NOL3.1 NOL3 0.0003 0.76 CALD1.2 CALD1 <0.0001 0.55 NFX1.1 NFX1 <0.0001 0.50 CACNA2D1.1 CACNA2D1 0.0352 0.84 NFKBp50.3 NFKB1 <0.0001 0.59 CA9.3 CA9 0.0299 0.84 NFATC2.1 NFATC2 <0.0001 0.64 CA2.1 CA2 <0.0001 0.58 NFAT5.1 NFAT5 <0.0001 0.65 C3AR1.1 C3AR1 0.0010 0.77 MYRIP.2 MYRIP 0.0004 0.72 ECRG4.1 C2orf40 <0.0001 0.47 MYH11.1 MYH11 <0.0001 0.50 C1QA.1 C1QA 0.0119 0.82 cMYC.3 MYC <0.0001 0.70 C13orf15.1 C13orf15 <0.0001 0.37 MX1.1 MX1 0.0103 0.81 BUB3.1 BUB3 <0.0001 0.67 MVP.1 MVP 0.0002 0.74 BTRC.1 BTRC <0.0001 0.65 MUC1.2 MUC1 0.0005 0.75 CIAP1.2 BIRC2 <0.0001 0.64 FRAP1.1 MTOR <0.0001 0.61 BIN1.3 BIN1 0.0001 0.73 MSH3.2 MSH3 <0.0001 0.60 BGN.1 BGN <0.0001 0.63 MSH2.3 MSH2 <0.0001 0.53 Bclx.2 BCL2L1 <0.0001 0.58 STMY3.3 MMP11 0.0034 0.79 Bcl2.2 BCL2 <0.0001 0.37 GBL.1 MLST8 0.0011 0.77 Bax.1 BAX 0.0035 0.78 MIF.2 MIF 0.0008 0.76 Bak.2 BAK1 0.0215 0.83 MICA.1 MICA <0.0001 0.70 BAG1.2 BAG1 <0.0001 0.40 MGMT.1 MGMT <0.0001 0.60 ATP6V1B1.1 ATP6V1B1 <0.0001 0.54 MCM3.3 MCM3 <0.0001 0.68 ATP1A1.1 ATP1A1 0.0037 0.78 MCAM.1 MCAM <0.0001 0.52 ASS1.1 ASS1 <0.0001 0.60 MARCKS.1 MARCKS 0.0001 0.73 ARRB1.1 ARRB1 <0.0001 0.45 ERK1.3 MAPK3 <0.0001 0.48 ARHGDIB.1 ARHGDIB <0.0001 0.50 ERK2.3 MAPK1 0.0221 0.83 AQP1.1 AQP1 <0.0001 0.40 MAP4.1 MAP4 <0.0001 0.63 APOLD1.1 APOLD1 <0.0001 0.54 MAP2K3.1 MAP2K3 <0.0001 0.59 APC.4 APC <0.0001 0.57 MAP2K1.1 MAP2K1 0.0002 0.74 ANXA4.1 ANXA4 0.0003 0.74 MAL2.1 MAL2 <0.0001 0.64 ANXA1.2 ANXA1 0.0001 0.73 MAL.1 MAL <0.0001 0.49 ANTXR1.1 ANTXR1 0.0051 0.80 LYZ.1 LYZ 0.0318 0.84 ANGPTL4.1 ANGPTL4 0.0041 0.80 LTF.1 LTF 0.0131 0.80 ANGPTL3.3 ANGPTL3 0.0258 0.82 LRP2.1 LRP2 <0.0001 0.63 ANGPTL2.1 ANGPTL2 0.0015 0.77 LMO2.1 LMO2 <0.0001 0.56 ANGPT2.1 ANGPT2 <0.0001 0.72 LDB2.1 LDB2 <0.0001 0.41 ANGPT1.1 ANGPT1 <0.0001 0.45 LDB1.2 LDB1 <0.0001 0.54 ALDOB.1 ALDOB <0.0001 0.60 LAMA4.1 LAMA4 0.0004 0.75 ALDH6A1.1 ALDH6A1 <0.0001 0.55 KRT7.1 KRT7 <0.0001 0.60 ALDH4.2 ALDH4A1 0.0124 0.82 K-ras.10 KRAS <0.0001 0.68 AKT3.2 AKT3 <0.0001 0.43 KL.1 KL <0.0001 0.49 AKT2.3 AKT2 <0.0001 0.64 Kitlng.4 KITLG <0.0001 0.43 AKT1.3 AKT1 <0.0001 0.58 c-kit.2 KIT <0.0001 0.60 AIF1.1 AIF1 0.0002 0.74 KDR.6 KDR <0.0001 0.36 AHR.1 AHR <0.0001 0.59 KCNJ15.1 KCNJ15 <0.0001 0.54 AGTR1.1 AGTR1 <0.0001 0.36 HTATIP.1 KAT5 <0.0001 0.40 ADH1B.1 ADH1B 0.0015 0.77 G-Catenin.1 JUP <0.0001 0.42 ADD1.1 ADD1 <0.0001 0.40 AP-1 (JUN official).2 JUN 0.0001 0.73 ADAMTS5.1 ADAMTS5 0.0006 0.73 JAG1.1 JAG1 <0.0001 0.42 ADAM17.1 ADAM17 <0.0001 0.72 ITGB5.1 ITGB5 0.0115 0.81 ACE2.1 ACE2 <0.0001 0.61 ITGB1.1 ITGB1 <0.0001 0.64 ACADSB.1 ACADSB <0.0001 0.54 ITGA7.1 ITGA7 <0.0001 0.54 BCRP.1 ABCG2 <0.0001 0.41 ITGA6.2 ITGA6 <0.0001 0.51 MRP4.2 ABCC4 <0.0001 0.65 ITGA5.1 ITGA5 0.0325 0.84 MRP3.1 ABCC3 0.0005 0.76 ITGA4.2 ITGA4 <0.0001 0.54 MRP1.1 ABCC1 0.0017 0.78 ITGA3.2 ITGA3 <0.0001 0.61 ABCB1.5 ABCB1 0.0003 0.75 IQGAP2.1 IQGAP2 <0.0001 0.63 NPD009 (ABAT official).3 ABAT <0.0001 0.70 INSR.1 INSR <0.0001 0.59 AAMP.1 AAMP 0.0292 0.84 IMP3.1 IMP3 <0.0001 0.54 A2M.1 A2M <0.0001 0.36 Table 5a: Proxy genes for which increased expression is associated with higher tumor grade (p-value ≤ .05) Gene Official Symbol CCF Grade Gene Official Symbol CCF Grade p-value OR p-value OR WT1.1 WT1 <0.0001 1.39 HPD.1 HPD 0.0054 1.20 VTN.1 VTN 0.0359 1.16 HIST1H1D.1 HIST1H1D 0.0248 1.16 VDR.2 VDR 0.0001 1.29 HGD.1 HGD <0.0001 1.41 UBE2T.1 UBE2T <0.0001 1.81 GZMA.1 GZMA 0.0006 1.26 TP.3 TYMP <0.0001 1.35 GPX2.2 GPX2 0.0182 1.18 C20 orf1.1 TPX2 <0.0001 2.14 GPX1.2 GPX1 0.0008 1.25 TOP2A.4 TOP2A <0.0001 2.07 FCGR3A.1 FCGR3A 0.0003 1.27 TNFSF13B.1 TNFSF13B 0.0062 1.20 fasl.2 FASLG 0.0045 1.21 TK1.2 TK1 <0.0001 1.66 FABP1.1 FABP1 <0.0001 1.32 TGFBI.1 TGFBI 0.0452 1.14 F2.1 F2 <0.0001 1.77 STAT1.3 STAT1 <0.0001 1.31 ESPL1.3 ESPL1 <0.0001 1.60 SQSTM1.1 SQSTM1 0.0003 1.27 E2F1.3 E2F1 <0.0001 1.36 OPN, osteopontin.3 SPP1 0.0002 1.29 CXCR6.1 CXCR6 <0.0001 1.50 SLC7A5.2 SLC7A5 0.0002 1.28 BLR1.1 CXCR5 0.0338 1.15 SLC16A3.1 SLC16A3 0.0052 1.21 CXCL9.1 CXCL9 0.0001 1.29 SLC13A3.1 SLC13A3 0.0003 1.27 CXCL10.1 CXCL10 0.0078 1.19 SFN.1 SFN 0.0066 1.20 GRO1.2 CXCL1 <0.0001 1.39 SEMA3C.1 SEMA3C <0.0001 1.32 CTSD.2 CTSD 0.0183 1.17 SAA2.2 SAA2 <0.0001 2.13 CTSB.1 CTSB 0.0006 1.26 S100A1.1 S100A1 <0.0001 1.40 CRP.1 CRP 0.0342 1.15 RRM2.1 RRM2 <0.0001 1.71 CP.1 CP <0.0001 1.37 RPLP1.1 RPLP1 0.0007 1.25 Chk2.3 CHEK2 <0.0001 1.37 RAD51.1 RAD51 <0.0001 1.53 Chk1.2 CHEK1 <0.0001 1.37 PTTG1.2 PTTG1 <0.0001 1.89 CENPF.1 CENPF <0.0001 1.78 PSMB9.1 PSMB9 0.0010 1.25 CD8A.1 CD8A <0.0001 1.35 PSMB8.1 PSMB8 0.0181 1.17 CD82.3 CD82 <0.0001 1.50 PRKCB1.1 PRKCB 0.0218 1.16 TNFSF7.1 CD70 <0.0001 1.43 PDCD1.1 PDCD1 <0.0001 1.43 CCNE1.1 CCNE1 0.0002 1.29 PCSK6.1 PCSK6 0.0009 1.25 CCNB1.2 CCNB1 <0.0001 1.75 PCNA.2 PCNA 0.0041 1.21 CCL5.2 CCL5 <0.0001 1.63 NME2.1 NME2 0.0106 1.19 CCL20.1 CCL20 0.0082 1.19 MYBL2.1 MYBL2 <0.0001 1.70 CAV2.1 CAV2 0.0210 1.17 MMP9.1 MMP9 <0.0001 1.46 CA12.1 CA12 <0.0001 1.41 MMP14.1 MMP14 0.0003 1.28 C3.1 C3 <0.0001 1.34 Ki-67.2 MKI67 <0.0001 1.70 C1QB.1 C1QB 0.0201 1.17 mGST1.2 MGST1 <0.0001 2.13 BUB1.1 BUB1 <0.0001 2.16 cMet.2 MET <0.0001 1.57 BRCA1.2 BRCA1 0.0004 1.26 MDK.1 MDK <0.0001 1.55 SURV.2 BIRC5 <0.0001 1.93 MDH2.1 MDH2 <0.0001 1.35 clAP2.2 BIRC3 <0.0001 1.44 MCM2.2 MCM2 <0.0001 1.33 STK15.2 AURKA <0.0001 1.38 LOX.1 LOX <0.0001 1.35 ATP5E.1 ATP5E <0.0001 1.45 LMNB1.1 LMNB1 <0.0001 1.76 APOL1.1 APOL1 <0.0001 1.47 LIMK1.1 LIMK1 <0.0001 1.43 APOE.1 APOE <0.0001 1.40 LAPTM5.1 LAPTM5 0.0044 1.21 APOC1.3 APOC1 <0.0001 1.42 LAMB3.1 LAMB3 <0.0001 1.49 ANXA2.2 ANXA2 0.0020 1.23 L1CAM.1 L1CAM 0.0338 1.15 ANGPTL3.3 ANGPTL3 <0.0001 1.32 KLRK1.2 KLRK1 0.0412 1.15 AMACR1.1 AMACR 0.0382 1.15 CD18.2 ITGB2 0.0069 1.21 ALOX5.1 ALOX5 0.0001 1.29 IL-8.1 IL8 0.0088 1.19 ALDH4.2 ALDH4A1 0.0002 1.28 IL6.3 IL6 0.0091 1.19 ADAM8.1 ADAM8 0.0006 1.26 ICAM1.1 ICAM1 0.0014 1.24 MRP2.3 ABCC2 <0.0001 1.97 HSPA8.1 HSPA8 <0.0001 1.39 Table 5b: Proxy genes for which increased expression is associated with lower tumor grade (p-value ≤ .05) Gene Official Symbol CCF Grade Gene Official Symbol CCF Grade p-value OR p-value OR ZHX2.1 ZHX2 0.0061 0.83 ITGA4.2 ITGA4 <0.0001 0.75 YB-1.2 YBX1 <0.0001 0.62 ITGA3.2 ITGA3 0.0128 0.85 XPNPEP2.2 XPNPEP2 0.0040 0.82 IQGAP2.1 IQGAP2 <0.0001 0.68 XIAP.1 XIAP <0.0001 0.64 INSR.1 INSR <0.0001 0.46 WISP1.1 WISP1 <0.0001 0.58 INHBA.1 INHBA 0.0049 0.83 VWF.1 VWF <0.0001 0.34 IMP3.1 IMP3 <0.0001 0.67 VHL.1 VHL 0.0088 0.84 IL6ST.3 IL6ST <0.0001 0.43 VEGF.1 VEGFA <0.0001 0.48 IL1B.1 IL1B 0.0102 0.84 VCAN.1 VCAN 0.0023 0.82 IL15.1 IL15 0.0001 0.76 VCAM1.1 VCAM1 0.0049 0.83 IL10.3 IL10 0.0239 0.86 USP34.1 USP34 <0.0001 0.62 IGFBP6.1 IGFBP6 <0.0001 0.75 UMOD.1 UMOD <0.0001 0.69 IGFBP5.1 IGFBP5 <0.0001 0.74 UGCG.1 UGCG <0.0001 0.58 IGFBP2.1 IGFBP2 <0.0001 0.76 UBB.1 UBB <0.0001 0.62 IGF2.2 IGF2 <0.0001 0.69 UBE1C.1 UBA3 <0.0001 0.67 IGF1R.3 IGF1R <0.0001 0.43 tusc4.2 TUSC4 <0.0001 0.61 ID3.1 ID3 <0.0001 0.48 TUSC2.1 TUSC2 0.0481 0.88 ID2.4 ID2 <0.0001 0.64 TSPAN7.2 TSPAN7 <0.0001 0.29 ID1.1 ID1 <0.0001 0.37 TSC2.1 TSC2 <0.0001 0.60 ICAM2.1 ICAM2 <0.0001 0.42 TSC1.1 TSC1 <0.0001 0.52 HYAL2.1 HYAL2 <0.0001 0.32 P53.2 TP53 <0.0001 0.66 HYAL1.1 HYAL1 <0.0001 0.52 TOP2B.2 TOP2B <0.0001 0.68 HSPG2.1 HSPG2 <0.0001 0.33 TNIP2.1 TNIP2 0.0001 0.76 HSPA1A.1 HSPA1A 0.0022 0.81 TNFSF12.1 TNFSF12 <0.0001 0.54 HSP90AB1.1 HSP90AB1 <0.0001 0.68 TNFRSF11B.1 TNFRSF11B <0.0001 0.73 HSD11B2.1 HSD11B2 <0.0001 0.43 TNFRSF10D.1 TNFRSF10D <0.0001 0.51 HPCAL1.1 HPCAL1 <0.0001 0.69 TNFRSF10C.3 TNFRSF10C 0.0003 0.78 HNRPAB.3 HNRNPAB 0.0432 0.87 DR5.2 TNFRSF10B <0.0001 0.69 HMGB1.1 HMGB1 <0.0001 0.47 TNFAIP6.1 TNFAIP6 0.0338 0.87 HIF1AN.1 HIF1AN <0.0001 0.64 TNFAIP3.1 TNFAIP3 0.0083 0.84 HIF1A.3 HIF1A <0.0001 0.55 TNF.1 TNF 0.0392 0.87 HGF.4 HGF 0.0022 0.81 TMEM47.1 TMEM47 <0.0001 0.33 HDAC1.1 HDAC1 <0.0001 0.48 TMEM27.1 TMEM27 <0.0001 0.73 HADH.1 HADH <0.0001 0.63 TIMP3.3 TIMP3 <0.0001 0.29 GSTp.3 GSTP1 <0.0001 0.66 TIMP2.1 TIMP2 <0.0001 0.54 GSTM3.2 GSTM3 <0.0001 0.53 THBS1.1 THBS1 <0.0001 0.58 GSTM1.1 GSTM1 <0.0001 0.61 THBD.1 THBD <0.0001 0.66 GRB7.2 GRB7 <0.0001 0.73 TGFBR2.3 TGFBR2 <0.0001 0.32 GRB14.1 GRB14 0.0001 0.76 TGFBR1.1 TGFBR1 <0.0001 0.59 GPC3.1 GPC3 0.0012 0.80 TGFB2.2 TGFB2 <0.0001 0.54 GNAS.1 GNAS <0.0001 0.70 TGFb1.1 TGFB1 <0.0001 0.66 GMNN.1 GMNN 0.0006 0.80 TGFA.2 TGFA <0.0001 0.68 GJA1.1 GJA1 <0.0001 0.66 TEK.1 TEK <0.0001 0.34 GCLM.2 GCLM 0.0319 0.87 cripto (TDGF1 official). 1 TDGF1 0.0328 0.86 GCLC.3 GCLC <0.0001 0.57 TCF4.1 TCF4 <0.0001 0.33 GATM.1 GATM 0.0006 0.79 TAGLN.1 TAGLN <0.0001 0.58 GATA3.3 GATA3 0.0029 0.82 TACSTD2.1 TACSTD2 <0.0001 0.61 GAS2.1 GAS2 0.0136 0.84 SUCLG1.1 SUCLG1 <0.0001 0.76 GADD45B.1 GADD45B <0.0001 0.54 STK11.1 STK11 <0.0001 0.53 FST.1 FST 0.0197 0.85 STC2.1 STC2 0.0085 0.84 FOS.1 FOS <0.0001 0.44 STAT5B.2 STAT5B <0.0001 0.40 FOLR1.1 FOLR1 <0.0001 0.75 STAT5A.1 STAT5A <0.0001 0.60 FLT4.1 FLT4 <0.0001 0.34 STAT3.1 STAT3 <0.0001 0.48 FLT3LG.1 FLT3LG <0.0001 0.73 SPRY1.1 SPRY1 <0.0001 0.40 FLT1.1 FLT1 <0.0001 0.29 SPAST.1 SPAST 0.0002 0.78 FILIP1.1 FILIP1 <0.0001 0.47 SPARCL1.1 SPARCL1 <0.0001 0.41 FIGF.1 FIGF <0.0001 0.70 SPARC.1 SPARC <0.0001 0.50 FHL1.1 FHL1 <0.0001 0.54 SNRK.1 SNRK <0.0001 0.29 FHIT.1 FHIT <0.0001 0.72 SNAI1.1 SNAI1 <0.0001 0.54 FH.1 FH 0.0203 0.86 MADH4.1 SMAD4 <0.0001 0.39 FGFR2 isoform 1.1 FGFR2 <0.0001 0.62 MADH2.1 SMAD2 <0.0001 0.40 FGFR1.3 FGFR1 <0.0001 0.48 SLC9A1.1 SLC9A1 <0.0001 0.75 FGF2.2 FGF2 <0.0001 0.62 SLC34A1.1 SLC34A1 0.0001 0.76 FGF1.1 FGF1 <0.0001 0.61 SKIL.1 SKIL <0.0001 0.52 FDPS.1 FDPS <0.0001 0.52 SHC1.1 SHC1 0.0063 0.83 FBXW7.1 FBXW7 <0.0001 0.57 SHANK3.1 SHANK3 <0.0001 0.27 FAP.1 FAP 0.0440 0.87 SGK.1 SGK1 <0.0001 0.60 ESRRG.3 ESRRG 0.0340 0.87 FRP1.3 SFRP1 0.0003 0.78 ERG.1 ERG <0.0001 0.36 PAI1.3 SERPINE1 0.0115 0.85 ERCC4.1 ERCC4 0.0337 0.87 SEMA3F.3 SEMA3F <0.0001 0.45 ERCC1.2 ERCC1 <0.0001 0.59 SELENBP1.1 SELENBP1 <0.0001 0.63 ERBB4.3 ERBB4 <0.0001 0.66 SELE.1 SELE <0.0001 0.74 HER2.3 ERBB2 <0.0001 0.57 SDPR.1 SDPR <0.0001 0.35 EPHB4.1 EPHB4 <0.0001 0.43 SDHA.1 SDHA <0.0001 0.69 EPHA2.1 EPHA2 <0.0001 0.44 SCNN1A.2 SCNN1A 0.0011 0.80 EPAS1.1 EPAS1 <0.0001 0.26 SCN4B.1 SCN4B <0.0001 0.47 ENPP2.1 ENPP2 <0.0001 0.62 S100A2.1 S100A2 <0.0001 0.72 ENPEP.1 ENPEP <0.0001 0.75 RUNX1.1 RUNX1 0.0001 0.77 ENO2.1 ENO2 0.0449 0.88 RRM1.2 RRM1 0.0438 0.87 CD105.1 ENG <0.0001 0.30 KIAA1303 raptor. 1 RPTOR <0.0001 0.53 EMP1.1 EMP1 <0.0001 0.42 RPS6KB1.3 RPS6KB1 <0.0001 0.49 EMCN.1 EMCN <0.0001 0.31 RPS23.1 RPS23 <0.0001 0.59 ELTD1.1 ELTD1 <0.0001 0.59 ROCK2.1 ROCK2 <0.0001 0.42 EIF2C1.1 EIF2C1 <0.0001 0.63 ROCK1.1 ROCK1 <0.0001 0.31 EGR1.1 EGR1 <0.0001 0.50 RIPK1.1 RIPK1 <0.0001 0.50 EGLN3.1 EGLN3 <0.0001 0.69 rhoC.1 RHOC <0.0001 0.70 EGF.3 EGF 0.0200 0.85 RhoB.1 RHOB <0.0001 0.36 EFNB2.1 EFNB2 <0.0001 0.36 ARHA.1 RHOA <0.0001 0.34 EFNB1.2 EFNB1 <0.0001 0.46 RHEB.2 RHEB <0.0001 0.72 EEF1A1.1 EEF1A1 <0.0001 0.39 RGS5.1 RGS5 <0.0001 0.30 EDNRB.1 EDNRB <0.0001 0.33 FLJ22655.1 RERGL <0.0001 0.42 EDN2.1 EDN2 <0.0001 0.67 NFKBp65.3 RELA <0.0001 0.69 EDN1 endothelin.1 EDN1 <0.0001 0.41 RB1.1 RB1 <0.0001 0.74 EBAG9.1 EBAG9 0.0057 0.83 RASSF1.1 RASSF1 <0.0001 0.60 DUSP1.1 DUSP1 <0.0001 0.54 RARB.2 RARB <0.0001 0.41 DPEP1.1 DPEP1 0.0001 0.76 RALBP1.1 RALBP1 <0.0001 0.47 DLL4.1 DLL4 <0.0001 0.49 RAF1.3 RAF1 <0.0001 0.48 DLC1.1 DLC1 <0.0001 0.33 RAC1.3 RAC1 <0.0001 0.75 DKFZP564O08 23.1 DKFZP564O 0823 <0.0001 0.46 PXDN.1 PXDN <0.0001 0.74 DICER1.2 DICER1 <0.0001 0.41 PTPRG.1 PTPRG <0.0001 0.29 DIAPH1.1 DIAPH1 0.0022 0.81 PTPRB.1 PTPRB <0.0001 0.27 DIABLO.1 DIABLO <0.0001 0.73 PTN.1 PTN <0.0001 0.58 DHPS.3 DHPS <0.0001 0.41 PTK2.1 PTK2 <0.0001 0.36 DET1.1 DET1 <0.0001 0.63 PTHR1.1 PTH1R <0.0001 0.50 DEFB1.1 DEFB1 0.0001 0.77 PTEN.2 PTEN <0.0001 0.40 DAPK1.3 DAPK1 <0.0001 0.48 PSMA7.1 PSMA7 0.0002 0.78 DAG1.1 DAG1 0.0150 0.85 PRPS2.1 PRPS2 0.0012 0.80 CYR61.1 CYR61 <0.0001 0.49 PROM2.1 PROM2 0.0326 0.87 CXCL12.1 CXCL12 <0.0001 0.64 PRKCH.1 PRKCH <0.0001 0.45 CX3CR1.1 CX3CR1 0.0008 0.80 PRKCD.2 PRKCD <0.0001 0.76 CX3CL1.1 CX3CL1 <0.0001 0.55 PPP2CA.1 PPP2CA <0.0001 0.68 CUL1.1 CUL1 <0.0001 0.62 PPARG.3 PPARG <0.0001 0.42 CUBN.1 CUBN 0.0081 0.84 PPAP2B.1 PPAP2B <0.0001 0.32 CTSL.2 CTSL1 0.0328 0.87 PMP22.1 PMP22 <0.0001 0.61 B-Catenin.3 CTNNB1 <0.0001 0.36 PLG.1 PLG <0.0001 0.75 A-Catenin.2 CTNNA1 <0.0001 0.73 PLAT.1 PLAT <0.0001 0.42 CTGF.1 CTGF <0.0001 0.61 PLA2G4C.1 PLA2G4C 0.0002 0.78 CSF1.1 CSF1 <0.0001 0.66 PIK3CA.1 PIK3CA <0.0001 0.48 CRADD.1 CRADD 0.0151 0.85 PI3K.2 PIK3C2B <0.0001 0.53 COL5A2.2 COL5A2 0.0155 0.85 PGF.1 PGF <0.0001 0.74 COL4A2.1 COL4A2 <0.0001 0.51 PFKP.1 PFKP 0.0008 0.80 COL4A1.1 COL4A1 <0.0001 0.59 CD31.3 PECAM1 <0.0001 0.32 COL1A2.1 COL1A2 0.0005 0.79 PDZK3.1 PDZK3 <0.0001 0.72 COL18A1.1 COL18A1 <0.0001 0.53 PDZK1.1 PDZK1 <0.0001 0.76 CLDN10.1 CLDN10 0.0351 0.87 PDGFRb.3 PDGFRB <0.0001 0.42 CLCNKB.1 CLCNKB <0.0001 0.73 PDGFRa.2 PDGFRA 0.0022 0.82 CFLAR.1 CFLAR <0.0001 0.45 PDGFD.2 PDGFD <0.0001 0.39 CEACAM1.1 CEACAM1 <0.0001 0.64 PDGFC.3 PDGFC <0.0001 0.57 p27.3 CDKN1B <0.0001 0.65 PDGFB.3 PDGFB <0.0001 0.33 p21.3 CDKN1A <0.0001 0.52 PDGFA.3 PDGFA <0.0001 0.42 CDK4.1 CDK4 0.0200 0.86 PCK1.1 PCK1 <0.0001 0.71 CDH5.1 CDH5 <0.0001 0.31 PCCA.1 PCCA <0.0001 0.75 CDH16.1 CDH16 0.0005 0.79 PARD6A.1 PARD6A 0.0088 0.84 CDH13.1 CDH13 <0.0001 0.40 Pak1.2 PAK1 0.0014 0.81 CD99.1 CD99 0.0001 0.77 PAH.1 PAH 0.0160 0.85 CD44.1 CD44_1 0.0216 0.86 OGG1.1 OGG1 0.0139 0.85 CD36.1 CD36 <0.0001 0.42 BFGF.3 NUDT6 <0.0001 0.63 CD34.1 CD34 <0.0001 0.39 NPR1.1 NPR1 <0.0001 0.42 CD14.1 CD14 0.0021 0.81 NPM1.2 NPM1 <0.0001 0.61 CCND1.3 CCND1 <0.0001 0.63 NOTCH3.1 NOTCH3 <0.0001 0.40 MCP1.1 CCL2 <0.0001 0.69 NOTCH2.1 NOTCH2 <0.0001 0.58 CAT.1 CAT 0.0014 0.81 NOTCH1.1 NOTCH1 <0.0001 0.38 CASP10.1 CASP10 <0.0001 0.65 NOS3.1 NOS3 <0.0001 0.42 CALD1.2 CALD1 <0.0001 0.44 NOS2A.3 NOS2 <0.0001 0.56 CACNA2D1.1 CACNA2D1 0.0003 0.78 NOL3.1 NOL3 <0.0001 0.61 CA9.3 CA9 0.0269 0.86 NFX1.1 NFX1 <0.0001 0.53 CA2.1 CA2 0.0001 0.77 NFKBp50.3 NFKB1 <0.0001 0.59 C7.1 C7 <0.0001 0.71 NFATC2.1 NFATC2 <0.0001 0.73 C3AR1.1 C3AR1 0.0032 0.82 NFAT5.1 NFAT5 <0.0001 0.58 ECRG4.1 C2orf40 <0.0001 0.50 MYRIP.2 MYRIP <0.0001 0.63 C13orf15.1 C13orf15 <0.0001 0.37 MYH11.1 MYH11 <0.0001 0.48 BUB3.1 BUB3 <0.0001 0.65 cMYC.3 MYC <0.0001 0.68 BTRC.1 BTRC <0.0001 0.61 MX1.1 MX1 0.0087 0.84 BNIP3.1 BNIP3 0.0018 0.81 MVP.1 MVP 0.0291 0.87 CIAP1.2 BIRC2 <0.0001 0.61 MUC1.2 MUC1 0.0043 0.83 BGN.1 BGN <0.0001 0.43 FRAP1.1 MTOR <0.0001 0.61 Bclx.2 BCL2L1 <0.0001 0.76 MT1X.1 MT1X 0.0276 0.86 Bcl2.2 BCL2 <0.0001 0.45 MSH3.2 MSH3 0.0001 0.76 BAG1.2 BAG1 <0.0001 0.47 MSH2.3 MSH2 <0.0001 0.60 AXL.1 AXL <0.0001 0.74 MMP2.2 MMP2 <0.0001 0.74 ATP6V1B1.1 ATP6V1B1 <0.0001 0.65 STMY3.3 MMP11 <0.0001 0.70 ASS1.1 ASS1 <0.0001 0.67 MIF.2 MIF 0.0004 0.79 ARRB1.1 ARRB1 <0.0001 0.49 MICA.1 MICA <0.0001 0.60 ARHGDIB.1 ARHGDIB <0.0001 0.50 MGMT.1 MGMT <0.0001 0.57 ARF1.1 ARF1 <0.0001 0.69 MCM3.3 MCM3 <0.0001 0.73 AREG.2 AREG 0.0007 0.80 MCAM.1 MCAM <0.0001 0.42 AQP1.1 AQP1 <0.0001 0.49 MARCKS.1 MARCKS <0.0001 0.63 APOLD1.1 APOLD1 <0.0001 0.40 ERK1.3 MAPK3 <0.0001 0.35 APC.4 APC <0.0001 0.62 ERK2.3 MAPK1 <0.0001 0.71 APAF1.2 APAF1 <0.0001 0.76 MAP4.1 MAP4 <0.0001 0.58 ANXA1.2 ANXA1 <0.0001 0.65 MAP2K3.1 MAP2K3 <0.0001 0.60 ANTXR1.1 ANTXR1 <0.0001 0.61 MAP2K1.1 MAP2K1 <0.0001 0.62 ANGPTL4.1 ANGPTL4 <0.0001 0.75 MAL.1 MAL <0.0001 0.63 ANGPTL2.1 ANGPTL2 <0.0001 0.60 LRP2.1 LRP2 0.0275 0.86 ANGPT2.1 ANGPT2 <0.0001 0.61 LMO2.1 LMO2 <0.0001 0.68 ANGPT1.1 ANGPT1 <0.0001 0.33 LDB2.1 LDB2 <0.0001 0.28 ALDOB.1 ALDOB 0.0348 0.87 LDB1.2 LDB1 <0.0001 0.52 ALDH6A1.1 ALDH6A1 <0.0001 0.61 LAMB1.1 LAMB1 <0.0001 0.73 AKT3.2 AKT3 <0.0001 0.30 LAMA4.1 LAMA4 <0.0001 0.55 AKT2.3 AKT2 <0.0001 0.65 KRT7.1 KRT7 <0.0001 0.61 AKT1.3 AKT1 <0.0001 0.50 K-ras.10 KRAS <0.0001 0.54 AHR.1 AHR <0.0001 0.55 KL.1 KL <0.0001 0.62 AGTR1.1 AGTR1 <0.0001 0.44 Kitlng.4 KITLG <0.0001 0.46 ADH1B.1 ADH1B <0.0001 0.70 c-kit.2 KIT <0.0001 0.48 ADD1.1 ADD1 <0.0001 0.40 KDR.6 KDR <0.0001 0.33 ADAMTS9.1 ADAMTS9 <0.0001 0.64 KCNJ15.1 KCNJ15 <0.0001 0.67 ADAMTS5.1 ADAMTS5 <0.0001 0.56 HTATIP.1 KAT5 <0.0001 0.33 ADAMTS4.1 ADAMTS4 <0.0001 0.66 G-Catenin.1 JUP <0.0001 0.39 ADAMTS2.1 ADAMTS2 <0.0001 0.69 AP-1 (JUN official).2 JUN <0.0001 0.54 ADAMTS1.1 ADAMTS1 <0.0001 0.51 JAG1.1 JAG1 <0.0001 0.28 ADAM17.1 ADAM17 <0.0001 0.67 ITGB5.1 ITGB5 <0.0001 0.60 ACADSB.1 ACADSB <0.0001 0.63 ITGB3.1 ITGB3 <0.0001 0.68 BCRP.1 ABCG2 <0.0001 0.43 ITGB1.1 ITGB1 <0.0001 0.46 MRP4.2 ABCC4 0.0337 0.87 ITGA7.1 ITGA7 <0.0001 0.40 AAMP.1 AAMP <0.0001 0.71 ITGA6.2 ITGA6 <0.0001 0.51 A2M.1 A2M <0.0001 0.29 ITGA5.1 ITGA5 <0.0001 0.62 Table 6a: Proxy genes for which increased expression is associated with the presence of necrosis (p-value ≤ .05) Gene Official Symbol CCF Necrosis Gene Official Symbol CCF Necrosis p-value OR p-value OR WT1.1 WT1 <0.0001 1.57 KRT19.3 KRT19 0.0001 1.43 VTN.1 VTN <0.0001 1.38 ITGB4.2 ITGB4 0.0492 1.19 VDR.2 VDR 0.0013 1.34 ISG20.1 ISG20 0.0006 1.38 UBE2T.1 UBE2T <0.0001 2.08 IL-8.1 IL8 <0.0001 2.40 TP.3 TYMP 0.0008 1.37 IL6.3 IL6 <0.0001 2.02 TSPAN8.1 TSPAN8 0.0016 1.29 ICAM1.1 ICAM1 <0.0001 1.75 C20 orf1.1 TPX2 <0.0001 2.64 HSPA8.1 HSPA8 0.0004 1.38 TOP2A.4 TOP2A <0.0001 2.02 HIST1H1D.1 HIST1H1D 0.0017 1.33 TNFSF13B.1 TNFSF13B 0.0002 1.38 GPX1.2 GPX1 <0.0001 1.46 TK1.2 TK1 <0.0001 1.71 FZD2.2 FZD2 0.0031 1.27 TIMP1.1 TIMP1 0.0076 1.27 FN1.1 FN1 <0.0001 1.45 TGFBI.1 TGFBI <0.0001 1.69 FCGR3A.1 FCGR3A 0.0001 1.43 OPN, osteopontin.3 SPP1 <0.0001 1.81 FCER1G.2 FCER1G <0.0001 1.50 SPHK1.1 SPHK1 <0.0001 1.44 FAP.1 FAP 0.0395 1.20 SLC7A5.2 SLC7A5 <0.0001 2.12 F3.1 F3 <0.0001 1.62 SLC2A1.1 SLC2A1 <0.0001 1.46 F2.1 F2 <0.0001 1.76 SLC16A3.1 SLC16A3 0.0001 1.48 ESPL1.3 ESPL1 0.0008 1.33 SLC13A3.1 SLC13A3 0.0019 1.29 EPHB2.1 EPHB2 0.0037 1.28 SHC1.1 SHC1 0.0156 1.24 EPHB1.3 EPHB1 0.0041 1.25 SFN.1 SFN <0.0001 1.57 EPB41L3.1 EPB41L3 0.0410 1.19 PAI1.3 SERPINE1 0.0164 1.25 ENO2.1 ENO2 0.0001 1.46 SERPINA5.1 SERPINA5 0.0016 1.27 EIF4EBP1.1 EIF4EBP1 <0.0001 1.60 SEMA3C.1 SEMA3C <0.0001 2.14 E2F1.3 E2F1 <0.0001 1.65 SELL.1 SELL 0.0096 1.26 CXCR6.1 CXCR6 <0.0001 1.48 SAA2.2 SAA2 <0.0001 2.50 CXCR4.3 CXCR4 0.0118 1.26 RRM2.1 RRM2 <0.0001 1.86 GRO1.2 CXCL1 <0.0001 1.83 RPLP1.1 RPLP1 0.0025 1.32 CTSB.1 CTSB <0.0001 1.70 RND3.1 RND3 0.0002 1.41 CRP.1 CRP 0.0494 1.16 RAD51.1 RAD51 <0.0001 1.51 CP.1 CP <0.0001 1.98 PTTG1.2 PTTG1 <0.0001 2.52 COL7A1.1 COL7A1 <0.0001 1.47 COX2.1 PTGS2 0.0002 1.36 COL1A1.1 COL1A1 0.0059 1.28 PRKCB1.1 PRKCB 0.0188 1.23 Chk2.3 CHEK2 0.0010 1.33 PRKCA.1 PRKCA 0.0339 1.21 Chk1.2 CHEK1 <0.0001 1.49 PLAUR.3 PLAUR <0.0001 1.60 CENPF.1 CENPF <0.0001 2.08 upa.3 PLAU 0.0002 1.41 CD82.3 CD82 <0.0001 2.09 PF4.1 PF4 0.0003 1.34 CD68.2 CD68 0.0163 1.24 PDCD1.1 PDCD1 <0.0001 1.40 CD44s.1 CD44_s <0.0001 1.66 PCSK6.1 PCSK6 0.0297 1.22 CCNE2.2 CCNE2_2 <0.0001 1.50 PCNA.2 PCNA 0.0025 1.33 CCNE1.1 CCNE1 <0.0001 1.44 NNMT.1 NNMT 0.0206 1.22 CCNB1.2 CCNB1 <0.0001 2.28 NME2.1 NME2 0.0124 1.25 CCL5.2 CCL5 <0.0001 1.45 MYBL2.1 MYBL2 <0.0001 1.90 CCL20.1 CCL20 0.0121 1.24 MT1X.1 MT1X 0.0003 1.39 CAV2.1 CAV2 0.0003 1.35 MMP9.1 MMP9 <0.0001 1.96 CA12.1 CA12 <0.0001 2.11 MMP7.1 MMP7 <0.0001 1.50 C3.1 C3 <0.0001 1.58 MMP14.1 MMP14 <0.0001 1.50 C1QB.1 C1QB 0.0032 1.31 Ki-67.2 MKI67 <0.0001 1.96 BUB1.1 BUB1 <0.0001 2.25 mGST1.2 MGST1 <0.0001 1.63 BRCA1.2 BRCA1 0.0006 1.35 cMet.2 MET 0.0357 1.22 SURV.2 BIRC5 <0.0001 2.11 MDK.1 MDK <0.0001 1.78 clAP2.2 BIRC3 <0.0001 1.47 MCM2.2 MCM2 0.0003 1.40 BCL2A1.1 BCL2A1 0.0004 1.34 LRRC2.1 LRRC2 0.0114 1.22 STK15.2 AURKA <0.0001 1.61 LOX.1 LOX <0.0001 1.99 PRO2000.3 ATAD2 0.0166 1.24 LMNB1.1 LMNB1 <0.0001 2.04 APOL1.1 APOL1 <0.0001 1.54 LIMK1.1 LIMK1 <0.0001 2.51 APOC1.3 APOC1 0.0026 1.30 LGALS9.1 LGALS9 0.0136 1.25 ANXA2.2 ANXA2 <0.0001 1.71 LGALS1.1 LGALS1 <0.0001 1.46 ALOX5.1 ALOX5 0.0004 1.38 LAPTM5.1 LAPTM5 <0.0001 1.47 ADAM8.1 ADAM8 <0.0001 1.89 LAMB3.1 LAMB3 <0.0001 1.96 MRP2.3 ABCC2 0.0002 1.39 L1CAM.1 L1CAM <0.0001 1.43 Table 6b: Proxy genes for which increased expression is associated with the absence of necrosis (p-value ≤ .05) Gene Official Symbol CCF Necrosis Gene Official Symbol CCF Necrosis p-value OR p-value OR YB-1.2 YBX1 0.0010 0.74 IGF2.2 IGF2 0.0117 0.79 XIAP.1 XIAP <0.0001 0.68 IGF1R.3 IGF1R <0.0001 0.38 WWOX.5 WWOX <0.0001 0.63 ID3.1 ID3 <0.0001 0.44 WISP1.1 WISP1 0.0002 0.71 ID2.4 ID2 <0.0001 0.68 VWF.1 VWF <0.0001 0.35 ID1.1 ID1 <0.0001 0.32 VHL.1 VHL 0.0086 0.78 ICAM2.1 ICAM2 <0.0001 0.47 VEGF.1 VEGFA <0.0001 0.50 HYAL2.1 HYAL2 <0.0001 0.28 VCAM1.1 VCAM1 <0.0001 0.55 HYAL1.1 HYAL1 <0.0001 0.39 USP34.1 USP34 <0.0001 0.64 HSPG2.1 HSPG2 <0.0001 0.33 UMOD.1 UMOD <0.0001 0.36 HSP90AB1.1 HSP90AB1 0.0004 0.73 UGCG.1 UGCG <0.0001 0.54 HSD11B2.1 HSD11B2 <0.0001 0.32 UBB.1 UBB <0.0001 0.48 Hepsin.1 HPN <0.0001 0.59 UBE1C.1 UBA3 <0.0001 0.59 HPCAL1.1 HPCAL1 <0.0001 0.68 TS.1 TYMS <0.0001 0.70 HMGB1.1 HMGB1 <0.0001 0.42 tusc4.2 TUSC4 <0.0001 0.68 HLA-DPB1.1 HLA-DPB1 0.0002 0.72 TUSC2.1 TUSC2 0.0462 0.83 HIF1AN.1 HIF1AN <0.0001 0.54 TSPAN7.2 TSPAN7 <0.0001 0.25 HDAC1.1 HDAC1 <0.0001 0.55 TSC2.1 TSC2 <0.0001 0.45 HAVCR1.1 HAVCR1 0.0012 0.76 TSC1.1 TSC1 <0.0001 0.45 HADH.1 HADH <0.0001 0.49 P53.2 TP53 <0.0001 0.61 GSTT1.3 GSTT1 0.0067 0.80 TOP2B.2 TOP2B <0.0001 0.69 GSTp.3 GSTP1 <0.0001 0.55 TNFSF12.1 TNFSF12 <0.0001 0.51 GSTM3.2 GSTM3 <0.0001 0.48 TRAIL.1 TNFSF10 <0.0001 0.68 GSTM1.1 GSTM1 <0.0001 0.54 TNFRSF11B.1 TNFRSF11B <0.0001 0.59 GRB7.2 GRB7 <0.0001 0.49 TNFRSF10D.1 TNFRSF10D <0.0001 0.58 GPX3.1 GPX3 <0.0001 0.59 DR5.2 TNFRSF10B 0.0001 0.71 GPC3.1 GPC3 0.0287 0.81 TNFAIP6.1 TNFAIP6 <0.0001 0.67 GJA1.1 GJA1 0.0004 0.74 TMEM47.1 TMEM47 <0.0001 0.29 GFRA1.1 GFRA1 0.0011 0.74 TMEM27.1 TMEM27 <0.0001 0.40 GCLC.3 GCLC <0.0001 0.50 TLR3.1 TLR3 <0.0001 0.64 GATM.1 GATM <0.0001 0.45 TIMP3.3 TIMP3 <0.0001 0.23 GATA3.3 GATA3 0.0159 0.79 TIMP2.1 TIMP2 <0.0001 0.52 GADD45B.1 GADD45B <0.0001 0.67 THBS1.1 THBS1 <0.0001 0.62 FOS.1 FOS <0.0001 0.56 TGFBR2.3 TGFBR2 <0.0001 0.34 FOLR1.1 FOLR1 <0.0001 0.59 TGFBR1.1 TGFBR1 <0.0001 0.63 FLT4.1 FLT4 <0.0001 0.27 TGFB2.2 TGFB2 <0.0001 0.55 FLT3LG.1 FLT3LG <0.0001 0.62 TGFb1.1 TGFB1 0.0036 0.76 FLT1.1 FLT1 <0.0001 0.32 TGFA.2 TGFA <0.0001 0.56 FILIP1.1 FILIP1 <0.0001 0.42 TEK.1 TEK <0.0001 0.23 FIGF.1 FIGF 0.0001 0.62 TCF4.1 TCF4 <0.0001 0.36 FHL1.1 FHL1 <0.0001 0.36 TAGLN.1 TAGLN <0.0001 0.50 FHIT.1 FHIT <0.0001 0.63 TACSTD2.1 TACSTD2 <0.0001 0.64 FH.1 FH <0.0001 0.65 SUCLG1.1 SUCLG1 <0.0001 0.50 FGFR2 isoform 1.1 FGFR2 <0.0001 0.51 STK11.1 STK11 <0.0001 0.48 FGFR1.3 FGFR1 <0.0001 0.55 STAT5B.2 STAT5B <0.0001 0.36 FGF2.2 FGF2 <0.0001 0.61 STAT5A.1 STAT5A <0.0001 0.56 FGF1.1 FGF1 <0.0001 0.49 STAT3.1 STAT3 <0.0001 0.63 FDPS.1 FDPS <0.0001 0.43 SPRY1.1 SPRY1 <0.0001 0.42 FBXW7.1 FBXW7 <0.0001 0.60 SPAST.1 SPAST 0.0004 0.74 fas.1 FAS 0.0054 0.79 SPARCL1.1 SPARCL1 <0.0001 0.48 ESRRG.3 ESRRG <0.0001 0.68 SPARC.1 SPARC <0.0001 0.54 ERG.1 ERG <0.0001 0.34 SOD1.1 SOD1 <0.0001 0.67 ERCC4.1 ERCC4 0.0197 0.81 SNRK.1 SNRK <0.0001 0.25 ERCC1.2 ERCC1 <0.0001 0.60 SNAI1.1 SNAI1 0.0004 0.71 ERBB4.3 ERBB4 0.0037 0.72 MADH4.1 SMAD4 <0.0001 0.33 ErbB3.1 ERBB3 <0.0001 0.59 MADH2.1 SMAD2 <0.0001 0.40 HER2.3 ERBB2 <0.0001 0.40 SLC34A1.1 SLC34A1 <0.0001 0.47 EPHB4.1 EPHB4 <0.0001 0.44 SLC22A6.1 SLC22A6 <0.0001 0.52 EPHA2.1 EPHA2 <0.0001 0.36 SKIL.1 SKIL <0.0001 0.59 EPAS1.1 EPAS1 <0.0001 0.29 SHANK3.1 SHANK3 <0.0001 0.25 ENPP2.1 ENPP2 <0.0001 0.50 SGK.1 SGK1 <0.0001 0.54 ENPEP.1 ENPEP <0.0001 0.56 FRP1.3 SFRP1 0.0053 0.77 CD105.1 ENG <0.0001 0.31 SEMA3F.3 SEMA3F <0.0001 0.43 EMP1.1 EMP1 <0.0001 0.49 SELENBP1.1 SELENBP1 <0.0001 0.62 EMCN.1 EMCN <0.0001 0.23 SDPR.1 SDPR <0.0001 0.28 ELTD1.1 ELTD1 <0.0001 0.59 SDHA.1 SDHA <0.0001 0.47 EIF2C1.1 EIF2C1 <0.0001 0.52 SCNN1A.2 SCNN1A 0.0013 0.73 EGR1.1 EGR1 <0.0001 0.54 SCN4B.1 SCN4B <0.0001 0.35 EGLN3.1 EGLN3 <0.0001 0.69 S100A2.1 S100A2 0.0355 0.82 EGFR.2 EGFR <0.0001 0.70 KIAA1303 raptor.1 RPTOR <0.0001 0.49 EFNB2.1 EFNB2 <0.0001 0.34 RPS6KB1.3 RPS6KB1 <0.0001 0.55 EFNB1.2 EFNB1 <0.0001 0.41 RPS6KAI.1 RPS6KA1 0.0002 0.68 EEF1A1.1 EEF1A1 <0.0001 0.32 RPS23.1 RPS23 <0.0001 0.47 EDNRB.1 EDNRB <0.0001 0.31 ROCK2.1 ROCK2 <0.0001 0.39 EDN2.1 EDN2 <0.0001 0.51 ROCK1.1 ROCK1 <0.0001 0.35 EDN1 endothelin.1 EDN1 <0.0001 0.41 RIPK1.1 RIPK1 <0.0001 0.45 EBAG9.1 EBAG9 0.0007 0.74 rhoC.1 RHOC 0.0001 0.70 DUSP1.1 DUSP1 <0.0001 0.65 RhoB.1 RHOB <0.0001 0.41 DPYS.1 DPYS <0.0001 0.66 ARHA.1 RHOA <0.0001 0.45 DPEP1.1 DPEP1 <0.0001 0.34 RHEB.2 RHEB 0.0002 0.69 DLL4.1 DLL4 <0.0001 0.49 RGS5.1 RGS5 <0.0001 0.26 DLC1.1 DLC1 <0.0001 0.36 FLJ22655.1 RERGL <0.0001 0.26 DKFZP564O08 23.1 DKFZP564O 0823 <0.0001 0.35 NFKBp65.3 RELA <0.0001 0.71 DICER1.2 DICER1 <0.0001 0.46 RB1.1 RB1 <0.0001 0.54 DIAPH1.1 DIAPH1 <0.0001 0.63 RASSF1.1 RASSF1 <0.0001 0.63 DIABLO.1 DIABLO 0.0002 0.72 RARB.2 RARB <0.0001 0.28 DHPS.3 DHPS <0.0001 0.46 RALBP1.1 RALBP1 <0.0001 0.52 DET1.1 DET1 <0.0001 0.61 RAF1.3 RAF1 <0.0001 0.58 DEFB1.1 DEFB1 <0.0001 0.69 RAC1.3 RAC1 0.0118 0.80 DDC.1 DDC <0.0001 0.51 PTPRG.1 PTPRG <0.0001 0.27 DCXR.1 DCXR 0.0061 0.78 PTPRB.1 PTPRB <0.0001 0.22 DAPK1.3 DAPK1 <0.0001 0.47 PTN.1 PTN <0.0001 0.41 CYR61.1 CYR61 <0.0001 0.52 PTK2.1 PTK2 <0.0001 0.33 CYP3A4.2 CYP3A4 0.0398 0.82 PTHR1.1 PTH1R <0.0001 0.32 CYP2C8v2.1 CYP2C8_21 0.0001 0.67 PTEN.2 PTEN <0.0001 0.44 CXCL12.1 CXCL12 <0.0001 0.53 PSMA7.1 PSMA7 0.0173 0.81 CX3CR1.1 CX3CR1 <0.0001 0.60 PRSS8.1 PRSS8 <0.0001 0.62 CX3CL1.1 CX3CL1 <0.0001 0.34 PRKCH.1 PRKCH <0.0001 0.43 CUL1.1 CUL1 <0.0001 0.62 PRKCD.2 PRKCD <0.0001 0.68 CUBN.1 CUBN <0.0001 0.39 PPP2CA.1 PPP2CA <0.0001 0.53 CTSH.2 CTSH 0.0018 0.77 PPARG.3 PPARG <0.0001 0.37 B-Catenin.3 CTNNB1 <0.0001 0.38 PPAP2B.1 PPAP2B <0.0001 0.27 A-Catenin.2 CTNNA1 <0.0001 0.58 PMP22.1 PMP22 0.0155 0.81 CTGF.1 CTGF <0.0001 0.64 PLG.1 PLG <0.0001 0.38 CSF1R.2 CSF1R 0.0308 0.83 PLAT. 1 PLAT <0.0001 0.42 CSF1.1 CSF1 0.0002 0.73 PLA2G4C.1 PLA2G4C <0.0001 0.48 CRADD.1 CRADD <0.0001 0.60 PIK3CA.1 PIK3CA <0.0001 0.47 COL4A2.1 COL4A2 <0.0001 0.51 PI3K.2 PIK3C2B <0.0001 0.42 COL4A1.1 COL4A1 <0.0001 0.66 PGF.1 PGF 0.0153 0.80 COL18A1.1 COL18A1 <0.0001 0.50 PFKP.1 PFKP <0.0001 0.70 CLU.3 CLU 0.0091 0.80 CD31.3 PECAM1 <0.0001 0.34 CLDN7.2 CLDN7 0.0029 0.76 PDZK3.1 PDZK3 <0.0001 0.49 CLDN10.1 CLDN10 <0.0001 0.48 PDZK1.1 PDZK1 <0.0001 0.45 CLCNKB.1 CLCNKB 0.0001 0.61 PDGFRb.3 PDGFRB <0.0001 0.45 CFLAR.1 CFLAR <0.0001 0.47 PDGFD.2 PDGFD <0.0001 0.33 CEACAM1.1 CEACAM1 <0.0001 0.43 PDGFC.3 PDGFC <0.0001 0.53 p27.3 CDKN1B 0.0002 0.73 PDGFB.3 PDGFB <0.0001 0.33 p21.3 CDKN1A <0.0001 0.65 PDGFA.3 PDGFA <0.0001 0.43 CDH6.1 CDH6 <0.0001 0.67 PCK1.1 PCK1 <0.0001 0.44 CDH5.1 CDH5 <0.0001 0.33 PCCA.1 PCCA <0.0001 0.47 CDH2.1 CDH2 0.0003 0.75 PARD6A.1 PARD6A 0.0045 0.77 CDH16.1 CDH16 <0.0001 0.51 Pak1.2 PAK1 0.0003 0.74 CDH13.1 CDH13 <0.0001 0.39 PAH.1 PAH <0.0001 0.62 CD36.1 CD36 <0.0001 0.41 OGG1.1 OGG1 <0.0001 0.62 CD34.1 CD34 <0.0001 0.34 BFGF.3 NUDT6 <0.0001 0.45 CD24.1 CD24 0.0148 0.81 NRG1.3 NRG1 0.0004 0.69 CCND1.3 CCND1 <0.0001 0.51 NPR1.1 NPR1 <0.0001 0.36 MCP1.1 CCL2 <0.0001 0.68 NPM1.2 NPM1 <0.0001 0.55 CAT.1 CAT <0.0001 0.48 NOTCH3.1 NOTCH3 <0.0001 0.40 CASP10.1 CASP10 <0.0001 0.62 NOTCH2.1 NOTCH2 <0.0001 0.68 CALD1.2 CALD1 <0.0001 0.42 NOTCH1.1 NOTCH1 <0.0001 0.38 CACNA2D1.1 CACNA2D1 0.0006 0.74 NOS3.1 NOS3 <0.0001 0.37 CA2.1 CA2 <0.0001 0.60 NOS2A.3 NOS2 <0.0001 0.42 C7.1 C7 <0.0001 0.65 NOL3.1 NOL3 <0.0001 0.67 ECRG4.1 C2orf40 <0.0001 0.32 NFX1.1 NFX1 <0.0001 0.43 C13orf15.1 C13orf15 <0.0001 0.31 NFKBp50.3 NFKB1 <0.0001 0.56 BUB3.1 BUB3 <0.0001 0.65 NFATC2.1 NFATC2 <0.0001 0.67 BTRC.1 BTRC <0.0001 0.63 NFAT5.1 NFAT5 <0.0001 0.55 BNIP3.1 BNIP3 0.0021 0.77 MYRIP.2 MYRIP <0.0001 0.36 CIAP1.2 BIRC2 <0.0001 0.56 MYH11.1 MYH11 <0.0001 0.35 BIN1.3 BIN1 <0.0001 0.67 cMYC.3 MYC <0.0001 0.68 BGN.1 BGN <0.0001 0.47 MVP.1 MVP <0.0001 0.66 BCL2L12.1 BCL2L12 0.0374 0.82 FRAP1.1 MTOR <0.0001 0.56 Bclx.2 BCL2L1 <0.0001 0.60 MSH3.2 MSH3 <0.0001 0.47 Bcl2.2 BCL2 <0.0001 0.31 MSH2.3 MSH2 <0.0001 0.51 BAG1.2 BAG1 <0.0001 0.42 MMP2.2 MMP2 0.0229 0.82 BAD.1 BAD 0.0187 0.82 STMY3.3 MMP11 <0.0001 0.66 AXL.1 AXL 0.0077 0.79 GBL.1 MLST8 0.0193 0.82 ATP6V1B1.1 ATP6V1B1 <0.0001 0.52 MIF.2 MIF <0.0001 0.69 ASS1.1 ASS1 <0.0001 0.61 MICA.1 MICA <0.0001 0.52 ARRB1.1 ARRB1 <0.0001 0.48 MGMT.1 MGMT <0.0001 0.50 ARHGDIB.1 ARHGDIB <0.0001 0.48 MCM3.3 MCM3 0.0105 0.78 ARF1.1 ARF1 0.0021 0.75 MCAM.1 MCAM <0.0001 0.41 AQP1.1 AQP1 <0.0001 0.28 MARCKS.1 MARCKS 0.0259 0.82 APOLD1.1 APOLD1 <0.0001 0.35 ERK1.3 MAPK3 <0.0001 0.35 APC.4 APC <0.0001 0.55 ERK2.3 MAPK1 <0.0001 0.61 APAF1.2 APAF1 0.0264 0.82 MAP4.1 MAP4 <0.0001 0.54 ANXA4.1 ANXA4 0.0012 0.76 MAP2K3.1 MAP2K3 <0.0001 0.52 ANXA1.2 ANXA1 0.0201 0.81 MAP2K1.1 MAP2K1 0.0172 0.81 ANTXR1.1 ANTXR1 <0.0001 0.58 MAL2.1 MAL2 0.0267 0.82 ANGPTL4.1 ANGPTL4 <0.0001 0.71 MAL.1 MAL <0.0001 0.46 ANGPTL3.3 ANGPTL3 0.0104 0.77 LTF.1 LTF 0.0038 0.74 ANGPTL2.1 ANGPTL2 <0.0001 0.63 LRP2.1 LRP2 <0.0001 0.52 ANGPT2.1 ANGPT2 <0.0001 0.65 LMO2.1 LMO2 <0.0001 0.60 ANGPT1.1 ANGPT1 <0.0001 0.30 LDB2.1 LDB2 <0.0001 0.26 AMACR1.1 AMACR 0.0080 0.79 LDB1.2 LDB1 <0.0001 0.52 ALDOB.1 ALDOB <0.0001 0.40 LAMA4.1 LAMA4 <0.0001 0.67 ALDH6A1.1 ALDH6A1 <0.0001 0.38 KRT7.1 KRT7 <0.0001 0.56 ALDH4.2 ALDH4A1 0.0001 0.71 K-ras.10 KRAS <0.0001 0.48 AKT3.2 AKT3 <0.0001 0.30 KL.1 KL <0.0001 0.34 AKT2.3 AKT2 <0.0001 0.53 KitIng.4 KITLG <0.0001 0.46 AKT1.3 AKT1 <0.0001 0.47 c-kit.2 KIT <0.0001 0.41 AHR.1 AHR <0.0001 0.60 KDR.6 KDR <0.0001 0.28 AGTR1.1 AGTR1 <0.0001 0.33 KCNJ15.1 KCNJ15 <0.0001 0.43 AGT.1 AGT 0.0032 0.77 HTATIP.1 KAT5 <0.0001 0.27 ADH6.1 ADH6 0.0011 0.71 G-Catenin.1 JUP <0.0001 0.32 ADH1B.1 ADH1B <0.0001 0.69 AP-1 (JUN official).2 JUN <0.0001 0.64 ADFP.1 ADFP 0.0001 0.73 JAG1.1 JAG1 <0.0001 0.23 ADD1.1 ADD1 <0.0001 0.33 ITGB5.1 ITGB5 <0.0001 0.64 ADAMTS9.1 ADAMTS9 <0.0001 0.69 ITGB3.1 ITGB3 0.0468 0.84 ADAMTS5.1 ADAMTS5 <0.0001 0.55 ITGB1.1 ITGB1 <0.0001 0.59 ADAMTS1.1 ADAMTS1 <0.0001 0.56 ITGA7.1 ITGA7 <0.0001 0.38 ADAM17.1 ADAM17 0.0009 0.76 ITGA6.2 ITGA6 <0.0001 0.40 ACE2.1 ACE2 <0.0001 0.45 ITGA5.1 ITGA5 0.0298 0.83 ACADSB.1 ACADSB <0.0001 0.46 ITGA4.2 ITGA4 <0.0001 0.61 BCRP.1 ABCG2 <0.0001 0.27 ITGA3.2 ITGA3 0.0018 0.76 MRP4.2 ABCC4 <0.0001 0.61 IQGAP2.1 IQGAP2 <0.0001 0.52 MRP3.1 ABCC3 0.0011 0.76 INSR.1 INSR <0.0001 0.38 MRP1.1 ABCC1 0.0008 0.75 IMP3.1 IMP3 <0.0001 0.53 ABCB1.5 ABCB1 <0.0001 0.59 IL6ST.3 IL6ST <0.0001 0.36 NPD009 (ABAT official).3 ABAT 0.0001 0.70 IL15.1 IL15 <0.0001 0.67 AAMP.1 AAMP <0.0001 0.62 IGFBP6.1 IGFBP6 <0.0001 0.66 A2M.1 A2M <0.0001 0.28 Table 7a: Proxy genes for which increased expression is associated with the presence of nodal invasion (p-value ≤ .05) Gene Official Symbol Nodal Invasion Gene Official Symbol Nodal Invasion p-value OR p-value OR TUBB.1 TUBB2A 0.0242 2.56 IL-8.1 IL8 0.0019 3.18 C20 orf1.1 TPX2 0.0333 2.61 IL6.3 IL6 0.0333 2.31 TK1.2 TK1 0.0361 1.75 HSPA1A.1 HSPA1A 0.0498 2.11 SPHK1.1 SPHK1 0.0038 3.43 GSTp.3 GSTP1 0.0272 3.46 SLC7A5.2 SLC7A5 0.0053 4.85 GRB14.1 GRB14 0.0287 2.32 SILV.1 SILV 0.0470 1.54 GMNN.1 GMNN 0.0282 3.00 SELE.1 SELE 0.0311 1.93 ENO2.1 ENO2 0.0190 3.43 upa.3 PLAU 0.0450 2.78 CCNB1.2 CCNB1 0.0387 1.87 MMP9.1 MMP9 0.0110 2.65 BUB1.1 BUB1 0.0429 2.21 MMP7.1 MMP7 0.0491 2.34 BAG2.1 BAG2 0.0346 2.54 MMP14.1 MMP14 0.0155 3.21 ADAMTS1.1 ADAMTS1 0.0193 3.31 LAMB1.1 LAMB1 0.0247 3.04 Table 7b: Proxy genes for which increased expression is associated with the absence of nodal invasion (p-value ≤ .05) Gene Official Symbol Nodal Invasion Gene Official Symbol Nodal Invasion p-value OR p-value OR VWF.1 VWF 0.0221 0.42 HMGB1.1 HMGB1 0.0385 0.45 VCAM1.1 VCAM1 0.0212 0.42 HLA-DPB1.1 HLA-DPB1 0.0398 0.43 UBE1C.1 UBA3 0.0082 0.32 HADH.1 HADH 0.0093 0.33 tusc4.2 TUSC4 0.0050 0.28 GSTM1.1 GSTM1 0.0018 0.18 TSPAN7.2 TSPAN7 0.0407 0.43 GPX2.2 GPX2 0.0211 0.07 TSC1.1 TSC1 0.0372 0.38 GJA1.1 GJA1 0.0451 0.46 TMSB10.1 TMSB10 0.0202 0.43 GATM.1 GATM 0.0038 0.25 TMEM47.1 TMEM47 0.0077 0.32 GATA3.3 GATA3 0.0188 0.06 TMEM27.1 TMEM27 0.0431 0.41 FOLR1.1 FOLR1 0.0152 0.32 TLR3.1 TLR3 0.0041 0.32 FLT4.1 FLT4 0.0125 0.22 TIMP3.3 TIMP3 0.0309 0.40 FLT1.1 FLT1 0.0046 0.35 TGFBR2.3 TGFBR2 0.0296 0.35 FHL1.1 FHL1 0.0435 0.47 TGFB2.2 TGFB2 0.0371 0.30 FHIT.1 FHIT 0.0061 0.29 TGFA.2 TGFA 0.0025 0.32 fas.1 FAS 0.0163 0.39 TEK.1 TEK 0.0018 0.09 ErbB3.1 ERBB3 0.0145 0.33 TCF4.1 TCF4 0.0088 0.38 EPHA2.1 EPHA2 0.0392 0.37 STAT5A.1 STAT5A 0.0129 0.49 EPAS1.1 EPAS1 0.0020 0.28 SPRY1.1 SPRY1 0.0188 0.43 ENPEP.1 ENPEP 0.0002 0.34 SPARCL1.1 SPARCL1 0.0417 0.50 CD105.1 ENG 0.0112 0.38 SOD1.1 SOD1 0.0014 0.23 EMCN.1 EMCN 0.0022 0.19 SNRK.1 SNRK 0.0226 0.43 EIF2C1.1 EIF2C1 0.0207 0.33 MADH2.1 SMAD2 0.0098 0.37 EGLN3.1 EGLN3 0.0167 0.52 SLC22A6.1 SLC22A6 0.0051 0.00 EFNB2.1 EFNB2 0.0192 0.30 PTPNS1.1 SIRPA 0.0206 0.43 EFNB1.2 EFNB1 0.0110 0.37 SHANK3.1 SHANK3 0.0024 0.30 EDNRB.1 EDNRB 0.0106 0.36 SGK.1 SGK1 0.0087 0.35 EDN1 endothelin.1 EDN1 0.0440 0.42 SELENBP1.1 SELENBP1 0.0016 0.29 DPYS.1 DPYS 0.0454 0.43 SCN4B.1 SCN4B 0.0081 0.08 DKFZP564O08 23.1 DKFZP564O 0823 0.0131 0.31 ROCK1.1 ROCK1 0.0058 0.41 DHPS.3 DHPS 0.0423 0.48 RhoB.1 RHOB 0.0333 0.43 DAPK1.3 DAPK1 0.0048 0.39 RGS5.1 RGS5 0.0021 0.31 CYP2C8v2.1 CYP2C8_21 0.0003 0.01 FLJ22655.1 RERGL 0.0009 0.01 CYP2C8.2 CYP2C8_2 0.0269 0.07 RB1.1 RB1 0.0281 0.48 CX3CR1.1 CX3CR1 0.0224 0.13 RASSF1.1 RASSF1 0.0004 0.23 CUBN.1 CUBN 0.0010 0.04 PTPRB.1 PTPRB 0.0154 0.40 CRADD.1 CRADD 0.0193 0.40 PTK2.1 PTK2 0.0158 0.38 CLDN10.1 CLDN10 0.0005 0.21 PTHR1.1 PTH1R <0.0001 0.01 CFLAR.1 CFLAR 0.0426 0.49 PRSS8.1 PRSS8 0.0023 0.10 CEACAM1.1 CEACAM1 0.0083 0.23 PRKCH.1 PRKCH 0.0475 0.48 CDKN2A.2 CDKN2A 0.0026 0.13 PPAP2B.1 PPAP2B 0.0110 0.40 p27.3 CDKN1B 0.0393 0.60 PLA2G4C.1 PLA2G4C 0.0002 0.03 CDH5.1 CDH5 0.0038 0.33 PI3K.2 PIK3C2B 0.0138 0.13 CDH13.1 CDH13 0.0203 0.39 PFKP.1 PFKP 0.0040 0.41 CD99.1 CD99 0.0173 0.38 CD31.3 PECAM1 0.0077 0.38 CD36.1 CD36 0.0015 0.29 PDGFD.2 PDGFD 0.0169 0.35 CD34.1 CD34 0.0250 0.38 PDGFC.3 PDGFC 0.0053 0.36 CD3z.1 CD247 0.0419 0.33 PDGFB.3 PDGFB 0.0359 0.47 CCND1.3 CCND1 0.0381 0.50 PCSK6.1 PCSK6 0.0103 0.34 CAT.1 CAT 0.0044 0.42 PCK1.1 PCK1 0.0003 0.02 CASP6.1 CASP6 0.0136 0.36 PCCA.1 PCCA 0.0074 0.12 CALD1.2 CALD1 0.0042 0.31 PARD6A.1 PARD6A 0.0243 0.21 CA9.3 CA9 0.0077 0.48 BFGF.3 NUDT6 0.0082 0.15 C13orf15.1 C13orf15 0.0152 0.39 NRG1.3 NRG1 0.0393 0.19 BUB3.1 BUB3 0.0157 0.26 NOS3.1 NOS3 0.0232 0.34 BIN1.3 BIN1 0.0224 0.38 NOS2A.3 NOS2 0.0086 0.11 Bclx.2 BCL2L1 0.0225 0.52 NFX1.1 NFX1 0.0065 0.35 Bcl2.2 BCL2 0.0442 0.45 MYH11.1 MYH11 0.0149 0.36 AXL.1 AXL 0.0451 0.44 cMYC.3 MYC 0.0472 0.46 ATP6V1B1.1 ATP6V1B1 0.0257 0.03 MUC1.2 MUC1 0.0202 0.26 ARRB1.1 ARRB1 0.0337 0.43 MIF.2 MIF 0.0145 0.39 ARHGDIB.1 ARHGDIB 0.0051 0.32 MICA.1 MICA 0.0015 0.15 AQP1.1 AQP1 0.0022 0.31 MGMT.1 MGMT 0.0414 0.50 APOLD1.1 APOLD1 0.0222 0.42 MAP2K1.1 MAP2K1 0.0075 0.40 APC.4 APC 0.0165 0.47 LMO2.1 LMO2 0.0127 0.07 ANXA5.1 ANXA5 0.0143 0.37 LDB2.1 LDB2 0.0048 0.33 ANXA4.1 ANXA4 0.0019 0.30 KitIng.4 KITLG 0.0146 0.18 ANXA1.2 ANXA1 0.0497 0.39 KDR.6 KDR 0.0106 0.34 ANGPTL7.1 ANGPTL7 0.0444 0.16 ITGB1.1 ITGB1 0.0469 0.36 ANGPTL4.1 ANGPTL4 0.0197 0.55 ITGA7.1 ITGA7 0.0290 0.38 ANGPT1.1 ANGPT1 0.0055 0.15 ITGA6.2 ITGA6 0.0010 0.17 ALDOB.1 ALDOB 0.0128 0.02 ITGA4.2 ITGA4 0.0089 0.44 ALDH4.2 ALDH4A1 0.0304 0.33 INSR.1 INSR 0.0057 0.32 AGTR1.1 AGTR1 0.0142 0.11 IMP3.1 IMP3 0.0086 0.43 ADH6.1 ADH6 0.0042 0.03 IL6ST.3 IL6ST 0.0484 0.46 ADFP.1 ADFP 0.0223 0.47 IL15.1 IL15 0.0009 0.08 ADD1.1 ADD1 0.0135 0.42 IFI27.1 IFI27 0.0013 0.22 BCRP.1 ABCG2 0.0098 0.19 HYAL2.1 HYAL2 0.0099 0.36 MRP3.1 ABCC3 0.0247 0.44 HYAL1.1 HYAL1 0.0001 0.08 MRP1.1 ABCC1 0.0022 0.32 Hepsin.1 HPN 0.0024 0.14 NPD009 (ABAT official).3 ABAT 0.0110 0.19 HPCAL1.1 HPCAL1 0.0024 0.38 A2M.1 A2M 0.0012 0.29 Table 8a: Genes for which increased expression is associated with lower risk of cancer recurrence after clinical/pathologic covariate adjustment (p<0.05) Gene Official Symbol p-value HR Gene Official Symbol p-value HR ACE2.1 ACE2 0.0261 0.85 ID1.1 ID1 0.0154 0.83 ADD1.1 ADD1 0.0339 0.85 IGF1R.3 IGF1R 0.0281 0.85 ALDOB.1 ALDOB 0.0328 0.84 IL15.1 IL15 0.0059 0.83 ANGPTL3.3 ANGPTL3 0.0035 0.79 IQGAP2.1 IQGAP2 0.0497 0.88 APOLD1.1 APOLDd1 0.0015 0.78 KL.1 KL 0.0231 0.86 AQP1.1 AQP1 0.0014 0.79 KLRK1.2 KLRK1 0.0378 0.87 BFGF.3 NUDT6 0.0010 0.77 LDB2.1 LDB2 0.0092 0.82 CASP10.1 CASP10 0.0024 0.82 LRP2.1 LRP2 0.0193 0.86 CAV2.1 CAV2 0.0191 0.86 LTF.1 LTF 0.0077 0.82 CCL4.2 CCL4 0.0045 0.81 MAP4.1 MAP4 0.0219 0.84 CCL5.2 CCL5 0.0003 0.78 MRP1.1 ABCC1 0.0291 0.87 CCR2.1 CCR2 0.0390 0.87 NOS3.1 NOS3 0.0008 0.78 CCR4.2 CCR4 0,0109 0.82 PI3K.2 PIK3C2B 0.0329 0.83 CCR7.1 CCR7 0.0020 0.80 PLA2G4C.1 PLA2G4C 0.0452 0.87 CD4.1 CD4 0.0195 0.86 PPAP2B.1 PPAP2B 0.0001 0.74 CD8A.1 CD8A 0,0058 0.83 PRCC.1 PRCC 0.0333 0.88 CEACAM1.1 CEACAM 1 0.0022 0.81 PRKCB1.1 PRKCB 0.0353 0.87 CFLAR.1 CFLAR 0.0308 0.87 PRKCH.1 PRKCH 0.0022 0.82 CTSS.1 CTSS 0.0462 0.87 PRSS8.1 PRSS8 0.0332 0.87 CX3CL1.1 CX3CL1 0.0021 0.81 PSMB9.1 PSMB9 0.0262 0.87 CXCL10.1 CXCL10 0.0323 0.86 PTPRB.1 PTPRB 0.0030 0.80 CXCL9.1 CXCL9 0.0006 0.79 RGS5.1 RGS5 0.0480 0.85 CXCR6.1 CXCR6 0.0469 0.88 SDPR.1 SDPR 0.0045 0.80 DAPK1.3 DAPK1 0.0050 0.83 SELE.1 SELE 0.0070 0.81 DDC.1 DDC 0.0307 0.86 SGK.1 SGK1 0.0100 0.83 DLC1.1 DLC1 0.0249 0.83 SHANK3.1 SHANK3 0.0311 0.84 ECRG4.1 C2orf40 0.0244 0.84 SNRK.1 SNRK 0.0026 0.81 EDNRB,1 EDNRB 0.0400 0.86 TEK.1 TEK 0.0059 0.78 EMCN.1 EMCN <0.0001 0.68 TGFBR2.3 TGFBR2 0.0343 0.85 EPAS1.1 EPAS1 0.0411 0.84 TIMP3.3 TIMP3 0.0165 0.83 fas.1 FAS 0.0242 0.87 TMEM27.1 TMEM27 0.0249 0.86 FH.1 FH 0.0407 0.88 TSPAN7.2 TSPAN7 0.0099 0.83 GATA3.3 GATA3 0.0172 0.83 UBB.1 UBB 0.0144 0.85 GZMA.1 GZMA 0.0108 0.84 WWOX.5 WWOX 0.0082 0.83 HLA-DPB1.1 HLA-DPB1 0.0036 0.82 HSPG2.1 HSPG2 0.0236 0.84 ICAM2.1 ICAM2 0.0091 0.83 ICAM3.1 ICAM3 0.0338 0.87 Table 8b: Genes for which increased expression is associated with higher risk of cancer recurrence after clinical/pathologic covariate adjustment (p<0.05) Gene Official Symbol p-value HR CIAP1.2 BIRC2 0.0425 1.14 BUB1.1 BUB1 0.0335 1.15 CCNB1.2 CCNB1 0.0296 1.14 ENO2.1 ENO2 0.0284 1.17 ITGB1.1 ITGB1 0.0402 1.16 ITGB5.1 ITGBS 0.0016 1.25 LAMB1.1 LAMB1 0.0067 1.20 MMP14.1 MMP14 0.0269 1.16 MMP9.1 MMP9 0.0085 1.19 PSMA7.1 PSMA7 0.0167 1.16 RUNX1.1 RUNX1 0.0491 1.15 SPHK1.1 SPHK1 0.0278 1.16 OPN, osteopontin.3 SPP1 0.0134 1.17 SQSTM1.1 SQSTM1 0.0347 1.13 C20 orf1.1 TPX2 0.0069 1.20 TUBB.1 TUBB2A 0.0046 1.21 VCAN.1 VCAN 0.0152 1.18 Table 9: 16 Significant Genes After Adjusting for Clinical/Pathologic Covariates and Allowing for an FDR of 10% Official Symbol n Gene Subset (Pathway) HR HR (95% CI) LR ChiSq LR p-value q-value EMCN 928 Angiogenesis 0.68 (0.57,0.80) 19.87 <0.0001 0.0042 PPAP2B 928 Angiogenesis 0.74 (0.65.085) 16.15 0.0001 0.0148 CCL5 928 Immune Response 0.78 (0.68.0.89) 12.98 0.0003 0.0529 CXCL9 928 Immune Response 0.79 (0.70,0.91) 11.74 0.0006 0.0772 NOS3 928 Angiogenesis 0.78 (0.68,0.90) 11.32 0.0008 0.0774 NUDT6 926 Angiogenesis 0.77 (0.66.0.90) 10.77 0.0010 0.0850 AQP1 928 Transport 0.79 (0.69,0.91) 10.15 0.0014 0.0850 APOLD1 927 Angiogenesis 0.78 (0.68,0.91) 10.07 0.0015 0.0850 ITGB5 928 Cell Adhesion/Extracellular Matrix 1,25 (1.09,1.43) 9.92 0.0016 0.0850 CCR7 928 Immune Response 0.80 (0.69,0.92) 9.58 0.0020 0.0850 CX3CL1 926 Immune Response 0.81 (0.70,0.92) 9.44 0.0021 0.0850 CEACAM1 928 Angiogenesis 0.81 (0.70,0.93) 9.37 0.0022 0.0850 PRKCH 917 Angiogenesis 0.82 (0.72,0.93) 9.36 0.0022 0.0850 CASP10 927 Apoptosis 0.82 (0.73,0.93) 9.25 0.0024 0.0850 SNRK 928 Angiogenesis 0.81 (0.71.0.92) 9.09 0.0026 0.0863 PTPRB 927 Angiogenesis 0.80 (0.69.0.92) 8.83 0.0030 0.0933 


Table B Gene Target Sequence Length Amplicon Sequence A-Catenin.2 78 
A2M.1 66 CTCTCCCGCCTTCCTAGCTGTCCCAGTGGAGAAGGAACAAGCGCCTCACTGCATCTGTGCAACGG AAMP.1 66 GTGTGGCAGGTGGACACTAAGGAGGAGGTCTGGTCCTTTGAAGCGGGAGACCTGGAGTGGATGGAG ABCB1.5 77 
ACADSB.1 68 TGGCGGGAGAACTAGCCATCAGCCTCCTGAAGCCTGCCATCATTGTTAATTTGAGGACTGGGCTGTCTT ACE.1 67 CGCTGTACGAGGATTTCACTGCCCTCAGCAATGAAGCCTACAAGCAGGACGGCTTCACAGACACGG ACE2.1 66 TACAATGAGAGGCTCTGGGCTTGGGAAAGCTGGAGATCTGAGGTCGGCAAGCAGCTGAGGCCATTA ADAM17.1 73 
ADAM8.1 67 GTCACTGTGTCCAGCCCACCCTTCCCAGCAATGAAGCCTACAAGCAGGACGGCTTCACAGACACGG ADAMTS1.1 73 
ADAMTS2.1 66 GAGAATGTCTGCCGCTGGCCTACCTCCAGCAAGCCAGACACGGGCCACGAT ADAMTS4.1 71 
ADAMTS5.1 79 
ADAMTS8.1 72 
ADAMTS9.1 66 GCACAGGTTACACAACCCGAACAGAATCCTATAACGGGAGCCGGCGCGATGACTGCCCAATGTCG ADD1.1 74 
ADFP.1 67 AAGAUGATCACCTCCGTGGCCATGACCAGTGCTCTGCCCATCATCCAGAAGCTAGAGCCGCAAATTG ADH1B.1 84 
ADH6.1 68 TGTTGGGGAGTAAACACTTGGACCTCTTGTATCCACCATCTTGGGCCATGAAGGGGCTGCTGGAATCGTT ADM.1 75 
AGR2.1 70 
AGT.1 73 
AGTR1.1 67 AGCATTGATCGATACCTGGCTATTGTTCACCCAATGAAGTCCCGCCTTCGACGCACAATGCTTGTAG AHR.1 69 GCGGCATAGAGACCGACTTAATACAGAGTTGGACCGTTTGGCTAGCCTGCTGCCTTTCCCACAAGATGT AIF1.1 71 
AKT1.3 71 
AKT2.3 71 
AKT3.2 75 
ALDH4.2 68 GGACAGGGTAAGACCGTGATCCAAGCGGAGATTGACGCTGCAGCGGAACTCATCGACTTCTTCCGGTT ALDH6A1.1 66 GGCTCTTTCAACAGCAGTCCTTGTGGGAGAAGOCAAGAAGTGCTGCCAGAGCGGTGGAGCATGC ALDOA.1 69 GCCTGTACGTGCCAGCTCCCCGACTGCCAGAGCCTCAACTGTCTCTGTGCTTCGAGATCAAGCTCCGATGA ALDOB.1 80 
ALOX12.1 67 AGTTCCTCAATGGTGCCAACCCCATGCTGTTGAGACGCTCGACCTCTCTGCCCTCCAGGCTAGTGCT ALOX5.1 66 GCCATCTGCGTCAACTCCAAGGAGCCTGAGGTGCTTCTGGAGAACCGAGTGCATAAGCAGGAGCTA AMACR1.1 71 
ANGPT1.1 71 
ANGPT2.1 69 CCGTGAAAGCTGCTCTGTAAAAGCTGACACAGCCCTCCCAAGTGAGCAGGACTGTTCTTCCCACTGCAA ANGPTL2.1 66 GCCATCTGGTCAACTCCAAGGAGCCTGAGGTGCTTCTGGAGAACCGTGCATAAGCAGGAGCTA ANGPTL3.3 78 
ANGPTL4.1 66 ATGACCTCAGATGGAGGCTGGACAGTAATTCAGAGGCGCCACCATGGCTCAGTGGACTTCAACCGG ANGPTL7.1 67 CTGCACAGACTCCAACCTCAATGGAGTGTACTACCGCCTGGGTGAGCACAATAAGCACCTGGATGGC ANTXR1.1 67 CTCCAGGTGTACCTCCAACCCTAGCCTTCTCCCACGCTGCCTACAACAGAGTCCCAGCCTTCTC ANXA1.2 67 GCCCCTATCCTACCTTCAATCCATCCTCGGATGTCGCTGCCTTGCATAAGGCCATAATGGTTAAAGG ANXA2.2 71 
ANXA4.1 67 TGGGAGGGATGAAGGAAATTATCTGGACGATGCTCTCGTGAGACAGGATGCCCAGGACCTGTATGAG ANXA5.1 67 GCTCAAGCCTGGAAGATGACGTGGTGGGGGACACTTCAGGGTACTACCAGCGGATGTTGGTGGTTCT AP-1 (JUN official).2 81 
AP1 M2.1 67 ACAACGACCGCACCATGTCCTTCATCCCGCCTGATGGTGACTTTGAGCTCATGTCATACCGCCTCAG APAF1.2 66 CACAAGGAAGAAGCTGGTGAATGCAATTCAGCAGAAGCTCTCCAAATTGAAAGGTGAACCAGGATG APC.4 69 GGACAGCAGGAATGTGTTTCTCCATACAGGTCACGGGGAGCCAATGGTTCAGAAACAAATCGAGTGGGT APOC1.3 70 
APOE.1 75 
APOL1.1 73 
APOLD1.1 66 GAGCAGCTGGAGTCTCGGGTTCAGCTCTGCACCAAGTGGCCACGACCTCAAGATCTCT 66 GCTTGGTATGACCCCTGGCCACAGCCTTCCCTCTGCATTGACCTGGAGGGGAGAGGTCAGCCTT AREG.2 82 
ARF1.1 64 CAGTAGAGATCCCCGCAACTCGCTTGTCCTTGGGTCACCCTGCATTCCATAGCCATGTGCTTGT ARG99.1 67 GCATGGGCTACTGCATCCTTTTTGTGCACGGACTGAGCAAGCTCTGCACTTGGCTGAATCGATGTGG ARGHEF18.1 71 
ARHA.1 73 
ARHGDIB.1 66 TGGTCCCTAGAACAAGAGGCTTAAAACCGGGCTTTCACCCAAGCTGCTCCCTCTGATCCTCCATCA ARRB1.1 69 TGCAGGAACGCCTCATCAAGAAGCTGGGCGAGCACGCTTACCCTTTCACCTTTGAGATCCCTCCAAACC ASS1.1 85 
ATP1A1.1 67 AGAACGCCTATTTGGAGCTGGGGGGCCTCGGAGAACGAGTCCTAGGTTTCTGCCACCTCTTTCTGCC ATP5E.1 66 CCGCTTTCGCTACAGCATGGTGGCCTACTGGAGACAGGCTGCACTCAGCTACATCCGATACTCCCA ATP6V1B1.1 67 AACCATGGGGAACGTCTGCCTCTTCCTGAACTTGGCCAATGACCCCACGATCGAGCGGATCATCACC AXL.1 66 TTGCAGCCCTGTCTTCCTACCTATCCACCTCCATCCCAGAGGTCCCTCCCCTTCTCTGTGCAG AZU1.1 74 
B-Catenin.3 80 
B2M.4 67 GGGATCGAGACATGTAACAGCATCATGGAGGTTTGAAGATGCGCATTTGGATTGGATGAATTCCA BAD.1 73 
BAG1.2 81 
BAG2.1 CTAGGGGCAAAAAGCATGACTGCTTTTTCCTGTCTGGCATGGAATCACGCAGTCACCTTGGGCATTTAG Bak.2 66 CCATTCCCACCATTCTACCTGAGGCCAGGACGTCTGGGGTGTGGGGATTGGTGGGTCTATGTTCCC Bax.1 70 
BBC3.2 83 
Bcl2.2 73 
BCL2A1.1 79 
BCL2L12.1 73 
Bclx.2 70 
BCRP.1 74 
BFGF.3 77 
BGN.1 66 GAGCTCCGCAAGGATGACTTCAAGGGTCTCCAGCACCTCTACGCCCTCGTCCTGGTGAACAACAAG BHLHB3.1 68 AGGAAGATCCCTCGCAGCCAGGAAAGGAAGCTCCCTGAATCCTTGCGTCCCGAAGGACGGAGGTTCAA BIK.1 70 
BIN1.3 76 
BLR1.1 67 GACCAAGCAGGAAGCTCAGACTGGTTGAGTTCAGGTAGCTGCCCCTGGCTCTGACCGAAACAGCGCT BNIP3.1 68 CTGGACGGAGTAGCTCCAAGAGCTCTCACTGTGACAGCCCACCTCGCTCGCAGACACCACAAGATACC BRCA1.1 65 TCAGGGGGCTAGAAATCTGTTGCTATGGGCCCTTCACCAACATGCCCACAGATCAACTGGAATGG BTRC.1 63 GTTGGGACACAGTTGGTTGCAGTCGGCCCAGGACGGTCTACTCAGCACAACTGACTGCTTCA BUB1.1 68 CCGAGGTTAATCCAGCACGTATGGGGCCAAGTGTAGGCTCCCAGCAGGAACTGAGAGCGCCATGTCTT BUB3.1 73 
c-kit.2 75 
C13orf15.1 84 
C1QA.1 66 CGGTCATCACCAACCAGGAAGAACCGTACCAGAACCACTCCGGCCGATTCGTCTGCACTGTACCCG C1QB.1 70 
C20 orfl.1 65 TCAGCTGTGAGCTGCGGATACCGCCCGGCAATGGGACCTGCTCTTAACCTCAAACCTAGGACCGT C3.1 67 CGTGAAGGAGTGCAGAAAGAGGACATCCCACCTGCAGACCTCAGTGACCAAGTCCCGGACACCGAGT C3AR1.1 66 AAGCCGCATCCCAGACTTGCTGAATCGGAATCTCTGGGGGTTGGGACCCAGCAAGGGCACTTAACA C7.1 69 
CA12.1 CTCTCTGAAGGTGTCCTGGCCAGCCCTGGAGAAGCACTGGTCTCTGCAGCACCCCTCAGTTCCTGT CA2.1 69 CAACGTGGAGTTTGATGACTCTCAGGACAAAGCAGTGCTCAAGGGAGGACCCCTGGATGGCACTTACAG CA9.3 72 
CACNA2D1.1 68 CAAACATTAGCTGGGCCTGTTCCATGGCATAACACTAAGGCGCAGACTCCTAAGGCACCCACTGGCTG CALD1.2 78 
CASP1.1 77 
CASP10.1 66 ACCTTTCTCTTGGCCGGATGTCCTCAGGGCTGGCAGATGCAGTAGACTGCAGTGGACAGTCCCCAC CASP6.1 67 CCTCACACTGGTGAACAGGAAAGTTTCTCAGCGCCGAGTGGACTTTTGCAAAGACCCAAGTGCAATT Caspase 3.1 66 TGAGCCTGAGCAGAGACATGACTCAGCCTGTTCCATGAAGGCAGAGCCATGGACCACGCAGGAAGG CAT.1 78 
CAV1.1 74 
CAV2.1 66 CTTCCCTGGGACGACTTGCCAGCTCTGAGGCATGACAGTACGGGCCCCCAGAAGGGTGACCAGGAG CCL18.1 68 GCTCCTGTGCACAAGTTGGTACCTACCAACAAAGAGCTCTGCTGCCTCGTCTATACCTCCTGGCAGATTCCA CCL19.1 78 
CCL20.1 69 CCATGTGCTGTACCAAGGTTTGCTCCTGGCTGCTTTGATGTCAGTGCTGCTACTCCACCTCTGCGGCG CCL4.2 70 
CCL5.2 65 AGGTTCTGAGCTCTGGCTTTGCCTTGGCTTTGCCAGGGCTCTGTGACCAGGAAGGAAGTCAGCAT CCNB1.2 84 
CCND1.3 69 GCATGTTCGTGGCCTCTAAGATGAAGGAGACCATCCCCCTGACGGCGAGAATGTGCATCTACACCG CCNE1.1 71 
CCNE2 variant 1.1 85 
CCNE2.2 82 
CCR1.1 66 TCCAAGACCCAATGGGAATTCACTCACCACACCTGCAGCCTTGACTTTCCTCAAAGCCTACGA CCR2.1 67 CTCGGGAATCCTGAAAACCCTGCTTCGGTGTCGAAACGAGAAGAAGAGGCATAGGGCAGTGAGAGTC CCR4.2 82 
CCR5.1 67 CAGACTGAATGGGGGTGGGGGGGGCGCCTTAGGTACTTATTCCAGATGCCTTCTCCAGACAAACCAG CCR7.1 64 GGATGACATGCACTCAGCTCTTGGCTCCACTGGGAGGAGAGGACAAGGGAAATGTCAGG CD105.1 75 
CD14.1 66 GTGTGCTAGCGTACTCCCGCCTCAAGGAACTGACGCTCGAGGATAAAGATAACCGGCACCATGC CD18.2 81 
CD1A.1 78 
CD24.1 77 
CD274.2 69 GCTGCATGATCAGCTATGGTGGTGCCGACTACAAGCGAATTACTGTGAAAGTCAATGCCCCATACAACA CD31.3 75 
CD34.1 67 CCACTGCACACACCTCAGAGGCTGTTCTTGGGGCCCTACACCTTGAGGAGGGGCAGGTAAACTCCTG CD36.1 67 GAACCCAGGACGCTGAGGACAACACAGTCTCTTTCCTGCAGCCCAATGGTGCCATCTTCGAACCTT CD3z.1 65 AGATGAAGTGGAAGGCGCTTTTCACCGCGGCCATCCTGCAGGCACAGTTGCCGATTACAGAGGCA CD4.1 67 GTGCTGGAGCGGGACTAACCCAGGTCCCTTGTCCCAAGTTCCACTGCTGCCTCTTGAATGCAGGGA CD44.1 67 GCTTATGAAGGAAACTGGAACCCAGAAGCACACCCTCCCCTCATTACCATGAGCATC CD44s.1 78 
CD44v6.1 78 
CD53.1 72 
CD68.2 74 
CD82.3 84 
CD8A.1 68 AGGGTGAGGTGCTTGAGTCTCCAACGGCAAGGGAACAAGTACTTCTTGATACCTGGGATACTGTGCCC CD99.1 77 
cdc25A.4 71 
CDC25B.1 85 
CDH1.3 81 
CDH13.1 67 GCTACTTCTCCACTGTCCCGTTCAGTCTGAATGCTGCCACAACCAGCCAGGCACGTCCACAGAGAGG CDH16.1 67 GACTGTCTGAATGGCCCAGGCAGCTCTAGCTGGGAGCTTGGCCTCTGGCTCCATCTGAGTCCCCTGG CDH2.1 66 TGACCGATAAGGATCAACCCCATACACCAGCCTGGAACGCAGTGTACAGAATCAGTGGCG CDH5.1 67 ACAGGAGACGTGTTCGCCATTGAGAGGCTGGACCGGGAGAATATCTCAGAGTACCACCTCACTGCTG CDH6.1 66 ACACAGGCGACATACAGGCCACCAAGACGCTGGACAGGGAAGAAAAACCCGTTTACATCCTTCGAG CDK4.1 66 CCTTCCCATCAGCACAGTTCGTGAGGTGGCTTTACTGAGGCGACTGGAGGCTTTTGAGCATCCCAA CDK6.1 67 AGTGCCCTGTCTCACCCATACTTCCAGGACCTGGAAAGGTGCAAAGAAAACCTGGATTCCCACCTGC CDKN2A.2 79 
CEACAM1.1 71 
CEBPA.1 66 TTGGTTTTGCTCGGATACTTGCCAAAATGAGACTCTCCGTCGCCAGCTGGGGGTAGGGTCTGAGAC CENPF.1 68 CTCCCGTCAACAGCGTTCTTTCCAAACACTGGACCAGGAGTGCATCCAGATGAAGGCCAGACTCACCC CFLAR.1 66 GGACTTTTGTCCAGTGACAGCTGAGACAACAAGGACCACGGGAGGAGGTGTAGGAGAGAAGCGCCG CGA (CHGA official).3 76 
Chk1.2 82 
Chk2.3 78 
CIAP1.2 72 
clAP2.2 86 
CLCNKB.1 67 GTGACCCTGAAGCTGTCCCCAGAGACTTCCCTGCATGAGGCACACAACCTCTTTGAGCTGTTGAAC CLDN10.1 66 GGTCTGTGGATGAACTGCGCAGGTAACGCGTTGGGTTCTTCCATTGCCGACCGCATTTTACTATC CLDN7.2 74 
CLU.3 76 
cMet.2 86 
cMYC.3 84 
COL18A1.1 67 AGCTGCCATCACGCCTACATCGTGCTCTGCATTGAGAACAGCTTCATGACTGCCTCCAAGTAGCCAC COL1A1.1 68 GTGGCCATCCAGCTGACCTTCCTGCGCCTGATGTCCACCGAGGCCTCCCAGAACATCACCTACCACTG COL1A2.1 80 
COL4A1.1 66 ACAAAGGCCTCCCAGGATTGGATGGCATCCCTGGTGTCAAAGGAGAAGCAGGTCTTCCTGGGACTC COL4A2.1 67 CAACCCTGGTGATGTCTGCTACTATGCCAGCCGGAAACGACAAGTCCTACTGGCTCTCTACCACTGCG COL5A2.2 72 
COL7A1.1 66 GGTGACAAAGGACCTCGGGGAGACAATGGGGACCCTGGTGACAAGGGCAGCAAGGGAGAGCCTGGT COX2.1 79 
CP.1 73 
CPB2.1 67 GGCACATACGGATTCTTGCTGCCGGAGCGTTACATCAAACCCAXCCTGTAGAGAAGCTTTTGCCGCTG CRADD.1 69 GATGGTGCCTCCAGCAACCGCTGGGGAGTGTGTCCCTGAGTCATGTGGGCTGAATCCTGACTTTCACTC cripto (TDGF1 official).1 65 GGGTCTGTGCCCCATGACACCTGGCTGCCCAAGAAGTGTTCCCTGTGTAAATGCTGGCACGGTCA CRP.1 66 GACGTGAACCACAGGGTGTCCTGTCAGAGGAGCCCATCTCCCATCTCCCCAGCTCCCTATCTGGAG CSF1.1 74 
CSF1R.2 80 
CSF2.1 76 
CSF2RA.2 67 TACCACACCCAGCATTCCTCCTGATCCCAGAGAAATCGGATCTGCGAACAGTGGCACCAGCCTCTAG CSF3.2 79 
CTGF.1 76 
CTSB.1 62 GGCCGAGATCTACAAAAACGGCCCCGTGGAGGGAGCTTTCTCTGTGTATTCGGACTTCCTGC CTSD.2 80 
CTSH.2 77 
CTSL.2 74 
CTSL2.1 67 TGTCTCACTGAGCGAGCAGAATCGGTGGACGTTCGCGTCCTCAAGGCAATCAGGGCTGCAATGGT CTSS.1 76 
CUBN.1 71 
CUL1.1 71 
CUL4A.1 75 
CX3CL1.1 66 GACCCTTGCCGTCTACCTGAGGGGCCTCTTATGGGCTGGGTTCTACCCAGGTGCTAGGAACACTCC CX3CR1.1 68 TTCCCAGTTGTGACATGAGGAAGGATCTGAGGCTGGCCCTCAGTGTGACTGAGACGGTTGCATTTAGC CXCL10.1 68 GGAGCAAAATCGATGCAGTGCTTCCAAGGATGGACCACACAGAGGCTGCCTCTCCCATCACTTCCCTA CXCL12.1 67 GAGCTACAGATGCCCATGCCGATTCTTCGAAAGCCATGTTGCCAGAGCCAACGTCAAGCATCTCAAA CXCL14.1 74 
CXCL9.1 70 
CXCR4.3 72 
CXCR6.1 67 CAGAGCCTGACGGATGTGTTCCTGGTGAACCTAGCCCTGGCTGACCTGGTGTTTGTCTGCACTCTGC CYP2C8.2 73 
CYP2C8v2.1 70 
CYP3A4.2 79 
CYR61.1 76 
DAG1.1 67 GTGACTGGOCTCATGCCTCCAAGTCAGAGTTTCCCTGGTGCCCCAGAGACAGGAGCACAAGTGGGAT DAPK1.3 77 
DCBLD2.1 69 TCACCAGGGCAGGAAGTTTATCATGCCTATGCTGAACCACTCCCAATTACGGGGCCTGAGTATGCAACC DCC.3 75 
DCN.1 67 GAAGGCCACTATCATCCTCCTTCTGCTTGCACAAGTTTCCTGGGCTGGACCGTTTCAACAGAGAGGC DCXR.1 66 CCATAGCGTCTACTGCTCCACCAAGGGTGCCCTGGACATGCTGACCAAGGTGATGGCCCTAGAGCT DDC.1 67 CAGAGCCCAGACACCATGAACGCAAGTGAATTCCGAAGGAGAGGGAAGGAGATGGTGGATTACGTGG DEFB1.1 68 GATGGCCTCAGGTGGTAACTTTCTCACAGGCCTTGGCCACAGATCTGATCATTACAATTGCGTCAGCA DET1.1 70 
DHPS.3 78 
DIABLO.1 73 
DIAPH1.1 DICER1.2 62 GAAGGAGTCAAGGAGAACCAGAAGGGGCGGGAGAGAGAAGAAAAGATGAGGCGAGCAAAAGT 68 TCCAATTCCAGCATCACTGTGGAGAAAAGCTGTTTGTCTCCCCAGCATACTTTATCGCCTTCACTGCC DKFZP564O0823.1 66 CAGCTACACTGTCGCAGTCCGCTGCTGAGCCTCCCACACTCATCTCCCCTCAAGCTCCAGCCTCAT 68 GATTCAGACGAGGATGAGCCTTGTGCCATCAGTGGCAAATGGACTTTCCAAAGGGACAGCAAGAGGTG DLL4.1 67 CACGGAGGTATAAGGCAGGAGCCTACCTGGACATCCCTGCTCAGCCCCGCGGCTGGACCTTCCTTCT DPEP1.1 72 
DPYS.1 70 
DR4.2 83 
DR5.2 84 
DUSP1.1 76 
DUSP9.1 77 
E2F1.3 75 
EBAG9.1 66 CGCTCCTGTTTTTCTCATCTGTGCAGTGGGTTTTGATTCCCACCATGGCCATCACCCAGTTTCGGT ECRG4.1 66 GCTCCTGCTCCTGTGCTGGGGCCCAGGTGGCATAAGTGGAAATAAACTCAAGCTGATGCTTCAAAA EDG2.1 72 
EDN1 endothelin.1 73 
EDN2.1 79 
EDNRA.2 76 
EDNRB.1 72 
EEF1A1.1 67 CGAGTGGAGACTGGTGTTCTCAAACCCGGTATGGTGGTCACCTTTGCTCCAGTCAAACGTTACAACGG EFNB1.2 66 GGAGCCCGTATCCTGGAGCTCCCTCAACCCCAAGTTCCTGAGTGGGAAGGGCTTGGTGATCTATCC EFNB2.1 73 
EGF.3 84 
EGFR.2 62 TGTCGATGGACTTCCAGAACCACCTGGGCAGCTGCCAAAAGTGTGATCCAAGCTGTGCGAAT EGLN3.1 68 GCTGGTCCTCTACTGCGGGAGCCGGCTGGGCAAATACTACGTCAAGGAGAGGTCTAAGGCAATGGTGG EGR1.1 76 
EIF2C1.1 67 CCCTGACGGACTCTCAGCGCGTTCGCTTCACCAAGGAGATCAAGGGCCTGAAGGTGGAAGTCACCCA EIF4EBP1.1 66 GGCGGTGAAGAGTCACGTTTGAGATGGACATTTAAAGCACCAGCCATCGTGTGGAGCACTACCAA ELTD1.1 66 AGGTCTTGTGCAAGAGG AGCCCTCGCTCTTCTGTTCCTTCTCGGCACCACCTGGATCTTTGGGGTT EMCN.1 73 
EMP1.1 75 
ENO2.1 67 TCCTTGGCTTACCTGACCTCTTGCTGTCTCTGCTCGCCCTCCTTTCTGTGCCCTACTCATTGGGGTT ENPEP.1 67 CACCTACACGGAGAACGGACAAGTCAAGAGCATAGTGGCCACCGATCATGAACCAACAGATGCGAGG ENPP2.1 67 CTCCTGCGCACTAATACCTTCAGGCCAACCATGCCAGAGGAAGTTACCAGACCCAATTATCCAGGGA EPAS1.1 72 
EPB41L3.1 66 TCAGTGCCATACGTCTCACTCTCTCCTTCCCTCTGGCTCTGTGCCTCTGCTACCTGGAGCCCAAG EPHA2.1 72 
EPHB1.3 67 CCTTGGGAGGGAAGATCCCTGTGAGATGGACAGCTCCAGAGGCCATCGCCTACCGCAAGTTGACTTC EPHB2.1 66 CAACCAGGCAGCTCCATCGGCAGTGTCCATCATCGCATCAGGTGAGCCGCACCGTGGACAGCATTAC EPHB4.1 77 
EPO.1 84 
ErbB3.1 81 
ERBB4.3 86 
ERCC1.2 67 GTCCAGGTGGATGTGAAAGATCCCCAGCAGGCCCTCAAGGAGCTGGCTAAGATGTGTATCCTGGCCG ERCC4.1 67 CTGCTGGAGTACGAGCGACAGCTGGTGCTGGAACTGCTCGACACTGACGGGCTAGTAGTGTGCGCCC EREG.1 91 
ERG.1 70 
ERK1.3 67 ACGGATCACAGTGGAGGAAGCGCTGGCTCACCCCTACCTGGAGCAGACTATGACCCGACGGATGAG ERK2.3 68 AGATTCTTGACCCCTGGTCCTGTCTCCAGCCCGTCTTGGCTTATCCACTTTGACTCCTTTGAGCCGTTT ESPL1.3 70 
ESRRG.3 67 CCAGCACCATTGTTGAAGATCCCCAGACCAAGTGTGAATACATGCTCAACTCGATGCCCAAGAGACT F2.1 77 
F3.1 73 
FABP1.1 66 GGGTCCAAAGTGATCCAAAACGAATTCACGGTGGGGGAGGAATGTGAGCTGGAGACAATGACAGGG FABP7.1 72 
FAP.1 66 CTGACCAGAACCACGGCTTATCCGGCCTGTCCACGAACCACTTATACACCCACATGACCCACTTCC fas.1 91 
fasl.2 80 
FBXW7.1 73 
FCER1G.2 73 
FCGR3A.1 67 GTCTCCAGTGGAAGGGAAAAGCCCATGATCTTCAAGCAGGGAAGCCCCAGTGAGTAGCTGCATTCCT FDPS.1 77 
FEN1.1 66 GTGGAGAAGGGTACGCCAGGGTCGCTGAGAGACTCTGTTCTCCCTGGAGGGACTGGTTGCCATGAG FGF1.1 66 GACACCGACGGGCTTTTATACGGCTCACAGACACCAAATGAGGAATGTTTGTTCCTGGAAAGGCTG FGF2.2 76 
FGF9.1 67 CACAGCTGCCATACTTCGACTTATCAGGATTCTGGCTGGTGGCCTGCGCGAGGGTGCAGTCTTACTT FGFR1.3 74 
FGFR2 isoform 1.1 80 
FH.1 67 ATGGTTGCAGCCCAAGTCATGGGGAACCATGTTGCTGTCACTGTCGGAGGCAGCAATGGACATTTTG FHIT.1 67 CCAGTGGAGCGCTTCCATGACCTGCGTCCTGATGAAGTGGCCGATTTGTTTCAGACGACCCAGAGAG FHL1.1 66 ATCCAGCCTTTGCCGAATACATCCTATCTGCCACACATCCAGCGTGAGGTCCCTCCAGCTACAAGG FIGF.1 72 
FILIP1.1 66 ACACCGGTCACAACGTCATCTGCTCGAGGAACCCAGTCAGTGTCAGGACAAGACGGGTCATCCCAG FKBP1A.1 76 CTGCCCTGACTGAATGTGTTCTGTCACTCAGCTTTGCTTCCGACACCTCTGTTTCCTCTTCCCCTTTCTC CTCGTA FLJ22655.1 82 
FLT1.1 75 
FLT3LG.1 75 
FLT4.1 69 ACCAAGAAGCTGACTGTGGCTGAGCCCGCTGACCATGGAAGATCTTCCACC FN1.1 69 
FOLR1.1 67 GAACGCCAAGCACCACAAGGAAAAGCCAGGCCCCGAGGACAAGTTGCATGAGCAGTGTCGACCCTGG FOS.1 67 CGAGCCCCTTTGATGACTTCCTGTTCCCAGCATCATCCAGGCCCAGTGGCTCTGAGACAGCCCGCTCC FRAP1.1 66 AGCGCTAGAGACTGTGGACCGCCTGACGGAGTCCCTGGATTTCACTGACTATGCCTCCCGGATCAT FRP1.3 75 
FST.1 72 
FZD2.2 78 
G-Catenin.1 68 TCAGCAGCAAGGGCATCATGGAGGAGGATGAGGCCTGCGGGCGCCAGTACACGCTCAAGAAAACCACC GADD45B.1 70 
GAS2.1 68 AACATGTCATGGTCCGTGTGGGAGGAGGCTGGGAAACTTTTGCAGGGTATTTGTTGAAACACGACCCC GATA3.3 75 
GATM.1 67 GATCTCGGCTTGGACGAACCTTGACAGGATGGGTGCAGCGAACTTTCCAGAGCACCCAGGCAGCTAC GBL.1 66 GCTGTCAATAGCACCGGAAACTGCTATGTCTGGAATCTGACGGGGGGCATTGGTGACGAGGTGACC GBP2.2 83 
GCLC.3 71 
GCLM.2 85 
GFRA1.1 69 TCCGGGTTAAGAACAAGCCCCTGGGGCCAGCAGGGTCTGAGAATGAAATTCCCACTCATGTTTTGCCAC GJA1.1 68 GTTCACTGGGGGTGTATGGGGTAGATGGGTGGAGAGGGAGGGGATAAGAGAGGTGCATGTTGGTATTT GLYAT.1 68 TACCATTGCAAGGTGCCCAGATGCTGCAGATGCTGGAGAAATCCTTGAGGAAGAGCCTCCCAGCATCC GMNN.1 67 GTTCGCTACGAGGATTGAGCGTCTCCACCCAGTAAGTGGGCAAGAGGCGGCAGGAAGTGGGTACGCA GNAS.1 72 
GPC3.1 68 TGATGCGCCTGGAAACAGTCAGCAGGCAACTCCGAAGGACAACGAGATAAGCACCTTTCACAACCTCG GPX1.2 67 GCTTATGACCGACCCCAAGCTCATCACCTGGTCTCCGGTGTGTCGCAACGATGTTGCCTGGAACTTT GPX2.2 75 
GPX3.1 69 GCTCTAGGTCCAATTGTTCTGCTCTAACTGATACCTCAACCTTGGGGCCAGCATCTCCCACTGCCTCCA GRB14.1 76 
GRB7.2 67 CCATCTGCATCCATCTTGTTTGGGCTCCCGACCCTTGAGAAGTGCCTCAGATAATACCCTGGTGGCC GRO1.2 73 
GSTM1.1 86 
GSTM3.2 76 
GSTp.3 76 
GSTT1.3 66 CACCATCCCCACCCTGTCTTCCACAGCCGCCTGAAAGCCACAATGAGAATGATGCACACTGAGGCC GZMA.1 79 
HADH.1 66 CCACCAGACAAGACCGATTCGCT GGCCTCCATTTCTTCAACCCAGTGCCTGTCATGAAACTTGTGG HAVCR1.1 76 
HDAC1.1 74 
Hepsin.1 84 
HER2.3 70 
HGD.1 76 
HGF.4 65 CCGAAATCCAGATGATGATGATGCTCATGGACCCTGGTGCTACACGGGAAATCCACTCATTCCTTGGG HGFAC.1 72 
HIF1A.3 82 
HIF1AN.1 66 TGTTGGCCAGGTCTCACTGCAGCCTGCCCGAGGCTAACTGGCTAGAGCCTCCAGGCCCTATGATGC HIST1H1 D.1 67 AAAAAGGCGAAGAAGGCAGGCGCAACTGCTGGGAAACGCAAAGCATCCGGACCCCCAGTATCTGAGC HLA-B.1 78 
HLA-DPA 1.1 78 
HLA-DPB1.1 73 
HLA-DQB1.1 67 GGTCTGCTCGGTGACAGATTTCTATCCAGGCCAGATCAAAGTCCGGTGGTTTCGGAATGATCAGGAG HLADQA1.2 76 
HMGB1.1 71 
HNRPAB.1 84 
HPCAL1.1 70 
HPD.1 78 
HSD11B2.1 69 CCAACCTGCCTCAAGAGCTGCTGCAGGCCTACGGCAAGGACTTCGAGCACTTGCATGGGCAGTTCC HSP90AB1.1 66 GCATTGTGACCAGCACCTACGGCTGGACAGCCAATATGGAGCGGATCATGAAAGCCCAGGCACTTC HSPA1A.1 70 
HSPA8.1 73 
HSPB1.1 84 
HSPG2.1 66 GAGTACGTGCCGAGTGTTGGGCAGCTCCGTGCCTCTAGAGGCCTCGTCCTGGTCACCATTGAG HTATIP.1 66 TCGAATTGTTTGGGCACTGATGAGGACTCCCAGGACAGCTGATGGAATACCGTCAGCACCACGC HYAL1.1 78 
HYAL2.1 67 CAACCATGCACTCCCAGTCTACGTCTTCAGACGACCCACCTACAGCGGCAGGCTCACGGGGGTTAGT HYAL3.1 67 TATGTCCGCCTCACACACCGGAGATCTGGGAGGTTCCTGTCCCAGGATGACCTTGTGCAGTCCATTG ICAM1.1 68 GCAGACAGTGACCATCTACAGCTTTCCGGCGCCCAACGTGATTCTGACGAAGCCAGAGGTCTCAGAAG ICAM2.1 62 GGTCATCCTGACACTGCAACCCACTTTGGTGGCTGTGGGCAAGTCCTTCACCATTGAGTGCA ICAM3.1 67 GCCTTCAATCTCAGCAACGTGACTGGCAACAGTCGGATCCTCTGCTCAGTGTACTGCAATGGCTCTC ID1.1 70 
ID2.4 76 
ID3.1 80 
IFI27.1 71 
IGF1.2 76 
IGF1R.3 83 
IGF2.2 72 
IGFBP2.1 73 
IGFBP3.1 66 ACATCCCAACGCATGCTCCTGGAGCTCACAGCCTTCTGTGGTGTCATTTCTGAAACAAGGGCGTGG IGFBP5.1 69 
IGFBP6.1 77 
IL-7.1 71 
IL-8.1 70 AAGGAACCATCTCACTGTGTGTAAACATGACTTCCAAGCTGGCCGTGGCTCTCTTGGCAGCCTTCCTGAT IL10.3 79 
IL11.2 66 TGGAAGGTTCCACAAGTCACCCTGTGATCAACAGTACCCGTATGGGACAAAGCTGCAAGGTCAAGA IL15.1 79 
IL1 B.1 67 AGCTGAGGAAGATGCTGGTTCCCTGCCCACAGACCTTCCAGGAGAATGACCTGAGCACCTTCTTTCC IL6.3 72 
IL6ST.3 74 
ILT-2.2 63 AGCCATCACTCTCAGTGCAGCCAGGTCCTATCGTGGCCCCTGAGGAGACCCTGACTCTGCAGT IMP3.1 72 
INDO.1 66 CGGGTTGCACGTCTAGTTCTGGGATGCATCACCATGGCATATGTGTGGGGCAAAGGTCATGGAGAT INHBA.1 72 
INHBB.1 72 
INSR.1 67 CAGTCTCCGAGAGCGGATTGAGTTCCTCAATGAGGCCTCGGTATGAAGGGCTTCACCTGCCATCAC IQGAP2.1 66 AGAGACACCAGCAACTGCGCAACAGGAGGTAGACCATGCCACGGACATGGTGA3CCGTGCAATGAT ISG20.1 70 
ITGA3.2 77 
ITGA4.2 66 CAACGCTTCAGTGATCAATCCCGGGGCGATTTACAGATGCAGGATCGGAAAGAATCCCGGCCAGAC ITGA5.1 75 
ITGA6.2 69 CAGTGACAAACAGCCCTTCCAACCCAAGGAATCCCACAAAAGATGGCGATGACGCCCATGAGGCTAAAC ITGA7.1 79 
ITGAV.1 79 
ITGB1.1 74 
ITGB3.1 78 
ITGB4.2 66 CAAGGTGCCCTCAGTGGAGCTCACCAACCTGTACCCGTATTGGACTATGAGAGAAGGTGTGCGC ITGB5.1 71 
JAG1.1 69 TGGCTTACACTGGCAATGGTAGTTTCTGTGGTTGGGTGGGAAATCGAGTGCCGCATCTCACAGCTATGC K-ras.10 71 
KCNJ15.1 67 GGACGTTCTACCTGCCTTGAAGAAGACACCTGACCTGCGGAGTGAGTGACCAGTGTTTCCAGAGCCT KDR.6 68 GAGGACGAAGGCCTCTACACCTGCCAGGCATGCAGTGTTCTTGGCTGTGCAAAAGTGGAGGCATTTTT Ki-67.2 80 
KIAA1303 raptor.1 66 ACTACAGCGGGAGCAGGAGCTGGAGGTAGCTGCAATCAACCCAAATCACCCTCTTGCTCAGATGCC KIF1A.1 66 CTCCTACTGGTCGCACACCTCACCTGAGGACATCAACTACGCGTCGCAGAAGCAGGTGTACCGGGA Kitlng.4 79 
KL.1 72 
KLK3.1 66 CCAAGCTTACCACCTGCACCCGGAGAGCTGTGTCACCATGTGGGTCCCGGTTGTCTTCCTCACCCT KLRK1.2 70 TGAGAGCCAGGCTTCTTGTATGTCTCAAAATGCCAGCCTTCTGAAAGTATACAGCAAAGAGGACCAGGAT KRT19.3 77 
KRT5.3 TCAGTGGAGAAGGAGTTGGACCAGTCAACATCTCTGTTGTCAGAAGCAGTGTTTCCTCTGGATATGGCA KRT7.1 71 
L1CAM.1 66 CTTGCTGGCCAATGCCTACATCTACGTTGTCCAGCTGCCAGCGAAGATCCTGACTGCGGACAATCA LAMA3.1 73 
LAMA4.1 67 GATGCACTGCGGTTAGCAGCGCTCTCCATCGAGGAAGGCAAATCCGGGGTGCTGAGCGTATCCTCTG LAMB1.1 66 CAAGGAGACTGGGAGGTGTCTCAAGTGCCTGTACCACACGGAAGGGGAACACTGTCAGTTCTGCCG LAMB3.1 67 ACTGACCAAGCCTGAGACCTACTGCACCCAGTATGGCGAGTGGGAGATGAAATGCTGCAAGTGTGAC LAMC2.2 80 
LAPTM5.1 66 TGCTGGACTTCTGCCTGAGCATCCTGACCCTCTGCAGCTCCTACATGGAAGTGCCCACCTATCTCA LDB1.2 AACACCCAGTTTGACGCAGCCAACGGCATTGACGACGAGGACAGCTTTAACAACTCCCCTGCACTGG LDB2.1 66 ATCACGGTGGACTGCGACCAGTGTACCATGGTCACCCAGCACGGGAAGCCCATGTTTACCAAGGTA LDHA.2 74 
LGALS1.1 72 
LGALS3.1 69 AGGGGAAAATGGCAGACAATTTTTCGCTCCATGATGCGTTATCTGGGTCTGGAAACCCAAAGCCTCAAG LGALS9.1 67 AGTACCCACCGCGTGCCCTTCCACCGTGTGGACACCATCTCCGTCAATGGCTCTGTGCAGCTGTC LIMK1.1 67 GCTTCAGGTGTTGTGACTGCAGTGCCTCCCTGTCGCACCAGTACTATGAGAAGGATGGGCAGCTCTT LMNB1.1 66 TGCAAACGCTGGGTCACAGCCAGCCCCCCAACTGACCTCATCTGGAAGAACCAGAACTCGTGGGG LMO2.1 74 
LOX.1 66 CCAATGGGAGAACAACGGGCAGGTGTTCAGCTTGCTGAGCCTGGGCTCACAGTACCAGCCTCAGCG LRP2.1 66 GGCTGTAGCTGGGTTTCCAGAAAGCTCTACTGGTTGGATGCCCGCCTGGATGGCCTCTTTGTCTC LRRC2.1 71 
LTF.1 68 AACGGAAGCCTGTGACTGAGGCTAGAAGCTGCCATCTTGCCATGGCCCCGAATCATGCCGTGGTGTCT LYZ.1 80 
MADH2.1 70 
MADH4.1 76 
MAL.1 66 GTTGGGAGCTTGCTGTCTAACCTCCAACTGCTGTGCTGTCTGCTAGGGTCACCTCCTGTTTCTG MAL2.1 67 CCTTCGTCTGCCTGGAGATTCTGTTCGGGGGTCTTGTCTGGATTTTGGTTCCCTCCTCCAATCTTCC MAP2K1.1 76 
MAP2K3.1 67 GCCCAATGTCCTTACAACAAGGAGGGCCATGTGAAGATGTGACTTTGGCATCAGTGGCTAC MAP4.1 72 
MARCKS.1 67 CCCCTCTTGGATCTGTTGAGTTTCTTTGTTGAATAAGCCAGCATGGGTGCCCAGTTCTCCAAGACCG Maspin.2 77 
MCAM.1 66 CGAGTTCCAGTGGCTGAGAGAAGAGACAGGCCAGGTGCTGGAAAGGGGGCCTGTGCTTCAGTTGCA MCM2.2 75 
MCM3.3 75 
MCM6.3 82 
MCP1.1 71 
MDH2.1 63 CCAACACCTTTGTTGCAGAGCTGAAGGGTTTGGATCCAGCTCGAGTCAACGTCCCTGTCATTG MDK.1 66 GGAGCCGACTGCAAGTACAAGTTTGAGAACTGGGGTGCGTGTGATGGGGGCACAGGCACCAAAGTC MDM2.1 68 CTACAGGGACGCCATCGAATCCGGATCTTGATGCTGGTGTAAGTGAACATTCAGGTGATTGGTTGGAT MGMT.1 69 
mGST1.2 79 
MICA.1 68 ATGGTGAATGTCACCCGCAGCGAGGCCYCAGAGGGCAACATTACCGTGACATGCAGGGCTTCTGGCTT MIF.2 66 CCGGACAGGGTCTACATCAACTATTACGACATGAACGCGGCCAATGTGGGCTGGAACAACTCCACC MMP1.1 72 
MMP10.1 66 TGGAGGTGACAGGGAAGCTGACTCTGACACTCTGGAGGTGATGCGCAAGCCCAGGTGTGGAGTTC MMP14.1 66 GCTGTGGAGCTCTCAGGAAGGGCCCTGAGGAAGGCACACTTGCTCCTGTTGGTCCCTGTCCTTGCT MMP2.2 86 
MMP7.1 79 
MMP9.1 67 GAGAACCAATCTCACCGACAGGCAGGCTGGCAGAGGAATACCTGTACCGCTATGGTTACACTGGGGTG MRP1.1 79 
MRP2.3 65 AGGGGATGACTTGGACACATCTGCCATTCGACATGACTGCAATTTTGACAAAGCCATGCAGTTTT MRP3.1 91 
MRP4.2 66 AGCGCCTGGAATCTACAACTCGGAGTCCAGTGTTTTCCCACTTGTCATCTTCTCTCCAGGGGCTCT MSH2.3 73 
MSH3.2 82 
MSH6.3 68 TCTATTGGGGGATTGGTAGGAACCGTTACCAGCTGGAAATTCCTGAGAATTTCACCACTCGCAATTTG MT1B.1 66 GTGGGCTGTGCCAAGTGTGCCCAGGGCTGTGTCTGCAAAGGCTCATCAGAGAAGTGCCGCTGCTGT MT1G.1 74 
MT1H.1 74 
MT1X.1 80 
MUC1.2 71 
MVP.1 75 
MX1.1 78 
MYBL2.1 74 
MYH11.1 85 
MYRIP.2 69 CCTTCACCTTCCTCGTCAACACCAAGCGCCAGTGTGGAGATTGCAAATTCAATGTCTGCAAGAGCTGCT NBN.1 76 
NCF1.1 66 GACACCTTCATCCGTCACATCGCCCTGCTGGGCTTTGAGAAGCGCTTCGTACCCAGCCAGCACTAT NFAT5.1 70 
NFATC2.1 72 
NFKBp50.3 73 
NFKBp65.3 68 CTGCCGGGATGGCTTCTATGAGGCTGAGCTCTGCCCGGACCGCTGCATCCACAGTTTCCAGAACCTGG NFX1.1 74 
NME2.1 66 ATGCTTGGGGAGACCAATCCAGCAGATTCAAAGCCAGGGACCATTCGTGGGGACTTCTGCATTCAG NNMT.1 67 CCTAGGGCAGGGATGGAGAGAGAGTCTGGGCATGAGGAGAGGGTCTCGGGATGTTTGGCTGGACTAG NOL3.1 72 
NOS2A.3 67 GGGTCCATTATGACTCCCAAAAGTTTGACCAGAGGACCCAGGGACAAGCCTACCCCTCCAGATGAGC NOS3.1 68 ATCTCGCCTCGCTCATGGGCACGGTGATGGCGAAGCGAGTGAAGGCGACAATCCTGTATGGCTCCGA NOTCH1.1 76 
NOTCH2.1 75 
NOTCH3.1 67 TGTGGACGAGTGTGCTGGCCCCGCACCCTGTGGCCCTCATGGTATCTGCACCTTCCTGGCAGGGAGT NPD009 (ABAT official).3 73 
NPM1.2 84 
NPPB.1 66 GACACCTGCTTCTGATTCCACAAGGGGCTTTTTCCTCAACCCTGTGGCCGCCTTTGAAGTGACTCA NPR1.1 66 ACATCTGGAGCTCCCCTGATGTTCAGAACCCTCATGCTCCTGGCCCTGGAAGCTGGCTTGTGTG NPY1R.1 70 GGATCTTCCCCACTCTGCTCCCTTCCATTCCCACCCTTCOTTOTTTAATAAGCAGGAGCGAAAAAGACAA NRG1.3 83 
NUDT1.1 77 
OGG1.1 71 
OPN, osteopontin.3 80 
p21.3 65 TGGAGACTCTCAGGGTCGAAAACGGCGGCAGACCAGCATGACAGATTTCTACCACTCCAAACGCC p27.3 66 CGGTGGACCACGAAGAGTTAACCCGGGACTTGGAGAAGCACTGCAGAGACATGGAAGAGGCGAGCC P53.2 68 CTTTGAACCCTTGCTTGCAATAGGTGTGCAGAAGCACCCAGGACTTCCATTTGCTTTGTCCCGGG PAH.1 80 
PA/1.3 81 
Pak1.2 70 
PARD6A.1 66 GATCCTCGAGGTCAATGGCATTGAAGTAGCCGGGAAGACCTTGGACCAAGTGACGGGACATGATGGT PBOV1.1 72 
PCCA.1 68 GGTGAAATCTGTGCACTGTCAAGCTGGAGACACAGTTGGAGAAGGGGATCTGCTCGTGGAGCTGGAAT PCK1.1 66 CTTAGCATGGCCCAGCACCCAGCAGCCAAACTGCCCAAGATCTTCCATGTCAACTGGTTCCGGAAG PCNA.2 71 
PCSK6.1 67 ACCTTGAGTAGCAGAGGCCCTCACACCTTCCTCAGAARGGACCCCAGGTGAAATGGCTCCAGCAAC PDCD1.1 73 
PDE4DIP.1 73 
PDGFA.3 67 TTGTTGGTGCCCTGGTGCCGTGGTGGCGGTCACTCCCTCTGCTGCCAGTGTTTGGACAGAACCCA PDGFB.3 62 ACTGAAGGAGACCCTTGGAGCCTAGGGGCATCGGCAGGAGAGTGTGTGGGCAGGGTTATTTA PDGFC.3 79 
PDGFD.2 74 
PDGFRa.2 72 
PDGFRb.3 66 CCAGCCCTTCCAGCTACAGATCAATGTCCCTGTCCGAGTGCTGGAGCTAACTGAGAGCCACCC PDZK1.1 75 
PDZK3.1 68 GAGCTGAGAGCCTTGAGCATGCCTGACCTTGACAAGCTCTGCAGCGAGGATTACTCAGCAGGGCCGAG PF4.1 73 
PFKP.1 68 AGCTGATGCCGCATACATTTTCGAAGAGCCCTTCGACATCAGGGATCTGCAGTCCAACGTGGAGCACC PFN2.1 82 
PGF.1 71 
PI3K.2 98 
PI3KC2A.1 83 
PIK3CA.1 67 GTGATTGAAGAGCATGCCAATTGGTCTGTATCCCGAGCAGGATTTAGCTATTCGCACGCAGGAC PLA2G4C.1 68 CCCTTTCCCCAAGTAGAAGAGGCTGAGCTGGATTTGTGGTCCAAGGCCCCCGCCAGCTGCTACATCCT PLAT.1 67 GATTTGCTGGGAAGTGCTGTGAAATAGATACCAGGGCCACGTGCTACGAGGACCAGGGCATCAGCTA PLAUR.3 76 
PLG.1 77 
PLN.1 84 
PLOD2.1 84 
PLP1.1 66 AGAACAGACTGGCCTGAGGAGCAGCAGTTGCTGGTGGCTAATGGTGTAACCTGAGATGGCCCTCTG PMP22.1 66 CCATCTACACGGTGAGGCACCCGGAGTGGCATCTAACTCGGATTACTCCTACGGTTTCGCCTACA PPAP2B.1 77 
PPARG.3 72 
PPP1R3C.1 82 
PPP2CA.1 78 
PRCC.1 67 GAGGAAGAGGAGGCGGTGGCTCCTACATCTGGGCCCGCTTTAGGGGGCTTGTTCGCTTCTCTCCCTG PRKCA.1 70 
PRKCB 1.1 67 GACCCAGCTCCACTCCTGCTTCCAGACCATGGACCGCCTGTACTTTGTGATGGAGTACGTGAATGGG PRKCD.2 68 CTGACACTTGCCGCAGAGAATCCCTTTCTCACCCACCTCATCTGCACCTTCCAGACCAAGGACCACCT PRKCH.1 68 CTCCACCTATGAGCGTCTGTCTCTGTGGGCTTGGGATGTTAAOAGGAGCCAAAAGGAGGGAAAGTGTG PRO2000.3 79 
PROM1.1 74 
PROM2.1 67 CTTCAGCGCATCCACTACCCCGACTTCCTCGTTCAGATCCAGAGGCCCGTGGTGAAGACCAGCATGG PRPS2.1 69 CACTGCACCAAGATTCAGGTCATTGACATTTCCATGATCTTGGCCGAAGCAATCCGAAGGACACACAAT PRSS8.1 68 GTACACTCTGGCCTCCAGCTATGCCTCCTGGATCCAAAGCAAGGTGACAGAACTCCAGCCTCGTGTGG PSMA7.1 67 GCCAAACTGCAGGATGAAAGAACAGTGCGGAAGATCTGTGCTTTGGATGACAACGTCTGCATGGCCT PSMB8.1 66 CAGTGGCTATCGGCCTAATCTTAGCCCTGAAGAGGCCTATGACCTTGGCCGCAGGGCTATTGCTTA PSMB9.1 66 GGGGTGTCATCTACCTGGTCACTATTACAGCTGCCGGTGTGGACCATCGAGTCATCTTGGGCAATG PTEN.2 81 
PTGIS.1 66 CCACACTGGCATCTCCCTGACCTTCTCCAGGGACAGAAGCAGGAGTAAGTTTCTCATCCCATGGGC PTHR1.1 73 
PTK2.1 68 GACCGGTCGAATGATAAGGTGTACGAGAATGTGACGGGCCTGGTGAAAGCTGTCATCGAGAGATGTCCAG PTK2B.1 74 
PTN.1 67 CCTTCCAGTCCAAAAATCCCGCCAAGAGAGCCCCAGAGCAGAGGAAATCCAAAGTGAGAGAGGGG PTPNS1.1 77 
PTPRB.1 68 GATATGCGGTGAGGAACAGCTTGATGCACACAGACTCATCCGGCACTTTCACTATACGGTGTGGCCAG PTPRC.1 74 
PTPRG.1 71 
PTTG1.2 74 
PVALB.1 81 
PXDN.1 67 GCTGCTCAAGCTGAACCCGCACTGGGACGGCGACACCATCTACTATGAGACCAGGAAGATCGTGGGT RAC1.3 66 TGTTGTAAATGTCTCAGCCCCTCGTTCTTGGTCCTGTCCCTTGGAACCTTTGTACGCTTTGCTCAA RAD51.1 66 AGACTACTCGGGTCGAGGTGAGCTTTCAGCCAGGCAGATGCACTTGGCCAGGTTTCTGCGGATGCT RAF1.3 73 
RALBP1.1 84 
RARB.2 78 
RASSF1.1 75 
RB1.1 77 
RBM35A.1 66 TGGTTTTGAATCAGGGCCGCCCATCAGGAGATGCCTTTATCCAGATGAAGTCTGCGGACAGAG REG4.1 83 
RET.1 71 
RGS1.1 84 
RGS5.1 79 
RHEB.2 78 
RhoB.1 67 AAGCATGAACAGGACTTGACCATCTTTCCAACCCCTGGGAAGACATTTGCAACTGACTTGGGGAGG rhoC.1 68 CCCGTTCGGTCTGAGGAAGGCCGGGACATGGCGAACCGGATCAGTGCCTTTGGCTACCTTGAGTGCTC RIPK1.1 67 AGTACCTTCAAGCCGGTCAAATTCAGCCACAGAACAGCCTGGTTCACTGCACAGTTCCCAGGGACTT RND3.1 66 TCGGAATTGGACTTGGGAGGCGCGGTGAGGAGTCAGGCTTAAAACTTGTTGGAGGGGAGTAACCAG ROCK1.1 73 
ROCK2.1 66 GATCCGAGACCCTCGCTCCCCCATCAACGTGGAGAGCTTGCTGGATGGCTTAGATTCCTTGGTCCT RPLP1.1 68 CAAGGTGCTCGGTCCTTCCGAGGAAGCTAAGGCTGCGTTGGGGTGAGGCCCTCACTTCATCCGGCGAC RPS23.1 67 GTTCTGGTTGCTGGATTTGGTCGCAAAGGTCATGCTGTTGGTGATATTCCTGGAGTCCGCTTTAAGG RPS27A.1 74 
RPS6KAI .170 
RPS6KB1.3 81 
RRM1.2 .2 66 GGGCTACTGGCAGCTACATTGCTGGGACTAATGGCAATTCCAATGGCCTTGTACCGATGCTGAGAG RRM2.1 71 
RUNX1.1 70 AACAGAGACATTGCCAACCATATTGGATCTGCTTGCTGTCCAAACCAGCAAACTTTCCTGGGCAAATCAC S3100A1.1 70 
S100A10.1 77 
S100A2.1 73 
SAA2.2 72 
SCN4B.1 67 GCCTTCCTGGAGTACCCGAGTGCTCCCTATGCCTTTCCAAGCATTTCTACTTGGGGAATTGGGCCAC SCNN1A.2 66 ATCAACATCCTGTCGAGGCTGCCAGAGACTCTGCCATCCCTGGAGGAGGACACGCTGGGCAACTT SDHA.1 67 GCAGAACTGAAGATGGGAAGATTTATCAGCGTGCATTTGGTGGACAGAGCCTCAAGTTTGGAAAGGG SDPR.1 66 ACCAGCACAAGATGGAGCAGCGACAGATCAGTTTGGAGGGCTCCGTGAAGGGCATCCAGAATGACC SELE.1 71 
SELENBP1.1 67 GGTACCAGCCTCGACACAATGTCATGATCAGCACTGAGTGGGCAGCTCCCAATGTCTTACGAGATGG SELL.1 67 TGCAACTGTGATGTGGGGTACTATGGGCCCCAGTGTCAGTGTTTGTGATTCAGTGAGCCTTTGGAGG SELPLG.1 83 
SEMA3B.1 71 
SEMA3C.1 66 ATGGCCATTCCTGTTCCAGATTCTACCCAACTGGGAAACGGAGGAGCCGAAGACAAGATGTGAGAC SEMA3F.3 86 
SEMA5B.1 67 CTCGAGGACAGCTCCAACATGAGCCTCTGGACCCAGAACATCACCGCCTGTCCTGTGCGGAATGTGA SERPINA5.1 66 CAGCATGGTAGTGCAAAGAGAGGTCCAGAGTCCTGGCCCTTGATGCCCAGCTCAGTGCCACAAAG SFN.1 70 
SGK.1 73 
SHANK3.1 68 CTGTGCCCTCTACAACCAGGAGAGGTGTGCTCGTGGTCCTGCTCTTGTGGAGCTAACAGGGATCTCC SHC1.1 71 
SILV.1 66 CCGCATCTTCTGCTCTTGTCCCATTGGTGAGAATAGCCCCCTCCTCAGTGGGCAGCAGGTCTGAGT SKIL.1 66 AGAGGCTGAATATGCAGGACAGTTGGCAGAACTGAGGCAGAGATTGGACCATGCTGAGGCCGATAG SLC13A3.1 66 CTTGCCCTCCAACAAGGTCTGCCCCCAGTACTTCCTCGACCAACTTCCTCTTCCCTCAGTGGGCT SLC16A3.1 68 ATGCGACCCACGTCTACATGTACGTGTTCATCCTGGCGGGGGCCGAGGTGCTCACCTCCTCCCTGATT SLC22A3.1 66 ATCGTCAGCGAGTTTGACCTTGTCTGTGTCAATGCGTGGATGCTGGACCTCACCCAAGCCATCCTG SLC22A6.1 68 TCCGCCACCTCTTCCTCTGCCTCTCCATGCTGTGGTTTGCCACTAGCTTGCATACTATGGGCTGGTC SLC2A1.1 67 GCCCTCCTGTGCCCACATCCCAGGCTTCACCCTGAATGGTTCCATGCCTGAGGGTGGAGACT SLC34A1.1 66 GCTGAGACCCACTGACCTGCAGACCTCATAGTGGGTGCCCAGGATGTTGTCCTACGGAGAGAGGCT SLC7A5.2 70 
SLC9A1.1 67 CTTCGAGATCTCCCTCTGGATCCTTCTGGCCTGCCTCATGAAGATAGGTTTCCATGTGATCCCCACT SLIT2.2 67 TTTACCGATGCACCTGTCCATATGGTTTCAAGGGGCAGGACTGTGATGTCCCAATTCATGCCTGCAT SNAI1.1 69 CCCAATCGGAAGCCTAACTACAGCGAGCTGCAGGACTCTAATCCAGAGTTTACCTTCCAGCAGCCCTAC SNRK.1 71 
SOD1.1 70 
SP3.1 69 TCAAGAGTCTCAGCAGCCAACCAGTCAAGCCCAAATTGTGCAAGGTATTACACCACAGACAATCCATGG SPARC.1 73 
SPARCL1.1 67 GGCACAGTGCAAGTGATGACTACTTCATCCCAAGCCAGGCCTTTCTGGAGGCCGAGAGAGCTCAATC SPAST.1 66 CCTGAGTTGTTGACAGGGCTTAGAGCTCCTGCCAGAGGGCTGTTACTCTTTGGTCCACGTGGGAAT SPHK1. 67 GGCAGCTTCCTTGAACCATTAGCTGGCTATGAGCAGGTCACCAATGAAGACCTCCTGACCAACTGC SPRY1.1 77 
SQSTM1.1 69 GGACCCGTCTACAGGTGAACTCCAGTCCCTACAGATGCCAGAATCGGAAGGGCCAAGCTCTCTGGACCC STAT1.3 81 
STAT3.1 70 TCACATGGCACTTTGGTGTTTGATAATCTCCTGGGAGAGATTGACCAGCAGTATAGCCGCTTCCTGCAAG STAT5A.1 77 
STAT5B.2 74 
STC2.1 67 AAGGAGGGGATCACCCACAGCGTGCAGGTTCAGTGTGAGCAACTGGGGAAGCCTGTGCTCCATCT STK11.1 66 GGACTCGGAGACGCTGTGCAGGAGGGCCGTCAAGATCCTCAAGAAGAAGAAG-TGCGAAGGATCCC STK15.2 69 CATCTTCCAGGAGGACCACTCTCTGTGGCACCCTGGACTACCTGCCCCCTGAAATGATTGAAGGTCGGA STK4.1 66 GAGCCACTTCCTGCAACTTTACCTCTTTCCCTCAGATGGGGAGCCATGACTGGGTTCACCTCAG STMY3.3 90 
SUCLG1.1 66 CCAAGCCTGTAGTGTCCTTCATTGCTGGTTTAACTGCTCCTCCTGGGAGAAGAATGGGTCATGCCG SULT1C2.1 67 GGGACCCAAAGCATGAAATTCGGAAGGTGATGCAGTTCATGGGAAAGAAGGTGGATGAAACAGTGCT SURV.2 80 
TACSTD2.1 80 
TAGLN.1 73 
TAP1.1 72 
TCF4.1 67 CACACCCTGGAATGGGAGACGCATCGAATCACATGGGACAGATGTAAAAGGGTCCAAGTTGCCACAT TCOF1.2 66 AGCGAGGATGAGGACGTGATCCCCGGCTACACAGTGCTTGACTCCTGGCATCAGAACCAATGTGGTG TEK.1 76 
TERT .185 
FAP2B.1 67 CGTGTGACGTGCGAGAGACGCGATGGACGCGCCTTGCTCTTACTGTGCAGGTCCTGAGAGCGTGTGG TFAP2C.1 68 CATGCCTCAGCAGATGGACGAGGTGCAGAATGTCGACGACCAGCACCTGTTGCTGCACGATCAGACAG TFPI.1 69 CCGAATGGTTTCCAGGTGGATAATTATGGAACCCAGCTCAATGCTGTGAATAACTCCCTGACTCCGCAA TGFA.2 83 
TGFb1.1 80 
TGFB2.2 75 
TGFBI.1 67 GCTACGAGTGCTGTCCTGGATATGAAAAGGTCCCTGGGGAGAAGGGCTGTCCAGCAGCCCTACCACT TGFBR1.1 67 GTCATCACCTGGCCTTGGTCCTGTGGAACTGGCAGCTGTCATTGCTGGACCAGTGTGCTTCGTCTGC TGFBR2.3 66 AACACCAATGGGTTCCATCTTTCTGGGCTCCTGATTGCTAACCACAGTTTGGCCTGATGAAGAGG THBD.1 68 AGATCTGCGACGGACTGCGGGGCCACCTAATGACAGTGCGCTCCTCGGTGGCTGCCGATGTCATTTCC 85 
TIMP1.1 76 
TIMP2.1 69 TCACCCTCTGTGACTTCATCGTGCCCTGGGACACCCTGAGCCCACCCAGAACAAGAGCCTGAACCACA TIMP3.3 67 CTACCTGCCTTGCTTTGTGACTTCCAAGAACGAGTGTCTCTGGACCGACATGCTCTCCAATTTCGGT TK1.2 84 
TLR3.1 71 
TMEM27.1 75 
TMEM47.1 71 
TMSB10.1 68 GAAATCGCCAGCTTCGATAAGGCCAAGCTGAAGAAAACGGAGACGCAGGAGAAGAACACCCTGCCGAC TNF.1 69 
TNFAIP3.1 68 ATCGTCTTGGCTGAGAAAGGGAAAAGACACACAAGTCGCGTCGGTTGGAGAAGCCAGAGCCATTCCAC TNFAIP6.1 67 AGGAGTGAAAGATGGGATGCCTATTGCTACAACCCACACGCAAAGGAGTGTGGTGGCGTCTTTACAG TNFRSF10C.3 67 GGAGTTTGACCAGAGATGCAAGGGGTGAAGGAGCGCTTCCTACCGTTAGGGAACTCTGGGGACAGAG TNFRSF10D.1 66 CCTCTCGCTTCTGGTGGTCTGTGAACTGAGTCCCTGGGATGCCTTTTAGGGCAGAGATTCCTGAGC TNFRSF11B.1 67 TGGCGACCAGACACCTTGAAGGGCCTAATGCACGCACTAAAGCACTCAAAGACGTACCACTTTCCC TNFRSF1A.1 71 
TNFSF12.1 68 TAGGCCAGGAGTTCCCAAATGTGAGGGGCGAGAAACAAGACAAGCTCCTCCCTTGAGAATTCCCTGTG TNFSF13B.1 80 
TNFSF7.1 67 CCAACCTCACTGGGACACTTTTGCCTTCCCGAAACACTGATGAGACCTTCTTTGGAGTGCAGTGGGT TNIP2.1 66 CATGTCAGAAAGGGCCGATCGGGAACGGGCTCAAAGTAGGATTCAAGAACTGGAGGAAAAGGTCGC TOP2A.4 72 
TOP2B.2 66 TGTGGACATCTTCCCCTCAGACTCCCTACTGAGCCACCTTCTCTGCCACGAACCGGTCGGGCTAG TP.3 82 
TRAIL.1 73 
TS.1 65 GCCTCGGTGTGCCTTTCAACATCGCCAGCTACGCCCTGCTCACGTACATGATTGCGCACATCACG TSC1.1 66 TCACCAAATCTCAGCCCGCTTTCCTCATCGTTCAGCCGATGTCACCACCAGCCCTTATGCTGACAC TSC2.1 69 ACAGTGGCCTCTTTCTCCTCCCTGTACCAGTCCAGCTGCCAAGGACAGCTGCACAGGAC TSPAN7.2 67 ATCACTGGGGTGATCCTGCTGGCIGRRGGAGRCRGGGGCAAACTTACTTCTGGGCACCTATATCTCCC TSPAN8.1 83 
TUBB.1 73 
TUSC2.1 68 CACCAAGAACGGGCAGAAGCGGGGCAAGCTGAGGCGAGTGCATAAGAATCTGATTCCTCAGGGCATCG tusc4.2 68 GGAGGAGCTAAATGCCTCAGGCCGGTGCACTCTGCCCATTGATGAGTCCAACACCATCCACTTGAAGG TXLNA. 1 68 GCCAGAACGGCTCAGTCTGGGGCCCTTCGTGATGTCTCTGACGAGCTGAGCCGCCAACTGGAAGACAT UBB.1 522 
UBE1C.1 76 
UBE2C.1 67 TGTCTGGCGATAAAGGGATTTCTGCCTTCCCTGAATCAGACAACCTTTTCAAATGGGTAGGGACCAT UBE2T.1 67 TGTTCTCAAATTGCCACCAAAAGGTGCTTGGAGACCATCCCTCAACATCGTGTTGACCTCT UGCG.1 73 
UMOD.1 66 GCGTGGACCTGGATGAGTGCGCCATTCCTGGAGCTCACAACTGCTCCGCCAACAGCAGCTGCGTAA upa.3 70 
USP34.1 70 
VCAM1.1 89 
VCAN.1 69 CCTGCTACACAGCCAACAAGACCACCCACTGTGGAAGACAAAGAGGCCTTTGGACCTCAGGCGCTTTCT VDR.2 67 GCCCTGGATTTGAGAAAGAGAAGTCTGGATCTGGGACCCTTTCCTTCCTTCCCTGGCTTGTAACT VEGF.1 71 
VEGFB.1 71 
VHL.1 67 CGGTTGGTGACTTGTCTGCCTCCTGCTTTGGGAAGACTGAGGCATCCGAGGCAGGGACAAGTCTT VIM.3 72 
VTCN1.1 70 
VTN.1 67 AGTCAATCTTCGCAGACGGCGAGTGGACACTGTGGACCCTCCCTACCCACGCTCCATCGCTCAGTAC VWF.1 66 TGAAGCACAGTGCCCTCTCCGTCGAGCTGCACAGTGACATGGAGGTGACGGTGAATGGGAGACTGG WIF.1 67 AACAAGCTGAGTGCCCAGGCGGGTGCCGAAATGGAGGCTTTTGTAATGAATGAAAGACGCATCTGCGAGTG W1SP1.1 75 
WT1.1 66 TGTACGGTCGGCATCTGACCAGTGAGAAACGCCCCTTCATGTGTGCTTACCCAGGCTGCAATAA WWOX.5 74 
XDH.1 66 TGGTGGCAGACATCCCTTCCTGGCCAGATACAAGGTTGGCTTCATGAAGACTGGGACAGTTGTGGC XIAP.1 77 
XPNPEP2.2 72 
YB-12 76 
ZHX2.1 67 GAGTACGACCAGTTAGCGGGGAACAAGTGGCCTGGTCCGAACTGAGATTGTGCGTTGGTTCAAGGAGA - The invention will now be described by reference to the following clauses:
- 1. A method for determining a likely clinical outcome for a patient with cancer comprising:
- (a) measuring, in a biological sample obtained from the patient, an expression level of at least one gene, or its expression product, from Tables 3a, 3b, 8a or 8b;
- (b) normalizing the expression level to obtain a normalized expression level; and
- (c) calculating a score estimating the likelihood that the patient will have a negative clinical outcome based on the normalized expression level,
wherein expression of genes listed in Tables 3b and 8b are positively correlated with a risk of a negative clinical outcome. - 2. The method of
clause 1, further comprising generating a report based on the score. - 3. The method of
clause 1, wherein the negative clinical outcome is a recurrence of cancer. - 4. The method of
clause 3, where the biological sample is obtained from a tumor. - 5. The method of
clause 4, wherein the tumor is a renal cell carcinoma. - 6. The method of
clause 1, wherein expression levels from at least two genes are measured. - 7. The method of
clause 6, wherein the at least two genes are from one or more gene subsets. - 8. The method of
clause 7, wherein the one or more gene subsets is angiogenesis, immune response, transport, cell adhesion/extracellular matrix, cell cycle, or apoptosis genes. - 9. A method for determining stage for a tumor obtained from a cancer patient, comprising:
- (a) measuring, in a biological sample obtained from the tumor, an expression level of at least one proxy gene, or its gene product, from Tables 4a or 4b;
- (b) normalizing the expression level to obtain a normalized expression level; and
- (c) determining the stage of the tumor based on the normalized expression level,
wherein expression of proxy genes listed in Table 4b is negatively correlated with increased stage of the tumor. - 10. The method of clause 9, wherein the tumor is renal cell carcinoma.
- 11. A method for determining grade of a tumor obtained from a cancer patient, comprising:
- (a) measuring, in a biological sample obtained from the tumor, an expression level of at least one proxy gene, or its gene product, from Tables 5a and 5b;
- (b) normalizing the expression level to obtain a normalized expression level; and
- (c) determining grade of the tumor based on the normalized expression level,
wherein expression of proxy genes listed in Table 5b is negatively correlated with increased grade of the tumor. - 12. The method of
clause 11, wherein the tumor is renal cell carcinoma. - 13. A method for determining presence of necrosis in a tissue sample obtained from a patient with cancer, comprising:
- (a) measuring, in the tissue sample, an expression level of at least one proxy gene, or its gene product, from Tables 6a and 6b;
- (b) normalizing the expression level to obtain a normalized expression level; and
- (c) determining the presence of necrosis of the tissue based on the normalized expression level,
wherein expression of proxy genes listed in Table 6b is negatively correlated with the presence of necrosis. - 14. The method of
clause 13, wherein the cancer is renal cell carcinoma. - 15. A method for determining nodal status of a patient with cancer, comprising:
- (a) measuring, in a biological sample obtained from the cancer patient, an expression level of at least one proxy gene, or its gene product, from Tables 7a and 7b;
- (b) normalizing the expression level to obtain a normalized expression level; and
- (c) determining the nodal status of the cancer patient based on the normalized expression level,
wherein expression of proxy genes listed in Table 7b is negatively correlated with nodal invasion. - 16. The method of
clause 15, wherein the cancer is renal cell carcinoma.
Claims (12)
- A method comprising:(a) measuring, in a biological sample obtained from a cancer patient with renal cell carcinoma, an expression level of at least one RNA transcript, or its expression product, of NOS3;(b) normalizing the expression level to obtain a normalized expression level; and(c)(i) determining a likelihood of recurrence of cancer for the patient based on the normalized expression level of the at least one RNA transcript, or its expression product, of NOS3, wherein the normalized expression levels of NOS3 are negatively correlated with a higher risk of cancer recurrence; or(ii) determining a likelihood of an increased tumor stage for the patient based on the normalized expression level of at least one RNA transcript, or its expression product, of NOS3, wherein the normalized expression level of NOS3 is negatively correlated with increased stage of the tumour; or(iii) determining a likelihood of an increased tumour grade for the patient based on the normalized expression level of the RNA transcript, or its expression product, of NOS3, wherein the normalized expression level of NOS3 is negatively correlated with increased grade of the tumour; or(iv) determining the presence of necrosis for the patient based on the normalized expression level of the RNA transcript, or its expression product, of NOS3, wherein the normalized expression level of NOS3 is negatively correlated with the presence of necrosis; or(v) determining a nodal status of the patient based on the normalized expression level of the RNA transcript, or its expression product, wherein the normalized expression level of NOS3 is negatively correlated with nodal invasion.
- A method as claimed in claim 1c) i), further comprising performing an assessment of the risk of recurrence and generating a report based on a risk score.
- A method as claimed in claim 1, where the biological sample was obtained from a tumour.
- A method as claimed in claim 1, wherein the biological sample is a fixed, paraffin- embedded tissue sample.
- A method as claimed in claim 1c) i), wherein expression levels from at least two genes are measured.
- A method as claimed in any preceding claim, wherein the expression level of the RNA transcript is measured using a PCR-based method.
- The method of claim 1 c) i), further comprising measuring an expression level of at least one other gene, or its expression product, from Tables 3a, 3b, 8a or 8b; wherein expression of genes listed in Tables 3a and 8a are negatively correlated with a higher risk of cancer recurrence, and
wherein expression of genes listed in Tables 3b and 8b are positively correlated with a higher risk of cancer recurrence. - The method of claim 1 c) ii), further comprising measuring an expression level of at least one other gene, or its gene product, from Tables 4a or 4b; wherein expression of genes listed in Table 4a is positively correlated with increased stage of the tumor, and
wherein expression of genes listed in Table 4b is negatively correlated with increased stage of the tumor. - The method of claim 1 c) iii), further comprising measuring an expression level of at least one other gene, or its gene product, from Tables 5a and 5b; wherein expression of genes listed in Table 5a is positively correlated with increased grade of the tumor, and
wherein expression of genes listed in Table 5b is negatively correlated with increased grade of the tumor. - The method of claim 1 c) iv), further comprising measuring an expression level of at least one other gene, or its gene product, from Tables 6a and 6b; wherein expression of genes listed in Table 6a is positively correlated with the presence of necrosis, and
wherein expression of genes listed in Table 6b is negatively correlated with the presence of necrosis. - The method of claim 1 c) v), further comprising measuring an expression level of at least one other gene, or its gene product, from from Tables 7a and 7b; wherein expression of genes listed in Table 7a is positively correlated with nodal invasion, and
wherein expression of genes listed in Table 7b is negatively correlated with nodal invasion. - The method of any preceding claim wherein the renal cell carcinoma is clear cell renal cell carcinoma.
Priority Applications (1)
| Application Number | Priority Date | Filing Date | Title |
|---|---|---|---|
| EP20210111.9A EP3831964A3 (en) | 2010-01-11 | 2011-01-07 | Method to use gene expression to determine likelihood of clinical outcome of renal cancer |
Applications Claiming Priority (6)
| Application Number | Priority Date | Filing Date | Title |
|---|---|---|---|
| US29403810P | 2010-01-11 | 2010-01-11 | |
| US34623010P | 2010-05-19 | 2010-05-19 | |
| EP17153152.8A EP3178944B1 (en) | 2010-01-11 | 2011-01-07 | Method to use gene expression to determine likelihood of clinical outcome of renal cancer |
| PCT/US2011/020596 WO2011085263A2 (en) | 2010-01-11 | 2011-01-07 | Method to use gene expression to determine likelihood of clinical outcome of renal cancer |
| EP15203193.6A EP3029155A3 (en) | 2010-01-11 | 2011-01-07 | Method to use gene expression to determine likelihood of clinical outcome of renal cancer |
| EP11732245.3A EP2524055A4 (en) | 2010-01-11 | 2011-01-07 | Method to use gene expression to determine likelihood of clinical outcome of renal cancer |
Related Parent Applications (3)
| Application Number | Title | Priority Date | Filing Date |
|---|---|---|---|
| EP11732245.3A Division EP2524055A4 (en) | 2010-01-11 | 2011-01-07 | Method to use gene expression to determine likelihood of clinical outcome of renal cancer |
| EP15203193.6A Division EP3029155A3 (en) | 2010-01-11 | 2011-01-07 | Method to use gene expression to determine likelihood of clinical outcome of renal cancer |
| EP17153152.8A Division EP3178944B1 (en) | 2010-01-11 | 2011-01-07 | Method to use gene expression to determine likelihood of clinical outcome of renal cancer |
Related Child Applications (1)
| Application Number | Title | Priority Date | Filing Date |
|---|---|---|---|
| EP20210111.9A Division EP3831964A3 (en) | 2010-01-11 | 2011-01-07 | Method to use gene expression to determine likelihood of clinical outcome of renal cancer |
Publications (1)
| Publication Number | Publication Date |
|---|---|
| EP3561078A1 true EP3561078A1 (en) | 2019-10-30 |
Family
ID=44258831
Family Applications (5)
| Application Number | Title | Priority Date | Filing Date |
|---|---|---|---|
| EP11732245.3A Withdrawn EP2524055A4 (en) | 2010-01-11 | 2011-01-07 | Method to use gene expression to determine likelihood of clinical outcome of renal cancer |
| EP19173150.4A Withdrawn EP3561078A1 (en) | 2010-01-11 | 2011-01-07 | Method to use gene expression to determine likelihood of clinical outcome of renal cancer |
| EP15203193.6A Withdrawn EP3029155A3 (en) | 2010-01-11 | 2011-01-07 | Method to use gene expression to determine likelihood of clinical outcome of renal cancer |
| EP17153152.8A Active EP3178944B1 (en) | 2010-01-11 | 2011-01-07 | Method to use gene expression to determine likelihood of clinical outcome of renal cancer |
| EP20210111.9A Pending EP3831964A3 (en) | 2010-01-11 | 2011-01-07 | Method to use gene expression to determine likelihood of clinical outcome of renal cancer |
Family Applications Before (1)
| Application Number | Title | Priority Date | Filing Date |
|---|---|---|---|
| EP11732245.3A Withdrawn EP2524055A4 (en) | 2010-01-11 | 2011-01-07 | Method to use gene expression to determine likelihood of clinical outcome of renal cancer |
Family Applications After (3)
| Application Number | Title | Priority Date | Filing Date |
|---|---|---|---|
| EP15203193.6A Withdrawn EP3029155A3 (en) | 2010-01-11 | 2011-01-07 | Method to use gene expression to determine likelihood of clinical outcome of renal cancer |
| EP17153152.8A Active EP3178944B1 (en) | 2010-01-11 | 2011-01-07 | Method to use gene expression to determine likelihood of clinical outcome of renal cancer |
| EP20210111.9A Pending EP3831964A3 (en) | 2010-01-11 | 2011-01-07 | Method to use gene expression to determine likelihood of clinical outcome of renal cancer |
Country Status (12)
| Country | Link |
|---|---|
| US (4) | US9551034B2 (en) |
| EP (5) | EP2524055A4 (en) |
| JP (5) | JP6286124B2 (en) |
| AU (1) | AU2011203977B2 (en) |
| CA (2) | CA3128103A1 (en) |
| DK (1) | DK3178944T3 (en) |
| ES (1) | ES2741379T3 (en) |
| IL (6) | IL219978A (en) |
| MX (2) | MX341866B (en) |
| NZ (4) | NZ600268A (en) |
| SG (1) | SG181806A1 (en) |
| WO (1) | WO2011085263A2 (en) |
Families Citing this family (24)
| Publication number | Priority date | Publication date | Assignee | Title |
|---|---|---|---|---|
| EP2524055A4 (en) | 2010-01-11 | 2013-06-05 | Genomic Health Inc | Method to use gene expression to determine likelihood of clinical outcome of renal cancer |
| WO2012015765A2 (en) | 2010-07-27 | 2012-02-02 | Genomic Health, Inc. | Method for using gene expression to determine prognosis of prostate cancer |
| CN106198980B (en) | 2010-08-13 | 2018-09-07 | 私募蛋白质体公司 | Cancer of pancreas biomarker and application thereof |
| WO2013016673A2 (en) * | 2011-07-27 | 2013-01-31 | The United States Of America, As Represented By The Secretary, Department Of Health And Human Services | Use of dpep1 and tpx2 expression for evaluating treatment or survival time of patients with pancreatic ductal adenocarcinoma |
| EP2748356A2 (en) * | 2011-08-22 | 2014-07-02 | Somalogic, Inc. | Renal cell carcinoma biomarkers and uses thereof |
| US10195174B2 (en) | 2011-10-24 | 2019-02-05 | Signalchem Lifesciences Corporation | Carbonic anhydrase IX-related markers and use thereof |
| NZ722902A (en) | 2012-01-31 | 2017-12-22 | Genomic Health Inc | Gene expression profile algorithm and test for determining prognosis of prostate cancer |
| DK3004392T3 (en) * | 2013-05-30 | 2020-10-26 | Genomic Health Inc | GENE EXPRESSION PROFILE ALGORM FOR CALCULATING A RECURRENCY SCORE FOR A PATIENT WITH KIDNEY CANCER |
| EP3047040B1 (en) * | 2013-09-17 | 2019-12-11 | Lucence Life Sciences Pte Ltd. | Multigene assay for prognosis of renal cancer |
| US10731163B2 (en) * | 2014-09-02 | 2020-08-04 | Max-Delbrück-Centrum Für Molekulare Medizin In Der Helmholtz-Gemeinschaft | Oligonucleotide targeted to the A20-3′ untranslated region |
| JP6638128B2 (en) * | 2014-10-30 | 2020-01-29 | 公立大学法人福島県立医科大学 | Test markers and test methods for malignancy of kidney cancer |
| WO2016126883A1 (en) * | 2015-02-03 | 2016-08-11 | Cedars-Sinai Medical Center | Biomarker based prognostic model for predicting overall survival in patients with metastatic clear cell kidney cancer |
| GB201616912D0 (en) | 2016-10-05 | 2016-11-16 | University Of East Anglia | Classification of cancer |
| WO2018161027A1 (en) * | 2017-03-03 | 2018-09-07 | Oregon State University | Antisense antibacterial compounds and methods |
| US10636512B2 (en) | 2017-07-14 | 2020-04-28 | Cofactor Genomics, Inc. | Immuno-oncology applications using next generation sequencing |
| US11335464B2 (en) * | 2018-01-12 | 2022-05-17 | Siemens Medical Solutions Usa, Inc. | Integrated precision medicine by combining quantitative imaging techniques with quantitative genomics for improved decision making |
| US11427873B2 (en) * | 2018-08-10 | 2022-08-30 | Omniseq, Inc. | Methods and systems for assessing proliferative potential and resistance to immune checkpoint blockade |
| RU2747746C2 (en) * | 2018-10-24 | 2021-05-13 | Общество с ограниченной ответственностью «Онкобокс» | Test-classifier of the clinical response to treatment with sorafenib in individual patients with kidney cancer |
| US11845989B2 (en) | 2019-01-23 | 2023-12-19 | Regeneron Pharmaceuticals, Inc. | Treatment of ophthalmic conditions with angiopoietin-like 7 (ANGPTL7) inhibitors |
| AU2020210630A1 (en) | 2019-01-23 | 2021-08-05 | Regeneron Pharmaceuticals, Inc. | Treatment of ophthalmic conditions with angiopoietin-like 7 (ANGPTL7) inhibitors |
| US20220364178A1 (en) * | 2019-08-14 | 2022-11-17 | University Of Massachusetts | Urinary rna signatures in renal cell carcinoma (rcc) |
| WO2022182768A1 (en) | 2021-02-26 | 2022-09-01 | Regeneron Pharmaceuticals, Inc. | Treatment of inflammation with glucocorticoids and angiopoietin-like 7 (angptl7) inhibitors |
| CN113817816A (en) * | 2021-10-08 | 2021-12-21 | 济南艾迪康医学检验中心有限公司 | Primer, kit and method for detecting EPAS1 gene mutation |
| WO2023080900A1 (en) * | 2021-11-05 | 2023-05-11 | Genentech, Inc. | Methods and compositions for classifying and treating kidney cancer |
Citations (5)
| Publication number | Priority date | Publication date | Assignee | Title |
|---|---|---|---|---|
| US5322770A (en) | 1989-12-22 | 1994-06-21 | Hoffman-Laroche Inc. | Reverse transcription with thermostable DNA polymerases - high temperature reverse transcription |
| US5538848A (en) | 1994-11-16 | 1996-07-23 | Applied Biosystems Division, Perkin-Elmer Corp. | Method for detecting nucleic acid amplification using self-quenching fluorescence probe |
| JP2005211023A (en) * | 2004-01-30 | 2005-08-11 | Hayashibara Biochem Lab Inc | Method for estimating possibility of metastasis or relapse of renal cell carcinoma |
| US20060008809A1 (en) | 2004-07-06 | 2006-01-12 | Genomic Health | Method for quantitative PCR data analysis system (QDAS) |
| US20060088823A1 (en) * | 2001-03-29 | 2006-04-27 | Brian Haab | Microarray gene expression profiling in clear cell renal cell carcinoma : prognosis and drug target identification |
Family Cites Families (49)
| Publication number | Priority date | Publication date | Assignee | Title |
|---|---|---|---|---|
| US7135314B1 (en) * | 1997-04-17 | 2006-11-14 | Cell Therapeutics, Inc. | Human phosphatidic acid phosphatase |
| ES2323220T3 (en) * | 2000-01-13 | 2009-07-09 | Genentech, Inc. | STRA6 HUMAN POLYPEPTIDES. |
| DE10126344A1 (en) * | 2000-07-14 | 2002-01-24 | Max Planck Gesellschaft | Apoptosis-inducing DNA sequences |
| AU2001294842A1 (en) * | 2000-09-28 | 2002-04-08 | Atairgin Technologies, Inc. | A method of determining tumor characteristics by determining abnormal copy number or expression level of lipid-associated genes |
| AU2002254482A1 (en) * | 2001-03-19 | 2002-10-03 | Corixa Corporation | Compositions and methods for the therapy and diagnosis of kidney cancer |
| DK1410011T3 (en) * | 2001-06-18 | 2011-07-18 | Netherlands Cancer Inst | Diagnosis and prognosis of breast cancer patients |
| US7470509B2 (en) * | 2002-02-08 | 2008-12-30 | Millennium Pharmaceuticals, Inc. | Compositions and methods for the identification, assessment, prevention and therapy of ovarian cancer |
| ES2374311T3 (en) * | 2002-03-13 | 2012-02-15 | Genomic Health, Inc. | OBTAINING PROFILE OF GENE EXPRESSION IN BIOPSIATED TUMOR FABRICS. |
| CA2501131A1 (en) * | 2002-10-04 | 2004-04-22 | Van Andel Research Institute | Molecular sub-classification of kidney tumors and the discovery of new diagnostic markers |
| US7611839B2 (en) * | 2002-11-21 | 2009-11-03 | Wyeth | Methods for diagnosing RCC and other solid tumors |
| AU2004235395A1 (en) * | 2003-04-29 | 2004-11-11 | Wyeth | Methods for prognosis and treatment of solid tumors |
| DK3170906T3 (en) | 2003-06-24 | 2018-11-05 | Genomic Health Inc | PREDICTION OF THE LIKELI REVENUE OF CANCER |
| BRPI0412110A (en) | 2003-07-02 | 2006-11-21 | Novartis Ag | genes regulated in ovarian cancer as prognostic and therapeutic targets |
| US20050002904A1 (en) * | 2003-07-03 | 2005-01-06 | Wary Kishore K. | Uses of vascular endothelial growth factor and type I collagen inducible protein (VCIP) |
| EP3330875B1 (en) | 2003-07-10 | 2021-12-01 | Genomic Health, Inc. | Expression profile algorithm and test for prognosing breast cancer recurrence |
| WO2005024603A2 (en) | 2003-09-10 | 2005-03-17 | The Board Of Regents Of The University Of Texas System | Methods for detecting, diagnosing and treating human renal cell carcinoma |
| CA2563074C (en) | 2004-04-09 | 2014-05-20 | Genomic Health, Inc. | Gene expression markers for predicting response to chemotherapy |
| US20070224596A1 (en) * | 2004-04-09 | 2007-09-27 | Mariana Nacht | Compositions and methods for the modifying hypoxia induced gene regulation |
| JP2008500057A (en) * | 2004-05-27 | 2008-01-10 | バーテックス ファーマシューティカルズ インコーポレイテッド | Biomarkers for monitoring inhibition of the IMPDH pathway |
| WO2006066071A2 (en) * | 2004-12-17 | 2006-06-22 | Mayo Foundation For Medical Education And Research | Prognosis of renal cell carcinoma |
| US20090258002A1 (en) * | 2005-02-01 | 2009-10-15 | Government Of The Us, As Represented By The Secretary, Department Of Health And Human Services | Biomarkers for Tissue Status |
| MX2007010001A (en) | 2005-02-18 | 2007-09-27 | Wyeth Corp | Pharmacogenomic markers for prognosis of solid tumors. |
| EP1910564A1 (en) | 2005-05-13 | 2008-04-16 | Duke University | Gene expression signatures for oncogenic pathway deregulation |
| WO2006124022A1 (en) | 2005-05-13 | 2006-11-23 | Vanandel Research Institute | Microarray gene expression profiling in subtypes of clear cell renal cell carcinoma |
| US20070037186A1 (en) * | 2005-05-20 | 2007-02-15 | Yuqiu Jiang | Thyroid fine needle aspiration molecular assay |
| US8278038B2 (en) * | 2005-06-08 | 2012-10-02 | Millennium Pharmaceuticals, Inc. | Methods for the identification, assessment, and treatment of patients with cancer therapy |
| WO2006135886A2 (en) * | 2005-06-13 | 2006-12-21 | The Regents Of The University Of Michigan | Compositions and methods for treating and diagnosing cancer |
| EP1907858A4 (en) * | 2005-06-13 | 2009-04-08 | Univ Michigan | Compositions and methods for treating and diagnosing cancer |
| WO2006134468A1 (en) * | 2005-06-15 | 2006-12-21 | Pfizer Limited | Substituted arylpyrazoles for use against parasitites |
| EP1930426A4 (en) | 2005-09-02 | 2009-04-29 | Toray Industries | Composition and method for diagnosing kidney cancer and estimating kidney cancer patient s prognosis |
| AU2006292033B2 (en) | 2005-09-14 | 2010-08-12 | Human Genetic Signatures Pty Ltd | Assay for a health state |
| CA2622852A1 (en) * | 2005-09-30 | 2007-04-12 | Universiteit Maastricht | Tumor angiogenesis associated genes and a method for their identification |
| EP1777523A1 (en) | 2005-10-19 | 2007-04-25 | INSERM (Institut National de la Santé et de la Recherche Médicale) | An in vitro method for the prognosis of progression of a cancer and of the outcome in a patient and means for performing said method |
| US8445198B2 (en) * | 2005-12-01 | 2013-05-21 | Medical Prognosis Institute | Methods, kits and devices for identifying biomarkers of treatment response and use thereof to predict treatment efficacy |
| CN101365806B (en) | 2005-12-01 | 2016-11-16 | 医学预后研究所 | For identifying method and apparatus and the purposes of prediction curative effect thereof of the biomarker of therapeutic response |
| JP2009523709A (en) | 2005-12-16 | 2009-06-25 | ジェネンテック・インコーポレーテッド | Methods for diagnosis, prognosis prediction and treatment of glioma |
| WO2007146668A2 (en) * | 2006-06-06 | 2007-12-21 | University Of Massachusetts | Use of imp3 as a prognostic marker for cancer |
| MX2009001489A (en) * | 2006-08-10 | 2009-02-18 | Millennium Pharm Inc | For the identification, assessment, and treatment of patients with cancer therapy. |
| US8450057B2 (en) | 2006-08-14 | 2013-05-28 | The Brigham And Women's Hospital, Inc. | Diagnostic tests using gene expression ratios |
| US9034574B2 (en) | 2006-12-27 | 2015-05-19 | The Johns Hopkins University | Agents for reversing epigenetic silencing of genes |
| US20080286273A1 (en) | 2007-05-02 | 2008-11-20 | Siemens Medical Solutions Usa, Inc. | Knowledge-Based Proliferation Signatures and Methods of Use |
| EP1990417A1 (en) | 2007-05-11 | 2008-11-12 | Universität Bayreuth | Archaeal plasmid vector system |
| WO2009105640A1 (en) | 2008-02-22 | 2009-08-27 | Virginia Commonwealth University | Signatures associated with rejection or recurrence of cancer |
| CA2743473C (en) | 2008-11-17 | 2022-06-14 | Veracyte, Inc. | Methods and compositions of molecular profiling for disease diagnostics |
| WO2010149640A2 (en) * | 2009-06-26 | 2010-12-29 | Noviogendix Research B.V. | Molecular markers in kidney cancer |
| NZ599194A (en) | 2009-11-23 | 2014-07-25 | Genomic Health Inc | Methods to predict clinical outcome of cancer |
| EP2524055A4 (en) | 2010-01-11 | 2013-06-05 | Genomic Health Inc | Method to use gene expression to determine likelihood of clinical outcome of renal cancer |
| BR112013032232A2 (en) | 2011-06-16 | 2016-09-20 | Caris Life Sciences Switzerland Holdings S A R L | Cancer characterization method using nucleic acid biomarker |
| EP2748356A2 (en) | 2011-08-22 | 2014-07-02 | Somalogic, Inc. | Renal cell carcinoma biomarkers and uses thereof |
-
2011
- 2011-01-07 EP EP11732245.3A patent/EP2524055A4/en not_active Withdrawn
- 2011-01-07 EP EP19173150.4A patent/EP3561078A1/en not_active Withdrawn
- 2011-01-07 MX MX2012007882A patent/MX341866B/en active IP Right Grant
- 2011-01-07 AU AU2011203977A patent/AU2011203977B2/en active Active
- 2011-01-07 NZ NZ600268A patent/NZ600268A/en unknown
- 2011-01-07 NZ NZ719474A patent/NZ719474A/en unknown
- 2011-01-07 EP EP15203193.6A patent/EP3029155A3/en not_active Withdrawn
- 2011-01-07 EP EP17153152.8A patent/EP3178944B1/en active Active
- 2011-01-07 DK DK17153152.8T patent/DK3178944T3/en active
- 2011-01-07 WO PCT/US2011/020596 patent/WO2011085263A2/en active Application Filing
- 2011-01-07 CA CA3128103A patent/CA3128103A1/en active Pending
- 2011-01-07 SG SG2012045142A patent/SG181806A1/en unknown
- 2011-01-07 NZ NZ705645A patent/NZ705645A/en unknown
- 2011-01-07 EP EP20210111.9A patent/EP3831964A3/en active Pending
- 2011-01-07 JP JP2012548188A patent/JP6286124B2/en active Active
- 2011-01-07 US US12/987,023 patent/US9551034B2/en active Active
- 2011-01-07 ES ES17153152T patent/ES2741379T3/en active Active
- 2011-01-07 NZ NZ61700311A patent/NZ617003A/en unknown
- 2011-01-07 CA CA2783858A patent/CA2783858C/en active Active
-
2012
- 2012-05-24 IL IL219978A patent/IL219978A/en active IP Right Grant
- 2012-07-05 MX MX2020009704A patent/MX2020009704A/en unknown
-
2016
- 2016-03-04 JP JP2016041689A patent/JP2016174600A/en active Pending
- 2016-12-05 US US15/368,979 patent/US10892038B2/en active Active
-
2017
- 2017-04-06 IL IL251635A patent/IL251635B/en active IP Right Grant
- 2017-04-14 JP JP2017080314A patent/JP6546214B2/en active Active
- 2017-12-14 IL IL256335A patent/IL256335B/en active IP Right Grant
-
2018
- 2018-10-03 IL IL26210018A patent/IL262100B/en active IP Right Grant
-
2019
- 2019-06-20 JP JP2019114273A patent/JP7307602B2/en active Active
- 2019-10-24 IL IL270151A patent/IL270151B/en active IP Right Grant
-
2020
- 2020-11-19 US US16/952,566 patent/US11776664B2/en active Active
-
2021
- 2021-02-07 IL IL280689A patent/IL280689B/en unknown
- 2021-07-06 JP JP2021112234A patent/JP7385630B2/en active Active
-
2023
- 2023-08-23 US US18/454,312 patent/US20240096451A1/en active Pending
Patent Citations (7)
| Publication number | Priority date | Publication date | Assignee | Title |
|---|---|---|---|---|
| US5322770A (en) | 1989-12-22 | 1994-06-21 | Hoffman-Laroche Inc. | Reverse transcription with thermostable DNA polymerases - high temperature reverse transcription |
| US5538848A (en) | 1994-11-16 | 1996-07-23 | Applied Biosystems Division, Perkin-Elmer Corp. | Method for detecting nucleic acid amplification using self-quenching fluorescence probe |
| US5723591A (en) | 1994-11-16 | 1998-03-03 | Perkin-Elmer Corporation | Self-quenching fluorescence probe |
| US5876930A (en) | 1994-11-16 | 1999-03-02 | Perkin-Elmer Corporation | Hybridization assay using self-quenching fluorescence probe |
| US20060088823A1 (en) * | 2001-03-29 | 2006-04-27 | Brian Haab | Microarray gene expression profiling in clear cell renal cell carcinoma : prognosis and drug target identification |
| JP2005211023A (en) * | 2004-01-30 | 2005-08-11 | Hayashibara Biochem Lab Inc | Method for estimating possibility of metastasis or relapse of renal cell carcinoma |
| US20060008809A1 (en) | 2004-07-06 | 2006-01-12 | Genomic Health | Method for quantitative PCR data analysis system (QDAS) |
Non-Patent Citations (56)
| Title |
|---|
| AL-AYANTI M ET AL., ARCH PATHOL LAB MED, vol. 127, 2003, pages 593 - 596 |
| AMERICAN JOINT COMMITTEE ON CANCER (AJCC) CANCER STAGING MANUAL, 2002, pages 323 - 325 |
| AUSUBEL ET AL.: "Current Protocols in Molecular Biology", 1995, WILEY INTERSCIENCE |
| AUSUBEL ET AL.: "Current Protocols of Molecular Biology", 1997, WILEY AND SONS |
| AUSUBEL ET AL.: "Short Protocols in Molecular Biology", 1995, WILEY & SONS |
| B. LEWINGENES IV: "Cell", 1990, PRESS |
| BOOM R ET AL., J CLIN MICROBIOL., vol. 28, 1990, pages 495 - 503 |
| C. SPEARMAN, AMER. J. PSYCHOL, vol. 15, 1904, pages 72 - 101 |
| D. FREEDMAN: "Statistics", 2007, W.W. NORTON & CO |
| D. HOSMERS. LEMESHOW: "Applied Logistic Regression", 1989, JOHN WILEY AND SONS |
| DIEFFENBACH, C.W. ET AL.: "PCR Primer, A Laboratory Manual", 1995, COLD SPRING HARBOR LABORATORY PRESS, article "General Concepts for PCR Primer Design", pages: 133 - 155 |
| DINGCANTOR, PROC. NAT'L ACAD SCI, vol. 100, 2003, pages 3059 - 3064 |
| FERGUSON ET AL., ANALYTICAL CHEMISTRY, vol. 72, 2000, pages 5618 |
| FUKUMURA ET AL., NUCL. ACIDS. RES., vol. 31, no. 16, 2003, pages e94 |
| G. NORMAND. STREINER: "Biostatistics: The Bare Essentials", 2007, pages: 137 - 138 |
| GREENE ET AL., AJCC CANCER STAGING MANUAL, 2002, pages 323 - 325 |
| H. MOTULSKY, H.: "Intuitive Biostatistics", 1995, OXFORD UNIVERSITY PRESS |
| H. MOTULSKY: "Intuitive Biostatistics", 1995, OXFORD UNIVERSITY PRESS |
| H. RAUSCHMEIER ET AL., WORLD J UROL, vol. 2, 1984, pages 103 - 108 |
| HELD ET AL., GENOME RESEARCH, vol. 6, 1996, pages 986 - 994 |
| HOD, BIOTECHNIQUES, vol. 13, 1992, pages 852 - 854 |
| HOLLAND ET AL., PROC NAT ACAD SCI USA, vol. 88, 1991, pages 7276 - 7280 |
| HOLLAND ET AL., PROC. NATL. ACAD. SCI., vol. 88, 1991, pages 7276 - 7280 |
| INNISGELFAND: "PCR Protocols, A Guide to Methods and Applications", 1994, CRC PRESS, LONDON, article "Optimization of PCRs", pages: 5 - 11 |
| J. MARIONI, GENOME RESEARCH, vol. 18, no. 9, 2008, pages 1509 - 1517 |
| J. MYERSA. WELL, RESEARCH DESIGN AND STATISTICAL ANALYSIS, 2003, pages 508 |
| J. RODGERSW. NICEWANDER, THE AMERICAN STATISTICIAN, vol. 42, 1988, pages 59 - 66 |
| JANSSON ET AL: "NITRIC OXIDE SYNTHASE ACTIVITY IN HUMAN RENAL CELL CARCINOMA", JOURNAL OF UROL, LIPPINCOTT WILLIAMS & WILKINS, BALTIMORE, MD, US, vol. 160, no. 2, 1 August 1998 (1998-08-01), pages 556 - 560, XP005562512, ISSN: 0022-5347, DOI: 10.1016/S0022-5347(01)62958-6 * |
| K. SPECHT ET AL., AM. J. PATHOL., vol. 158, 2001, pages 419 - 29 |
| KAWAMOTO ET AL., GENOME RES., vol. 12, 1999, pages 1305 - 1312 |
| KOK J ET AL., LABORATORY INVESTIGATION, vol. 85, 2005, pages 154 - 159 |
| LEE ET AL., NUCL. ACIDS RES, vol. 21, 1993, pages 3761 - 3766 |
| LEIBOVICH ET AL.: "prediction of progression after radical nephrectomy for patients with clear cell renal cell carcinoma", CANCER, vol. 97, 2003, pages 1663 - 1671 |
| LIANGPARDEE, SCIENCE, vol. 257, 1992, pages 967 - 971 |
| M. CRAGER: "Gene identification using true discovery rate degree of association sets and estimates corrected for regression to the mean", STATISTICS IN MEDICINE, December 2009 (2009-12-01) |
| M. CRAGER: "Gene identification using true discovery rate degree of association sets and estimates corrected for regression to the mean", STATISTICS IN MEDICINE, vol. 29, 2009, pages 33 - 45 |
| M. CRONIN ET AL., AM J PATHOL, vol. 164, 2004, pages 35 - 42 |
| M. CRONIN, AM J. PATHOL, vol. 164, no. 1, 2004, pages 35 - 42 |
| M. ZHOU ET AL.: "AACR Annual Meeting", 2007, article "Optimized RNA extraction and RT-PCR assays provide successful molecular analysis on a wide variety of archival fixed tissues" |
| MARCH: "Advanced Organic Chemistry Reactions, Mechanisms and Structure", 1992, JOHN WILEY & SONS |
| OLIPHANT ET AL., DISCOVERY OF MARKERS FOR DISEASE (SUPPLEMENT TO BIOTECHNIQUES, June 2002 (2002-06-01) |
| P. ROYSTONM. PARMER, STATISTICS IN MEDICINE, vol. 21, no. 15, 2002, pages 2175 - 2197 |
| PARKERBARNES, METHODS IN MOLECULAR BIOLOGY, vol. 106, 1999, pages 247 - 283 |
| PEARSON K.LEE A., BIOMETRIKA, vol. 2, 1902, pages 357 |
| PLASTERER, T.N.: "PrimerSelect: Primer and probe design", METHODS MOL. BIOL., vol. 70, 1997, pages 520 - 527 |
| RINI B I ET AL: "4501: Identification of prognostic genomic markers in patients with localized clear cell renal cell carcinoma (ccRCC)", JOURNAL OF CLINICAL ONCOLOGY; AMERICAN SOCIETY OF CLINICAL ONCOLOGY (ASCO ) 2010 ANNUAL MEETING, AMERICAN SOCIETY OF CLINICAL ONCOLOGY, US; CHICAGO, ILLINOIS, USA, vol. 28, no. 15, Suppl, 20 May 2010 (2010-05-20), pages 4501, XP008183019, ISSN: 0732-183X, DOI: 10.1200/JCO.2010.28.15_SUPPL.4501 * |
| SAMBROOK ET AL.: "Molecular Cloning: A Laboratory Manual", 1989, COLD SPRING HARBOR PRESS |
| SAMBROOK ET AL.: "Molecular Cloning: A Laboratory Manual", 2001, COLD SPRING HARBOR |
| SILVA S ET AL., BMC CANCER, vol. 6, 2006, pages 200 |
| SINGLETON ET AL.: "Dictionary of Microbiology and Molecular Biology", 1994, J. WILEY & SONS |
| T.E. GODFREY ET AL., J. MOLEC. DIAGNOSTICS, vol. 2, 2000, pages 84 - 91 |
| TANG S W ET AL: "MYC pathway is activated in clear cell renal cell carcinoma and essential for proliferation of clear cell renal cell carcinoma cells", CANCER LETTERS, NEW YORK, NY, US, vol. 273, no. 1, 8 January 2009 (2009-01-08), pages 35 - 43, XP025685873, ISSN: 0304-3835, [retrieved on 20080921], DOI: 10.1016/J.CANLET.2008.07.038 * |
| V. FORIA ET AL.: "RCC subtypes", J CLIN PATHOL, vol. 58, no. 1, 2005, pages 39 - 43 |
| WEIS ET AL., TRENDS IN GENETICS, vol. 8, 1992, pages 263 - 264 |
| Y. THYAVIHALLY ET AL., INT SEMIN SURG ONCOL, vol. 2, 2005, pages 18 |
| YANG ET AL., GENOME RES., vol. 11, 2001, pages 1888 - 1898 |
Also Published As
Similar Documents
| Publication | Publication Date | Title |
|---|---|---|
| US11776664B2 (en) | Method to use gene expression to determine likelihood of clinical outcome of renal cancer | |
| US20220396842A1 (en) | Method for using gene expression to determine prognosis of prostate cancer | |
| US10179936B2 (en) | Gene expression profile algorithm and test for likelihood of recurrence of colorectal cancer and response to chemotherapy | |
| US8632980B2 (en) | Gene expression markers for prediction of patient response to chemotherapy | |
| US20110123990A1 (en) | Methods To Predict Clinical Outcome Of Cancer | |
| AU2015227398B2 (en) | Method for using gene expression to determine prognosis of prostate cancer | |
| AU2019268079B2 (en) | Method to use gene expression to determine likelihood of clinical outcome of renal cancer |
Legal Events
| Date | Code | Title | Description |
|---|---|---|---|
| PUAI | Public reference made under article 153(3) epc to a published international application that has entered the european phase |
Free format text: ORIGINAL CODE: 0009012 |
|
| AC | Divisional application: reference to earlier application |
Ref document number: 2524055 Country of ref document: EP Kind code of ref document: P Ref document number: 3178944 Country of ref document: EP Kind code of ref document: P Ref document number: 3029155 Country of ref document: EP Kind code of ref document: P |
|
| AK | Designated contracting states |
Kind code of ref document: A1 Designated state(s): AL AT BE BG CH CY CZ DE DK EE ES FI FR GB GR HR HU IE IS IT LI LT LU LV MC MK MT NL NO PL PT RO RS SE SI SK SM TR |
|
| 17P | Request for examination filed |
Effective date: 20200403 |
|
| RBV | Designated contracting states (corrected) |
Designated state(s): AL AT BE BG CH CY CZ DE DK EE ES FI FR GB GR HR HU IE IS IT LI LT LU LV MC MK MT NL NO PL PT RO RS SE SI SK SM TR |
|
| 17Q | First examination report despatched |
Effective date: 20200727 |
|
| REG | Reference to a national code |
Ref country code: HK Ref legal event code: DE Ref document number: 40016195 Country of ref document: HK |
|
| STAA | Information on the status of an ep patent application or granted ep patent |
Free format text: STATUS: THE APPLICATION HAS BEEN WITHDRAWN |
|
| 18W | Application withdrawn |
Effective date: 20201204 |