EP3486836B1 - Procédé d'analyse d'image, appareil, programme et algorithme d'apprentissage profond appris - Google Patents
Procédé d'analyse d'image, appareil, programme et algorithme d'apprentissage profond appris Download PDFInfo
- Publication number
- EP3486836B1 EP3486836B1 EP18206451.9A EP18206451A EP3486836B1 EP 3486836 B1 EP3486836 B1 EP 3486836B1 EP 18206451 A EP18206451 A EP 18206451A EP 3486836 B1 EP3486836 B1 EP 3486836B1
- Authority
- EP
- European Patent Office
- Prior art keywords
- image
- analysis
- data
- region
- tissue
- Prior art date
- Legal status (The legal status is an assumption and is not a legal conclusion. Google has not performed a legal analysis and makes no representation as to the accuracy of the status listed.)
- Active
Links
- 238000013135 deep learning Methods 0.000 title claims description 99
- 238000003703 image analysis method Methods 0.000 title claims description 32
- 238000004458 analytical method Methods 0.000 claims description 181
- 238000012549 training Methods 0.000 claims description 165
- 238000000034 method Methods 0.000 claims description 138
- 210000001519 tissue Anatomy 0.000 claims description 126
- 238000010191 image analysis Methods 0.000 claims description 110
- 210000003855 cell nucleus Anatomy 0.000 claims description 104
- 238000013528 artificial neural network Methods 0.000 claims description 92
- 210000004027 cell Anatomy 0.000 claims description 50
- 239000003086 colorant Substances 0.000 claims description 41
- 238000003384 imaging method Methods 0.000 claims description 41
- 210000004940 nucleus Anatomy 0.000 claims description 22
- 238000010186 staining Methods 0.000 claims description 21
- 238000002073 fluorescence micrograph Methods 0.000 claims description 9
- WZUVPPKBWHMQCE-UHFFFAOYSA-N Haematoxylin Chemical compound C12=CC(O)=C(O)C=C2CC2(O)C1C1=CC=C(O)C(O)=C1OC2 WZUVPPKBWHMQCE-UHFFFAOYSA-N 0.000 claims description 8
- 238000012758 nuclear staining Methods 0.000 claims description 4
- 230000002093 peripheral effect Effects 0.000 claims description 3
- 238000012545 processing Methods 0.000 description 141
- 230000008569 process Effects 0.000 description 109
- 238000010586 diagram Methods 0.000 description 66
- 230000006870 function Effects 0.000 description 65
- 238000003745 diagnosis Methods 0.000 description 21
- 208000005718 Stomach Neoplasms Diseases 0.000 description 20
- 206010017758 gastric cancer Diseases 0.000 description 20
- 201000011549 stomach cancer Diseases 0.000 description 20
- 238000001514 detection method Methods 0.000 description 17
- 230000008878 coupling Effects 0.000 description 10
- 238000010168 coupling process Methods 0.000 description 10
- 238000005859 coupling reaction Methods 0.000 description 10
- 238000011478 gradient descent method Methods 0.000 description 10
- 206010028980 Neoplasm Diseases 0.000 description 8
- 238000004364 calculation method Methods 0.000 description 8
- 230000004913 activation Effects 0.000 description 6
- 238000013527 convolutional neural network Methods 0.000 description 6
- 230000001575 pathological effect Effects 0.000 description 6
- 201000011510 cancer Diseases 0.000 description 5
- 230000011218 segmentation Effects 0.000 description 5
- 230000002380 cytological effect Effects 0.000 description 3
- 230000002496 gastric effect Effects 0.000 description 3
- 239000011521 glass Substances 0.000 description 3
- 238000007490 hematoxylin and eosin (H&E) staining Methods 0.000 description 3
- 238000012333 histopathological diagnosis Methods 0.000 description 3
- 239000004973 liquid crystal related substance Substances 0.000 description 3
- 230000003287 optical effect Effects 0.000 description 3
- 230000008520 organization Effects 0.000 description 3
- 210000004881 tumor cell Anatomy 0.000 description 3
- 206010006187 Breast cancer Diseases 0.000 description 2
- 208000026310 Breast neoplasm Diseases 0.000 description 2
- LFQSCWFLJHTTHZ-UHFFFAOYSA-N Ethanol Chemical compound CCO LFQSCWFLJHTTHZ-UHFFFAOYSA-N 0.000 description 2
- WSFSSNUMVMOOMR-UHFFFAOYSA-N Formaldehyde Chemical compound O=C WSFSSNUMVMOOMR-UHFFFAOYSA-N 0.000 description 2
- 238000013459 approach Methods 0.000 description 2
- 239000000470 constituent Substances 0.000 description 2
- 210000002919 epithelial cell Anatomy 0.000 description 2
- 239000000284 extract Substances 0.000 description 2
- 230000007774 longterm Effects 0.000 description 2
- 238000010801 machine learning Methods 0.000 description 2
- 238000002360 preparation method Methods 0.000 description 2
- 238000007789 sealing Methods 0.000 description 2
- 238000001356 surgical procedure Methods 0.000 description 2
- FWBHETKCLVMNFS-UHFFFAOYSA-N 4',6-Diamino-2-phenylindol Chemical compound C1=CC(C(=N)N)=CC=C1C1=CC2=CC=C(C(N)=N)C=C2N1 FWBHETKCLVMNFS-UHFFFAOYSA-N 0.000 description 1
- 241001270131 Agaricus moelleri Species 0.000 description 1
- 206010003445 Ascites Diseases 0.000 description 1
- 102000008186 Collagen Human genes 0.000 description 1
- 108010035532 Collagen Proteins 0.000 description 1
- 206010009944 Colon cancer Diseases 0.000 description 1
- 102000004856 Lectins Human genes 0.000 description 1
- 108090001090 Lectins Proteins 0.000 description 1
- 208000007433 Lymphatic Metastasis Diseases 0.000 description 1
- 241000124008 Mammalia Species 0.000 description 1
- 208000035346 Margins of Excision Diseases 0.000 description 1
- 208000002151 Pleural effusion Diseases 0.000 description 1
- 208000006994 Precancerous Conditions Diseases 0.000 description 1
- 206010036790 Productive cough Diseases 0.000 description 1
- 238000001574 biopsy Methods 0.000 description 1
- 210000004369 blood Anatomy 0.000 description 1
- 239000008280 blood Substances 0.000 description 1
- 210000001185 bone marrow Anatomy 0.000 description 1
- 238000005119 centrifugation Methods 0.000 description 1
- 210000001175 cerebrospinal fluid Anatomy 0.000 description 1
- 229920001436 collagen Polymers 0.000 description 1
- 208000029742 colonic neoplasm Diseases 0.000 description 1
- 238000012790 confirmation Methods 0.000 description 1
- 230000007423 decrease Effects 0.000 description 1
- 230000008030 elimination Effects 0.000 description 1
- 238000003379 elimination reaction Methods 0.000 description 1
- 239000000835 fiber Substances 0.000 description 1
- 239000000834 fixative Substances 0.000 description 1
- 239000012530 fluid Substances 0.000 description 1
- 238000012744 immunostaining Methods 0.000 description 1
- 230000006872 improvement Effects 0.000 description 1
- 230000001678 irradiating effect Effects 0.000 description 1
- 239000002523 lectin Substances 0.000 description 1
- 238000012886 linear function Methods 0.000 description 1
- 230000003211 malignant effect Effects 0.000 description 1
- 210000004962 mammalian cell Anatomy 0.000 description 1
- 239000012188 paraffin wax Substances 0.000 description 1
- 230000007170 pathology Effects 0.000 description 1
- 238000007781 pre-processing Methods 0.000 description 1
- 238000004321 preservation Methods 0.000 description 1
- 210000003802 sputum Anatomy 0.000 description 1
- 208000024794 sputum Diseases 0.000 description 1
- 210000002784 stomach Anatomy 0.000 description 1
- 238000012706 support-vector machine Methods 0.000 description 1
- 210000002700 urine Anatomy 0.000 description 1
Images


Classifications
-
- G—PHYSICS
- G06—COMPUTING; CALCULATING OR COUNTING
- G06V—IMAGE OR VIDEO RECOGNITION OR UNDERSTANDING
- G06V20/00—Scenes; Scene-specific elements
- G06V20/60—Type of objects
- G06V20/69—Microscopic objects, e.g. biological cells or cellular parts
- G06V20/698—Matching; Classification
-
- G—PHYSICS
- G06—COMPUTING; CALCULATING OR COUNTING
- G06T—IMAGE DATA PROCESSING OR GENERATION, IN GENERAL
- G06T7/00—Image analysis
- G06T7/0002—Inspection of images, e.g. flaw detection
- G06T7/0012—Biomedical image inspection
- G06T7/0014—Biomedical image inspection using an image reference approach
-
- G—PHYSICS
- G06—COMPUTING; CALCULATING OR COUNTING
- G06T—IMAGE DATA PROCESSING OR GENERATION, IN GENERAL
- G06T7/00—Image analysis
- G06T7/70—Determining position or orientation of objects or cameras
- G06T7/73—Determining position or orientation of objects or cameras using feature-based methods
- G06T7/74—Determining position or orientation of objects or cameras using feature-based methods involving reference images or patches
-
- G—PHYSICS
- G06—COMPUTING; CALCULATING OR COUNTING
- G06T—IMAGE DATA PROCESSING OR GENERATION, IN GENERAL
- G06T7/00—Image analysis
- G06T7/90—Determination of colour characteristics
-
- G—PHYSICS
- G06—COMPUTING; CALCULATING OR COUNTING
- G06V—IMAGE OR VIDEO RECOGNITION OR UNDERSTANDING
- G06V10/00—Arrangements for image or video recognition or understanding
- G06V10/40—Extraction of image or video features
- G06V10/44—Local feature extraction by analysis of parts of the pattern, e.g. by detecting edges, contours, loops, corners, strokes or intersections; Connectivity analysis, e.g. of connected components
-
- G—PHYSICS
- G06—COMPUTING; CALCULATING OR COUNTING
- G06V—IMAGE OR VIDEO RECOGNITION OR UNDERSTANDING
- G06V10/00—Arrangements for image or video recognition or understanding
- G06V10/40—Extraction of image or video features
- G06V10/56—Extraction of image or video features relating to colour
-
- G—PHYSICS
- G06—COMPUTING; CALCULATING OR COUNTING
- G06T—IMAGE DATA PROCESSING OR GENERATION, IN GENERAL
- G06T2207/00—Indexing scheme for image analysis or image enhancement
- G06T2207/20—Special algorithmic details
- G06T2207/20084—Artificial neural networks [ANN]
-
- G—PHYSICS
- G06—COMPUTING; CALCULATING OR COUNTING
- G06T—IMAGE DATA PROCESSING OR GENERATION, IN GENERAL
- G06T2207/00—Indexing scheme for image analysis or image enhancement
- G06T2207/30—Subject of image; Context of image processing
- G06T2207/30004—Biomedical image processing
- G06T2207/30024—Cell structures in vitro; Tissue sections in vitro
Definitions
- the present invention relates to an image analysis method, apparatus, program, and learned deep learning algorithm. More specifically, the invention relates to an image analysis method including the generation of data indicating the region of a cell nucleus at an optional position of the image of the tissue or cell.
- Japanese Patent Application Publication No. 2010-203949 discloses an image diagnosis support apparatus that determines and classifies a tissue image in a pathological tissue image into four groups of normal, benign tumor, precancerous state, and cancer state.
- the image classifying means extracts the focus region from the image data, calculates a feature amount indicative of the feature of the focus region, and classifies the group based on the calculated feature amount.
- Feature amounts are the density of clusters per unit area in the cell nucleus, the density of cluster areas, the area of clusters, the thickness of clusters, and the length of clusters.
- the image determining means learns the relationship between the feature amount and the determination result and makes a determination based on the learned learning parameter. Learning executes machine learning using learning algorithms such as support vector machines.
- SC-CNN Spatially Constrained Convolutional Neural Network
- NEP Neighboring Ensemble Predictor
- a sliding window operation is applied to each image in order to represent image patches via high-level features obtained via the auto-encoder, which are then subsequently fed to a classifier which categorizes each image patch as nuclear or non-nuclear SADANANDAN SAJITH KECHERIL ET AL: "Automated Training of Deep Convolutional Neural Networks for Cell Segmentation ", discloses a system for tracking cells in bright filed images by using fluorescent images as ground truth data.
- Histopathological diagnosis is often performed as an intraoperative rapid diagnosis to determine the site of excision of tissue containing malignant tumor during surgery. Intraoperative rapid diagnosis is performed while the affected area of the patient is incised and the surgical operation is temporarily halted awaiting a determination of histopathological tissue diagnosis such as whether the tumor is malignant, whether there is tumor remains in the resection margin of the excised tissue, whether there is lymph node metastasis and the like. The result of intraoperative rapid diagnosis determines the subsequent direction of temporarily halted surgery of the patient.
- the histopathological diagnosis is performed by a physician, particularly a pathologist, by observing the tissue sample with a microscope or the like to diagnose the tissue sample, in order to be able to perform accurate definitive diagnosis by observing the tissue sample, the pathologist must repeatedly observe tissue samples of various cases under supervision of a highly skilled pathologist, such that the training of a pathologist takes an extraordinary amount of time.
- the pathology of the sample tissue is determined based on image analysis by machine learning.
- the ability of the person to greatly influence the performance of the image analysis in the method of creating the feature amount by human hand is a problem that the ability of the person to greatly influence the performance of the image analysis in the method of creating the feature amount by human hand.
- one observation target is the state of the cell nucleus, and malignant tumors and benign tumors are differentiated from the size and form of each cell nucleus, the arrangement state of a plurality of cell nuclei and the like. Therefore, it is very important that the cell nucleus can be accurately extracted in pathological tissue diagnosis as the basis of histological diagnosis and cell diagnosis.
- the present invention provides an image analysis method, in accordance with claim 1, and an image analysis apparatus, in accordance with claim 13.
- the present invention relates to an image analysis method for analyzing an image of a tissue or a cell, and an image analysis method using a deep learning algorithm of a neural network structure.
- an image of a tissue or a cell is an image obtained from a tissue sample or a sample containing a cell.
- Samples of tissue samples or samples containing cells are taken from individuals.
- the individual is not particularly limited, but is preferably a mammal, more preferably a human. Whether an individual is alive or deceased when a sample is taken from the individual is irrelevant.
- the tissue is not limited as long as it is present in the individual. Examples of tissues collected from an individual include surgically excised tissue, biopsy tissue and the like. Samples containing cells are not limited insofar as they are taken from individuals. For example, sputum, pleural effusion, ascites, urine, cerebrospinal fluid, bone marrow, blood, cystic fluid and the like can be mentioned.
- the sample is intended as a preparation to prepare a sample including the tissue sample or sample including cells to be process for observation by microscope and the like.
- the sample can be prepared according to a known method. For example, in the case of a tissue sample, after tissue is collected from an individual, the tissue is fixed with a prescribed fixing solution (formalin fixative or the like), the fixed tissue is embedded in paraffin, and the paraffin-embedded tissue is sliced. The sliced section is placed on a slide glass. The sample is completed by subjecting the slide glass with slice to staining for observation with an optical microscope, that is, for bright field observation, and performing prescribed sealing treatment.
- a typical example of a tissue sample is a tissue diagnostic sample (pathological specimen), and the staining is hematoxylin-eosin (HE) staining.
- HE hematoxylin-eosin
- the cells in the sample are attached to a slide glass by centrifugation, smearing or the like, fixed with a predetermined fixing solution (ethanol or the like), stained for bright field observation, and a predetermined sealing process is carried out to complete the sample.
- a predetermined fixing solution ethanol or the like
- a typical example of a sample containing cells is a sample for cytological diagnosis (cytological specimen), and staining is Papanicolaou staining.
- the cell diagnostic sample also includes an imprinted sample of the tissue collected for the tissue sample.
- Hematoxylin is widely used as a nuclear stain in tissue cell staining (for example, immunostaining, lectin staining, sugar staining, fat staining, collagen fiber staining and the like). Therefore, the invention can be applied to all samples using hematoxylin for nuclear staining.
- first training image is an image including tissues or cells contained in a sample of a tissue specimen taken from an individual or a sample of a specimen containing cells taken from an individual.
- This image is obtained from samples stained so that the tissue structure or cell structure can be recognized by microscopic observation.
- the stain is not limited insofar as the tissue structure or the cell structure can be recognized, a stain for bright field observation is preferable.
- the above-described bright field observation staining is not limited insofar as at least the cell nucleus and a part other than the cell nucleus can be stained so as to be distinguishable by hue.
- HE staining can be mentioned.
- Papanicolaou stain can be mentioned.
- the next training image indicates which part of the first training image is the cell nucleus region, that is, the image indicates a region in the first training image that correctly identifies the "cell nucleus region".
- This image is obtained by selectively irradiating a cell nucleus of a sample that is the same sample from which the first training image was acquired or a sample corresponding to the sample from which the first training image was acquired (for example, a consecutively sliced sample), and the image is captured after performing fluorescent nuclear staining.
- the fluorescent nucleus stains includes, but is not limited to, 4 ', 6-diamidino-2-phenylindole (DAPI) stain.
- training data generated from each of the above-described first training image and second training image are used in the deep learning method. Since the first training image is imaged as a color image, for example, under observation of the bright field microscope, the HE-stained sample includes a plurality of hues in the first training image.
- the first training image (bright field image) 70 can be acquired in advance using an image acquiring device such as a known optical microscope, fluorescent microscope, or virtual slide scanner, for example.
- an image acquiring device such as a known optical microscope, fluorescent microscope, or virtual slide scanner, for example.
- color imaging acquired from the image acquiring device is 24-bit color space with RGB.
- RGB Red, green and blue
- the first training image (bright field image) 70 may be an image including one or more primary colors.
- the hue is illustratively defined by a combination of the three primary colors of light or a combination of the three primary colors of the color.
- the first training data are generated from the first training image 70 by separating the hues appearing in the first training image 70 into individual primary colors, generating data for each primary color, such that the first training data are data represented by a code corresponding to the density.
- single color images 72R, 72G, and 72B separated for each primary color of red (R), green (G), and blue (B) which are the three primary colors of light.
- the entire image is encoded for each image of R, G, and B by the encoding diagrams 72r, 72g, and 72b.
- the color density also may be encoded with numerical values indicating 256 gradations of each color.
- the color density also may be pre-processed for numerical values indicating 256 gradations of each color, and the color density of each pixel may be encoded with numbers indicated by eight levels from 0 to 7, for example.
- the color density encoding diagrams 72r, 72g, and 72b in the single color image of each color of R, G, and B shown in the example of FIG. 1 represent the color density in each pixel at eight gradations of values from 0 to 7 (three tones expressing tone). Symbols indicating color densities are also referred to as color density values in this specification.
- the second training image 71 is an image obtained by capturing fluorescent nuclei-stained samples by fluorescence observation under a fluorescence microscope and capturing images of gray scales of two or more gradations or color images.
- the second training image 71 may be acquired in advance, for example, using a known bright field image acquisition device such as a fluorescence microscope or a virtual slide scanner.
- the second training data are a true value image 73 showing the region of the cell nucleus of the learning target tissue, which is generated from the second training image 71 obtained by imaging the learning target tissue.
- the first training image 70 and the second training image 71 are images obtained by imaging the same region or corresponding region of the tissue on the sample.
- the second training image 71 of color or grayscale having two or more gradations is converted into data as a monochrome fluorescence image by a binarization process, and then learned as the correct interpretation by the neural network 50 and resulting in a true image 73.
- the true image 73 are data indicating a region of the cell nucleus, that is, a correct interpretation.
- the region of the cell nucleus and the other regions are distinguished, and the region of the cell nucleus is discriminated by binarizing the second training image 71. Whether the region is a cell nucleus region or a region other than the cell nucleus is determined, for example, by comparing the color density of each pixel in the image with a predetermined condition (for example, a color density threshold value).
- the color density encoded diagrams 72r, 72g, and 72b (also referred to as first training data) and the true image 73 (also referred to as second training data) are used as the training data 74
- the neural network 50 learns the training data 74 with the color density encoded diagrams 72r, 72g, and 72b as the input layer 50a and the true image 73 as the output layer 50b. That is, a pair of the color density encoded diagrams 72r, 72g, and 72b for each color of R, G, and B and the true value image 73 are used as the training data 74 for learning of the neural network 50.
- FIG. 2 shows an example of pixels configuring the training data 74.
- Three values 74a shown in the upper part of FIG. 2 are density values of R, G, B in each pixel. Illustratively, the three values are stored in the order red (R), green (G) and blue (B).
- Each pixel of the color density encoded diagrams 72r, 72g, and 72b is shown in eight levels of color density values from value 0 to value 7. This is a process of converting the brightness of each color image 72R, 72G, 72B represented in 256 steps to the eight-step color density value, respectively, as an example of image preprocessing.
- the color density value for example, the lowest brightness (a gradation group having a low brightness value when represented by 256 RGB colors) is set as the color density value 0, and gradually higher values are assigned as the degree of brightness increases, with the highest brightness (gradation group having high brightness value when expressed in RGB color of 256 gradations) is set as color density value 7.
- the value 74b shown in the lower part of FIG. 2 is binary data of the true image 73.
- the binary data 74b of the true image 73 is also called a label value.
- the label value 1 indicates the region of the cell nucleus
- the label value 0 indicates the other region. That is, in the true value image 73 shown in FIG. 1 , the position of the label value changing from 1 to 0 or the position of the pixel changing from 0 to 1 corresponds to the boundary between the region of the cell nucleus and the other region.
- the training data 75 shown in FIG. 2 are data obtained by extracting an area of a predetermined number of pixels (hereinafter referred to as "window size") of the training data 74 shown in FIG. 2 .
- window size a predetermined number of pixels
- the window size of the tumor site training data 75 is simplified to 3 ⁇ 3 pixels for the sake of convenience of explanation, the actual preferable window size is illustratively about 113 ⁇ 113 pixels, and among them, a size of a 3 ⁇ 3 nuclei of normal gastric epithelial cells is preferable from the viewpoint of learning efficiency.
- a window W1 of 3 ⁇ 3 pixels is set and the window W1 is moved relative to the training data 74.
- the center of the window W1 is located at any pixel of the training data 74, for example, the training data 74 in the window W1 indicated by the black frame are extracted as the training data 75 of the window size.
- the extracted window size training data 75 are used for learning of the neural network 50 shown in FIG. 1 .
- the number of nodes of the input layer 50a of the neural network 50 is the number of pixels of the training data 75 of the input window size and the number of the primary colors included in the image (for example, three nodes: R, G, and B in the case of the three primary colors of light).
- the color density value data 76 of each pixel of the window size training data 75 are set as the input layer 50a of the neural network, and the binarized data 77 of the pixel located at the center among the binary data 74b corresponding to the true value image 73 of each pixel of the training data 75 is set as the output layer 50b of the neural network 50 and are learned by the neural network 50.
- the color density value data 76 of each pixel are aggregate data of the color density values 74a of each color of R, G, B of each pixel of the training data 75.
- the training data 75 of the window size input to the neural network 50 can be automatically created by the computer without being created by the user. Efficient deep layer learning of the neural network 50 is promoted in this way.
- the center of the window W1 is located at the upper left corner of the training data 74.
- the training data 75 of the window size is extracted of the window W1, and the position of the window W1 is moved each time learning of the neural network 50 is performed. More specifically, the window W1 is moved in units of one pixel so that the center of the window W1 scans all the pixels of the training data 74, for example. In this way the training data 75 of the window size extracted from all the pixels of the training data 74 are used for learning of the neural network 50. Therefore, the degree of learning of the neural network 50 can be improved, and a deep learning algorithm having the structure of the neural network 60 shown in FIG. 3 is obtained as a result of deep learning.
- analysis data 80 are generated from an analysis target image (bright field image) 78 obtained by imaging a sample including a tissue or cells to be analyzed.
- the sample preferably is stained the same as the first training image.
- the analysis target image 78 also can be acquired as a color image, for example, using a known microscope, a virtual slide scanner or the like, for example.
- the analysis target image (bright field image) 78 may be an image including one or more primary colors.
- color analysis target image 78 is encoded with color density values of each color of R, G, and B for each pixel, it is possible to express the entire image as an encoded diagram of color density values in each pixel of each R, G, B (analysis color density encoded diagrams 79r, 79g, 79b).
- Color density encoded diagrams 79r, 79g, and 79b indicating the codes of the color densities in the single color image of each color of R, G, and B shown in the example of FIG. 3 are obtained by substituting the three primary colors of images 79R, 79G, 79B with color density values represented by codes displayed in eight levels from 0 to 7.
- the analysis data 80 are data obtained by extracting regions (that is, window sizes) having a predetermined number of pixels of the color density encoded diagrams 79r, 79g, and 79b, and the data of the tissue or cell included in the analysis target image 78 include color density values.
- the analysis data 80 has a simplified window size of 3 ⁇ 3 pixels for convenience of explanation similar to the training data 75, a preferable window size is, for example, about 113 ⁇ 113 pixels, and a size of a 3 ⁇ 3 nucleus of normal gastric epithelial cells is preferable in view of discrimination accuracy, for example, a field of view of 40 times which is about 113 ⁇ 113 pixels.
- a window W2 of 3 ⁇ 3 pixels is set, and the window W2 is moved relative to the color density encoded diagrams 79r, 79g, and 79b.
- the center of the window W2 is located at any pixel of the color density encoded diagrams 79r, 79g, 79b, and the color density encoded diagrams 79r, 79g, 79b are displayed in a window W2 indicated by a black frame of 3 ⁇ 3 pixels to obtain window size analysis data 80.
- the analysis data 80 are generated for each area including peripheral pixels around the predetermined pixel from the color density encoded diagrams 79r, 79g, and 79b.
- the predetermined pixel means the pixel of the color density encoded diagrams 79r, 79g, and 79b located at the center of the window W2, and the peripheral pixels are pixels within the window size range centered on the predetermined pixel of color density encoded diagrams 79r, 79g, 79b.
- the color density values also are stored in the order of red (R), green (G) and blue (B) for each pixel similarly to the training data 74.
- analysis data 80 are processed using a deep learning algorithm 60 having a neural network learned using the window size training data 75 shown in FIG. 1 .
- Data 83 indicating whether a region is a cell nucleus region in the analysis target tissue or cell are generated by processing the analysis data 80.
- the analysis data 80 cut out from the color density encoding diagrams 79r, 79g, and 79b of the respective colors R, G, and B are input to the neural network 60 configuring the deep learning algorithm.
- the number of nodes of the input layer 60a of the neural network 60 corresponds to the product of the number of input pixels and the number of primary colors included in the image.
- an estimated value 82 (binary) of the pixel located at the center of the analysis data 80 is output from the output layer 60b. For example, when the estimated value is 1, the value indicates the region of the cell nucleus, and when the estimated value is 0, it indicates the other region.
- the estimated value 82 output from the output layer 60b of the neural network 60 is data generated for each pixel of the analysis target image and is data indicating whether it is a cell nucleus region in the analysis target image.
- the estimated value 82 differentiates between the region of the cell nucleus and the other region by, for example, the value 1 and the value 0.
- the estimate value 82 is also called a label value and is also called a class in the description of the neural network in the following description.
- the neural network 60 generates a label indicating whether the region is a cell nucleus region relative to the pixel located at the center of the analysis data 80 among the input analysis data 80. In other words, the neural network 60 classifies the analysis data 80 into classes indicating the regions of cell nuclei contained in the analysis target image.
- the color density value data 81 of each pixel is aggregate data of the color density values of each color of R, G, B of each pixel of the analysis data 80.
- the analysis data 80 are extracted by window size while moving the window W2 by one pixel unit so that the center of the window W2 scans all pixels of the color density encoded diagrams 79r, 79g, and 79b of the respective colors R, G, B.
- the extracted analysis data 80 are input to the neural network 60.
- binary data 83 are obtained as data indicating whether or not the region is a cell nucleus region in the analysis target image.
- the cell nucleus region detection process also is performed on the binary data 83 to obtain a cell nucleus region weighted image 84 indicating a region of the cell nucleus.
- the tumor cell nucleus region detection process is, for example, a process of detecting a pixel whose estimate value 82 is a value 1, and is a process of actually identifying the region of the cell nucleus.
- the cell nucleus region weighted image 84 is an image in which the region of the cell nucleus obtained by the image analysis process is displayed superimposed on the analysis target image 78.
- a process of displaying the cell nucleus and the other regions on the display device so as to be distinguishable also may be performed. For example, processing is performed such as filling the region of the cell nucleus with color, drawing a line between the region of the tumor cell nucleus and the other region and the like so as to be distinguishably displayed on the display device.
- the image analysis system includes a deep learning apparatus 100A and an image analysis apparatus 200A.
- the vendor side apparatus 100 operates as the deep layer learning apparatus 100A and the user side apparatus 200 operates as the image analysis apparatus 200A.
- the deep learning apparatus 100A learns using the training data in the neural network 50 and provides the user with a deep learning algorithm 60 that is trained with the training data.
- the deep learning algorithm configured by the learned neural network 60 is provided from the deep learning apparatus 100A to the image analysis apparatus 200A through a recording medium 98 or a network 99.
- the image analysis apparatus 200A analyzes an analysis target image using a deep learning algorithm configured by the learned neural network 60.
- the deep layer learning apparatus 100A is configured by, for example, a general-purpose computer, and performs a deep learning process based on a flowchart to be described later.
- the image analysis apparatus 200A is configured by, for example, a general-purpose computer, and performs image analysis processing based on a flowchart to be described later.
- the recording medium 98 is a computer readable non-transitory tangible recording medium such as a DVD-ROM or a USB memory.
- the deep learning apparatus 100A is connected to an imaging device 300.
- the imaging device 300 includes an imaging element 301 and a fluorescence microscope 302, and captures bright field images and fluorescence images of a learning sample 308 set on a stage 309.
- the learning sample 308 is subjected to the staining described above.
- the deep learning apparatus 100A acquires the first training image 70 and the second training image 71 captured by the imaging device 300.
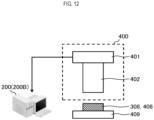
- the image analysis apparatus 200A is connected to the imaging device 400.
- the imaging device 400 includes an imaging element 401 and a fluorescence microscope 402, and captures a bright field image of an analysis target sample 408 set on the stage 409.
- the analysis target sample 408 is stained in advance as described above.
- the image analysis apparatus 200A acquires the analysis target image 78 captured by the imaging device 400.
- a known fluorescence microscope, a virtual slide scanner or the like having a function of imaging a sample can be used as the imaging devices 300 and 400.
- the imaging device 400 also may be an optical microscope insofar as it has a function of imaging a sample.
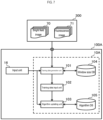
- the vendor side apparatus 100 (100A, 100B) includes processing units 10 (10A, 10B), an input unit 16, and an output unit 17.
- the processing unit 10 includes a CPU (Central Processing Unit) 11 that performs data processing to be described later, a memory 12 used as a work area for data processing, a recording unit 13 that records programs and processing data described later, a bus 14 for transmitting data, an interface unit 15 for inputting and outputting data with an external device, and a GPU (Graphics Processing Unit) 19.
- the input unit 16 and the output unit 17 are connected to the processing unit 10.
- the input unit 16 is an input device such as a keyboard or a mouse
- the output unit 17 is a display device such as a liquid crystal display.
- the GPU 19 functions as an accelerator for assisting arithmetic processing (for example, parallel arithmetic processing) performed by the CPU 11. That is, the process performed by the CPU 11 in the following description means that the process includes a process performed by the CPU 11 using the GPU 19 as an accelerator.
- the processing unit 10 pre-records the program and the neural network 50 of the present invention in the recording unit 13 before learning, for example, in an executable form.
- the execution form is, for example, a form generated by being converted from a programming language by a compiler.
- the processing unit 10 performs processing using the program recorded in the recording unit 13 and the neural network 50 before learning.
- processing performed by the processing unit 10 means processing performed by the CPU 11 based on the program stored in the recording unit 13 or the memory 12 and the neural network 50.
- the CPU 11 temporarily stores necessary data (such as intermediate data being processed) with the memory 12 as a work area, and appropriately records data for long term storage, such as calculation results, in the recording unit 13.
- the user side apparatus 200 (200A, 200B, 200C) includes a processing unit 20 (20A, 20B, 20C), an input unit 26, and an output unit 27.
- the processing unit 20 includes a CPU (Central Processing Unit) 21 for performing data processing to be described later, a memory 22 used as a work area for data processing, a recording unit 23 for recording programs and processing data described later, a bus 24 for transmitting data, an interface section 25 for inputting and outputting data with an external device, and a GPU (Graphics Processing Unit) 29.
- the input unit 26 and the output unit 27 are connected to the processing unit 20.
- the input unit 26 is an input device such as a keyboard or a mouse
- the output unit 27 is a display device such as a liquid crystal display.
- the GPU 29 functions as an accelerator for assisting arithmetic processing (for example, parallel arithmetic processing) performed by the CPU 21. That is, the process performed by the CPU 21 in the following description means that the process includes a process performed by the CPU 21 using the GPU 29 as an accelerator.
- the processing unit 20 records in advance the program according to the present invention and the learned neural network structure deep layer learning algorithm 60, for example, in an executable format in the recording unit 23.
- the execution form is, for example, a form generated by being converted from a programming language by a compiler.
- the processing unit 20 performs processing using the program recorded in the recording unit 23 and the deep learning algorithm 60.
- the processing performed by the processing unit 20 means the processing actually performed by the processing unit 20 based on the program stored in the recording unit 23 or the memory 22 and the deep learning algorithm 60.
- the CPU 21 temporarily stores necessary data (such as intermediate data being processed) with the memory 22 as a work area, and appropriately records data for long term storage, such as calculation results, in the recording unit 23.
- the processing unit 10A of the deep learning apparatus 100A includes a training data generating unit 101, a training data input unit 102, and an algorithm updating unit 103. These functional blocks are realized by installing a program that causes a computer to execute a deep layer learning process in the recording unit 13 or the memory 12 of the processing unit 10A and executing this program by the CPU 11.
- the window size database 104 and the algorithm database 105 are recorded in the recording unit 13 or the memory 12 of the processing unit 10A.
- the first training image 70 and the second training image 71 of the sample for learning are captured in advance by the imaging device 300 and stored in advance in the recording unit 13 or the memory 12 of the processing unit 10A.
- the neural network 50 is stored in advance in the algorithm database 105 in association with, for example, the type (for example, organization name) of the tissue sample from which the analysis target sample is derived or the type of sample including cells.
- the processing unit 10A of the deep learning apparatus 100A performs the process shown in FIG. 8 .
- the processes of steps S11 to S13, S18 and S19 are performed by the training data generating unit 101.
- the process of step S14 is performed by the training data input unit 102.
- the processes of steps S15 to S17 are performed by the algorithm updating unit 103.
- steps S11 to S 19 described below a deep learning process for a pair of a first training image 70 (bright field images) and a second training image (second training image 71) will be described.
- step S11 the processing unit 10A generates color density encoded diagrams 72r, 72g, and 72b for R, G, B colors from the input first training image 70.
- the color density encoded diagrams 72r, 72g, and 72b are created by stepwise expression of the color density values of the respective colors of R, G, and B of each pixel of the first training image 70.
- color density encoding diagrams 72r, 72g, and 72b are created for each R, G, B gradation image with the color density value set to 8 levels from 0 to 7. Assignment of a color density value is carried out, for example, by setting the lowest brightness as the color density value 0, gradually assigning a higher value as the degree of brightness increases, and setting the highest brightness as the color density value 7.
- step S12 the processing unit 10A binarizes the gradation of each pixel of the input second training image 71 to generate a true value image 73.
- the true value image 73 (binarized image 73) is used to generate training data to cause the neural network 50 to learn a correct interpretation.
- the binarization process is performed, for example, by comparing the gradation of each pixel in the image with a predetermined threshold value.
- the processing unit 10A receives input of the type of tissue for learning from the operator on the side of the deep learning apparatus 100A via the input unit 16.
- the processing unit 10A sets the window size by referring to the window size database 104 based on the type of the input tissue and refers to the algorithm database 105 to set the neural network 50 used for learning.
- the window size is, for example, 113 ⁇ 113 pixels.
- This pixel size is a size in an image captured at, for example, 40 times magnification. Illustratively, it is a size that supports that the entire shape of the cell nucleus region of at least one cell out of two to nine cells is included in the window.
- the window size is a unit of training data to be input to the neural network 50 at the time of one input, and the product of the number of pixels of the tumor site training data 75 of the window size and the number of the primary colors included in the image corresponds to the number of nodes of the input layer 50a.
- the window size is associated with the type of the tissue sample or the type of the sample including cells and recorded in advance in the window size database 104.
- step S14 the processing unit 10A generates the window size training data 75 from the color density encoded diagrams 72r, 72g, and 72b and the true image 73.
- the training data 75 of the window size is created by the window W 1 from the training data 74 of the combined color density encoded diagrams 72r, 72g, and 72b and the true image 73.
- step S15 shown in FIG. 8 the processing unit 10A learns the neural network 50 using the window size training data 75.
- the learning result of the neural network 50 is accumulated each time the neural network 50 learns using the window size training data 75.
- step S16 the processing unit 10A determines whether learning results for a predetermined number of trials are accumulated.
- the processing unit 10A performs the processing of step S17 when the learning results are accumulated for a predetermined number of trials, and the processing unit 10A performs the processing of step S18 when the learning results are not accumulated for a predetermined number of trials.
- step S18 the processing unit 10A determines whether the specified number of pixels in the input image have been processed.
- the input image is the training data 74; when a series of processes from step S14 to step S17 has been performed for the specified number of pixels in the training data 74, the deep learning process is terminated.
- Learning by the neural network does not necessarily have to be performed for all pixels in the input image, and the processing unit 10A can perform learning by processing a part of pixels in the input image, that is, a prescribed number of pixels.
- the prescribed number of pixels also may be all pixels in the input image.
- the degree of learning of the neural network 50 is improved by repeating the deep learning processes of steps S11 to S19 for a pair of input image relative to a plurality of pairs of different input images. In this way a deep learning algorithm 60 of the neural network structure shown in FIG. 3 is obtained.
- the number of nodes of the input layer 50a corresponds to the product of the number of pixels of the input image, that is, the number of pixels of the window W1 shown in FIG. 2 and the number of primary colors included in each pixel. Since the pixel data (color density values) of the image can be input to the input layer 50a, the user can input the input image to the input layer 50a without separately calculating the feature amount from the input image.
- Equation (1) Each input is multiplied by a different weight.
- b is a value called bias.
- the output (z) of the node is an output of a predetermined function f relative to the total input (u) represented by (Equation 1), and is expressed by the following (Equation 2).
- the function f is called an activation function.
- Function 2 z f u
- FIG. 9C is a schematic diagram showing the operation between the nodes.
- the nodes that output the result (z) represented by (Equation 2) are arranged in a layered manner relative to the total input (u) represented by (Equation 1).
- the output of the node of the previous layer becomes the input of the node of the next layer.
- the output of the node 89a on the layer on the left side in the figure becomes the input to the node 89b on the layer on the right side in the figure.
- Each node 89b of the right side layer receives an output from a node 89a on the left side layer, respectively.
- a rectified linear unit function is used as the activation function.
- y (x: w) be the function expressed using the neural network
- the function y (x: w) changes as the parameter w of the neural network changes. Adjusting the function y (x: w) so that the neural network selects a more suitable parameter w for the input x is referred to as learning of the neural network.
- learning of the neural network e.g., multiple sets of inputs and outputs of functions expressed using a neural network are given. Assuming that the desired output for an input x is d, the input/output set is ⁇ (x 1 , d 1 ), (x 2 , d 2 ), ..., (x n , d n ) ⁇ .
- the set of each set represented by (x, d) is referred to as training data. Specifically, the set of a set of a color density values for each pixel and a label for a true value image in a single color image of each color of R, G, B shown in FIG. 2 is the training data shown in
- Learning by a neural network means that when input xn is given to any input/output pair (xn, dn), weight w is adjusted so that the output y (xn: w) of the neural network is as close as possible to the output dn.
- An error function is a measure for measuring the proximity between a function expressed using a neural network and training data. Function 8 y x n : w ⁇ d n
- the error function is also referred to as a loss function.
- Equation 7 is a softmax function.
- Each class is expressed as C 1 , ..., C K , and the output y of the node k of the output layer L K (that is, u k (L) ) indicates the probability that given input x belongs to class C K .
- the input x is classified into a class having the maximum probability represented by Equation 8. Function 11 p C k
- the function expressed by the neural network is regarded as a model of the posterior probability of each class, and the likelihood of the weight w relative to the training data under such a probability model is evaluated and a weight w that maximizes likelihood is selected.
- the target output d n by the softmax function of (Equation 7) is set to 1 only when the output is a correct class, and 0 if the output is otherwise.
- the posterior distribution is represented as follows (Equation 9). Function 12 p d
- the Learning means minimizing the error function E(w) calculated based on the training data for the parameter w of the neural network.
- the error function E(w) is expressed by (Equation 6).
- Minimizing the error function E(w) for the parameter w has the same meaning as finding the local minima of the function E(w).
- the parameter w is the weight of the coupling between the nodes.
- the minimum point of the weight w is obtained by iterative calculation that iteratively updates the parameter w using an arbitrary initial value as a starting point.
- An example of such a calculation is the gradient descent method.
- Equation 11 a vector expressed by the following Equation 11 is used.
- the symbol ⁇ is a constant that determines the magnitude of the update amount of the parameter w, and is referred to as a learning coefficient.
- the gradient descent method performed for only some of the training data is referred to as the stochastic gradient descent method.
- a stochastic gradient descent method is used in the image analysis method according to the embodiment.
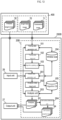
- the processing unit 20A of the image analysis apparatus 200A includes an analysis data generation unit 201, an analysis data input unit 202, an analysis unit 203, and a tumor cell nucleus region detection unit 204.
- These functional blocks are realized by installing a program according to the present invention for causing a computer to execute an image analysis process in the recording unit 23 or the memory 22 of the processing unit 20A and executing this program by the CPU 21.
- the window size database 104 and the algorithm database 105 are provided from the deep learning apparatus 100A through the recording medium 98 or the network 99, and recorded in the recording unit 23 or the memory 22 of the processing unit 20A.
- the analysis target image 78 of the analysis target tissue is captured in advance by the imaging device 400, and recorded in the recording unit 23 or the memory 22 of the processing unit 20A in advance.
- the deep learning algorithm 60 including the learned coupling weight w is stored in the algorithm database 105 in association with the type of tissue sample (for example, tissue name) from which the sample of the analysis target tissue is derived or the type of sample including cells, and functions as a program module which is a part of a program that causes a computer to execute an image analysis process. That is, the deep learning algorithm 60 is used in a computer having a CPU and a memory, and causes the computer to function to execute computation or processing of specific information corresponding to the purpose of use, such as outputting data indicating whether the region is the cell nucleus in the analysis target tissue.
- the CPU 21 of the processing unit 20A performs the calculation of the neural network 60 based on the learned coupling weight w in accordance with the algorithm prescribed in the deep learning algorithm 60 recorded in the recording unit 23 or the memory 22.
- the CPU 21 of the processing unit 20A performs an operation on the captured analysis target image 78 of the analysis target tissue which is input to the input layer 60a and output from the output layer 60b binary image 83 of the data indicating whether the region is a cell nucleus in the analysis target tissue.
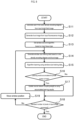
- the processing unit 20A of the image analysis apparatus 200A performs the processes shown in FIG. 11 .
- the processes of steps S21 and S22 are performed by the analysis data generation unit 201.
- the processes of steps S23, S24, S26, and S27 are performed by the analysis data input unit 202.
- the processes of steps S25 and S28 are performed by the analysis unit 203.
- the process of step S29 is performed by the cell nucleus region detection unit 204.
- step S21 the processing unit 20A generates color density encoded diagrams 79r, 79g, and 79b of R, G, and B colors from the input analysis target image 78.
- the generation method of the color density encoded diagrams 79r, 79g, and 79b is the same as the generation method of step S11 at the time of the deep learning process shown in FIG. 8 .
- the processing unit 20A accepts the input of the tissue type from the user on the image analysis apparatus 200A side as the analysis condition through the input unit 26.
- the processing unit 20A refers to the window size database 104 and the algorithm database 105 on the basis of the entered tissue type to set the window size used for analysis, and acquires the deep learning algorithm 60 used for analysis.
- the window size is a unit of analysis data to be input to the neural network 60 at the time of one input, and the product of the number of pixels of the window size analysis data 80 and the number of primary colors included in the image corresponds to the number of nodes of input layer 60a.
- the window size is associated with the tissue type, and stored in the window size database 104 in advance.
- the window size is, for example, 3x3 pixels as shown in the window W2 of FIG. 3 .
- the deep learning algorithm 60 is also recorded in advance in the algorithm database 105 shown in FIG. 10 in association with the type of the tissue sample or the type of the sample including cells.
- step S23 shown in FIG. 11 the processing unit 20A generates the window size analysis data 80 from the color density encoded diagrams 79r, 79g, and 79b.
- step S24 the processing unit 20A inputs the analysis data 80 shown in FIG. 3 to the deep learning algorithm 60.
- the initial position of the window is, for example, a position at the center of 3 ⁇ 3 pixels in the window corresponding to the upper left corner of the analysis target image, as in step S15 in the deep learning process.
- the processing unit 20A inputs the data 81 of a total of 27 color density values of 3 ⁇ 3 pixels ⁇ 3 primary colors included in the window size analysis data 80 to the input layer 60a
- the deep learning algorithm 60 outputs determination result 82 to the output layer 60b.
- step S25 shown in FIG. 11 the processing unit 20A records the determination result 82 output to the output layer 60b shown in FIG. 3 .
- the determination result 82 is an estimated value (binary) of pixels located at the center of the color density encoded diagrams 79r, 79g, and 79b, which are analysis targets. For example, when the estimated value is 1, the value indicates the region of the cell nucleus, and when the estimated value is 0, it indicates the other region.
- step S26 shown in FIG. 11 the processing unit 20A determines whether all the pixels in the input image have been processed.
- the input image is the color density encoded diagrams 79r, 79g, and 79b shown in FIG. 3 , and the process of step S28 is performed for all the pixels in the color density encoded diagrams 79r, 79g, and 79b when the series of processes from step S23 to step S25 shown in FIG. 11 have been performed.
- step S27 the processing unit 20A moves the center position of the window W2 by one pixel unit within the color density encoded diagrams 79r, 79g, and 79b shown in FIG. 3 similarly to step S19 in the deep learning process. Thereafter, the processing unit 20A performs a series of processes from step S23 to step S25 at the position of the new window W2 after movement. In step S25, the processing unit 20A records the determination result 82 corresponding to the new window position after the movement. A binary image 83 of the analysis result is obtained by recording the discrimination result 82 for each window size on all the pixels in the analysis target image.
- the image size of the binary image 83 as the analysis result is the same as the image size of the analysis target image.
- the value 1 and the value 0 of the estimate value may be numerical data attached to each pixel, and in place of the estimate value 1 and 0, for example, the value 1 and the value 0 may be displayed in a display color associated with each of them.
- step S28 shown in FIG. 11 the processing unit 20A outputs the binary image 83 of the analysis result to the output unit 27.
- step S29 following step S28 the processing unit 20A also performs a cell nucleus region detection process on the cell nucleus region of the binary image 83 of the analysis result.
- the region of the cell nucleus and the other regions are distinguished and represented by binary values. Therefore, in the binary image 83, it is possible to discriminate the region of the cell nucleus by detecting the position of the pixel whose estimate value of the pixel changes from 1 to 0 or the pixel changing from 0 to 1.
- the processing unit 20A may create a cell nucleus region weighted image 84 by superimposing the region of the obtained cell nucleus on the analysis target image 78.
- the processing unit 20A outputs the created cell nucleus region weighted image 84 to the output unit 27, and ends the image analysis process.
- the user of the image analysis apparatus 200A can acquire the binary image 83 as the analysis result by inputting the analysis target image 78 of the analysis target tissue to the image analysis apparatus 200A.
- the binary image 83 represents the region of the cell nucleus and other regions in the analysis target sample, and the user can discriminate the region of the cell nucleus in the analysis target sample.
- the user of the image analysis apparatus 200A also can acquire the cell nucleus region weighted image 84 as the analysis result.
- the cell nucleus region weighted image 84 is generated, for example, by filling the region of the cell nucleus with a color in the analysis target image 78.
- the cell nucleus region weighted image 84 is generated by overlapping a boundary line between a region of cell nucleus and another region. In this way the user can grasp the region of the cell nucleus at a glance in the analysis target tissue.
- Showing the region of the cell nucleus in the analysis target sample helps a person not familiar with the sample to understand the state of the cell nucleus.
- the image analysis system according to the second embodiment includes a user side apparatus 200, and the user side apparatus 200 operates as an integrated image analysis apparatus 200B.
- the image analysis apparatus 200B is configured by, for example, a general-purpose computer, and performs both of the deep learning process and the image analysis process described in the first embodiment. That is, the image analysis system according to the second embodiment is a stand-alone system that performs deep learning and image analysis on the user side.
- the image analysis system according to the second embodiment differs from the image analysis system according to the first embodiment in that the integrated type image analysis apparatus 200B installed on the user side has the functions of both the deep learning apparatus 100A and the image analysis apparatus 200A according to the first embodiment.
- the image analysis apparatus 200B is connected to the imaging apparatus 400.
- the imaging apparatus 400 acquires the first training image 70 and the second training image 71 of the learning tissue, and acquires the analysis target image 78 of the analysis target tissue at the time of the image analysis process.
- the hardware configuration of the image analysis apparatus 200B is similar to the hardware configuration of the user side apparatus 200 shown in FIG. 6 .
- the processing unit 20B of the image analysis apparatus 200B includes a training data generation unit 101, a training data input unit 102, an algorithm update unit 103, an analysis data generation unit 201, an analysis data input unit 202, an analysis unit 203, and a cell nucleus region detection unit 204.
- These functional blocks are realized by installing a program that causes a computer to execute a deep learning process and an image analysis process in the recording unit 23 or the memory 22 of the processing unit 20B and executing this program by the CPU 21.
- the window size database 104 and the algorithm database 105 are recorded in the recording unit 23 or the memory 22 of the processing unit 20B, and both are used jointly during deep learning and image analysis processing.
- the learned neural network 60 is stored beforehand in the algorithm database 105 in association with the type of tissue or the type of sample including cells, the coupling weight w is updated by the deep learning process, and stored as the deep learning algorithm 60 in the algorithm database 105.
- the first training image 70 and the second training image 71 which are the first training images for learning are captured in advance by the imaging apparatus 400 and stored in advance in the recording unit 23 or the memory 22 of the processing unit 20B.
- the analysis target image 78 of the analysis target sample is also imaged in advance by the imaging apparatus 400 and recorded in the recording unit 23 or the memory 22 of the processing unit 20B in advance.
- the processing unit 20B of the image analysis apparatus 200B performs the processing shown in FIG. 11 at the time of the deep learning process and the processing shown in FIG. 8 at the time of the image analysis process.
- the processes of steps S11 to S13, S18 and S19 are performed by the training data generating unit 101 during the deep learning process.
- the process of step S14 is performed by the training data input unit 102.
- the processes of steps S15 to S17 are performed by the algorithm updating unit 103.
- the processes of steps S21 and S22 are performed by the analysis data generation unit 201 at the time of image analysis process.
- the processes of steps S23, S24, S26, and S27 are performed by the analysis data input unit 202.
- the processes of steps S25 and S28 are performed by the analysis unit 203.
- the process of step S29 is performed by the cell nucleus region detection unit 204.
- the procedure of the deep learning process and the procedure of the image analysis process performed by the image analysis apparatus 200B according to the second embodiment are similar to the procedures performed by the deep learning apparatus 100A and the image analysis apparatus 200A according to the first embodiment. Note that the image analysis apparatus 200B according to the second embodiment differs from the deep learning apparatus 100A and the image analysis apparatus 200A according to the first embodiment in the following points.
- step S 13 at the time of the deep learning process the processing unit 20B receives an input of the type of tissue for learning from the user of the image analysis apparatus 200B via the input unit 26.
- the processing unit 20B sets the window size by referring to the window size database 104 based on the type of the input tissue, and refers to the algorithm database 105 to set the neural network 50 used for learning.
- the user of the image analysis apparatus 200B can acquire the binary image 83 as the analysis result by inputting the analysis target image 78 to the image analysis apparatus 200B.
- the user of the image analysis apparatus 200B also can acquire the cell nucleus region weighted image 84 as the analysis result.
- the image analysis system includes a vendor side apparatus 100 and a user side apparatus 200.
- the vendor side apparatus 100 operates as an integrated type image analysis apparatus 100B and the user side apparatus 200 operates as the terminal apparatus 200C.
- the image analysis apparatus 100B is, for example, a general-purpose computer and is a device on the cloud server side that performs both of the deep layer learning process and the image analysis process described in the first embodiment.
- the terminal apparatus 200C is composed of, for example, a general-purpose computer, and is a user side terminal apparatus that transmits an analysis target image to the image analysis apparatus 100B via the network 99, and receives an image of the analysis result from the image analysis apparatus 100B via the network 99.
- the image analysis system according to the third embodiment is similar to the image analysis system according to the second embodiment in that the integrated image analysis apparatus 100B installed on the vendor side has the functions of both the deep learning apparatus 100A and the image analysis apparatus 200A according to the first embodiment.
- the image analysis system according to the third embodiment differs from the image analysis system according to the second embodiment in that it is provided a terminal apparatus 200C and supplies the input interface of the analysis target image and the output interface of the analysis result image to the terminal apparatus 200C on the user side.
- the image analysis system according to the third embodiment is a client service type system in which the vendor side performs a deep learning process and an image analysis process and provides a cloud service type of input/output interface for analysis target images and analysis result images to the user side.
- the image analysis apparatus 100B is connected to the imaging apparatus 300 and acquires the first training image 70 and the second training image 71 of the learning tissue captured by the imaging apparatus 300.
- the terminal apparatus 200C is connected to the imaging apparatus 400, and acquires the analysis target image 78 of the analysis target tissue which is imaged by the imaging apparatus 400.
- the hardware configuration of the image analysis apparatus 100B is similar to the hardware configuration of the vendor-side apparatus 100 shown in FIG. 5 .
- the hardware configuration of the terminal apparatus 200C is the same as the hardware configuration of the user apparatus 200 shown in FIG. 6 .
- the processing unit 20B of the image analysis apparatus 200B includes a training data generation unit 101, a training data input unit 102, an algorithm update unit 103, an analysis data generation unit 201, an analysis data input unit 202, an analysis unit 203, and a cell nucleus region detection unit 204.
- These functional blocks are realized by installing a program that causes a computer to execute a deep learning process and an image analysis process in the recording unit 13 or the memory 22 of the processing unit 10B and executing this program by the CPU 11.
- the window size database 104 and the algorithm database 105 are recorded in the recording unit 13 or the memory 12 of the processing unit 10B, and both are used jointly during deep learning and image analysis processing.
- the learned neural network 50 is stored beforehand in the algorithm database 105 in association with the type of tissue, the coupling weight w is updated by the deep learning process, and stored as the deep learning algorithm 60 in algorithm data base 105.
- the first training image 70 and the second training image 71 of the sample for learning are captured in advance by the imaging device 300 and stored in advance in the recording unit 13 or the memory 12 of the processing unit 10B.
- the analysis target image 78 of the analysis target tissue is also imaged in advance by the imaging apparatus 400 and recorded in the recording unit 23 or the memory 22 of the processing unit 20C of the terminal apparatus 200C in advance.
- the processing unit 10B of the image analysis apparatus 100B performs the process shown in FIG. 8 at the time of the deep learning process and the processing shown in FIG. 11 at the time of the image analysis process.
- the processes of steps S11 to S13, S18 and S19 are performed by the training data generating unit 101 during the deep learning process.
- the process of step S14 is performed by the training data input unit 102.
- the processes of steps S15 to S17 are performed by the algorithm updating unit 103.
- the processes of steps S21 and S22 are performed by the analysis data generation unit 201 at the time of image analysis process.
- the processes of steps S23, S24, S26, and S27 are performed by the analysis data input unit 202.
- the processes of steps S25 and S28 are performed by the analysis unit 203.
- the process of step S29 is performed by the cell nucleus region detection unit 204.
- the procedure of the deep learning process and the procedure of the image analysis process performed by the image analysis apparatus 100B according to the third embodiment are similar to the procedures performed by the deep learning apparatus 100A and the image analysis apparatus 200A according to the first embodiment. Note that the image analysis apparatus 100B according to the third embodiment differs from the deep learning apparatus 100A and the image analysis apparatus 200A according to the first embodiment in the following points.
- the processing unit 10B receives the analysis target image 78 of the analysis target tissue from the terminal apparatus 200C on the user side, and generates color density encoded diagrams 79r, 79g, and 79b of R, G, and B colors from the received analysis target image 78 in step S21 during the image analysis process shown in FIG. 11 .
- the generation method of the color density encoded diagrams 79r, 79g, and 79b is the same as the generation method of step S11 at the time of the deep learning process shown in FIG. 8 .
- step S28 during the image analysis process the processing unit 10B transmits the binary image 83 of the analysis result to the terminal apparatus 200C on the user side.
- the processing unit 20C outputs the binary image 83 of the received analysis result to the output unit 27.
- step S29 during the image analysis process the processing unit 10B also performs a detection process of the region of the cell nucleus on the binary image 83 of the analysis result following step S28.
- the processing unit 10B creates a cell nucleus area weighted image 84 by superimposing the obtained cell nucleus region on the analysis target image 78 of the analysis target.
- the processing unit 10B transmits the created cell nucleus region weighted image 84 to the user terminal apparatus 200C.
- the processing unit 20C outputs the received cell nucleus region weighted image 84 to the output unit 27, and ends the image analysis process.
- the user of the terminal apparatus 200C can acquire the binary image 83 as the analysis result by transmitting the analysis target image 78 of the analysis target tissue to the image analysis apparatus 100B.
- the user of the terminal apparatus 200C also can acquire the cell nucleus region weighted image 84 as the analysis result.
- the user can be given the result of the image analysis process without acquiring the window size database 104 and the algorithm database 105 from the depth learning apparatus 100A.
- the user can be given the result of the image analysis process without acquiring the window size database 104 and the algorithm database 105 from the depth learning apparatus 100A.
- pathologists performing cytodiagnosis is insufficient nationwide. Pathologists are enrolled in a major hospital in urban areas, but most are not in remote medical institutions or in relatively small medical institutions such as clinics even in urban areas.
- the cloud service provided by the image analysis apparatus 100B and the terminal apparatus 200C aids tissue diagnosis and cytological diagnosis in such remote places or relatively small medical institutions.
- the sample to be treated is not limited thereto, and a sample of the above-described tissue sample or a sample containing cells can be used.
- the processing units 10A, 20B, and 10B refer to the window size database 104 to set the number of pixels of the window size in step S 13 in the first to third embodiments
- the pixel number of the window size also may be directly set by the operator or the user. In this case, the window size database 104 is unnecessary.
- the processing units 10A, 20B, and 10B set the number of pixels of the window size based on the type of the input organization in step S13 in the first to third embodiments
- the size of the tissue also may be input instead of inputting the type of tissue.
- the processing units 10A, 20B, and 10B may set the number of pixels of the window size by referring to the window size database 104 based on the size of the input tissue.
- the size of the tissue may be input instead of entering the type of tissue.
- the processing units 20A, 20B, and 10B may refer to the window size database 104 and the algorithm database 105 to set the number of pixels of the window size and acquire the neural network 60 based on the size of the input tissue.
- the size may be directly input as a numerical value, or a user may input a predetermined numerical range corresponding to the size to be selected and input by the user, for example, using the input user interface as a pull-down menu.
- the imaging magnification at the time of capturing the first training image 70, the analysis target image 78, and the second training image 71 also may be input.
- the magnification may be directly input as a numerical value, or a user may select a predetermined numerical range corresponding to the magnification that the user intends to input, for example, using the input user interface as a pull-down menu.
- the window size is set to 3 ⁇ 3 pixels for the sake of convenience in the deep learning process and the image analysis process in the first to third embodiments
- the number of pixels of the window size is not limited to this.
- the window size also may be set according to, for example, the type of the tissue sample and the type of the sample including cells. In this case, it suffices that the product of the number of pixels of the window size and the number of primary colors included in the image corresponds to the number of nodes of the input layers 50a and 60a of the neural networks 50 and 60.
- the processing units 10A, 20B, and 10B also may acquire the number of pixels of the window size and correct the number of pixels of the acquired window size based on the input imaging magnification.
- step S17 the processing units 10A, 20B, and 10B record the deep layer learning algorithm 60 in the algorithm database 105 in association with the organization type on a one-to-one basis in the first to third embodiments.
- the processing units 10A, 20B, 10B also may associate a plurality of tissue types with one deep learning algorithm 60 and record them in the algorithm database 105.
- the hue is defined by a combination of three primary colors of light or a combination of three primary colors of light, but the number of hues is not limited to three.
- the number of hues also may be four primary colors plus yellow (Y) to red (R), green (G), and blue (B), or three primary colors of red (R), green (G), and blue (B) It may be a two primary color in which any one hue is reduced as two primary colors.
- one primary color of only one of the three primary colors of red (R), green (G), and blue (B) (for example, green (G)) may be used.
- the bright field images 70 and the analysis target image 78 acquired using a known microscope, a virtual slide scanner or the like are not limited to color images of three primary colors of red (R), green (G), and blue (B), and may be a color image of two primary colors or an image containing one or more primary colors.
- the processing units 10A, 20B, and 10B generate the color density encoded diagrams 72r, 72g, and 72b as single color images of three primary colors in step S11 in the first to third embodiments
- the gradation of the primary colors of the color density encoded diagrams 72r, 72g, and 72b is not limited to 3 gradations.
- the gradation of the color density encoded diagrams 72r, 72g, and 72b may be an image of two gradations or may be an image of one gradation or more.
- the processing units 20A, 20B, and 10B generate single-color images for each primary color of the color density encoded diagrams 79r, 79g, and 79b in step S21
- the gradation of the primary color is not limited to 3 gradations when generating the color density encoded diagram.
- the primary color when creating the color density encoded diagram may be an image of two gradations or may be an image of one or more gradations.
- the gradation of the color density encoded diagrams 72r, 72g, 72b, 79r, 79g, 79b can be set to 256 levels (8 gradations) with color density values from value 0 to value 255.
- the processing units 10A, 20B, and 10B generate R, G, B color density encoded graphics 72r, 72g, and 72b from the input first training image 70 in step S11 in the first to third embodiments
- the input first training image 70 may be gradated in advance. That is, the processing units 10A, 20B, and 10B may directly obtain the color density encoded diagrams 72r, 72g, 72b of R, G, B colors from, for example, a virtual slide scanner or the like.
- the processing units 20A, 20B, and 10B generate the color density encoded diagrams 79r, 79g, and 79b of the respective colors of R, G, and B from the input analysis target image 78 in step S21
- the input analysis target image 78 also may be gradated in advance. That is, the processing units 20A, 20B, and 10B may directly obtain the color density encoded diagrams 79r, 79g, and 79b of R, G, B colors from, for example, a virtual slide scanner or the like.
- RGB is used for the color space when generating the color density encoded diagrams 72 and 79 from the first training images 70 and 78 of color
- the color space is not limited to RGB.
- various color spaces can be used such as YUV, CMY, and CIE Lab.
- density values of each pixel are stored in the order of red (R), green (G), and blue (B)in the training data 74 and the analysis data 80, however, the order of storing and handling density values is not limited to this.
- the density values may be stored in the order of blue (B), green (G), and red (R), and the order of arrangement of density values in the training data 74 and the order of arrangement of density values in the analysis data 80 may be the same.
- processing units 10 A, 20 B, and 10 B binarize the gradation of each pixel of the input second training image 71 to generate the true value image 73 in step S12 of the first to third embodiments, it is also possible to acquire the binarized true value image 73 in advance.
- processing units 10A and 10B are realized as an integrated device in the first to third embodiments, the processing units 10A and 10B need not be integrated devices, and may be any of a CPU 11, a memory 12, a recording unit 13 and the like arranged in different locations and connected via a network.
- the processing units 10A and 10B, the input unit 16, and the output unit 17 are not necessarily arranged in one place, and they may be arranged separately from each other and connected to each other so as to communicate with each other via a network.
- the processing units 20A, 20B, 20C are also the same as the processing units 10A, 10B.
- each function block of the training data generation unit 101, the training data input unit 102, the algorithm update unit 103, the analysis data generation unit 201, the analysis data input unit 202, the analysis unit 203, and the cell nucleus region detection unit 204 is executed by a single CPU 11 or a single CPU 21 in the first to third embodiments, these function blocks are not necessary executed on a single CPU, and also may be distributedly executed among a plurality of CPUs. Each of these functional blocks also may be distributedly executed by a plurality of GPUs, or may be distributedly executed by a plurality of CPUs and a plurality of GPUs.
- programs for performing the process of each step described in FIGS. 8 and 11 are recorded in the recording units 13 and 23 in advance.
- the program may be installed in the processing units 10B and 20B from a computer readable non-transitory tangible recording medium 98 such as a DVD-ROM or a USB memory.
- the processors 10B and 20B may be connected to the network 99, and the program may be downloaded and installed from, for example, an external server (not shown) via the network 99.
- the input units 16 and 26 are input devices such as a keyboard or a mouse
- the output units 17 and 27 are realized as a display device such as a liquid crystal display.
- the input units 16 and 26 and the output units 17 and 27 may be integrated and realized as a touch panel type display device.
- the output units 17 and 27 may be composed of a printer or the like, and the binary image 83 of the analysis result or the cell nucleus region weighted image 84 of the cell nucleus may be printed and output.
- the imaging apparatus 300 is directly connected to the depth learning device 100A or the image analysis device 100B in the first to third embodiments, the imaging apparatus 300 also may be connected via the network 99 to the deep learning apparatus 100A, or may be connected to the image analyzing apparatus 100B.
- the imaging apparatus 400 is directly connected to the image analysis apparatus 200A or image analysis apparatus 200B, the imaging apparatus 400 also may be connected to the image analysis apparatus 200A or the image analysis apparatus 200B via the network 99.
- a deep learning process and image analysis process were performed in the stand-alone type system shown in the second embodiment.
- the tissues to be learned and analyzed were gastric cancer tissues. Analysis was performed on two different gastric cancer tissue samples.
- FIGS. 16A and 16B show the bright-field image and the fluorescence image obtained by imaging, respectively, and the binarized image created from the fluorescence image is shown in FIG. 16C .
- training data were prepared by combining the color density encoded diagram and the binarized image.
- the created training data were divided into a window size of 113 ⁇ 113 pixels and the neural network learned the divided training data of the window size as the input layer.
- the 113 ⁇ 113 pixels adopted as the window size is a size that supports including in the window the entire shape of the cell nucleus region of at least one cell among the plural cells of about two to nine cells.
- FIG. 17 shows the analysis result of the first stomach cancer tissue sample image.
- FIG. 17A is a bright field image obtained by staining the stomach cancer tissue with HE and
- FIG. 17B is an image showing a contour of the region of the cell nucleus obtained by the analysis processing displayed superimposed on the image of FIG. 17A .
- the region surrounded by white is the region of cell nucleus.
- FIG. 18 shows the analysis result of the second gastric cancer tissue sample image.
- FIG. 18A is a bright field image obtained by staining the gastric cancer tissue with HE
- FIG. 18B is an image showing a contour of the region of the cell nucleus obtained by the analysis processing displayed superimposed on the image of FIG. 18A .
- the region surrounded by white is the region of cell nucleus.
- FIG. 19 shows the analysis result of the touch imprint sample of the stomach cancer part.
- FIG. 19A is a bright field image obtained by staining the gastric cancer tissue with HE
- FIG. 19B is an image showing a contour of the region of the cell nucleus obtained by the analysis process displayed superimposed on the image of FIG. 19A .
- the region surrounded by white is the region of cell nucleus.
- FIG. 20 shows the analysis result of the touch imprint sample of the gastric cancer site.
- FIG. 20A is a bright field image obtained by staining the gastric cancer tissue with HE
- FIG. 20B is an image showing a contour of the region of the cell nucleus obtained by the analysis process displayed superimposed on the image of FIG. 20A .
- the region surrounded by white is the region of cell nucleus.
Claims (13)
- Procédé d'analyse d'image pour analyser une image (78) d'un tissu (308, 408) ou d'une cellule en utilisant un algorithme d'apprentissage profond (60) d'une structure (50) de réseau neuronal, le procédé comprenant :la génération de données d'analyse (80) à partir d'une image cible d'analyse (78) qui inclut le tissu (308, 408) ou la cellule à analyser ;l'entrée des données d'analyse (80) dans l'algorithme d'apprentissage profond (60) ; etla génération de données (82) indiquant une région d'un noyau cellulaire dans l'image cible d'analyse (78) par l'algorithme d'apprentissage profond (60), dans lequel :l'algorithme d'apprentissage profond (60) est généré à partir de données d'apprentissage incluant des paires de premières données d'apprentissage (72r, 72g, 72b) et de secondes données d'apprentissage (73),les premières données d'apprentissage (72r, 72g, 72b) incluent des données de valeur de densité de couleur (76) de chaque pixel générées à partir d'une image en champ clair d'un tissu ou d'une cellule qui est teinté pour observation en champ clair,les secondes données d'apprentissage (73) incluent des données binarisées (77) de chaque pixel générées à partir d'image de fluorescence d'une même région ou région correspondante du tissu ou de la cellule dont le noyau cellulaire est teinté pour observation par fluorescence, dans lequel les données binarisées (77) indiquent si chaque pixel est une région d'un noyau cellulaire, etl'algorithme d'apprentissage profond (60) apprend une relation entre les premières données d'apprentissage (72r, 72g, 72b), en tant que couche d'entrée (50a, 60a) de la structure (50) de réseau neuronal, et les secondes données d'apprentissage (73), en tant que couche de sortie (50b, 60c) de la structure (50) de réseau neuronal.
- Procédé d'analyse d'image selon la revendication 1, dans lequel
l'image cible d'analyse (78) est une image d'un échantillon de diagnostic tissulaire, et l'image cible d'analyse (78) inclut une teinte composée d'une couleur primaire ou une teinte obtenue en combinant deux couleurs primaires ou plus. - Procédé d'analyse d'image selon la revendication 1, dans lequel
l'image cible d'analyse (78) est une image d'un échantillon de diagnostic cellulaire, et l'image cible d'analyse (78) inclut une teinte composée d'une couleur primaire ou une teinte obtenue en combinant deux couleurs primaires ou plus. - Procédé d'analyse d'image selon l'une quelconque des revendications 1 à 3, dans lequel
les données (82) indiquant la région du noyau cellulaire sont des données pour différencier et présenter la région du noyau cellulaire et l'autre région. - Procédé d'analyse d'image selon l'une quelconque des revendications 1 à 3, dans lequel
les données (82) indiquant la région du noyau cellulaire sont des données pour indiquer une frontière entre la région du noyau cellulaire et l'autre région. - Procédé d'analyse d'image selon l'une quelconque des revendications 1 à 5, dans lequel
l'algorithme d'apprentissage profond (60) détermine si une position arbitraire dans l'image cible d'analyse (78) est la région du noyau cellulaire. - Procédé d'analyse d'image selon l'une quelconque des revendications 1 à 6, dans lequel
la génération des données d'analyse (80) à partir de l'image cible d'analyse (78) comprend la génération des données d'analyse (80) pour chacune d'une pluralité de régions présentant un nombre de pixels prédéterminé, pour l'image cible d'analyse (78). - Procédé d'analyse d'image selon la revendication 7, dans lequelchacune de la pluralité de régions présentant le nombre de pixels prédéterminé inclut des pixels périphériques délimitant un pixel particulier, respectivement ; etl'algorithme d'apprentissage profond (60) génère une étiquette indiquant si une région dans un pixel particulier est un noyau cellulaire.
- Procédé d'analyse d'image selon la revendication 8, dans lequel
un nombre de noeuds de la couche d'entrée (50a, 60a) de la structure (50) de réseau neuronal correspond à un produit du nombre de pixels prédéterminé dans les données d'analyse (80) et d'un nombre de couleurs primaires combinées incluses dans l'image cible d'analyse (78). - Procédé d'analyse d'image selon l'une quelconque des revendications 1 à 9, dans lequel
un échantillon incluant le tissu ou la cellule dans un échantillon teinté, et l'image cible d'analyse (78) est une image obtenue en imageant l'échantillon teinté sous un microscope en champ clair. - Procédé d'analyse d'image selon la revendication 10, dans lequel
la teinture pour observation sur fond clair utilise de l'hématoxyline pour teinture nucléaire. - Procédé d'analyse d'image selon la revendication 10 ou revendication 11, dans lequella teinte pour observation en champ clair est une teinte hématoxyline-éosine lorsque l'échantillon inclut le tissu ; etla teinte pour observation en champ clair est une teinte de Papanicolaou lorsque l'échantillon inclut des cellules.
- Appareil d'analyse d'image (200A) pour analyser une image d'un tissu (308, 408) ou d'une cellule en utilisant un algorithme d'apprentissage profond (60) d'une structure (50) de réseau neuronal, l'appareil (200A) étant configuré pour :générer des données d'analyse (80) à partir d'une image cible d'analyse (78) qui inclut le tissu (308, 408) ou la cellule à analyser ;entrer les données d'analyse (80) dans l'algorithme d'apprentissage profond (60) ; etgénérer des données (82) indiquant une région d'un noyau cellulaire dans l'image cible d'analyse (78) par l'algorithme d'apprentissage profond (60), dans lequel :l'algorithme d'apprentissage profond est généré à partir de données d'apprentissage incluant des paires de premières données d'apprentissage (72r, 72g, 72b) et de secondes données d'apprentissage (73),les premières données d'apprentissage (72r, 72g, 72b) incluent des données de valeur de densité de couleur (76) de chaque pixel générées à partir d'une image en champ clair d'un tissu ou d'une cellule qui est teinté pour observation en champ clair,les secondes données d'apprentissage (73) incluent des données binarisées (77) de chaque pixel générées à partir d'image de fluorescence d'une même région ou région correspondante du tissu ou de la cellule dont le noyau cellulaire est teinté pour observation par fluorescence, dans lequel les données binarisées (77) indiquent si chaque pixel est une région d'un noyau cellulaire, etl'algorithme d'apprentissage profond (60) est configuré pour apprendre une relation entre les premières données d'apprentissage (72r, 72g, 72b), en tant que couche d'entrée (50a, 60a) de la structure (50) de réseau neuronal, et les secondes données d'apprentissage (73), en tant que couche de sortie (50b, 60c) de la structure (50) de réseau neuronal.
Applications Claiming Priority (1)
| Application Number | Priority Date | Filing Date | Title |
|---|---|---|---|
| JP2017222178A JP7198577B2 (ja) | 2017-11-17 | 2017-11-17 | 画像解析方法、装置、プログラムおよび学習済み深層学習アルゴリズムの製造方法 |
Publications (2)
| Publication Number | Publication Date |
|---|---|
| EP3486836A1 EP3486836A1 (fr) | 2019-05-22 |
| EP3486836B1 true EP3486836B1 (fr) | 2024-01-10 |
Family
ID=64331746
Family Applications (1)
| Application Number | Title | Priority Date | Filing Date |
|---|---|---|---|
| EP18206451.9A Active EP3486836B1 (fr) | 2017-11-17 | 2018-11-15 | Procédé d'analyse d'image, appareil, programme et algorithme d'apprentissage profond appris |
Country Status (4)
| Country | Link |
|---|---|
| US (3) | US11074692B2 (fr) |
| EP (1) | EP3486836B1 (fr) |
| JP (2) | JP7198577B2 (fr) |
| CN (2) | CN109871735B (fr) |
Families Citing this family (23)
| Publication number | Priority date | Publication date | Assignee | Title |
|---|---|---|---|---|
| JP7198577B2 (ja) * | 2017-11-17 | 2023-01-04 | シスメックス株式会社 | 画像解析方法、装置、プログラムおよび学習済み深層学習アルゴリズムの製造方法 |
| US11621058B2 (en) | 2018-02-08 | 2023-04-04 | Ohio State Innovation Foundation | Synthetic IHC-stained digital sides generated using artificial neural networks |
| CN115684569A (zh) * | 2018-02-15 | 2023-02-03 | 国立大学法人新潟大学 | 超突变型癌的判别系统、程序及方法 |
| JP7137935B2 (ja) * | 2018-02-27 | 2022-09-15 | シスメックス株式会社 | 画像解析方法、画像解析装置、プログラム、学習済み深層学習アルゴリズムの製造方法および学習済み深層学習アルゴリズム |
| EP3608701A1 (fr) * | 2018-08-09 | 2020-02-12 | Olympus Soft Imaging Solutions GmbH | Procédé de fourniture d'au moins un procédé d'évaluation pour échantillons |
| WO2020129176A1 (fr) * | 2018-12-19 | 2020-06-25 | 株式会社日立国際電気 | Système de traitement d'image, procédé de traitement d'image et programme de traitement d'image |
| AU2020273186A1 (en) | 2019-04-11 | 2021-12-02 | Agilent Technologies, Inc. | User interface configured to facilitate user annotation for instance segmentation within biological sample |
| KR102091832B1 (ko) * | 2019-08-05 | 2020-03-20 | 주식회사 에프앤디파트너스 | 멀티미디어 정보를 이용한 휴대용 체외진단키트 해석장치 |
| WO2021041338A1 (fr) | 2019-08-23 | 2021-03-04 | Memorial Sloan Kettering Cancer Center | Identification de régions d'intérêt dans des images de lames virtuelles |
| US20220334043A1 (en) * | 2019-09-02 | 2022-10-20 | H.U. Group Research Institute G.K. | Non-transitory computer-readable storage medium, gate region estimation device, and method of generating learning model |
| KR102449534B1 (ko) * | 2019-09-18 | 2022-09-30 | 김광수 | 지능형 세포 관리 시스템 |
| JP2021064115A (ja) * | 2019-10-11 | 2021-04-22 | 株式会社島津製作所 | 細胞画像解析方法及び細胞解析装置 |
| JP2021083431A (ja) * | 2019-11-29 | 2021-06-03 | シスメックス株式会社 | 細胞解析方法、細胞解析装置、細胞解析システム、及び細胞解析プログラム |
| CN111178229B (zh) * | 2019-12-26 | 2023-04-28 | 南京航空航天大学 | 一种基于深度学习的静脉显像方法和装置 |
| CN111325220B (zh) * | 2020-02-17 | 2023-04-07 | 腾讯科技(深圳)有限公司 | 图像生成方法、装置、设备及存储介质 |
| US20230160874A1 (en) * | 2020-04-21 | 2023-05-25 | Shimadzu Corporation | Cell image analyzer |
| CN111739010B (zh) | 2020-06-23 | 2022-06-24 | 珠海圣美生物诊断技术有限公司 | 一种检测循环异常细胞的方法及装置 |
| CN114463246A (zh) * | 2020-11-06 | 2022-05-10 | 广达电脑股份有限公司 | 圈选系统及圈选方法 |
| CN112613505A (zh) * | 2020-12-18 | 2021-04-06 | 安徽丹姆斯生物科技有限公司 | 一种基于深度学习的细胞微核识别、定位和计数方法 |
| CN112750493B (zh) * | 2020-12-22 | 2024-05-03 | 深思考人工智能机器人科技(北京)有限公司 | 基于巴氏染色方式的dna倍体定量分析方法及系统 |
| CN113487572A (zh) * | 2021-07-07 | 2021-10-08 | 中国人民解放军总医院第一医学中心 | 基于同源多窗技术的医学图像深度学习方法和装置 |
| CN114463249B (zh) * | 2021-11-24 | 2024-04-05 | 杭州医派智能科技有限公司 | 一种基于深度学习的用于评估肾小球周围组织纤维化的辅助方法、计算机设备 |
| CN116012838B (zh) * | 2022-12-30 | 2023-11-07 | 创芯国际生物科技(广州)有限公司 | 基于人工智能的类器官活性识别方法及系统 |
Family Cites Families (20)
| Publication number | Priority date | Publication date | Assignee | Title |
|---|---|---|---|---|
| GB0211068D0 (en) | 2002-05-14 | 2002-06-26 | Amersham Biosciences Uk Ltd | Method for assessing biofilms |
| US9070006B2 (en) * | 2006-12-19 | 2015-06-30 | Hologic, Inc. | Method and system for processing an image of a biological specimen |
| JP5321145B2 (ja) | 2009-03-04 | 2013-10-23 | 日本電気株式会社 | 画像診断支援装置、画像診断支援方法、画像診断支援プログラム、及びその記憶媒体 |
| JP5295906B2 (ja) | 2009-08-03 | 2013-09-18 | 花王株式会社 | 毛髪特性データの取得方法 |
| JP5140780B2 (ja) * | 2010-12-28 | 2013-02-13 | エスシーワールド株式会社 | 血液中の標的細胞の検査方法、標的細胞検索装置、及びバイオチップ |
| JP5812095B2 (ja) * | 2011-09-09 | 2015-11-11 | コニカミノルタ株式会社 | 生体物質検出方法 |
| CN103020585B (zh) * | 2012-11-06 | 2015-08-26 | 华南师范大学 | 一种免疫组织阳性细胞和阴性细胞识别方法 |
| CA2944829C (fr) * | 2014-05-23 | 2022-10-25 | Ting Chen | Systemes et procedes de detection de structures et/ou de motifs biologiques dans des images |
| US10839510B2 (en) * | 2015-08-19 | 2020-11-17 | Colorado Seminary, Which Owns And Operates The University Of Denver | Methods and systems for human tissue analysis using shearlet transforms |
| EP3448232A4 (fr) * | 2016-04-26 | 2019-12-18 | Ascend Hit Llc | Système et procédés d'analyse et de rapport d'images médicales |
| CN109690554B (zh) * | 2016-07-21 | 2023-12-05 | 西门子保健有限责任公司 | 用于基于人工智能的医学图像分割的方法和系统 |
| CN106570505B (zh) * | 2016-11-01 | 2020-08-21 | 北京昆仑医云科技有限公司 | 对组织病理图像进行分析的方法和系统 |
| US11132529B2 (en) * | 2016-11-16 | 2021-09-28 | Ventana Medical Systems, Inc. | Convolutional neural networks for locating objects of interest in images of biological samples |
| US10573003B2 (en) * | 2017-02-13 | 2020-02-25 | Amit Sethi | Systems and methods for computational pathology using points-of-interest |
| CA3053368A1 (fr) * | 2017-02-14 | 2018-08-23 | Dignity Health | Systemes, procedes et supports pour presenter selectivement des images capturees par endomicroscopie laser confocale |
| CN107256558B (zh) * | 2017-05-18 | 2019-12-17 | 深思考人工智能机器人科技(北京)有限公司 | 一种无监督式的宫颈细胞图像自动分割方法及系统 |
| CN107679490B (zh) * | 2017-09-29 | 2019-06-28 | 百度在线网络技术(北京)有限公司 | 用于检测图像质量的方法和装置 |
| JP7076698B2 (ja) * | 2017-11-17 | 2022-05-30 | 国立研究開発法人国立がん研究センター | 画像解析方法、画像解析装置、プログラム、学習済み深層学習アルゴリズムの製造方法および学習済み深層学習アルゴリズム |
| JP7198577B2 (ja) * | 2017-11-17 | 2023-01-04 | シスメックス株式会社 | 画像解析方法、装置、プログラムおよび学習済み深層学習アルゴリズムの製造方法 |
| JP6983704B2 (ja) * | 2018-03-19 | 2021-12-17 | 株式会社ミツトヨ | 計測用x線ctの測定計画生成方法及び装置 |
-
2017
- 2017-11-17 JP JP2017222178A patent/JP7198577B2/ja active Active
-
2018
- 2018-11-15 EP EP18206451.9A patent/EP3486836B1/fr active Active
- 2018-11-16 US US16/193,422 patent/US11074692B2/en active Active
- 2018-11-16 CN CN201811362790.2A patent/CN109871735B/zh active Active
- 2018-11-16 CN CN202410217329.7A patent/CN117975453A/zh active Pending
-
2021
- 2021-06-21 US US17/352,488 patent/US11842556B2/en active Active
-
2022
- 2022-09-06 JP JP2022141451A patent/JP2022180419A/ja active Pending
-
2023
- 2023-09-07 US US18/462,530 patent/US20230419696A1/en active Pending
Non-Patent Citations (1)
| Title |
|---|
| SADANANDAN SAJITH KECHERIL ET AL: "Automated Training of Deep Convolutional Neural Networks for Cell Segmentation", SCIENTIFIC REPORTS, vol. 7, no. 7860, 10 August 2017 (2017-08-10), US, pages 1 - 7, XP055923572, ISSN: 2045-2322, DOI: 10.1038/s41598-017-07599-6 * |
Also Published As
| Publication number | Publication date |
|---|---|
| JP2019095853A (ja) | 2019-06-20 |
| US20210312627A1 (en) | 2021-10-07 |
| US11074692B2 (en) | 2021-07-27 |
| US20190156481A1 (en) | 2019-05-23 |
| JP2022180419A (ja) | 2022-12-06 |
| CN109871735B (zh) | 2024-03-15 |
| US20230419696A1 (en) | 2023-12-28 |
| CN117975453A (zh) | 2024-05-03 |
| CN109871735A (zh) | 2019-06-11 |
| EP3486836A1 (fr) | 2019-05-22 |
| US11842556B2 (en) | 2023-12-12 |
| JP7198577B2 (ja) | 2023-01-04 |
Similar Documents
| Publication | Publication Date | Title |
|---|---|---|
| EP3486836B1 (fr) | Procédé d'analyse d'image, appareil, programme et algorithme d'apprentissage profond appris | |
| US11436718B2 (en) | Image analysis method, image analysis apparatus, program, learned deep layer learning algorithm manufacturing method and learned deep layer learning algorithm | |
| JP7458519B2 (ja) | 画像解析方法、画像解析装置、プログラム、学習済み深層学習アルゴリズムの製造方法および学習済み深層学習アルゴリズム | |
| US20200388033A1 (en) | System and method for automatic labeling of pathology images | |
| CA2966555C (fr) | Systemes et procedes pour analyse de co-expression dans un calcul de l'immunoscore | |
| JP6517788B2 (ja) | 適応的病理組織画像分解のためのシステム及び方法 | |
| CN113454733A (zh) | 用于预后组织模式识别的多实例学习器 | |
| WO2019048954A1 (fr) | Détermination de qualité de coloration de tissu | |
| CN112435243A (zh) | 一种全切片数字病理图像的自动分析系统及方法 | |
| WO2015189264A1 (fr) | Prédiction d'une récurrence du cancer du sein directement à partir de caractéristiques d'image calculées à partir de lames de tissu d'immunohistopathologie numérisées | |
| EP3506165A1 (fr) | Utilisation d'une première tache pour former un mod?le afin de prédire la région tachée par une seconde tache | |
| WO2012041333A1 (fr) | Imagerie, détection et classement automatisés d'objets dans des échantillons cytologiques | |
| US11861881B2 (en) | Critical component detection using deep learning and attention | |
| CN113261012B (zh) | 处理图像的方法、装置及系统 | |
| US20230162485A1 (en) | Digital analysis of preanalytical factors in tissues used for histological staining | |
| CN117529750A (zh) | 使用多重免疫荧光成像的组织学染色的数字合成 | |
| US20210366107A1 (en) | Sensitivity analysis for digital pathology | |
| Selcuk et al. | Automated HER2 Scoring in Breast Cancer Images Using Deep Learning and Pyramid Sampling | |
| WO2024081150A1 (fr) | Prédiction de niveau d'expression pour biomarqueurs dans des images de pathologie numérique |
Legal Events
| Date | Code | Title | Description |
|---|---|---|---|
| PUAI | Public reference made under article 153(3) epc to a published international application that has entered the european phase |
Free format text: ORIGINAL CODE: 0009012 |
|
| STAA | Information on the status of an ep patent application or granted ep patent |
Free format text: STATUS: THE APPLICATION HAS BEEN PUBLISHED |
|
| AK | Designated contracting states |
Kind code of ref document: A1 Designated state(s): AL AT BE BG CH CY CZ DE DK EE ES FI FR GB GR HR HU IE IS IT LI LT LU LV MC MK MT NL NO PL PT RO RS SE SI SK SM TR |
|
| AX | Request for extension of the european patent |
Extension state: BA ME |
|
| STAA | Information on the status of an ep patent application or granted ep patent |
Free format text: STATUS: REQUEST FOR EXAMINATION WAS MADE |
|
| STAA | Information on the status of an ep patent application or granted ep patent |
Free format text: STATUS: EXAMINATION IS IN PROGRESS |
|
| 17P | Request for examination filed |
Effective date: 20191121 |
|
| RBV | Designated contracting states (corrected) |
Designated state(s): AL AT BE BG CH CY CZ DE DK EE ES FI FR GB GR HR HU IE IS IT LI LT LU LV MC MK MT NL NO PL PT RO RS SE SI SK SM TR |
|
| 17Q | First examination report despatched |
Effective date: 20191219 |
|
| STAA | Information on the status of an ep patent application or granted ep patent |
Free format text: STATUS: EXAMINATION IS IN PROGRESS |
|
| STAA | Information on the status of an ep patent application or granted ep patent |
Free format text: STATUS: EXAMINATION IS IN PROGRESS |
|
| REG | Reference to a national code |
Ref country code: DE Ref legal event code: R079 Ref document number: 602018063910 Country of ref document: DE Free format text: PREVIOUS MAIN CLASS: G06K0009000000 Ipc: G06V0010440000 Ref country code: DE Ref legal event code: R079 Free format text: PREVIOUS MAIN CLASS: G06K0009000000 Ipc: G06V0010440000 |
|
| GRAP | Despatch of communication of intention to grant a patent |
Free format text: ORIGINAL CODE: EPIDOSNIGR1 |
|
| STAA | Information on the status of an ep patent application or granted ep patent |
Free format text: STATUS: GRANT OF PATENT IS INTENDED |
|
| RIC1 | Information provided on ipc code assigned before grant |
Ipc: G06V 20/69 20220101ALI20230721BHEP Ipc: G06V 10/56 20220101ALI20230721BHEP Ipc: G06V 10/44 20220101AFI20230721BHEP |
|
| INTG | Intention to grant announced |
Effective date: 20230811 |
|
| GRAS | Grant fee paid |
Free format text: ORIGINAL CODE: EPIDOSNIGR3 |
|
| GRAA | (expected) grant |
Free format text: ORIGINAL CODE: 0009210 |
|
| STAA | Information on the status of an ep patent application or granted ep patent |
Free format text: STATUS: THE PATENT HAS BEEN GRANTED |
|
| AK | Designated contracting states |
Kind code of ref document: B1 Designated state(s): AL AT BE BG CH CY CZ DE DK EE ES FI FR GB GR HR HU IE IS IT LI LT LU LV MC MK MT NL NO PL PT RO RS SE SI SK SM TR |
|
| REG | Reference to a national code |
Ref country code: GB Ref legal event code: FG4D |
|
| REG | Reference to a national code |
Ref country code: CH Ref legal event code: EP |
|
| REG | Reference to a national code |
Ref country code: DE Ref legal event code: R096 Ref document number: 602018063910 Country of ref document: DE |
|
| REG | Reference to a national code |
Ref country code: IE Ref legal event code: FG4D |