EP3472358B1 - Verfahren und system für epigenetische analyse - Google Patents
Verfahren und system für epigenetische analyse Download PDFInfo
- Publication number
- EP3472358B1 EP3472358B1 EP17814184.2A EP17814184A EP3472358B1 EP 3472358 B1 EP3472358 B1 EP 3472358B1 EP 17814184 A EP17814184 A EP 17814184A EP 3472358 B1 EP3472358 B1 EP 3472358B1
- Authority
- EP
- European Patent Office
- Prior art keywords
- methylation
- genomic
- genome
- regions
- epigenetic
- Prior art date
- Legal status (The legal status is an assumption and is not a legal conclusion. Google has not performed a legal analysis and makes no representation as to the accuracy of the status listed.)
- Active
Links
- 238000004458 analytical method Methods 0.000 title claims description 148
- 230000001973 epigenetic effect Effects 0.000 title claims description 142
- 238000000034 method Methods 0.000 title claims description 113
- 230000011987 methylation Effects 0.000 claims description 443
- 238000007069 methylation reaction Methods 0.000 claims description 443
- 108090000623 proteins and genes Proteins 0.000 claims description 78
- 238000009826 distribution Methods 0.000 claims description 68
- 108091029523 CpG island Proteins 0.000 claims description 45
- 108010077544 Chromatin Proteins 0.000 claims description 38
- 210000003483 chromatin Anatomy 0.000 claims description 38
- 238000000638 solvent extraction Methods 0.000 claims description 30
- 238000012163 sequencing technique Methods 0.000 claims description 22
- LSNNMFCWUKXFEE-UHFFFAOYSA-M Bisulfite Chemical compound OS([O-])=O LSNNMFCWUKXFEE-UHFFFAOYSA-M 0.000 claims description 17
- 230000027455 binding Effects 0.000 claims description 15
- 238000005381 potential energy Methods 0.000 claims description 15
- 238000013459 approach Methods 0.000 claims description 14
- 108700024394 Exon Proteins 0.000 claims description 12
- 108091092195 Intron Proteins 0.000 claims description 12
- 108700009124 Transcription Initiation Site Proteins 0.000 claims description 12
- 238000001369 bisulfite sequencing Methods 0.000 claims description 10
- 238000003860 storage Methods 0.000 claims description 7
- 238000004590 computer program Methods 0.000 claims description 6
- 238000012986 modification Methods 0.000 claims description 6
- 238000005192 partition Methods 0.000 claims description 5
- 238000007476 Maximum Likelihood Methods 0.000 claims description 3
- 102000040945 Transcription factor Human genes 0.000 claims description 3
- 108091023040 Transcription factor Proteins 0.000 claims description 3
- 238000012175 pyrosequencing Methods 0.000 claims description 3
- 102000006835 Lamins Human genes 0.000 claims description 2
- 108010047294 Lamins Proteins 0.000 claims description 2
- 238000003780 insertion Methods 0.000 claims description 2
- 230000037431 insertion Effects 0.000 claims description 2
- 210000005053 lamin Anatomy 0.000 claims description 2
- 238000013179 statistical model Methods 0.000 claims description 2
- 238000001712 DNA sequencing Methods 0.000 claims 2
- 206010028980 Neoplasm Diseases 0.000 description 59
- 230000035945 sensitivity Effects 0.000 description 56
- 108091029430 CpG site Proteins 0.000 description 52
- 201000011510 cancer Diseases 0.000 description 45
- 210000001519 tissue Anatomy 0.000 description 40
- 239000000523 sample Substances 0.000 description 39
- 210000001072 colon Anatomy 0.000 description 33
- 238000012423 maintenance Methods 0.000 description 29
- 210000000130 stem cell Anatomy 0.000 description 29
- 210000004027 cell Anatomy 0.000 description 27
- 206010009944 Colon cancer Diseases 0.000 description 26
- 108020004414 DNA Proteins 0.000 description 25
- 208000029742 colonic neoplasm Diseases 0.000 description 25
- 210000004072 lung Anatomy 0.000 description 23
- 210000004556 brain Anatomy 0.000 description 22
- 201000010099 disease Diseases 0.000 description 20
- 208000037265 diseases, disorders, signs and symptoms Diseases 0.000 description 20
- 230000006870 function Effects 0.000 description 20
- 208000020816 lung neoplasm Diseases 0.000 description 20
- 230000008520 organization Effects 0.000 description 20
- 206010058467 Lung neoplasm malignant Diseases 0.000 description 19
- 201000005202 lung cancer Diseases 0.000 description 19
- 230000005366 Ising model Effects 0.000 description 18
- 210000002950 fibroblast Anatomy 0.000 description 18
- 201000007270 liver cancer Diseases 0.000 description 18
- 208000014018 liver neoplasm Diseases 0.000 description 18
- 238000012360 testing method Methods 0.000 description 18
- 210000004698 lymphocyte Anatomy 0.000 description 17
- 230000007067 DNA methylation Effects 0.000 description 16
- 230000000875 corresponding effect Effects 0.000 description 15
- 239000003623 enhancer Substances 0.000 description 14
- 230000007613 environmental effect Effects 0.000 description 14
- 230000008569 process Effects 0.000 description 14
- 210000004185 liver Anatomy 0.000 description 13
- 230000015556 catabolic process Effects 0.000 description 12
- 108010034791 Heterochromatin Proteins 0.000 description 11
- 102100038970 Histone-lysine N-methyltransferase EZH2 Human genes 0.000 description 11
- 101000882127 Homo sapiens Histone-lysine N-methyltransferase EZH2 Proteins 0.000 description 11
- 210000004458 heterochromatin Anatomy 0.000 description 11
- 108010022894 Euchromatin Proteins 0.000 description 10
- 101000584499 Homo sapiens Polycomb protein SUZ12 Proteins 0.000 description 10
- 102100030702 Polycomb protein SUZ12 Human genes 0.000 description 10
- ISAKRJDGNUQOIC-UHFFFAOYSA-N Uracil Chemical compound O=C1C=CNC(=O)N1 ISAKRJDGNUQOIC-UHFFFAOYSA-N 0.000 description 10
- 230000032683 aging Effects 0.000 description 10
- 230000006399 behavior Effects 0.000 description 10
- 210000000349 chromosome Anatomy 0.000 description 10
- 210000000632 euchromatin Anatomy 0.000 description 10
- 238000007637 random forest analysis Methods 0.000 description 10
- 230000008827 biological function Effects 0.000 description 9
- 239000012472 biological sample Substances 0.000 description 9
- 230000008859 change Effects 0.000 description 9
- 210000002510 keratinocyte Anatomy 0.000 description 9
- 238000012545 processing Methods 0.000 description 9
- 108010000597 Polycomb Repressive Complex 2 Proteins 0.000 description 8
- 102000002272 Polycomb Repressive Complex 2 Human genes 0.000 description 8
- 230000017858 demethylation Effects 0.000 description 8
- 238000010520 demethylation reaction Methods 0.000 description 8
- 238000011161 development Methods 0.000 description 8
- 230000018109 developmental process Effects 0.000 description 8
- 238000003745 diagnosis Methods 0.000 description 8
- 230000014509 gene expression Effects 0.000 description 8
- 239000000463 material Substances 0.000 description 8
- 208000005623 Carcinogenesis Diseases 0.000 description 7
- 108700029231 Developmental Genes Proteins 0.000 description 7
- 230000005540 biological transmission Effects 0.000 description 7
- 210000004369 blood Anatomy 0.000 description 7
- 239000008280 blood Substances 0.000 description 7
- 230000036952 cancer formation Effects 0.000 description 7
- 231100000504 carcinogenesis Toxicity 0.000 description 7
- 230000002759 chromosomal effect Effects 0.000 description 7
- 238000001514 detection method Methods 0.000 description 7
- 230000005283 ground state Effects 0.000 description 7
- 238000003752 polymerase chain reaction Methods 0.000 description 7
- 108010001202 Cytochrome P-450 CYP2E1 Proteins 0.000 description 6
- 102100024889 Cytochrome P450 2E1 Human genes 0.000 description 6
- 102100026559 Filamin-B Human genes 0.000 description 6
- 101000913551 Homo sapiens Filamin-B Proteins 0.000 description 6
- 230000033228 biological regulation Effects 0.000 description 6
- 238000005516 engineering process Methods 0.000 description 6
- 230000001747 exhibiting effect Effects 0.000 description 6
- 238000002474 experimental method Methods 0.000 description 6
- 238000011002 quantification Methods 0.000 description 6
- 230000001105 regulatory effect Effects 0.000 description 6
- 238000012549 training Methods 0.000 description 6
- 230000007704 transition Effects 0.000 description 6
- 108010014064 CCCTC-Binding Factor Proteins 0.000 description 5
- 101150078651 Epha4 gene Proteins 0.000 description 5
- 102100021616 Ephrin type-A receptor 4 Human genes 0.000 description 5
- 101000781955 Homo sapiens Proto-oncogene Wnt-1 Proteins 0.000 description 5
- 102100027671 Transcriptional repressor CTCF Human genes 0.000 description 5
- 102000052547 Wnt-1 Human genes 0.000 description 5
- 239000011324 bead Substances 0.000 description 5
- 210000004958 brain cell Anatomy 0.000 description 5
- 230000000694 effects Effects 0.000 description 5
- 239000011159 matrix material Substances 0.000 description 5
- 230000002829 reductive effect Effects 0.000 description 5
- 230000008521 reorganization Effects 0.000 description 5
- 230000007306 turnover Effects 0.000 description 5
- 229940035893 uracil Drugs 0.000 description 5
- KXSKAZFMTGADIV-UHFFFAOYSA-N 2-[3-(2-hydroxyethoxy)propoxy]ethanol Chemical compound OCCOCCCOCCO KXSKAZFMTGADIV-UHFFFAOYSA-N 0.000 description 4
- 201000000046 Beckwith-Wiedemann syndrome Diseases 0.000 description 4
- 101000693243 Homo sapiens Paternally-expressed gene 3 protein Proteins 0.000 description 4
- 101000740205 Homo sapiens Sal-like protein 1 Proteins 0.000 description 4
- 101001123859 Homo sapiens Sialidase-1 Proteins 0.000 description 4
- 101000616761 Homo sapiens Single-minded homolog 2 Proteins 0.000 description 4
- 101000818631 Homo sapiens Zinc finger imprinted 2 Proteins 0.000 description 4
- 102100025757 Paternally-expressed gene 3 protein Human genes 0.000 description 4
- 102100037204 Sal-like protein 1 Human genes 0.000 description 4
- 102100021825 Single-minded homolog 2 Human genes 0.000 description 4
- 102100021114 Zinc finger imprinted 2 Human genes 0.000 description 4
- 239000000090 biomarker Substances 0.000 description 4
- 238000004364 calculation method Methods 0.000 description 4
- 238000004113 cell culture Methods 0.000 description 4
- 238000006243 chemical reaction Methods 0.000 description 4
- 238000005265 energy consumption Methods 0.000 description 4
- 230000036541 health Effects 0.000 description 4
- XEBWQGVWTUSTLN-UHFFFAOYSA-M phenylmercury acetate Chemical compound CC(=O)O[Hg]C1=CC=CC=C1 XEBWQGVWTUSTLN-UHFFFAOYSA-M 0.000 description 4
- 108700028369 Alleles Proteins 0.000 description 3
- 238000012935 Averaging Methods 0.000 description 3
- 102100021820 E3 ubiquitin-protein ligase RNF4 Human genes 0.000 description 3
- 102100037060 Forkhead box protein D3 Human genes 0.000 description 3
- 101000876352 Homo sapiens Alpha-endosulfine Proteins 0.000 description 3
- 101001107086 Homo sapiens E3 ubiquitin-protein ligase RNF4 Proteins 0.000 description 3
- 101001029308 Homo sapiens Forkhead box protein D3 Proteins 0.000 description 3
- 101000836190 Homo sapiens SNRPN upstream reading frame protein Proteins 0.000 description 3
- 108091036059 MESTIT1 (gene) Proteins 0.000 description 3
- 108091028043 Nucleic acid sequence Proteins 0.000 description 3
- 108091034117 Oligonucleotide Proteins 0.000 description 3
- 210000001744 T-lymphocyte Anatomy 0.000 description 3
- 230000003321 amplification Effects 0.000 description 3
- 238000004422 calculation algorithm Methods 0.000 description 3
- 238000000546 chi-square test Methods 0.000 description 3
- 230000001186 cumulative effect Effects 0.000 description 3
- 230000003247 decreasing effect Effects 0.000 description 3
- 230000004069 differentiation Effects 0.000 description 3
- 238000011156 evaluation Methods 0.000 description 3
- 210000004602 germ cell Anatomy 0.000 description 3
- 238000010801 machine learning Methods 0.000 description 3
- 238000003199 nucleic acid amplification method Methods 0.000 description 3
- 102000039446 nucleic acids Human genes 0.000 description 3
- 108020004707 nucleic acids Proteins 0.000 description 3
- 150000007523 nucleic acids Chemical class 0.000 description 3
- 210000004940 nucleus Anatomy 0.000 description 3
- 210000003819 peripheral blood mononuclear cell Anatomy 0.000 description 3
- 230000001737 promoting effect Effects 0.000 description 3
- 238000003908 quality control method Methods 0.000 description 3
- 241000894007 species Species 0.000 description 3
- 238000009966 trimming Methods 0.000 description 3
- GUAHPAJOXVYFON-ZETCQYMHSA-N (8S)-8-amino-7-oxononanoic acid zwitterion Chemical compound C[C@H](N)C(=O)CCCCCC(O)=O GUAHPAJOXVYFON-ZETCQYMHSA-N 0.000 description 2
- 102100022144 Achaete-scute homolog 2 Human genes 0.000 description 2
- 102100036092 Alpha-endosulfine Human genes 0.000 description 2
- 208000001333 Colorectal Neoplasms Diseases 0.000 description 2
- 108700039691 Genetic Promoter Regions Proteins 0.000 description 2
- 101000901109 Homo sapiens Achaete-scute homolog 2 Proteins 0.000 description 2
- 101000931098 Homo sapiens DNA (cytosine-5)-methyltransferase 1 Proteins 0.000 description 2
- 101000968674 Homo sapiens MutS protein homolog 4 Proteins 0.000 description 2
- 101000711846 Homo sapiens Transcription factor SOX-9 Proteins 0.000 description 2
- 108091036429 KCNQ1OT1 Proteins 0.000 description 2
- 102100025825 Methylated-DNA-protein-cysteine methyltransferase Human genes 0.000 description 2
- 238000011529 RT qPCR Methods 0.000 description 2
- 102100028760 Sialidase-1 Human genes 0.000 description 2
- 102100034803 Small nuclear ribonucleoprotein-associated protein N Human genes 0.000 description 2
- 102100034204 Transcription factor SOX-9 Human genes 0.000 description 2
- 230000019552 anatomical structure morphogenesis Effects 0.000 description 2
- 238000003556 assay Methods 0.000 description 2
- 230000008901 benefit Effects 0.000 description 2
- 238000001574 biopsy Methods 0.000 description 2
- 210000005013 brain tissue Anatomy 0.000 description 2
- 230000032823 cell division Effects 0.000 description 2
- 238000013145 classification model Methods 0.000 description 2
- 238000004891 communication Methods 0.000 description 2
- 230000000052 comparative effect Effects 0.000 description 2
- OPTASPLRGRRNAP-UHFFFAOYSA-N cytosine Chemical compound NC=1C=CNC(=O)N=1 OPTASPLRGRRNAP-UHFFFAOYSA-N 0.000 description 2
- 230000001419 dependent effect Effects 0.000 description 2
- 230000008995 epigenetic change Effects 0.000 description 2
- 239000012634 fragment Substances 0.000 description 2
- 239000000499 gel Substances 0.000 description 2
- 108091008053 gene clusters Proteins 0.000 description 2
- 230000030279 gene silencing Effects 0.000 description 2
- 210000001654 germ layer Anatomy 0.000 description 2
- PCHJSUWPFVWCPO-UHFFFAOYSA-N gold Chemical compound [Au] PCHJSUWPFVWCPO-UHFFFAOYSA-N 0.000 description 2
- 239000010931 gold Substances 0.000 description 2
- 229910052737 gold Inorganic materials 0.000 description 2
- 238000009499 grossing Methods 0.000 description 2
- 150000002500 ions Chemical class 0.000 description 2
- 230000007040 lung development Effects 0.000 description 2
- 230000004199 lung function Effects 0.000 description 2
- 238000005259 measurement Methods 0.000 description 2
- 230000001394 metastastic effect Effects 0.000 description 2
- 206010061289 metastatic neoplasm Diseases 0.000 description 2
- 108040008770 methylated-DNA-[protein]-cysteine S-methyltransferase activity proteins Proteins 0.000 description 2
- 239000000203 mixture Substances 0.000 description 2
- 239000002773 nucleotide Substances 0.000 description 2
- 230000021715 photosynthesis, light harvesting Effects 0.000 description 2
- 238000011176 pooling Methods 0.000 description 2
- 230000004481 post-translational protein modification Effects 0.000 description 2
- 210000002442 prefrontal cortex Anatomy 0.000 description 2
- 238000002360 preparation method Methods 0.000 description 2
- 238000003753 real-time PCR Methods 0.000 description 2
- 238000011160 research Methods 0.000 description 2
- 238000010206 sensitivity analysis Methods 0.000 description 2
- 238000000926 separation method Methods 0.000 description 2
- 210000003491 skin Anatomy 0.000 description 2
- 108010039827 snRNP Core Proteins Proteins 0.000 description 2
- 238000007619 statistical method Methods 0.000 description 2
- 230000023895 stem cell maintenance Effects 0.000 description 2
- 230000000153 supplemental effect Effects 0.000 description 2
- 238000011144 upstream manufacturing Methods 0.000 description 2
- 238000012800 visualization Methods 0.000 description 2
- 241000283690 Bos taurus Species 0.000 description 1
- 102000038594 Cdh1/Fizzy-related Human genes 0.000 description 1
- 108091007854 Cdh1/Fizzy-related Proteins 0.000 description 1
- 241000282693 Cercopithecidae Species 0.000 description 1
- 238000001353 Chip-sequencing Methods 0.000 description 1
- 108010009540 DNA (Cytosine-5-)-Methyltransferase 1 Proteins 0.000 description 1
- 102100036279 DNA (cytosine-5)-methyltransferase 1 Human genes 0.000 description 1
- 102100024812 DNA (cytosine-5)-methyltransferase 3A Human genes 0.000 description 1
- 102100024810 DNA (cytosine-5)-methyltransferase 3B Human genes 0.000 description 1
- 101710123222 DNA (cytosine-5)-methyltransferase 3B Proteins 0.000 description 1
- 108010024491 DNA Methyltransferase 3A Proteins 0.000 description 1
- 230000005778 DNA damage Effects 0.000 description 1
- 231100000277 DNA damage Toxicity 0.000 description 1
- 238000007399 DNA isolation Methods 0.000 description 1
- 230000004543 DNA replication Effects 0.000 description 1
- 239000006144 Dulbecco’s modified Eagle's medium Substances 0.000 description 1
- 241000282326 Felis catus Species 0.000 description 1
- 229920001917 Ficoll Polymers 0.000 description 1
- 238000000729 Fisher's exact test Methods 0.000 description 1
- 102100027570 Forkhead box protein Q1 Human genes 0.000 description 1
- 208000032612 Glial tumor Diseases 0.000 description 1
- 206010018338 Glioma Diseases 0.000 description 1
- 108700005087 Homeobox Genes Proteins 0.000 description 1
- 102100021090 Homeobox protein Hox-A9 Human genes 0.000 description 1
- 102100028096 Homeobox protein Nkx-6.2 Human genes 0.000 description 1
- 102100030636 Homeobox protein OTX1 Human genes 0.000 description 1
- 101000861406 Homo sapiens Forkhead box protein Q1 Proteins 0.000 description 1
- 101000578258 Homo sapiens Homeobox protein Nkx-6.2 Proteins 0.000 description 1
- 101000584392 Homo sapiens Homeobox protein OTX1 Proteins 0.000 description 1
- 101000599778 Homo sapiens Insulin-like growth factor 2 mRNA-binding protein 1 Proteins 0.000 description 1
- 101001006887 Homo sapiens Kelch-like protein 21 Proteins 0.000 description 1
- 101001005097 Homo sapiens LIM domain-containing protein 2 Proteins 0.000 description 1
- 101000804764 Homo sapiens Lymphotactin Proteins 0.000 description 1
- 101000629400 Homo sapiens Mesoderm-specific transcript homolog protein Proteins 0.000 description 1
- 101000615488 Homo sapiens Methyl-CpG-binding domain protein 2 Proteins 0.000 description 1
- 101001071240 Homo sapiens PHD finger protein 13 Proteins 0.000 description 1
- 101000890333 Homo sapiens THAP domain-containing protein 3 Proteins 0.000 description 1
- 206010020751 Hypersensitivity Diseases 0.000 description 1
- 102100037924 Insulin-like growth factor 2 mRNA-binding protein 1 Human genes 0.000 description 1
- 102100027799 Kelch-like protein 21 Human genes 0.000 description 1
- 108010084772 LIM Domain Proteins Proteins 0.000 description 1
- 102000005633 LIM Domain Proteins Human genes 0.000 description 1
- 102100026030 LIM domain-containing protein 2 Human genes 0.000 description 1
- 102100035304 Lymphotactin Human genes 0.000 description 1
- 102100026821 Mesoderm-specific transcript homolog protein Human genes 0.000 description 1
- 102100021299 Methyl-CpG-binding domain protein 2 Human genes 0.000 description 1
- 102000016397 Methyltransferase Human genes 0.000 description 1
- 108060004795 Methyltransferase Proteins 0.000 description 1
- 102100021157 MutS protein homolog 4 Human genes 0.000 description 1
- 206010061309 Neoplasm progression Diseases 0.000 description 1
- 108010047956 Nucleosomes Proteins 0.000 description 1
- 241000283973 Oryctolagus cuniculus Species 0.000 description 1
- 102100036867 PHD finger protein 13 Human genes 0.000 description 1
- 102100026459 POU domain, class 3, transcription factor 2 Human genes 0.000 description 1
- 101710133394 POU domain, class 3, transcription factor 2 Proteins 0.000 description 1
- 102100026456 POU domain, class 3, transcription factor 3 Human genes 0.000 description 1
- 101710133393 POU domain, class 3, transcription factor 3 Proteins 0.000 description 1
- 241000009328 Perro Species 0.000 description 1
- 102000012425 Polycomb-Group Proteins Human genes 0.000 description 1
- 108010022429 Polycomb-Group Proteins Proteins 0.000 description 1
- 102100040039 THAP domain-containing protein 3 Human genes 0.000 description 1
- 102000044209 Tumor Suppressor Genes Human genes 0.000 description 1
- 108700025716 Tumor Suppressor Genes Proteins 0.000 description 1
- 102000006275 Ubiquitin-Protein Ligases Human genes 0.000 description 1
- 108010083111 Ubiquitin-Protein Ligases Proteins 0.000 description 1
- 239000011543 agarose gel Substances 0.000 description 1
- 230000029936 alkylation Effects 0.000 description 1
- 238000005804 alkylation reaction Methods 0.000 description 1
- 208000026935 allergic disease Diseases 0.000 description 1
- 238000002669 amniocentesis Methods 0.000 description 1
- 230000003466 anti-cipated effect Effects 0.000 description 1
- 230000001042 autoregulative effect Effects 0.000 description 1
- 230000002902 bimodal effect Effects 0.000 description 1
- 239000012620 biological material Substances 0.000 description 1
- 230000015572 biosynthetic process Effects 0.000 description 1
- 210000001124 body fluid Anatomy 0.000 description 1
- 210000000988 bone and bone Anatomy 0.000 description 1
- 230000011712 cell development Effects 0.000 description 1
- 230000024245 cell differentiation Effects 0.000 description 1
- 230000003915 cell function Effects 0.000 description 1
- 230000010261 cell growth Effects 0.000 description 1
- 230000009087 cell motility Effects 0.000 description 1
- 230000001413 cellular effect Effects 0.000 description 1
- 210000003169 central nervous system Anatomy 0.000 description 1
- 210000001175 cerebrospinal fluid Anatomy 0.000 description 1
- 238000000205 computational method Methods 0.000 description 1
- 230000001276 controlling effect Effects 0.000 description 1
- 238000012937 correction Methods 0.000 description 1
- 230000002596 correlated effect Effects 0.000 description 1
- 238000002790 cross-validation Methods 0.000 description 1
- 210000004748 cultured cell Anatomy 0.000 description 1
- 230000021953 cytokinesis Effects 0.000 description 1
- 229940104302 cytosine Drugs 0.000 description 1
- 238000007405 data analysis Methods 0.000 description 1
- 230000002939 deleterious effect Effects 0.000 description 1
- 238000009795 derivation Methods 0.000 description 1
- 210000003981 ectoderm Anatomy 0.000 description 1
- 230000002500 effect on skin Effects 0.000 description 1
- -1 elements Substances 0.000 description 1
- 210000001671 embryonic stem cell Anatomy 0.000 description 1
- 210000002257 embryonic structure Anatomy 0.000 description 1
- 210000001900 endoderm Anatomy 0.000 description 1
- 230000002255 enzymatic effect Effects 0.000 description 1
- 230000006718 epigenetic regulation Effects 0.000 description 1
- 230000009786 epithelial differentiation Effects 0.000 description 1
- 230000029142 excretion Effects 0.000 description 1
- 210000003608 fece Anatomy 0.000 description 1
- 230000012953 feeding on blood of other organism Effects 0.000 description 1
- 230000001605 fetal effect Effects 0.000 description 1
- 238000000684 flow cytometry Methods 0.000 description 1
- 230000002431 foraging effect Effects 0.000 description 1
- 238000007672 fourth generation sequencing Methods 0.000 description 1
- 239000012520 frozen sample Substances 0.000 description 1
- 230000004927 fusion Effects 0.000 description 1
- 238000012226 gene silencing method Methods 0.000 description 1
- 230000002068 genetic effect Effects 0.000 description 1
- 230000007614 genetic variation Effects 0.000 description 1
- 238000010362 genome editing Methods 0.000 description 1
- 210000004209 hair Anatomy 0.000 description 1
- 108010027263 homeobox protein HOXA9 Proteins 0.000 description 1
- 230000003284 homeostatic effect Effects 0.000 description 1
- 230000009610 hypersensitivity Effects 0.000 description 1
- 230000003832 immune regulation Effects 0.000 description 1
- 230000010365 information processing Effects 0.000 description 1
- 230000002401 inhibitory effect Effects 0.000 description 1
- 230000010354 integration Effects 0.000 description 1
- 230000003993 interaction Effects 0.000 description 1
- 238000011835 investigation Methods 0.000 description 1
- 210000000265 leukocyte Anatomy 0.000 description 1
- 230000000670 limiting effect Effects 0.000 description 1
- 210000005229 liver cell Anatomy 0.000 description 1
- 230000004807 localization Effects 0.000 description 1
- 238000007477 logistic regression Methods 0.000 description 1
- 230000005923 long-lasting effect Effects 0.000 description 1
- 210000002751 lymph Anatomy 0.000 description 1
- 238000002826 magnetic-activated cell sorting Methods 0.000 description 1
- 230000005415 magnetization Effects 0.000 description 1
- 230000036210 malignancy Effects 0.000 description 1
- 238000004519 manufacturing process Methods 0.000 description 1
- 230000007246 mechanism Effects 0.000 description 1
- 239000002609 medium Substances 0.000 description 1
- 210000003716 mesoderm Anatomy 0.000 description 1
- 238000010197 meta-analysis Methods 0.000 description 1
- 230000033607 mismatch repair Effects 0.000 description 1
- 230000004048 modification Effects 0.000 description 1
- 230000008450 motivation Effects 0.000 description 1
- 238000013188 needle biopsy Methods 0.000 description 1
- 230000001537 neural effect Effects 0.000 description 1
- 230000007372 neural signaling Effects 0.000 description 1
- 230000004766 neurogenesis Effects 0.000 description 1
- 210000002569 neuron Anatomy 0.000 description 1
- 230000007996 neuronal plasticity Effects 0.000 description 1
- 210000001623 nucleosome Anatomy 0.000 description 1
- 125000003729 nucleotide group Chemical group 0.000 description 1
- 238000005457 optimization Methods 0.000 description 1
- 210000005259 peripheral blood Anatomy 0.000 description 1
- 239000011886 peripheral blood Substances 0.000 description 1
- 230000002093 peripheral effect Effects 0.000 description 1
- 210000001428 peripheral nervous system Anatomy 0.000 description 1
- 210000002381 plasma Anatomy 0.000 description 1
- 210000001778 pluripotent stem cell Anatomy 0.000 description 1
- 239000002243 precursor Substances 0.000 description 1
- 230000000750 progressive effect Effects 0.000 description 1
- 230000000135 prohibitive effect Effects 0.000 description 1
- 230000000644 propagated effect Effects 0.000 description 1
- 230000002685 pulmonary effect Effects 0.000 description 1
- 238000000746 purification Methods 0.000 description 1
- 239000002096 quantum dot Substances 0.000 description 1
- 230000009467 reduction Effects 0.000 description 1
- 230000015660 regulation of neurogenesis Effects 0.000 description 1
- 230000008439 repair process Effects 0.000 description 1
- 230000004044 response Effects 0.000 description 1
- 210000003296 saliva Anatomy 0.000 description 1
- 238000005070 sampling Methods 0.000 description 1
- 230000009919 sequestration Effects 0.000 description 1
- 210000002966 serum Anatomy 0.000 description 1
- 230000011664 signaling Effects 0.000 description 1
- 238000007390 skin biopsy Methods 0.000 description 1
- 238000005309 stochastic process Methods 0.000 description 1
- 239000000758 substrate Substances 0.000 description 1
- 238000001356 surgical procedure Methods 0.000 description 1
- 230000000946 synaptic effect Effects 0.000 description 1
- 210000001138 tear Anatomy 0.000 description 1
- 238000007671 third-generation sequencing Methods 0.000 description 1
- 230000002103 transcriptional effect Effects 0.000 description 1
- 230000009261 transgenic effect Effects 0.000 description 1
- 210000004881 tumor cell Anatomy 0.000 description 1
- 230000005751 tumor progression Effects 0.000 description 1
- 238000009827 uniform distribution Methods 0.000 description 1
Images


Classifications
-
- G—PHYSICS
- G16—INFORMATION AND COMMUNICATION TECHNOLOGY [ICT] SPECIALLY ADAPTED FOR SPECIFIC APPLICATION FIELDS
- G16B—BIOINFORMATICS, i.e. INFORMATION AND COMMUNICATION TECHNOLOGY [ICT] SPECIALLY ADAPTED FOR GENETIC OR PROTEIN-RELATED DATA PROCESSING IN COMPUTATIONAL MOLECULAR BIOLOGY
- G16B20/00—ICT specially adapted for functional genomics or proteomics, e.g. genotype-phenotype associations
- G16B20/20—Allele or variant detection, e.g. single nucleotide polymorphism [SNP] detection
-
- G—PHYSICS
- G16—INFORMATION AND COMMUNICATION TECHNOLOGY [ICT] SPECIALLY ADAPTED FOR SPECIFIC APPLICATION FIELDS
- G16B—BIOINFORMATICS, i.e. INFORMATION AND COMMUNICATION TECHNOLOGY [ICT] SPECIALLY ADAPTED FOR GENETIC OR PROTEIN-RELATED DATA PROCESSING IN COMPUTATIONAL MOLECULAR BIOLOGY
- G16B20/00—ICT specially adapted for functional genomics or proteomics, e.g. genotype-phenotype associations
- G16B20/30—Detection of binding sites or motifs
-
- G—PHYSICS
- G16—INFORMATION AND COMMUNICATION TECHNOLOGY [ICT] SPECIALLY ADAPTED FOR SPECIFIC APPLICATION FIELDS
- G16B—BIOINFORMATICS, i.e. INFORMATION AND COMMUNICATION TECHNOLOGY [ICT] SPECIALLY ADAPTED FOR GENETIC OR PROTEIN-RELATED DATA PROCESSING IN COMPUTATIONAL MOLECULAR BIOLOGY
- G16B40/00—ICT specially adapted for biostatistics; ICT specially adapted for bioinformatics-related machine learning or data mining, e.g. knowledge discovery or pattern finding
Definitions
- the invention relates generally to epigenetics and more specifically to methods and a system for analysis and classification of the epigenome in health and disease.
- Waddington used the language of ordinary differential equations, including the notion of an "attractor", to describe the robustness of deterministic phenotypic endpoints to environmental perturbations, which he believed to be entirely governed by DNA sequence and genes.
- an "attractor” to describe the robustness of deterministic phenotypic endpoints to environmental perturbations, which he believed to be entirely governed by DNA sequence and genes.
- a growing appreciation for the role that stochasticity and uncertainty play in development and epigenetics has led to relatively simple probabilistic models that take into account epigenetic uncertainty by adding a "noise" term to deterministic models or probabilistically modelling methylation sites independently.
- the invention provides a method for performing epigenetic analysis as claimed in claim 1 that includes calculating an epigenetic potential energy landscape (PEL), or the corresponding joint probability distribution, of a genomic region within one or more genomic samples.
- PEL epigenetic potential energy landscape
- Calculating the PEL includes: a) partitioning a genome into discrete genomic regions; b) analyzing the methylation status within a genomic region by fitting a parametric statistical model (hereafter referred to as The Model) to methylation data that takes into account dependence among the methylation states at individual methylation sites, with the number of parameters of The Model growing slower than geometrically in the number of methylation sites inside the region; and c) computing and analyzing a PEL, or the corresponding joint probability distribution, within the genomic region and/or its subregions and/or merged super-regions, thereby performing epigenetic analysis.
- the Model parametric statistical model
- a method for performing epigenetic analysis that includes the computation and analysis of the average methylation status of a genome.
- the method includes: a) partitioning the genome into discrete genomic regions; b) analyzing the methylation status within a genomic region by fitting The Model to methylation data; and c) quantifying the average methylation status of the genomic region and/or its subregions and/or merged super-regions, thereby performing epigenetic analysis.
- Also disclosed is a method for performing epigenetic analysis that includes the computation and analysis of the epigenetic uncertainty of a genome.
- the analysis includes: a) partitioning the genome into discrete genomic regions; b) analyzing the methylation status within a genomic region by fitting The Model to methylation data; and c) quantifying methylation uncertainty of the genomic region and/or its subregions and/or merged super-regions, thereby performing epigenetic analysis.
- Also disclosed is a method for performing epigenetic analysis that includes the analysis of epigenetic discordance between a first genome and a second genome (including but not limited to the analysis of epigenetic discordance between a normal and a diseased state, such as cancer, with genomes procured from one or more patients).
- the analysis includes: a) partitioning the first and the second genome into discrete genomic regions; b) analyzing the methylation statuses within a genomic region of the first and the second genomes by fitting The Model to methylation data in each genome; and c) quantifying a difference and/or distance between the probability distributions and/or quantities derived therefrom for the genomic region and/or its subregions and/or merged super-regions between the first and second genomes; thereby performing epigenetic analysis.
- a method for performing epigenetic analysis that includes detecting the skewness and/or bimodality of the probability distribution of the methylation level and classifying the average methylation status of a genomic region into discrete classes, including bistability.
- Detection and classification includes: a) partitioning the genome into discrete genomic regions; b) analyzing the methylation status within a genomic region by fitting The Model to methylation data; and c) detecting the skewness and/or bimodality of the probability distribution of the methylation level and classifying the average methylation status of a genomic region into discrete classes, including bistability, thereby performing epigenetic analysis.
- a method for performing epigenetic analysis that includes classifying methylation uncertainty within a genomic region into discrete classes.
- Classification includes: a) partitioning the genome into discrete genomic regions; b) analyzing the methylation status within a genomic region by fitting The Model to methylation data; and c) classifying the methylation uncertainty of a genomic region into discrete classes, thereby performing epigenetic analysis.
- Also disclosed is a method for performing epigenetic analysis that includes the computation of methylation regions and methylation blocks.
- Computation includes: a) partitioning the genome into discrete genomic regions; b) analyzing the methylation status within a genomic region by fitting The Model to methylation data; c) classifying the methylation status of genomic regions across the entire genome; and d) grouping the classification results into methylation regions and methylation blocks, thereby performing epigenetic analysis.
- Also disclosed is a method for performing epigenetic analysis that includes the computation of entropy regions and entropy blocks.
- Computation includes: a) partitioning the genome into discrete genomic regions; b) analyzing the methylation status within a genomic region by fitting The Model to methylation data; c) classifying the methylation uncertainty of genomic regions across the entire genome; and d) grouping the classification results into entropy regions and entropy blocks, thereby performing epigenetic analysis.
- Also disclosed is a method for performing epigenetic analysis that includes the calculation of informational properties of epigenetic maintenance through methylation channels.
- the analysis includes: a) partitioning the genome into discrete genomic regions; b) analyzing the methylation status within a genomic region by fitting The Model to methylation data; and c) quantifying the informational properties of epigenetic maintenance (including but not limited to the capacity and relative dissipated energy of methylation channels) of a genomic region and/or its subregions and/or merged super-regions, thereby performing epigenetic analysis.
- Also disclosed is a method for performing epigenetic analysis that includes computing the sensitivity to perturbations of informational/statistical properties (including but not limited to entropy) of the methylation system within a genomic region and/or its subregions and/or merged super-regions.
- the analysis includes: a) partitioning a genome into discrete genomic regions; b) analyzing the methylation status within a genomic region by fitting The Model to methylation data; and c) quantifying the sensitivity to perturbations of informational/statistical properties (including but not limited to entropy) of the methylation system within the genomic region and/or its subregions and/or merged super-regions, thereby performing epigenetic analysis.
- Also disclosed is a method for performing epigenetic analysis that includes identifying genomic features (including but not limited to gene promoters) in a genome that exhibit high entropic sensitivity or large differences in entropic sensitivity between a first genome and a second genome (including but not limited to between a normal and a diseased state, such as cancer, with genomes procured from one or more patients).
- genomic features including but not limited to gene promoters
- a second genome including but not limited to between a normal and a diseased state, such as cancer, with genomes procured from one or more patients.
- the analysis includes: a) partitioning the first and second genomes into discrete genomic regions; b) analyzing the methylation status within a genomic region by fitting The Model to methylation data; and c) identifying genomic features (including but not limited to gene promoters) in a genome that exhibit high entropic sensitivity or large differences in entropic sensitivity between a first genome and a second genome (including but not limited to between a normal and a diseased state, such as cancer, with genomes procured from one or more patients).
- genomic features including but not limited to gene promoters
- Also disclosed is a method for performing epigenetic analysis that identifies genomic features (including but not limited to gene promoters) with potentially important biological functions (including but not limited to regulation of normal versus diseased states, such as cancer) occult to mean-based analysis, while exhibiting higher-order statistical differences (including but not limited to entropy or information distances) in the methylation states between a first genome and a second genome.
- Identification includes: a) partitioning the first and second genomes into discrete genomic regions; b) analyzing the methylation status within a genomic region for the first and second genome by fitting The Model to methylation data in each genome; and c) identifying genomic features (including but not limited to gene promoters) with relatively low mean differences but relatively high epigenetic differences in higher-order statistical quantities (including but not limited to entropy or informational distances) between the first and the second genome, thereby performing epigenetic analysis.
- Also disclosed is a method for performing epigenetic analysis that identifies relationships between bistability in methylation and genomic features (including but not limited to gene promoters) with potentially important biological function.
- the analysis includes: a) partitioning the genomes of one or more genomic samples into discrete genomic regions; b) analyzing the methylation status within a genomic region by fitting The Model to methylation data; and c) identifying genomic features (including but not limited to gene promoters) associated with high amounts of bistability in their methylation status in one or more genomic samples and relating them to potentially important biological function, thereby performing epigenetic analysis.
- Detection includes: a) partitioning the genomes of one or more genomic samples into discrete genomic regions; b) analyzing the methylation status within a genomic region of each genome by fitting The Model to methylation data; and c) locating TAD boundaries, thereby performing epigenetic analysis.
- a method for performing epigenetic analysis based on predicting euchromatin/heterochromatin domains (including but not limited to compartments A and B) from methylation data includes: a) partitioning the genome into discrete genomic regions; b) analyzing the methylation status within a genomic region by fitting The Model to the methylation data; and c) combining results from multiple regions to estimate the euchromatin/heterochromatin domains (including but not limited to A/B compartment organization) using a regression or classification model trained on data for which A/B euchromatin/heterochromatin domain information has been previously measured or estimated, thereby performing epigenetic analysis.
- Also disclosed is a method for performing epigenetic analysis that includes identifying genomic features (including but not limited to gene promoters) for which a change in euchromatin/heterochromatin structure (including but not limited to compartments A and B) is observed between a first genome and a second genome (including but not limited to between a normal and a diseased state, such as cancer, with genomes procured from one or more patients).
- genomic features including but not limited to gene promoters
- a change in euchromatin/heterochromatin structure including but not limited to compartments A and B
- a second genome including but not limited to between a normal and a diseased state, such as cancer, with genomes procured from one or more patients.
- the analysis includes: a) partitioning the first and second genomes into discrete genomic regions; b) analyzing the methylation status within a genomic region by fitting The Model to methylation data; and c) identifying genomic features (including but not limited to gene promoters) for which a change in euchromatin/heterochromatin structure (including but not limited to compartments A and B) is observed between a first genome and a second genome (including but not limited to between a normal and a diseased state, such as cancer, with genomes procured from one or more patients).
- genomic features including but not limited to gene promoters
- a change in euchromatin/heterochromatin structure including but not limited to compartments A and B
- the invention provides a non-transitory computer readable storage medium encoded with a computer program.
- the program includes instructions that, when executed by one or more processors, cause the one or more processors to perform operations that implement the method of claims 1-10.
- the system includes a memory, and one or more processors coupled to the memory, with the one or more processors being configured to perform operations that implement the method of the disclosure.
- the present invention is based on innovative computational methods for epigenomic analysis.
- Epigenetics is defined as genomic modifications carrying information independent of DNA sequence heritable through cell division.
- Waddington coined the term "epigenetic landscape" as a metaphor for pluripotency and differentiation, but epigenetic potential energy landscapes have not yet been rigorously defined.
- the present disclosure describes derivation of potential energy landscapes from whole genome bisulfite sequencing data, or other data sources of methylation status, which allow quantification of genome-wide methylation stochasticity and epigenetic differences using Shannon's entropy and the Jensen-Shannon distance.
- the present disclosure further discusses discovery of important developmental genes occult to previous mean-based methylation analysis and the exploration of a relationship between entropy and chromatin structure.
- Viewing methylation maintenance as a communications system methylation channels are introduced into the analytical methods and show that higher-order chromatin organization can be predicted from their informational properties.
- the results herein provide a fundamental understanding of the information-theoretic nature of the epigenome and a powerful methodology for studying its role in disease and aging.
- Methylation uncertainty is quantified genome-wide using Shannon's entropy.
- a powerful information-theoretic methodology for distinguishing epigenomes using the Jensen-Shannon distance between sample-specific potential energy landscapes associated with stem cells, tissue lineages and cancer is provided, which is used to discover important developmental genes previously occult to mean-based analysis that exhibit higher-order statistical differences in the methylation states between two genomes.
- a relationship between entropy and topologically associating domains (TADs) is also established, which allows one to efficiently predict their boundaries from individual WGBS samples.
- Methylation channels are also introduced as models of DNA methylation maintenance and show that their informational properties can be effectively used to predict higher-order chromatin organization using machine learning.
- a sensitivity index is introduced that quantifies the rate by which environmental or external perturbations influence methylation uncertainty along the genome, suggesting that genomic loci associated with high sensitivity are those most affected by such perturbations.
- the present invention provides methods of epigenetic analysis that take into account the role of stochasticity and uncertainty.
- the invention provides a method for performing epigenetic analysis that includes calculating an epigenetic potential energy landscape (PEL), or the corresponding joint probability distribution, of a genomic region within one or more genomic samples.
- PEL epigenetic potential energy landscape
- Calculating the PEL includes: a) partitioning a genome into discrete genomic regions; b) analyzing the methylation status within a genomic region by fitting a parametric statistical model (hereafter referred to as The Model) to methylation data that takes into account dependence among the methylation states at individual methylation sites, with the number of parameters of The Model growing slower than geometrically in the number of methylation sites inside the region; and c) computing and analyzing a PEL, or the corresponding joint probability distribution, within the genomic region and/or its subregions and/or merged super-regions, thereby performing epigenetic analysis.
- the Model parametric statistical model
- the Ising model provides a natural way of modeling statistically dependent binary methylation data that is consistent with observed means and pairwise correlations.
- DNA methylation is viewed as a process that reliably transmits linear strings of binary (0-1) data from a cell to its progeny in a manner that is robust to intrinsic and extrinsic stochastic biochemical fluctuations.
- the methylation state within a given genomic region containing N CpG sites is modeled by an N -dimensional binary-valued random vector X whose n -th element X n takes value 0 or 1 depending on whether or not the n -th CpG site is unmethylated or methylated, respectively.
- V X x ⁇ 0 ⁇ log P X x , for some constant ⁇ 0 , where P x ( x ) is the joint probability of a methylation state x within the genomic region.
- the potential V x ( x ) - ⁇ 0 quantifies the amount of information associated with the methylation state x, which is given by - log P x ( x ).
- Parameter a n influences the propensity of the n -th CpG site to be methylated due to non-cooperative factors, with positive a n promoting methylation and negative a n inhibiting methylation, whereas parameter c n influences the correlation between the methylation states of two consecutive CpG sites n and n - 1 due to cooperative factors, with positive c n promoting positive correlation and negative c n promoting negative correlation (anti-correlation).
- a chromosome is partitioned into relatively small and equally sized non-overlapping regions (hereafter referred to as genomic regions) whose lengths are taken to be 3000 base pairs each, a length that has been determined by striking a balance between estimation and computational performance.
- Parameter ⁇ accounts for intrinsic factors that uniformly affect CpG methylation over a genomic region, whereas parameter ⁇ modulates the influence of the CpG density on methylation.
- the previous expression for c n accounts for the expectation that correlation between the methylation of two consecutive CpG sites decays as the distance between these two sites increases, since the longer a DNMT enzyme must move along the DNA the higher is the probability of dissociating from the DNA before reaching the next CpG site.
- the PEL encapsulates the view that methylation within a genomic region depends on two distinct factors: the underlying CpG architecture of the genome at that location, quantified by the CpG density ⁇ n , defined by Equation (6) and the distance d n , given by Equation (7), whose values can be readily determined from the DNA sequence itself, as well as by the current biochemical environment in the nucleus provided by the methylation machinery, quantified by the parameters of the Ising model whose values must be estimated from available methylation data.
- regions with less than 10 CpG sites are not modeled, and the same applies for regions with not enough data for which the methylation state of less than 2/3 of the CpG sites is measured or for which the average depth of coverage is less than 2.5 observations per CpG sites.
- likelihood maximization is performed by multilevel coordinated search (MCS), a general-purpose global non-convex and derivative-free optimization algorithm.
- Equation (3) Evaluating the joint probability of a methylation state x, requires calculating the partition function Z of the Boltzmann-Gibbs distribution, which cannot be computed directly from Equation (3), since Z is expressed as a sum over a large number of distinct states that grows geometrically (as 2 N ) in the number N of CpG sites within the genomic region.
- Z Z 1 0 + Z 1 1 , where Z 1 is computed using the following recursion:
- Z n 1 ⁇ n 1,0 Z n + 1 0 + ⁇ n 1,1 Z n + 1 1
- n N ⁇ 1 , N ⁇ 2 , ... , 1
- genomic subregions small and equally sized non-overlapping regions (hereafter referred to as genomic subregions) of 150 base pairs each and methylation analysis is performed at a resolution of one genomic subregion.
- L the fraction of methylated CpG sites within a genomic subregion
- a method for performing epigenetic analysis that includes the computation and analysis of the average methylation status of a genome.
- the method includes: a) partitioning the genome into discrete genomic regions; b) analyzing the methylation status within a genomic region by fitting The Model to methylation data; and c) quantifying the average methylation status of the genomic region and/or its subregions and/or merged super-regions, thereby performing epigenetic analysis.
- the probability P n (1) is computed from the probability distribution P x ( x ) of the methylation state within the genomic subregion by marginalization.
- the MML is an effective measure of methylation status that can be reliably computed genome-wide from low coverage methylation data using the Ising model. Moreover, distributions of MML values can be computed over selected genomic features (e.g., CpG islands, island shores, shelves, open sea, exons, introns, gene promoters, and the like), thus providing a genome-wide breakdown of methylation uncertainty showing lower or higher levels of methylation within said genomic features of a first genome as compared to a second genome.
- genomic features e.g., CpG islands, island shores, shelves, open sea, exons, introns, gene promoters, and the like
- Also disclosed is a method for performing epigenetic analysis that includes the computation and analysis of the epigenetic uncertainty of a genome.
- the analysis includes: a) partitioning the genome into discrete genomic regions; b) analyzing the methylation status within a genomic region by fitting The Model to methylation data; and c) quantifying methylation uncertainty of the genomic region and/or its subregions and/or merged super-regions, thereby performing epigenetic analysis.
- NME normalized methylation entropy
- the NME is an effective measure of methylation uncertainty that can be reliably computed genome-wide from low coverage methylation data using the Ising model. Moreover, distributions of NME values can be computed over selected genomic features (e.g., CpG islands, island shores, shelves, open sea, exons, introns, gene promoters, and the like), thus providing a genome-wide breakdown of methylation uncertainty showing lower or higher levels of methylation uncertainty within said genomic features of a first genome as compared to a second genome.
- genomic features e.g., CpG islands, island shores, shelves, open sea, exons, introns, gene promoters, and the like
- Also disclosed is a method for performing epigenetic analysis that includes the analysis of epigenetic discordance between a first genome and a second genome (including but not limited to the analysis of epigenetic discordance between a normal and a diseased state, such as cancer, with genomes produced from one or more patients).
- the analysis includes: a) partitioning the first and the second genome into discrete genomic regions; b) analyzing the methylation statuses within a genomic region of the first and the second genomes by fitting The Model to methylation data in each genome; and c) quantifying a difference and/or distance between the probability distributions and/or quantities derived therefrom for the genomic region and/or its subregions and/or merged super-regions between the first and second genomes; thereby performing epigenetic analysis.
- JSD Jensen-Shannon distance
- the JSD is a normalized distance metric that takes values between 0 and 1, whereas the square JSD is the average information a value of the methylation level drawn from one of the two probability distributions P or Q provides about the identity of the distribution.
- the JSD equals 0 only when the two distributions are identical and reaches its maximum value of 1 if the two distributions do not overlap and can, therefore, be perfectly distinguished from a single genomic sample.
- the JSD values between all corresponding pairs of genomic subregions are computed genome-wide, the values are ordered in increasing order, and the smallest value in the list is determined such that 90% of the distances is less than or equal to that value (90-th percentile).
- the epigenetic distances between pairs of genomic samples are computed, the distances are used to construct a dissimilarity matrix, and a two-dimensional representation is employed using multidimensional scaling (MDS) based on Kruskal's non-metric method, which finds a two-dimensional configuration of points whose inter-point distances correspond to the epigenetic dissimilarities among the genomic samples.
- MDS multidimensional scaling
- a method for performing epigenetic analysis that includes detecting the skewness and/or bimodality of the probability distribution of the methylation level and classifying the average methylation status of a genomic region into discrete classes, including bistability.
- Detection and classification includes: a) partitioning the genome into discrete genomic regions; b) analyzing the methylation status within a genomic region by fitting The Model to methylation data; and c) detecting the skewness and/or bimodality of the probability distribution of the methylation level and classifying the average methylation status of a genomic region into discrete classes, including bistability, thereby performing epigenetic analysis.
- Classifying the methylation status of a genome is an important part of methylation analysis.
- the methylation status within a genomic subregion is effectively summarized by classifying the genomic subregion into one of seven discrete classes: highly unmethylated, partially unmethylated, partially methylated, highly methylated, mixed, highly mixed, and bistable.
- Classification is based on calculating the probability distribution of methylation level within the genomic subregion and on classifying the genomic subregion into one of the seven classes by analyzing the shape of this distribution and detecting its skewness and/or bimodality.
- a method for performing epigenetic analysis that includes classifying methylation uncertainty within a genomic region into discrete classes.
- Classification includes: a) partitioning the genome into discrete genomic regions; b) analyzing the methylation status within a genomic region by fitting The Model to methylation data; and c) classifying the methylation uncertainty of a genomic region into discrete classes, thereby performing epigenetic analysis.
- Methylation uncertainty within a genomic subregion is effectively summarized by classifying the genomic subregion into one of five discrete classes: highly ordered, moderately ordered, weakly ordered/disordered, moderately disordered, highly disordered. This classification is based on calculating the NME h within the genomic subregion and on classifying the genomic subregion and using the following scheme:
- Also disclosed is a method for performing epigenetic analysis that includes the computation of methylation regions and methylation blocks.
- Computation includes: a) partitioning the genome into discrete genomic regions; b) analyzing the methylation status within a genomic region by fitting The Model to methylation data; c) classifying the methylation status of genomic regions across the entire genome; and d) grouping the classification results into methylation regions and methylation blocks, thereby performing epigenetic analysis.
- methylation analysis at the level of genomic units, it is of great interest to analyze the methylation status of a genome at the level of genomic features, such as gene promoters, enhancers and the like, as well as at the level of chromatin organization, such as lamina associated domains (LADs), large organized chromatin K9-modifications (LOCKs), and the like. This is accomplished by generating coarser versions of classification of the methylation status than at the level of genomic subregions.
- LADs lamina associated domains
- LOCKs large organized chromatin K9-modifications
- the window is labeled as being methylated if at least 75% of the genomic subregions intersecting the window are respectively classified as being partially/highly methylated, whereas the window is labeled as being unmethylated if at least 75% of the genomic subregions touching the window are respectively classified as being partially/highly unmethylated.
- All methylated windows are then grouped together using the operation of union followed by removal of regions overlapping with unmethylated windows, and the same is done for all unmethylated windows. This process generates methylation regions (MRs), classified as methylated or unmethylated, along the entire genome.
- MRs methylation regions
- the window is labeled as being methylated if at least 75% of the genomic subregions intersecting the window are respectively classified as being partially/highly methylated, whereas the window is labeled as being unmethylated if at least 75% of the genomic subregions touching the window are respectively classified as being partially/highly unmethylated.
- All methylated windows are then grouped together using the operation of union followed by removal of regions overlapping unmethylated windows, and the same is done for all unmethylated windows. This process generates methylation blocks (MBs), classified as methylated or unmethylated, along the entire genome.
- MBs methylation blocks
- Also disclosed is a method for performing epigenetic analysis that includes the computation of entropy regions and entropy blocks.
- Computation includes: a) partitioning the genome into discrete genomic regions; b) analyzing the methylation status within a genomic region by fitting The Model to methylation data; c) classifying the methylation uncertainty of genomic regions across the entire genome; and d) grouping the classification results into entropy regions and entropy blocks, thereby performing epigenetic analysis.
- methylation uncertainty of a genome at the level of genomic features, such as gene promoters, enhancers and the like, as well as at the level of chromatin organization, such as lamina associated domains (LADs), large organized chromatin K9-modifications (LOCKs), and the like. This is accomplished by generating coarser versions of classification of the methylation uncertainty than at the level of genomic subregions.
- the window is labeled as being ordered if at least 75% of the genomic subregions intersecting the window are respectively classified as being moderately/highly ordered, whereas the window is labeled as being disordered if at least 75% of the genomic subregions touching the window are respectively classified as being moderately/highly disordered.
- All ordered windows are then grouped together using the operation of union followed by removal of regions overlapping disordered windows, and the same is done for all disordered windows. This process generates entropy regions (ERs), classified as ordered or disordered, along the entire genome.
- ERs entropy regions
- the window is labeled as being ordered if at least 75% of the genomic subregions intersecting the window are respectively classified as being moderately/highly ordered, whereas the window is labeled as being disordered if at least 75% of the genomic subregions touching the window are respectively classified as being moderately/highly disordered.
- All ordered windows are then grouped together using the operation of union followed by removal of regions overlapping disordered windows, and the same is done for all disordered windows. This process generates entropy blocks (EBs), classified as ordered or disordered, along the entire genome.
- EBs entropy blocks
- Also disclosed is a method for performing epigenetic analysis that includes the calculation of informational properties of epigenetic maintenance through methylation channels.
- the analysis includes: a) partitioning the genome into discrete genomic regions; b) analyzing the methylation status within a genomic region by fitting The Model to methylation data; and c) quantifying the informational properties of epigenetic maintenance (including but not limited to the capacity and relative dissipated energy of methylation channels) of a genomic region and/or its subregions and/or merged super-regions, thereby performing epigenetic analysis.
- Transmission of methylation information at the n -th CpG site of a genome is modeled by a Markov chain X n (0) ⁇ X n (1) ⁇ ... ⁇ X n ( k -1) ⁇ X n ( k ) ⁇ ..., where X n (0) is the initial methylation state before any maintenance steps and X n ( k ) is the methylation state after k maintenance steps.
- the MC can be specified by the probabilities ⁇ n ( k ), ⁇ n ( k ) ⁇ of demethylation and de novo methylation. These probabilities are thought to be regulated by the maintenance and de novo methyltransferases (DNMT1, DNMT3A, and DNMT3B), by active (TET) and passive demethylation processes, as well as by other potential mechanisms, which are anticipated to be constrained by the free energy available for methylation maintenance.
- DNMT1, DNMT3A, and DNMT3B maintenance and de novo methyltransferases
- TET active
- passive demethylation processes as well as by other potential mechanisms, which are anticipated to be constrained by the free energy available for methylation maintenance.
- This ratio is calculated directly from methylation data using Equation (25) with the probability P n (1) of the n -th CpG site to be methylated being computed from the Ising model using marginalization.
- the CGE is calculated directly from methylation data using Equation (26) with the probability P n (1) of the n -th CpG site to be methylated being computed from the Ising model using marginalization.
- IC information capacity
- the IC is calculated by computing the turnover ratio ⁇ n directly from methylation data and using Equation (28).
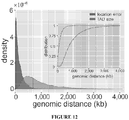
- the (minimum) energy E n dissipated during maintenance of the methylation state at the n-th CpG site of a genome is approximately related to the probability of transmission error ⁇ n by E n ⁇ ⁇ k B T n log ⁇ n , where k B is Boltzmann's constant and T n is the absolute temperature at the CpG site.
- RDE relative dissipated energy
- the RDE is calculated by computing the turnover ratio ⁇ n directly from methylation data and using Equation (31).
- ICs, RDEs, and CGEs are effective measures of the informational behavior of epigenetic maintenance that can be reliably computed genome-wide from low coverage methylation data using the Ising model. Moreover, distributions of IC, RDE, and CGE values can be computed over selected genomic features (e.g., CpG islands, island shores, shelves, open sea, exons, introns, gene promoters, and the like), thus providing a genome-wide breakdown of methylation uncertainty showing different aspects of the informational properties of epigenetic maintenance within said genomic features of a first genome as compared to a second genome.
- genomic features e.g., CpG islands, island shores, shelves, open sea, exons, introns, gene promoters, and the like
- Also disclosed is a method for performing epigenetic analysis that includes computing the sensitivity to perturbations of informational/statistical properties (including but not limited to entropy) of the methylation system within a genomic region and/or its subregions and/or merged super-regions.
- the analysis includes: a) partitioning a genome into discrete genomic regions; b) analyzing the methylation status within a genomic region by fitting The Model to methylation data; and c) quantifying the sensitivity to perturbations of informational/statistical properties (including but not limited to entropy) of the methylation system within the genomic region and/or its subregions and/or merged super-regions, thereby performing epigenetic analysis.
- An important aspect of methylation analysis is to determine the sensitivity of informational/statistical properties of the methylation system to perturbations of methylation parameters.
- a measure is used to quantify the effect of variations in parameters ⁇ on the NME within a genomic subregion of a genome. It is assumed that, within a genomic subregion, the Ising parameters fluctuate around their estimated values ⁇ by a random amount G ⁇ ⁇ , where G is a random variable that follows a zero-mean Gaussian distribution with small standard deviation ⁇ .
- ⁇ is used to quantify the sensitivity of NME within a genomic subregion to perturbations. This measure is referred to as the entropic sensitivity index (ESI).
- Also disclosed is a method for performing epigenetic analysis that identifies important genomic features (including but not limited to gene promoters) with potentially important biological functions (including but not limited to regulation of normal versus diseased states, such as cancer) occult to mean-based analysis, while exhibiting higher-order statistical differences (including but not limited to entropy or information distances) in the methylation states between a first genome and a second genome.
- Identification includes: a) partitioning the first and second genomes into discrete genomic regions; b) analyzing the methylation status within a genomic region for the first and second genome by fitting The Model to methylation data in each genome; and c) identifying genomic features (including but not limited to gene promoters) with relatively low mean differences but relatively high epigenetic differences in higher-order statistical quantities (including but not limited to entropy or informational distances) between the first and the second genome, thereby performing epigenetic analysis.
- a master ranked list of genomic features is constructed, with genomic features located higher in the master rank list being associated with relatively low mean-based differences in methylation but relatively high epigenetic differences between a first and a second genome.
- a mean-based score is calculated for each genomic feature and this score is then used to form a first rank list of genomic features, with genomic features associated with larger mean-based scores being located higher in the first rank list.
- a higher-order statistical score based on the JSD is calculated for each genomic feature and this score is then used to form a second rank list of genomic features, with genomic features associated with larger JSD-based scores being located higher in the second rank list.
- the absolute difference between the MMLs observed for the first and the second genome are calculated for each genomic subregion that intersects the genomic feature, and a score is formed by averaging all such absolute differences, where missing data are accounted for setting the MML value equal to 0.
- the JSD is calculated for each genomic subregion that intersects the genomic feature, and a score is formed by averaging all such JSD values, where missing data are accounted for setting the JSD value equal to 0.
- each genomic feature is further scored using the ratio of its ranking in the second rank list to its ranking in the first rank list. These scores are then used to form the master rank list with genomic features associated with higher scores being located lower in the master rank list. Genomic features located near the top of the master rank list are characterized by high JSD values but little difference in mean methylation level, indicating that the probability distributions of methylation level within these genomic features are different between a first and a second genome, although these probability distributions have similar means.
- Also disclosed is a method for performing epigenetic analysis that identifies relationships between bistability in methylation and genomic features (including but not limited to gene promoters) with potentially important biological function.
- the analysis includes: a) partitioning the genomes of one or more genomic samples into discrete genomic regions; b) analyzing the methylation status within a genomic region by fitting The Model to methylation data; and c) identifying genomic features (including but not limited to gene promoters) associated with high amounts of bistability in their methylation status in one or more genomic samples and relating them to genomic features of potentially important biological function, thereby performing epigenetic analysis.
- bistability in methylation might be associated with important biological function
- its possible enrichment in selected genomic features e.g., CpG islands, island shores, shelves, open sea, exons, introns, gene promoters, and the like
- R and B binary (0-1) random variables
- R 1, if the subregion overlaps the genomic feature
- B 1, if the genomic subregion is bistable.
- the null hypothesis that R and B are statistically independent is then tested by applying the ⁇ 2 -test on the 2 ⁇ 2 contingency table for R and B and the odds ratio (OR) is calculated as a measure of enrichment.
- a reference set of genomic features is considered (e.g., all gene promoters in the genome) and one or more genomic samples are employed.
- a score is computed for a genomic feature in the reference set, by calculating the fraction of base pairs within the genomic feature that are inside genomic subregions being classified as bistable in the genomic sample by the method used to classify the methylation status of a genome.
- a bistability score is then calculated by averaging all scores obtained for the genomic feature using one or more genomic samples.
- the bistability scores are then used to form a rank list of the genomic features in the reference set in order of decreasing bistability.
- a test set of genomic features associated with a specific biological phenomenon is considered and a p -value is then calculated for the test set to be ranked higher in the bistability rank list of the reference set just by chance.
- a p -value is first computed for each genomic feature in the test set to be ranked higher in the bistability rank list of the reference set just by chance by testing against the null hypothesis that the genomic feature appears at a random location in the bistability rank list.
- the rank of the genomic feature is used as the test statistic which, under the null hypothesis, follows a uniform distribution. This implies that the p -value of the genomic feature in the test set can be calculated by dividing the ranking of the genomic feature in the bistability rank list by the total number of genomic features in the list.
- the p -value for the test set to be ranked higher in the bistability rank list of the reference set just by chance is finally calculated by combining the individual p -values associated with the genomic features in the test set using Fisher's meta-analysis method.
- Detection includes: a) partitioning the genomes of one or more genomic samples into discrete genomic regions; b) analyzing the methylation status within a genomic region of each genome by fitting The Model to methylation data; and c) locating TAD boundaries, thereby performing epigenetic analysis.
- Topologically associating domains are structural features of the chromatin that are highly conserved across tissue types and species. Their importance stems from the fact that loci within these domains tend to frequently interact with each other, with much less frequent interactions being observed between loci within adjacent domains. Genome-wide detection of TAD boundaries is an essential but experimentally challenging task.
- the NME can be effectively used to computationally locate TAD boundaries from one or more genomic samples.
- entropy blocks For genomic sample, ordered and disordered entropy blocks (EBs) are computed genome-wide from WGBS data by employing the method for calculating entropy regions and blocks. Regions of the genome predictive of the location of TAD boundaries are identified by detecting the unclassified genomic space between successive ordered and disordered EBs or between successive disordered and ordered EBs. For example, if an ordered EB located at chrl: 1-1000 were followed by a disordered EB at chrl: 1501-2500, then chrl: 1001-1500 is deemed to be a "predictive region".
- Predictive regions obtained from methylation analysis of more than one genomic sample are subsequently combined.
- the "predictive coverage” of each base pair is calculated by counting the number of “predictive regions” containing the base pair. "Predictive regions” are then combined by grouping consecutive base pairs whose predictive coverage is at least 4.
- the entire genome is partitioned into discrete genomic bins of 100,000 base pairs each (to match training data) and 8 information-theoretic features of methylation maintenance are computed within each genomic bin from WGBS data, which include the median values and interquartile ranges of IC, RDE, NME and MML.
- a random forest model with 1000 trees is trained on data consisting of input WGBS data that are matched to output chromosome conformational capture data, such as Hi-C, and/or measured or estimated compartment A/B data for one or more genomic samples. Values of the regression/classification feature vector are computed from the input WGBS data and all feature/output pairs are then used to learn a binary discriminant function that maps input feature vector values to known output compartment A/B classification.
- the trained random forest model is subsequently applied on a genomic sample.
- the genomic sample is first partitioned into discrete genomic bins.
- the value of the feature vector is then calculated from WGBS data for each genomic bin, and the genomic bin is classified as being in compartment A or B by using the binary discriminant function learned during training. Since regression takes into account only information within a 100,000 base pair bin, predicted A/B values are averaged using a three-bin smoothing window and the genome-wide median value is removed from the overall A/B signal.
- the accuracy of the method depends on the training step. Availability of more chromosome conformational capture and high quality measured or estimated compartment A/B data is expected to result in better training, thus increasing classification performance.
- a genome is present in a biological sample taken from a subject.
- the biological sample can be virtually any biological sample, particularly a sample that contains DNA from the subject.
- the biological sample can be a germline, stem cell, reprogrammed cell, cultured cell, or tissue sample which contains 1000 to about 10,000,000 cells. However, it is possible to obtain samples that contain smaller numbers of cells, even a single cell, in embodiments that utilize an amplification protocol such as PCR.
- the sample need not contain any intact cells, so long as it contains sufficient biological material (e.g., DNA) to assess methylation status within one or more regions of the genome.
- the sample might also contain chromatin for analysis of euchromatin and heterochromatin by ATAC-seq or similar methods.
- a biological or tissue sample can be drawn from any tissue that includes cells with DNA.
- a biological or tissue sample may be obtained by surgery, biopsy, swab, stool, or other collection method.
- the sample is derived from blood, plasma, serum, lymph, nerve-cell containing tissue, cerebrospinal fluid, biopsy material, tumor tissue, bone marrow, nervous tissue, skin, hair, tears, fetal material, amniocentesis material, uterine tissue, saliva, feces, or sperm. Methods for isolating PBLs from whole blood are well known in the art.
- the biological sample can be a blood sample.
- the blood sample can be obtained using methods known in the art, such as finger prick or phlebotomy.
- the blood sample is approximately 0.1 to 20 ml, or alternatively approximately 1 to 15 ml with the volume of blood being approximately 10 ml. Smaller amounts may also be used, as well as circulating free DNA in blood.
- Microsampling and sampling by needle biopsy, catheter, excretion or production of bodily fluids containing DNA are also potential biological sample sources.
- the subject is typically a human but also can be any species with methylation marks on its genome, including, but not limited to, a dog, cat, rabbit, cow, bird, rat, horse, pig, or monkey.
- WGBS methylation analysis
- many other methods for performing nucleic acid sequencing or analyzing methylation status or chromatin status may be utilized including nucleic acid amplification, polymerase chain reaction (PCR), bisulfite pyrosequencing, nanopore sequencing, 454 sequencing, insertion tagged sequencing.
- PCR polymerase chain reaction
- the methodology of the disclosure utilizes systems such as those provided by Illumina, Inc, (HiSeqTM X10, HiSeqTM 1000, HiSeqTM 2000, HiSeqTM 2500, Genome AnalyzersTM, MiSeqTM systems), Applied Biosystems Life Technologies (ABI PRISMTM Sequence detection systems, SOLiDTM System, Ion PGMTM Sequencer, ion ProtonTM Sequencer). Nucleic acid analysis can also be carried out by systems provided by Oxford Nanopore Technologies (GridiONTM, MiniONTM) or Pacific Biosciences (PacbioTM RS II).
- Sequencing can also be carried out by standard Sanger dideoxy terminator sequencing methods and devices, or on other sequencing instruments, further as those described in, for example, United States patents and patent applications U.S. Pat. Nos. 5,888,737 , 6,175,002 , 5,695,934 , 6,140,489 , 5,863,722 , 2007/007991 , 2009/0247414 , 2010/0111768 and PCT application WO2007/123744 .
- sequencing may be performed using any of the methods described herein with, or without, bisulfite conversion.
- Chromatin can be analyzed using similar analytical methodology after ATAC sequencing and related methods. As illustrated in the Examples herein, analysis of methylation can be performed by bisulfite genomic sequencing. Bisulfite treatment modifies DNA converting unmethylated, but not methylated, cytosines to uracil. Bisulfite treatment can be carried out using the METHYLEASYTM bisulfite modification kit (Human Genetic Signatures).
- bisulfite pyrosequencing which is a sequencing-based analysis of DNA methylation that quantitatively measures multiple, consecutive CpG sites individually with high accuracy and reproducibility may be used. This can be done by whole genome bisulfite sequencing or by MiSeqTM using primers for such analysis.
- 1% unmethylated Lambda DNA can be spiked-in to monitor bisulfite conversion efficiency. Genomic DNA was fragmented to an average size of 350bp using a Covaris S2 sonicator (Woburn, MA).
- Bisulfite sequencing libraries can be constructed using the Illumina TruSeqTM DNA Library Preparation kit protocol (primers included) or NEBNextTM Ultra (NEBNextTM Multiplex Oligos for Illumina module, New England BioLabs, cat # E7535L) according to the manufacturer's instructions. Both protocols use a Kapa HiFi Uracil+ PCR system (Kapa Biosystems, cat # KK2801).
- gel-based size selection can be performed to enrich for fragments in the 300-400bp range.
- size selection can be performed using modified AMPure XPTM bead ratios of 0.4x and 0.2x, aiming also for an insert size of 300-400bp.
- the samples can be bisulfite converted and purified using the EZ DNATM Methylation Gold Kit (Zymo Research, cat # D5005).
- PCR-enriched products can be cleaned up using 0.9X AMPure XPTM beads (Beckman Coulter, cat # A63881).
- Final libraries can be run on the 2100 BioanalyzerTM (Agilent, Santa Clare, CA, USA) using the High-Sensitivity DNA assay for quality control purposes. Libraries can be quantified by qPCR using the Library Quantification Kit for Illumina sequencing platforms (cat # KK4824, KAPA Biosystems, Boston, USA), using 7900HT Real Time PCR SystemTM (Applied Biosystems) and sequenced on the Illumina HiSeq2000 (2x100bp read length, v3 chemistry according to the manufacturer's protocol with lOx PhiX spike-in) and HiSeq2500TM (2x125bp read length, v4 chemistry according to the manufacturer's protocol with lOx PhiX spike-in).
- Altered methylation can be determined by identifying a detectable difference in methylation. For example, hypomethylation can be determined by identifying whether after bisulfite treatment a uracil or a cytosine is present a particular location. If uracil is present after bisulfite treatment, then the residue is unmethylated. Hypomethylation is present when there is a measurable decrease in methylation.
- methylation calling can be performed using FASTQ files processed using Trim Galore! v0.3.6 (Babraham Institute) to perform single-pass adapter- and quality-trimming of reads, as well as running FastQC v0.11.2 for general quality check of sequencing data.
- Reads can then aligned be aligned to the hgl9/GRCh37 or other human or other species builds using Bismark v0.12.3 and Bowtie2 v2.1.0 or comparable and/or updated software.
- Separate mbias plots for read 1 and read 2 can be generated by running the Bismark methylation extractor using the "mbias_only" flag. These plots can be used to determine how many bases to remove from the 5' end of reads.
- BAM files can subsequently be processed with Samtools v0.1.19 for sorting, merging, duplicate removal and indexing, as well as for methylation base calling.
- the method for analyzing methylation status can include amplification after oligonucleotide capture, MiSeqTM sequencing, or MinIONTM long read sequencing without bisulfite conversion.
- the methods described herein may be used in a variety of ways to predict, diagnose and/or monitor diseases, such as cancer. Further, the methods may be utilized to distinguish various cell types from one another as well as determine cellular age. These aspects may be accomplished by performing the respective epigenetic analysis method for a test genome and comparing the obtained epigenetic measure to a corresponding known measure for a reference genome; i.e., a measure for a known cell type or disease.
- the present invention is described partly in terms of functional components and various processing steps. Such functional components and processing steps may be realized by any number of components, operations and techniques configured to perform the specified functions and achieve the various results.
- the present invention may employ various biological samples, biomarkers, elements, materials, computers, data sources, storage systems and media, information gathering techniques and processes, data processing criteria, statistical analyses, regression analyses and the like, which may carry out a variety of functions.
- the invention is described in the medical diagnosis context, the present invention may be practiced in conjunction with any number of applications, environments and data analyses; the systems described herein are merely exemplary applications for the invention.
- An exemplary epigenetic analysis system may be implemented in conjunction with a computer system, for example a conventional computer system comprising a processor and a random access memory, such as a remotely-accessible application server, network server, personal computer or workstation.
- the computer system also suitably includes additional memory devices or information storage systems, such as a mass storage system and a user interface, for example a conventional monitor, keyboard and tracking device.
- the computer system may, however, comprise any suitable computer system and associated equipment and may be configured in any suitable manner.
- the computer system comprises a stand-alone system.
- the computer system is part of a network of computers including a server and a database.
- the software required for receiving, processing, and analyzing biomarker information may be implemented in a single device or implemented in a plurality of devices.
- the software may be accessible via a network such that storage and processing of information takes place remotely with respect to users.
- the epigenetic analysis system according to various aspects of the present invention and its various elements provide functions and operations to facilitate biomarker analysis, such as data gathering, processing, analysis, reporting and/or diagnosis.
- the present epigenetic analysis system maintains information relating to methylation and samples and facilitates analysis and/or diagnosis,
- the computer system executes the computer program, which may receive, store, search, analyze, and report information relating to the epigenome.
- the computer program may comprise multiple modules performing various functions or operations, such as a processing module for processing raw data and generating supplemental data and an analysis module for analyzing raw data and supplemental data to generate a disease status model and/or diagnosis information.
- the procedures performed by the epigenetic analysis system may comprise any suitable processes to facilitate epigenetic analysis and/or disease diagnosis.
- the epigenetic analysis system is configured to establish a disease status model and/or determine disease status in a patient. Determining or identifying disease status may comprise generating any useful information regarding the condition of the patient relative to the disease, such as performing a diagnosis, providing information helpful to a diagnosis, assessing the stage or progress of a disease, identifying a condition that may indicate a susceptibility to the disease, identify whether further tests may be recommended, predicting and/or assessing the efficacy of one or more treatment programs, or otherwise assessing the disease status, likelihood of disease, or other health aspect of the patient.
- the epigenetic analysis system may also provide various additional modules and/or individual functions.
- the epigenetic analysis system may also include a reporting function, for example to provide information relating to the processing and analysis functions.
- the epigenetic analysis system may also provide various administrative and management functions, such as controlling access and performing other administrative functions.
- the epigenetic analysis system suitably generates a disease status model and/or provides a diagnosis for a patient based on raw biomarker data and/or additional subject data relating to the subjects.
- the epigenetic data may be acquired from any suitable biological samples.
- WGBS data corresponding to 10 genomic samples are used, which include HI human embryonic stem cells, normal and matched cancer cells from colon normal and cancer, cells from liver, keratinocytes from skin biopsies of sun protected sites from younger and older individuals, and EBV-immortalized lymphoblasts (Supplementary Table 1 below). Additional WGBS data corresponding to 25 genomic samples were also generated that include normal and matched cancer cells from liver and lung, pre-frontal cortex, cultured HNF fibroblasts at 5 passage numbers, and sorted CD4 + T-cells from younger and older individuals, all with IRB approval (Supplementary Table 1 below).
- Pre-frontal cortex samples were obtained from the University of Maryland Brain and Tissue Bank, which is a Brain and Tissue Repository of the NIH NeuroBioBank.
- Peripheral blood mononuclear cells PBMCs
- CD4 + T-cells were subsequently isolated from PBMCs by positive selection with MACS magnetic bead technology (Miltenyi).
- Post-separation flow cytometry assessed the purity of CD4 + T-cells to be at 97%.
- Primary neonatal dermal fibroblasts were acquired from Lonza and cultured in Gibco's DMEM supplemented with 15% FBS (Gemini BioProducts).
- Genomic DNA was extracted from samples using the MasterpureTM DNA Purification Kit (Epicentre). High molecular weight of the extracted DNA was verified by running a 1% agarose gel and by assessing the 260/280 and 260/230 ratios of samples on Nanodrop. Concentration was quantified using Qubit 2.0 FluorometerTM (Invitrogen).
- FASTQ files were processed using Trim Galore! TM v0.3.6 (Babraham Institute) to perform single-pass adapter- and quality-trimming of reads, as well as running FastQCTM v0.11.2 for general quality check of sequencing data. Reads were then aligned to the hgl9/GRCh37 genome using BismarkTM v0.12.3 and Bowtie2TM v2.1.0. Separate mbias plots for read 1 and read 2 were generated by running the Bismark methylation extractor using the "mbias_only" flag. These plots were used to determine how many bases to remove from the 5' end of reads. The number was generally higher for read 2, which is known to have poorer quality. The amount of 5' trimming ranged from 4 to 25 base pairs, with most common values being around 10 base pairs. BAM files were subsequently processed with SamtoolsTM v0.1.19 for sorting, merging, duplicate removal, and indexing.
- FASTQ files associated with the EBV sample were processed using the same pipeline described for the in-house samples.
- BAM files associated with some colon and liver normal samples, obtained from [ Ziller, M. J. et al. Nature 500, 477-481 (2013 )] could not be assessed using the BismarkTM methylation extractor due to incompatibility of the original alignment tool (MAQ) used on these samples. Therefore, the advice of Ziller et al. was followed and 4 base pairs were trimmed from all reads in those files.
- CGIs CpG islands
- CGI shores were defined as sequences flanking 2000 base pairs on either side of islands, shelves as sequences flanking 2000 base pairs on either side of shores, and open seas as everything else.
- the R BioconductorTM package "TxDb.Hsapiens.UCSC.hgl9.knownGene” was used for defining exons, introns and transcription start sites (TSSs). Promoter regions were defined as sequences flanking 2000 base pairs on either side of TSSs.
- a curated list of enhancers was obtained from the VISTATM Enhancer Browser (http://enhancer.lbl.gov) by downloading all human (hg19) positive enhancers that show reproducible expression in at least three independent transgenic embryos. Hypomethylated blocks (colon and lung cancer) were obtained from [ Timp, W. et al. Genome Med. 6, 61 (2014 )]. HI stem cell LOCKs and Human Pulmonary Fibroblast (HPF) LOCKs were obtained from [ Wen, B. et al. BMC Genomics 13, 566 (2012 )]. LAD tracks associated with Tig3 cells derived from embryonic lung fibroblasts were obtained from [ Guelen, L. et al.
- Raw files have been deposited to NCBI's Sequencing Read Archive (SRA) under Accessions SRP072078, SRP072071, SRP072075, and SRP072141.
- SRA Sequencing Read Archive
- the methylation PEL V x ( x ) was estimated from WGBS data corresponding to 35 genomic samples, including stem cells, normal cells from colon, liver, lung, and brain tissues, matched cancers from three of these tissues, cultured fibroblasts at 5 passage numbers, CD4 + lymphocytes and skin keratinocytes from younger and older individuals, and EBV-immortalized lymphoblasts (Supplementary Table 1 below).
- the genome was partitioned into consecutive non-overlapping genomic regions of 3000 base pairs in length each, and the maximum-likelihood estimation method introduced earlier was used to estimate the PEL parameters within each genomic region.
- the strategy capitalizes on appropriately combining the full information available in multiple methylation reads, especially the correlation between methylation at CpG sites, as opposed to the customary approach of estimating marginal probabilities at each individual CpG site ( Fig. 1A ).
- visualization of the PEL is chosen to be performed within a region of a CpG island (CGI) near the promoter of a gene containing 12 CpG sites.
- CGI CpG island
- the 2 12 computed values are distributed over a 64 ⁇ 64 square grid using a two-dimensional version of Gray's code, so that methylation states located adjacent to each other in the east/west and north/south directions differ in only one bit.
- Computed PELs demonstrate that most methylation states associated with the CGI of WNT1, an important signaling gene, in colon normal exhibit high potential ( FIG. 1B , three-dimensional and violin plots), implying that significant energy is required to leave the fully unmethylated state, which is the state of lowest potential (ground state). Any deviation from this state will rapidly be "funneled” back, leading to low uncertainty in methylation.
- the methylation states of WNT1 in colon cancer demonstrate low potential ( Fig. 1B , three-dimensional and violin plots), implying that relatively little energy is required to leave the fully unmethylated ground state. In this case, deviations from this state will be frequent and long lasting, leading to uncertainty in methylation.
- methylation states associated with the CGI of EPHA4 exhibit low potential in stem cells ( Fig. 1B , three-dimensional and violin plots), suggesting that low energy is needed to leave the fully unmethylated ground state, thus leading to uncertainty in methylation.
- EPHA4 shows high potential in the brain ( Fig. 1B , three-dimensional and violin plots), implying that appreciable energy is required to leave the fully unmethylated ground state, thus leading to low uncertainty in methylation.
- the NME is an effective measure of methylation uncertainty that can be reliably computed genome-wide from low coverage WGBS data using the Ising model, together with the mean methylation level (MML), which is the average of the methylation means at individual CpG sites within a genomic subregion.
- MML mean methylation level
- the genome-wide distributions of MML and NME values were calculated and compared among genomic samples. Consistent with previous reports, the MML in stem cells and brain tissues was globally higher than in normal colon, liver, and lung and that the same was true for CD4 + lymphocytes and skin keratinocytes ( Fig. 2A ). Moreover, the MML was reduced in all seven cancers studied compared to their matched normal tissue ( Fig.
- MML and NME distributions were also computed over selected genomic features and provided a genome-wide breakdown showing lower and more variable methylation levels and entropy values within CGIs and TSSs compared to other genomic features, such as shores, exons, introns and the like ( Fig. 4A , B ).
- the absolute NME differences was first computed at each genomic subregion associated with all three pairwise comparisons and, by pooling these values, an empirical null distribution was constructed that accounted for biological and statistical variability of differential entropy in the young samples. Subsequently, he absolute dNME values corresponding to a young-old pair (CD4-Y3, CD4-O1) were computed and multiple hypotheses testing was performed to reject the null hypothesis that the observed NME difference is due to biological or statistical variability. By using the "qvalue" package of BioconductorTM with default parameters, false discovery rate (FDR) analysis was performed and the probability that the null hypothesis is rejected at a randomly chosen genomic subregion was estimated. This resulted in approximately computing the fraction of genomic subregions found to be differentially entropic for reasons other than biological or statistical variability among the young samples.
- FDR false discovery rate
- JSD Jensen-Shannon distance
- genes that exhibited appreciable differential methylation level (dMML) and/or JSD in stem cells compared to differential tissues were examined.
- genes were ranked based on the absolute value of the dMML as well as on the JSD within their promoters (Supplementary Data 1 described below and attached) and it was surprising to find that many genes known to be involved in development and differentiation showed relatively small changes in dMML yet very high JSD, indicating that the probability distributions of methylation level within their promoters were appreciably different, despite little difference in mean methylation level.
- RJSD relative JSD-based ranking scheme
- IGF2BP1, FOXD3, NKX6-2, SALL1, EPHA4, and OTX1 key genes were found at the top of the RJSD list, such as IGF2BP1, FOXD3, NKX6-2, SALL1, EPHA4, and OTX1, with RJSD-based GO annotation ranking analysis revealing key categories associated with stem cell maintenance and brain cell development (Supplementary Data 1 & 2 described below and attached).
- dMML-based GO annotation analysis resulted in a higher number of significant categories than RJSD-based analysis, and these were closely related to differentiated functions, such as immune regulation and neuronal signaling in the case of brain and CD4 (Supplementary Data 2 described below and attached).
- RJSD-based GO annotation analysis produced a higher number of significant categories than dMML-based analysis, and these were again related to developmental morphogenesis categories.
- the PEL parameters c n are strongly positive, compared to low methylation cooperativity in stem (almost zero c n 's) that flattens the PEL ( Fig. 1B , lower panel) and results in higher entropy than in brain ( Fig. 7A ).
- the region shows binding of EZH2 and SUZ12, functional enzymatic components of the polycomb repressive complex 2 (PRC2), which regulates heterochromatin formation.
- PRC2 polycomb repressive complex 2
- SIM2 a master regulator of neurogenesis, is associated with high JSD regions with similar EZH2/SUZ12 binding, which span several CGIs located near its promoter ( Fig. 7B ).
- a gain of entropy is observed in brain, corresponding to a simultaneous loss in methylation propensity (through reduced a n ' s) and a gain in methylation cooperativity (through increased c n 's).
- bistable genomic subregions were in general enriched in CpG island shores (ORs > 1 in 29/34 phenotypes, p -values ⁇ 2.2 ⁇ 10 -16 ) and promoters (ORs > 1 in 26/34 phenotypes, p -values ⁇ 1.68 ⁇ 10 -9 ), but depleted in CGIs (ORs ⁇ 1 in 26/34 phenotypes, p -values ⁇ 2.2 ⁇ 10 -16 ) and gene bodies (ORs ⁇ 1 in 29/34 phenotypes, p -values ⁇ 3.06 ⁇ 10 -14 ). Moreover, it was noticed that bistable genomic subregions were associated with appreciably higher NME than the rest of the genome [ Fig. 8 ; comparing the bistable regions (yellow) to the rest of the genome (purple)].
- each gene was rank-ordered in the genome using a bistability score, which was calculated as the average frequency of methylation bistability within the gene's promoter in 17 normal genomic samples.
- a bistability score which was calculated as the average frequency of methylation bistability within the gene's promoter in 17 normal genomic samples.
- TAD boundary annotations were visually proximal to boundaries of entropy blocks (EBs), i.e., genomic blocks of consistently low or high NME values ( Fig. 10 ). This suggested that TAD boundaries may be located within genomic regions that separate successive EBs.
- EBs entropy blocks
- EBs were computed in the WGBS stem data and 404 regions were generated to predict the location of TAD boundaries. It was then found, using "GenometriCorr", a statistical package for evaluating the correlation of genome-wide data with given genomic features, that the 5862 annotated TAD boundaries in HI stem cells were located within these predictive regions or were close in a statistically significant manner. These EB-based predictive regions correctly identified 6% of the annotated TAD boundaries (362 out of 5862) derived from 90% of computed predictive regions.
- TAD boundary annotations for HI stem cells with available annotations for IMR90 lung fibroblasts (a total of 10,276 annotations). Since TADs are largely thought to be cell-type invariant, it was realized that it is possible to predict the location of more TAD boundaries by combining information from EBs derived from additional phenotypes ( Fig. 11 ).
- WGBS data from 17 different cell types stem, colonnormal, coloncancer, livernormal-1, livercancer-1, livernormal-2, livercancer-2, livernormal-3, livercancer-3, lungnormal-1, lungcancer-1, lungnormal-2, lungcancer-2, lungnormal-3, lungcancer-3, brain-1, brain-2) was employed, the corresponding EBs computed, predictive regions for each cell type determined, and these regions were appropriately combined to form a single list encompassing information (6632 predictive regions) from all genomic samples.
- TAD boundary predictions it was noted that it is natural to locate a TAD boundary at the center of the associated predictive region in the absence of prior information.
- the errors of locating TAD boundaries were small when compared to the TAD sizes as demonstrated by estimating the probability density and the corresponding cumulative probability distribution of the location errors as well as of the TAD sizes using a kernel density estimator ( Fig. 12 ).
- Computed cumulative probability distributions implied that the probability of the location error being smaller than N base pairs was larger than the probability of the TAD size being smaller than N, for every N. It was therefore concluded that the location error was smaller than the TAD size in a well-defined statistical sense (stochastic ordering).
- ICs Information capacities
- RDEs relative dissipated energies
- CGEs CpG entropies
- CGIs CpG islands
- TSSs transcription start sites
- the Hi-C and FH data were paired with WGBS EBV, fibro-P10, and colon cancer samples, as well as with samples obtained by pooling WGBS liver cancer (livercancer-1, livercancer-2, livercancer-3) and lung cancer (lungcancer-1, luncancer-2, lungcancer-3) data.
- the entire genome was partitioned into 100,000 base pair bins (to match the available Hi-C and FH data) and 8 information-theoretic features of methylation maintenance were computed within each bin (median values and interquartile ranges of IC, RDE, NME and MML).
- a random forest model was trained using the R package "randomForest" with its default settings, except that the number of trees was increased to 1,000. Then, the trained random forest model was applied on each WGBS sample and A/B tracks were produced that approximately identified A/B compartments associated with the samples. Since regression takes into account only information within a 100-kb bin, the predicted A/B values were averaged using a three-bin smoothing window and the genome-wide median value was removed from the overall A/B signal, as suggested by Fortin and Hansen [ Fortin, J. P. & Hansen, K. D. Genome Biol. 16, 180, (2015 )].
- Random forest regression was capable of reliably predicting A/B compartments from single WGBS samples (see Fig. 15C for an example), resulting in cross-validated average correlation of 0.74 and an average agreement of 81% between predicted and true A/B signals when using a calling margin of zero, which increased to 0.82 and 91% when the calling margin was set equal to 0.2.
- compartments A and B are cell-type specific, and in agreement with results of a previous study that demonstrated extensive A/B compartment reorganization during early stages of development, many differences between predicted compartments A/B were observed (see Fig. 16 for an example). In order to comprehensively quantify observed differences in compartments A and B, percentages of A to B and B to A switching were computed in all sample pairs (Supplementary Data 4 described below and attached).
- the percentage of A to B compartment switching was computed by dividing the number of 100-kb bin pairs for which an A prediction was made in the first sample and a B prediction made in the second sample by the total number of bins for which A/B predictions were available in both samples, and similarly for the case of B to A switching.
- compartment B in normal tissue may exhibit regions of large JSD values between normal and cancer ( Fig. 18A ), suggesting that considerable epigenetic changes may occur within this compartment during carcinogenesis. This observation was further supported by the observed differences in the genome-wide distributions of JSD values between normal and cancer within compartments A and B in normal ( Fig. 18B ).
- Compartment B to A switching in colon cancer included the HOXA and HOXD gene clusters, whereas, in lung cancer, it included the HOXD gene cluster but not HOXA ( Fig. 19A , B ). It also included SOX9 in colon cancer and the tyrosine kinase SYK in both colon and lung cancer ( Fig. 19C ). Fewer regions showed compartment A to B switching in cancer, consistent with the directionality of LAD and LOCKs changes in cancer. Interestingly, this included MGMT in colon but not lung, a gene implicated in the repair of alkylation DNA damage that is known to be methylated and silenced in colorectal cancer, as well as the mismatch repair gene MSH4 ( Fig. 19D ).
- compartment B demarcates genomic regions in which it is more likely for methylation information to be degraded during carcinogenesis.
- Epigenetic changes such as altered DNA methylation and post-translational modifications of chromatin, integrate external and internal environmental signals with genetic variation to modulate phenotype.
- environmental variability was viewed as a process that directly influences the methylation PEL parameters and a stochastic approach was developed that allowed use of the entropic sensitivity index (ESI) as a relative measure of NME to parameter variability.
- ESI entropic sensitivity index
- entropic sensitivity was also examined. It was found that entropic sensitivity within compartment A was appreciably higher than in compartment B in all genomic samples except stem cells ( Fig. 23 ), consistent with the notion that the transcriptionally active compartment A would be more responsive to stimuli. Moreover, observed differences among normal tissues and between normal and cancer were largely confined to compartment B ( Fig. 23 ). One could notice substantial loss of entropic sensitivity in compartment B in older CD4 + lymphocytes and skin keratinocytes, but not in compartment A. This is in contrast to cell culture that showed a sensitivity gain in compartment B ( Fig. 23 ).
- Colon cancer showed several LIM-domain proteins, including LIMD2 (ranked 4 th ), which transduce environmental signals regulating cell motility and tumor progression, as well as genes implicated in colon and other types of cancer, such as QK1 (ranked 1 st ), a critical regulator of colon epithelial differentiation and suppressor of colon cancer that was recently discovered to be a fusion partner with MYB in glioma leading to an auto-regulatory feedback loop, HOXA9 (ranked 8 th ), a canonical rearranged homeobox gene that is dysregulated in cancer, and FOXQ1 (ranked 9 th ), which is overexpressed and enhances tumorigenicity of colorectal cancer.
- LIMD2 ranked 4 th
- QK1 ranked 1 st
- HOXA9 ranked 8 th
- FOXQ1 ranked 9 th
- the Ising model of statistical physics was employed to derive, from whole genome bisulfite sequencing, epigenetic potential energy landscapes (PELs) representing intrinsic epigenetic stochasticity.
- PELs epigenetic potential energy landscapes
- biologically sound principles of methylation processivity, distance-dependent cooperativity, and CpG density were employed to build a rigorous approach to modeling DNA methylation landscapes. This approach was not only capable of modeling stochasticity in DNA methylation from low coverage data, but also allowed genome-wide analysis of Shannon entropy at high resolution.
- fundamental principles of information theory into a framework of methylation channels, it was also possible to predict in detail, high-order chromatin organization from single WGBS samples without performing Hi-C experiments.
- JSD Jensen-Shannon distance
- PRC2 components are critical for stochastic epigenetic silencing in an early area of the field of epigenetics, position effect variegation, which also involves stochasticity. It is suggested that PRC2 is important not only for gene silencing but also for regulating epigenetic stochasticity in general.
- TAD boundaries can be located within transition domains between high and low entropy in one or more genomic samples. This suggests a model in which TAD boundaries, which are relatively invariant across cell types and are associated with CTCF binding sites, are potential transition points at which high and low entropy blocks can be demarcated in the genome, and the particular combination of TAD boundaries that transition between high and low entropy define, in large part, the A/B compartments distinguishing tissue types.
- methylation channels An information-theoretic approach to epigenetics was also introduced by means of methylation channels, which allows one to estimate the information capacity of the methylation machinery to reliably maintain the methylation state.
- a close relationship was found between information capacity, CG entropy, and relative dissipated energy, as well as between regional localization of high information capacity and attendant high energy consumption (e.g., within CpG island shores and compartment A).
- informational properties of methylation channels can be used to predict A/B compartments and a machine learning algorithm was designed to perform such predictions on widely available WGBS samples from individual tissues and cell culture. This algorithm can be used to predict large-scale chromatin organization from DNA methylation data on individual genomic samples.
- DNA methylation in a given tissue may carry information about both the current state and the possibility of stochastic switching. This information could then be propagated in part through methylation channels over many cycles of DNA replication, even for higher order chromatin organization where the chromatin post-translational modifications themselves may be lost during cell division. This could imply that epigenetic information is carried by a population of cells as a whole, and that this information not only helps to maintain a differentiated state but to also help mediate developmental plasticity throughout the life of an organism.
- Figure 1 relates to potential energy landscapes.
- 1A Multiple WGBS reads of the methylation state within a genomic locus are used to form a methylation matrix whose entries represent the methylation status of each CpG site (1: methylated, 0: unmethylated, ND: no data).
- Most methods for methylation analysis estimate marginal methylation probabilities and means at individual CpG sites by using the methylation information only within each column associated with a CpG site.
- the statistical physics approach presented in this disclosure computes the most likely PEL by determining the likelihood of each row of the methylation matrix, combining this information across rows into an average likelihood, and maximizing this likelihood with respect to the PEL parameters.
- 1B PELs associated with the CpG islands (CGIs) of WNT1 in colon normal and colon cancer and EPHA4 in stem and brain.
- Point (m,n) marks a methylation state, with (0,0) indicating the fully unmethylated state, which is also the ground state (i.e., the state of lowest potential) in both examples.
- 1C Boxplots of the Ising PEL parameter distributions for all genomic samples used in this study. The boxes show the 25% quantile, the median, and the 75% quantile, whereas each whisker has a length of 1.5 ⁇ the interquartile range.
- Figure 2 relates to the mean methylation level (MML) and the normalized methylation entropy (NME).
- MML mean methylation level
- NME normalized methylation entropy
- 2A Boxplots of MML and NME distributions for all genomic samples used in this study. The boxes show the 25% quantile, the median, and the 75% quantile, whereas each whisker has a length of 1.5 ⁇ the interquartile range.
- 2B Genome-wide MML and NME densities associated with two normal/cancer samples show global MML loss in colon and lung cancer, accompanied by a gain in entropy.
- 2C Genome-wide MML and NME densities associated with young/old CD4 + lymphocytes and skin keratinocytes show global MML loss in old individuals, accompanied by a gain in entropy.
- Figure 3 relates to changes in mean methylation level and methylation entropy in cancer.
- 3A Genome browser image showing significant loss in mean methylation level (dMML) in colon and lung cancer, accompanied by gain in methylation entropy (dNME). Liver cancer exhibits loss of methylation entropy within large regions of the genome due to profound hypomethylation.
- 3B The CGI near the promoter of CDH1, a tumor suppressor gene, exhibits entropy loss in colon cancer.
- 3C The CGI near the promoter of NEU1 shows gain of methylation entropy in lung cancer. NEU1 sialidase is required for normal lung development and function, whereas its expression has been implicated in tumorigenesis and metastatic potential.
- 3D Noticeable loss of methylation entropy is observed in liver cancer at the shores of the CGI near the promoter of ENSA, a gene that is known to be hypomethylated in liver cancer.
- Figure 4 pertains to the breakdown of mean methylation level (MML) and normalized methylation entropy (NME) within genomic features throughout the genome in various genomic samples. Boxplots of genome-wide distributions of methylation measures for all genomic samples used in this study within CGIs, shores, shelves, open seas, TSSs, exons, introns, and intergenic regions.
- 4A Mean methylation level (MML).
- 4B Normalized methylation entropy (NME). The boxes show the 25% quantile, the median, and the 75% quantile, whereas each whisker has a length of 1.5 ⁇ the interquartile range.
- Figure 5 shows that cultured fibroblasts may not be appropriate for modeling aging.
- 5A Unmethylated blocks (MB-green) progressively form with passage in HNF fibroblasts and this process is similar to the one observed during carcinogenesis in liver cells. However, entropic blocks (EB-red) remain relatively stable.
- 5B An example of the potentially misleading nature of HNF fibroblasts as a model for aging is CYP2E1, a gene that has been found to be downregulated with age.
- the differential mean methylation level (dMML) track shows methylation gain in old CD4 + lymphocytes near the promoter of this gene, whereas no appreciable change in methylation level is observed with passage.
- dMML differential mean methylation level
- the CYP2E1 promoter demonstrates large entropy differential (dNME) in old CD4 + lymphocytes, but virtually no entropy change with passage in HNF fibroblasts.
- 5C Noticeable gain in methylation entropy is also observed near the promoter of FLNB in old CD4 + lymphocytes, a gene found to be downregulated with age. However, the FLNB promoter exhibits loss of entropy with passage in fibroblasts.
- FIG. 6 shows that epigenetic distances delineate lineages.
- JSD Jensen-Shannon distance
- Figure 7 shows differential regulation within genomic regions of high Jensen-Shannon distance (JSD) but low differential mean methylation level (dMML) near promoters of some genes.
- 7A The promoter of EPHA4 shows binding of EZH2 and SUZ12, key components of the histone methyltransferase PRC2, and demonstrates negligible differential methylation between stem cells and brain but high JSD, driven by the PEL parameters, which leads to gain of entropy in brain.
- 7B The promoter of SIM2, a master regulation of neurogenesis, exhibits low level of dMML but high JSD between stem cells and brain, demonstrating large epigenetic distance.
- Figure 8 relates to methylation bistability and entropy. Boxplots of NME distributions within bistable genomic subregions (yellow) as compared to the rest of the genome (purple). The boxes show the 25% quantile, the median, and the 75% quantile, whereas each whisker has a length of 1.5 ⁇ the interquartile range.
- Figure 9 relates to bistability in methylation level and imprinting.
- 9A Genome browser image displaying part of the 11p15.5 chromosomal region associated with H19.
- 9B A portion of the 11p15.5 chromosomal region associated with KCNQ1OT1.
- 9C The 15q11.2 chromosomal region near the SNURF promoter.
- 9D Genome browser image displaying part of the 19q13.43 chromosomal region around the PEG3 / ZIM2 promoter.
- Bistable methylation marks shown for a number of normal tissues, coincide with the location of the PEG3 / ZIM2 ICR that exhibits CTCF binding. Note that the ICR also includes the transcriptional start site of the imprinted gene MIMT1.
- 9E Genome browser image displaying part of the 7q32.2 chromosomal region around the MEST / MESTIT1 promoter.
- Bistable methylation marks shown for a number of normal tissues, coincide with areas rich in CTCF binding sites.
- Figure 10 relates to entropy blocks and TAD boundaries.
- 10A In the normal/cancer panel, a subset of known TAD boundary annotations in H1 stem cells appeared to be associated with boundaries of entropic blocks (green: ordered, red: disordered), suggesting that TADs may maintain a consistent level of methylation entropy within themselves.
- 10B Another example showing that the location of TAD boundaries may associate with boundaries of ordered (green) or disordered (red) blocks.
- Figure 11 relates to entropy blocks and TAD boundaries. Regions of entopic transitions can be effectively used to identify the location of some TAD boundaries (black squares). Since TADs are cell-type invariant, the location of more TAD boundaries can be identified by using additional WGBS data corresponding to distinct phenotypes.
- Figure 12 relates to entropy blocks and TAD boundaries. Probability densities and cumulative probability distributions (insert) of TAD boundary location error and TAD sizes.
- Figure 13 relates to information-theoretic properties of methylation channels (MCs). Boxplots of genome-wide ICs, RDEs and CGEs at individual CpG sites show global differences among genomic samples. The boxes show the 25% quantile, the median, and the 75% quantile, whereas each whisker has a length of 1.5 ⁇ the interquartile range.
- Figure 14 pertains to the breakdown of information-theoretic properties of methylation channels (MCs) within genomic features throughout the genome in various genomic samples. Boxplots of information-theoretic properties of MCs for all genomic samples used in this study within CGIs, shores, shelves, open seas, TSSs, exons, introns, and intergenic regions.
- 14A Information capacity (IC).
- 14B Relative dissipated energy (RDE). The boxes show the 25% quantile, the median, and the 75% quantile, whereas each whisker has a length of 1.5 ⁇ the interquartile range.
- Figure 15 shows that information-theoretic properties of methylation channels (MCs) can be used to predict large-scale chromatin organization.
- 15A Analysis of Hi-C and WGBS data reveals that maintenance of the methylation state within compartment B (blue) in EBV cells is mainly performed by MCs with low information capacity (IC) that dissipate low amounts of energy (RDE) resulting in a relatively disordered (NME) and less methylated (MML) state than in compartment A (brown).
- IC information capacity
- RDE dissipate low amounts of energy
- NME relatively disordered
- MML less methylated
- 15C An example of random forest based prediction of A/B compartments (AB) in EBV cells using information-theoretic properties of methylation maintenance.
- Figure 16 relates to A/B compartment switching.
- Figure 17 relates to A/B compartment switching and clustering of genomic samples. Net percentage of A/B compartment switching was used as a dissimilarity measure in hierarchical agglomerative clustering. At a given height, a cluster is characterized by lower overall compartment switching than an alternative grouping of genomic samples.
- Figure 18 relates to compartment B overlapping hypomethylated blocks, LADs, and LOCKs, as well as its enrichment in high epigenetic distances.
- 18A Genome browser images of two chromosomal regions show significant overlap of compartment B in normal lung (blue) with hypomethylated blocks, LADs, and LOCKs. Gain in JSD is observed within compartment B (blue) in normal lung during carcinogenesis.
- 18B Boxplots of genome-wide JSD distributions within compartments A (brown) and B (blue) in normal colon, liver and lung demonstrate gain in JSD within compartment B in cancer. The boxes show the 25% quantile, the median, and the 75% quantile, whereas each whisker has a length of 1.5 ⁇ the interquartile range.
- Figure 19 relates to the relocation of compartments A and B in cancer.
- 19A The HOXA cluster of developmental genes is within compartment B in normal colon, liver and lung. It is however relocated to compartment A in colon and liver cancer but not in lung cancer. Compartmental reorganization of the HOXA genes is accompanied by marked hypomethylation and entropy loss within selected loci, implicating a role of chromatin reorganization in altered HOXA gene expression within tumors.
- 19B The HOXD genes are within compartment B in normal colon, liver and lung and are relocated to compartment A in all three cancers.
- 19C SOX9 is within compartment B in colon and lung normal and is relocated to compartment B only in colon cancer.
- SYK is within compartment B in colon and lung normal and it is relocated to compartment B both in colon and lung cancer.
- Figure 20 relates to computing and comparing entropic sensitivity.
- 20A Gain of entropy and loss in the entropic sensitivity index (ESI) is observed within a portion of the CGI associated with WNT1.
- 20B Large differences in entropic sensitivity (dESI) may be observed genome-wide between normal and cancer tissues (visualized here for a large section of chromosome 1), exhibiting alternate bands of hyposensitivity and hypersensitivity.
- 20C Boxplots of genome-wide ESI distributions corresponding to the genomic samples used in this study reveal global differences in entropic sensitivity across genomic samples. The boxes show the 25% quantile, the median, and the 75% quantile, whereas each whisker has a length of 1.5 ⁇ the interquartile range.
- Figure 21 pertains to the breakdown of entropic sensitivity within various genomic features throughout the genome in various genomic samples. Boxplots of genome-wide distributions of the entropic sensitivity index (ESI) for all genomic samples used in this study within CGIs, shores, shelves, open seas, TSSs, exons, introns, and intergenic regions. The boxes show the 25% quantile, the median, and the 75% quantile, whereas each whisker has a length of 1.5 ⁇ the interquartile range.
- EI entropic sensitivity index
- Figure 22 shows a wide behavior of entropic sensitivity in the genome.
- 22A An example of ESI values in colon normal tissue shows wide-spread entropic sensitivity along the genome. However, unmethylated CGIs may exhibit low entropic sensitivity.
- KLHL21 is a substrate-specific adapter of a BCR (BTB-CUL3-RBX1) E3 ubiquitin-protein ligase complex required for efficient chromosome alignment and cytokinesis. PHF13 regulates chromatin structure.
- THAP3 is required for regulation of RRM1 that may play a role in malignancies and disease.
- 22B In liver normal cells, substantial entropic sensitivity is observed within the CGI near the promoter of the polycomb target gene ENSA, which is significantly reduced in liver cancer. ENSA is known to be hypomethylated in liver cancer.
- 22C In lung normal cells, the CGI near the promoter of NEU1 exhibits low entropic sensitivity, which is significantly increased in lung cancer. NEU1 sialidase is required for normal lung development and function, whereas its expression has been implicated in tumorigenesis and metastatic potential.
- 22D In young CD4 + lymphocytes, substantial entropic sensitivity is observed within the CGI near the promoter of CYP2E1, which is lost in old individuals. CYP2E1 is known to be downregulated with age. 22E: The CGI near the promoter of FLNB exhibits gain in entropic sensitivity in old CD4 + lymphocytes. FLNB is known to be downregulated with age.
- Figure 23 pertains to the breakdown of entropic sensitivity within compartments A and B in various genomic samples. Boxplots of genome-wide ESI distributions within compartment A (brown) and compartment B (blue) show that entropic sensitivity is higher within compartment A than within compartment B. The boxes show the 25% quantile, the median, and the 75% quantile, whereas each whisker has a length of 1. 5 ⁇ the interquartile range.
- Supplementary Table 1 provides a list of all WGBS genomic samples used in this disclosure.
- Supplementary Table 2 provides the results of statistical analysis for EZH2/SUZ 12 binding association with promoters and enhancers at genomic loci characterized by high Jensen-Shannon distance (JSD).
- Supplementary Table 3 provides the results of odds ratio (OR) analysis of bistability enrichment in CGIs, shores, promoters, and gene bodies.
- Supplementary Data 1 provides gene rankings for some genomic sample pairs based on the magnitude of the differential methylation level (dMML), the Jensen-Shannon distance (JSD), and the relative Jensen-Shannon distance (RJSD). Supplementary Data 1 as attached hereto includes a portion of the collective data set as a representative sample.
- dMML differential methylation level
- JSD Jensen-Shannon distance
- RJSD relative Jensen-Shannon distance
- Supplementary Data 2 provides Gene Ontology (GO) annotation results for some genomic sample pairs using gene rankings based on the magnitude of the differential mean methylation level (dMML), the Jensen-Shannon distance (JSD), and the relative Jensen-Shannon distance (RJSD). Supplementary Data 2 as attached hereto includes a portion of the collective data set as a representative sample.
- dMML differential mean methylation level
- JSD Jensen-Shannon distance
- RJSD relative Jensen-Shannon distance
- Supplementary Data 3 provides a list of ranked genes based on a bistability score and its association with a list of imprinted genes (CPOE) as well as a list of genes exhibiting monoallelic expression (MAE). Supplementary Data 3 as attached hereto includes a portion of the collective data set as a representative sample.
- Supplementary Data 4 shows a matrix of A/B compartment switching frequencies among 34 genomic samples. Supplementary Data 4 is attached hereto in its entirety.
- Supplementary Data 5 provides a list of gene rankings based on a decreasing differential entropic sensitivity index (dESI) when comparing colon normal to colon cancer.
- Supplementary Data 5 as attached hereto includes a portion of the collective data set as a representative sample.
Landscapes
- Physics & Mathematics (AREA)
- Health & Medical Sciences (AREA)
- Life Sciences & Earth Sciences (AREA)
- Engineering & Computer Science (AREA)
- Bioinformatics & Cheminformatics (AREA)
- Medical Informatics (AREA)
- Biotechnology (AREA)
- Biophysics (AREA)
- Evolutionary Biology (AREA)
- Bioinformatics & Computational Biology (AREA)
- Spectroscopy & Molecular Physics (AREA)
- General Health & Medical Sciences (AREA)
- Theoretical Computer Science (AREA)
- Proteomics, Peptides & Aminoacids (AREA)
- Chemical & Material Sciences (AREA)
- Analytical Chemistry (AREA)
- Genetics & Genomics (AREA)
- Molecular Biology (AREA)
- Computer Vision & Pattern Recognition (AREA)
- Software Systems (AREA)
- Public Health (AREA)
- Evolutionary Computation (AREA)
- Epidemiology (AREA)
- Databases & Information Systems (AREA)
- Data Mining & Analysis (AREA)
- Bioethics (AREA)
- Artificial Intelligence (AREA)
- Measuring Or Testing Involving Enzymes Or Micro-Organisms (AREA)
- Analysing Materials By The Use Of Radiation (AREA)
Claims (11)
- Ein Verfahren zum Durchführen epigenetischer Analyse, beinhaltend das Berechnen einer epigenetischen Landschaft der potenziellen Energie (Potential Energy Landscape; PEL) oder der entsprechenden gemeinsamen Probabilitätsverteilung einer Genomregion innerhalb einer oder mehrerer genomischer Proben, wobei die PEL wie folgt definiert ist:
 ▪ V x(x) die PEL innerhalb einer Genomregion ist,▪ P x(x) die gemeinsame Probabilität der Zufallsvariablen X ist, die den Methylierungszustand der modellierten Methylierungsstellen darstellt und innerhalb der Genomregion einen Wert x annimmt, und▪ φ0 eine Konstante ist;und wobei die gemeinsame Probabilitätsverteilung einer Genomregion wie folgt errechnet wird:
 ▪ P x(x) die gemeinsame Probabilität der Zufallsvariablen X ist, die den Methylierungszustand der modellierten Methylierungsstellen darstellt und innerhalb der Genomregion einen Wert x annimmt,▪ V x(x) die PEL innerhalb der Genomregion ist und▪ Z die durch ein rekursives Verfahren errechnete Partitionsfunktion ist;wobei das Berechnen der PEL Folgendes beinhaltet:a) Partitionieren eines Genoms in diskrete Genomregionen;b) Analysieren des Methylierungszustands innerhalb einer Genomregion durch Anpassen eines parametrischen statistischen Modells (das Modell), das Abhängigkeit der Methylierungszustände an einzelnen Methylierungsstellen untereinander berücksichtigt und bei dem die Zahl von Parametern langsamer wächst als geometrisch bei der Zahl von Methylierungsstellen innerhalb der Region, an Methylierungsdaten; undc) Errechnen und Analysieren einer PEL oder der entsprechenden gemeinsamen Probabilitätsverteilung innerhalb der Genomregion und/oder ihrer Teilregionen und/oder zusammengefasster Superregionen, wodurch eine epigenetische Analyse durchgeführt wird, wobei die PEL wie folgt berechnet wird:
 ▪ V x(x) die PEL innerhalb einer Genomregion ist,▪ N die Zahl modellierter Methylierungsstellen innerhalb der Genomregion ist und▪ {a 1,...,aN } und {c 2,...,cN } Parameter des Modells sind, wobei die PEL-Parameter {a 1,...,aN } und {c 2,...,cN } durch Festsetzen von an = α + βρn und cn = γ/dn spezifiziert sind, wobei ρ n die CpG-Dichte der n-ten modellierten Methylierungsstelle ist und dn der Abstand der n-ten modellierten Methylierungsstelle von ihrer "nächsten benachbarten" modellierten Methylierungsstelle n - 1 ist;und wobei das Verfahren unter Verwendung eines auf einem Computersystem ablaufenden Computerprogramms umgesetzt wird.
 - Verfahren gemäß Anspruch 1, wobei jede diskrete Genomregion etwa 3000 Basenpaare lang ist und die Teilregionen etwa 150 Basenpaare lang sind.
- Verfahren gemäß Anspruch 1, wobei die Parameter α, β, γ anhand von Methylierungsdaten unter Verwendung eines Ansatzes der maximalen Wahrscheinlichkeit abgeschätzt werden.
- Verfahren gemäß Anspruch 1, ferner beinhaltend das Vergleichen der PEL oder ihrer assoziierten gemeinsamen Probabilitätsverteilung, berechnet für eine Genomregion eines ersten Genoms, mit einer anderen PEL oder ihrer assoziierten gemeinsamen Probabilitätsverteilung, berechnet für die entsprechende Genomregion eines zweiten Genoms, wobei optional PEL-Vergleiche für Genomregionen über das gesamte erste und zweite Genom hinweg durchgeführt werden.
- Verfahren gemäß Anspruch 1, wobei das Analysieren der PEL ferner das Quantifizieren des Methylierungsgrades innerhalb von Genomteilregionen beinhaltet.
- Verfahren gemäß Anspruch 5, wobei der Methylierungsgrad innerhalb einer Genomteilregion unter Verwendung der folgenden Formel quantifiziert wird:
 ▪ L der Methylierungsgrad innerhalb einer Genomteilregion ist,▪ N die Zahl modellierter Methylierungsstellen innerhalb der Genomteilregion ist und▪ Xn eine Zufallsvariable ist, die den Wert 0 annimmt, wenn die n-te modellierte Methylierungsstelle der Genomteilregion unmethyliert ist, und 1, wenn die Stelle methyliert ist.
 - Verfahren gemäß Anspruch 5, ferner beinhaltend das Berechnen einer Probabilitätsverteilung für den Methylierungsgrad innerhalb einer Genomteilregion.
- Verfahren gemäß Anspruch 7, wobei die Probabilitätsverteilung des Methylierungsgrades wie folgt errechnet wird:
 ▪ PL (l) die Probabilität der Zufallsvariablen L für den Methylierungsgrad ist, die innerhalb einer Genomteilregion einen Wert l annimmt,▪ P x(x) die gemeinsame Probabilität der Zufallsvariablen X ist, die den Methylierungszustand der modellierten Methylierungsstellen darstellt und innerhalb der Genomregion einen Wert x annimmt, berechnet mit dem Verfahren gemäß Anspruch 7,▪ S(lN) der Satz aller Methylierungszustände innerhalb der Genomteilregion mit exakt l × N modellierten Methylierungsstellen, die methyliert sind, ist und▪ N die Zahl modellierter Methylierungsstellen innerhalb der Genomteilregion ist.
 - Verfahren gemäß Anspruch 1, ferner beinhaltend das Annotieren von genomischen Merkmalen durch Analysieren der gemeinsamen Probabilitätsverteilung oder der Derivatzusammenfassungen, die die genomischen Merkmale überlappen, wobei die genomischen Merkmale optional aus der Gruppe ausgewählt sind, die aus Genen, Genepromotoren, Introns, Exons, Transkriptionsstartstellen (TSS), CpG-Inseln (CGI), CGI-Insel-Shores, CGI-Shelves, differenziell methylierten Regionen (DMR), Entropieblöcken (EB), topologisch assoziierten Domänen (TAD), hypomethylierten Blöcken, laminassoziierten Domänen (LAD), großen organisierten Chromatin-K9-Modifikationen (LOCK), Prägungssteuerungsregionen (ICR) und Transkriptionsfaktorbindungsstellen besteht.
- Verfahren gemäß Anspruch 1, beinhaltend das Gewinnen von Methylierungsdaten aus einer oder mehreren Techniken, ausgewählt aus der Gruppe, bestehend aus Ganzgenom-Bisulfit-DNA-Sequenzierung, gezielter PCR-Bisulfit-DNA-Sequenzierung, Bisulfit-Einfangsequenzierung, auf Nanoporen basierender Sequenzierung, Einzelmolekül-Echtzeitsequenzierung, Bisulfit-Pyrosequenzierung, GemCode-Sequenzierung, 454-Sequenzierung, insertionsmarkierter Sequenzierung oder anderen verwandten Verfahren.
- Ein nicht flüchtiges, computerlesbares Speichermedium, das mit einem Computerprogramm codiert ist, wobei das Programm Anweisungen beinhaltet, die bei Ausführung durch einen oder mehrere Prozessoren dazu führen, dass der eine oder die mehreren Prozessoren Abläufe durchführen, um das Verfahren gemäß den Ansprüchen 1-10 durchzuführen.
Applications Claiming Priority (2)
| Application Number | Priority Date | Filing Date | Title |
|---|---|---|---|
| US201662351056P | 2016-06-16 | 2016-06-16 | |
| PCT/US2017/037900 WO2017218908A2 (en) | 2016-06-16 | 2017-06-16 | Methods and system for epigenetic analysis |
Publications (3)
| Publication Number | Publication Date |
|---|---|
| EP3472358A2 EP3472358A2 (de) | 2019-04-24 |
| EP3472358A4 EP3472358A4 (de) | 2020-02-26 |
| EP3472358B1 true EP3472358B1 (de) | 2021-08-18 |
Family
ID=60664277
Family Applications (1)
| Application Number | Title | Priority Date | Filing Date |
|---|---|---|---|
| EP17814184.2A Active EP3472358B1 (de) | 2016-06-16 | 2017-06-16 | Verfahren und system für epigenetische analyse |
Country Status (6)
| Country | Link |
|---|---|
| US (1) | US20220076779A1 (de) |
| EP (1) | EP3472358B1 (de) |
| JP (1) | JP7066643B2 (de) |
| AU (1) | AU2017285496B2 (de) |
| ES (1) | ES2897550T3 (de) |
| WO (1) | WO2017218908A2 (de) |
Families Citing this family (10)
| Publication number | Priority date | Publication date | Assignee | Title |
|---|---|---|---|---|
| JP7429338B2 (ja) | 2017-01-10 | 2024-02-08 | ジュノー セラピューティクス インコーポレイテッド | 細胞療法および関連方法のエピジェネティック解析 |
| CN110853706B (zh) * | 2018-08-01 | 2022-07-22 | 中国科学院深圳先进技术研究院 | 一种整合表观遗传组学的肿瘤克隆组成构建方法及系统 |
| CN109213833A (zh) * | 2018-09-10 | 2019-01-15 | 成都四方伟业软件股份有限公司 | 二分类模型训练方法、数据分类方法及对应装置 |
| CN110428319B (zh) * | 2019-08-05 | 2021-04-27 | 深圳乐信软件技术有限公司 | 一种数据比对平台、方法、设备和存储介质 |
| US11795495B1 (en) * | 2019-10-02 | 2023-10-24 | FOXO Labs Inc. | Machine learned epigenetic status estimator |
| US11887698B2 (en) | 2020-01-08 | 2024-01-30 | Samsung Electronics Co., Ltd. | Method and electronic device for building comprehensive genome scale metabolic model |
| CN112102878B (zh) * | 2020-09-16 | 2024-01-26 | 张云鹏 | 一种LncRNA学习系统 |
| EP4265738A1 (de) * | 2022-03-03 | 2023-10-25 | Beijing OriginPoly Bio-Tec Co., Ltd. | Kombination von dna-methylierungsmarkern und deren verwendung, primer, sonden und kit zur früherkennung von eierstockkrebs |
| CN114480655A (zh) * | 2022-03-03 | 2022-05-13 | 北京起源聚禾生物科技有限公司 | Dna甲基化标志物组合及应用、卵巢癌早期检测引物探针及试剂盒 |
| CN116642819B (zh) * | 2023-07-19 | 2023-10-10 | 江苏得康生物科技有限公司 | 细胞群的识别方法及其装置 |
Family Cites Families (8)
| Publication number | Priority date | Publication date | Assignee | Title |
|---|---|---|---|---|
| US5695934A (en) | 1994-10-13 | 1997-12-09 | Lynx Therapeutics, Inc. | Massively parallel sequencing of sorted polynucleotides |
| US5888737A (en) | 1997-04-15 | 1999-03-30 | Lynx Therapeutics, Inc. | Adaptor-based sequence analysis |
| GB0507835D0 (en) | 2005-04-18 | 2005-05-25 | Solexa Ltd | Method and device for nucleic acid sequencing using a planar wave guide |
| US7514952B2 (en) | 2005-06-29 | 2009-04-07 | Altera Corporation | I/O circuitry for reducing ground bounce and VCC sag in integrated circuit devices |
| EP3373174A1 (de) | 2006-03-31 | 2018-09-12 | Illumina, Inc. | Systeme und vorrichtungen zur "sequence-by-synthesis"-analyse |
| WO2010065916A1 (en) | 2008-12-04 | 2010-06-10 | Rush University Medical Center | Dna methylation based test for monitoring efficacy of treatment |
| EP2707506B1 (de) | 2011-05-12 | 2018-07-11 | The Johns Hopkins University | Verfahren zum nachweis von krebs durch allgemeinen stabilitätsverlust epigenetischer domänen und zusammensetzungen dafür |
| NZ706269A (en) * | 2012-09-20 | 2016-08-26 | Univ Hong Kong Chinese | Non-invasive determination of methylome of fetus or tumor from plasma |
-
2017
- 2017-06-16 JP JP2018566224A patent/JP7066643B2/ja active Active
- 2017-06-16 AU AU2017285496A patent/AU2017285496B2/en active Active
- 2017-06-16 ES ES17814184T patent/ES2897550T3/es active Active
- 2017-06-16 EP EP17814184.2A patent/EP3472358B1/de active Active
- 2017-06-16 WO PCT/US2017/037900 patent/WO2017218908A2/en unknown
- 2017-06-16 US US16/310,176 patent/US20220076779A1/en active Pending
Also Published As
| Publication number | Publication date |
|---|---|
| AU2017285496B2 (en) | 2023-02-23 |
| US20220076779A1 (en) | 2022-03-10 |
| AU2017285496A1 (en) | 2019-01-24 |
| WO2017218908A2 (en) | 2017-12-21 |
| JP7066643B2 (ja) | 2022-05-13 |
| EP3472358A4 (de) | 2020-02-26 |
| JP2019522285A (ja) | 2019-08-08 |
| WO2017218908A3 (en) | 2018-01-18 |
| EP3472358A2 (de) | 2019-04-24 |
| ES2897550T3 (es) | 2022-03-01 |
Similar Documents
| Publication | Publication Date | Title |
|---|---|---|
| EP3472358B1 (de) | Verfahren und system für epigenetische analyse | |
| Jenkinson et al. | Potential energy landscapes identify the information-theoretic nature of the epigenome | |
| US20200251180A1 (en) | Resolving genome fractions using polymorphism counts | |
| CN109072300B (zh) | 区分复杂生物样品中的甲基化水平 | |
| US20220246234A1 (en) | Using cell-free dna fragment size to detect tumor-associated variant | |
| Kho et al. | Transcriptomic analysis of human lung development | |
| US20190218615A1 (en) | Maternal plasma transcriptome analysis by massively parallel rna sequencing | |
| Chen et al. | Methods for identifying differentially methylated regions for sequence-and array-based data | |
| Simpson et al. | Detecting DNA methylation using the oxford nanopore technologies MinION sequencer | |
| Lefrançois et al. | TruSeq-based gene expression analysis of formalin-fixed paraffin-embedded (FFPE) cutaneous T-cell lymphoma samples: subgroup analysis results and elucidation of biases from FFPE sample processing on the TruSeq platform | |
| Słowiński et al. | GeTallele: A Method for Analysis of DNA and RNA Allele Frequency Distributions | |
| Chang et al. | Mapping transcription mechanisms from multimodal genomic data | |
| Jenkinson et al. | Potential energy landscapes reveal the information-theoretic nature of the epigenome | |
| Tanić et al. | Performance comparison and in-silico harmonisation of commercial platforms for DNA methylome analysis by targeted bisulfite sequencing | |
| Scherer | Computational solutions for addressing heterogeneity in DNA methylation data | |
| Ober-Reynolds et al. | Integrated single-cell chromatin and transcriptomic analyses of human scalp reveal etiological insights into genetic risk for hair and skin disease | |
| Galvan Femenia et al. | Identification of intergenerational epigenetic inheritance by whole genome DNA methylation analysis in trios |
Legal Events
| Date | Code | Title | Description |
|---|---|---|---|
| STAA | Information on the status of an ep patent application or granted ep patent |
Free format text: STATUS: THE INTERNATIONAL PUBLICATION HAS BEEN MADE |
|
| PUAI | Public reference made under article 153(3) epc to a published international application that has entered the european phase |
Free format text: ORIGINAL CODE: 0009012 |
|
| STAA | Information on the status of an ep patent application or granted ep patent |
Free format text: STATUS: REQUEST FOR EXAMINATION WAS MADE |
|
| STAA | Information on the status of an ep patent application or granted ep patent |
Free format text: STATUS: REQUEST FOR EXAMINATION WAS MADE |
|
| 17P | Request for examination filed |
Effective date: 20181217 |
|
| AK | Designated contracting states |
Kind code of ref document: A2 Designated state(s): AL AT BE BG CH CY CZ DE DK EE ES FI FR GB GR HR HU IE IS IT LI LT LU LV MC MK MT NL NO PL PT RO RS SE SI SK SM TR |
|
| AX | Request for extension of the european patent |
Extension state: BA ME |
|
| DAV | Request for validation of the european patent (deleted) | ||
| DAX | Request for extension of the european patent (deleted) | ||
| A4 | Supplementary search report drawn up and despatched |
Effective date: 20200123 |
|
| RIC1 | Information provided on ipc code assigned before grant |
Ipc: G16B 20/00 20190101ALI20200117BHEP Ipc: C12Q 1/68 20180101AFI20200117BHEP Ipc: G16B 40/00 20190101ALI20200117BHEP |
|
| GRAP | Despatch of communication of intention to grant a patent |
Free format text: ORIGINAL CODE: EPIDOSNIGR1 |
|
| STAA | Information on the status of an ep patent application or granted ep patent |
Free format text: STATUS: GRANT OF PATENT IS INTENDED |
|
| INTG | Intention to grant announced |
Effective date: 20210304 |
|
| GRAS | Grant fee paid |
Free format text: ORIGINAL CODE: EPIDOSNIGR3 |
|
| GRAA | (expected) grant |
Free format text: ORIGINAL CODE: 0009210 |
|
| STAA | Information on the status of an ep patent application or granted ep patent |
Free format text: STATUS: THE PATENT HAS BEEN GRANTED |
|
| AK | Designated contracting states |
Kind code of ref document: B1 Designated state(s): AL AT BE BG CH CY CZ DE DK EE ES FI FR GB GR HR HU IE IS IT LI LT LU LV MC MK MT NL NO PL PT RO RS SE SI SK SM TR |
|
| REG | Reference to a national code |
Ref country code: GB Ref legal event code: FG4D |
|
| REG | Reference to a national code |
Ref country code: CH Ref legal event code: EP |
|
| REG | Reference to a national code |
Ref country code: DE Ref legal event code: R096 Ref document number: 602017044394 Country of ref document: DE |
|
| REG | Reference to a national code |
Ref country code: IE Ref legal event code: FG4D Ref country code: AT Ref legal event code: REF Ref document number: 1421685 Country of ref document: AT Kind code of ref document: T Effective date: 20210915 |
|
| REG | Reference to a national code |
Ref country code: LT Ref legal event code: MG9D |
|
| REG | Reference to a national code |
Ref country code: NL Ref legal event code: MP Effective date: 20210818 |
|
| REG | Reference to a national code |
Ref country code: AT Ref legal event code: MK05 Ref document number: 1421685 Country of ref document: AT Kind code of ref document: T Effective date: 20210818 |
|
| PG25 | Lapsed in a contracting state [announced via postgrant information from national office to epo] |
Ref country code: SE Free format text: LAPSE BECAUSE OF FAILURE TO SUBMIT A TRANSLATION OF THE DESCRIPTION OR TO PAY THE FEE WITHIN THE PRESCRIBED TIME-LIMIT Effective date: 20210818 Ref country code: RS Free format text: LAPSE BECAUSE OF FAILURE TO SUBMIT A TRANSLATION OF THE DESCRIPTION OR TO PAY THE FEE WITHIN THE PRESCRIBED TIME-LIMIT Effective date: 20210818 Ref country code: FI Free format text: LAPSE BECAUSE OF FAILURE TO SUBMIT A TRANSLATION OF THE DESCRIPTION OR TO PAY THE FEE WITHIN THE PRESCRIBED TIME-LIMIT Effective date: 20210818 Ref country code: HR Free format text: LAPSE BECAUSE OF FAILURE TO SUBMIT A TRANSLATION OF THE DESCRIPTION OR TO PAY THE FEE WITHIN THE PRESCRIBED TIME-LIMIT Effective date: 20210818 Ref country code: NO Free format text: LAPSE BECAUSE OF FAILURE TO SUBMIT A TRANSLATION OF THE DESCRIPTION OR TO PAY THE FEE WITHIN THE PRESCRIBED TIME-LIMIT Effective date: 20211118 Ref country code: PT Free format text: LAPSE BECAUSE OF FAILURE TO SUBMIT A TRANSLATION OF THE DESCRIPTION OR TO PAY THE FEE WITHIN THE PRESCRIBED TIME-LIMIT Effective date: 20211220 Ref country code: LT Free format text: LAPSE BECAUSE OF FAILURE TO SUBMIT A TRANSLATION OF THE DESCRIPTION OR TO PAY THE FEE WITHIN THE PRESCRIBED TIME-LIMIT Effective date: 20210818 Ref country code: BG Free format text: LAPSE BECAUSE OF FAILURE TO SUBMIT A TRANSLATION OF THE DESCRIPTION OR TO PAY THE FEE WITHIN THE PRESCRIBED TIME-LIMIT Effective date: 20211118 Ref country code: AT Free format text: LAPSE BECAUSE OF FAILURE TO SUBMIT A TRANSLATION OF THE DESCRIPTION OR TO PAY THE FEE WITHIN THE PRESCRIBED TIME-LIMIT Effective date: 20210818 |
|
| PG25 | Lapsed in a contracting state [announced via postgrant information from national office to epo] |
Ref country code: PL Free format text: LAPSE BECAUSE OF FAILURE TO SUBMIT A TRANSLATION OF THE DESCRIPTION OR TO PAY THE FEE WITHIN THE PRESCRIBED TIME-LIMIT Effective date: 20210818 Ref country code: LV Free format text: LAPSE BECAUSE OF FAILURE TO SUBMIT A TRANSLATION OF THE DESCRIPTION OR TO PAY THE FEE WITHIN THE PRESCRIBED TIME-LIMIT Effective date: 20210818 Ref country code: GR Free format text: LAPSE BECAUSE OF FAILURE TO SUBMIT A TRANSLATION OF THE DESCRIPTION OR TO PAY THE FEE WITHIN THE PRESCRIBED TIME-LIMIT Effective date: 20211119 |
|
| REG | Reference to a national code |
Ref country code: ES Ref legal event code: FG2A Ref document number: 2897550 Country of ref document: ES Kind code of ref document: T3 Effective date: 20220301 |
|
| PG25 | Lapsed in a contracting state [announced via postgrant information from national office to epo] |
Ref country code: NL Free format text: LAPSE BECAUSE OF FAILURE TO SUBMIT A TRANSLATION OF THE DESCRIPTION OR TO PAY THE FEE WITHIN THE PRESCRIBED TIME-LIMIT Effective date: 20210818 |
|
| PG25 | Lapsed in a contracting state [announced via postgrant information from national office to epo] |
Ref country code: DK Free format text: LAPSE BECAUSE OF FAILURE TO SUBMIT A TRANSLATION OF THE DESCRIPTION OR TO PAY THE FEE WITHIN THE PRESCRIBED TIME-LIMIT Effective date: 20210818 |
|
| REG | Reference to a national code |
Ref country code: DE Ref legal event code: R097 Ref document number: 602017044394 Country of ref document: DE |
|
| PG25 | Lapsed in a contracting state [announced via postgrant information from national office to epo] |
Ref country code: SM Free format text: LAPSE BECAUSE OF FAILURE TO SUBMIT A TRANSLATION OF THE DESCRIPTION OR TO PAY THE FEE WITHIN THE PRESCRIBED TIME-LIMIT Effective date: 20210818 Ref country code: SK Free format text: LAPSE BECAUSE OF FAILURE TO SUBMIT A TRANSLATION OF THE DESCRIPTION OR TO PAY THE FEE WITHIN THE PRESCRIBED TIME-LIMIT Effective date: 20210818 Ref country code: RO Free format text: LAPSE BECAUSE OF FAILURE TO SUBMIT A TRANSLATION OF THE DESCRIPTION OR TO PAY THE FEE WITHIN THE PRESCRIBED TIME-LIMIT Effective date: 20210818 Ref country code: EE Free format text: LAPSE BECAUSE OF FAILURE TO SUBMIT A TRANSLATION OF THE DESCRIPTION OR TO PAY THE FEE WITHIN THE PRESCRIBED TIME-LIMIT Effective date: 20210818 Ref country code: CZ Free format text: LAPSE BECAUSE OF FAILURE TO SUBMIT A TRANSLATION OF THE DESCRIPTION OR TO PAY THE FEE WITHIN THE PRESCRIBED TIME-LIMIT Effective date: 20210818 Ref country code: AL Free format text: LAPSE BECAUSE OF FAILURE TO SUBMIT A TRANSLATION OF THE DESCRIPTION OR TO PAY THE FEE WITHIN THE PRESCRIBED TIME-LIMIT Effective date: 20210818 |
|
| PLBE | No opposition filed within time limit |
Free format text: ORIGINAL CODE: 0009261 |
|
| STAA | Information on the status of an ep patent application or granted ep patent |
Free format text: STATUS: NO OPPOSITION FILED WITHIN TIME LIMIT |
|
| 26N | No opposition filed |
Effective date: 20220519 |
|
| PG25 | Lapsed in a contracting state [announced via postgrant information from national office to epo] |
Ref country code: IT Free format text: LAPSE BECAUSE OF FAILURE TO SUBMIT A TRANSLATION OF THE DESCRIPTION OR TO PAY THE FEE WITHIN THE PRESCRIBED TIME-LIMIT Effective date: 20210818 |
|
| PG25 | Lapsed in a contracting state [announced via postgrant information from national office to epo] |
Ref country code: SI Free format text: LAPSE BECAUSE OF FAILURE TO SUBMIT A TRANSLATION OF THE DESCRIPTION OR TO PAY THE FEE WITHIN THE PRESCRIBED TIME-LIMIT Effective date: 20210818 |
|
| PG25 | Lapsed in a contracting state [announced via postgrant information from national office to epo] |
Ref country code: MC Free format text: LAPSE BECAUSE OF FAILURE TO SUBMIT A TRANSLATION OF THE DESCRIPTION OR TO PAY THE FEE WITHIN THE PRESCRIBED TIME-LIMIT Effective date: 20210818 |
|
| REG | Reference to a national code |
Ref country code: BE Ref legal event code: MM Effective date: 20220630 |
|
| PG25 | Lapsed in a contracting state [announced via postgrant information from national office to epo] |
Ref country code: LU Free format text: LAPSE BECAUSE OF NON-PAYMENT OF DUE FEES Effective date: 20220616 Ref country code: IE Free format text: LAPSE BECAUSE OF NON-PAYMENT OF DUE FEES Effective date: 20220616 |
|
| PG25 | Lapsed in a contracting state [announced via postgrant information from national office to epo] |
Ref country code: BE Free format text: LAPSE BECAUSE OF NON-PAYMENT OF DUE FEES Effective date: 20220630 |
|
| P01 | Opt-out of the competence of the unified patent court (upc) registered |
Effective date: 20230515 |
|
| PGFP | Annual fee paid to national office [announced via postgrant information from national office to epo] |
Ref country code: FR Payment date: 20230626 Year of fee payment: 7 Ref country code: DE Payment date: 20230626 Year of fee payment: 7 |
|
| PGFP | Annual fee paid to national office [announced via postgrant information from national office to epo] |
Ref country code: GB Payment date: 20230627 Year of fee payment: 7 Ref country code: ES Payment date: 20230703 Year of fee payment: 7 Ref country code: CH Payment date: 20230702 Year of fee payment: 7 |
|
| PG25 | Lapsed in a contracting state [announced via postgrant information from national office to epo] |
Ref country code: HU Free format text: LAPSE BECAUSE OF FAILURE TO SUBMIT A TRANSLATION OF THE DESCRIPTION OR TO PAY THE FEE WITHIN THE PRESCRIBED TIME-LIMIT; INVALID AB INITIO Effective date: 20170616 |
|
| PG25 | Lapsed in a contracting state [announced via postgrant information from national office to epo] |
Ref country code: MK Free format text: LAPSE BECAUSE OF FAILURE TO SUBMIT A TRANSLATION OF THE DESCRIPTION OR TO PAY THE FEE WITHIN THE PRESCRIBED TIME-LIMIT Effective date: 20210818 Ref country code: CY Free format text: LAPSE BECAUSE OF FAILURE TO SUBMIT A TRANSLATION OF THE DESCRIPTION OR TO PAY THE FEE WITHIN THE PRESCRIBED TIME-LIMIT Effective date: 20210818 |