EP3438643A1 - Baseline pulse value calculation method and hematology analyzer particle count method - Google Patents
Baseline pulse value calculation method and hematology analyzer particle count method Download PDFInfo
- Publication number
- EP3438643A1 EP3438643A1 EP17773223.7A EP17773223A EP3438643A1 EP 3438643 A1 EP3438643 A1 EP 3438643A1 EP 17773223 A EP17773223 A EP 17773223A EP 3438643 A1 EP3438643 A1 EP 3438643A1
- Authority
- EP
- European Patent Office
- Prior art keywords
- data
- datum
- pulse
- value
- memory
- Prior art date
- Legal status (The legal status is an assumption and is not a legal conclusion. Google has not performed a legal analysis and makes no representation as to the accuracy of the status listed.)
- Granted
Links
- 238000004364 calculation method Methods 0.000 title claims abstract description 67
- 238000000034 method Methods 0.000 title claims abstract description 38
- 239000002245 particle Substances 0.000 title claims abstract description 23
- 238000005070 sampling Methods 0.000 claims description 41
- 230000007425 progressive decline Effects 0.000 claims description 8
- 230000007423 decrease Effects 0.000 claims description 6
- 210000000601 blood cell Anatomy 0.000 abstract description 2
- 210000004027 cell Anatomy 0.000 description 22
- 238000001514 detection method Methods 0.000 description 7
- 210000001772 blood platelet Anatomy 0.000 description 6
- 238000003491 array Methods 0.000 description 5
- 238000005259 measurement Methods 0.000 description 5
- 210000003743 erythrocyte Anatomy 0.000 description 4
- 210000004369 blood Anatomy 0.000 description 2
- 239000008280 blood Substances 0.000 description 2
- 238000009825 accumulation Methods 0.000 description 1
- 230000003247 decreasing effect Effects 0.000 description 1
- 210000000265 leukocyte Anatomy 0.000 description 1
- 230000000750 progressive effect Effects 0.000 description 1
Images


Classifications
-
- G—PHYSICS
- G01—MEASURING; TESTING
- G01N—INVESTIGATING OR ANALYSING MATERIALS BY DETERMINING THEIR CHEMICAL OR PHYSICAL PROPERTIES
- G01N15/00—Investigating characteristics of particles; Investigating permeability, pore-volume or surface-area of porous materials
- G01N15/10—Investigating individual particles
- G01N15/14—Optical investigation techniques, e.g. flow cytometry
- G01N15/1456—Optical investigation techniques, e.g. flow cytometry without spatial resolution of the texture or inner structure of the particle, e.g. processing of pulse signals
- G01N15/1459—Optical investigation techniques, e.g. flow cytometry without spatial resolution of the texture or inner structure of the particle, e.g. processing of pulse signals the analysis being performed on a sample stream
-
- G—PHYSICS
- G01—MEASURING; TESTING
- G01N—INVESTIGATING OR ANALYSING MATERIALS BY DETERMINING THEIR CHEMICAL OR PHYSICAL PROPERTIES
- G01N15/00—Investigating characteristics of particles; Investigating permeability, pore-volume or surface-area of porous materials
- G01N15/10—Investigating individual particles
-
- G—PHYSICS
- G01—MEASURING; TESTING
- G01D—MEASURING NOT SPECIALLY ADAPTED FOR A SPECIFIC VARIABLE; ARRANGEMENTS FOR MEASURING TWO OR MORE VARIABLES NOT COVERED IN A SINGLE OTHER SUBCLASS; TARIFF METERING APPARATUS; MEASURING OR TESTING NOT OTHERWISE PROVIDED FOR
- G01D5/00—Mechanical means for transferring the output of a sensing member; Means for converting the output of a sensing member to another variable where the form or nature of the sensing member does not constrain the means for converting; Transducers not specially adapted for a specific variable
- G01D5/12—Mechanical means for transferring the output of a sensing member; Means for converting the output of a sensing member to another variable where the form or nature of the sensing member does not constrain the means for converting; Transducers not specially adapted for a specific variable using electric or magnetic means
- G01D5/244—Mechanical means for transferring the output of a sensing member; Means for converting the output of a sensing member to another variable where the form or nature of the sensing member does not constrain the means for converting; Transducers not specially adapted for a specific variable using electric or magnetic means influencing characteristics of pulses or pulse trains; generating pulses or pulse trains
- G01D5/24471—Error correction
- G01D5/2448—Correction of gain, threshold, offset or phase control
-
- G—PHYSICS
- G01—MEASURING; TESTING
- G01N—INVESTIGATING OR ANALYSING MATERIALS BY DETERMINING THEIR CHEMICAL OR PHYSICAL PROPERTIES
- G01N15/00—Investigating characteristics of particles; Investigating permeability, pore-volume or surface-area of porous materials
- G01N15/10—Investigating individual particles
- G01N15/1031—Investigating individual particles by measuring electrical or magnetic effects
- G01N15/12—Investigating individual particles by measuring electrical or magnetic effects by observing changes in resistance or impedance across apertures when traversed by individual particles, e.g. by using the Coulter principle
-
- G—PHYSICS
- G01—MEASURING; TESTING
- G01N—INVESTIGATING OR ANALYSING MATERIALS BY DETERMINING THEIR CHEMICAL OR PHYSICAL PROPERTIES
- G01N15/00—Investigating characteristics of particles; Investigating permeability, pore-volume or surface-area of porous materials
- G01N15/10—Investigating individual particles
- G01N15/14—Optical investigation techniques, e.g. flow cytometry
- G01N15/1429—Signal processing
-
- G—PHYSICS
- G01—MEASURING; TESTING
- G01N—INVESTIGATING OR ANALYSING MATERIALS BY DETERMINING THEIR CHEMICAL OR PHYSICAL PROPERTIES
- G01N15/00—Investigating characteristics of particles; Investigating permeability, pore-volume or surface-area of porous materials
- G01N15/10—Investigating individual particles
- G01N2015/1006—Investigating individual particles for cytology
-
- G—PHYSICS
- G01—MEASURING; TESTING
- G01N—INVESTIGATING OR ANALYSING MATERIALS BY DETERMINING THEIR CHEMICAL OR PHYSICAL PROPERTIES
- G01N15/00—Investigating characteristics of particles; Investigating permeability, pore-volume or surface-area of porous materials
- G01N15/10—Investigating individual particles
- G01N15/14—Optical investigation techniques, e.g. flow cytometry
- G01N2015/1402—Data analysis by thresholding or gating operations performed on the acquired signals or stored data
-
- G—PHYSICS
- G01—MEASURING; TESTING
- G01N—INVESTIGATING OR ANALYSING MATERIALS BY DETERMINING THEIR CHEMICAL OR PHYSICAL PROPERTIES
- G01N15/00—Investigating characteristics of particles; Investigating permeability, pore-volume or surface-area of porous materials
- G01N15/10—Investigating individual particles
- G01N15/14—Optical investigation techniques, e.g. flow cytometry
- G01N2015/1486—Counting the particles
-
- G—PHYSICS
- G01—MEASURING; TESTING
- G01R—MEASURING ELECTRIC VARIABLES; MEASURING MAGNETIC VARIABLES
- G01R29/00—Arrangements for measuring or indicating electric quantities not covered by groups G01R19/00 - G01R27/00
- G01R29/02—Measuring characteristics of individual pulses, e.g. deviation from pulse flatness, rise time or duration
-
- G—PHYSICS
- G16—INFORMATION AND COMMUNICATION TECHNOLOGY [ICT] SPECIALLY ADAPTED FOR SPECIFIC APPLICATION FIELDS
- G16B—BIOINFORMATICS, i.e. INFORMATION AND COMMUNICATION TECHNOLOGY [ICT] SPECIALLY ADAPTED FOR GENETIC OR PROTEIN-RELATED DATA PROCESSING IN COMPUTATIONAL MOLECULAR BIOLOGY
- G16B99/00—Subject matter not provided for in other groups of this subclass
Definitions
- the present invention relates to the technical field of pulse signal recognition, in particular to a pulse baseline value calculation method and a particle counting method of a hematology analyzer.
- a hematology analyzer When a hematology analyzer counts the particles such as white blood cells, red blood cells and the like, a blood sample is placed in a particle measurement system, when the measured particles pass through it, a sensor generates a corresponding analog pulse signal, the signal is converted into a digital pulse signal after being amplified and filtered, the digital pulse signal includes two data states, one is data during the pulse duration, and the other is data during the pulse non-duration time.
- a baseline value, a starting point, an end point, a peak value, a valley value and the like of the pulse signal are extracted from the pulse signal, the baseline value is subtracted from the extracted peak value to obtain absolute peak value data, then the volume of the particles is obtained according to a directly proportional relation between the peak value of the pulse and the volume of the particles, and the particles are counted. If the signal is not accurately judged, the accuracy of particle counting is affected.
- the Chinese patent CN201110033511.X discloses a baseline calculation module for calculating a baseline, during pulse non-duration time, the baseline calculation module performs statistics on average values of adjacent fixed number of sampling points during the pulse non-duration time to serve as a pulse baseline value, a fixed amount of sampling point data is stored by a memory, a sequence of numbers is formed by the sampling point data in a chronological order, when a new sampling point is input, the memory discards the first datum in the stored data sequence, and all remaining data is moved forward, the newly input data is arranged at the end of the data sequence, once a new sampled datum is input, the data sum of the memory of the baseline calculation module is added with the data, and the discarded data is subtracted to obtain an updated data sum, and thus a new baseline value is obtained quickly.
- the latest baseline value can be quickly obtained, but when ripples, bubbles, jitters, sudden changes, electromagnetic interference and other noise interference cause baseline fluctuation, the noise superposed on the baseline is accumulated on the baseline value in the calculation method, thereby deviating from the real baseline value, causing misjudgment of the baseline value, affecting the calculation of the absolute pulse peak, and ultimately affecting the accuracy of the particle counting.
- the technical problem to be solved by the present invention is to provide a pulse baseline value calculation method and a particle counting method of a hematology analyzer in view of the above problem that the baseline value calculation can hardly avoid the noise interference in the prior art.
- a pulse baseline value calculation method characterized in that, within pulse non-duration time, if an absolute value of a difference value between any two adjacent data of n continuous sampled data is less than a baseline threshold, and the n continuous sampled data are closest to a pulse starting point, an average value of the n continuous sampled data is calculated, and the average value is a pulse baseline value.
- the pulse baseline value calculation method includes the following steps:
- the sampling frequency of the n continuous sampled data is 1.5-3.5 MHz.
- the number of the n continuous sampled data is 2 m , and the value of m is selected from 2, 3, 4 or 5.
- the baseline threshold is a preset value, and a numerical range of the baseline threshold is 10-30.
- the pulse starting point is identified according to one of the following methods: (1) if w continuous sampled data successively and progressively increase, and the difference value between the wth datum and the first datum in the w data is greater than a starting point threshold, then the pulse starting point is the first datum of the w continuous sampled data; (2) or if the jth datum of the w continuous sampled data progressively decreases, the other data progressively increase, meanwhile the (j+1)th datum is greater than the (j-1)th datum, and the difference value between the wth datum and the first datum in the w data is greater than the starting point threshold, then the pulse starting point is the first datum of the w continuous sampled data.
- the pulse starting point identification method includes the following steps:
- the sampling frequency of the w continuous sampled data is 1.5-3.5 MHz, and the numerical range of w is an integer of 5-10.
- the starting point threshold is a preset value, and the numerical range of the starting point threshold is 20-60.
- a particle counting method of a hematology analyzer wherein the particle counting method includes a pulse baseline value calculation method, and within pulse non-duration time, if an absolute value of a difference value between any two adjacent data of n continuous sampled data is less than a baseline threshold, and the n continuous sampled data are closest to a pulse starting point, an average value of the n continuous sampled data is calculated, and the average value is a pulse baseline value.
- the pulse baseline value calculation method includes the following steps:
- the sampling frequency of the n continuous sampled data is 1.5-3.5 MHz.
- the number of the n continuous sampled data is 2 m , and the value of m is selected from 2, 3, 4 or 5.
- the baseline threshold is a preset value, and a numerical range of the baseline threshold is 10-30.
- the pulse starting point is identified according to one of the following methods: (1) if w continuous sampled data successively and progressively increase, and the difference value between the wth datum and the first datum in the w data is greater than a starting point threshold, then the pulse starting point is the first datum of the w continuous sampled data; (2) or if the jth datum of the w continuous sampled data progressively decreases, the other data progressively increase, meanwhile the (j+1)th datum is greater than the (j-1)th datum, and the difference value between the wth datum and the first datum in the w data is greater than the starting point threshold, then the pulse starting point is the first datum of the w continuous sampled data.
- the pulse starting point identification method includes the following steps:
- the sampling frequency of the w continuous sampled data is 1.5-3.5 MHz, and the numerical range of w is an integer of 5-10.
- the starting point threshold is a preset value, and the numerical range of the starting point threshold is 20-60.
- the pulse baseline value calculation method of the present invention has the advantages of setting the baseline threshold and performing comparison, avoiding the sampled data of the baseline where the noise is superimposed, selecting the sampled data with noise or interference within an allowable range for calculation, avoiding accumulating the noise on the final baseline value, that is, eliminating the noise interference during the baseline calculation, making the baseline value be closer to the real data, greatly reducing the erroneous judgment of the baseline value, and making the particle count be more accurate.
- a particle counting method of a blood cell analyze includes a pulse identification method, and the pulse recognition method includes a pulse baseline value calculation method.
- the pulse recognition method includes a pulse baseline value calculation method.
- a pulse baseline value calculation method within pulse non-duration time, if an absolute value of a difference value between any two adjacent data of n continuous sampled data is less than a baseline threshold, and the n continuous sampled data are closest to a pulse starting point, an average value of the n continuous sampled data is calculated, and the average value is a pulse baseline value.
- the baseline threshold is a preset value and is mainly set according to the magnitude of the system noise. If the system is subjected to baseline fluctuation caused by noise such as ripple, bubbles, jitter, sudden changes, electromagnetic interference and the like, the noise is superimposed on the baseline.
- the pulse baseline value calculation steps after the baseline threshold is set and comparison is made, the sampled data of the baseline where the noise is superimposed can be avoided, the sampled data with noise or interference within an allowable range are selected for calculation, the accumulation of the noise on the final baseline value is avoided, that is, the noise interference during the baseline calculation is eliminated, the baseline value is closer to the real data, the erroneous judgment of the baseline value is greatly reduced, and the particle count is more accurate.
- the specific calculation method that the absolute value of the difference value between any two adjacent data of the n continuous sampled data is smaller than the baseline threshold is as follows: calculating the difference value between two adjacent data one by one according to the sampling time, comparing the sizes of the absolute value of the difference value and the baseline threshold one by one, and calculating all data arrays satisfying the condition that the absolute value of the difference value between any two adjacent data of the n continuous sampled data is smaller than the baseline threshold.
- the specific judgment method that the n continuous sampled data are closest to the pulse starting point is as follows: comparing time intervals of sampling time of a plurality of data arrays satisfying the condition that the absolute value of the difference value between any two adjacent data of the n continuous sampled data is smaller than the baseline threshold and the pulse starting point, and judging that the sampled data with the shortest time interval is closest to the pulse starting point.
- the data array further away from the pulse starting point is compared with the data arrays closest to the pulse starting point, and the average value of the data arrays closest to the pulse starting point is closer to the real baseline value of the pulse.
- the pulse baseline value calculation method includes the following steps:
- the pulse baseline value calculation step the pulse starting point is also judged. Once the system detects the pulse starting point, that is, the pulse starts, the pulse baseline value calculation step stops, and the pulse baseline value is the current stored value. Within the pulse non-duration time, through the above calculation solution, there may be multiple data arrays meeting the requirements, multiple baseline values are calculated, the baseline values are covered in a chronological order, therefore, when the baseline values need to be valued, the system stores the currently latest baseline value, that is, the data array closest to the pulse starting point is selected, and the baseline value of the data array is calculated.
- the sampling frequency of the n continuous sampled data is 1.5-3.5 MHz.
- the specific value of the sampling frequency is selected from one of 1.5, 1.7, 2, 2.3, 2.5, 2.8, 3, 3.2, 3.5.
- the sampling frequency is preset and can be set according to the system data processing requirements.
- the number of the n continuous sampled data is 2 m , and the value of m is selected from 2, 3, 4 or 5. That is, the number of the continuous sampled data is 4, 8, 16, or 32, an even number of data are used for judgment, which is relatively simple during the calculation, is conducive to saving the CPU resources and reducing the cost of the CPU. Further, the value of n is 8.
- the baseline threshold is a preset value, and a numerical range of the baseline threshold is 10-30.
- the value of the baseline threshold is selected from one of 10, 12, 14, 15, 17, 19, 20, 22, 25, 27, 29, 30.
- the main impact factor of the baseline threshold is system noise
- the baseline threshold is preset according to the magnitude of the system noise, and during the baseline calculation, the noise interference can be excluded, so that the baseline value is closer to the true value. Further, the baseline threshold is 20.
- the numerical value of the above sampling frequency, the numerical value of n, and the numerical value of the baseline threshold can be arbitrarily combined.
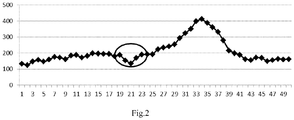
- Fig.2 is a voltage curve chart in a platelet detection process in the presence of downward interference, wherein the abscissa represents the number of sampled data, the vertical coordinate represents a measured voltage amplitude, the size of a pulse peak value x 34 is 413.
- Table 1 shows specific numerical values of sampled data x 1 -x 50 , and the data includes the sampled data within pulse non-duration time and the sampled data within pulse duration time. Taking the specific sampled data as an example to illustrate the pulse baseline value calculation steps in which the value of n is 8, the baseline threshold is 20, and the data x 22 is the pulse starting point:
- the pulse baseline value is the average value 179.75 of 8 data from x 14 to x 21 . It can be clearly seen in an area marked by a black circle in Fig.2 that the voltage curve has a downward interference before the starting of the pulse, the interference is within the interval of x 20 to x 22 , in the method of the prior art, the interference in the circle is calculated within the baseline value, however, the value interval of the baseline value calculation of the present invention is x 12 to x 19 , thereby avoiding the interference interval.
- Fig.3 it is a histogram of blood platelet distribution widths at 2-30 fl obtained by the method of the present invention and the method of the prior art, when the same sample of the equal volume is detected under the same conditions.
- abscissa represents a cell volume value (in fl), and the vertical coordinate represents a cell number value
- a thin solid line represents a histogram obtained by the method of the present invention, and a thick solid line represents a curve obtained by polynomial fitting of the histogram according to the present invention
- a thin dashed line represents a histogram obtained by the method of the prior art, and a thick dashed line represents a curve obtained by polynomial fitting of the histogram of the prior art.
- the distribution width PDW of blood platelets is generally 2-30 fl, and it can be seen from the comparison of the thick solid line and the thick broken line that, when the baseline calculation is inaccurate, the distribution width of the histogram is widened, when the cell volume calculation is relatively small, the histogram is stretched to the left side, and when the cell volume calculation is relatively large, the histogram is stretched to the right side, that is, the cell count values falling within 2-30fl are fewer.
- the cell distribution of the thick solid line on the point is relatively small, and the cell distribution of the thick dashed line on the coordinate is relatively large, some of cells are distributed before the 2fl, in other words, the distribution width of the thick dotted line histogram is widened, at this time, the cell distribution amount and volume are deviated, that is, some cells in the thick dotted line are distributed at the outside of the distribution width PDW of the blood platelets.
- the baseline value in the prior art is relatively small, resulting in a relatively high absolute peak value of the cell, that is, the cell volume value is relatively large, so that some cells are distributed at the outside of the cell distribution width, resulting in inaccurate cell counting, and even causing erroneous judgment. If the baseline value is relatively large, the cell volume value is relatively small, and some cells are still distributed at the outside of the cell distribution width.
- Fig.4 is a voltage curve chart in a red blood cell detection process in the presence of upward interference, wherein the abscissa represents the number of sampled data, the vertical coordinate represents a measured voltage amplitude, the size of a pulse peak value x 36 is 1314. Calculation is performed in such a manner that value of n is 8, the baseline threshold is 20, and the data x 23 is the pulse starting point.
- Table 3 shows specific numerical values of sampled data x 1 -x 50 in Fig. 4 , and the data include the sampled data within pulse non-duration time and the sampled data within pulse duration time.
- the data range of the sampled data meets the requirements of baseline value calculation from x 10 to x 17 , and therefore, the average value 238.12 of 8 data in x 10 to x 17 is used as the baseline value of the current pulse.
- Table 3 50 sampled data of pulse voltage with upward interference Serial number x 1 -x 10 x 11 -x 20 x 21 -x 30 x 31 -x 40 x 41 -x 50 1 183 237 262 599 525 2 174 222 250 744 355 3 197 232 255 903 246 4 208 248 260 1063 171 5 196 246 265 1229 156 6 209 245 280 1314 191 7 226 244 325 1277 206 8 221 270 390 1156 191 9 212 300 440 986 525 10 231 280 494 766 355
- the pulse baseline value is the average value 262.12 of 8 data from x 15 to x 22 . It can be clearly seen in an area marked by a black circle in Fig.4 that the voltage curve has an upward interference before the starting of the pulse, the interference is within the interval of x 18 to x 20 , in the method of the prior art, the interference in the circle is calculated within the baseline value, however, the value interval of the baseline value calculation of the present invention is x 10 to x 17 , thereby avoiding the interference interval.
- Tests and calculation prove that the combination of any three numerical values of the value range of the sampling frequency of 1.5-3.5 MHz, the numerical range of n of 4, 8, 16 or 32 and the numerical range of the baseline threshold of 10-30, for example, the combination in which the sampling frequency is 1.5MHz, the value of n is 8 and the baseline threshold is 30; or the combination in which the sampling frequency is 2.3MHz, the value of n is 16 and the baseline threshold is 15; or combination in which the sampling frequency is 3MHz, the value of n is 32 and the baseline threshold is 22; or a combination in which the sampling frequency is3.5 MHz, the value of n is 4 and the baseline threshold is 10; can all avoid the sampled data of the baseline where the noise is superimposed, selecting the sampled data with noise or interference within an allowable range for calculation, eliminating the noise interference during the baseline calculation, making the baseline value be closer to the real data, greatly reducing the erroneous judgment of the baseline value, and making the particle count be more accurate.
- the pulse starting point is identified according to one of the following methods: (1) if w continuous sampled data successively and progressively increase, and the difference value between the wth datum and the first datum in the w data is greater than a starting point threshold, then the pulse starting point is the first datum of the w continuous sampled data; (2) or if the jth datum of the w continuous sampled data progressively decreases, the other data progressively increase, meanwhile the (j+1)th datum is greater than the (j-1)th datum, and the difference value between the wth datum and the first datum in the w data is greater than the starting point threshold, then the pulse starting point is the first datum of the w continuous sampled data.
- the starting point is the first datum of the w data, compared with other data in the w data, the starting point is more stable, therefore when the difference value between the with datum and the first datum is compared with the starting point threshold, the accuracy is higher.
- the w continuous sampled data are difficult to successively and progressively increase, some of the data may progressively decrease, erroneous judgment is generated easily by only adopting the successive and progressive mode of the w data, thereby affecting the accuracy of the pulse width calculation, so the solution in which the jth datum of the w continuous sampled data progressively decreases is adopted, and by combination of the two solutions, the pulse starting point is accurately judged without generating erroneous judgment on the location of the pulse starting point due to the presence of the interference.
- the pulse starting point identification method includes the following steps:
- the sampling frequency of the w continuous sampled data is 1.5-3.5 MHz, and the numerical range of w is an integer of 5-10.
- the specific value of the sampling frequency is selected from one of 1.5, 1.7, 2, 2.3, 2.5, 2.8, 3, 3.2, 3.5, and the numerical value of w is selected from one of 5, 6, 7, 8, 9, and 10. Further, the numerical value of w is 7.
- the starting point threshold is a preset value, and the numerical range of the starting point threshold is 20-60.
- the numerical value of the starting point threshold is selected from one of 20, 22, 24, 25, 27, 29, 30, 32, 35, 37, 39, 40, 43, 45, 48, 50, 52, 55, 57, 60.
- the starting point threshold is 40.
- the main influence factor of the starting point threshold is the system noise, the starting point threshold is preset according to the magnitude of the system noise, and when the starting point threshold is detected, the interference of the noise interference can be removed, and the pulse starting point can be accurately detected.
- the numerical value of the sampling frequency, the numerical value of w and the numerical value of the starting point threshold can be randomly combined.
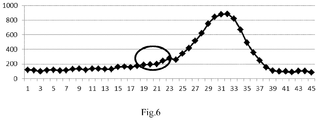
- Fig.6 is a voltage curve chart in a red blood cell detection process in the presence of downward interference, wherein the abscissa represents the number of sampled data, the vertical coordinate represents a voltage amplitude, the size of a pulse peak value x 32 is 884, Table 5 shows specific numerical values of sampled data x 1 -x 45 , and the data include the sampled data within pulse non-duration time and the sampled data within pulse duration time.
- the calculation steps of the pulse starting point by taking specific sampled data as an example in which the numerical value of w is 7 and the starting point threshold is 40:.
- the x 18 is the starting point of the current pulse.
- Fig.6 in the calculation process of the pulse starting point, if the pulse interference is encountered, the situation that individual sampling points are progressively decreased from the beginning of the pulse starting point, it can be clearly seen from a site marked by a black circle in Fig.6 that an obvious drop occurs at the x 24 point, all data in front of the x 24 point are removed very easily if the method in the prior art is applied to the calculation, the x 24 point is deemed as the pulse starting point, but the actual pulse starting point is x 18 , thus affecting the accuracy of the pulse width calculation.
- Table 5 45 sampled data in the pulse identification process Serial number x 1 -x 10 x 11 -x 20 x 21 -x 30 x 31 -x 40 x 41 -x 45 1 121 136 197 877 97 2 112 135 243 884 89 3 97 129 278 819 104 4 115 127 260 669 106 5 120 157 344 490 86 6 109 165 419 359 7 112 154 514 248 8 130 174 621 156 9 133 191 751 109 10 120 193 842 99
Landscapes
- Chemical & Material Sciences (AREA)
- Physics & Mathematics (AREA)
- General Physics & Mathematics (AREA)
- General Health & Medical Sciences (AREA)
- Health & Medical Sciences (AREA)
- Life Sciences & Earth Sciences (AREA)
- Pathology (AREA)
- Biochemistry (AREA)
- Analytical Chemistry (AREA)
- Immunology (AREA)
- Dispersion Chemistry (AREA)
- Engineering & Computer Science (AREA)
- Signal Processing (AREA)
- Bioinformatics & Cheminformatics (AREA)
- Bioinformatics & Computational Biology (AREA)
- Biotechnology (AREA)
- Evolutionary Biology (AREA)
- Medical Informatics (AREA)
- Spectroscopy & Molecular Physics (AREA)
- Theoretical Computer Science (AREA)
- Measurement Of Current Or Voltage (AREA)
- Investigating Or Analysing Biological Materials (AREA)
Abstract
Description
- The present invention relates to the technical field of pulse signal recognition, in particular to a pulse baseline value calculation method and a particle counting method of a hematology analyzer.
- When a hematology analyzer counts the particles such as white blood cells, red blood cells and the like, a blood sample is placed in a particle measurement system, when the measured particles pass through it, a sensor generates a corresponding analog pulse signal, the signal is converted into a digital pulse signal after being amplified and filtered, the digital pulse signal includes two data states, one is data during the pulse duration, and the other is data during the pulse non-duration time. During the measurement, a baseline value, a starting point, an end point, a peak value, a valley value and the like of the pulse signal are extracted from the pulse signal, the baseline value is subtracted from the extracted peak value to obtain absolute peak value data, then the volume of the particles is obtained according to a directly proportional relation between the peak value of the pulse and the volume of the particles, and the particles are counted. If the signal is not accurately judged, the accuracy of particle counting is affected.
- The Chinese patent
CN201110033511.X - The technical problem to be solved by the present invention is to provide a pulse baseline value calculation method and a particle counting method of a hematology analyzer in view of the above problem that the baseline value calculation can hardly avoid the noise interference in the prior art.
- In order to solve the above problem, one technical solution of the present invention is as follows:
A pulse baseline value calculation method, characterized in that, within pulse non-duration time, if an absolute value of a difference value between any two adjacent data of n continuous sampled data is less than a baseline threshold, and the n continuous sampled data are closest to a pulse starting point, an average value of the n continuous sampled data is calculated, and the average value is a pulse baseline value. - Preferably, the pulse baseline value calculation method includes the following steps:
- a) presetting a memory, wherein the memory is used for storing sampled data;
- b) within pulse non-duration time, receiving, by the memory, the sampled data in a chronological order of sampling, and accumulatively adding 1 to a stored data number i in the memory every time when the memory stores a sampled datum;
- c) if i>1, entering step d), otherwise, returning to step b), and continuing to wait for receiving the sampled data;
- d) judging whether an absolute value of a difference value between the current sampled datum and the previous sampled datum is less than a baseline threshold, if the absolute value is less than the baseline threshold, entering step e), otherwise, performing zero clearing on the ith datum in the memory and the stored data number i, then returning to step b), and restarting to receive the sampled data; and
- e) judging whether the stored data number i is equal to n, if i=n, calculating the average value of the n data as the current baseline value, then discarding, by the memory, the first datum and moving the other n-1 data forward, that is, storing the nth datum in the (n-1)th memory, subtracting 1 from the stored data number i, then returning to step b), and continuing to wait for receiving the sampled data; and if the stored data number i is not equal to n, directly returning to step b), and continuing to wait for receiving the sampled data.
- Preferably, the sampling frequency of the n continuous sampled data is 1.5-3.5 MHz.
- Preferably, the number of the n continuous sampled data is 2 m , and the value of m is selected from 2, 3, 4 or 5.
- Preferably, the baseline threshold is a preset value, and a numerical range of the baseline threshold is 10-30.
- Preferably, the pulse starting point is identified according to one of the following methods: (1) if w continuous sampled data successively and progressively increase, and the difference value between the wth datum and the first datum in the w data is greater than a starting point threshold, then the pulse starting point is the first datum of the w continuous sampled data; (2) or if the jth datum of the w continuous sampled data progressively decreases, the other data progressively increase, meanwhile the (j+1)th datum is greater than the (j-1)th datum, and the difference value between the wth datum and the first datum in the w data is greater than the starting point threshold, then the pulse starting point is the first datum of the w continuous sampled data.
- Preferably, the pulse starting point identification method includes the following steps:
- B1) presetting a memory, wherein the memory is used for storing sampled data;
- B2) receiving, by the memory, the sampled data in a chronological order of sampling, and accumulatively adding 1 to a stored data number j in the memory, namely, replacing the j with (j+1), every time when the memory stores a sampled datum;
- B3) if j>1, entering step B4), otherwise, returning to step B2) and continuing to wait for receiving the sampled data;
- B4) judging whether the current sampled datum yj is greater than the previous sampled datum y j-1, if yes, entering step B5), or, otherwise entering step B7);
- B5) judging whether the stored data number j is equal to w, if j=w, entering step B6); if j is not equal to w, returning to step B2), and continuing to wait for receiving the sampled data;
- B6) judging whether the difference value between the current sampled datum yj and the first datum y 1 in the memory is greater than the starting point threshold, if the difference value is greater than the starting point threshold, setting the first datum y 1 in the memory as the pulse starting point; if the difference value is smaller than the starting point threshold, discarding, by the memory, the first datum, moving the other n-1 data forward, that is, storing the wth datum in the (w-1)th memory, subtracting 1 from the stored data number j, returning to step B2), and continuing to wait for receiving the sampled data;
- B7) continuing to receive, by the memory, the sampled data, accumulatively adding 1 to the stored data number j in the memory, and accumulatively adding 1 to a progressive decrease data mark q;
- B8) judging whether q is equal to 1, if q=1, entering step B9), or otherwise, entering B10);
- B9) judging whether the current sampled datum yj is greater than the sampled datum y j-2, if yes, judging whether the stored data number j is equal to (w+1), if yes, replacing j with (j-1), and returning to the step B5), if not, returning to step B5), or, otherwise, entering step B10); and
- B10) performing zero clearing on all data in the memory, the stored data number j and the progressive decrease data mark q, returning to step B2), and restarting to receive the sampled data.
- Preferably, the sampling frequency of the w continuous sampled data is 1.5-3.5 MHz, and the numerical range of w is an integer of 5-10.
- Preferably, the starting point threshold is a preset value, and the numerical range of the starting point threshold is 20-60.
- One technical solution of the present invention is as follows:
A particle counting method of a hematology analyzer, wherein the particle counting method includes a pulse baseline value calculation method, and within pulse non-duration time, if an absolute value of a difference value between any two adjacent data of n continuous sampled data is less than a baseline threshold, and the n continuous sampled data are closest to a pulse starting point, an average value of the n continuous sampled data is calculated, and the average value is a pulse baseline value. - Preferably, the pulse baseline value calculation method includes the following steps:
- a) presetting a memory, wherein the memory is used for storing sampled data;
- b) within pulse non-duration time, receiving, by the memory, the sampled data in a chronological order of sampling, and accumulatively adding 1 to a stored data number i in the memory every time when the memory stores a sampled datum;
- c) if i>1, entering step d), otherwise, returning to step b), and continuing to wait for receiving the sampled data;
- d) judging whether an absolute value of a difference value between the current sampled datum and the previous sampled datum is less than a baseline threshold, if the absolute value is less than the baseline threshold, entering step e), otherwise, performing zero clearing on the ith datum in the memory and the stored data number i, then returning to step b), and restarting to receive the sampled data; and
- e) judging whether the stored data number i is equal to n, if i=n, calculating the average value of the n data as the current baseline value, then discarding, by the memory, the first datum and moving the other n-1 data forward, that is, storing the nth datum in the (n-1)th memory, subtracting 1 from the stored data number i, then returning to step b), and continuing to wait for receiving the sampled data; and if the stored data number i is not equal to n, directly returning to step b), and continuing to wait for receiving the sampled data.
- Preferably, the sampling frequency of the n continuous sampled data is 1.5-3.5 MHz.
- Preferably, the number of the n continuous sampled data is 2 m , and the value of m is selected from 2, 3, 4 or 5.
- Preferably, the baseline threshold is a preset value, and a numerical range of the baseline threshold is 10-30.
- Preferably, the pulse starting point is identified according to one of the following methods: (1) if w continuous sampled data successively and progressively increase, and the difference value between the wth datum and the first datum in the w data is greater than a starting point threshold, then the pulse starting point is the first datum of the w continuous sampled data; (2) or if the jth datum of the w continuous sampled data progressively decreases, the other data progressively increase, meanwhile the (j+1)th datum is greater than the (j-1)th datum, and the difference value between the wth datum and the first datum in the w data is greater than the starting point threshold, then the pulse starting point is the first datum of the w continuous sampled data.
- Preferably, the pulse starting point identification method includes the following steps:
- B1) presetting a memory, wherein the memory is used for storing sampled data;
- B2) receiving, by the memory, the sampled data in a chronological order of sampling, and accumulatively adding 1 to a stored data number j in the memory, namely, replacing the j with (j+1), every time when the memory stores a sampled datum;
- B3) if j>1, entering step B4), otherwise, returning to step B2) and continuing to wait for receiving the sampled data;
- B4) judging whether the current sampled datum yj is greater than the previous sampled datum y j-1, if yes, entering step B5), or, otherwise entering step B7);
- B5) judging whether the stored data number j is equal to w, if j=w, entering step B6); if j is not equal to w, returning to step B2), and continuing to wait for receiving the sampled data;
- B6) judging whether the difference value between the current sampled datum yj and the first datum y 1 in the memory is greater than the starting point threshold, if the difference value is greater than the starting point threshold, setting the first datum y 1 in the memory as the pulse starting point; if the difference value is smaller than the starting point threshold, discarding, by the memory, the first datum, moving the other n-1 data forward, that is, storing the wth datum in the (w-1)th memory, subtracting 1 from the stored data number j, returning to step B2), and continuing to wait for receiving the sampled data;
- B7) continuing to receive, by the memory, the sampled data, accumulatively adding 1 to the stored data number j in the memory, and accumulatively adding 1 to a progressive decrease data mark q;
- B8) judging whether q is equal to 1, if q=1, entering step B9), or otherwise, entering B10);
- B9) judging whether the current sampled datum yj is greater than the sampled datum y j-2, if yes, judging whether the stored data number j is equal to (w+1), if yes, replacing j with (j-1), and returning to the step B5), if not, returning to step B5), or, otherwise, entering step B10); and
- B10) performing zero clearing on all data in the memory, the stored data number j and the progressive decrease data mark q, returning to step B2), and restarting to receive the sampled data.
- Preferably, the sampling frequency of the w continuous sampled data is 1.5-3.5 MHz, and the numerical range of w is an integer of 5-10.
- Preferably, the starting point threshold is a preset value, and the numerical range of the starting point threshold is 20-60.
- Compared with the prior art, the pulse baseline value calculation method of the present invention has the advantages of setting the baseline threshold and performing comparison, avoiding the sampled data of the baseline where the noise is superimposed, selecting the sampled data with noise or interference within an allowable range for calculation, avoiding accumulating the noise on the final baseline value, that is, eliminating the noise interference during the baseline calculation, making the baseline value be closer to the real data, greatly reducing the erroneous judgment of the baseline value, and making the particle count be more accurate.
-
-
Fig.1 is a flowchart of a pulse baseline value calculation method. -
Fig.2 is a voltage curve chart in platelet detection process in the presence of downward interference. -
Fig.3 is a histogram of blood platelet distribution in a 3-diff hematology analyzer. -
Fig.4 is a voltage curve chart in red blood cell detection process in the presence of upward interference. -
Fig.5 is a flowchart of a pulse starting point identification step. -
Fig.6 is a voltage curve chart in a pulse starting point identification process in the presence of upward interference. - The present invention will be further described in detail below with reference to the drawings and embodiments, but the protection scope of the present invention is not limited thereto.
- A particle counting method of a blood cell analyze includes a pulse identification method, and the pulse recognition method includes a pulse baseline value calculation method. During the measurement, when a blood sample passes through a micropore, it will cause impedance change to form a voltage pulse, and a pulse starting point, a pulse peak value, a baseline value and a pulse width and the like are accurately identified, and finally, particle classification statistics is performed according to an absolute amplitude of the pulse.
- In a pulse baseline value calculation method, within pulse non-duration time, if an absolute value of a difference value between any two adjacent data of n continuous sampled data is less than a baseline threshold, and the n continuous sampled data are closest to a pulse starting point, an average value of the n continuous sampled data is calculated, and the average value is a pulse baseline value. The baseline threshold is a preset value and is mainly set according to the magnitude of the system noise. If the system is subjected to baseline fluctuation caused by noise such as ripple, bubbles, jitter, sudden changes, electromagnetic interference and the like, the noise is superimposed on the baseline. By adoption of the pulse baseline value calculation steps, after the baseline threshold is set and comparison is made, the sampled data of the baseline where the noise is superimposed can be avoided, the sampled data with noise or interference within an allowable range are selected for calculation, the accumulation of the noise on the final baseline value is avoided, that is, the noise interference during the baseline calculation is eliminated, the baseline value is closer to the real data, the erroneous judgment of the baseline value is greatly reduced, and the particle count is more accurate.
- Preferably, the specific calculation method that the absolute value of the difference value between any two adjacent data of the n continuous sampled data is smaller than the baseline threshold is as follows: calculating the difference value between two adjacent data one by one according to the sampling time, comparing the sizes of the absolute value of the difference value and the baseline threshold one by one, and calculating all data arrays satisfying the condition that the absolute value of the difference value between any two adjacent data of the n continuous sampled data is smaller than the baseline threshold.
- Preferably, the specific judgment method that the n continuous sampled data are closest to the pulse starting point is as follows: comparing time intervals of sampling time of a plurality of data arrays satisfying the condition that the absolute value of the difference value between any two adjacent data of the n continuous sampled data is smaller than the baseline threshold and the pulse starting point, and judging that the sampled data with the shortest time interval is closest to the pulse starting point. The data array further away from the pulse starting point is compared with the data arrays closest to the pulse starting point, and the average value of the data arrays closest to the pulse starting point is closer to the real baseline value of the pulse.
- Referring to
Fig.1 , the pulse baseline value calculation method includes the following steps: - a) presetting a memory, wherein the memory is used for storing sampled data;
- b) within pulse non-duration time, receiving, by the memory, the sampled data in a chronological order of sampling, and accumulatively adding 1 to a stored data number i in the memory every time when the memory stores a sampled datum;
- c) if i>1, entering step d), otherwise, returning to step b), and continuing to wait for receiving the sampled data;
- d) judging whether an absolute value of a difference value between the current sampled datum and the previous sampled datum is less than a baseline threshold, if the absolute value is less than the baseline threshold, entering step e), otherwise, performing zero clearing on the ith datum in the memory and the stored data number i, then returning to step b), and restarting to receive the sampled data; and
- e) judging whether the stored data number i is equal to n, if i=n, calculating the average value of the n data as the current baseline value, then discarding, by the memory, the first datum and moving the other n-1 data forward, that is, storing the nth datum in the (n-1)th memory, subtracting 1 from the stored data number i, then returning to step b), and continuing to wait for receiving the sampled data; and if the stored data number i is not equal to n, directly returning to step b), and continuing to wait for receiving the sampled data.
- In the pulse baseline value calculation step, the pulse starting point is also judged. Once the system detects the pulse starting point, that is, the pulse starts, the pulse baseline value calculation step stops, and the pulse baseline value is the current stored value. Within the pulse non-duration time, through the above calculation solution, there may be multiple data arrays meeting the requirements, multiple baseline values are calculated, the baseline values are covered in a chronological order, therefore, when the baseline values need to be valued, the system stores the currently latest baseline value, that is, the data array closest to the pulse starting point is selected, and the baseline value of the data array is calculated.
- Preferably, the sampling frequency of the n continuous sampled data is 1.5-3.5 MHz. Preferably, the specific value of the sampling frequency is selected from one of 1.5, 1.7, 2, 2.3, 2.5, 2.8, 3, 3.2, 3.5. The sampling frequency is preset and can be set according to the system data processing requirements.
- Preferably, the number of the n continuous sampled data is 2 m , and the value of m is selected from 2, 3, 4 or 5. That is, the number of the continuous sampled data is 4, 8, 16, or 32, an even number of data are used for judgment, which is relatively simple during the calculation, is conducive to saving the CPU resources and reducing the cost of the CPU. Further, the value of n is 8.
- Preferably, the baseline threshold is a preset value, and a numerical range of the baseline threshold is 10-30. Preferably, the value of the baseline threshold is selected from one of 10, 12, 14, 15, 17, 19, 20, 22, 25, 27, 29, 30. The main impact factor of the baseline threshold is system noise, the baseline threshold is preset according to the magnitude of the system noise, and during the baseline calculation, the noise interference can be excluded, so that the baseline value is closer to the true value. Further, the baseline threshold is 20.
- The numerical value of the above sampling frequency, the numerical value of n, and the numerical value of the baseline threshold can be arbitrarily combined.
-
Fig.2 is a voltage curve chart in a platelet detection process in the presence of downward interference, wherein the abscissa represents the number of sampled data, the vertical coordinate represents a measured voltage amplitude, the size of a pulse peak value x34 is 413. Table 1 shows specific numerical values of sampled data x1-x50, and the data includes the sampled data within pulse non-duration time and the sampled data within pulse duration time. Taking the specific sampled data as an example to illustrate the pulse baseline value calculation steps in which the value of n is 8, the baseline threshold is 20, and the data x22 is the pulse starting point: - 1) presetting a memory, wherein the memory is used for storing 8 continuous sampled data;
- 2) within the pulse non-duration time, receiving, by the memory, the sampled datum x1, and accumulatively adding 1 to a stored data number i in the memory, that is, i=1, i<1;
- 3) receiving, by the memory, the sampled datum x2, i=2, x2-x1=124-133=-9, wherein the absolute value of the difference value is less than the baseline threshold 20, i<8;
- 4) receiving, by the memory, the sampled datum x3, i=3, x3-x2=147-124=23, wherein the absolute value of the difference value is greater than the baseline threshold of 20;
- 5) i=0, performing zero clearing on the data of the memory;
- 6) restarting to receive the sampled datum x4, i=1, i<1;
- 7) receiving, by the memory, the sampled datum x5, i=2, x5-x4=146-158=-12, wherein the absolute value of the difference value is less than the baseline threshold 20, i<8;
- 8) receiving, by the memory, the sampled datum x6, i=3;
- H1) x10-x9=183-162=21, the absolute value of the difference value being greater than the baseline threshold of 20, i=0, performing zero clearing on the data of the memory
- H2) restarting to receive the sampled datum x11, i=1, i<1;
- H3) receiving, by the memory, the sampled datum x12, i=2, x12-x11=172-187=-15, wherein the absolute value is less than the baseline threshold of 20, i<8;
- H4) receiving, by the memory, the sampled datum x13, i=3, x13-x12=182-172=10, wherein the absolute value is less than the baseline threshold 20, i<8;
- H5) receiving, by the memory, the sampled datum x14, i=4, x14-x13=198-182=16, wherein the absolute value is less than the baseline threshold of 20, i<8;
- H6) receiving, by the memory, the sampled datum x15, i=5, x15-x14=196-198=-2, wherein the absolute value is less than the baseline threshold 20, i<8;
- H7) receiving, by the memory, the sampled datum x16, i=6, x16-x15=195-196=-1, wherein the absolute value is less than the baseline threshold of 20, i<8;
- H8) receiving, by the memory, the sampled datum x17, i=7, x17-x16=194-195=-1, wherein the absolute value is less than the baseline threshold of 20, i<8;
- H9) receiving, by the memory, the sampled datum x18, i=8, x18-x17=180-194=-14, wherein the absolute value is less than the baseline threshold 20;
- H10) calculating the average value 188 of 8 data of x11 to x18 as the current baseline value and storing the same, meanwhile, discarding, by the memory, the first datum x11, and moving the other 7 data forward, that is, storing the nth datum in the (n-1) memory, wherein the stored data number i=7;
- H11) receiving, by the memory, the sampled datum x19, i=8, x19-x18=188-180=8, wherein the absolute value is less than the baseline threshold 20;
- H12) calculating the average value 188.12 of 8 data of x12 to x19 as the current baseline value and storing the same, covering the previously calculated baseline value, meanwhile, discarding, by the memory, the first datum x12, and moving the other 7 data forward, that is, storing the nth datum in the (n-1) memory, wherein the stored data number i=7;
- H13) receiving, by the memory, the sampled datum x20, i=8, x20-x19=152-188=-36, wherein the absolute value is greater than the baseline threshold 20, i=0, and performing zero clearing on the data of the memory;
- Referring to Table 2, in the prior art, if only a plurality of numerical values before the pulse starting point are averaged, if the value is 8, then the pulse baseline value is the average value 179.75 of 8 data from x14 to x21. It can be clearly seen in an area marked by a black circle in
Fig.2 that the voltage curve has a downward interference before the starting of the pulse, the interference is within the interval of x20 to x22, in the method of the prior art, the interference in the circle is calculated within the baseline value, however, the value interval of the baseline value calculation of the present invention is x12 to x19, thereby avoiding the interference interval. Due to the difference of the value range, the deviation of the baseline value affects the accuracy of the absolute peak value, and the percentage of the absolute peak value in the two cases is 3.6%, which directly affects the measurement of the volume of the cell and the related distribution parameters.Table 2 comparison of baseline value calculation results Baseline value Value area Absolute peak value Percentage Method of the present invention 188.12 x12 to x19 224.88 3.6% Prior art 179.75 x14 to x21 233.25 - Referring to
Fig.3 , it is a histogram of blood platelet distribution widths at 2-30 fl obtained by the method of the present invention and the method of the prior art, when the same sample of the equal volume is detected under the same conditions. InFig.3 , abscissa represents a cell volume value (in fl), and the vertical coordinate represents a cell number value; a thin solid line represents a histogram obtained by the method of the present invention, and a thick solid line represents a curve obtained by polynomial fitting of the histogram according to the present invention; and a thin dashed line represents a histogram obtained by the method of the prior art, and a thick dashed line represents a curve obtained by polynomial fitting of the histogram of the prior art. - In the detection of a 3-diff hematology analyzer, the distribution width PDW of blood platelets is generally 2-30 fl, and it can be seen from the comparison of the thick solid line and the thick broken line that, when the baseline calculation is inaccurate, the distribution width of the histogram is widened, when the cell volume calculation is relatively small, the histogram is stretched to the left side, and when the cell volume calculation is relatively large, the histogram is stretched to the right side, that is, the cell count values falling within 2-30fl are fewer. As shown in
Fig.3 , when the abscissa is 2 fl, the cell distribution of the thick solid line on the point is relatively small, and the cell distribution of the thick dashed line on the coordinate is relatively large, some of cells are distributed before the 2fl, in other words, the distribution width of the thick dotted line histogram is widened, at this time, the cell distribution amount and volume are deviated, that is, some cells in the thick dotted line are distributed at the outside of the distribution width PDW of the blood platelets. As shown in Table 2, the baseline value in the prior art is relatively small, resulting in a relatively high absolute peak value of the cell, that is, the cell volume value is relatively large, so that some cells are distributed at the outside of the cell distribution width, resulting in inaccurate cell counting, and even causing erroneous judgment. If the baseline value is relatively large, the cell volume value is relatively small, and some cells are still distributed at the outside of the cell distribution width. -
Fig.4 is a voltage curve chart in a red blood cell detection process in the presence of upward interference, wherein the abscissa represents the number of sampled data, the vertical coordinate represents a measured voltage amplitude, the size of a pulse peak value x36 is 1314. Calculation is performed in such a manner that value of n is 8, the baseline threshold is 20, and the data x23 is the pulse starting point. Table 3 shows specific numerical values of sampled data x1-x50 inFig. 4 , and the data include the sampled data within pulse non-duration time and the sampled data within pulse duration time. Through the calculation, it can be obtained that the data range of the sampled data meets the requirements of baseline value calculation from x10 to x17, and therefore, the average value 238.12 of 8 data in x10 to x17 is used as the baseline value of the current pulse.Table 3 50 sampled data of pulse voltage with upward interference Serial number x1-x10 x11-x20 x21-x30 x31-x40 x41-x50 1 183 237 262 599 525 2 174 222 250 744 355 3 197 232 255 903 246 4 208 248 260 1063 171 5 196 246 265 1229 156 6 209 245 280 1314 191 7 226 244 325 1277 206 8 221 270 390 1156 191 9 212 300 440 986 525 10 231 280 494 766 355 - Referring to Table 4, in the prior art, if only a plurality of numerical values before the pulse starting point are averaged, if the value is 8, then the pulse baseline value is the average value 262.12 of 8 data from x15 to x22. It can be clearly seen in an area marked by a black circle in
Fig.4 that the voltage curve has an upward interference before the starting of the pulse, the interference is within the interval of x18 to x20, in the method of the prior art, the interference in the circle is calculated within the baseline value, however, the value interval of the baseline value calculation of the present invention is x10 to x17, thereby avoiding the interference interval. Due to the difference of the value range, the deviation of the baseline value affects the accuracy of the absolute peak value, and the percentage of the absolute peak value is 2.28%, which directly affects the measurement of the volume of the cell and the related distribution parameters. That is, the baseline value of the prior art is relatively large, then the absolute peak value is relatively small, the cell volume is relatively small, and the distribution can be beyond the cell distribution width.Table 4 comparison of baseline value calculation results Baseline value Value area Absolute peak value Percentage Method of the present invention 238.12 x10 to x17 1075.88 2.28% Prior art 262.12 x15 to x22 1051.88 - Tests and calculation prove that the combination of any three numerical values of the value range of the sampling frequency of 1.5-3.5 MHz, the numerical range of n of 4, 8, 16 or 32 and the numerical range of the baseline threshold of 10-30, for example, the combination in which the sampling frequency is 1.5MHz, the value of n is 8 and the baseline threshold is 30; or the combination in which the sampling frequency is 2.3MHz, the value of n is 16 and the baseline threshold is 15; or combination in which the sampling frequency is 3MHz, the value of n is 32 and the baseline threshold is 22; or a combination in which the sampling frequency is3.5 MHz, the value of n is 4 and the baseline threshold is 10; can all avoid the sampled data of the baseline where the noise is superimposed, selecting the sampled data with noise or interference within an allowable range for calculation, eliminating the noise interference during the baseline calculation, making the baseline value be closer to the real data, greatly reducing the erroneous judgment of the baseline value, and making the particle count be more accurate.
- The pulse starting point is identified according to one of the following methods: (1) if w continuous sampled data successively and progressively increase, and the difference value between the wth datum and the first datum in the w data is greater than a starting point threshold, then the pulse starting point is the first datum of the w continuous sampled data; (2) or if the jth datum of the w continuous sampled data progressively decreases, the other data progressively increase, meanwhile the (j+1)th datum is greater than the (j-1)th datum, and the difference value between the wth datum and the first datum in the w data is greater than the starting point threshold, then the pulse starting point is the first datum of the w continuous sampled data. The starting point is the first datum of the w data, compared with other data in the w data, the starting point is more stable, therefore when the difference value between the with datum and the first datum is compared with the starting point threshold, the accuracy is higher. In the presence of interference during the judgment of the pulse starting point, the w continuous sampled data are difficult to successively and progressively increase, some of the data may progressively decrease, erroneous judgment is generated easily by only adopting the successive and progressive mode of the w data, thereby affecting the accuracy of the pulse width calculation, so the solution in which the jth datum of the w continuous sampled data progressively decreases is adopted, and by combination of the two solutions, the pulse starting point is accurately judged without generating erroneous judgment on the location of the pulse starting point due to the presence of the interference.
- Referring to
Fig.5 , the pulse starting point identification method includes the following steps: - B1) presetting a memory, the memory is used for storing (w+1) continuous sampled data;
- B2) receiving, by the memory, the sampled data in a chronological order of sampling, and accumulatively adding 1 to a stored data number j in the memory, namely, j=j+1, every time when the memory stores a sampled datum;
- B3) if j>1, entering step B4), otherwise, returning to step B2) and continuing to wait for receiving the sampled data;
- B4) judging whether the current sampled datum yj is greater than the previous sampled datum y j-1, if yes, entering step B5), or, otherwise entering step B7);
- B5) judging whether the j is equal to w, if j=w, entering step B6); if j is not equal to w, returning to step B2), and continuing to wait for receiving the sampled data;
- B6) judging whether the difference value between the current sampled datum yj and the first datum y 1 in the memory is greater than the starting point threshold, if the difference value is greater than the starting point threshold, setting the first datum y 1 in the memory as the pulse starting point; if the difference value is smaller than the starting point threshold, discarding, by the memory, the first datum, moving the other w-1 data forward, that is, storing the wth datum in the (w-1)th memory, subtracting 1 from the stored data number j, returning to step B2), and continuing to wait for receiving the sampled data;
- B7) continuing to receive, by the memory, the sampled data, accumulatively adding 1 to the stored data number j in the memory, and accumulatively adding 1 to a progressive decrease data mark q;
- B8) judging whether q is equal to 1, if q=1, entering step B9), or otherwise, entering B10);
- B9) judging whether the current sampled datum yj is greater than the sampled datum y j-2, if yes, judging whether j is equal to w+1, if yes, j=j-1, and returning to the step B5), if not, returning to step B5), or, otherwise, entering step B10); and
- B10) performing zero clearing on all data in the memory, the stored data number j and the progressive decrease data mark q, returning to step B2), and restarting to receive the sampled data.
- Preferably, the sampling frequency of the w continuous sampled data is 1.5-3.5 MHz, and the numerical range of w is an integer of 5-10. Preferably, the specific value of the sampling frequency is selected from one of 1.5, 1.7, 2, 2.3, 2.5, 2.8, 3, 3.2, 3.5, and the numerical value of w is selected from one of 5, 6, 7, 8, 9, and 10. Further, the numerical value of w is 7.
- Preferably, the starting point threshold is a preset value, and the numerical range of the starting point threshold is 20-60. Preferably, the numerical value of the starting point threshold is selected from one of 20, 22, 24, 25, 27, 29, 30, 32, 35, 37, 39, 40, 43, 45, 48, 50, 52, 55, 57, 60. Further, the starting point threshold is 40. The main influence factor of the starting point threshold is the system noise, the starting point threshold is preset according to the magnitude of the system noise, and when the starting point threshold is detected, the interference of the noise interference can be removed, and the pulse starting point can be accurately detected.
- The numerical value of the sampling frequency, the numerical value of w and the numerical value of the starting point threshold can be randomly combined.
-
Fig.6 is a voltage curve chart in a red blood cell detection process in the presence of downward interference, wherein the abscissa represents the number of sampled data, the vertical coordinate represents a voltage amplitude, the size of a pulse peak value x32 is 884, Table 5 shows specific numerical values of sampled data x1-x45, and the data include the sampled data within pulse non-duration time and the sampled data within pulse duration time. The calculation steps of the pulse starting point by taking specific sampled data as an example in which the numerical value of w is 7 and the starting point threshold is 40:. - 1) presetting a memory, wherein the memory is used for storing 8 continuous sampled data;
- 2) receiving and storing, by the memory, the sampled datum y 1=x1=121, and accumulatively adding 1 to a stored data number j in the memory, that is, j=1;
- 3) receiving, by the memory, the sampled datum y 2=x2=112, j=2, y 2<y 1, and receiving, by the memory, the sampled datum y 3=x3=97, j=3, q=1;
- 4) y 3<y 1, performing zero clearing on the data of the memory, j=0, q=0;
- G1) receiving, by the memory, the sampled datum y 1=x 13=129, j=1;
- G2) receiving, by the memory, the sampled datum y 2=x 14=127, j=2, y 2<y 1, and receiving, by the memory, the sampled datum y 3=x15=157, j=3, q=1;
- G3) y 3>y 1, receiving, by the memory, the sampled datum y 4=x 16=165, j=4;
- G4) y 4>y 3, receiving, by the memory, the sampled datum y 5=x 17=154, j=5;
- G5) y 4>y 3, performing zero clearing on the data of the memory, j=0, q=0;
- G6) receiving and storing, by the memory, sampled datum y 1=x18174, and accumulatively adding 1 to a stored data number j in the memory, that is, j=1;
- G7) receiving, by the memory, the sampled datum y 2=x19=191, j=2, y 2>y 1;
- G8) receiving, by the memory, the sampled datum y 3=x20=193, j=3, y 3>y 2;
- G9) receiving, by the memory, the sampled datum y 4=x21=197, j=4, y 4>y 3;
- G10) receiving, by the memory, the sampled datum y 5=x22=243, j=5, y 5>y 4;
- G11) receiving, by the memory, the sampling data y 6=x23=278, j=6, y 6>y 5;
- G12) receiving, by the memory, the sampling data y 7=x24=260, j=7, y 7<y 6;
- G13) receiving, by the memory, the sampling data y 8=x25=344, j=8, q=1, y 8>y 6; and
- G14) j=j-1=7, y 7-y 1=x 24-x 18=260-174=86, greater than the starting point threshold 40, y 1, namely, x18 being the pulse starting point.
- Through calculation, the obtained data range of the sampled data meets the calculation requirements of the pulse starting point from x18 to x24, therefore, the x18 is the starting point of the current pulse. Referring to
Fig.6 , in the calculation process of the pulse starting point, if the pulse interference is encountered, the situation that individual sampling points are progressively decreased from the beginning of the pulse starting point, it can be clearly seen from a site marked by a black circle inFig.6 that an obvious drop occurs at the x24 point, all data in front of the x24 point are removed very easily if the method in the prior art is applied to the calculation, the x24 point is deemed as the pulse starting point, but the actual pulse starting point is x18, thus affecting the accuracy of the pulse width calculation.Table 5 45 sampled data in the pulse identification process Serial number x1-x10 x11-x20 x21-x30 x31-x40 x41-x45 1 121 136 197 877 97 2 112 135 243 884 89 3 97 129 278 819 104 4 115 127 260 669 106 5 120 157 344 490 86 6 109 165 419 359 7 112 154 514 248 8 130 174 621 156 9 133 191 751 109 10 120 193 842 99 - Tests and calculation prove that the combination of any three numerical values of value range of the sampling frequency of 1.5-3.5 MHz, the numerical range of w of 5-10 and the numerical range of the starting point threshold of 20-60, for example, the combination in which the sampling frequency is 1.5, the value of w is 10 and the starting point threshold is 27; or the combination in which the sampling frequency is 2, the value of w is 7 and the starting point threshold is 60; or combination in which the sampling frequency is 2.8, the value of w is 9 and the starting point threshold is 20; or a combination in which the sampling frequency is 3.5, the value of w is 5 and the starting point threshold is 43; can all avoid the specific sampled data with pulse interference and accurately calculate the pulse starting point.
continuing the detection, if a new baseline value meeting the condition, continuously covering the new baseline value, until the pulse starting point x22 is detected, stopping calculating the baseline value, and if it is discovered by calculation that no baseline value between x20 and x22 can meet the baseline value calculation condition, using the average value 188.12 of 8 data from x12 to x19 as the baseline value of the current pulse.
| Serial number | x1-x10 | x11-x20 | x21-x30 | x31-x40 | x41-x50 |
| 1 | 133 | 187 | 135 | 324 | 187 |
| 2 | 124 | 172 | 170 | 351 | 162 |
| 3 | 147 | 182 | 190 | 398 | 156 |
| 4 | 158 | 198 | 192 | 413 | 172 |
| 5 | 146 | 196 | 193 | 387 | 170 |
| 6 | 159 | 195 | 223 | 361 | 148 |
| 7 | 176 | 194 | 234 | 332 | 156 |
| 8 | 171 | 180 | 241 | 278 | 164 |
| 9 | 162 | 188 | 254 | 215 | 160 |
| 10 | 183 | 152 | 293 | 199 | 162 |
Claims (10)
- A pulse baseline value calculation method, characterized in that, within pulse non-duration time, if an absolute value of a difference value between any two adjacent data of n continuous sampled data is less than a baseline threshold, and the n continuous sampled data are closest to a pulse starting point, an average value of the n continuous sampled data is calculated, and the average value is a pulse baseline value.
- The pulse baseline value calculation method according to claim 1, characterized in that, comprising the following steps:a) presetting a memory, wherein the memory is used for storing sampled data;b) within pulse non-duration time, receiving, by the memory, the sampled data in a chronological order of sampling, and accumulatively adding 1 to a stored data number i in the memory every time when the memory stores a sampled datum;c) if i>1, entering step d), otherwise, returning to step b), and continuing to wait for receiving the sampled data;d) judging whether an absolute value of a difference value between the current sampled datum and the previous sampled datum is less than a baseline threshold, if the absolute value is less than the baseline threshold, entering step e), otherwise, performing zero clearing on the ith datum in the memory and the stored data number i, then returning to step b), and restarting to receive the sampled data; ande) judging whether the stored data number i is equal to n, if i=n, calculating the average value of the n data as the current baseline value, then discarding, by the memory, the first datum and moving the other n-1 data forward, that is, storing the nth datum in the (n-1)th memory, subtracting 1 from the stored data number i, then returning to step b), and continuing to wait for receiving the sampled data; and if the stored data number i is not equal to n, directly returning to step b), and continuing to wait for receiving the sampled data.
- The pulse baseline value calculation method according to claim 1 or 2, wherein the sampling frequency of the n continuous sampled data is 1.5-3.5 MHz.
- The pulse baseline value calculation method according to claim 3, wherein the number of the n continuous sampled data is 2 m , and the value of m is selected from 2, 3, 4 or 5.
- The pulse baseline value calculation method according to claim 3, wherein the baseline threshold is a preset value, and a numerical range of the baseline threshold is 10-30.
- The pulse baseline value calculation method according to claim 1 or 2, wherein the pulse starting point is identified according to one of the following methods: (1) if w pieces of continuous sampled data successively and progressively increase, and the difference value between the wth datum and the first datum in the w data is greater than a starting point threshold, then the pulse starting point is the first datum of the w pieces continuous sampled data; (2) or if the jth datum of the w pieces continuous sampled data progressively decreases, the other data progressively increase, meanwhile the (j+1)th datum is greater than the (j-1)th datum, and the difference value between the wth datum and the first datum in the w data is greater than the starting point threshold, then the pulse starting point is the first datum of the w pieces continuous sampled data.
- The pulse baseline value calculation method according to claim 6, wherein the pulse starting point identification method comprises the following steps:B1) presetting a memory, wherein the memory is used for storing sampled data;B2) receiving, by the memory, the sampled data in a chronological order of sampling, every time when the memory stores a sampled datum, accumulatively adding 1 to a stored data number j in the memory, namely, replacing the j with (j+1);B3) if j>1, entering step B4), otherwise, returning to step B2) and continuing to wait for receiving the sampled data;B4) judging whether the current sampled datum yj is greater than the previous sampled datum y j-1, if yes, entering step B5), or, otherwise entering step B7);B5) judging whether the stored data number j is equal to w, if j=w, entering step B6); if j is not equal to w, returning to step B2), and continuing to wait for receiving the sampled data;B6) judging whether the difference value between the current sampled datum yj and the first datum y 1 in the memory is greater than the starting point threshold, if the difference value is greater than the starting point threshold, setting the first datum y 1 in the memory as the pulse starting point; if the difference value is smaller than the starting point threshold, discarding, by the memory, the first datum, moving the other n-1 data forward, that is, storing the wth datum in the (w-1)th memory, subtracting 1 from the stored data number j, returning to step B2), and continuing to wait for receiving the sampled data;B7) continuing to receive, by the memory, the sampled data, accumulatively adding 1 to the stored data number j in the memory, and accumulatively adding 1 to a progressive decrease data mark q;B8) judging whether q is equal to 1, if q=1, entering step B9), or otherwise, entering B10);B9) judging whether the current sampled datum yj is greater than the sampled datum y j-2, if yes, judging whether the stored data number j is equal to (w+1), if yes, replacing j with (j-1), and returning to the step B5), if not, returning to step B5), or, otherwise, entering step B10); andB10) performing zero clearing on all data in the memory, the stored data number j and the progressive decrease data mark q, returning to step B2), and restarting to receive the sampled data.
- The pulse baseline value calculation method according to claim 7, wherein the sampling frequency of the w pieces continuous sampled data is 1.5-3.5 MHz, and the numerical range of w is an integer of 5-10.
- The pulse baseline value calculation method according to claim 8, wherein the starting point threshold is a preset value, and the numerical range of the starting point threshold is 20-60.
- A particle counting method of a hematology analyzer, wherein the particle counting method comprises a pulse baseline value calculation method, and within pulse non-duration time, if an absolute value of a difference value between any two adjacent data of n continuous sampled data is less than a baseline threshold, and the n continuous sampled data are closest to a pulse starting point, an average value of the n continuous sampled data is calculated, and the average value is a pulse baseline value.
Applications Claiming Priority (2)
| Application Number | Priority Date | Filing Date | Title |
|---|---|---|---|
| CN201610199880.9A CN105866011B (en) | 2016-03-31 | 2016-03-31 | The particle counting methods of pulse base value calculating method and blood cell analysis machine |
| PCT/CN2017/078544 WO2017167193A1 (en) | 2016-03-31 | 2017-03-29 | Baseline pulse value calculation method and hematology analyzer particle count method |
Publications (3)
| Publication Number | Publication Date |
|---|---|
| EP3438643A1 true EP3438643A1 (en) | 2019-02-06 |
| EP3438643A4 EP3438643A4 (en) | 2019-11-20 |
| EP3438643B1 EP3438643B1 (en) | 2021-10-27 |
Family
ID=56627536
Family Applications (1)
| Application Number | Title | Priority Date | Filing Date |
|---|---|---|---|
| EP17773223.7A Active EP3438643B1 (en) | 2016-03-31 | 2017-03-29 | Baseline pulse value calculation method and hematology analyzer particle count method |
Country Status (4)
| Country | Link |
|---|---|
| US (1) | US11754489B2 (en) |
| EP (1) | EP3438643B1 (en) |
| CN (1) | CN105866011B (en) |
| WO (1) | WO2017167193A1 (en) |
Families Citing this family (11)
| Publication number | Priority date | Publication date | Assignee | Title |
|---|---|---|---|---|
| CN105866011B (en) * | 2016-03-31 | 2018-10-26 | 艾康生物技术(杭州)有限公司 | The particle counting methods of pulse base value calculating method and blood cell analysis machine |
| CN107449721B (en) * | 2017-08-09 | 2023-02-17 | 利多(香港)有限公司 | Isolation pool for sheath flow rear pool cleaning device |
| CN110118715B (en) * | 2018-02-06 | 2024-05-14 | 深圳市帝迈生物技术有限公司 | Blood cell pulse signal analysis device and method |
| CN110967246B (en) * | 2018-09-29 | 2022-09-30 | 中国航发商用航空发动机有限责任公司 | Data processing method and data processing system for split Hopkinson bar experiment |
| EP3648386A1 (en) * | 2018-11-01 | 2020-05-06 | Comcast Cable Communications, LLC | Uplink transmissions using multiple active resources |
| CN110257234A (en) * | 2019-05-24 | 2019-09-20 | 军事科学院系统工程研究院卫勤保障技术研究所 | A method of based on electrical impedance flow cytometer detection Yeast protoplase and budding ratio |
| CN112945807A (en) * | 2021-01-29 | 2021-06-11 | 深圳市科曼医疗设备有限公司 | Automatic detection method and device based on blood cell analyzer |
| CN113109630B (en) * | 2021-03-29 | 2022-10-04 | 深圳市科曼医疗设备有限公司 | Pulse data processing method and device and blood cell analyzer |
| CN115372262A (en) * | 2022-09-13 | 2022-11-22 | 南京颐兰贝生物科技有限责任公司 | Pulse recognition method and device for five-classification blood analyzer |
| CN116226115B (en) * | 2023-05-10 | 2023-08-22 | 江西飞尚科技有限公司 | Intelligent environment-friendly dust equipment monitoring data processing method and system |
| CN116660970B (en) * | 2023-07-07 | 2024-03-22 | 安徽中能聚控科技有限公司 | Pulse discrimination method and system based on neutron-gamma mixed radiation |
Family Cites Families (15)
| Publication number | Priority date | Publication date | Assignee | Title |
|---|---|---|---|---|
| US6680476B1 (en) | 2002-11-22 | 2004-01-20 | Agilent Technologies, Inc. | Summed time-of-flight mass spectrometry utilizing thresholding to reduce noise |
| CN101344475B (en) * | 2007-07-13 | 2011-09-07 | 深圳迈瑞生物医疗电子股份有限公司 | Signal base line processing equipment and processing method |
| JP4882899B2 (en) * | 2007-07-25 | 2012-02-22 | ソニー株式会社 | Speech analysis apparatus, speech analysis method, and computer program |
| US7940105B2 (en) | 2008-08-08 | 2011-05-10 | Beckman Coulter, Inc. | High-resolution parametric signal restoration |
| CN102164104A (en) * | 2011-01-12 | 2011-08-24 | 深圳市蓝韵实业有限公司 | Method and device for quickly processing signal base line |
| CN102624367B (en) * | 2011-01-30 | 2015-11-25 | 深圳迈瑞生物医疗电子股份有限公司 | Multichannel impulsive synchronization recognition device and method |
| CN102289558B (en) * | 2011-05-23 | 2014-10-01 | 公安部第一研究所 | Baseline adjusting method based on random signal processing |
| CN102319064B (en) * | 2011-10-13 | 2013-08-14 | 深圳市理邦精密仪器股份有限公司 | Device and method for improving accuracy of recognizing deceleration of fetal heart rate data |
| CN103006204B (en) * | 2012-12-29 | 2014-07-16 | 重庆康如来科技有限公司 | Method and device for calibrating baseline of electrocardiosignal |
| CN103006205B (en) * | 2012-12-29 | 2014-07-02 | 重庆邮电大学 | Device and method for electrocardiosignal baseline recognition |
| EP2951584A2 (en) * | 2013-02-04 | 2015-12-09 | Epona Biotech Ltd | Device and methods |
| CN103969675B (en) * | 2013-02-05 | 2017-08-04 | 苏州瑞派宁科技有限公司 | Digitize the baseline correction method and system of scintillation pulse |
| CN103235841B (en) * | 2013-03-28 | 2015-12-23 | 中国科学院高能物理研究所 | Baseline restoration method and device |
| CN105078444B (en) * | 2014-08-25 | 2020-02-14 | 深圳迈瑞生物医疗电子股份有限公司 | Noise detection method and device and medical detection equipment |
| CN105866011B (en) * | 2016-03-31 | 2018-10-26 | 艾康生物技术(杭州)有限公司 | The particle counting methods of pulse base value calculating method and blood cell analysis machine |
-
2016
- 2016-03-31 CN CN201610199880.9A patent/CN105866011B/en active Active
-
2017
- 2017-03-29 EP EP17773223.7A patent/EP3438643B1/en active Active
- 2017-03-29 WO PCT/CN2017/078544 patent/WO2017167193A1/en active Application Filing
- 2017-03-29 US US16/091,044 patent/US11754489B2/en active Active
Also Published As
| Publication number | Publication date |
|---|---|
| CN105866011B (en) | 2018-10-26 |
| US20190113437A1 (en) | 2019-04-18 |
| US11754489B2 (en) | 2023-09-12 |
| EP3438643A4 (en) | 2019-11-20 |
| CN105866011A (en) | 2016-08-17 |
| EP3438643B1 (en) | 2021-10-27 |
| WO2017167193A1 (en) | 2017-10-05 |
Similar Documents
| Publication | Publication Date | Title |
|---|---|---|
| EP3438643A1 (en) | Baseline pulse value calculation method and hematology analyzer particle count method | |
| US8154273B2 (en) | Detecting and handling coincidence in particle analysis | |
| KR101395268B1 (en) | Pulse processing device and radiation measuring instrument | |
| US7493219B1 (en) | Method of discriminating particle groups and particle analyzer | |
| CN111521915B (en) | High-voltage direct-current line corona onset field strength determination method and system | |
| EP2296272A2 (en) | Method for detecting and filtering a random noise signal | |
| CN107276779B (en) | Monitoring method, system and equipment | |
| CN108931463B (en) | Blood cell pulse recognition method and device based on sheath flow impedance principle | |
| US11280771B2 (en) | Liquid chromatograph | |
| CN111060443B (en) | Interference pulse identification method and device, storage medium and cell counting equipment | |
| CN114441415B (en) | Micro-plugging hole identification method and sample analyzer | |
| CN114441414B (en) | Hole blockage judging method and sample analyzer | |
| CN107436954B (en) | A kind of online flow data approximate processing method of quality control and device | |
| US20210318222A1 (en) | Method for correcting a blood cell parameter, blood sample analyzer and storage medium | |
| JP5693973B2 (en) | High resolution classification | |
| JP7395591B2 (en) | Sample analyzer | |
| CN115023787A (en) | Mass spectrometer and mass spectrometry method | |
| CN113139405A (en) | Cell classification result correction method based on multimodal fitting analysis | |
| CN111870775B (en) | Infusion detection and identification method and device and infusion equipment | |
| US7899627B2 (en) | Automatic dynamic baseline creation and adjustment | |
| CN115128256A (en) | Sample analyzer, method for detecting clogging, and readable storage medium | |
| Zet et al. | Real time digital pulse processing applied to heavy ion irradiation | |
| CN116106368A (en) | Blood cell voltage signal processing method and system | |
| JPS6332347A (en) | Analysis of grain size distribution | |
| JPS58113735A (en) | Analyzing device for blood |
Legal Events
| Date | Code | Title | Description |
|---|---|---|---|
| STAA | Information on the status of an ep patent application or granted ep patent |
Free format text: STATUS: THE INTERNATIONAL PUBLICATION HAS BEEN MADE |
|
| PUAI | Public reference made under article 153(3) epc to a published international application that has entered the european phase |
Free format text: ORIGINAL CODE: 0009012 |
|
| STAA | Information on the status of an ep patent application or granted ep patent |
Free format text: STATUS: REQUEST FOR EXAMINATION WAS MADE |
|
| 17P | Request for examination filed |
Effective date: 20181030 |
|
| AK | Designated contracting states |
Kind code of ref document: A1 Designated state(s): AL AT BE BG CH CY CZ DE DK EE ES FI FR GB GR HR HU IE IS IT LI LT LU LV MC MK MT NL NO PL PT RO RS SE SI SK SM TR |
|
| AX | Request for extension of the european patent |
Extension state: BA ME |
|
| RIC1 | Information provided on ipc code assigned before grant |
Ipc: G01N 15/10 20060101AFI20171006BHEP Ipc: G06F 19/10 20110101ALI20171006BHEP |
|
| STAA | Information on the status of an ep patent application or granted ep patent |
Free format text: STATUS: REQUEST FOR EXAMINATION WAS MADE |
|
| DAV | Request for validation of the european patent (deleted) | ||
| DAX | Request for extension of the european patent (deleted) | ||
| REG | Reference to a national code |
Ref country code: DE Ref legal event code: R079 Ref document number: 602017048316 Country of ref document: DE Free format text: PREVIOUS MAIN CLASS: G01N0015100000 Ipc: G01N0015120000 |
|
| A4 | Supplementary search report drawn up and despatched |
Effective date: 20191021 |
|
| RIC1 | Information provided on ipc code assigned before grant |
Ipc: G01N 15/12 20060101AFI20191015BHEP Ipc: G01R 29/02 20060101ALI20191015BHEP Ipc: G01D 5/244 20060101ALI20191015BHEP |
|
| GRAP | Despatch of communication of intention to grant a patent |
Free format text: ORIGINAL CODE: EPIDOSNIGR1 |
|
| STAA | Information on the status of an ep patent application or granted ep patent |
Free format text: STATUS: GRANT OF PATENT IS INTENDED |
|
| INTG | Intention to grant announced |
Effective date: 20210507 |
|
| GRAS | Grant fee paid |
Free format text: ORIGINAL CODE: EPIDOSNIGR3 |
|
| GRAA | (expected) grant |
Free format text: ORIGINAL CODE: 0009210 |
|
| STAA | Information on the status of an ep patent application or granted ep patent |
Free format text: STATUS: THE PATENT HAS BEEN GRANTED |
|
| AK | Designated contracting states |
Kind code of ref document: B1 Designated state(s): AL AT BE BG CH CY CZ DE DK EE ES FI FR GB GR HR HU IE IS IT LI LT LU LV MC MK MT NL NO PL PT RO RS SE SI SK SM TR |
|
| REG | Reference to a national code |
Ref country code: GB Ref legal event code: FG4D |
|
| REG | Reference to a national code |
Ref country code: CH Ref legal event code: EP |
|
| REG | Reference to a national code |
Ref country code: AT Ref legal event code: REF Ref document number: 1442214 Country of ref document: AT Kind code of ref document: T Effective date: 20211115 |
|
| REG | Reference to a national code |
Ref country code: DE Ref legal event code: R096 Ref document number: 602017048316 Country of ref document: DE |
|
| REG | Reference to a national code |
Ref country code: IE Ref legal event code: FG4D |
|
| REG | Reference to a national code |
Ref country code: LT Ref legal event code: MG9D |
|
| REG | Reference to a national code |
Ref country code: NL Ref legal event code: MP Effective date: 20211027 |
|
| REG | Reference to a national code |
Ref country code: AT Ref legal event code: MK05 Ref document number: 1442214 Country of ref document: AT Kind code of ref document: T Effective date: 20211027 |
|
| PG25 | Lapsed in a contracting state [announced via postgrant information from national office to epo] |
Ref country code: RS Free format text: LAPSE BECAUSE OF FAILURE TO SUBMIT A TRANSLATION OF THE DESCRIPTION OR TO PAY THE FEE WITHIN THE PRESCRIBED TIME-LIMIT Effective date: 20211027 Ref country code: LT Free format text: LAPSE BECAUSE OF FAILURE TO SUBMIT A TRANSLATION OF THE DESCRIPTION OR TO PAY THE FEE WITHIN THE PRESCRIBED TIME-LIMIT Effective date: 20211027 Ref country code: FI Free format text: LAPSE BECAUSE OF FAILURE TO SUBMIT A TRANSLATION OF THE DESCRIPTION OR TO PAY THE FEE WITHIN THE PRESCRIBED TIME-LIMIT Effective date: 20211027 Ref country code: BG Free format text: LAPSE BECAUSE OF FAILURE TO SUBMIT A TRANSLATION OF THE DESCRIPTION OR TO PAY THE FEE WITHIN THE PRESCRIBED TIME-LIMIT Effective date: 20220127 Ref country code: AT Free format text: LAPSE BECAUSE OF FAILURE TO SUBMIT A TRANSLATION OF THE DESCRIPTION OR TO PAY THE FEE WITHIN THE PRESCRIBED TIME-LIMIT Effective date: 20211027 |
|
| PG25 | Lapsed in a contracting state [announced via postgrant information from national office to epo] |
Ref country code: IS Free format text: LAPSE BECAUSE OF FAILURE TO SUBMIT A TRANSLATION OF THE DESCRIPTION OR TO PAY THE FEE WITHIN THE PRESCRIBED TIME-LIMIT Effective date: 20220227 Ref country code: SE Free format text: LAPSE BECAUSE OF FAILURE TO SUBMIT A TRANSLATION OF THE DESCRIPTION OR TO PAY THE FEE WITHIN THE PRESCRIBED TIME-LIMIT Effective date: 20211027 Ref country code: PT Free format text: LAPSE BECAUSE OF FAILURE TO SUBMIT A TRANSLATION OF THE DESCRIPTION OR TO PAY THE FEE WITHIN THE PRESCRIBED TIME-LIMIT Effective date: 20220228 Ref country code: PL Free format text: LAPSE BECAUSE OF FAILURE TO SUBMIT A TRANSLATION OF THE DESCRIPTION OR TO PAY THE FEE WITHIN THE PRESCRIBED TIME-LIMIT Effective date: 20211027 Ref country code: NO Free format text: LAPSE BECAUSE OF FAILURE TO SUBMIT A TRANSLATION OF THE DESCRIPTION OR TO PAY THE FEE WITHIN THE PRESCRIBED TIME-LIMIT Effective date: 20220127 Ref country code: NL Free format text: LAPSE BECAUSE OF FAILURE TO SUBMIT A TRANSLATION OF THE DESCRIPTION OR TO PAY THE FEE WITHIN THE PRESCRIBED TIME-LIMIT Effective date: 20211027 Ref country code: LV Free format text: LAPSE BECAUSE OF FAILURE TO SUBMIT A TRANSLATION OF THE DESCRIPTION OR TO PAY THE FEE WITHIN THE PRESCRIBED TIME-LIMIT Effective date: 20211027 Ref country code: HR Free format text: LAPSE BECAUSE OF FAILURE TO SUBMIT A TRANSLATION OF THE DESCRIPTION OR TO PAY THE FEE WITHIN THE PRESCRIBED TIME-LIMIT Effective date: 20211027 Ref country code: GR Free format text: LAPSE BECAUSE OF FAILURE TO SUBMIT A TRANSLATION OF THE DESCRIPTION OR TO PAY THE FEE WITHIN THE PRESCRIBED TIME-LIMIT Effective date: 20220128 Ref country code: ES Free format text: LAPSE BECAUSE OF FAILURE TO SUBMIT A TRANSLATION OF THE DESCRIPTION OR TO PAY THE FEE WITHIN THE PRESCRIBED TIME-LIMIT Effective date: 20211027 |
|
| REG | Reference to a national code |
Ref country code: DE Ref legal event code: R097 Ref document number: 602017048316 Country of ref document: DE |
|
| PG25 | Lapsed in a contracting state [announced via postgrant information from national office to epo] |
Ref country code: SM Free format text: LAPSE BECAUSE OF FAILURE TO SUBMIT A TRANSLATION OF THE DESCRIPTION OR TO PAY THE FEE WITHIN THE PRESCRIBED TIME-LIMIT Effective date: 20211027 Ref country code: SK Free format text: LAPSE BECAUSE OF FAILURE TO SUBMIT A TRANSLATION OF THE DESCRIPTION OR TO PAY THE FEE WITHIN THE PRESCRIBED TIME-LIMIT Effective date: 20211027 Ref country code: RO Free format text: LAPSE BECAUSE OF FAILURE TO SUBMIT A TRANSLATION OF THE DESCRIPTION OR TO PAY THE FEE WITHIN THE PRESCRIBED TIME-LIMIT Effective date: 20211027 Ref country code: EE Free format text: LAPSE BECAUSE OF FAILURE TO SUBMIT A TRANSLATION OF THE DESCRIPTION OR TO PAY THE FEE WITHIN THE PRESCRIBED TIME-LIMIT Effective date: 20211027 Ref country code: DK Free format text: LAPSE BECAUSE OF FAILURE TO SUBMIT A TRANSLATION OF THE DESCRIPTION OR TO PAY THE FEE WITHIN THE PRESCRIBED TIME-LIMIT Effective date: 20211027 Ref country code: CZ Free format text: LAPSE BECAUSE OF FAILURE TO SUBMIT A TRANSLATION OF THE DESCRIPTION OR TO PAY THE FEE WITHIN THE PRESCRIBED TIME-LIMIT Effective date: 20211027 |
|
| PLBE | No opposition filed within time limit |
Free format text: ORIGINAL CODE: 0009261 |
|
| STAA | Information on the status of an ep patent application or granted ep patent |
Free format text: STATUS: NO OPPOSITION FILED WITHIN TIME LIMIT |
|
| 26N | No opposition filed |
Effective date: 20220728 |
|
| PG25 | Lapsed in a contracting state [announced via postgrant information from national office to epo] |
Ref country code: MC Free format text: LAPSE BECAUSE OF FAILURE TO SUBMIT A TRANSLATION OF THE DESCRIPTION OR TO PAY THE FEE WITHIN THE PRESCRIBED TIME-LIMIT Effective date: 20211027 Ref country code: AL Free format text: LAPSE BECAUSE OF FAILURE TO SUBMIT A TRANSLATION OF THE DESCRIPTION OR TO PAY THE FEE WITHIN THE PRESCRIBED TIME-LIMIT Effective date: 20211027 |
|
| REG | Reference to a national code |
Ref country code: CH Ref legal event code: PL |
|
| PG25 | Lapsed in a contracting state [announced via postgrant information from national office to epo] |
Ref country code: SI Free format text: LAPSE BECAUSE OF FAILURE TO SUBMIT A TRANSLATION OF THE DESCRIPTION OR TO PAY THE FEE WITHIN THE PRESCRIBED TIME-LIMIT Effective date: 20211027 |
|
| REG | Reference to a national code |
Ref country code: BE Ref legal event code: MM Effective date: 20220331 |
|
| PG25 | Lapsed in a contracting state [announced via postgrant information from national office to epo] |
Ref country code: LU Free format text: LAPSE BECAUSE OF NON-PAYMENT OF DUE FEES Effective date: 20220329 Ref country code: LI Free format text: LAPSE BECAUSE OF NON-PAYMENT OF DUE FEES Effective date: 20220331 Ref country code: IE Free format text: LAPSE BECAUSE OF NON-PAYMENT OF DUE FEES Effective date: 20220329 Ref country code: CH Free format text: LAPSE BECAUSE OF NON-PAYMENT OF DUE FEES Effective date: 20220331 |
|
| PG25 | Lapsed in a contracting state [announced via postgrant information from national office to epo] |
Ref country code: BE Free format text: LAPSE BECAUSE OF NON-PAYMENT OF DUE FEES Effective date: 20220331 |
|
| PGFP | Annual fee paid to national office [announced via postgrant information from national office to epo] |
Ref country code: FR Payment date: 20230209 Year of fee payment: 7 |
|
| PG25 | Lapsed in a contracting state [announced via postgrant information from national office to epo] |
Ref country code: IT Free format text: LAPSE BECAUSE OF FAILURE TO SUBMIT A TRANSLATION OF THE DESCRIPTION OR TO PAY THE FEE WITHIN THE PRESCRIBED TIME-LIMIT Effective date: 20211027 |
|
| P01 | Opt-out of the competence of the unified patent court (upc) registered |
Effective date: 20230516 |
|
| PG25 | Lapsed in a contracting state [announced via postgrant information from national office to epo] |
Ref country code: HU Free format text: LAPSE BECAUSE OF FAILURE TO SUBMIT A TRANSLATION OF THE DESCRIPTION OR TO PAY THE FEE WITHIN THE PRESCRIBED TIME-LIMIT; INVALID AB INITIO Effective date: 20170329 |
|
| PG25 | Lapsed in a contracting state [announced via postgrant information from national office to epo] |
Ref country code: MK Free format text: LAPSE BECAUSE OF FAILURE TO SUBMIT A TRANSLATION OF THE DESCRIPTION OR TO PAY THE FEE WITHIN THE PRESCRIBED TIME-LIMIT Effective date: 20211027 Ref country code: CY Free format text: LAPSE BECAUSE OF FAILURE TO SUBMIT A TRANSLATION OF THE DESCRIPTION OR TO PAY THE FEE WITHIN THE PRESCRIBED TIME-LIMIT Effective date: 20211027 |
|
| PGFP | Annual fee paid to national office [announced via postgrant information from national office to epo] |
Ref country code: DE Payment date: 20240209 Year of fee payment: 8 Ref country code: GB Payment date: 20240208 Year of fee payment: 8 |