EP3431977A1 - System and method for analyte sensing in physiological gas samples - Google Patents
System and method for analyte sensing in physiological gas samples Download PDFInfo
- Publication number
- EP3431977A1 EP3431977A1 EP18180455.0A EP18180455A EP3431977A1 EP 3431977 A1 EP3431977 A1 EP 3431977A1 EP 18180455 A EP18180455 A EP 18180455A EP 3431977 A1 EP3431977 A1 EP 3431977A1
- Authority
- EP
- European Patent Office
- Prior art keywords
- capacitance
- graphene
- voltage
- minimum
- cdc
- Prior art date
- Legal status (The legal status is an assumption and is not a legal conclusion. Google has not performed a legal analysis and makes no representation as to the accuracy of the status listed.)
- Granted
Links
- 239000012491 analyte Substances 0.000 title claims abstract description 27
- 238000000034 method Methods 0.000 title claims description 30
- OKTJSMMVPCPJKN-UHFFFAOYSA-N Carbon Chemical compound [C] OKTJSMMVPCPJKN-UHFFFAOYSA-N 0.000 claims abstract description 113
- 229910021389 graphene Inorganic materials 0.000 claims abstract description 113
- 230000005284 excitation Effects 0.000 claims abstract description 35
- 238000004891 communication Methods 0.000 claims abstract description 31
- 230000004044 response Effects 0.000 claims abstract description 14
- 238000005070 sampling Methods 0.000 claims description 41
- 230000008859 change Effects 0.000 claims description 33
- 239000012855 volatile organic compound Substances 0.000 claims description 17
- 239000000126 substance Substances 0.000 claims description 7
- 238000001839 endoscopy Methods 0.000 claims description 4
- 239000007789 gas Substances 0.000 description 90
- 238000012360 testing method Methods 0.000 description 58
- 238000003032 molecular docking Methods 0.000 description 39
- 239000010410 layer Substances 0.000 description 16
- KBPLFHHGFOOTCA-UHFFFAOYSA-N 1-Octanol Chemical compound CCCCCCCCO KBPLFHHGFOOTCA-UHFFFAOYSA-N 0.000 description 14
- CSCPPACGZOOCGX-UHFFFAOYSA-N Acetone Chemical compound CC(C)=O CSCPPACGZOOCGX-UHFFFAOYSA-N 0.000 description 12
- 230000037361 pathway Effects 0.000 description 12
- 238000005259 measurement Methods 0.000 description 11
- 201000010099 disease Diseases 0.000 description 10
- 208000037265 diseases, disorders, signs and symptoms Diseases 0.000 description 10
- IJGRMHOSHXDMSA-UHFFFAOYSA-N Atomic nitrogen Chemical compound N#N IJGRMHOSHXDMSA-UHFFFAOYSA-N 0.000 description 9
- 229910001873 dinitrogen Inorganic materials 0.000 description 7
- 238000010586 diagram Methods 0.000 description 6
- 239000012212 insulator Substances 0.000 description 6
- 239000000463 material Substances 0.000 description 6
- 230000007547 defect Effects 0.000 description 5
- 230000006855 networking Effects 0.000 description 5
- 238000012545 processing Methods 0.000 description 5
- VYPSYNLAJGMNEJ-UHFFFAOYSA-N Silicium dioxide Chemical compound O=[Si]=O VYPSYNLAJGMNEJ-UHFFFAOYSA-N 0.000 description 4
- 238000011010 flushing procedure Methods 0.000 description 4
- 239000000203 mixture Substances 0.000 description 4
- 208000006545 Chronic Obstructive Pulmonary Disease Diseases 0.000 description 3
- 206010019280 Heart failures Diseases 0.000 description 3
- 230000002567 autonomic effect Effects 0.000 description 3
- 230000005540 biological transmission Effects 0.000 description 3
- 238000004364 calculation method Methods 0.000 description 3
- 150000001875 compounds Chemical class 0.000 description 3
- 238000003745 diagnosis Methods 0.000 description 3
- 230000003862 health status Effects 0.000 description 3
- TVMXDCGIABBOFY-UHFFFAOYSA-N octane Chemical compound CCCCCCCC TVMXDCGIABBOFY-UHFFFAOYSA-N 0.000 description 3
- 230000008569 process Effects 0.000 description 3
- 230000035945 sensitivity Effects 0.000 description 3
- LFQSCWFLJHTTHZ-UHFFFAOYSA-N Ethanol Chemical compound CCO LFQSCWFLJHTTHZ-UHFFFAOYSA-N 0.000 description 2
- 208000022559 Inflammatory bowel disease Diseases 0.000 description 2
- FHPKRIUVRALRED-UHFFFAOYSA-N acetic acid;pyrene Chemical compound CC(O)=O.C1=CC=C2C=CC3=CC=CC4=CC=C1C2=C43 FHPKRIUVRALRED-UHFFFAOYSA-N 0.000 description 2
- 238000004458 analytical method Methods 0.000 description 2
- 238000013459 approach Methods 0.000 description 2
- 239000003990 capacitor Substances 0.000 description 2
- 230000000875 corresponding effect Effects 0.000 description 2
- 206010012601 diabetes mellitus Diseases 0.000 description 2
- 230000000694 effects Effects 0.000 description 2
- 238000005516 engineering process Methods 0.000 description 2
- CJNBYAVZURUTKZ-UHFFFAOYSA-N hafnium(iv) oxide Chemical compound O=[Hf]=O CJNBYAVZURUTKZ-UHFFFAOYSA-N 0.000 description 2
- 230000036541 health Effects 0.000 description 2
- 239000007943 implant Substances 0.000 description 2
- 238000010801 machine learning Methods 0.000 description 2
- 238000004519 manufacturing process Methods 0.000 description 2
- 235000012239 silicon dioxide Nutrition 0.000 description 2
- 239000000377 silicon dioxide Substances 0.000 description 2
- 239000000758 substrate Substances 0.000 description 2
- 230000000007 visual effect Effects 0.000 description 2
- 208000024172 Cardiovascular disease Diseases 0.000 description 1
- 206010009944 Colon cancer Diseases 0.000 description 1
- 208000035473 Communicable disease Diseases 0.000 description 1
- 208000011231 Crohn disease Diseases 0.000 description 1
- 208000019693 Lung disease Diseases 0.000 description 1
- 206010058467 Lung neoplasm malignant Diseases 0.000 description 1
- BPQQTUXANYXVAA-UHFFFAOYSA-N Orthosilicate Chemical compound [O-][Si]([O-])([O-])[O-] BPQQTUXANYXVAA-UHFFFAOYSA-N 0.000 description 1
- 208000037656 Respiratory Sounds Diseases 0.000 description 1
- XUIMIQQOPSSXEZ-UHFFFAOYSA-N Silicon Chemical compound [Si] XUIMIQQOPSSXEZ-UHFFFAOYSA-N 0.000 description 1
- MCMNRKCIXSYSNV-UHFFFAOYSA-N ZrO2 Inorganic materials O=[Zr]=O MCMNRKCIXSYSNV-UHFFFAOYSA-N 0.000 description 1
- 230000009471 action Effects 0.000 description 1
- 239000012080 ambient air Substances 0.000 description 1
- 208000006673 asthma Diseases 0.000 description 1
- 230000004888 barrier function Effects 0.000 description 1
- 230000008901 benefit Effects 0.000 description 1
- 230000037396 body weight Effects 0.000 description 1
- 229940124630 bronchodilator Drugs 0.000 description 1
- 239000000168 bronchodilator agent Substances 0.000 description 1
- 239000000919 ceramic Substances 0.000 description 1
- 206010009887 colitis Diseases 0.000 description 1
- 201000010276 collecting duct carcinoma Diseases 0.000 description 1
- 208000029742 colonic neoplasm Diseases 0.000 description 1
- 230000000052 comparative effect Effects 0.000 description 1
- 239000002131 composite material Substances 0.000 description 1
- 230000003750 conditioning effect Effects 0.000 description 1
- 239000004020 conductor Substances 0.000 description 1
- 230000001276 controlling effect Effects 0.000 description 1
- 230000002596 correlated effect Effects 0.000 description 1
- 239000003246 corticosteroid Substances 0.000 description 1
- 229960001334 corticosteroids Drugs 0.000 description 1
- 238000000151 deposition Methods 0.000 description 1
- 235000018823 dietary intake Nutrition 0.000 description 1
- 230000001079 digestive effect Effects 0.000 description 1
- 208000010643 digestive system disease Diseases 0.000 description 1
- 238000011067 equilibration Methods 0.000 description 1
- 238000005530 etching Methods 0.000 description 1
- 230000005713 exacerbation Effects 0.000 description 1
- 238000002474 experimental method Methods 0.000 description 1
- 239000012530 fluid Substances 0.000 description 1
- 239000011521 glass Substances 0.000 description 1
- 229910052735 hafnium Inorganic materials 0.000 description 1
- VBJZVLUMGGDVMO-UHFFFAOYSA-N hafnium atom Chemical compound [Hf] VBJZVLUMGGDVMO-UHFFFAOYSA-N 0.000 description 1
- 208000027866 inflammatory disease Diseases 0.000 description 1
- 201000005202 lung cancer Diseases 0.000 description 1
- 208000020816 lung neoplasm Diseases 0.000 description 1
- 230000013011 mating Effects 0.000 description 1
- 229910052751 metal Inorganic materials 0.000 description 1
- 239000002184 metal Substances 0.000 description 1
- 150000002739 metals Chemical class 0.000 description 1
- 229910052757 nitrogen Inorganic materials 0.000 description 1
- TWNQGVIAIRXVLR-UHFFFAOYSA-N oxo(oxoalumanyloxy)alumane Chemical compound O=[Al]O[Al]=O TWNQGVIAIRXVLR-UHFFFAOYSA-N 0.000 description 1
- RVTZCBVAJQQJTK-UHFFFAOYSA-N oxygen(2-);zirconium(4+) Chemical compound [O-2].[O-2].[Zr+4] RVTZCBVAJQQJTK-UHFFFAOYSA-N 0.000 description 1
- 229920000642 polymer Polymers 0.000 description 1
- 230000002028 premature Effects 0.000 description 1
- 230000001681 protective effect Effects 0.000 description 1
- 230000036387 respiratory rate Effects 0.000 description 1
- 238000007789 sealing Methods 0.000 description 1
- 229910052710 silicon Inorganic materials 0.000 description 1
- 239000010703 silicon Substances 0.000 description 1
- 239000002356 single layer Substances 0.000 description 1
- 238000002791 soaking Methods 0.000 description 1
- 238000003860 storage Methods 0.000 description 1
- -1 such as Substances 0.000 description 1
- 239000003826 tablet Substances 0.000 description 1
- 238000002560 therapeutic procedure Methods 0.000 description 1
- GFQYVLUOOAAOGM-UHFFFAOYSA-N zirconium(iv) silicate Chemical compound [Zr+4].[O-][Si]([O-])([O-])[O-] GFQYVLUOOAAOGM-UHFFFAOYSA-N 0.000 description 1
Images


Classifications
-
- G—PHYSICS
- G01—MEASURING; TESTING
- G01N—INVESTIGATING OR ANALYSING MATERIALS BY DETERMINING THEIR CHEMICAL OR PHYSICAL PROPERTIES
- G01N27/00—Investigating or analysing materials by the use of electric, electrochemical, or magnetic means
- G01N27/02—Investigating or analysing materials by the use of electric, electrochemical, or magnetic means by investigating impedance
- G01N27/22—Investigating or analysing materials by the use of electric, electrochemical, or magnetic means by investigating impedance by investigating capacitance
- G01N27/227—Sensors changing capacitance upon adsorption or absorption of fluid components, e.g. electrolyte-insulator-semiconductor sensors, MOS capacitors
-
- A—HUMAN NECESSITIES
- A61—MEDICAL OR VETERINARY SCIENCE; HYGIENE
- A61B—DIAGNOSIS; SURGERY; IDENTIFICATION
- A61B5/00—Measuring for diagnostic purposes; Identification of persons
- A61B5/08—Detecting, measuring or recording devices for evaluating the respiratory organs
- A61B5/082—Evaluation by breath analysis, e.g. determination of the chemical composition of exhaled breath
-
- G—PHYSICS
- G01—MEASURING; TESTING
- G01N—INVESTIGATING OR ANALYSING MATERIALS BY DETERMINING THEIR CHEMICAL OR PHYSICAL PROPERTIES
- G01N27/00—Investigating or analysing materials by the use of electric, electrochemical, or magnetic means
- G01N27/02—Investigating or analysing materials by the use of electric, electrochemical, or magnetic means by investigating impedance
- G01N27/22—Investigating or analysing materials by the use of electric, electrochemical, or magnetic means by investigating impedance by investigating capacitance
- G01N27/228—Circuits therefor
-
- A—HUMAN NECESSITIES
- A61—MEDICAL OR VETERINARY SCIENCE; HYGIENE
- A61B—DIAGNOSIS; SURGERY; IDENTIFICATION
- A61B2560/00—Constructional details of operational features of apparatus; Accessories for medical measuring apparatus
- A61B2560/04—Constructional details of apparatus
- A61B2560/0456—Apparatus provided with a docking unit
-
- A—HUMAN NECESSITIES
- A61—MEDICAL OR VETERINARY SCIENCE; HYGIENE
- A61B—DIAGNOSIS; SURGERY; IDENTIFICATION
- A61B2562/00—Details of sensors; Constructional details of sensor housings or probes; Accessories for sensors
- A61B2562/02—Details of sensors specially adapted for in-vivo measurements
-
- G—PHYSICS
- G01—MEASURING; TESTING
- G01N—INVESTIGATING OR ANALYSING MATERIALS BY DETERMINING THEIR CHEMICAL OR PHYSICAL PROPERTIES
- G01N27/00—Investigating or analysing materials by the use of electric, electrochemical, or magnetic means
- G01N27/02—Investigating or analysing materials by the use of electric, electrochemical, or magnetic means by investigating impedance
- G01N27/22—Investigating or analysing materials by the use of electric, electrochemical, or magnetic means by investigating impedance by investigating capacitance
- G01N27/221—Investigating or analysing materials by the use of electric, electrochemical, or magnetic means by investigating impedance by investigating capacitance by investigating the dielectric properties
- G01N2027/222—Investigating or analysing materials by the use of electric, electrochemical, or magnetic means by investigating impedance by investigating capacitance by investigating the dielectric properties for analysing gases
-
- G—PHYSICS
- G01—MEASURING; TESTING
- G01N—INVESTIGATING OR ANALYSING MATERIALS BY DETERMINING THEIR CHEMICAL OR PHYSICAL PROPERTIES
- G01N33/00—Investigating or analysing materials by specific methods not covered by groups G01N1/00 - G01N31/00
- G01N33/48—Biological material, e.g. blood, urine; Haemocytometers
- G01N33/483—Physical analysis of biological material
- G01N33/497—Physical analysis of biological material of gaseous biological material, e.g. breath
Definitions
- the present disclosure invention relates to systems, devices and methods for analyte sensing in physiological gas samples. More specifically, the present invention disclosure relates to systems, devices and methods for measuring analyte presence on graphene varactors.
- clinicians In the process of providing health care, clinicians often make physical observations and run tests to gather data about a patient. After collecting data and analyzing other aspects, such as a given patient's health history, the clinician often forms a diagnosis and then selects a therapy to treat the diagnosed condition.
- the present invention disclosure relates to systems, devices and methods for analyte sensing in physiological gas samples.
- a system for measuring analyte presence on a graphene varactor according to the present invention disclosure can include a capacitance to digital converter (CDC) and a graphene varactor.
- the CDC can be in electrical communication with the graphene varactor and can be configured to measure the capacitance of the graphene varactor in response to an excitation signal over a plurality of DC bias voltages.
- the system can further include a multiplexor configured to selectively provide electrical communication between the CDC and a plurality of graphene varactors.
- An excitation signal can be applied to a selected graphene varactor through the multiplexor.
- the excitation signal can include an alternating voltage component.
- the amplitude of the excitation signal can be fixed by the CDC.
- a controller circuit can be included and can be configured to receive an electrical signal reflecting the capacitance of the graphene varactor.
- the controller circuit can include a microcontroller.
- the system can further include an electronic component in electrical communication with the controller circuit and the CDC, the electronic component selected from the group consisting of an I2C or an SPI.
- the graphene varactor can include a functionalized graphene varactor.
- the controller circuit can be configured to calculate at least one parameter for the graphene varactor selected from the group consisting of:
- the graphene varactor(s) can be grounded.
- the graphene varactor(s) can be in electrical communication with an independent excitation output of the CDC.
- the system can further include one or more programmable digital to analog converters (DACs) in series with the plurality of graphene sensors.
- DACs programmable digital to analog converters
- the system can further include a switch, the CDC in electrical communication with the switch and controlling the switch to selectively provide communication with output voltages of two programmable digital to analog converters (DACs), the programmed voltage difference between the DACs determining the excitation amplitude, and the difference between the programmed average voltage of the DACs and the bias at the CDC input determining the DC bias.
- DACs programmable digital to analog converters
- the invention disclosure also relates to a gas sampling device, for example a hand-held breath sampling device or a gas sampling device for use with catheters and/or endoscopy systems, for sensing gaseous analytes for example volatile organic compounds, the device comprising or incorporated into the above referred to system.
- a gas sampling device for example a hand-held breath sampling device or a gas sampling device for use with catheters and/or endoscopy systems, for sensing gaseous analytes for example volatile organic compounds, the device comprising or incorporated into the above referred to system.
- the invention disclosure also relates to the use of this system and/or gas sampling device for determining the presence of and/or measuring a chemical analyte such as a volatile organic compound, in particular for use in the following method according to the present invention disclosure.
- the invention disclosure also relates to a method for measuring analyte presence on a graphene varactor.
- the method can include measuring a capacitance of the graphene varactor over a range of DC bias voltages; comparing the measured capacitance at one or more DC bias voltages to one or more corresponding baseline capacitance values; and determining the presence or absence of an analyte based on the comparison.
- the method can further include determining one or more aspects selected from the group consisting of:
- the method can further include forming a capacitance to voltage curve from the measured capacitance of the graphene varactor over the range of DC bias voltages.
- the method can further include comparing the formed capacitance to voltage curve with a baseline capacitance to voltage curve.
- the method can further include distinguishing between different analytes binding to the graphene varactor.
- the range of DC bias voltages can be in the following ranges -3 V to 3 V; -2.5 V to 2.5 V; -2 V to 2 V; -1.5 V to 1.5 V; -1 V to 1 V; -0.5 V to 0.5 V.
- Volatile organic compounds as sensed in breath samples or other gas samples, can provide valuable information about the health status of a patient.
- patterns of volatile organic compounds (including the presence, absence, and/or concentration of a plurality of different volatile organic compounds) in a breath or gas sample of a patient can be associated with various disease states and/or particular health statuses.
- the disease states can include, but are not limited to, lung cancer, colon cancer, pulmonary disease (e.g. asthma, COPD), cardiovascular disease (e.g. heart failure), infectious diseases, digestive and inflammatory diseases (e.g. inflammatory bowel diseases such as Crohn's, colitis, or the like) or diabetes.
- Graphene varactors are one type of device that can be used to measure volatile organic compounds.
- Various properties of graphene varactors, such as capacitance can change in response to the presence of volatile organic compounds thereon. This has been used to propose sensors in which a value of the capacitance, measured at a previously determined advantageous bias voltage, is measured and is correlated with the concentration of a specific analyte
- measurement of properties of the graphene varactors, such as capacitance remains technically challenging. Passive wireless techniques can be used, but may not be sufficiently accurate or fast for all purposes.
- the present invention disclosure can be used to rapidly and accurately measure the capacitance of a plurality of graphene varactors due to the use of a capacitance-to-digital converted (CDC).
- CDC capacitance-to-digital converted
- Existing systems tend to rely on other measurement circuits, which are more commonly used and may be more advantageous for measuring capacitance at a given (single) bias voltage.
- a CDC component enables a rapid sweep across bias voltages in a manner that makes it practical to rapidly collect data for a plurality of DC bias voltages.
- an advantage of using a CDC may be that the density of sensors on a substrate that can be read in an inexpensive and portable system may be significantly increased.
- a CDC allows for sensors which are more precise and which may be used to accurately and quickly detect various different analytes in a same sample, leading to a large and rich data set which can provide information that would be difficult or even impossible to derive using existing systems.
- the system 100 can include a breath sensing device 160 for sensing gaseous analytes (or volatile organic compounds).
- a breath sensing device 160 for sensing gaseous analytes (or volatile organic compounds).
- the system is exhibited in a hand-held format. It will be appreciated, however, that many other formats for the system are contemplated herein.
- the breath sensing device 160 can include a housing 178.
- the breath sensing device 160 can include a mouthpiece 162 into which a subject to be evaluated can blow a breath sample.
- the breath sensing device 160 can also include a display screen 174 and a user input device 176, such as a keyboard.
- the breath sensing device 160 can also include a gas outflow port 172.
- FIG. 1 shows a breath sensing device, it will be appreciated that other types of gas sampling systems can also be used herein.
- gas sampling devices for use with catheters and endoscopy systems can also be used.
- An exemplary gas sampling device in the context of a catheter or endoscopy device is described in U.S. Appl. No. 62/350,345 .
- the system 100 can include a local computing device 182 that can include a microprocessor, input and output circuits, input devices, a visual display, a user interface, and the like.
- the breath sensing device 160 can communicate with the local computing device 182 in order to exchange data between the breath sensing device 160 and the local computing device 182.
- the local computing device 182 can be configured to perform various processing steps with the data received from the breath sensing device 160, including, but not limited to, calculating various parameters described herein. However, it should be appreciated that the features associated with the local computing device 182 can be integrated into the breath sensing device 160.
- the local computing device 182 can be a laptop computer, a desktop computer, a server (real or virtual), a purpose dedicated computer device, or a portable computing device (including, but not limited to, a mobile phone, tablet, wearable device, etc.).
- the local computing device 182 and/or the breath sensing device 160 can communicate with computing devices in remote locations through a data network 184, such as the Internet or another network for the exchange of data as packets, frames, or otherwise.
- a data network 184 such as the Internet or another network for the exchange of data as packets, frames, or otherwise.
- the system 100 can also include a computing device such as a server 186 (real or virtual).
- the server 186 can be located remotely from the breath sensing device 160.
- the server 186 can be in data communication with a database 188.
- the database 188 can be used to store various patient information, such as that described herein.
- the database can specifically include an electronic medical database containing data regarding the health status of a patient, patterns of data associated with various conditions (such as that generated from machine learning analysis of large sets of patient data), demographic data and the like.
- Graphene varactors can be prepared in various ways and with various geometries.
- the graphene varactor 200 can include an insulator layer 202, a gate electrode 204, a dielectric layer 206, a graphene layer 208, and a contact electrode 210.
- FIG. 3 shows a cross-sectional view of the graphene varactor 200.
- the gate electrode 204 can be recessed into the insulator layer 202.
- the gate electrode 204 can be formed by etching a depression into the insulator layer 202 and then depositing an electrically conductive material in the depression to form the gate electrode 204.
- the insulator layer 202 can include various materials.
- the insulator layer 202 can be silicon dioxide formed on a silicon substrate (wafer).
- the dielectric layer 206 can be formed on a surface of the insulator layer 202 and the gate electrode 204.
- the dielectric layer 206 can be formed of a material, such as, silicon dioxide, aluminum oxide, hafnium dioxide, zirconium dioxide, hafnium silicate or zirconium silicate.
- the graphene layer 208 can be disposed on the dielectric layer 206.
- the graphene layer 208 can be a graphene monolayer.
- a contact electrode 210 can also be disposed on the surface (or a portion thereof) of the graphene layer 208. Aspects of exemplary graphene varactors can be found in U.S. Publ. App. No. 2014/0145735 .
- the graphene layer can be functionalized to make the graphene sensor specific for a particular analyte or class of analytes. As analytes bind to the graphene layer, the capacitance of the sensor changes. Further, as shown below with regard to FIGS. 8-9 , the capacitance changes differently based on the voltage of the excitation current.
- Systems herein can also include a breath and/or gas sensing device or system.
- systems herein can gather data on the presence, absence, and/or amount of various gaseous analytes including, but not limited to, volatile organic compounds.
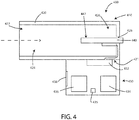
- FIG. 4 is a schematic cross-sectional view of an example system 400 consistent with the technology disclosed herein. It will be appreciated that this schematic view has been simplified for ease of illustration and that embodiments of systems and devices herein can include various features not shown in FIG. 4 . In addition, some embodiments of systems and devices herein may lack various features shown in FIG. 4 .
- the system 400 is generally configured for collecting a gas sample and communicating data associated with the gas sample.
- the system 400 has a gas sampling device 410 and a docking station 430.
- the gas sampling device 410 can be configured to collect a gas sample and facilitate testing of the gas sample to generate data.
- the gas sampling device 410 can be configured as a handheld device.
- the gas sampling device can be configured to be held in the hand of a care provider, a patient, or both, during certain steps of its use, while also being configured to be held or otherwise positioned in association with the docking station 430 during certain steps of its use.
- the gas sampling device 410 can be configured to receive a gas sample, such as exhaled breath, from a patient and direct the gas sample to a testing location.
- the gas sampling device 410 generally has a housing 420 defining an airflow aperture 422, a gas testing chamber 426, a sensor receptacle 428, an airflow pathway 424, and a docking structure 421.
- the gas (such as breath from a patient), can pass into the gas sampling device 410 through the airflow aperture 422, through the airflow pathway 424, into the gas testing chamber 426 and into contact with one or more measurement zones 442 of a disposable sensor test strip 440, and then out the end of the gas testing chamber 426 through the sensor receptacle 428, or through a separate exhaust port (not shown in this view).
- the gas such as breath from a patient
- the gas can pass into the gas sampling device 410 through the airflow aperture 422, through the airflow pathway 424, into the gas testing chamber 426 and into contact with one or more measurement zones 442 of a disposable sensor test strip 440, and then out the end of the gas testing chamber 426 through the sensor receptacle 428, or through a separate exhaust port (not shown in this view).
- FIG. 4 shows the airflow pathway 424 to be approximately the same size as the interior space of the housing 420, it will be appreciated that this is simply for ease of illustration and that the size of the airflow pathway 424 can be, in many cases, much smaller than the entire interior size of the housing 420, allowing for room for other components within the interior of the housing 420, such as other components described herein including, but not limited to, sensors, a power source, processing devices, communication hardware, conditioning elements, and the like.
- the housing 420 can be constructed of a variety of materials and combinations of materials.
- the housing 420 can be a single cohesive structure or can be constructed of multiple components that are coupled to form the housing 420.
- a portion of the housing 420 that defines the airflow pathway 424 can be coupled to the portion of the housing 420 that defines the airflow aperture 422.
- the portion of the housing 420 that defines the airflow pathway 424 can include a conduit or tube with various different cross-sectional sizes and shapes.
- the conduit or tube can be formed from various materials including, but not limited to, polymers, metals, ceramics, glass, composites or the like.
- surfaces lining the airflow pathway 424 can be coated with materials to provide various desirable functional properties.
- the airflow aperture 422 is generally configured to provide an input for the gas sample at the housing 420.
- the airflow aperture 422 can be configured to be in fluid communication with a patient's mouth, although in some other embodiments a protective liner can be used to provide a barrier between the patient's mouth and the housing, which will be described in more detail, below.
- the airflow pathway 424 generally is configured to direct the gas input at the airflow aperture 422 to the gas testing chamber 426. As such, the airflow pathway 424 generally extends from the airflow aperture 422 to the gas testing chamber 426.
- the airflow pathway 424 can have a cross-sectional area that is substantially the same along the length of the airflow pathway or it can vary.
- the gas testing chamber 426 can have different interior dimensions (e.g., height, width, etc.) than the airflow pathway leading to it.
- the gas testing chamber 426 defines a testing location for the gas sample.
- the gas testing chamber 426 can be configured to receive a measurement zone 442 of a disposable sensor test strip 440.
- the sensor receptacle 428 defined by the housing 420 is generally configured to removably retain the disposable sensor test strip 440 within the gas testing chamber 426.
- the sensor receptacle 428 can be configured to slidably receive the disposable sensor test strip 440 that is manually inserted by a user.
- the disposable sensor test strip 440 can be inserted with its long (or major) axis parallel to the long (or major) axis of the housing 420.
- the disposable sensor test strip 440 can also be inserted with its long (or major) axis positioned differently with respect to the long (or major) axis of the housing 420, such as perpendicular.
- Example sensor test strips will be described in more detail, below.
- FIG. 4 depicts the test strip located approximately in the middle of the gas sampling device 410 (top to bottom with regard to the perspective of the figure), it will be appreciated that the test strip can be positioned biased toward the top or the bottom, to be closer to an exterior surface of the housing 420 or gas sampling device 410.
- the disposable sensor strip can be positioned less than 5 cm, 4 cm, 3 cm, 2 cm, 1 cm, 0.5 cm, 0.2 cm or less from exterior surface (or exterior wall) of the housing 420.
- the docking station 430 is generally configured to collect data generated from testing the gas sample.
- the docking station 430 has a reading device 432 that can include circuitry to measure the capacitance of a plurality of graphene sensors. Aspects of circuitry to measure the capacitance of the graphene sensors are described in greater detail below. However, it will be appreciated that such circuitry can all be disposed in the gas sampling device 410, can all be disposed in the docking station 430, or can be distributed with some components in the gas sampling device 410 and some components in the docking station 430. Indeed, in some cases there may not be a separate docking station and functionality attributed thereto herein can simply be integrated into the gas sampling device.
- the reading device 432 can also be configured to both baseline data and sample data from the disposable sensor test strip 440 - where the term "baseline data" is defined as data collected before exposure of the disposable sensor test strip 440 to the gas sample or the patient or test subject and wherein the term “sample data” refers to data specific to the gas sample of the patient or test subject.
- the baseline data can reflect conditions of whatever gas happens to be in the testing chamber prior to obtaining a gas sample of a patient. Ambient air can purposefully be pushed through the testing chamber, and/or a particular reference gas sample of known composition can be put into the testing chamber for purposes of generating baseline data.
- the docking station 430 is generally configured to be a docking location for the gas sampling device 410.
- the docking station 430 is generally configured to physically receive the gas sampling device 410.
- the docking station 430 can receive the gas sampling device 410 through a variety of structures and configurations that will be appreciated by those having ordinary skill in the art.
- the docking station 430 and the docking structure 421 of the gas sampling device 410 can have a mating configuration by which the docking station 430 receives the docking structure 421 of the gas sampling device 410.
- the docking station 430 and the docking structure 421 can define an interference fit. However, the docking station 430 can simply rest upon or in the docking structure 421.
- the docking station 430 and the docking structure 421 can be configured to position the disposable sensor test strip 440 and the reading device 432 in sufficient proximity to accommodate transmission of data between the reading device 432 and disposable sensor test strip 440.
- the docking station and the docking structure can be configured to position the disposable sensor test strip 440 and the reading device 432 within 6 cm, 5 cm, 4 cm, 3 cm, or 2 cm of each other, or even within 1 cm of each other.
- the docking station 430 can have various additional components.
- the docking station 430 can have a processor 436 and memory 435.
- the processor 436 and memory 435 can be configured to process and store data obtained from the tested gas sample.
- the memory 435 can store baseline data locally and the processor 436 can be configured to remove collected baseline data from the tested gas data to obtain adjusted data. Such adjusted data can remove some impact of the ambient environment on the tested gas data.
- the processor can be configured to compare the adjusted data (or, in some embodiments the tested gas data) to known data indicative of one or more diseases. Such a comparison can be used to identify the presence of a particular disease using a comparative algorithm.
- the processor of the docking station 430 can be configured to identify a defect in the disposable sensor test strip 440.
- Example defects can include manufacturing defects and/or premature exposure to ambient gases.
- the docking station 430 can be configured to collect, save, and potentially transmit records of such defects.
- the docking station 430 can have networking hardware 434.
- the networking hardware 434 can be configured to transmit data over a network to a remote system, including a cloud-based system.
- the remote system can be a hospital, clinic, laboratory, or other location.
- the networking hardware 434 can be configured to transmit data generated from testing the gas sample.
- the networking hardware 434 can be configured to transmit baseline data.
- the networking hardware can be configured to transmit adjusted data.
- the remote system can analyze the data it receives. For example, the remote system can be configured to compare the adjusted data to known data indicative of a plurality of diseases. That comparison can identify the presence of a particular disease.
- the docking station 430 can have a user interface 438.
- the user interface 438 can be configured to communicate information to a user.
- the user interface 438 can be configured to communicate an active data transmission, such as a data transmission between the docking station 430 and the gas sampling device 410 and/or between the docking station 430 and a network.
- the user interface 438 can be configured to communicate information about the current stage of the testing process, progress of the same, or what steps are next or what actions are required.
- the user interface 438 can be configured to communicate that that the gas sampling device 410 is ready to receive a gas sample or that the docking station 430 has finished reading data from the gas sampling device 410.
- the user interface 438 can also be configured to communicate a defect in the sensor test strip.
- the user interface 438 can be configured to communicate through visual notification, audio notification, and the like.
- a flashing light can be used to indicate that the docking station 430 is transmitting data.
- the user interface 438 can include a light source such as an LED or similar light emitting device.
- a disposable sensor test strip 440 is inserted into the gas sampling device 410 such that it is received by the gas testing chamber 426 defined by a housing of a gas sampling device.
- the gas sampling device 410 having the disposable sensor test strip 440 is docked to the docking station 430, and the reading device 432 of the docking station 430 reads baseline data from the disposable sensor test strip 440 through the housing 420 of the gas sampling device 410.
- the gas sampling device 410 is undocked from the docking station 430 after reading the baseline data, and a gas sample is received by the gas testing chamber such that the gas sample is brought into contact with the disposable sensor test strip 440.
- the gas sampling device 410 may be physically grasped by a care provider and removed from the docking station 430 and physically handed to a patient or test subject who may then blow into the gas sampling device 410 to provide the gas sample to be analyzed.
- the gas sampling device 410 may be held by the care provider instead of being held by the patient or test subject.
- the gas sampling device 410 can then be docked to the docking station 430 after receiving the gas sample, and the data from the tested gas is read from the disposable sensor test strip 440 by the reading device 432, wherein the adjusted data is read through the housing 420 of the gas sampling device 410.
- the disposable sensor test strip 440 can be configured to be single-use. As such, the disposable sensor test strip 440 can be disposed of following the collection of sample gas data from the disposable sensor test strip 440.
- Various other methods of using the system depicted in FIG. 4 are also contemplated.
- the measurement zones 442 can include a plurality of discrete binding detectors in the form of graphene varactors that can include one or more analyte binding receptors bound thereto. All of the analyte binding receptors within a particular discrete binding detector can be the same with respect to their analyte binding properties, or at least some of the analyte binding receptors within a particular zone can be different from one another with respect to their analyte binding properties. Each discrete binding detector can be unique. Discrete binding detectors that are unique can be cross-reactive in that they bind to different portions or different configurations of the same chemical compound.
- the plurality of graphene varactors can include those that are specific for different volatile organic compound.
- the plurality of graphene varactors can detect the presence of at least 5, 10, 15, 20, 30, 40 or more different volatile organic compounds.
- the number of different volatile organic compounds detected by the graphene varactors can be in a range wherein any of the forgoing numbers can serve as the upper or lower bound of the range provided that the upper bound is greater than the lower bound.
- the capacitance of the graphene sensor can be measured by delivering an excitation current at a particular voltage and/or over a range of voltages. Measuring the capacitance provides data that reflects the binding status of analytes to the graphene sensor.
- Various measurement circuitry can be used to measure the capacitance of the graphene sensor.
- the circuitry can include a capacitance to digital converter (CDC) 502 in electrical communication with a multiplexor 504.
- the multiplexor 504 can provide selective electrical communication with a plurality of graphene varactors 506.
- the other side of the graphene varactors 506 can be in electrical communication with a ground 508.
- the CDC 502 can be in electrical communication with a bus device 510.
- the bus device 510 can include various specific components, but can be selected from the group consisting of an I2C or an SPI.
- the bus device 510 can, in turn, be in electrical communication with a controller or processor.
- the bus device 510 can be in electrical communication with a microcontroller 512.
- the microcontroller 512 can, in turn, be in communication with other components of the device or system. It will be appreciated that not all of the components illustrated in FIG. 5 may be separate from one another. On the contrary, various components can be integrated together, including, but not limited to, the multiplexor 504, the CDC 502, and the bus device 510.
- the excitation signal (an alternating voltage) is applied to the selected capacitor through the multiplexor and the electronic charge required to charge and discharge the graphene varactor is measured to determine the capacitance.
- the amplitude of the excitation signal is fixed by the CDC 502.
- the bias voltage at which the capacitance is measured is equal to the average voltage of the excitation signal.
- An exemplary CDC for this type of configuration includes Texas Instruments model FDC1004.
- the FDC1004 has an integrated multiplexor and IC. It will be appreciated that many other types of CDCs can also be used.
- the graphene varactors may not be grounded.
- the other side of the graphene varactors can be connected to another device.
- the other side of the graphene varactors can be connected to an independent excitation output of the CDC or another component.
- an excitation signal (again, an alternating voltage) is applied to all of the capacitors in the sensor array, and electronic charge required to charge and discharge the selected graphene varactor is measured through the multiplexor to determine the capacitance.
- the amplitude of the excitation signal is set by the CDC.
- the bias voltage at which the capacitance is measured can be equal to the difference between the bias voltage at the CDC input (via the multiplexor, usually equal to VCC/2, where VCC is the supply voltage) and the average voltage of the excitation signal. Since the excitation voltage is typically centered about VCC/2 for this type of CDC, the bias voltage is typically fixed at zero volts.
- the circuitry can include a capacitance to digital converter (CDC) 502 in electrical communication with a multiplexor 504.
- the multiplexor 504 can provide selective electrical communication with a plurality of graphene varactors 506.
- the other side of the graphene varactors 506 can be in electrical communication with an independent excitation output of the CDC.
- the change in capacitance of the graphene varactor based on analyte binding depends on the excitation voltage used to measure the capacitance. Because of this, a greater amount of information can be gathered by varying the voltage of the excitation signal across a range of voltages. Various techniques can be used to achieve this. A pair of programmable digital to analog converters with different output voltages can be used in combination with a switch in order to achieve variation in the voltage of the excitation signal.
- the circuitry can include a capacitance to digital converter (CDC) 502 in electrical communication with a multiplexor 504.
- the multiplexor 504 can provide selective electrical communication with a plurality of graphene varactors 506.
- the connection to the other side of the graphene varactors 506 can be controlled by a switch 702 (as controlled by the CDC) and can provide selective electrical communication with a first digital to analog converter (DAC) 704 and a second digital to analog converter (DAC) 706.
- the other side of the DACs 704, 706 can be connected to a bus device 510, or in some cases, the CDC 502.
- the excitation signal from the CDC controls the switch between the output voltages of the two programmable Digital to Analog Converters (DACs).
- the programmed voltage difference between the DACs determines the excitation amplitude, providing an additional programmable scale factor to the measurement and allowing measurement of a wider range of capacitances than specified by the CDC.
- the bias voltage at which the capacitance is measured is equal to the difference between the bias voltage at the CDC input (via the multiplexor, usually equal to VCC/2, where VCC is the supply voltage) and the average voltage of the excitation signal, which is programmable.
- Buffer or amplifiers and/or bypass capacitance can be used at the DAC outputs to maintain stable voltages during switching. Many different ranges of DC bias voltages can be used.
- the range of DC bias voltages can be from - 3 V to 3 V; -2.5 V to 2.5 V; -2 V to 2 V; - 1.5 V to 1.5 V; - 1 V to 1 V; or from -0.5 V to 0.5 V.
- aspects that can be calculated include maximum slope of capacitance to voltage, change in maximum slope of capacitance to voltage over a baseline value, minimum slope of capacitance to voltage, change in minimum slope of capacitance to voltage over a baseline value, minimum capacitance, change in minimum capacitance over a baseline value, voltage at minimum capacitance (Dirac point), change in voltage at minimum capacitance, maximum capacitance, change in maximum capacitance, ratio of maximum capacitance to minimum capacitance, response time constants, and ratios of any of the foregoing between different graphene sensors and particularly between different graphene sensors having specificity for different analytes.
- the above calculated aspects can be used for various diagnostic purposes.
- the above calculated aspects can be indicative of the identity and/or concentrations of specific volatile organic components of a gas sample.
- each of the calculated values above can serve as a distinct piece of data that forms part of a pattern for a given patient and/or given gas sample.
- the pattern can then be matched against pre-existing patterns, or patterns identified in real- time, derived from large stored data sets through techniques such as machine learning or other techniques, wherein such patterns are determined to be characteristic of various conditions or disease states.
- the above calculated aspects can also be put to other purposes, diagnostic and otherwise.
- the controller circuit can be configured to receive an electrical signal reflecting the capacitance of the graphene varactors.
- the controller circuit can include a microcontroller to perform these calculations.
- the controller circuit can include a microprocessor in electrical communication with the measurement circuit.
- the microprocessor system can include components such as an address bus, a data bus, a control bus, a clock, a CPU, a processing device, an address decoder, RAM, ROM and the like.
- the controller circuit can include a calculation circuit (such as an application specific integrated circuit - ASIC) in electrical communication with the measurement circuit.
- the system can include a non-volatile memory where sensitivity calibration information for the particular sensor is stored.
- the sensor could be tested in a production facility, where its sensitivity to various analytes such as VOC's can be determined and then stored on an EPROM or similar component.
- sensitivity calibration information can be stored in a central database and referenced with a sensor serial number when patient data is sent to a central location for analysis and diagnosis.
- Components can be configured to communicate over a network, such as the internet or a similar network.
- a central storage and data processing facility can be included. Data gathered from sensors in the presence of the patient (local) can be sent to the central processing facility (remote) via the internet or a similar network, and the pattern from the particular patient being evaluated can be compared to those of thousands or millions of other patients, many of whom have been previously diagnosed with various conditions and wherein such condition data has been stored. Pattern matching algorithms can be used to find other patients or classes of patients (for example disease or condition specific classes) to which the current patient's pattern is most similar. Each class of patients can include a predetermined likelihood of having a given condition or disease state. In this manner, after pattern matching a likelihood of having a given condition or disease state can be provided back across the data network to the facility where the patient is currently at.
- Methods can include any of the approaches and/or operations described herein.
- a method of measuring analyte presence on a graphene varactor is preferably included.
- the method can include measuring a capacitance of the graphene varactor over a range of DC bias voltages, comparing the measured capacitance at one or more DC bias voltages to one or more corresponding baseline capacitance values and determining the presence or absence of an analyte based on the comparison.
- the method can further include determining one or more aspects including, but not limited to, maximum slope of capacitance to voltage, change in maximum slope of capacitance to voltage over a baseline value, minimum slope of capacitance to voltage, change in minimum slope of capacitance to voltage over a baseline value, minimum capacitance, change in minimum capacitance over a baseline value and voltage at minimum capacitance (Dirac point), change in voltage at minimum capacitance, maximum capacitance, change in maximum capacitance, ratio of maximum capacitance to minimum capacitance, response time constants, and ratios of any of the foregoing between different graphene sensors and particularly between different graphene sensors having specificity for different analytes.
- determining one or more aspects including, but not limited to, maximum slope of capacitance to voltage, change in maximum slope of capacitance to voltage over a baseline value, minimum slope of capacitance to voltage, change in minimum slope of capacitance to voltage over a baseline value, minimum capacitance, change in minimum capacitance over a baseline value and voltage at minimum
- the method can include forming a capacitance to voltage curve from the measured capacitance of the graphene varactor over the range of DC bias voltages.
- the method can include comparing the formed capacitance to voltage curve with a baseline capacitance to voltage curve.
- the method can include distinguishing between different analytes binding to the graphene varactor.
- the method can further include measuring a capacitance of the graphene varactor over a range of DC bias voltages.
- the range of DC bias voltages can be from - 3 V to 3 V; -2.5 V to 2.5 V; -2 V to 2 V; -1.5 V to 1.5 V; -1 V to 1 V; -0.5 V to 0.5 V.
- the patient can be prompted to take a breath or gas test (where the test could be performed either in a non-clinical setting such as their home or where such a prompt could cause them to come to a clinical setting to take the test).
- a pattern including such things as sleep patterns (e.g. wearable, implant or non-contact in-home sensor), physiological data (autonomic tone measures), body weight (such as weight automatically measured by a mat in the house), activity levels (e.g. mobile device, wearable, implant or non-contact in-home sensor), etc. can be assessed, such as using an algorithm, and if the results of those factors so indicate, then the system can inform the user that they should administer or get a breath or gas test to detect early signs of heart failure decompensation. If a positive result, or data trends are beyond a normal range for the individual patient, then the system can inform the patient to seek medical care for early intervention.
- a pattern including things such as sleep patterns, autonomic tone, respiratory rate, respiratory sounds, activity levels, etc. can be used to recommend to the user that they should administer a breath test (or come to a clinic to get a breath test) to detect early signs of a COPD exacerbation or repeat exacerbation. If a positive result, or data trends beyond normal range for the individual patient, seek medical care and/or use prescribed pharmaceutical (e.g. bronchodilators, corticosteroids, etc.) for early intervention.
- prescribed pharmaceutical e.g. bronchodilators, corticosteroids, etc.
- heart failure decompensation and COPD such patterns and prompts to the patient to get a breath test can also be used for diabetes management and inflammatory bowel diseases (also including data regarding dietary intake, autonomic tone, etc. in the pattern) to detect early signs of a flare-up.
- Example 1 Capacitance for a Graphene Varactor over a Range of Voltages
- a graphene varactor was manufactured consistent with that described in U.S.Publ. Appl. No. 2014/0145735 .
- a baseline capacitance to voltage curve was established by measuring capacitance over a range of excitation voltages while flushing the sensor with nitrogen gas using an LCR meter.
- the DC bias voltage ranged from -0.5 V to 0.5 V.
- capacitance values over the same bias voltage range were also measured while flushing the sensor with a combination of nitrogen gas and octanol vapor.
- the total flow rate was 0.5 liters per minute in each experiment, octanol concentration was approximately 3.6 parts per million in nitrogen, sensors were exposed to the nitrogen gas and octanol vapor mixture for approximately 5 minutes before measurement for equilibration, the AC excitation signal had amplitude 50 mV and frequency 500 kHz.
- Example 2 Capacitance for a Graphene Varactor over a Range of Voltages
- a graphene varactor was prepared as described in Example 1.
- a baseline capacitance to voltage curve was established by measuring capacitance over a range of excitation voltages using an LCR meter as described above in Example 1.
- the DC bias voltage ranged from -1 V to 1 V.
- capacitance values over the same bias voltage range were also measured while flushing the sensor with a combination of nitrogen gas and acetone vapor. Details were the same as descried above in Example 1, except that the acetone concentration was approximately 25,000 parts per million.
- Example 3 Capacitance for a Functionalized Graphene Varactor over a Range of Voltages
- a graphene varactor was prepared as described in Example 1. The graphene was then functionalized with pyrene-acetic acid by soaking the varactor in a 1 mM solution of pyrene acetic-acid in ethanol for 14 hours.
- a baseline capacitance to voltage curve was established by measuring capacitance over a range of excitation voltages using an LCR meter as described above in Example 1.
- FIG. 10 it can be seen that binding of acetone caused the capacitance to voltage curve to shift sharply to the right, with the Dirac point increasing by approximately 0.1 volts.
- FIG. 11 it can be seen that binding of octane caused relatively small changes in the capacitance to voltage curve, but the shift to the right made the binding detectable.
- FIG. 12 it can be seen that binding of octanol caused relatively small changes in the capacitance to voltage curve, but the shift to the right made the binding detectable.
- circuitry can include both hardwired circuitry for execution of particular operations as well as processors that are programmed to execute instructions to provide the same functionality.
Landscapes
- Health & Medical Sciences (AREA)
- Chemical & Material Sciences (AREA)
- Life Sciences & Earth Sciences (AREA)
- General Health & Medical Sciences (AREA)
- Pathology (AREA)
- Physics & Mathematics (AREA)
- Analytical Chemistry (AREA)
- Biochemistry (AREA)
- General Physics & Mathematics (AREA)
- Immunology (AREA)
- Electrochemistry (AREA)
- Chemical Kinetics & Catalysis (AREA)
- Engineering & Computer Science (AREA)
- Physiology (AREA)
- Biophysics (AREA)
- Pulmonology (AREA)
- Biomedical Technology (AREA)
- Heart & Thoracic Surgery (AREA)
- Medical Informatics (AREA)
- Molecular Biology (AREA)
- Surgery (AREA)
- Animal Behavior & Ethology (AREA)
- Public Health (AREA)
- Veterinary Medicine (AREA)
- Power Engineering (AREA)
- Investigating Or Analyzing Materials By The Use Of Electric Means (AREA)
Abstract
Description
- The present disclosure invention relates to systems, devices and methods for analyte sensing in physiological gas samples. More specifically, the present invention disclosure relates to systems, devices and methods for measuring analyte presence on graphene varactors.
- In the process of providing health care, clinicians often make physical observations and run tests to gather data about a patient. After collecting data and analyzing other aspects, such as a given patient's health history, the clinician often forms a diagnosis and then selects a therapy to treat the diagnosed condition.
- Knowledge of the presence and/or concentrations of various chemical analytes, such as volatile organic compounds, can be extremely useful in forming a diagnosis.
- However, measuring such chemical analytes in a clinically practical manner remains technically challenging.
- The present invention disclosure relates to systems, devices and methods for analyte sensing in physiological gas samples.
- A system for measuring analyte presence on a graphene varactor according to the present invention disclosure can include a capacitance to digital converter (CDC) and a graphene varactor. The CDC can be in electrical communication with the graphene varactor and can be configured to measure the capacitance of the graphene varactor in response to an excitation signal over a plurality of DC bias voltages.
- The system can further include a multiplexor configured to selectively provide electrical communication between the CDC and a plurality of graphene varactors.
- An excitation signal can be applied to a selected graphene varactor through the multiplexor.
- The excitation signal can include an alternating voltage component.
- The amplitude of the excitation signal can be fixed by the CDC.
- A controller circuit can be included and can be configured to receive an electrical signal reflecting the capacitance of the graphene varactor.
- The controller circuit can include a microcontroller.
- The system can further include an electronic component in electrical communication with the controller circuit and the CDC, the electronic component selected from the group consisting of an I2C or an SPI.
- The graphene varactor can include a functionalized graphene varactor.
- The controller circuit can be configured to calculate at least one parameter for the graphene varactor selected from the group consisting of:
- maximum slope of capacitance to voltage;
- change in maximum slope of capacitance to voltage over a baseline value;
- minimum slope of capacitance to voltage;
- change in minimum slope of capacitance to voltage over a baseline value;
- minimum capacitance;
- change in minimum capacitance over a baseline value;
- voltage at minimum capacitance;
- change in voltage at minimum capacitance;
- maximum capacitance;
- change in maximum capacitance;
- ratio of maximum capacitance to minimum capacitance;
- response time constant; and
- ratios of any of the foregoing between the graphene varactor and a second graphene varactor.
- The graphene varactor(s) can be grounded.
- The graphene varactor(s) can be in electrical communication with an independent excitation output of the CDC.
- The system can further include one or more programmable digital to analog converters (DACs) in series with the plurality of graphene sensors.
- The system can further include a switch, the CDC in electrical communication with the switch and controlling the switch to selectively provide communication with output voltages of two programmable digital to analog converters (DACs), the programmed voltage difference between the DACs determining the excitation amplitude, and the difference between the programmed average voltage of the DACs and the bias at the CDC input determining the DC bias.
- The invention disclosure also relates to a gas sampling device, for example a hand-held breath sampling device or a gas sampling device for use with catheters and/or endoscopy systems, for sensing gaseous analytes for example volatile organic compounds, the device comprising or incorporated into the above referred to system.
- The invention disclosure also relates to the use of this system and/or gas sampling device for determining the presence of and/or measuring a chemical analyte such as a volatile organic compound, in particular for use in the following method according to the present invention disclosure.
- The invention disclosure also relates to a method for measuring analyte presence on a graphene varactor. The method can include measuring a capacitance of the graphene varactor over a range of DC bias voltages; comparing the measured capacitance at one or more DC bias voltages to one or more corresponding baseline capacitance values; and determining the presence or absence of an analyte based on the comparison.
- The method can further include determining one or more aspects selected from the group consisting of:
- maximum slope of capacitance to voltage;
- change in maximum slope of capacitance to voltage over a baseline value;
- minimum slope of capacitance to voltage;
- change in minimum slope of capacitance to voltage over a baseline value;
- minimum capacitance;
- change in minimum capacitance over a baseline value;
- voltage at minimum capacitance;
- change in voltage at minimum capacitance;
- maximum capacitance;
- change in maximum capacitance;
- ratio of maximum capacitance to minimum capacitance;
- response time constant; and
- ratios of any of the foregoing between two different graphene sensors.
- The method can further include forming a capacitance to voltage curve from the measured capacitance of the graphene varactor over the range of DC bias voltages.
- The method can further include comparing the formed capacitance to voltage curve with a baseline capacitance to voltage curve.
- The method can further include distinguishing between different analytes binding to the graphene varactor.
- The range of DC bias voltages can be in the following ranges -3 V to 3 V; -2.5 V to 2.5 V; -2 V to 2 V; -1.5 V to 1.5 V; -1 V to 1 V; -0.5 V to 0.5 V.
- The present invention disclosure is also referred to in the following clauses, the wording of which corresponds to the clauses.
- This summary is an overview of some of the teachings of the present application and is not intended to be an exclusive or exhaustive treatment of the present subject matter. Further details are found in the detailed description and appended clauses. Other aspects will be apparent to persons skilled in the art upon reading and understanding the following detailed description and viewing the drawings that form a part thereof, each of which is not to be taken in a limiting sense. The scope herein is defined by the appended clauses and their legal equivalents.
- Aspects may be more completely understood in connection with the following drawings, in which:
-
FIG. 1 is a schematic view of various components of a system in accordance with the present invention disclosure. -
FIG. 2 is a schematic exploded view of a graphene varactor in accordance with the present invention disclosure. -
FIG. 3 is a schematic cross-sectional view of a graphene varactor in accordance with the present invention disclosure. -
FIG. 4 is a schematic cross-sectional view of elements of a gas sensing device consistent with the technology disclosed herein. -
FIG. 5 is a schematic diagram of circuitry to measure the capacitance of a plurality of graphene sensors in accordance with the present invention disclosure. -
FIG. 6 is a schematic diagram of circuitry to measure the capacitance of a plurality of graphene sensors in accordance with the present invention disclosure. -
FIG. 7 is a schematic diagram of circuitry to measure the capacitance of a plurality of graphene sensors in accordance with the present invention disclosure. -
FIG. 8 is a graph showing capacitance versus DC bias voltage for a graphene varactor in accordance with the present invention disclosure. -
FIG. 9 is a graph showing capacitance versus DC bias voltage for a graphene varactor in accordance the present invention disclosure. -
FIG. 10 is a graph showing capacitance versus DC bias voltage for a functionalized graphene varactor in response to acetone binding in accordance with the present invention disclosure. -
FIG. 11 is a graph showing capacitance versus DC bias voltage for a functionalized graphene varactor in response to octane binding in accordance with the present invention disclosure. -
FIG. 12 is a graph showing capacitance versus DC bias voltage for a functionalized graphene varactor in response to octanol binding in accordance with the present invention disclosure. - Volatile organic compounds, as sensed in breath samples or other gas samples, can provide valuable information about the health status of a patient. In particular, patterns of volatile organic compounds (including the presence, absence, and/or concentration of a plurality of different volatile organic compounds) in a breath or gas sample of a patient can be associated with various disease states and/or particular health statuses. The disease states can include, but are not limited to, lung cancer, colon cancer, pulmonary disease (e.g. asthma, COPD), cardiovascular disease (e.g. heart failure), infectious diseases, digestive and inflammatory diseases (e.g. inflammatory bowel diseases such as Crohn's, colitis, or the like) or diabetes.
- Graphene varactors are one type of device that can be used to measure volatile organic compounds. Various properties of graphene varactors, such as capacitance, can change in response to the presence of volatile organic compounds thereon. This has been used to propose sensors in which a value of the capacitance, measured at a previously determined advantageous bias voltage, is measured and is correlated with the concentration of a specific analyte However, measurement of properties of the graphene varactors, such as capacitance, remains technically challenging. Passive wireless techniques can be used, but may not be sufficiently accurate or fast for all purposes.
- However, the present invention disclosure can be used to rapidly and accurately measure the capacitance of a plurality of graphene varactors due to the use of a capacitance-to-digital converted (CDC). Existing systems tend to rely on other measurement circuits, which are more commonly used and may be more advantageous for measuring capacitance at a given (single) bias voltage. However, a CDC component enables a rapid sweep across bias voltages in a manner that makes it practical to rapidly collect data for a plurality of DC bias voltages.
- Furthermore, an advantage of using a CDC may be that the density of sensors on a substrate that can be read in an inexpensive and portable system may be significantly increased.
- Therefore, a CDC allows for sensors which are more precise and which may be used to accurately and quickly detect various different analytes in a same sample, leading to a large and rich data set which can provide information that would be difficult or even impossible to derive using existing systems.
- Referring now to
FIG. 1 , a schematic view is shown of possible components of asystem 100 in accordance with the present invention disclosure. Thesystem 100 can include abreath sensing device 160 for sensing gaseous analytes (or volatile organic compounds). In this figure, the system is exhibited in a hand-held format. It will be appreciated, however, that many other formats for the system are contemplated herein. - The
breath sensing device 160 can include ahousing 178. Thebreath sensing device 160 can include amouthpiece 162 into which a subject to be evaluated can blow a breath sample. Thebreath sensing device 160 can also include adisplay screen 174 and auser input device 176, such as a keyboard. Thebreath sensing device 160 can also include agas outflow port 172. Aspects of breath sensing systems and devices are described in U.S. Publ. Appl. No.2016/0109440 . WhileFIG. 1 shows a breath sensing device, it will be appreciated that other types of gas sampling systems can also be used herein. For example, gas sampling devices for use with catheters and endoscopy systems can also be used. An exemplary gas sampling device in the context of a catheter or endoscopy device is described inU.S. Appl. No. 62/350,345 - The
system 100 can include alocal computing device 182 that can include a microprocessor, input and output circuits, input devices, a visual display, a user interface, and the like. Thebreath sensing device 160 can communicate with thelocal computing device 182 in order to exchange data between thebreath sensing device 160 and thelocal computing device 182. Thelocal computing device 182 can be configured to perform various processing steps with the data received from thebreath sensing device 160, including, but not limited to, calculating various parameters described herein. However, it should be appreciated that the features associated with thelocal computing device 182 can be integrated into thebreath sensing device 160. Thelocal computing device 182 can be a laptop computer, a desktop computer, a server (real or virtual), a purpose dedicated computer device, or a portable computing device (including, but not limited to, a mobile phone, tablet, wearable device, etc.). - The
local computing device 182 and/or thebreath sensing device 160 can communicate with computing devices in remote locations through adata network 184, such as the Internet or another network for the exchange of data as packets, frames, or otherwise. - The
system 100 can also include a computing device such as a server 186 (real or virtual). Theserver 186 can be located remotely from thebreath sensing device 160. Theserver 186 can be in data communication with adatabase 188. - The
database 188 can be used to store various patient information, such as that described herein. The database can specifically include an electronic medical database containing data regarding the health status of a patient, patterns of data associated with various conditions (such as that generated from machine learning analysis of large sets of patient data), demographic data and the like. - Graphene varactors can be prepared in various ways and with various geometries.
- Referring now to
FIG. 2 , an exploded view of agraphene varactor 200 is shown. Thegraphene varactor 200 can include aninsulator layer 202, agate electrode 204, adielectric layer 206, agraphene layer 208, and acontact electrode 210. -
FIG. 3 shows a cross-sectional view of thegraphene varactor 200. As is shown, thegate electrode 204 can be recessed into theinsulator layer 202. Thegate electrode 204 can be formed by etching a depression into theinsulator layer 202 and then depositing an electrically conductive material in the depression to form thegate electrode 204. Theinsulator layer 202 can include various materials. Theinsulator layer 202 can be silicon dioxide formed on a silicon substrate (wafer). Thedielectric layer 206 can be formed on a surface of theinsulator layer 202 and thegate electrode 204. Thedielectric layer 206 can be formed of a material, such as, silicon dioxide, aluminum oxide, hafnium dioxide, zirconium dioxide, hafnium silicate or zirconium silicate. Thegraphene layer 208 can be disposed on thedielectric layer 206. Thegraphene layer 208 can be a graphene monolayer. Acontact electrode 210 can also be disposed on the surface (or a portion thereof) of thegraphene layer 208. Aspects of exemplary graphene varactors can be found in U.S. Publ. App. No.2014/0145735 . - Further aspects of gas and/or breath sampling systems are described in U.S. Publ. Appl. No.
2016/0109440 . - The graphene layer can be functionalized to make the graphene sensor specific for a particular analyte or class of analytes. As analytes bind to the graphene layer, the capacitance of the sensor changes. Further, as shown below with regard to
FIGS. 8-9 , the capacitance changes differently based on the voltage of the excitation current. - Systems herein can also include a breath and/or gas sensing device or system. In particular, systems herein can gather data on the presence, absence, and/or amount of various gaseous analytes including, but not limited to, volatile organic compounds.
-
FIG. 4 is a schematic cross-sectional view of anexample system 400 consistent with the technology disclosed herein. It will be appreciated that this schematic view has been simplified for ease of illustration and that embodiments of systems and devices herein can include various features not shown inFIG. 4 . In addition, some embodiments of systems and devices herein may lack various features shown inFIG. 4 . Thesystem 400 is generally configured for collecting a gas sample and communicating data associated with the gas sample. Thesystem 400 has agas sampling device 410 and adocking station 430. - The
gas sampling device 410 can be configured to collect a gas sample and facilitate testing of the gas sample to generate data. In some embodiments, thegas sampling device 410 can be configured as a handheld device. In such cases, the gas sampling device can be configured to be held in the hand of a care provider, a patient, or both, during certain steps of its use, while also being configured to be held or otherwise positioned in association with thedocking station 430 during certain steps of its use. - The
gas sampling device 410 can be configured to receive a gas sample, such as exhaled breath, from a patient and direct the gas sample to a testing location. Thegas sampling device 410 generally has ahousing 420 defining anairflow aperture 422, agas testing chamber 426, asensor receptacle 428, anairflow pathway 424, and adocking structure 421. - When receiving a gas sample, the gas (such as breath from a patient), can pass into the
gas sampling device 410 through theairflow aperture 422, through theairflow pathway 424, into thegas testing chamber 426 and into contact with one ormore measurement zones 442 of a disposablesensor test strip 440, and then out the end of thegas testing chamber 426 through thesensor receptacle 428, or through a separate exhaust port (not shown in this view). While this view depicts contact in some areas between thesensor receptacle 428 and the disposablesensor test strip 440, it will appreciated that there can be segments or areas where thesensor receptacle 428 and the disposablesensor test strip 440 do not contact or do not create sealing contact, thus allowing for a path for the gas to flow out through thesensor receptacle 428. - While
FIG. 4 shows theairflow pathway 424 to be approximately the same size as the interior space of thehousing 420, it will be appreciated that this is simply for ease of illustration and that the size of theairflow pathway 424 can be, in many cases, much smaller than the entire interior size of thehousing 420, allowing for room for other components within the interior of thehousing 420, such as other components described herein including, but not limited to, sensors, a power source, processing devices, communication hardware, conditioning elements, and the like. - The
housing 420 can be constructed of a variety of materials and combinations of materials. Thehousing 420 can be a single cohesive structure or can be constructed of multiple components that are coupled to form thehousing 420. As an illustrative example, a portion of thehousing 420 that defines theairflow pathway 424 can be coupled to the portion of thehousing 420 that defines theairflow aperture 422. The portion of thehousing 420 that defines theairflow pathway 424 can include a conduit or tube with various different cross-sectional sizes and shapes. The conduit or tube can be formed from various materials including, but not limited to, polymers, metals, ceramics, glass, composites or the like. In some embodiments, surfaces lining theairflow pathway 424 can be coated with materials to provide various desirable functional properties. - The
airflow aperture 422 is generally configured to provide an input for the gas sample at thehousing 420. Theairflow aperture 422 can be configured to be in fluid communication with a patient's mouth, although in some other embodiments a protective liner can be used to provide a barrier between the patient's mouth and the housing, which will be described in more detail, below. - The
airflow pathway 424 generally is configured to direct the gas input at theairflow aperture 422 to thegas testing chamber 426. As such, theairflow pathway 424 generally extends from theairflow aperture 422 to thegas testing chamber 426. Theairflow pathway 424 can have a cross-sectional area that is substantially the same along the length of the airflow pathway or it can vary. Thegas testing chamber 426 can have different interior dimensions (e.g., height, width, etc.) than the airflow pathway leading to it. - The
gas testing chamber 426 defines a testing location for the gas sample. Thegas testing chamber 426 can be configured to receive ameasurement zone 442 of a disposablesensor test strip 440. Accordingly, thesensor receptacle 428 defined by thehousing 420 is generally configured to removably retain the disposablesensor test strip 440 within thegas testing chamber 426. Thesensor receptacle 428 can be configured to slidably receive the disposablesensor test strip 440 that is manually inserted by a user. The disposablesensor test strip 440 can be inserted with its long (or major) axis parallel to the long (or major) axis of thehousing 420. However, the disposablesensor test strip 440 can also be inserted with its long (or major) axis positioned differently with respect to the long (or major) axis of thehousing 420, such as perpendicular. Example sensor test strips will be described in more detail, below. - While
FIG. 4 depicts the test strip located approximately in the middle of the gas sampling device 410 (top to bottom with regard to the perspective of the figure), it will be appreciated that the test strip can be positioned biased toward the top or the bottom, to be closer to an exterior surface of thehousing 420 orgas sampling device 410. The disposable sensor strip can be positioned less than 5 cm, 4 cm, 3 cm, 2 cm, 1 cm, 0.5 cm, 0.2 cm or less from exterior surface (or exterior wall) of thehousing 420. - The
docking station 430 is generally configured to collect data generated from testing the gas sample. Thedocking station 430 has areading device 432 that can include circuitry to measure the capacitance of a plurality of graphene sensors. Aspects of circuitry to measure the capacitance of the graphene sensors are described in greater detail below. However, it will be appreciated that such circuitry can all be disposed in thegas sampling device 410, can all be disposed in thedocking station 430, or can be distributed with some components in thegas sampling device 410 and some components in thedocking station 430. Indeed, in some cases there may not be a separate docking station and functionality attributed thereto herein can simply be integrated into the gas sampling device. - The
reading device 432 can also be configured to both baseline data and sample data from the disposable sensor test strip 440 - where the term "baseline data" is defined as data collected before exposure of the disposablesensor test strip 440 to the gas sample or the patient or test subject and wherein the term "sample data" refers to data specific to the gas sample of the patient or test subject. The baseline data can reflect conditions of whatever gas happens to be in the testing chamber prior to obtaining a gas sample of a patient. Ambient air can purposefully be pushed through the testing chamber, and/or a particular reference gas sample of known composition can be put into the testing chamber for purposes of generating baseline data. - The
docking station 430 is generally configured to be a docking location for thegas sampling device 410. Thedocking station 430 is generally configured to physically receive thegas sampling device 410. Thedocking station 430 can receive thegas sampling device 410 through a variety of structures and configurations that will be appreciated by those having ordinary skill in the art. Thedocking station 430 and thedocking structure 421 of thegas sampling device 410 can have a mating configuration by which thedocking station 430 receives thedocking structure 421 of thegas sampling device 410. Thedocking station 430 and thedocking structure 421 can define an interference fit. However, thedocking station 430 can simply rest upon or in thedocking structure 421. Thedocking station 430 and thedocking structure 421 can be configured to position the disposablesensor test strip 440 and thereading device 432 in sufficient proximity to accommodate transmission of data between thereading device 432 and disposablesensor test strip 440. In some embodiments the docking station and the docking structure can be configured to position the disposablesensor test strip 440 and thereading device 432 within 6 cm, 5 cm, 4 cm, 3 cm, or 2 cm of each other, or even within 1 cm of each other. - The
docking station 430 can have various additional components. Thedocking station 430 can have aprocessor 436 andmemory 435. Theprocessor 436 andmemory 435 can be configured to process and store data obtained from the tested gas sample. For example, thememory 435 can store baseline data locally and theprocessor 436 can be configured to remove collected baseline data from the tested gas data to obtain adjusted data. Such adjusted data can remove some impact of the ambient environment on the tested gas data. The processor can be configured to compare the adjusted data (or, in some embodiments the tested gas data) to known data indicative of one or more diseases. Such a comparison can be used to identify the presence of a particular disease using a comparative algorithm. In yet another example, the processor of thedocking station 430 can be configured to identify a defect in the disposablesensor test strip 440. Example defects can include manufacturing defects and/or premature exposure to ambient gases. Thedocking station 430 can be configured to collect, save, and potentially transmit records of such defects. - The
docking station 430 can have networking hardware 434. - The networking hardware 434 can be configured to transmit data over a network to a remote system, including a cloud-based system. The remote system can be a hospital, clinic, laboratory, or other location. The networking hardware 434 can be configured to transmit data generated from testing the gas sample. The networking hardware 434 can be configured to transmit baseline data. The networking hardware can be configured to transmit adjusted data. The remote system can analyze the data it receives. For example, the remote system can be configured to compare the adjusted data to known data indicative of a plurality of diseases. That comparison can identify the presence of a particular disease.
- The
docking station 430 can have auser interface 438. Theuser interface 438 can be configured to communicate information to a user. For example, theuser interface 438 can be configured to communicate an active data transmission, such as a data transmission between thedocking station 430 and thegas sampling device 410 and/or between thedocking station 430 and a network. Theuser interface 438 can be configured to communicate information about the current stage of the testing process, progress of the same, or what steps are next or what actions are required. For example, theuser interface 438 can be configured to communicate that that thegas sampling device 410 is ready to receive a gas sample or that thedocking station 430 has finished reading data from thegas sampling device 410. Theuser interface 438 can also be configured to communicate a defect in the sensor test strip. Theuser interface 438 can be configured to communicate through visual notification, audio notification, and the like. As a specific example, a flashing light can be used to indicate that thedocking station 430 is transmitting data. Theuser interface 438 can include a light source such as an LED or similar light emitting device. - One example approach to using the system depicted in
FIG. 4 will now be described. A disposablesensor test strip 440 is inserted into thegas sampling device 410 such that it is received by thegas testing chamber 426 defined by a housing of a gas sampling device. Thegas sampling device 410 having the disposablesensor test strip 440 is docked to thedocking station 430, and thereading device 432 of thedocking station 430 reads baseline data from the disposablesensor test strip 440 through thehousing 420 of thegas sampling device 410. Thegas sampling device 410 is undocked from thedocking station 430 after reading the baseline data, and a gas sample is received by the gas testing chamber such that the gas sample is brought into contact with the disposablesensor test strip 440. For example, thegas sampling device 410 may be physically grasped by a care provider and removed from thedocking station 430 and physically handed to a patient or test subject who may then blow into thegas sampling device 410 to provide the gas sample to be analyzed. In other cases, thegas sampling device 410 may be held by the care provider instead of being held by the patient or test subject. Thegas sampling device 410 can then be docked to thedocking station 430 after receiving the gas sample, and the data from the tested gas is read from the disposablesensor test strip 440 by thereading device 432, wherein the adjusted data is read through thehousing 420 of thegas sampling device 410. The disposablesensor test strip 440 can be configured to be single-use. As such, the disposablesensor test strip 440 can be disposed of following the collection of sample gas data from the disposablesensor test strip 440. Various other methods of using the system depicted inFIG. 4 are also contemplated. - The
measurement zones 442 can include a plurality of discrete binding detectors in the form of graphene varactors that can include one or more analyte binding receptors bound thereto. All of the analyte binding receptors within a particular discrete binding detector can be the same with respect to their analyte binding properties, or at least some of the analyte binding receptors within a particular zone can be different from one another with respect to their analyte binding properties. Each discrete binding detector can be unique. Discrete binding detectors that are unique can be cross-reactive in that they bind to different portions or different configurations of the same chemical compound. - The plurality of graphene varactors can include those that are specific for different volatile organic compound. The plurality of graphene varactors can detect the presence of at least 5, 10, 15, 20, 30, 40 or more different volatile organic compounds. The number of different volatile organic compounds detected by the graphene varactors can be in a range wherein any of the forgoing numbers can serve as the upper or lower bound of the range provided that the upper bound is greater than the lower bound.
- As referenced above, the capacitance of the graphene sensor can be measured by delivering an excitation current at a particular voltage and/or over a range of voltages. Measuring the capacitance provides data that reflects the binding status of analytes to the graphene sensor.
- Various measurement circuitry can be used to measure the capacitance of the graphene sensor.
- Referring now to
FIG. 5 , a schematic diagram is shown of circuitry to measure the capacitance of a plurality of graphene sensors. The circuitry can include a capacitance to digital converter (CDC) 502 in electrical communication with amultiplexor 504. Themultiplexor 504 can provide selective electrical communication with a plurality ofgraphene varactors 506. The other side of thegraphene varactors 506 can be in electrical communication with aground 508. - The
CDC 502 can be in electrical communication with abus device 510. Thebus device 510 can include various specific components, but can be selected from the group consisting of an I2C or an SPI. Thebus device 510 can, in turn, be in electrical communication with a controller or processor. - For example, the
bus device 510 can be in electrical communication with amicrocontroller 512. Themicrocontroller 512 can, in turn, be in communication with other components of the device or system. It will be appreciated that not all of the components illustrated inFIG. 5 may be separate from one another. On the contrary, various components can be integrated together, including, but not limited to, themultiplexor 504, theCDC 502, and thebus device 510. - In operation, the excitation signal (an alternating voltage) is applied to the selected capacitor through the multiplexor and the electronic charge required to charge and discharge the graphene varactor is measured to determine the capacitance. The amplitude of the excitation signal is fixed by the
CDC 502. The bias voltage at which the capacitance is measured is equal to the average voltage of the excitation signal. An exemplary CDC for this type of configuration includes Texas Instruments model FDC1004. The FDC1004 has an integrated multiplexor and IC. It will be appreciated that many other types of CDCs can also be used. - The graphene varactors may not be grounded. The other side of the graphene varactors can be connected to another device. For example, the other side of the graphene varactors can be connected to an independent excitation output of the CDC or another component. In this case, an excitation signal (again, an alternating voltage) is applied to all of the capacitors in the sensor array, and electronic charge required to charge and discharge the selected graphene varactor is measured through the multiplexor to determine the capacitance. The amplitude of the excitation signal is set by the CDC. The bias voltage at which the capacitance is measured can be equal to the difference between the bias voltage at the CDC input (via the multiplexor, usually equal to VCC/2, where VCC is the supply voltage) and the average voltage of the excitation signal. Since the excitation voltage is typically centered about VCC/2 for this type of CDC, the bias voltage is typically fixed at zero volts.
- Referring now to
FIG. 6 , a further schematic diagram is shown of circuitry to measure the capacitance of a plurality of graphene sensors in accordance with the present invention disclosure. The circuitry can include a capacitance to digital converter (CDC) 502 in electrical communication with amultiplexor 504. Themultiplexor 504 can provide selective electrical communication with a plurality ofgraphene varactors 506. In this embodiment, the other side of thegraphene varactors 506 can be in electrical communication with an independent excitation output of the CDC. - The change in capacitance of the graphene varactor based on analyte binding depends on the excitation voltage used to measure the capacitance. Because of this, a greater amount of information can be gathered by varying the voltage of the excitation signal across a range of voltages. Various techniques can be used to achieve this. A pair of programmable digital to analog converters with different output voltages can be used in combination with a switch in order to achieve variation in the voltage of the excitation signal.
- Referring now to
FIG. 7 , a further schematic diagram is shown of circuitry to measure the capacitance of a plurality of graphene sensors in accordance with the present invention disclosure. The circuitry can include a capacitance to digital converter (CDC) 502 in electrical communication with amultiplexor 504. Themultiplexor 504 can provide selective electrical communication with a plurality ofgraphene varactors 506. The connection to the other side of thegraphene varactors 506 can be controlled by a switch 702 (as controlled by the CDC) and can provide selective electrical communication with a first digital to analog converter (DAC) 704 and a second digital to analog converter (DAC) 706. The other side of theDACs bus device 510, or in some cases, theCDC 502. - In this case, the excitation signal from the CDC controls the switch between the output voltages of the two programmable Digital to Analog Converters (DACs). The programmed voltage difference between the DACs determines the excitation amplitude, providing an additional programmable scale factor to the measurement and allowing measurement of a wider range of capacitances than specified by the CDC. The bias voltage at which the capacitance is measured is equal to the difference between the bias voltage at the CDC input (via the multiplexor, usually equal to VCC/2, where VCC is the supply voltage) and the average voltage of the excitation signal, which is programmable. Buffer or amplifiers and/or bypass capacitance can be used at the DAC outputs to maintain stable voltages during switching. Many different ranges of DC bias voltages can be used. In some embodiments, the range of DC bias voltages can be from - 3 V to 3 V; -2.5 V to 2.5 V; -2 V to 2 V; - 1.5 V to 1.5 V; - 1 V to 1 V; or from -0.5 V to 0.5 V.
- Many different aspects can be calculated based on the capacitance data. For example, aspects that can be calculated include maximum slope of capacitance to voltage, change in maximum slope of capacitance to voltage over a baseline value, minimum slope of capacitance to voltage, change in minimum slope of capacitance to voltage over a baseline value, minimum capacitance, change in minimum capacitance over a baseline value, voltage at minimum capacitance (Dirac point), change in voltage at minimum capacitance, maximum capacitance, change in maximum capacitance, ratio of maximum capacitance to minimum capacitance, response time constants, and ratios of any of the foregoing between different graphene sensors and particularly between different graphene sensors having specificity for different analytes.
- The above calculated aspects can be used for various diagnostic purposes. In some cases, the above calculated aspects can be indicative of the identity and/or concentrations of specific volatile organic components of a gas sample. As such, each of the calculated values above can serve as a distinct piece of data that forms part of a pattern for a given patient and/or given gas sample. As also described elsewhere herein, the pattern can then be matched against pre-existing patterns, or patterns identified in real- time, derived from large stored data sets through techniques such as machine learning or other techniques, wherein such patterns are determined to be characteristic of various conditions or disease states. The above calculated aspects can also be put to other purposes, diagnostic and otherwise.
- In some cases calculations, such as those described above, can be performed by a controller circuit. The controller circuit can be configured to receive an electrical signal reflecting the capacitance of the graphene varactors. The controller circuit can include a microcontroller to perform these calculations. The controller circuit can include a microprocessor in electrical communication with the measurement circuit. The microprocessor system can include components such as an address bus, a data bus, a control bus, a clock, a CPU, a processing device, an address decoder, RAM, ROM and the like. The controller circuit can include a calculation circuit (such as an application specific integrated circuit - ASIC) in electrical communication with the measurement circuit.
- In addition, the system can include a non-volatile memory where sensitivity calibration information for the particular sensor is stored. By way of example, the sensor could be tested in a production facility, where its sensitivity to various analytes such as VOC's can be determined and then stored on an EPROM or similar component. In addition or alternatively, sensitivity calibration information can be stored in a central database and referenced with a sensor serial number when patient data is sent to a central location for analysis and diagnosis. These components can be included with any of the pieces of hardware described herein.
- Components can be configured to communicate over a network, such as the internet or a similar network. A central storage and data processing facility can be included. Data gathered from sensors in the presence of the patient (local) can be sent to the central processing facility (remote) via the internet or a similar network, and the pattern from the particular patient being evaluated can be compared to those of thousands or millions of other patients, many of whom have been previously diagnosed with various conditions and wherein such condition data has been stored. Pattern matching algorithms can be used to find other patients or classes of patients (for example disease or condition specific classes) to which the current patient's pattern is most similar. Each class of patients can include a predetermined likelihood of having a given condition or disease state. In this manner, after pattern matching a likelihood of having a given condition or disease state can be provided back across the data network to the facility where the patient is currently at.
- Methods can include any of the approaches and/or operations described herein. A method of measuring analyte presence on a graphene varactor is preferably included. The method can include measuring a capacitance of the graphene varactor over a range of DC bias voltages, comparing the measured capacitance at one or more DC bias voltages to one or more corresponding baseline capacitance values and determining the presence or absence of an analyte based on the comparison.
- The method can further include determining one or more aspects including, but not limited to, maximum slope of capacitance to voltage, change in maximum slope of capacitance to voltage over a baseline value, minimum slope of capacitance to voltage, change in minimum slope of capacitance to voltage over a baseline value, minimum capacitance, change in minimum capacitance over a baseline value and voltage at minimum capacitance (Dirac point), change in voltage at minimum capacitance, maximum capacitance, change in maximum capacitance, ratio of maximum capacitance to minimum capacitance, response time constants, and ratios of any of the foregoing between different graphene sensors and particularly between different graphene sensors having specificity for different analytes.
- The method can include forming a capacitance to voltage curve from the measured capacitance of the graphene varactor over the range of DC bias voltages. The method can include comparing the formed capacitance to voltage curve with a baseline capacitance to voltage curve. The method can include distinguishing between different analytes binding to the graphene varactor. The method can further include measuring a capacitance of the graphene varactor over a range of DC bias voltages. The range of DC bias voltages can be from - 3 V to 3 V; -2.5 V to 2.5 V; -2 V to 2 V; -1.5 V to 1.5 V; -1 V to 1 V; -0.5 V to 0.5 V.
- The patient can be prompted to take a breath or gas test (where the test could be performed either in a non-clinical setting such as their home or where such a prompt could cause them to come to a clinical setting to take the test).
- A pattern including such things as sleep patterns (e.g. wearable, implant or non-contact in-home sensor), physiological data (autonomic tone measures), body weight (such as weight automatically measured by a mat in the house), activity levels (e.g. mobile device, wearable, implant or non-contact in-home sensor), etc. can be assessed, such as using an algorithm, and if the results of those factors so indicate, then the system can inform the user that they should administer or get a breath or gas test to detect early signs of heart failure decompensation. If a positive result, or data trends are beyond a normal range for the individual patient, then the system can inform the patient to seek medical care for early intervention.
- A pattern including things such as sleep patterns, autonomic tone, respiratory rate, respiratory sounds, activity levels, etc., can be used to recommend to the user that they should administer a breath test (or come to a clinic to get a breath test) to detect early signs of a COPD exacerbation or repeat exacerbation. If a positive result, or data trends beyond normal range for the individual patient, seek medical care and/or use prescribed pharmaceutical (e.g. bronchodilators, corticosteroids, etc.) for early intervention.
- Beyond, heart failure decompensation and COPD, such patterns and prompts to the patient to get a breath test can also be used for diabetes management and inflammatory bowel diseases (also including data regarding dietary intake, autonomic tone, etc. in the pattern) to detect early signs of a flare-up.
- A graphene varactor was manufactured consistent with that described in U.S.Publ. Appl. No.
2014/0145735 . - A baseline capacitance to voltage curve was established by measuring capacitance over a range of excitation voltages while flushing the sensor with nitrogen gas using an LCR meter. The DC bias voltage ranged from -0.5 V to 0.5 V. Using the same LCR meter, capacitance values over the same bias voltage range were also measured while flushing the sensor with a combination of nitrogen gas and octanol vapor. The total flow rate was 0.5 liters per minute in each experiment, octanol concentration was approximately 3.6 parts per million in nitrogen, sensors were exposed to the nitrogen gas and octanol vapor mixture for approximately 5 minutes before measurement for equilibration, the AC excitation signal had amplitude 50 mV and frequency 500 kHz.
- As shown in
FIG. 8 , it can be seen that binding of octanol caused the capacitance to voltage curve to retain the same overall shape but be shifted to the right (e.g., the minimum capacitance occurred at a higher DC bias voltage). - A graphene varactor was prepared as described in Example 1. A baseline capacitance to voltage curve was established by measuring capacitance over a range of excitation voltages using an LCR meter as described above in Example 1. The DC bias voltage ranged from -1 V to 1 V. Using the same LCR meter, capacitance values over the same bias voltage range were also measured while flushing the sensor with a combination of nitrogen gas and acetone vapor. Details were the same as descried above in Example 1, except that the acetone concentration was approximately 25,000 parts per million.
- As shown in
FIG. 9 , it can be seen that binding of acetone caused the capacitance to voltage curve to change shape in that the top portion of the curve was shifted to the right, but the bottom portion of the curve was shifted to the left. - A graphene varactor was prepared as described in Example 1. The graphene was then functionalized with pyrene-acetic acid by soaking the varactor in a 1 mM solution of pyrene acetic-acid in ethanol for 14 hours.
- A baseline capacitance to voltage curve was established by measuring capacitance over a range of excitation voltages using an LCR meter as described above in Example 1.
- The DC bias voltage ranged from -1 V to 1 V. Using the same LCR meter, capacitance values over the same bias voltage range were also measured while flushing the sensor with:
- a combination of nitrogen gas and gaseous acetone;
- a combination of nitrogen gas and gaseous octane; and
- a combination of nitrogen gas and gaseous octanol.
- As shown in
FIG. 10 , it can be seen that binding of acetone caused the capacitance to voltage curve to shift sharply to the right, with the Dirac point increasing by approximately 0.1 volts. As shown inFIG. 11 , it can be seen that binding of octane caused relatively small changes in the capacitance to voltage curve, but the shift to the right made the binding detectable. As shown inFIG. 12 , it can be seen that binding of octanol caused relatively small changes in the capacitance to voltage curve, but the shift to the right made the binding detectable. - It should be noted that, as used in this specification and the appended clauses, the singular forms "a", "an", and "the" include plural referents unless the content clearly dictates otherwise. Thus, for example, reference to a composition containing "a compound" includes a mixture of two or more compounds. It should also be noted that the term "or" is generally employed in its sense including "and/or" unless the content clearly dictates otherwise.
- It should also be noted that, as used in this specification and the appended clauses, the phrase "configured" describes a system, apparatus, or other structure that is constructed or configured to perform a particular task or adopt a particular configuration to. The phrase "configured" can be used interchangeably with other similar phrases such as arranged and configured, constructed and arranged, constructed, manufactured and arranged, and the like. "Circuitry" can include both hardwired circuitry for execution of particular operations as well as processors that are programmed to execute instructions to provide the same functionality.
- All publications and patent applications in this specification are indicative of the level of ordinary skill in the art to which this specification pertains.
Claims (15)
- A system for measuring analyte presence on a graphene varactor by evaluating capacitance across a range of DC bias voltages, comprising:- a capacitance to digital converter (CDC);- one or more graphene varactors; and- a controller circuit configured to receive an electrical signal reflecting the capacitance of the one or more graphene varactors at a plurality of DC bias voltages;wherein the CDC is in electrical communication with the one or more graphene varactors and is configured to measure the capacitance of the graphene varactor in response to an excitation signal over the range of DC bias voltages, wherein the measured capacitance across the range of DC bias voltages forms part of a pattern for a given sample; and
wherein the computing device is configured to record the measured capacitance values across the range of DC bias voltages. - The system of claim 1, further comprising a multiplexor configured to selectively provide electrical communication between the CDC and a plurality of the graphene varactors, wherein an excitation signal is preferably applied to a selected graphene varactor through the multiplexor.
- The system of any of claims 1 or 2, wherein the excitation signal comprising an alternating voltage, and/or wherein the amplitude of the excitation signal is fixed by the CDC.
- The system of claim 1, further comprising an electronic component in electrical communication with the controller circuit and the CDC, the electronic component selected from the group consisting of an I2C or an SPI.
- The system of any of claims 1-4, wherein the one or more graphene varactors comprise a functionalized graphene varactor.
- The system of any of claims 1-5, wherein the controller circuit is configured to calculate at least one parameter for the one or more graphene varactors, the at least one parameter selected from the group consisting of:- maximum slope of capacitance to voltage;- change in maximum slope of capacitance to voltage over a baseline value;- minimum slope of capacitance to voltage;- change in minimum slope of capacitance to voltage over a baseline value;- minimum capacitance;- change in minimum capacitance over a baseline value;- voltage at minimum capacitance;- change in voltage at minimum capacitance;- maximum capacitance;- change in maximum capacitance;- ratio of maximum capacitance to minimum capacitance;- response time constant; and- ratios of any of the foregoing between the graphene varactor and a second graphene varactor.
- The system of any of claims 1-6, wherein the one or more graphene varactors are in electrical communication with an independent excitation output of the CDC, and/or further comprising one or more programmable digital to analog converters (DACs) in series with the one or more graphene varactors, and/or , further comprising a switch, the CDC in electrical communication with the switch and controlling the switch to selectively provide communication with output voltages of two programmable digital to analog converters (DACs), the programmed voltage difference between the DACs determining the excitation amplitude, and the difference between the programmed average voltage of the DACs and the bias at the CDC input determining the DC bias.
- The system of any of the preceding claims 5-7 wherein the controller circuit comprises a microcontroller.
- The system of any of the preceding claims wherein the plurality of graphene varactors are grounded.
- A gas sampling device, for example a hand-held breath sampling device or a gas sampling device for use with catheters and/or endoscopy systems, for sensing gaseous analytes for example volatile organic compounds, the device comprising, or incorporated in, a system according to any of the preceding claims.
- A method for measuring analyte presence on a graphene varactor by evaluating capacitance across a range of DC bias voltages, comprising:- measuring a capacitance of the graphene varactor in response to an excitation signal over a range of DC bias voltages using a capacitance to digital converter (CDC);- evaluating the measured capacitance values across a range of DC bias voltages to identify patterns associated with the presence, absence or amount of one or more analytes.
- The method of claim 11, further comprising determining one or more aspects selected from the group consisting of:- maximum slope of capacitance to voltage;- change in maximum slope of capacitance to voltage over a baseline value;- minimum slope of capacitance to voltage;- change in minimum slope of capacitance to voltage over a baseline value;- minimum capacitance;- change in minimum capacitance over a baseline value;- voltage at minimum capacitance;- change in voltage at minimum capacitance;- maximum capacitance;- change in maximum capacitance;- ratio of maximum capacitance to minimum capacitance;- response time constant; and- ratios of any of the foregoing between two different graphene sensors; and/or further comprising forming a capacitance to voltage curve from the measured capacitance of the graphene varactor over the plurality of DC bias voltages, preferably further comprising comparing the formed capacitance to voltage curve with a baseline capacitance to voltage curve; and/or wherein the range of DC bias voltages is in the following ranges : - 3 V to 3 V; -2.5 V to 2.5 V; -2 V to 2 V; - 1.5 V to 1.5 V; - 1 V to 1 V; -0.5 V to 0.5 V.
- Use of a system according to any of the claims 1-9, for determining the presence of a chemical analyte such as a volatile organic compound, preferably for measuring the chemical analyte.
- Use of a device according to claim 10, for determining the presence of a chemical analyte such as a volatile organic compound, preferably for measuring the chemical analyte.
- Use of a system and/or a device according to any of the claims 1-9, respectively 10, in a method according to claim 11 or 12.
Priority Applications (1)
| Application Number | Priority Date | Filing Date | Title |
|---|---|---|---|
| EP20214733.6A EP3825683A1 (en) | 2017-07-18 | 2018-06-28 | System and method for analyte sensing in physiological gas samples |
Applications Claiming Priority (2)
| Application Number | Priority Date | Filing Date | Title |
|---|---|---|---|
| US201762533916P | 2017-07-18 | 2017-07-18 | |
| NL2019492A NL2019492B1 (en) | 2017-09-06 | 2017-09-06 | Systems and methods for analyte sensing in physiological gas samples |
Related Child Applications (1)
| Application Number | Title | Priority Date | Filing Date |
|---|---|---|---|
| EP20214733.6A Division EP3825683A1 (en) | 2017-07-18 | 2018-06-28 | System and method for analyte sensing in physiological gas samples |
Publications (2)
| Publication Number | Publication Date |
|---|---|
| EP3431977A1 true EP3431977A1 (en) | 2019-01-23 |
| EP3431977B1 EP3431977B1 (en) | 2020-12-23 |
Family
ID=60020565
Family Applications (2)
| Application Number | Title | Priority Date | Filing Date |
|---|---|---|---|
| EP20214733.6A Pending EP3825683A1 (en) | 2017-07-18 | 2018-06-28 | System and method for analyte sensing in physiological gas samples |
| EP18180455.0A Active EP3431977B1 (en) | 2017-07-18 | 2018-06-28 | System and method for analyte sensing in physiological gas samples |
Family Applications Before (1)
| Application Number | Title | Priority Date | Filing Date |
|---|---|---|---|
| EP20214733.6A Pending EP3825683A1 (en) | 2017-07-18 | 2018-06-28 | System and method for analyte sensing in physiological gas samples |
Country Status (5)
| Country | Link |
|---|---|
| EP (2) | EP3825683A1 (en) |
| JP (1) | JP7244227B2 (en) |
| CN (1) | CN109270130B (en) |
| ES (1) | ES2854975T3 (en) |
| NL (1) | NL2019492B1 (en) |
Cited By (13)
| Publication number | Priority date | Publication date | Assignee | Title |
|---|---|---|---|---|
| US10770182B2 (en) | 2017-05-19 | 2020-09-08 | Boston Scientific Scimed, Inc. | Systems and methods for assessing the health status of a patient |
| WO2020223208A1 (en) * | 2019-04-29 | 2020-11-05 | Regents Of The University Of Minnesota | Systems and methods for assessing and treating hemorrhage and other conditions |
| US10852264B2 (en) | 2017-07-18 | 2020-12-01 | Boston Scientific Scimed, Inc. | Systems and methods for analyte sensing in physiological gas samples |
| US11166636B2 (en) | 2018-02-20 | 2021-11-09 | Boston Scientific Scimed, Inc. | Breath sampling mask and system |
| US11172846B2 (en) | 2016-10-21 | 2021-11-16 | Boston Scientific Scimed, Inc. | Gas sampling device |
| US11191457B2 (en) | 2016-06-15 | 2021-12-07 | Boston Scientific Scimed, Inc. | Gas sampling catheters, systems and methods |
| US11262354B2 (en) | 2014-10-20 | 2022-03-01 | Boston Scientific Scimed, Inc. | Disposable sensor elements, systems, and related methods |
| US11293914B2 (en) | 2018-04-25 | 2022-04-05 | Boston Scientific Scimed, Inc. | Chemical sensors with non-covalent, electrostatic surface modification of graphene |
| US11442056B2 (en) | 2018-10-19 | 2022-09-13 | Regents Of The University Of Minnesota | Systems and methods for detecting a brain condition |
| US11662325B2 (en) | 2018-12-18 | 2023-05-30 | Regents Of The University Of Minnesota | Systems and methods for measuring kinetic response of chemical sensor elements |
| US11835435B2 (en) | 2018-11-27 | 2023-12-05 | Regents Of The University Of Minnesota | Systems and methods for detecting a health condition |
| US11923419B2 (en) | 2019-08-20 | 2024-03-05 | Regents Of The University Of Minnesota | Non-covalent modification of graphene-based chemical sensors |
| US11921096B2 (en) | 2019-09-10 | 2024-03-05 | Regents Of The University Of Minnesota | Fluid analysis system |
Families Citing this family (1)
| Publication number | Priority date | Publication date | Assignee | Title |
|---|---|---|---|---|
| WO2019164922A1 (en) * | 2018-02-20 | 2019-08-29 | Regents Of The University Of Minnesota | Chemical varactor-based sensors with non-covalent surface modification of graphene |
Citations (1)
| Publication number | Priority date | Publication date | Assignee | Title |
|---|---|---|---|---|
| EP3093653A1 (en) * | 2015-05-13 | 2016-11-16 | ams AG | Sensor circuit and method for measuring a physical or chemical quantity |
Family Cites Families (15)
| Publication number | Priority date | Publication date | Assignee | Title |
|---|---|---|---|---|
| US6170318B1 (en) * | 1995-03-27 | 2001-01-09 | California Institute Of Technology | Methods of use for sensor based fluid detection devices |
| US9034170B2 (en) * | 2007-12-12 | 2015-05-19 | University Of Florida Research Foundation, Inc. | Electric-field enhanced performance in catalysis and solid-state devices involving gases |
| JP5372398B2 (en) * | 2008-03-31 | 2013-12-18 | 理研計器株式会社 | Multi-component gas detector |
| WO2011109736A2 (en) * | 2010-03-04 | 2011-09-09 | Dorrough David M | Obscured feature detector |
| US9513244B2 (en) * | 2011-04-14 | 2016-12-06 | Regents Of The University Of Minnesota | Ultra-compact, passive, varactor-based wireless sensor using quantum capacitance effect in graphene |
| US20120306802A1 (en) * | 2011-06-06 | 2012-12-06 | Mccracken David Harold | Differential capacitance touch sensor |
| US9138169B2 (en) * | 2011-09-07 | 2015-09-22 | Monitor Mask Inc. | Oxygen facemask with capnography monitoring ports |
| US20130100067A1 (en) * | 2011-10-25 | 2013-04-25 | Christopher William Dews | System and method for determining a number and position of one or more touches on a touch screen |
| FR2987129B1 (en) * | 2012-02-21 | 2014-03-14 | Commissariat Energie Atomique | SENSORS OF NOSE OR ELECTRONIC LANGUAGE |
| US9366664B2 (en) * | 2014-05-21 | 2016-06-14 | Andas Inc. | Device for measurement of exhaled nitric oxide concentration |
| US11262354B2 (en) | 2014-10-20 | 2022-03-01 | Boston Scientific Scimed, Inc. | Disposable sensor elements, systems, and related methods |
| CN104914138A (en) * | 2015-07-03 | 2015-09-16 | 深圳市共进电子股份有限公司 | Humidity sensor, humidity sensor array and preparation method thereof |
| CN105445335A (en) * | 2015-11-17 | 2016-03-30 | 中国石油大学(华东) | Humidity sensing system for monitoring insulation state of power transformer |
| CN105527321B (en) * | 2015-12-26 | 2018-10-09 | 靳职雄 | Import and export the online test method of toxic gas benzene in rubber product |
| CN106152924A (en) * | 2016-07-02 | 2016-11-23 | 南京河海南自水电自动化有限公司 | The measurement apparatus of a kind of condenser type tensile-line instrument and measuring method |
-
2017
- 2017-09-06 NL NL2019492A patent/NL2019492B1/en not_active IP Right Cessation
-
2018
- 2018-06-28 EP EP20214733.6A patent/EP3825683A1/en active Pending
- 2018-06-28 EP EP18180455.0A patent/EP3431977B1/en active Active
- 2018-06-28 ES ES18180455T patent/ES2854975T3/en active Active
- 2018-07-17 CN CN201810782878.3A patent/CN109270130B/en active Active
- 2018-07-17 JP JP2018133996A patent/JP7244227B2/en active Active
Patent Citations (1)
| Publication number | Priority date | Publication date | Assignee | Title |
|---|---|---|---|---|
| EP3093653A1 (en) * | 2015-05-13 | 2016-11-16 | ams AG | Sensor circuit and method for measuring a physical or chemical quantity |
Non-Patent Citations (4)
| Title |
|---|
| A. OPREA ET AL: "Integrated Temperature, Humidity and Gas Sensors on Flexible Substrates for Low-Power Applications", SENSORS, 2007 IEEE, 1 January 2007 (2007-01-01), Pi, pages 158 - 161, XP055466331, ISBN: 978-1-4244-1261-7, DOI: 10.1109/ICSENS.2007.4388360 * |
| DEEN DAVID A ET AL: "Graphene-Based Quantum Capacitance Wireless Vapor Sensors", IEEE SENSORS JOURNAL, IEEE SERVICE CENTER, NEW YORK, NY, US, vol. 14, no. 5, 1 May 2014 (2014-05-01), pages 1459 - 1466, XP011543455, ISSN: 1530-437X, [retrieved on 20140318], DOI: 10.1109/JSEN.2013.2295302 * |
| EBRISH M A ET AL: "Operation of multi-finger graphene quantum capacitance varactors using planarized local bottom gate electrodes", APPLIED PHYSICS LETTERS, A I P PUBLISHING LLC, US, vol. 100, no. 14, 2 April 2012 (2012-04-02), pages 143102 - 143102, XP012155503, ISSN: 0003-6951, [retrieved on 20120402], DOI: 10.1063/1.3698394 * |
| MA RUI ET AL: "Acetone sensing using graphene quantum capacitance varactors", 2016 IEEE SENSORS, IEEE, 30 October 2016 (2016-10-30), pages 1 - 3, XP033036953, DOI: 10.1109/ICSENS.2016.7808671 * |
Cited By (15)
| Publication number | Priority date | Publication date | Assignee | Title |
|---|---|---|---|---|
| US11262354B2 (en) | 2014-10-20 | 2022-03-01 | Boston Scientific Scimed, Inc. | Disposable sensor elements, systems, and related methods |
| US11191457B2 (en) | 2016-06-15 | 2021-12-07 | Boston Scientific Scimed, Inc. | Gas sampling catheters, systems and methods |
| US11172846B2 (en) | 2016-10-21 | 2021-11-16 | Boston Scientific Scimed, Inc. | Gas sampling device |
| US10770182B2 (en) | 2017-05-19 | 2020-09-08 | Boston Scientific Scimed, Inc. | Systems and methods for assessing the health status of a patient |
| US11714058B2 (en) | 2017-07-18 | 2023-08-01 | Regents Of The University Of Minnesota | Systems and methods for analyte sensing in physiological gas samples |
| US10852264B2 (en) | 2017-07-18 | 2020-12-01 | Boston Scientific Scimed, Inc. | Systems and methods for analyte sensing in physiological gas samples |
| US11166636B2 (en) | 2018-02-20 | 2021-11-09 | Boston Scientific Scimed, Inc. | Breath sampling mask and system |
| US11293914B2 (en) | 2018-04-25 | 2022-04-05 | Boston Scientific Scimed, Inc. | Chemical sensors with non-covalent, electrostatic surface modification of graphene |
| US11867596B2 (en) | 2018-04-25 | 2024-01-09 | Regents Of The University Of Minnesota | Chemical sensors with non-covalent, electrostatic surface modification of graphene |
| US11442056B2 (en) | 2018-10-19 | 2022-09-13 | Regents Of The University Of Minnesota | Systems and methods for detecting a brain condition |
| US11835435B2 (en) | 2018-11-27 | 2023-12-05 | Regents Of The University Of Minnesota | Systems and methods for detecting a health condition |
| US11662325B2 (en) | 2018-12-18 | 2023-05-30 | Regents Of The University Of Minnesota | Systems and methods for measuring kinetic response of chemical sensor elements |
| WO2020223208A1 (en) * | 2019-04-29 | 2020-11-05 | Regents Of The University Of Minnesota | Systems and methods for assessing and treating hemorrhage and other conditions |
| US11923419B2 (en) | 2019-08-20 | 2024-03-05 | Regents Of The University Of Minnesota | Non-covalent modification of graphene-based chemical sensors |
| US11921096B2 (en) | 2019-09-10 | 2024-03-05 | Regents Of The University Of Minnesota | Fluid analysis system |
Also Published As
| Publication number | Publication date |
|---|---|
| JP2019020415A (en) | 2019-02-07 |
| ES2854975T3 (en) | 2021-09-23 |
| JP7244227B2 (en) | 2023-03-22 |
| NL2019492B1 (en) | 2019-03-14 |
| EP3431977B1 (en) | 2020-12-23 |
| CN109270130A (en) | 2019-01-25 |
| EP3825683A1 (en) | 2021-05-26 |
| CN109270130B (en) | 2023-08-29 |
Similar Documents
| Publication | Publication Date | Title |
|---|---|---|
| US11714058B2 (en) | Systems and methods for analyte sensing in physiological gas samples | |
| EP3431977B1 (en) | System and method for analyte sensing in physiological gas samples | |
| US11172846B2 (en) | Gas sampling device | |
| US11662325B2 (en) | Systems and methods for measuring kinetic response of chemical sensor elements | |
| JP5848608B2 (en) | Breath analysis system and method for diagnosis and disease management of asthma, tuberculosis and lung cancer | |
| JP5635631B2 (en) | Capacitance detection in electrochemical analysis | |
| JP2010521243A (en) | End-breathing gas estimation system and method | |
| BR112021000221A2 (en) | METHOD FOR MEASURING THE CONCENTRATION OF AN ANALYST IN BREATHING, ANALYTICAL DETECTION DEVICE IN BREATHING AND METHOD FOR PREPARING A SENSOR FOR MEASURING ANALYTICAL CONCENTRATION | |
| US20200163587A1 (en) | A lung condition monitoring device | |
| Binson et al. | Design and construction of a portable e-nose system for human exhaled breath VOC analysis | |
| Le Maout et al. | A low cost, handheld E-nose for renal diseases early diagnosis | |
| TW201621316A (en) | Method and device for measuring blood glucose level | |
| Fung et al. | Design and Benchmark Testing for Open Architecture Reconfigurable Mobile Spirometer | |
| CN117255941A (en) | System and method for sample characterization by using hysteresis effect of graphene varactor | |
| CN210863616U (en) | Exhaled gas VOCs detection device | |
| EP4323759A1 (en) | Systems utilizing graphene varactor hysteresis effects for sample characterization as well as corresponding method | |
| Cuastumal et al. | Wireless electronic smell system for the detection of diseases through the exhaled breath | |
| Pambudi et al. | Design and Development of Flow Analyzer for Peak Inspiratory Flow (PIF) and Peak Expiratory Flow (PEF) Parameters. | |
| JP7256541B2 (en) | System and method for determining calorimetric performance and requirements | |
| CN114424286A (en) | Tools and methods for assessing Spinal Muscular Atrophy (SMA) | |
| WO2023144313A1 (en) | Sensing device for predicting the risk of an copd and/or asthma attack, measurement arrangement and method for the maintenance of the sensing device | |
| CA3176990A1 (en) | Apparatus and methods for pulmonary monitoring | |
| Ogorodnik et al. | Electronic nose for identification of lung diseases | |
| CA2970201A1 (en) | Method of determining parameters of a test fluid |
Legal Events
| Date | Code | Title | Description |
|---|---|---|---|
| PUAI | Public reference made under article 153(3) epc to a published international application that has entered the european phase |
Free format text: ORIGINAL CODE: 0009012 |
|
| STAA | Information on the status of an ep patent application or granted ep patent |
Free format text: STATUS: REQUEST FOR EXAMINATION WAS MADE |
|
| 17P | Request for examination filed |
Effective date: 20180628 |
|
| AK | Designated contracting states |
Kind code of ref document: A1 Designated state(s): AL AT BE BG CH CY CZ DE DK EE ES FI FR GB GR HR HU IE IS IT LI LT LU LV MC MK MT NL NO PL PT RO RS SE SI SK SM TR |
|
| AX | Request for extension of the european patent |
Extension state: BA ME |
|
| STAA | Information on the status of an ep patent application or granted ep patent |
Free format text: STATUS: EXAMINATION IS IN PROGRESS |
|
| 17Q | First examination report despatched |
Effective date: 20190211 |
|
| GRAP | Despatch of communication of intention to grant a patent |
Free format text: ORIGINAL CODE: EPIDOSNIGR1 |
|
| STAA | Information on the status of an ep patent application or granted ep patent |
Free format text: STATUS: GRANT OF PATENT IS INTENDED |
|
| INTG | Intention to grant announced |
Effective date: 20200703 |
|
| GRAS | Grant fee paid |
Free format text: ORIGINAL CODE: EPIDOSNIGR3 |
|
| GRAA | (expected) grant |
Free format text: ORIGINAL CODE: 0009210 |
|
| STAA | Information on the status of an ep patent application or granted ep patent |
Free format text: STATUS: THE PATENT HAS BEEN GRANTED |
|
| AK | Designated contracting states |
Kind code of ref document: B1 Designated state(s): AL AT BE BG CH CY CZ DE DK EE ES FI FR GB GR HR HU IE IS IT LI LT LU LV MC MK MT NL NO PL PT RO RS SE SI SK SM TR |
|
| REG | Reference to a national code |
Ref country code: GB Ref legal event code: FG4D |
|
| REG | Reference to a national code |
Ref country code: DE Ref legal event code: R096 Ref document number: 602018011009 Country of ref document: DE |
|
| REG | Reference to a national code |
Ref country code: AT Ref legal event code: REF Ref document number: 1348210 Country of ref document: AT Kind code of ref document: T Effective date: 20210115 Ref country code: CH Ref legal event code: NV Representative=s name: VOSSIUS AND PARTNER PATENTANWAELTE RECHTSANWAE, CH |
|
| REG | Reference to a national code |
Ref country code: IE Ref legal event code: FG4D |
|
| REG | Reference to a national code |
Ref country code: NL Ref legal event code: FP |
|
| PG25 | Lapsed in a contracting state [announced via postgrant information from national office to epo] |
Ref country code: GR Free format text: LAPSE BECAUSE OF FAILURE TO SUBMIT A TRANSLATION OF THE DESCRIPTION OR TO PAY THE FEE WITHIN THE PRESCRIBED TIME-LIMIT Effective date: 20210324 Ref country code: NO Free format text: LAPSE BECAUSE OF FAILURE TO SUBMIT A TRANSLATION OF THE DESCRIPTION OR TO PAY THE FEE WITHIN THE PRESCRIBED TIME-LIMIT Effective date: 20210323 Ref country code: FI Free format text: LAPSE BECAUSE OF FAILURE TO SUBMIT A TRANSLATION OF THE DESCRIPTION OR TO PAY THE FEE WITHIN THE PRESCRIBED TIME-LIMIT Effective date: 20201223 Ref country code: RS Free format text: LAPSE BECAUSE OF FAILURE TO SUBMIT A TRANSLATION OF THE DESCRIPTION OR TO PAY THE FEE WITHIN THE PRESCRIBED TIME-LIMIT Effective date: 20201223 |
|
| REG | Reference to a national code |
Ref country code: AT Ref legal event code: MK05 Ref document number: 1348210 Country of ref document: AT Kind code of ref document: T Effective date: 20201223 |
|
| PG25 | Lapsed in a contracting state [announced via postgrant information from national office to epo] |
Ref country code: SE Free format text: LAPSE BECAUSE OF FAILURE TO SUBMIT A TRANSLATION OF THE DESCRIPTION OR TO PAY THE FEE WITHIN THE PRESCRIBED TIME-LIMIT Effective date: 20201223 Ref country code: LV Free format text: LAPSE BECAUSE OF FAILURE TO SUBMIT A TRANSLATION OF THE DESCRIPTION OR TO PAY THE FEE WITHIN THE PRESCRIBED TIME-LIMIT Effective date: 20201223 Ref country code: BG Free format text: LAPSE BECAUSE OF FAILURE TO SUBMIT A TRANSLATION OF THE DESCRIPTION OR TO PAY THE FEE WITHIN THE PRESCRIBED TIME-LIMIT Effective date: 20210323 |
|
| PG25 | Lapsed in a contracting state [announced via postgrant information from national office to epo] |
Ref country code: HR Free format text: LAPSE BECAUSE OF FAILURE TO SUBMIT A TRANSLATION OF THE DESCRIPTION OR TO PAY THE FEE WITHIN THE PRESCRIBED TIME-LIMIT Effective date: 20201223 |
|
| REG | Reference to a national code |
Ref country code: LT Ref legal event code: MG9D |
|
| PG25 | Lapsed in a contracting state [announced via postgrant information from national office to epo] |
Ref country code: SK Free format text: LAPSE BECAUSE OF FAILURE TO SUBMIT A TRANSLATION OF THE DESCRIPTION OR TO PAY THE FEE WITHIN THE PRESCRIBED TIME-LIMIT Effective date: 20201223 Ref country code: RO Free format text: LAPSE BECAUSE OF FAILURE TO SUBMIT A TRANSLATION OF THE DESCRIPTION OR TO PAY THE FEE WITHIN THE PRESCRIBED TIME-LIMIT Effective date: 20201223 Ref country code: PT Free format text: LAPSE BECAUSE OF FAILURE TO SUBMIT A TRANSLATION OF THE DESCRIPTION OR TO PAY THE FEE WITHIN THE PRESCRIBED TIME-LIMIT Effective date: 20210423 Ref country code: LT Free format text: LAPSE BECAUSE OF FAILURE TO SUBMIT A TRANSLATION OF THE DESCRIPTION OR TO PAY THE FEE WITHIN THE PRESCRIBED TIME-LIMIT Effective date: 20201223 Ref country code: EE Free format text: LAPSE BECAUSE OF FAILURE TO SUBMIT A TRANSLATION OF THE DESCRIPTION OR TO PAY THE FEE WITHIN THE PRESCRIBED TIME-LIMIT Effective date: 20201223 Ref country code: CZ Free format text: LAPSE BECAUSE OF FAILURE TO SUBMIT A TRANSLATION OF THE DESCRIPTION OR TO PAY THE FEE WITHIN THE PRESCRIBED TIME-LIMIT Effective date: 20201223 Ref country code: SM Free format text: LAPSE BECAUSE OF FAILURE TO SUBMIT A TRANSLATION OF THE DESCRIPTION OR TO PAY THE FEE WITHIN THE PRESCRIBED TIME-LIMIT Effective date: 20201223 |
|
| PG25 | Lapsed in a contracting state [announced via postgrant information from national office to epo] |
Ref country code: AT Free format text: LAPSE BECAUSE OF FAILURE TO SUBMIT A TRANSLATION OF THE DESCRIPTION OR TO PAY THE FEE WITHIN THE PRESCRIBED TIME-LIMIT Effective date: 20201223 Ref country code: PL Free format text: LAPSE BECAUSE OF FAILURE TO SUBMIT A TRANSLATION OF THE DESCRIPTION OR TO PAY THE FEE WITHIN THE PRESCRIBED TIME-LIMIT Effective date: 20201223 |
|
| REG | Reference to a national code |
Ref country code: ES Ref legal event code: FG2A Ref document number: 2854975 Country of ref document: ES Kind code of ref document: T3 Effective date: 20210923 |
|
| REG | Reference to a national code |
Ref country code: DE Ref legal event code: R097 Ref document number: 602018011009 Country of ref document: DE |
|
| PG25 | Lapsed in a contracting state [announced via postgrant information from national office to epo] |
Ref country code: IS Free format text: LAPSE BECAUSE OF FAILURE TO SUBMIT A TRANSLATION OF THE DESCRIPTION OR TO PAY THE FEE WITHIN THE PRESCRIBED TIME-LIMIT Effective date: 20210423 |
|
| PG25 | Lapsed in a contracting state [announced via postgrant information from national office to epo] |
Ref country code: AL Free format text: LAPSE BECAUSE OF FAILURE TO SUBMIT A TRANSLATION OF THE DESCRIPTION OR TO PAY THE FEE WITHIN THE PRESCRIBED TIME-LIMIT Effective date: 20201223 |
|
| PLBE | No opposition filed within time limit |
Free format text: ORIGINAL CODE: 0009261 |
|
| STAA | Information on the status of an ep patent application or granted ep patent |
Free format text: STATUS: NO OPPOSITION FILED WITHIN TIME LIMIT |
|
| PG25 | Lapsed in a contracting state [announced via postgrant information from national office to epo] |
Ref country code: DK Free format text: LAPSE BECAUSE OF FAILURE TO SUBMIT A TRANSLATION OF THE DESCRIPTION OR TO PAY THE FEE WITHIN THE PRESCRIBED TIME-LIMIT Effective date: 20201223 |
|
| 26N | No opposition filed |
Effective date: 20210924 |
|
| PG25 | Lapsed in a contracting state [announced via postgrant information from national office to epo] |
Ref country code: MC Free format text: LAPSE BECAUSE OF FAILURE TO SUBMIT A TRANSLATION OF THE DESCRIPTION OR TO PAY THE FEE WITHIN THE PRESCRIBED TIME-LIMIT Effective date: 20201223 |
|
| PG25 | Lapsed in a contracting state [announced via postgrant information from national office to epo] |
Ref country code: SI Free format text: LAPSE BECAUSE OF FAILURE TO SUBMIT A TRANSLATION OF THE DESCRIPTION OR TO PAY THE FEE WITHIN THE PRESCRIBED TIME-LIMIT Effective date: 20201223 |
|
| REG | Reference to a national code |
Ref country code: BE Ref legal event code: MM Effective date: 20210630 |
|
| PG25 | Lapsed in a contracting state [announced via postgrant information from national office to epo] |
Ref country code: LU Free format text: LAPSE BECAUSE OF NON-PAYMENT OF DUE FEES Effective date: 20210628 |
|
| PG25 | Lapsed in a contracting state [announced via postgrant information from national office to epo] |
Ref country code: IS Free format text: LAPSE BECAUSE OF FAILURE TO SUBMIT A TRANSLATION OF THE DESCRIPTION OR TO PAY THE FEE WITHIN THE PRESCRIBED TIME-LIMIT Effective date: 20210423 |
|
| PG25 | Lapsed in a contracting state [announced via postgrant information from national office to epo] |
Ref country code: BE Free format text: LAPSE BECAUSE OF NON-PAYMENT OF DUE FEES Effective date: 20210630 |
|
| PG25 | Lapsed in a contracting state [announced via postgrant information from national office to epo] |
Ref country code: CY Free format text: LAPSE BECAUSE OF FAILURE TO SUBMIT A TRANSLATION OF THE DESCRIPTION OR TO PAY THE FEE WITHIN THE PRESCRIBED TIME-LIMIT Effective date: 20201223 |
|
| P01 | Opt-out of the competence of the unified patent court (upc) registered |
Effective date: 20230529 |
|
| PG25 | Lapsed in a contracting state [announced via postgrant information from national office to epo] |
Ref country code: HU Free format text: LAPSE BECAUSE OF FAILURE TO SUBMIT A TRANSLATION OF THE DESCRIPTION OR TO PAY THE FEE WITHIN THE PRESCRIBED TIME-LIMIT; INVALID AB INITIO Effective date: 20180628 |
|
| PGFP | Annual fee paid to national office [announced via postgrant information from national office to epo] |
Ref country code: NL Payment date: 20230626 Year of fee payment: 6 Ref country code: IE Payment date: 20230627 Year of fee payment: 6 Ref country code: FR Payment date: 20230626 Year of fee payment: 6 Ref country code: DE Payment date: 20230626 Year of fee payment: 6 |
|
| PGFP | Annual fee paid to national office [announced via postgrant information from national office to epo] |
Ref country code: IT Payment date: 20230620 Year of fee payment: 6 Ref country code: GB Payment date: 20230627 Year of fee payment: 6 Ref country code: ES Payment date: 20230703 Year of fee payment: 6 Ref country code: CH Payment date: 20230702 Year of fee payment: 6 |
|
| PG25 | Lapsed in a contracting state [announced via postgrant information from national office to epo] |
Ref country code: MK Free format text: LAPSE BECAUSE OF FAILURE TO SUBMIT A TRANSLATION OF THE DESCRIPTION OR TO PAY THE FEE WITHIN THE PRESCRIBED TIME-LIMIT Effective date: 20201223 |