EP3423976B1 - Verfahren und vorrichtung zur identifizierung und quantifizierung von anomalie - Google Patents
Verfahren und vorrichtung zur identifizierung und quantifizierung von anomalie Download PDFInfo
- Publication number
- EP3423976B1 EP3423976B1 EP17759003.1A EP17759003A EP3423976B1 EP 3423976 B1 EP3423976 B1 EP 3423976B1 EP 17759003 A EP17759003 A EP 17759003A EP 3423976 B1 EP3423976 B1 EP 3423976B1
- Authority
- EP
- European Patent Office
- Prior art keywords
- abnormality
- measurements
- zone
- sample
- normality
- Prior art date
- Legal status (The legal status is an assumption and is not a legal conclusion. Google has not performed a legal analysis and makes no representation as to the accuracy of the status listed.)
- Active
Links
Images


Classifications
-
- G—PHYSICS
- G16—INFORMATION AND COMMUNICATION TECHNOLOGY [ICT] SPECIALLY ADAPTED FOR SPECIFIC APPLICATION FIELDS
- G16B—BIOINFORMATICS, i.e. INFORMATION AND COMMUNICATION TECHNOLOGY [ICT] SPECIALLY ADAPTED FOR GENETIC OR PROTEIN-RELATED DATA PROCESSING IN COMPUTATIONAL MOLECULAR BIOLOGY
- G16B45/00—ICT specially adapted for bioinformatics-related data visualisation, e.g. displaying of maps or networks
-
- G—PHYSICS
- G16—INFORMATION AND COMMUNICATION TECHNOLOGY [ICT] SPECIALLY ADAPTED FOR SPECIFIC APPLICATION FIELDS
- G16H—HEALTHCARE INFORMATICS, i.e. INFORMATION AND COMMUNICATION TECHNOLOGY [ICT] SPECIALLY ADAPTED FOR THE HANDLING OR PROCESSING OF MEDICAL OR HEALTHCARE DATA
- G16H50/00—ICT specially adapted for medical diagnosis, medical simulation or medical data mining; ICT specially adapted for detecting, monitoring or modelling epidemics or pandemics
- G16H50/70—ICT specially adapted for medical diagnosis, medical simulation or medical data mining; ICT specially adapted for detecting, monitoring or modelling epidemics or pandemics for mining of medical data, e.g. analysing previous cases of other patients
-
- G—PHYSICS
- G06—COMPUTING OR CALCULATING; COUNTING
- G06T—IMAGE DATA PROCESSING OR GENERATION, IN GENERAL
- G06T7/00—Image analysis
- G06T7/0002—Inspection of images, e.g. flaw detection
- G06T7/0012—Biomedical image inspection
-
- G—PHYSICS
- G16—INFORMATION AND COMMUNICATION TECHNOLOGY [ICT] SPECIALLY ADAPTED FOR SPECIFIC APPLICATION FIELDS
- G16B—BIOINFORMATICS, i.e. INFORMATION AND COMMUNICATION TECHNOLOGY [ICT] SPECIALLY ADAPTED FOR GENETIC OR PROTEIN-RELATED DATA PROCESSING IN COMPUTATIONAL MOLECULAR BIOLOGY
- G16B20/00—ICT specially adapted for functional genomics or proteomics, e.g. genotype-phenotype associations
-
- G—PHYSICS
- G16—INFORMATION AND COMMUNICATION TECHNOLOGY [ICT] SPECIALLY ADAPTED FOR SPECIFIC APPLICATION FIELDS
- G16B—BIOINFORMATICS, i.e. INFORMATION AND COMMUNICATION TECHNOLOGY [ICT] SPECIALLY ADAPTED FOR GENETIC OR PROTEIN-RELATED DATA PROCESSING IN COMPUTATIONAL MOLECULAR BIOLOGY
- G16B40/00—ICT specially adapted for biostatistics; ICT specially adapted for bioinformatics-related machine learning or data mining, e.g. knowledge discovery or pattern finding
-
- G—PHYSICS
- G16—INFORMATION AND COMMUNICATION TECHNOLOGY [ICT] SPECIALLY ADAPTED FOR SPECIFIC APPLICATION FIELDS
- G16H—HEALTHCARE INFORMATICS, i.e. INFORMATION AND COMMUNICATION TECHNOLOGY [ICT] SPECIALLY ADAPTED FOR THE HANDLING OR PROCESSING OF MEDICAL OR HEALTHCARE DATA
- G16H10/00—ICT specially adapted for the handling or processing of patient-related medical or healthcare data
- G16H10/40—ICT specially adapted for the handling or processing of patient-related medical or healthcare data for data related to laboratory analysis, e.g. patient specimen analysis
-
- G—PHYSICS
- G16—INFORMATION AND COMMUNICATION TECHNOLOGY [ICT] SPECIALLY ADAPTED FOR SPECIFIC APPLICATION FIELDS
- G16H—HEALTHCARE INFORMATICS, i.e. INFORMATION AND COMMUNICATION TECHNOLOGY [ICT] SPECIALLY ADAPTED FOR THE HANDLING OR PROCESSING OF MEDICAL OR HEALTHCARE DATA
- G16H30/00—ICT specially adapted for the handling or processing of medical images
- G16H30/20—ICT specially adapted for the handling or processing of medical images for handling medical images, e.g. DICOM, HL7 or PACS
-
- G—PHYSICS
- G16—INFORMATION AND COMMUNICATION TECHNOLOGY [ICT] SPECIALLY ADAPTED FOR SPECIFIC APPLICATION FIELDS
- G16H—HEALTHCARE INFORMATICS, i.e. INFORMATION AND COMMUNICATION TECHNOLOGY [ICT] SPECIALLY ADAPTED FOR THE HANDLING OR PROCESSING OF MEDICAL OR HEALTHCARE DATA
- G16H30/00—ICT specially adapted for the handling or processing of medical images
- G16H30/40—ICT specially adapted for the handling or processing of medical images for processing medical images, e.g. editing
-
- G—PHYSICS
- G16—INFORMATION AND COMMUNICATION TECHNOLOGY [ICT] SPECIALLY ADAPTED FOR SPECIFIC APPLICATION FIELDS
- G16H—HEALTHCARE INFORMATICS, i.e. INFORMATION AND COMMUNICATION TECHNOLOGY [ICT] SPECIALLY ADAPTED FOR THE HANDLING OR PROCESSING OF MEDICAL OR HEALTHCARE DATA
- G16H50/00—ICT specially adapted for medical diagnosis, medical simulation or medical data mining; ICT specially adapted for detecting, monitoring or modelling epidemics or pandemics
- G16H50/20—ICT specially adapted for medical diagnosis, medical simulation or medical data mining; ICT specially adapted for detecting, monitoring or modelling epidemics or pandemics for computer-aided diagnosis, e.g. based on medical expert systems
-
- G—PHYSICS
- G06—COMPUTING OR CALCULATING; COUNTING
- G06T—IMAGE DATA PROCESSING OR GENERATION, IN GENERAL
- G06T2207/00—Indexing scheme for image analysis or image enhancement
- G06T2207/10—Image acquisition modality
- G06T2207/10072—Tomographic images
-
- G—PHYSICS
- G06—COMPUTING OR CALCULATING; COUNTING
- G06T—IMAGE DATA PROCESSING OR GENERATION, IN GENERAL
- G06T2207/00—Indexing scheme for image analysis or image enhancement
- G06T2207/30—Subject of image; Context of image processing
- G06T2207/30004—Biomedical image processing
- G06T2207/30008—Bone
Definitions
- the present invention relates to a method and apparatus for identifying and quantifying abnormality, such as between two or more co-measurements, and is of particular but by no means exclusive application in the analysis of biological samples such as bone.
- the invention also relates to a method and system for building an abnormality quantifier, such as using two or more co-measurements, also of particular but by no means exclusive application in the analysis of biological samples.
- a normal sample group In many fields, it is necessary to characterize and identify the distinction between a normal sample group and an abnormal, such as to determine whether any particular individual member of that group (e.g. a person, product, geophysical reading, etc) is abnormal. This typically involves, first, measuring the sample using a suitable device, then analysing the measurement results, typically using statistical methods, to determine whether it is abnormal.
- defining a reference range or reference interval of physiologic measurement in healthy persons is commonly required. This is relevant to the interpretation of test or other results as a frame of reference for a particular subject. For example, subjects within the reference range may be regarded as normal and those outside the reference range as abnormal (e.g. as diseased). That is, the reference range-in this example-is defined by a parameter with upper and lower limits delineating what is regarded as normal, with abnormal being indicated by values above or below, respectively, these upper and lower limits.
- the reference range that characterizes normality may be defined by two values between which 95% of the presumed reference group fall; it is assumed that 2.5% of normal subjects-though indeed normal-will have values of the reference parameter that overlaps with the range of abnormal individuals, such that 2.5% of normal subjects will have a value of this parameter below the lower limit of the normal interval. Likewise, 2.5% of the normal subjects will have a value of this parameter higher than the upper limit.
- normal and abnormal are defined as the number of standard deviations above or below the mean value of the 'normal' reference population. This may be applied in bone medicine. In the case of osteoporosis or fragile bone, abnormal is defined as having a bone mineral density less than -2.5 Standard Deviation below the mean value of a young normal healthy population.
- LDL low-density lipoprotein
- cancer antigen 19-9 is generally regarded as having no clinical significance if below what is usual in the normal population; BMD (in the field bone), if above a certain value, is automatically considered normal. Therefore, such markers are often provided with only one limit of the reference range stated.
- values of a given parameter either above a specified percentile (e.g., 5th percentile) or below a specified percentile (e.g., 95th percentile) are considered indicative of abnormality; subjects with values between these percentiles are considered normal.
- This 'two-sided' definition is used, for example, to define normal blood pressure, normal tissue mineralization, and normal height.
- 'normal' corresponds-for example-to a systolic blood pressure of between 120 and 80 mm Hg; in the case of tissue mineralization, ⁇ normal' corresponds to mineralization values (ash fraction) between 62% and 68%.
- a height of 160 m may be within a normal range (that is, within the upper and lower limit of normality) for an individual of 70 kg, but abnormal for an individual of 120 kg.
- Age is intrinsically linked to BMD, as is porosity to tissue mineral density.
- lower and upper values of the references range may not fully distinguish normal from abnormal.
- a value may still fall within the upper and lower values but yet be abnormal because some other determinant of the value makes it abnormal but these other determinants of the measurement of interest are not considered.
- existing techniques may not-in some case-reliably facilitate the identification of the disease, its causes, pathogenesis, a physiological manifestation, or the effects of influential factors (such as a treatment) that may cause a sample or a subject to be more or less normal, or move from a normal state to an abnormal state or vice versa.
- Chandola et al. discuss, in Anomaly detection: A Survey (ACM Computing Surveys, 41(3) (2009) pp.1-58 ), different types of anomaly, and various classification based anomaly detection techniques, nearest neighbour-based anomaly detection techniques and clustering-based anomaly detection techniques.
- WO 2011/029153 (“Method And System for Image Analysis of Selected Tissue Structures”) discloses a method for analysing a sample comprising first and second materials of different densities, including defining a region of interest in a cross sectional image of at least a portion of the sample that includes a junction between the materials, determining a density profile of the sample within the region of interest and crossing the junction, determining a representative density of the second material, and analysing the sample using the junction.
- U.S. Patent Application Publication No. 2016/042287 discloses a method for detecting anomalies using sample-based rule identification.
- Data for data analytics is maintained in a database and a set of anomaly rules is defined.
- a rare pattern in the data is statistically identified.
- the rare pattern is labelled as anomaly and/or non-anomaly based on verification by a domain expert.
- the set of anomaly rules is adjusted based on the labelled anomaly, and other anomalies in the data are detected and classified by applying the adjusted set of anomaly rules to the data.
- a computer-implemented method of building an abnormality quantifier configured to identify and quantify the extent of abnormality in one or more measurements of subjects or members of a cohort, the abnormality being bone abnormality or obesity, the method comprising:
- the method comprises obtaining the measurements of the normal population or sample by measuring one or more normal samples or subjects, and obtaining the measurements of the abnormal population or sample by measuring one or more abnormal samples or subjects.
- the comparison of the normality zone and the abnormality zone may be based on representative points of the respective zones, such as the midpoint of the normality zone and the maximum abnormal point (or ⁇ MAP') of the abnormality zone.
- representative points of the respective zones such as the midpoint of the normality zone and the maximum abnormal point (or ⁇ MAP') of the abnormality zone.
- Measuring the sample or population may comprise acquiring images using computed tomography (CT), magnetic resonance imaging (MRI) or other imaging device, and processing the images using an image processing technique, such as the one disclosed in WO 2011/029153 or any other image processing device.
- CT computed tomography
- MRI magnetic resonance imaging
- image processing technique such as the one disclosed in WO 2011/029153 or any other image processing device.
- Measuring the sample may comprise processing previously acquired images using an image processing technique such as the one disclosed in WO 2011/029153 or any other image processing device.
- Measuring the sample may comprise analysing a biological sample using an analysis technique, such as an assay. Measuring the sample may comprise obtaining measurements using a measurement instrument. Measuring the sample may comprise analysing a biological sample using an analysis technique comprising an assay.
- an analysis technique such as an assay.
- Measuring the sample may comprise obtaining measurements using a measurement instrument.
- Measuring the sample may comprise analysing a biological sample using an analysis technique comprising an assay.
- Measuring the sample may comprise obtaining measurements using a measurement instrument comprising an assay measuring instrument.
- the measurement device is an imaging device.
- the measurement device may be configured to output a plurality of different sets of bone parameters.
- the bone abnormality is fracture-vulnerability.
- the fracture-vulnerability may be due to structural abnormality comprising a reduced amount of bone.
- the method further comprises estimating a timeframe (e.g. 2 years) in which a fracture may occur from an amount of bone reduction.
- the method further comprises recategorizing a subject that has previously been categorized (such as by BMD) by adjusting the definition of abnormality (such as abnormality threshold).
- a previous categorization by BMD may be, for example, osteopenia or normal BMD.
- Such subjects may be 70 years of age or older.
- the abnormality may be age dependent.
- the fracture vulnerability is due to brittleness.
- the method further comprises determining a type of fracture-vulnerability including distinguishing fracture-vulnerability due to reduced amount of bone from fracture-vulnerability due to bone brittleness.
- the method may further comprise applying a treatment according to the type of fracture-vulnerability, or changing a treatment based on the type of fracture-vulnerability (where changing the treatment may comprise ceasing an existing treatment and commencing a new treatment, or modifying 20 an existing treatment).
- the treatment may be a romosuzumab, abaloparatide, teriparatide or other anabolic therapy, or a Denosumab, Alendronate or other antiresorptive therapy.
- the method may comprise identifying one or more abnormalities in one or more measurements of the sample.
- the method may comprise applying, a treatment based on the one or more abnormalities.
- the method may comprise designing a treatment based on the one or more abnormalities.
- the method may comprise modifying a treatment based on the one or more abnormalities.
- the one or more abnormalities may be in a bone.
- the one or more abnormalities may comprise fracture-vulnerable bone.
- the treatment may comprise an anabolic therapy or other bone active intervention.
- an apparatus configured to build an abnormality quantifier for identifying and quantifying the extent of abnormality in one or more measurements of subjects or members of a cohort, the abnormality being bone abnormality or obesity, the system comprising:
- a computer-implemented method for identifying abnormality in one or more measurements of subjects or members of a cohort, the abnormality being bone abnormality or obesity comprising: receiving or accessing a definition of abnormality generated by an abnormality quantifier built according to a method comprising:
- Determining a definition of abnormality may include defining normality.
- the measurements may comprise two- or more dimensional ordered pairs of co-measurements (of either co-dependent or non co-dependent parameters).
- an apparatus for identifying abnormality in one or more measurements of subjects or members of a cohort, the abnormality being bone abnormality or obesity comprising:
- a computer-implemented method for building a software device that can be used to define and quantifying abnormality of a measurement.
- the device can also (such as in a default mode) define and quantify the extent of abnormality of a measurement.
- the method of this aspect comprises: receiving or accessing at least one first dataset comprising measurements of a normal population or sample and at least one second dataset comprising measurements of an abnormal population or sample; generating or map by imagizing the datasets (such as by imagizing the dataset comprises converting geometric virtual coordinates representative of a dataset into an image resulting in a cloud of points representative of normal or abnormal subjects); identifying a normality zone within the map using the first dataset; identifying an abnormality zone within the image using the second dataset; determining a definition of abnormality based on a comparison of the normality zone and the abnormality zone; and outputting a software device adapted to define and quantify the extent of abnormality of measurements in one or more other datasets.
- the measurements of the normal population or sample and the measurements of the abnormal population comprise co- measurements.
- the method comprises obtaining the measurements of the normal population or sample by measuring one or more normal samples or subjects, and obtaining the measurements of the abnormal population or sample by measuring one or more abnormal samples or subjects.
- the device may be in the form of a discrete software application (e.g. downloadable to a computing device), a software program, a webpage, or any calculator.
- the device once self-trained, can also be used to define and quantify the extent of abnormalities in other datasets.
- the device or abnormality quantifier may be in the form of a computing device, or a discrete software application (e.g. downloadable to a computing device), a software program, a webpage, or any calculator; in a form of an imaging device such as a computed tomography (CT), a magnetic resonance machine (MRI), a blood test device such as a coulter count, a urine or saliva analysis device or an ultrasound.
- CT computed tomography
- MRI magnetic resonance machine
- a blood test device such as a coulter count
- urine or saliva analysis device or an ultrasound can also be used to define and quantify the extent of abnormalities in other datasets.
- the method may include binarizing the imagized dataset using an image binarizer before identifying the zones.
- determining the normality zone comprises segmenting the spatial zone corresponding to the imagized normal dataset (using any suitable spatial segmentation technique).
- the abnormality zone comprises segmenting the spatial zone corresponding to the imagized abnormal dataset (using any suitable spatial segmentation technique).
- the method comprises segmenting the normality and abnormality zones using a threshold based segmentation method or an edge detection segmentation method.
- the method comprises segmenting the normality and abnormality zones using density-based spatial clustering of applications with noise (DBSCAN).
- the method comprises segmenting the normality or abnormality zones using a density profile analysis, such as that disclosed in international patent application publication no. WO 2011/029153 .
- points corresponding to the zone are treated as a first material and points not occupied are treated as a second material.
- the method then comprises segmenting the normality zone using an approach comparable to that disclosed in WO 2011/029153 . This comprises
- the method may comprise defining and quantifying the extent of normality by a normality definer.
- the method may comprise defining and quantifying the extent of abnormality by an abnormality definer.
- the normality definer defines normality using the spatial characteristics of the normal zone, such as the external edges and the most central point in the zone.
- the central point is the most representative of normality, defined by any suitable criterion; in this embodiment, it may be the centroid, a geometric center, or a point with coordinates being the average values of both the measurement and the co-measurement.
- the choice of the most central value highlight the intent to capture the most normal value in the normality zone (most normal point).
- abnormality definer defines abnormality using the spatial characteristics of the abnormal zone such as its shape in relation to that of the normal zone.
- an abnormality definer defines abnormality using a linear exit vector with an origin being the most normal point as determined by a normality definer and a direction being that of the sum of the vectors extending from the most normal point to the respective points in the abnormal zone corresponding to the abnormal dataset (which may or may not be in a zone overlapping with the normal zone).
- an abnormality definer may define and quantify abnormality using a path rather than a linear exit vector.
- a path may be defined as a series of consecutive vectors the first originating in any point in the normal zone, and the end of the vector being points in the nearest sub-zone of the abnormal zone and corresponding to the abnormal dataset (they may or may not be in a zone overlapping with the normal zone).
- the subsequent vector has its origin where the first vector ended and ends in the near sub-zone in the abnormality until all sub-zones of the abnormality zone have been covered.
- the invention provides a method in which abnormality is defined according to a spatial position-which may be expressed as an angular direction (from 0 to 360°, for example) about a centre of normality-of the abnormal points or of the main concentration of the abnormal points. That is, points of the abnormal dataset, which should be predominantly outside the normality zone, may be spatially positioned at any angle in a frame of reference with an origin at the most central point of normality and coordinates similar to those of the centre of normality or most normal point.
- the abnormal points may be predominantly at and around -45°; in other conditions of abnormality they may be around +45° or -90° or otherwise.
- the exit vector described above identifies or coincides with this direction of abnormality.
- This spatial direction of abnormality may thus be identified using, for example, the shape of the abnormality zone, an exit vector, or an exit path starting in the normality zone (such as at the most normal point).
- the normality identifier e.g., mid point or centroid
- a method in which the magnitude of abnormality is quantified by the abnormality quantifier is as a function of their spatial position relative to the identified maximum abnormality. This may be in a square area, a rectangular area, a triangular area or an elliptical area near the maximum disease point.
- abnormality is quantified as a distance from the identified maximum abnormality.
- the method comprises treating abnormality as a weighted distance from a maximum abnormality.
- the method comprises quantifying abnormality as a weighted distance from maximum abnormality and deviation from the exit path or exit path.
- the method may comprise optimizing the results of abnormality identifier by testing the performance of the identified abnormal values.
- the method may comprise controlling the normality identifier to modify characteristics used to identify normality (e.g., most normal point, edges, etc) and/or controlling the abnormality definer to modify characteristics used to identify abnormalities (e.g. shape, linear vector, exit path, etc).
- characteristics used to identify normality e.g., most normal point, edges, etc
- controlling the abnormality definer to modify characteristics used to identify abnormalities (e.g. shape, linear vector, exit path, etc).
- the method may comprise re-testing performance of the characterization of abnormality determined according to this method in identifying abnormal values until suitable performance has been reached.
- the suitable performance may be a preset value.
- the method may comprise the abnormality definer defining abnormality in another set of two or more co-measurements.
- Merging the results between two or more optimized results may include defining as abnormal a subject that has a measurement appearing to be abnormal in at least one matrix (representing a co-measurement), represented by two or more imagized datasets, or defining as abnormal a subject that has a measurement appearing to be abnormal in most matrices (representing a co-measurement), represented by two or more imagized datasets.
- the abnormality quantifier builder may be set so that all normal co-measurements occupy a predefined scale (e.g., 0 to 100).
- the maximum abnormal (or disease point) is set as 0 regardless of the abnormality.
- the abnormality quantifier builder then outputs an 'abnormality quantifier'.
- this abnormality quantifier is embodied as software.
- the abnormality quantifier is embodied as a discrete software application, is provided via a webpage that quantifies specific abnormality, or any other calculator.
- the abnormality quantifier is set output define and quantify the extent of abnormality for the measurement it has self-trained itself.
- the invention provides apparatuses configured to implement any of the methods described above.
- the invention provides an apparatus for identifying abnormality in one or more measurements (such as of subjects or members of a cohort), the apparatus comprising: a processor; a memory; a data imagizer configured to generate an image or map by imagizing at least a first and a second dataset (such as by imagizing the datasets comprises converting geometric virtual coordinates representative of a dataset into an image resulting in a cloud of points representative of normal or abnormal subjects); a zone identifier configured to identify a normality zone within the image using the first dataset and identify an abnormality zone within the image using the second dataset; an abnormality definer configured to determine a definition of abnormality based on a comparison of the normality zone and the abnormality zone; and an outputter for outputting at least one result.
- the first and a second datasets comprise co-measurements. Imagizing the first and second datasets may comprise converting geometric virtual coordinates representative of a dataset into an image resulting in a cloud of points representative of normal or abnormal subjects.
- the apparatus may include a normality definer configured to determine a definition of normality.
- the apparatus may include a binarizer.
- the invention provides executable instructions or software (such as embodied in a computer readable medium, for example with the executable instructions or software imbedded or permanently stored therein), that, when executed by a computing device or processor of a computing device, cause the computer or processor to perform any of the methods of the above aspects.
- the result of the analysing step would generally be outputted so that it can be used to define normal versus abnormal, but may be outputted to a memory or memory medium for later used.
- the invention provides a computing device provided with executable instructions or software that, when executed by the computing device or by a processor of the computing device, cause the computing device or processor of the computing device to perform any of the methods of the above aspects.
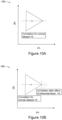
- An abnormality quantifier builder 4 operates as shown schematically at 2 in figure 1A , while figure 1 B is a more detailed schematic representation 6 of the operation of abnormality quantifier builder 4 in building an abnormality quantifier.
- samples sets A, B, C, ... , N are uploaded into abnormality quantifier builder 4, which then builds an abnormality identifier for those sample sets.
- the outputted abnormality quantifier is designed to quantify abnormalities in one or more sample sets.
- Sample Set A may relate, for example, to an individual, an anatomical part of the individual such as a bone, heart, brain, kidney, or a biological sample such as saliva, blood or urine.
- the sample may also be a non-biological material such as a rock.
- the sample set may also be comprise an image or images of any of the aforementioned materials.
- Abnormality quantifier builder 4 divides the sample set into two populations: a first population of normal samples ('sample set A1') and a second population of abnormal samples ('sample set A2'). Sample set A1 is free of abnormality, but sample set A2 may have many types of abnormalities. Abnormality quantifier builder 4 builds an abnormality quantifier that can quantify the specific abnormality existing in sample set A.
- Controller 8 of abnormality quantifier builder 4 controls a measuring device 12 of abnormality quantifier builder 4 to output selected set(s) of measurement results for both normal and abnormal samples sets A1, A2. These measurement results sets are selected based on the likely ability to distinguish normal versus abnormal for a specified abnormality.
- the set of measurement results may be of cortical bone porosity and trabecular bone density if the abnormality is fracture-vulnerable bone, or height and weight if the abnormality is obesity.
- Abnormality quantifier builder 4 may also be preset to build the abnormality quantifier for one or more specific sample(s) and for specific abnormalities in that or those samples. In that case, abnormality quantifier builder 4 automatically recognises the sample set and performs the specific desired measurements without the input of controller 8.
- controller 8 may upload the measurement results into abnormality identifier 13 if the measurement results were performed by a measuring device other than measuring device 12 of abnormality quantifier builder 4.
- Abnormality identifier 13 then processes the sets of normal and abnormal measurements, and defines the abnormality.
- abnormality quantifier builder 4 requests a third population of samples (sample set A3).
- Sample set A3 is the testing population. It contains both known normal and abnormal examples of the type of sample set A.
- Measuring device 12 measures and provide the preselected measurements likely to distinguish normal and abnormal samples to the built abnormality quantifier.
- the abnormality quantifier tests and modifies its own performance. If the desired performance cannot be reached, then abnormality quantifier builder 4 outputs to controller 8 that an acceptable abnormality quantifier could not be built for the sample set and abnormality, at the desired performance level. If the desired performance is reached then abnormality quantifier builder 4 outputs the abnormality quantifier for sample set A and the specific abnormality.
- FIG. 3A is a schematic view of measuring device 12.
- Measuring device 12 includes an image acquisition device 15, an image processor 16, a biological sample analyzer 17, one or more other measuring instruments 18, and controlling software 19.
- a system for identifying and quantifying abnormality (which may be referred to as an abnormality identifier), built by abnormality quantifier builder 4, according to an embodiment of the present invention, is shown schematically at 20 in figure 3A , shown with a data source 21.
- System 20 includes a data input 22 and an image processor 23.
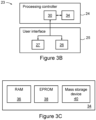
- Image processor 23 includes a processing controller 24; processing controller 24 includes several components, which are described below.
- Image processor 23 also includes a user interface 25.
- User interface 25 comprises, in this example, a display 26 and a keyboard 27, but it will be appreciated that other known user interfaces or combinations thereof may be employed, including a computer mouse, a touch screen, a scanner, a printer and another computing device.
- the data source 21 may comprise, for example, a data collection/creation device (such as CT scanner with data analysis capacity), a database, computer readable data medium, a computing device with user interface, or a network connection to any of these.
- a data collection/creation device such as CT scanner with data analysis capacity
- FIGS 3B and 3C are more detailed schematic view of components of system 10.
- processing controller 24 includes a processor 30 and a memory 34 in data communication with each other.
- memory 34 includes RAM 36, EPROM 38 and a mass storage device 40.
- An instruction set may be stored in mass storage device 40 and, when required, loaded into RAM 36 for execution by processor 30. The instruction set is adapted to control system 10 to perform the steps of the method of this embodiment, as described below.
- Data input 22 is adapted to receive datasets from data source 21.
- datasets include, as is described in greater detail below, one or more datasets of normal values (that is, data correspond to a cohort or cohorts of normal subjects) and one or more datasets of abnormal values (that is, data correspond to a cohort or cohorts of abnormal subjects).
- Each dataset comprises, in this example, two-dimensional data points, that is, comprising ordered pairs of values. These values relate to respective physical characteristics of the subjects. It will be appreciated that data of other dimensionality (whether one-, three- or higher) may be employed, each comprising one, three or more values respectively that relate to respective characteristics of the subjects.
- the first value may be referred to as "the measurement” and second value as the “co-measurement”, or the first may be referred to as “measure A” and the second as “measurement B”.
- a dataset comprised values for the measurement of the height and weight such as when the abnormality is obesity
- This terminology is not intended to suggest, however, that there is necessarily a correlation between the measurement and the co-measurement (or measurements A and B).
- the term "co-measurement” refers to a set of ordered pairs (or triplets, etc) of measurements, but this will be apparent from the context.
- abnormality quantifier builder (see figure 5 ) which builds an abnormality quantifier, which is outputted in a form a webpage, a discrete software application, software, or any form of calculator.
- the abnormality quantifier may also output results as quantified measured of abnormality rather than an abnormality quantifier device.
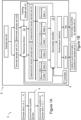
- FIG. 4 is a schematic view of processing controller 24 of image processor 23, together with user interface 25.
- Processing controller 24 includes processor 30 and memory 34.
- Processor 30 includes a data imagizer 48, a binarizer 50, a zone identifier 52, a normality definer 54, an abnormality definer 56, a performance tester 58, a results optimizer 60, an outputter 62, an output merger 64 and a final outputter 66.
- abnormality quantifier builder 68 is also configured to build a software device based on exemplary datasets known to be derived from, respectively, normal and abnormal populations, such that abnormality quantifier builder 68 can then be used with future datasets derived from like populations and determine which points in the future datasets are 'normal' and which are 'abnormal.'
- Memory 34 includes the aforementioned instruction set 70, datasets storage 72 of datasets 1, 2, ... , n (for storing respective datasets), image storage 74 (for storing images generated by data imagizer), suboutputs storage 76 (for storing suboutputs 1, 2, ... , n), and results storage 78.
- Data imagizer 48 is adapted to transform the normal and abnormal values into an image or map (which, in this context may be regarded as synonymous). This process may be referred to as imagization of the datasets. Data imagizer 48 can then control system 10 to output the resulting image or map (see, for example, those illustrated in figures 7A to 7D and 8 ), such as to display 26 for inspection by a user, but it should be appreciated that it is not essential that the image or map be outputted.
- the process of imagization by data imagizer 48 may optionally involve binarization.
- Binarization aims to facilitate image processing (including the identification of zones within the image) with minimal deleterious effect on accuracy. Any suitable binarization technique may be employed.
- the image once binarized, is processed to identify normal and abnormal the zones as follows. All points in the normal and abnormal sets of data are respectively given the same value resulting in an image where points belonging to the proposed population (normal or abnormal) are foreground and those not belonging to any dataset are background.
- zone identifier 52 processes the images (i.e. imagized dataset) to identify the normal and abnormal zones corresponding respectively to the zone produced by the dataset of normal data and the zone produced by the dataset of abnormal data.
- zone identifier 52 it should be noted that the image does not need to be viewed in order for zone identifier 52 to identify normality and abnormality zones of the image.
- zone identifier 52 uses the 'density-based spatial clustering of applications with noise' (DBSCAN) technique. This technique groups together points that are closely packed, marking points that lie alone in low-density regions as outliers.
- DBSCAN noise'
- the algorithm classifies a set of points into three types: core points, density reachable points and outliers, as follows:
- zone identifier 52 uses the image processing technique disclosed in WO 2011/029153 .
- This technique includes:
- normality definer 54 and abnormality definer 56 define normality and abnormality, and abnormality definer 56 quantifies the extent of abnormality.
- normality definer 54 defines normality using the spatial geometry of the segmented normal zone.
- normality definer 54 may do so in terms of the external edge or the most central point in the normality zone.
- the most central point may be the centroid, or a point with coordinates that are the average values of both the measurement and the co-measurement.
- Abnormality quantifier builder 68 chooses the most central point to ensure that it captures the most normal value in the normality zone (i.e. the 'most normal point').
- abnormality definer 56 uses the defined values of normality and the characteristics of the abnormality zone to define abnormality.
- the characteristics of the abnormality zone used to define abnormality may comprise the shape, in particular the shape in relation to that of the normality zone.
- abnormality definer 56 employs the exit vector defined as the direction of abnormality (e.g., "-45°", such as is approximately the case in-for instance- figure 7A ) as the abnormality quantifier.
- the shape of the abnormality zone and its orientation relative to those characteristics of the normality zone may be used to define abnormality.
- the spatial orientation of the abnormality zone may be used to define abnormality because points exiting the normality zone may exit at any point of the perimeter of the normality zone.
- abnormality definer 56 may ascertain that the abnormality zone has a generally elliptical shape or may fairly be characterized with an ellipse, so the major axis of the ellipse originating from the normal zone's most normal (viz. representative) point may be used to characterize the abnormality zone's spatial orientation.
- Abnormality definer 56 may ascertain that the abnormality zone has other shapes, but in each case that shape and its orientation can serve to characterize the abnormality zone and its spatial orientation.
- abnormality definer 56 defines abnormality using a linear exit vector with an origin being the most normal point as determined by normality definer 54 and a direction being that of the sum of the vectors extending from the most normal point to the respective points in the abnormal zone corresponding to the abnormal dataset (which may or may not be in a zone overlapping with the normal zone).
- abnormality definer 56 may define and quantify abnormality using a path rather than a linear exit vector.
- a path may be defined as a series of consecutive vectors the first originating in any point in the normal zone, and the end of the vector being points in the nearest sub-zone of the abnormal zone and corresponding to the abnormal dataset (they may or may not be in a zone overlapping with the normal zone).
- the subsequent vector has its origin where the first vector ended and ends in the near sub-zone in the abnormality until all sub-zones of the abnormality zone have been covered.
- Abnormality definer 56 may define abnormality by other techniques as desired, but regardless of the method employed by abnormality definer 56 to define abnormality, abnormality definer 56 then uses the direction of abnormality to find the point maximum abnormality.
- maximum abnormality is defined as the point furthest away from the normal point as identified by normality identifier 54 in the direction that was defined as the direction of abnormality by the abnormality definer 56.
- the normality point may be a point corresponding to the average values of both co-measurements.
- abnormality definer 56 quantifies the magnitude of abnormality as a function of spatial position relative to the identified maximum abnormality. This may be a square area, rectangular area, triangular area, or elliptical area near the maximum abnormality point.
- abnormality definer 56 may quantify abnormality as a distance from the identified maximum abnormality. In still another embodiment, abnormality definer 56 may quantify abnormality as a weighted distance from maximum abnormality, or as a weighted distance from maximum abnormality and deviation of the exit vector or exit path. For example, there is an exit vector (say, -45°), the further away an exit point is from this optimal exit angle, the less likely it is to be abnormal.
- results optimizer 60 optimizes the results of abnormality identifier 56 by testing the performance of the identified abnormal values.
- Abnormality identifier 56 provides the results to results optimizer 60, which then determines if the results are acceptable or not.
- a preset value of the minimal acceptable performance of abnormality identifier 56 may be employed.
- the preset value may be 70%, meaning that abnormality identifier 56 must be found to correctly identify as abnormal 70% of abnormal points to be deemed to satisfactory.
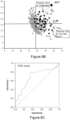
- results optimizer 60 tests the performance of the results. This may be done using any suitable test of performance of the output of a measurement, such as receiver operating characteristic (ROC), or ROC curve, an odd ratio or any other form of performance evaluation test.
- ROC receiver operating characteristic
- Abnormality quantifier builder 68 may have a preset performance threshold. If this has been reached then, abnormality quantifier builder 68 can be controlled to output a device ready to define abnormality between the measurements and co-measurements.
- results optimizer 60 may improve the results by controlling the normality definer 54 to modify the characteristics used to identify normality (e.g., most normal point, edges, etc) and/or control abnormality definer 56 to modify the characteristics used to identify abnormalities (e.g., shape, linear vector, exit path, etc).
- performance tester 58 again tests the performance of abnormality definer 56. This may include testing against a preset normality value. The process may be repeated a predetermined number of times (e.g. 10 times). When all the possible preset options (e.g., shapes ranging from circle to an ellipse with minor-axis ⁇ 0) have been examined, results optimizer 60 provides the results of the co-measurements to outputter 62.
- a preset normality value e.g. 10 times.
- Outputter 62 assesses whether other datasets require processing. If not, outputter 62 outputs the results; if so, the sets of other datasets are analysed-that is, processing returns to data imagizer 48 where processing commences of the next dataset (which may relate to a different abnormal condition or to a further set of measurements of an earlier dataset).
- output merger 64 merges the results of abnormality.
- Output merger 64 may merge the results of abnormality according to, for example, any of these criteria:
- abnormality quantifier builder 68 may be configured such that all normal measurements (A, B) are in a predetermined scale (e.g., 0 to 100), so effectively unitless.
- the maximum abnormal point (which may correspond to a disease point) is set as 0 regardless of the abnormality.
- Figure 6 depicts this concept schematically.
- Abnormality quantifier builder 68 then outputs an 'abnormality quantifier'.
- an 'abnormality quantifier' is software.
- the abnormality quantifier is a discrete software application, a webpage that quantifies specific abnormality, or any other suitable calculator.
- the abnormality quantifier is an imaging device, a device that analyses a biological sample, or an ultrasound device.
- the abnormality quantifier defines and quantifies the extent of abnormality for the measurement it has self-trained itself to quantify.
- the abnormality quantifier is a medical device such as an imaging device with the measuring device being a computed tomography (CT) scanner with an inbuilt image processing software.
- CT computed tomography
- the abnormality quantifier is a medical device with a measuring device in the form of an image processing device.
- the image processing device may use any suitable image processing technique (such as that disclosed in international patent application publication no. WO 2011/029153 ).
- the medical device is an analyser of biological samples, such as an assay. The medical device may identify abnormalities such as those produced by diseases or normal physiological processes such as ageing or physical exercise. In these circumstances, the medical device may be used as an aid in the diagnosis of disease in an individual.
- the medical device may quantify the changes in the extent of abnormality such that produced by treatments or influential factors such as lifestyle factors (smoking, alcohol consumption, physical exercise, etc). In these circumstances the medical device may be used as an aid in the monitoring of the effects of treatments or influential factors on an individual.
- treatments or influential factors such as lifestyle factors (smoking, alcohol consumption, physical exercise, etc).
- the medical device built by the builder of abnormality quantifier is a device that identifies and quantifies the extent of abnormality in bone (see examples below).
- the abnormality may be a fracture-vulnerable bone and therefore requiring treatment to decrease the extent of abnormality in the bone. In these circumstances, repeated quantification of the extent of abnormality may be used to monitor the treatment.
- treatments that many be used to do so such as antiresorptives (e.g. an alendronate, denosumab, risedronate, selective estrogen receptor modulator (SERM) and odanacatib).
- antiresorptives e.g. an alendronate, denosumab, risedronate, selective estrogen receptor modulator (SERM) and odanacatib.
- SERM selective estrogen receptor modulator
- the treatment may comprise an anabolic therapy, such as with teriparatide (intermittent parathyroid hormone), or Parathyroid hormone-related protein (PTH rp) such as abaloparatide or Humanized anti-sclerostin monoclonal antibody such as Romosozumab.
- Treatment may also entail modification of lifestyle factors such as physical exercise, diary food, calcium, and vitamin D intake.
- the invention provides executable instructions or software (such as embodied in a computer readable medium, for example with the executable instructions or software imbedded or permanently stored therein), that, when executed by a computer or processor of a computer, cause the computer or processor of the computer to perform the method for analysing a set of (optionally co-dependent) measurements as described above to output the extent of abnormality between two co-measurements or devices can be used to use to define and quantify the extent of abnormality between two co-measurements.
- executable instructions or software such as embodied in a computer readable medium, for example with the executable instructions or software imbedded or permanently stored therein
- the result of the analysing step would generally be outputted so that it can be used to define normal versus abnormal, but may be outputted to a memory or memory medium for later used, may be outputted as a device (an application, software, a webpage, or any other calculator).
- the invention provides a computing device provided with executable instructions or software that, when executed by the computing device or by a processor of the computing device, cause the computing device or processor of the computing device to perform the method for analysing of data of co-dependent variable as described above.
- this embodiment attempts to address at least some of the problems arising from the shortcomings of some existing approaches. It takes into account the spatial position a data point to determine whether the specific point is normal or abnormal, and defines abnormality by a spatial direction where the point exit and the magnitude of the exit are defined as disease related, such that the magnitude of abnormality is related to the deviation from the expected position regardless of the absolute value.
- Example 1 In this example, the sample was bone, and the abnormality was bone fragility (i.e., fracture-vulnerable bone) due to a reduced amount of bone or 'too little bone'-commonly referred to as osteoporosis.
- bone fragility i.e., fracture-vulnerable bone
- the measuring device of abnormality quantifier builder 4 was the image processor using the image processing technique disclosed in the international patent application publication no. WO 2011/029153 .
- the processor had been preset to automatically output bone porosity (determined as a percentage) and trabecular density (determined in units of mgHA/cc) for the abnormality identifier. These measurements were preselected based on the assumption that, if the amount of bone is reduced, such a reduction would be apparent in both cortical and trabecular compartments. This makes these measurements likely to be good markers of bone fragility due to reduced amount of bone.
- abnormality quantifier builder 4 would not be expected to build an abnormality quantifier for this type of bone abnormality; this is because any attempt to build an abnormality quantifier would be expected to fail to meet the acceptance criteria regardless of the level of optimization in defining abnormality by the abnormality quantifier. If this were to be the case, different parameters that were likely to be surrogates of a reduced amount of bone would need to be selected (or preselected) and used by abnormality quantifier builder 4 until an abnormality quantifier can be built. The selection or preselection of other likely parameters could be either automated or input by the controller as desired. However, if the assumption that bone porosity and trabecular density are good markers of bone fragility, the builder of abnormality quantifier will be able to build an abnormality quantifier for this type of bone fragility.
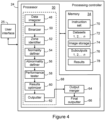
- Figures 7A to 7D show examples of an image of datasets created by abnormality quantifier builder 4 from the measured values of porosity and trabecular density from a referent population and their analysis according to an embodiment of the present invention for determining normal and abnormal.
- Figure 7A is an image 120 derived from datasets comprising trabecular density and bone porosity values for a referent population of normal and abnormal subjects.
- Subjects with fractured bone due to documented reduced amount of bone, of which there are 35, are shown with hollow circles: the subjects may be described as diseased or 'abnormal.'
- the abnormality definer uses the point in image 120 that corresponds to the abnormality (that is, 'mid normality point' A) to find an exit (or abnormality) vector (V).
- vectors V1, V2,... , Vn are determined as the vectors from the mid normality point A to the respective abnormal points.
- Abnormality definer determines a maximum abnormal point (MAP), using the exit vector V.
- MAP maximum abnormal point
- Abnormality may then be quantified based on the magnitude of the difference between the MAP and other points. Several approaches many be used.
- Figure 8 illustrates an image 140 of a dataset that comprises the data shown in figures 7A to 7D as well as data relating to an independent cohort of 77 subjects with a bone fracture (shown as shaded circles).
- Figure 8 illustrates the identification of abnormality according to an embodiment of the present invention.
- exit vector V derived from the analysis of image 120 of figure 7A is also shown in figure 8 .
- the method of this embodiment once applied to the cohort of subjects with a bone fracture, captures 57 of the 77 fracture patients as abnormal, and only 4 normal values as abnormal. This is a predictive positive value of 93.4% which is satisfactory performance.
- Abnormality quantifier builder 4 has thus built an abnormality quantifier for quantifying fracture-vulnerability due to 'too little bone'. This may assist in the identification of subjects with fracture-vulnerability due to this type of abnormality so that modifying factors such as treatment can be used to decrease the level of abnormality.
- treatment may be initiated to modify the extent of abnormality.
- Antiresorptives such as alendronate or denosumab, anabolic therapies such as PTH, PTHrp, and Romosozumab are known to decrease porosity and increase trabecular density. These treatments will cause the sample porosity and trabecular density to move further away from the MAP and this effect can be used to assist in the monitoring of the effectiveness of these treatments.
- the rate of movement of the sample relative to the MAP with time, and the magnitude of change in the spatial position of these measurements from the sample can be used not only to assist in treatment monitoring but also to assess the differences in the effectiveness of different treatments. A more effective or more potent treatment will move samples measurements away from the MAP at a rate with time and/or at the highest magnitude.
- anabolic therapies build bones and are more potent than antiresorptives
- a greater degree of abnormality i.e., reduction in amount of bone is severe
- this bone abnormality quantifier may help prompt the health professional to use anabolic therapies whereas a lesser degree of abnormality (the reduction in the amount of bone is less severe) may help prompt the health practitioner to use of antiresorptives instead.
- this abnormality quantifying may help in treatment choice.
- Example 2 As in example 1, in this example the sample or population is bone is again. However, the abnormality is bone fragility (i.e., fracture-vulnerable bone), not that due to a reduced amount of bone ('too little bone' or osteoporosis) but the one due to bone with relatively normal amount but which is brittle.
- bone fragility i.e., fracture-vulnerable bone
- the measuring device of the abnormality quantifier builder 4 was also as for example 1: an image processor using the image processing technique disclosed in the international patent application publication no. WO 2011/029153 .
- the processor has been preselected to automatically output bone porosity (determined as a percentage) and mineralization (determined in units as a percentage) for abnormality identifier. These measurements were preselected based on the assumption that, if the amount of bone is reduced and the mineralization level is increased then micro-cracks can initiate and propagate more easily leading to the point of catastrophic failure (i.e., fracture). Hence, these two measurements can be good markers of this type of bone fragility.
- abnormality quantifier builder 4 would not be able to output an abnormality quantifier for this type of bone fragility by measuring these two parameters.
- Abnormality quantifier builder 4 would either be preset (i.e., pre-program) to measure other likely candidates measurement until an abnormality quantifier is built or the controller can input other likely candidate into the builder.
- Figures 9A to 9C show examples of an image of datasets produced using the measurements of cortical bone porosity and bone mineralization from a referent population and their analysis according to an embodiment of the present invention for determining normal and abnormal.
- Abnormality quantifier builder 4 uses a process similar to that described in example 1 to build an abnormality quantifier but for this type of bone fragility. It should however be noted that differences processes described above such as using a shape, an exit path rather than a vector could be used.
- Figure 9A is a plot of mineralization (%) (or MN) versus porosity, and depicts a quantifier of abnormality due to brittleness.
- grey dots indicate normal subjects, and the normality zone is outlined by curve 132.
- the 'Mid normality point' A was determined as the average of porosity and mineralization from all the normal points.
- Mid normality point A defines four quadrants in the image, with boundaries defined by discontinued horizontal and vertical axes passing through mid normality point A.
- the abnormality definer 56 uses the point in the image that corresponds to the abnormality (that is, 'mid normality point' A) to find an exit (or abnormality) vector (V).
- Abnormality definer 56 determines a maximum abnormal point ( MAP ), using the exit vector V.
- the maximum abnormal point is shown in the figure. Abnormality may then be quantified based on the magnitude of the difference between the MAP and other points.
- the performance of abnormality definer 56 is further tested using third datasets containing a mixture of abnormal subjects with atypical femoral fractures (due bone brittleness) and another set of abnormal subjects with this time classical or typical fracture known to be due to reduced amount of bone (see figure 9B ).
- Subjects with fracture vulnerable-bone due increased brittleness and those with fracture vulnerable-bone due reduced amount of bone are of the same age. This is to ensure that the abnormality quantifier is built with enhanced performance so that it can distinguish with a reasonable degree of accuracy subjects with fracture-vulnerable bones due increases brittleness versus subjects with fracture-vulnerable bones due to reduced amount of bone "too little bone”.
- the abnormality quantifier build by abnormality quantifier builder 4, as in Example 2, may assist in diagnosis of fracture-vulnerability, decision to treat, treatment monitoring and treatment decision.
- treatment decision of particular importance is its ability to distinguish the two types of fracture-vulnerable bones.
- Antiresorptives such as alendronate, risedronate, or Denosumab inhibit remodelling (i.e., freeze the bone) and so allow mineralization to continue; with these drugs it is currently allowed to continue in an unchecked manner by health professional. Thus, with these drugs, mineralization may progress to the extent that the bone becomes brittle. There are indeed, documented cases of fractures due to increased brittleness in patients on antiresorptives, which are thought likely to be have been due to unwarranted changes in mineralization.
- the abnormality quantifier built by the builder of abnormality quantifier may assist in treatment decision when treating with antiresorptives in the following ways:
- Anabolic therapies such a such romosozumab, teriparatide or abaloparatide form newer bone and/or remove older bone and replace it with newer bone. Whatever the case, the newer bone is less mineralized. Thus, they have the opposite effect of antiresorptives on bone mineralization.
- the abnormality quantifier built by the builder of abnormality quantifier may assist in treatment decision when treating with anabolic therapy in the following ways:
- the abnormality built by the builder of abnormality quantifier offer the opportunity for a personalized medicine, and particularly in the field of bone medicine.
- Bone abnormalities quantified by the abnormalities quantifier of Examples 1 and 2 provide a fundamental shift from current approaches in the diagnosis, treatment decision, treatment implementation and monitoring for bone diseases. It makes available a unique method of treatment for bone diseases. Although these examples are disclosed in the context of bone diseases similar abnormalities quantifiers can be built by the builder of abnormality quantifier for other diseases or abnormalities.
- the method can be used to measure an interaction and change in the interaction between two measurements when statistical methods show no interaction as defined by the correlation coefficient not different from zero, as shown in figures 10A to 10C .
- the method can be used to assess the change in the interaction between two measurements (A) and (B) produced by an influential factor (such as a disease) even when the statistically the correlation between these two variables does not neither in a normal state, nor in a new state after the effect of an influential factor (e.g., Disease).
- an influential factor such as a disease
- the magnitude of abnormality will still be quantified as deviation from the spatial position relative to that of the normal reference population even if the statistical parameters use to quantify the relationship between the two measurements haven't change.
Landscapes
- Engineering & Computer Science (AREA)
- Health & Medical Sciences (AREA)
- Medical Informatics (AREA)
- General Health & Medical Sciences (AREA)
- Public Health (AREA)
- Physics & Mathematics (AREA)
- Epidemiology (AREA)
- Life Sciences & Earth Sciences (AREA)
- Primary Health Care (AREA)
- Data Mining & Analysis (AREA)
- Biomedical Technology (AREA)
- Theoretical Computer Science (AREA)
- Bioinformatics & Cheminformatics (AREA)
- Databases & Information Systems (AREA)
- Radiology & Medical Imaging (AREA)
- Nuclear Medicine, Radiotherapy & Molecular Imaging (AREA)
- Evolutionary Biology (AREA)
- Spectroscopy & Molecular Physics (AREA)
- Biophysics (AREA)
- Bioinformatics & Computational Biology (AREA)
- Biotechnology (AREA)
- Pathology (AREA)
- Computer Vision & Pattern Recognition (AREA)
- General Physics & Mathematics (AREA)
- Quality & Reliability (AREA)
- Chemical & Material Sciences (AREA)
- Analytical Chemistry (AREA)
- Genetics & Genomics (AREA)
- Molecular Biology (AREA)
- Proteomics, Peptides & Aminoacids (AREA)
- Artificial Intelligence (AREA)
- Bioethics (AREA)
- Evolutionary Computation (AREA)
- Software Systems (AREA)
- Investigating Or Analysing Biological Materials (AREA)
- Measuring And Recording Apparatus For Diagnosis (AREA)
- Medical Treatment And Welfare Office Work (AREA)
- Investigating Materials By The Use Of Optical Means Adapted For Particular Applications (AREA)
Claims (15)
- Computerimplementiertes Verfahren zum Aufbauen eines Abnormalitätsquantifizierers, der dazu konfiguriert ist, das Ausmaß von Abnormalität bei einer oder mehreren Messungen von Probanden oder Mitgliedern einer Gruppe zu identifizieren und quantifizieren, wobei die Abnormalität Knochenabnormalität oder Fettleibigkeit ist, wobei das Verfahren Folgendes umfasst:Erstellen mindestens eines ersten ausgewählten Datensatzes (A1), umfassend Messungen einer normalen Population oder Probe, und mindestens eines zweiten ausgewählten Datensatzes (A2), umfassend Messungen einer abnormalen Population oder Probe;Erstellen einer Karte (120; 140) durch Abbilden der Datensätze;Identifizieren einer Normalitätszone (122; 132) innerhalb der Karte (120; 140) unter Verwendung des ersten Datensatzes (A1) ;Identifizieren einer Abnormalitätszone innerhalb der Karte (120; 140) unter Verwendung des zweiten Datensatzes (A2);Bestimmen einer Definition von Abnormalität basierend auf einem Vergleich der Normalitätszone (122; 132) und der Abnormalitätszone;Erhalten von oder Zugreifen auf mindestens einen dritten Datensatz (A3), umfassend Messungen sowohl einer bekannten normalen als auch abnormalen Population oder Probe;Testen der Leistung der Definition von Abnormalität in Bezug auf ein oder mehrere vorab festgelegte Leistungskriterien unter Verwendung des mindestens einen dritten Datensatzes (A3);Verbessern der Leistung durch Modifizieren von Merkmalen, die verwendet werden, um eine oder mehrere von Normalität und Abnormalität zu identifizieren; undAusgeben eines Abnormalitätsquantifizierers, wenn ein vorab festgelegter Leistungsschwellenwert erreicht worden ist;wobei die Messungen der normalen Population oder Probe Co-Messungen umfassen, die Messungen sind, die sich auf jeweilige Merkmale der normalen Population oder Probe beziehen, und die Messungen der abnormalen Population oder Probe Co-Messungen umfassen, die Messungen sind, die sich auf jeweilige Merkmale der abnormalen Population oder Probe beziehen;wobei der Abnormalitätsquantifizierer dazu konfiguriert ist, das Ausmaß von Abnormalität in der Probe auf Grundlage der verbesserten Definition von Abnormalität zu identifizieren und quantifizieren;wobei die Merkmale, die verwendet werden, um Abnormalität zu identifizieren, eines oder mehrere der Folgenden umfassen: eine Form, Richtung, Ausrichtung oder sonstige geometrische Definition der Abnormalitätszone, räumliche Merkmale der Abnormalitätszone und eine Form oder Ausrichtung der Abnormalitätszone in Verbindung mit jener der Normalitätszone; undwobei die Merkmale, die verwendet werden, um Normalität zu identifizieren, eines oder mehrere der Folgenden umfassen: räumliche Merkmale der Normalitätszone, einen zentralsten Punkt in der Normalitätszone, einen normalsten Punkt, äußere Ränder der Normalitätszone und einen Punkt mit Koordinaten, die Durchschnittswerte der Co-Messungen des ersten Datensatzes (A1) sind.
- Verfahren nach Anspruch 1, umfassend Erhalten der Messungen der normalen Population oder Probe durch Messen von einer oder mehreren normalen Proben oder Probanden und Erhalten der Messungen der abnormalen Population oder Probe durch Messen von einer oder mehreren abnormalen Proben oder Probanden.
- Verfahren nach Anspruch 1 oder 2, wobei das Abbilden des ersten und des zweiten Datensatzes Umwandeln von geometrischen virtuellen Koordinaten, die einen Datensatz darstellen, in die Karte als eine Punktwolke, die normale und abnormale Probanden darstellt, umfasst.
- Verfahren nach einem der Ansprüche 1 bis 3, wobei das Messen der Probe oder Population Folgendes umfasst:Aufnehmen von Bildern unter Verwendung von Computertomografie (CT), Magnetresonanzbildgebung (MRI) oder einer sonstigen Bildgebungsvorrichtung und Verarbeiten der Bilder unter Verwendung einer Bildverarbeitungstechnik; oderVerarbeiten zuvor aufgenommener Bilder unter Verwendung einer Bildverarbeitungstechnik.
- Verfahren nach einem der Ansprüche 1 bis 4, wobei das Messen der Probe Analysieren einer biologischen Probe unter Verwendung einer Analysetechnik und/oder Erhalten von Messungen unter Verwendung eines Messinstruments, vorzugsweise umfassend ein Analysemessinstrument, umfasst.
- Verfahren nach Anspruch 4 oder 5, ferner umfassend Identifizieren von einer oder mehreren Abnormalitäten bei einer oder mehreren Messungen der Population oder Probe.
- Verfahren nach Anspruch 1, wobei die Messungen mit einer Bildgebungsvorrichtung erhalten werden, die dazu konfiguriert ist, eine Vielzahl von unterschiedlichen Sätzen von Knochenparametern auszugeben, und wobei vorzugsweise die Knochenabnormalität eine Bruchanfälligkeit ist, und wobei vorzugsweise die Bruchanfälligkeit auf die strukturelle Abnormalität, die eine verringerte Knochenmenge umfasst, zurückzuführen ist, und wobei optional das Verfahren ferner Schätzen eines Zeitfensters, in welchem ein Bruch aufgrund einer Knochenverringerungsmenge auftreten kann, umfasst.
- Verfahren nach Anspruch 7, ferner umfassend Neukategorisieren eines Probanden, der zuvor kategorisiert wurde, durch Anpassen der Definition von Abnormalität.
- Verfahren nach einem der Ansprüche 1 bis 8, wobei die Abnormalität altersabhängig ist.
- Verfahren nach Anspruch 1, ferner umfassend Bestimmen eines Typs von Bruchanfälligkeit einschließlich Unterscheiden von Bruchanfälligkeit aufgrund einer verringerten Knochenmenge von Bruchanfälligkeit aufgrund von Knochensprödigkeit.
- Vorrichtung, die dazu konfiguriert ist, einen Abnormalitätsquantifizierer zum Identifizieren und Quantifizieren des Ausmaßes von Abnormalität bei einer oder mehreren Messungen von Probanden oder Mitgliedern einer Gruppe aufzubauen, wobei die Abnormalität Knochenabnormalität oder Fettleibigkeit ist, wobei die Vorrichtung Folgendes umfasst:einen Datenbildgeber (48), der dazu konfiguriert ist, eine Karte (120; 140) durch Abbilden mindestens eines ersten ausgewählten Datensatzes (A1), umfassend Messungen einer normalen Population oder Probe, und mindestens eines zweiten ausgewählten Datensatzes (A2), umfassend Messungen einer abnormalen Population oder Probe zu erstellen;einen Zonenidentifizierer (21), der dazu konfiguriert ist, eine Normalitätszone innerhalb der Karte (120; 140) unter Verwendung des ersten Datensatzes (A1) zu identifizieren und eine Abnormalitätszone innerhalb der Karte (120; 140) unter Verwendung des zweiten Datensatzes (A2) zu identifizieren;einen Abnormalitätsdefinierer (56), der dazu konfiguriert ist, eine Definition von Abnormalität basierend auf einem Vergleich der Normalitätszone (122; 132) und der Abnormalitätszone zu bestimmen;einen Leistungstester (58), der dazu konfiguriert ist, die Leistung der Definition von Abnormalität in Bezug auf ein oder mehrere vorab festgelegte Leistungskriterien unter Verwendung mindestens eines dritten Datensatzes (A3), umfassend Messungen sowohl einer bekannten normalen als auch abnormalen Population oder Probe, zu testen;einen Ergebnisoptimierer (60), der dazu konfiguriert ist, die Leistung durch Modifizieren von Merkmalen, die verwendet werden, um eine oder mehrere von Normalität und Abnormalität zu identifizieren, zu verbessern; undeinen Ausgeber (62), der dazu konfiguriert ist, einen Abnormalitätsquantifizierer auszugeben, wenn ein vorab festgelegter Leistungsschwellenwert erreicht worden ist;wobei die Messungen der normalen Population oder Probe Co-Messungen umfassen, die Messungen sind, die sich auf jeweilige Merkmale der normalen Population oder Probe beziehen, und die Messungen der abnormalen Population oder Probe Co-Messungen umfassen, die Messungen sind, die sich auf jeweilige Merkmale der abnormalen Population oder Probe beziehen;wobei der Abnormalitätsquantifizierer dazu konfiguriert ist, das Ausmaß von Abnormalität in der Population oder Probe auf Grundlage der verbesserten Definition von Abnormalität zu identifizieren und quantifizieren;wobei die Merkmale, die verwendet werden, um Abnormalität zu identifizieren, eines oder mehrere der Folgenden umfassen: eine Form, Richtung, Ausrichtung oder sonstige geometrische Definition der Abnormalitätszone, räumliche Merkmale der Abnormalitätszone und eine Form oder Ausrichtung der Abnormalitätszone in Verbindung mit jener der Normalitätszone; undwobei die Merkmale, die verwendet werden, um Normalität zu identifizieren, eines oder mehrere der Folgenden umfassen: räumliche Merkmale der Normalitätszone, einen zentralsten Punkt in der Normalitätszone, einen normalsten Punkt, äußere Ränder der Normalitätszone und einen Punkt mit Koordinaten, die Durchschnittswerte der Co-Messungen des ersten Datensatzes (A1) sind.
- Computerimplementiertes Verfahren zum Identifizieren von Abnormalität bei einer oder mehreren Messungen von Probanden oder Mitgliedern einer Gruppe, wobei die Abnormalität Knochenabnormalität oder Fettleibigkeit ist, wobei das Verfahren Folgendes umfasst:
Erhalten von oder Zugreifen auf eine Definition von Abnormalität, die durch einen Abnormalitätsquantifizierer erstellt wird, der gemäß einem Verfahren aufgebaut ist, das Folgendes umfasst:Erstellen einer Karte (120; 140) durch Abbilden mindestens eines ersten ausgewählten Datensatzes (A1), umfassend Messungen einer normalen Population oder Probe, und mindestens eines zweiten ausgewählten Datensatzes (A2), umfassend Messungen einer abnormalen Population oder Probe;Identifizieren einer Normalitätszone (122; 132) innerhalb der Karte (120; 140) unter Verwendung des ersten ausgewählten Datensatzes (A1);Identifizieren einer Abnormalitätszone innerhalb der Karte (120; 140) unter Verwendung des zweiten ausgewählten Datensatzes (A2) ;Bestimmen einer Definition von Abnormalität basierend auf einem Vergleich der Normalitätszone und der Abnormalitätszone;Testen der Leistung der Definition von Abnormalität in Bezug auf ein oder mehrere vorab festgelegte Leistungskriterien unter Verwendung mindestens eines dritten Datensatzes (A3), umfassend Messungen sowohl einer bekannten normalen als auch abnormalen Population oder Probe; undVerbessern der Leistung durch Modifizieren von Merkmalen, die verwendet werden, um eine oder mehrere von Normalität und Abnormalität zu identifizieren; undBestimmen anhand der Definition von Abnormalität, welche der einen oder mehreren Messungen Abnormalität entsprechen;wobei die Messungen der normalen Population oder Probe Co-Messungen umfassen, die Messungen sind, die sich auf jeweilige Merkmale der normalen Population oder Probe beziehen, und die Messungen der abnormalen Population oder Probe Co-Messungen umfassen, die Messungen sind, die sich auf jeweilige Merkmale der abnormalen Population oder Probe beziehen;wobei die Merkmale, die verwendet werden, um Abnormalität zu identifizieren, eines oder mehrere der Folgenden umfassen: eine Form, Richtung, Ausrichtung oder sonstige geometrische Definition der Abnormalitätszone, räumliche Merkmale der Abnormalitätszone und eine Form oder Ausrichtung der Abnormalitätszone in Verbindung mit jener der Normalitätszone; undwobei die Merkmale, die verwendet werden, um Normalität zu identifizieren, eines oder mehrere der Folgenden umfassen: räumliche Merkmale der Normalitätszone, einen zentralsten Punkt in der Normalitätszone, einen normalsten Punkt, äußere Ränder der Normalitätszone und einen Punkt mit Koordinaten, die Durchschnittswerte der Co-Messungen des ersten Datensatzes (A1) sind. - Vorrichtung zum Identifizieren von Abnormalität bei einer oder mehreren Messungen von Probanden oder Mitgliedern einer Gruppe, wobei die Abnormalität Knochenabnormalität oder Fettleibigkeit ist, wobei die Vorrichtung Folgendes umfasst:einen Prozessor (30);einen Speicher (34);einen Datenbildgeber (48), der dazu konfiguriert ist, eine Karte (120; 140) durch Abbilden mindestens eines ersten und eines zweiten Datensatzes (A1; A2) zu erstellen, wobei der erste Datensatz (A1) Messungen einer normalen Population oder Probe umfasst und der zweite Datensatz (A2) Messungen einer abnormalen Population oder Probe umfasst;einen Zonenidentifizierer (21), der dazu konfiguriert ist, eine Normalitätszone innerhalb der Karte (120; 140) unter Verwendung des ersten Datensatzes (A1) zu identifizieren und eine Abnormalitätszone innerhalb der Karte (120; 140) unter Verwendung des zweiten Datensatzes (A2) zu identifizieren;einen Abnormalitätsdefinierer (56), der dazu konfiguriert ist, eine Definition von Abnormalität basierend auf einem Vergleich der Normalitätszone (122; 132) und der Abnormalitätszone zu bestimmen;einen Leistungstester (58), der dazu konfiguriert ist, die Leistung der Definition von Abnormalität in Bezug auf ein oder mehrere vorab festgelegte Leistungskriterien unter Verwendung mindestens eines dritten Datensatzes (A3), umfassend Messungen sowohl einer bekannten normalen als auch abnormalen Population oder Probe, zu testen;einen Ergebnisoptimierer (60), der dazu konfiguriert ist, die Leistung durch Modifizieren von Merkmalen, die verwendet werden, um eine oder mehrere von Normalität und Abnormalität zu identifizieren, zu verbessern; undeinen Ausgeber (62) zum Ausgeben mindestens eines Ergebnisses;wobei der erste und der zweite Datensatz (A1, A2) Co-Messungen umfassen, wobei die Messungen der normalen Population oder Probe Messungen sind, die sich auf jeweilige Merkmale der normalen Population oder Probe beziehen, und die Messungen der abnormalen Population oder Probe Messungen sind, die sich auf jeweilige Merkmale der abnormalen Population oder Probe beziehen; undwobei die Vorrichtung dazu konfiguriert ist, anhand der Definition von Abnormalität zu bestimmen, welche der einen oder mehreren Messungen Abnormalität entsprechen;wobei die Merkmale, die verwendet werden, um Abnormalität zu identifizieren, eines oder mehrere der Folgenden umfassen: eine Form, Richtung, Ausrichtung oder sonstige geometrische Definition der Abnormalitätszone, räumliche Merkmale der Abnormalitätszone und eine Form oder Ausrichtung der Abnormalitätszone in Verbindung mit jener der Normalitätszone; undwobei die Merkmale, die verwendet werden, um Normalität zu identifizieren, eines oder mehrere der Folgenden umfassen: räumliche Merkmale der Normalitätszone, einen zentralsten Punkt in der Normalitätszone, einen normalsten Punkt, äußere Ränder der Normalitätszone und einen Punkt mit Koordinaten, die Durchschnittswerte der Co-Messungen des ersten Datensatzes (A1) sind.
- Vorrichtung nach Anspruch 13, wobei das Abbilden des ersten und des zweiten Datensatzes Umwandeln von geometrischen virtuellen Koordinaten, die einen Datensatz darstellen, in die Karte als eine Punktwolke, die normale oder abnormale Probanden darstellt, umfasst, wobei die Vorrichtung vorzugsweise einen Normalitätsdefinierer beinhaltet, der dazu konfiguriert ist, eine Definition von Normalität zu bestimmen.
- Vorrichtung nach Anspruch 11 oder 13, die einen Binarisierer (50) einschließt.
Applications Claiming Priority (2)
| Application Number | Priority Date | Filing Date | Title |
|---|---|---|---|
| AU2016900806A AU2016900806A0 (en) | 2016-03-03 | Method and Apparatus for Identifying and Quantifying Abnormality | |
| PCT/AU2017/050172 WO2017147648A1 (en) | 2016-03-03 | 2017-02-28 | Method and apparatus for identifying and quantifying abnormality |
Publications (4)
| Publication Number | Publication Date |
|---|---|
| EP3423976A1 EP3423976A1 (de) | 2019-01-09 |
| EP3423976A4 EP3423976A4 (de) | 2019-03-20 |
| EP3423976C0 EP3423976C0 (de) | 2024-02-21 |
| EP3423976B1 true EP3423976B1 (de) | 2024-02-21 |
Family
ID=59742404
Family Applications (1)
| Application Number | Title | Priority Date | Filing Date |
|---|---|---|---|
| EP17759003.1A Active EP3423976B1 (de) | 2016-03-03 | 2017-02-28 | Verfahren und vorrichtung zur identifizierung und quantifizierung von anomalie |
Country Status (7)
| Country | Link |
|---|---|
| US (2) | US11462302B2 (de) |
| EP (1) | EP3423976B1 (de) |
| JP (1) | JP7160339B2 (de) |
| CN (2) | CN109074432B (de) |
| AU (1) | AU2017225901B2 (de) |
| ES (1) | ES2975107T3 (de) |
| WO (1) | WO2017147648A1 (de) |
Families Citing this family (7)
| Publication number | Priority date | Publication date | Assignee | Title |
|---|---|---|---|---|
| JP7301343B2 (ja) * | 2019-03-28 | 2023-07-03 | 株式会社タニタ | 健康管理装置、健康管理システム、健康管理プログラム、及び健康管理方法 |
| CN111613266A (zh) * | 2020-05-20 | 2020-09-01 | 中南大学 | 基于定量构效关系的离群值检测方法 |
| CN111680751B (zh) * | 2020-06-09 | 2023-05-30 | 南京农业大学 | 一种谷物产量图异常数据检测算法 |
| CN114119623B (zh) * | 2020-08-31 | 2025-05-13 | 苏州科瓴精密机械科技有限公司 | 基于色度分量的图像分割方法、系统、图像分割设备及可读存储介质 |
| CN117711593B (zh) * | 2024-02-05 | 2024-04-19 | 苏州绿华科技有限公司 | 一种智慧药房进出药管理系统 |
| CN118277755B (zh) * | 2024-05-31 | 2024-09-10 | 中环汽研(北京)低碳科技有限公司 | 一种车辆发动机燃油类别识别方法、装置和设备 |
| CN118585511B (zh) * | 2024-06-27 | 2025-02-11 | 山东中医药大学附属医院 | 一种骨科数据库构建方法、系统及存储介质 |
Family Cites Families (17)
| Publication number | Priority date | Publication date | Assignee | Title |
|---|---|---|---|---|
| AU1671697A (en) * | 1996-02-16 | 1997-09-02 | Sumitomo Metal Industries Ltd. | Method of detecting abnormality and abnormality detection system |
| US20050085705A1 (en) * | 2003-10-21 | 2005-04-21 | Rao Stephen M. | fMRI system for use in detecting neural abnormalities associated with CNS disorders and assessing the staging of such disorders |
| JP2005198970A (ja) * | 2004-01-19 | 2005-07-28 | Konica Minolta Medical & Graphic Inc | 医用画像処理装置 |
| CA2635202A1 (en) * | 2005-12-28 | 2007-07-12 | Hill's Pet Nutrition, Inc. | Method of diagnosing a body weight condition or predisposition in an animal |
| CN101561878B (zh) * | 2009-05-31 | 2012-11-21 | 河海大学 | 基于改进cure聚类算法的无监督异常检测方法与系统 |
| WO2011029153A1 (en) | 2009-09-11 | 2011-03-17 | Straxcorp Pty Ltd | Method and system for image analysis of selected tissue structures |
| WO2011137407A1 (en) * | 2010-04-30 | 2011-11-03 | Vucomp, Inc. | Microcalcification detection and classification in radiographic images |
| GB201012519D0 (en) * | 2010-07-26 | 2010-09-08 | Ucl Business Plc | Method and system for anomaly detection in data sets |
| US20130044927A1 (en) * | 2011-08-15 | 2013-02-21 | Ian Poole | Image processing method and system |
| CN102360378A (zh) * | 2011-10-10 | 2012-02-22 | 南京大学 | 一种时序数据离群点检测方法 |
| GB201118000D0 (en) * | 2011-10-19 | 2011-11-30 | Orthox Ltd | An implantable repair device |
| JP6075973B2 (ja) * | 2012-06-04 | 2017-02-08 | 富士通株式会社 | 健康状態判定装置およびその作動方法 |
| WO2014070207A1 (en) * | 2012-11-05 | 2014-05-08 | Landmark Graphics Corporation | System, method and computer program product for wellbore event modeling using rimlier data |
| US11086970B2 (en) * | 2013-03-13 | 2021-08-10 | Blue Belt Technologies, Inc. | Systems and methods for using generic anatomy models in surgical planning |
| CN103955678A (zh) * | 2014-05-13 | 2014-07-30 | 深圳市同洲电子股份有限公司 | 一种图像的识别方法和装置 |
| US10140576B2 (en) | 2014-08-10 | 2018-11-27 | Palo Alto Research Center Incorporated | Computer-implemented system and method for detecting anomalies using sample-based rule identification |
| US10318886B2 (en) * | 2015-10-30 | 2019-06-11 | Citrix Systems, Inc. | Anomaly detection with K-means clustering and artificial outlier injection |
-
2017
- 2017-02-28 CN CN201780025987.4A patent/CN109074432B/zh active Active
- 2017-02-28 CN CN202310124797.5A patent/CN116051535A/zh active Pending
- 2017-02-28 ES ES17759003T patent/ES2975107T3/es active Active
- 2017-02-28 WO PCT/AU2017/050172 patent/WO2017147648A1/en not_active Ceased
- 2017-02-28 US US16/081,701 patent/US11462302B2/en active Active
- 2017-02-28 JP JP2018545854A patent/JP7160339B2/ja active Active
- 2017-02-28 AU AU2017225901A patent/AU2017225901B2/en active Active
- 2017-02-28 EP EP17759003.1A patent/EP3423976B1/de active Active
-
2022
- 2022-10-03 US US17/959,180 patent/US12243625B2/en active Active
Non-Patent Citations (1)
| Title |
|---|
| YAO JIANHUA ET AL: "Cortical shell unwrapping for vertebral body abnormality detection on computed tomography", COMPUTERIZED MEDICAL IMAGING AND GRAPHICS, PERGAMON PRESS, NEW YORK, NY, US, vol. 38, no. 7, 13 April 2014 (2014-04-13), pages 628 - 638, XP029064013, ISSN: 0895-6111, DOI: 10.1016/J.COMPMEDIMAG.2014.04.001 * |
Also Published As
| Publication number | Publication date |
|---|---|
| AU2017225901B2 (en) | 2022-07-28 |
| ES2975107T3 (es) | 2024-07-03 |
| US20230112205A1 (en) | 2023-04-13 |
| EP3423976C0 (de) | 2024-02-21 |
| JP7160339B2 (ja) | 2022-10-25 |
| CN109074432A (zh) | 2018-12-21 |
| CN116051535A (zh) | 2023-05-02 |
| WO2017147648A1 (en) | 2017-09-08 |
| US11462302B2 (en) | 2022-10-04 |
| US12243625B2 (en) | 2025-03-04 |
| AU2017225901A1 (en) | 2018-10-11 |
| US20210217162A1 (en) | 2021-07-15 |
| EP3423976A4 (de) | 2019-03-20 |
| EP3423976A1 (de) | 2019-01-09 |
| CN109074432B (zh) | 2023-09-29 |
| JP2019508146A (ja) | 2019-03-28 |
Similar Documents
| Publication | Publication Date | Title |
|---|---|---|
| US12243625B2 (en) | Method and apparatus for identifying and quantifying abnormality | |
| US10588589B2 (en) | Systems and methods for prediction of osteoporotic fracture risk | |
| JP6023235B2 (ja) | 病気の診断およびモニタリングのための医療画像化方法および装置ならびにその用途 | |
| Buie et al. | Automatic segmentation of cortical and trabecular compartments based on a dual threshold technique for in vivo micro-CT bone analysis | |
| Xu et al. | Computer-aided classification of interstitial lung diseases via MDCT: 3D adaptive multiple feature method (3D AMFM) | |
| US10588588B2 (en) | Method for the fully automatic detection and assessment of damaged vertebrae | |
| US10278672B2 (en) | Method of characterizing the pathological response of tissue to a treatment plan | |
| WO2016013004A1 (en) | Systems and methods for prediction of osteoporotic fracture risk | |
| EP3667615B1 (de) | Bestimmung von metastasen in einem bild eines anatomischen körperteils | |
| CN111862020B (zh) | 一种眼前节生理年龄预测方法、装置、服务器及存储介质 | |
| TW201935403A (zh) | 肝癌分群預測模型、其預測系統以及肝癌分群判斷方法 | |
| Marusina et al. | Automatic segmentation of MRI images in dynamic programming mode | |
| US9763636B2 (en) | Method and system for spine position detection | |
| US10729389B2 (en) | 3D assessment of conjugant eye deviation for the identificaiton of acute ischemic stroke | |
| US20240127448A1 (en) | Assessment of lung disease progression | |
| EP3754598B1 (de) | Verfahren und system zur auswahl eines interessierenden bereichs in einem bild | |
| US20120296194A1 (en) | Method and system for determining a condition of a brain | |
| Singh et al. | A novel magnetic resonance imaging segmentation technique for determining diffuse intrinsic pontine glioma tumor volume | |
| CN114699098A (zh) | 骨密度测量方法、骨密度数据库的构建方法及装置 | |
| GB2491027A (en) | A method and system for determining a condition of a brain | |
| Newell et al. | A semiautomatic method to identify vertebral end plate lesions (Schmorl's nodes) | |
| CN119919713A (zh) | 一种图像处理方法、装置、设备、存储介质及程序产品 | |
| JP2024540185A (ja) | デジタル画像から骨のテクスチャを解析する方法 |
Legal Events
| Date | Code | Title | Description |
|---|---|---|---|
| STAA | Information on the status of an ep patent application or granted ep patent |
Free format text: STATUS: THE INTERNATIONAL PUBLICATION HAS BEEN MADE |
|
| PUAI | Public reference made under article 153(3) epc to a published international application that has entered the european phase |
Free format text: ORIGINAL CODE: 0009012 |
|
| STAA | Information on the status of an ep patent application or granted ep patent |
Free format text: STATUS: REQUEST FOR EXAMINATION WAS MADE |
|
| 17P | Request for examination filed |
Effective date: 20180920 |
|
| AK | Designated contracting states |
Kind code of ref document: A1 Designated state(s): AL AT BE BG CH CY CZ DE DK EE ES FI FR GB GR HR HU IE IS IT LI LT LU LV MC MK MT NL NO PL PT RO RS SE SI SK SM TR |
|
| AX | Request for extension of the european patent |
Extension state: BA ME |
|
| REG | Reference to a national code |
Ref country code: DE Ref legal event code: R079 Free format text: PREVIOUS MAIN CLASS: G06F0019260000 Ipc: G16H0050700000 |
|
| A4 | Supplementary search report drawn up and despatched |
Effective date: 20190218 |
|
| RIC1 | Information provided on ipc code assigned before grant |
Ipc: G16H 50/20 20180101ALI20190212BHEP Ipc: G16H 50/70 20180101AFI20190212BHEP |
|
| DAV | Request for validation of the european patent (deleted) | ||
| DAX | Request for extension of the european patent (deleted) | ||
| STAA | Information on the status of an ep patent application or granted ep patent |
Free format text: STATUS: EXAMINATION IS IN PROGRESS |
|
| 17Q | First examination report despatched |
Effective date: 20210331 |
|
| RAP3 | Party data changed (applicant data changed or rights of an application transferred) |
Owner name: CURVEBEAM AL LIMITED |
|
| REG | Reference to a national code |
Ref country code: DE Ref legal event code: R079 Free format text: PREVIOUS MAIN CLASS: G16H0050700000 Ipc: G16H0050200000 Ref country code: DE Ref legal event code: R079 Ref document number: 602017079346 Country of ref document: DE Free format text: PREVIOUS MAIN CLASS: G16H0050700000 Ipc: G16H0050200000 |
|
| GRAP | Despatch of communication of intention to grant a patent |
Free format text: ORIGINAL CODE: EPIDOSNIGR1 |
|
| STAA | Information on the status of an ep patent application or granted ep patent |
Free format text: STATUS: GRANT OF PATENT IS INTENDED |
|
| RIC1 | Information provided on ipc code assigned before grant |
Ipc: G16H 30/40 20180101ALI20230928BHEP Ipc: G16H 50/70 20180101ALI20230928BHEP Ipc: G16H 50/20 20180101AFI20230928BHEP |
|
| INTG | Intention to grant announced |
Effective date: 20231023 |
|
| GRAS | Grant fee paid |
Free format text: ORIGINAL CODE: EPIDOSNIGR3 |
|
| GRAA | (expected) grant |
Free format text: ORIGINAL CODE: 0009210 |
|
| STAA | Information on the status of an ep patent application or granted ep patent |
Free format text: STATUS: THE PATENT HAS BEEN GRANTED |
|
| AK | Designated contracting states |
Kind code of ref document: B1 Designated state(s): AL AT BE BG CH CY CZ DE DK EE ES FI FR GB GR HR HU IE IS IT LI LT LU LV MC MK MT NL NO PL PT RO RS SE SI SK SM TR |
|
| REG | Reference to a national code |
Ref country code: GB Ref legal event code: FG4D |
|
| REG | Reference to a national code |
Ref country code: CH Ref legal event code: EP |
|
| REG | Reference to a national code |
Ref country code: DE Ref legal event code: R096 Ref document number: 602017079346 Country of ref document: DE |
|
| REG | Reference to a national code |
Ref country code: IE Ref legal event code: FG4D |
|
| U01 | Request for unitary effect filed |
Effective date: 20240315 |
|
| U07 | Unitary effect registered |
Designated state(s): AT BE BG DE DK EE FI FR IT LT LU LV MT NL PT SE SI Effective date: 20240322 |
|
| PG25 | Lapsed in a contracting state [announced via postgrant information from national office to epo] |
Ref country code: IS Free format text: LAPSE BECAUSE OF FAILURE TO SUBMIT A TRANSLATION OF THE DESCRIPTION OR TO PAY THE FEE WITHIN THE PRESCRIBED TIME-LIMIT Effective date: 20240621 |
|
| REG | Reference to a national code |
Ref country code: ES Ref legal event code: FG2A Ref document number: 2975107 Country of ref document: ES Kind code of ref document: T3 Effective date: 20240703 |
|
| PG25 | Lapsed in a contracting state [announced via postgrant information from national office to epo] |
Ref country code: GR Free format text: LAPSE BECAUSE OF FAILURE TO SUBMIT A TRANSLATION OF THE DESCRIPTION OR TO PAY THE FEE WITHIN THE PRESCRIBED TIME-LIMIT Effective date: 20240522 |
|
| PG25 | Lapsed in a contracting state [announced via postgrant information from national office to epo] |
Ref country code: RS Free format text: LAPSE BECAUSE OF FAILURE TO SUBMIT A TRANSLATION OF THE DESCRIPTION OR TO PAY THE FEE WITHIN THE PRESCRIBED TIME-LIMIT Effective date: 20240521 Ref country code: HR Free format text: LAPSE BECAUSE OF FAILURE TO SUBMIT A TRANSLATION OF THE DESCRIPTION OR TO PAY THE FEE WITHIN THE PRESCRIBED TIME-LIMIT Effective date: 20240221 |
|
| PG25 | Lapsed in a contracting state [announced via postgrant information from national office to epo] |
Ref country code: RS Free format text: LAPSE BECAUSE OF FAILURE TO SUBMIT A TRANSLATION OF THE DESCRIPTION OR TO PAY THE FEE WITHIN THE PRESCRIBED TIME-LIMIT Effective date: 20240521 Ref country code: NO Free format text: LAPSE BECAUSE OF FAILURE TO SUBMIT A TRANSLATION OF THE DESCRIPTION OR TO PAY THE FEE WITHIN THE PRESCRIBED TIME-LIMIT Effective date: 20240521 Ref country code: IS Free format text: LAPSE BECAUSE OF FAILURE TO SUBMIT A TRANSLATION OF THE DESCRIPTION OR TO PAY THE FEE WITHIN THE PRESCRIBED TIME-LIMIT Effective date: 20240621 Ref country code: HR Free format text: LAPSE BECAUSE OF FAILURE TO SUBMIT A TRANSLATION OF THE DESCRIPTION OR TO PAY THE FEE WITHIN THE PRESCRIBED TIME-LIMIT Effective date: 20240221 Ref country code: GR Free format text: LAPSE BECAUSE OF FAILURE TO SUBMIT A TRANSLATION OF THE DESCRIPTION OR TO PAY THE FEE WITHIN THE PRESCRIBED TIME-LIMIT Effective date: 20240522 |
|
| PG25 | Lapsed in a contracting state [announced via postgrant information from national office to epo] |
Ref country code: PL Free format text: LAPSE BECAUSE OF FAILURE TO SUBMIT A TRANSLATION OF THE DESCRIPTION OR TO PAY THE FEE WITHIN THE PRESCRIBED TIME-LIMIT Effective date: 20240221 |
|
| PG25 | Lapsed in a contracting state [announced via postgrant information from national office to epo] |
Ref country code: PL Free format text: LAPSE BECAUSE OF FAILURE TO SUBMIT A TRANSLATION OF THE DESCRIPTION OR TO PAY THE FEE WITHIN THE PRESCRIBED TIME-LIMIT Effective date: 20240221 |
|
| REG | Reference to a national code |
Ref country code: CH Ref legal event code: PL |
|
| PG25 | Lapsed in a contracting state [announced via postgrant information from national office to epo] |
Ref country code: SM Free format text: LAPSE BECAUSE OF FAILURE TO SUBMIT A TRANSLATION OF THE DESCRIPTION OR TO PAY THE FEE WITHIN THE PRESCRIBED TIME-LIMIT Effective date: 20240221 |
|
| PG25 | Lapsed in a contracting state [announced via postgrant information from national office to epo] |
Ref country code: CH Free format text: LAPSE BECAUSE OF NON-PAYMENT OF DUE FEES Effective date: 20240229 |
|
| PG25 | Lapsed in a contracting state [announced via postgrant information from national office to epo] |
Ref country code: CZ Free format text: LAPSE BECAUSE OF FAILURE TO SUBMIT A TRANSLATION OF THE DESCRIPTION OR TO PAY THE FEE WITHIN THE PRESCRIBED TIME-LIMIT Effective date: 20240221 |
|
| PG25 | Lapsed in a contracting state [announced via postgrant information from national office to epo] |
Ref country code: SK Free format text: LAPSE BECAUSE OF FAILURE TO SUBMIT A TRANSLATION OF THE DESCRIPTION OR TO PAY THE FEE WITHIN THE PRESCRIBED TIME-LIMIT Effective date: 20240221 |
|
| PG25 | Lapsed in a contracting state [announced via postgrant information from national office to epo] |
Ref country code: SM Free format text: LAPSE BECAUSE OF FAILURE TO SUBMIT A TRANSLATION OF THE DESCRIPTION OR TO PAY THE FEE WITHIN THE PRESCRIBED TIME-LIMIT Effective date: 20240221 Ref country code: SK Free format text: LAPSE BECAUSE OF FAILURE TO SUBMIT A TRANSLATION OF THE DESCRIPTION OR TO PAY THE FEE WITHIN THE PRESCRIBED TIME-LIMIT Effective date: 20240221 Ref country code: RO Free format text: LAPSE BECAUSE OF FAILURE TO SUBMIT A TRANSLATION OF THE DESCRIPTION OR TO PAY THE FEE WITHIN THE PRESCRIBED TIME-LIMIT Effective date: 20240221 Ref country code: CZ Free format text: LAPSE BECAUSE OF FAILURE TO SUBMIT A TRANSLATION OF THE DESCRIPTION OR TO PAY THE FEE WITHIN THE PRESCRIBED TIME-LIMIT Effective date: 20240221 Ref country code: CH Free format text: LAPSE BECAUSE OF NON-PAYMENT OF DUE FEES Effective date: 20240229 |
|
| U90 | Renewal fees not paid: noting of loss of rights |
Free format text: RENEWAL FEE NOT PAID FOR YEAR 08 Effective date: 20241009 |
|
| PG25 | Lapsed in a contracting state [announced via postgrant information from national office to epo] |
Ref country code: MC Free format text: LAPSE BECAUSE OF FAILURE TO SUBMIT A TRANSLATION OF THE DESCRIPTION OR TO PAY THE FEE WITHIN THE PRESCRIBED TIME-LIMIT Effective date: 20240221 |
|
| REG | Reference to a national code |
Ref country code: DE Ref legal event code: R097 Ref document number: 602017079346 Country of ref document: DE |
|
| PG25 | Lapsed in a contracting state [announced via postgrant information from national office to epo] |
Ref country code: MC Free format text: LAPSE BECAUSE OF FAILURE TO SUBMIT A TRANSLATION OF THE DESCRIPTION OR TO PAY THE FEE WITHIN THE PRESCRIBED TIME-LIMIT Effective date: 20240221 |
|
| PLBE | No opposition filed within time limit |
Free format text: ORIGINAL CODE: 0009261 |
|
| STAA | Information on the status of an ep patent application or granted ep patent |
Free format text: STATUS: NO OPPOSITION FILED WITHIN TIME LIMIT |
|
| U50 | Request for re-establishment of rights filed [unitary effect] |
Free format text: RE-ESTABLISHMENT OF RIGHTS REQUESTED DUE TO A NOTIFICATION OF LAPSE Effective date: 20241209 |
|
| PG25 | Lapsed in a contracting state [announced via postgrant information from national office to epo] |
Ref country code: IE Free format text: LAPSE BECAUSE OF NON-PAYMENT OF DUE FEES Effective date: 20240228 |
|
| 26N | No opposition filed |
Effective date: 20241122 |
|
| PG25 | Lapsed in a contracting state [announced via postgrant information from national office to epo] |
Ref country code: IE Free format text: LAPSE BECAUSE OF NON-PAYMENT OF DUE FEES Effective date: 20240228 |
|
| U1N | Appointed representative for the unitary patent procedure changed after the registration of the unitary effect |
Representative=s name: FLEUCHAUS & GALLO PARTNERSCHAFT MBB; DE |
|
| U20 | Renewal fee for the european patent with unitary effect paid |
Year of fee payment: 9 Effective date: 20250221 |
|
| PGFP | Annual fee paid to national office [announced via postgrant information from national office to epo] |
Ref country code: GB Payment date: 20250220 Year of fee payment: 9 |
|
| U20 | Renewal fee for the european patent with unitary effect paid |
Year of fee payment: 9 Effective date: 20250221 |
|
| U53 | Request for re-establishment of rights accepted [unitary effect] |
Effective date: 20250331 |
|
| PGFP | Annual fee paid to national office [announced via postgrant information from national office to epo] |
Ref country code: ES Payment date: 20250331 Year of fee payment: 9 |
|
| PG25 | Lapsed in a contracting state [announced via postgrant information from national office to epo] |
Ref country code: CY Free format text: LAPSE BECAUSE OF FAILURE TO SUBMIT A TRANSLATION OF THE DESCRIPTION OR TO PAY THE FEE WITHIN THE PRESCRIBED TIME-LIMIT; INVALID AB INITIO Effective date: 20170228 |
|
| PG25 | Lapsed in a contracting state [announced via postgrant information from national office to epo] |
Ref country code: HU Free format text: LAPSE BECAUSE OF FAILURE TO SUBMIT A TRANSLATION OF THE DESCRIPTION OR TO PAY THE FEE WITHIN THE PRESCRIBED TIME-LIMIT; INVALID AB INITIO Effective date: 20170228 |
|
| PG25 | Lapsed in a contracting state [announced via postgrant information from national office to epo] |
Ref country code: TR Free format text: LAPSE BECAUSE OF FAILURE TO SUBMIT A TRANSLATION OF THE DESCRIPTION OR TO PAY THE FEE WITHIN THE PRESCRIBED TIME-LIMIT Effective date: 20240221 |