EP3295159B1 - Meilleure mesure d'analyte de système de biocapteur - Google Patents
Meilleure mesure d'analyte de système de biocapteur Download PDFInfo
- Publication number
- EP3295159B1 EP3295159B1 EP16726185.8A EP16726185A EP3295159B1 EP 3295159 B1 EP3295159 B1 EP 3295159B1 EP 16726185 A EP16726185 A EP 16726185A EP 3295159 B1 EP3295159 B1 EP 3295159B1
- Authority
- EP
- European Patent Office
- Prior art keywords
- signal
- output signal
- secondary output
- analyte concentration
- temperature
- Prior art date
- Legal status (The legal status is an assumption and is not a legal conclusion. Google has not performed a legal analysis and makes no representation as to the accuracy of the status listed.)
- Active
Links
- 239000012491 analyte Substances 0.000 title claims description 205
- 238000005259 measurement Methods 0.000 title claims description 75
- WQZGKKKJIJFFOK-GASJEMHNSA-N Glucose Natural products OC[C@H]1OC(O)[C@H](O)[C@@H](O)[C@@H]1O WQZGKKKJIJFFOK-GASJEMHNSA-N 0.000 claims description 114
- 239000008103 glucose Substances 0.000 claims description 114
- 238000000034 method Methods 0.000 claims description 73
- 238000006243 chemical reaction Methods 0.000 claims description 57
- 230000000694 effects Effects 0.000 claims description 55
- 238000012360 testing method Methods 0.000 claims description 38
- 239000013060 biological fluid Substances 0.000 claims description 34
- 239000008280 blood Substances 0.000 claims description 27
- 210000004369 blood Anatomy 0.000 claims description 27
- 238000005534 hematocrit Methods 0.000 claims description 9
- 230000004044 response Effects 0.000 claims description 9
- 102000001554 Hemoglobins Human genes 0.000 claims description 3
- 108010054147 Hemoglobins Proteins 0.000 claims description 3
- 239000000523 sample Substances 0.000 description 75
- 238000010606 normalization Methods 0.000 description 39
- 125000002791 glucosyl group Chemical group C1([C@H](O)[C@@H](O)[C@H](O)[C@H](O1)CO)* 0.000 description 35
- 125000004122 cyclic group Chemical group 0.000 description 30
- 230000008569 process Effects 0.000 description 18
- 238000009529 body temperature measurement Methods 0.000 description 16
- 230000003287 optical effect Effects 0.000 description 16
- 238000004458 analytical method Methods 0.000 description 11
- 230000002596 correlated effect Effects 0.000 description 9
- 239000013074 reference sample Substances 0.000 description 9
- 238000000611 regression analysis Methods 0.000 description 9
- 238000013459 approach Methods 0.000 description 7
- 239000003153 chemical reaction reagent Substances 0.000 description 7
- 230000000875 corresponding effect Effects 0.000 description 7
- 238000001514 detection method Methods 0.000 description 7
- 102000004190 Enzymes Human genes 0.000 description 6
- 108090000790 Enzymes Proteins 0.000 description 6
- 238000004082 amperometric method Methods 0.000 description 6
- 239000004020 conductor Substances 0.000 description 6
- 239000000126 substance Substances 0.000 description 6
- 230000001419 dependent effect Effects 0.000 description 5
- BPYKTIZUTYGOLE-IFADSCNNSA-N Bilirubin Chemical compound N1C(=O)C(C)=C(C=C)\C1=C\C1=C(C)C(CCC(O)=O)=C(CC2=C(C(C)=C(\C=C/3C(=C(C=C)C(=O)N\3)C)N2)CCC(O)=O)N1 BPYKTIZUTYGOLE-IFADSCNNSA-N 0.000 description 4
- HVYWMOMLDIMFJA-DPAQBDIFSA-N cholesterol Chemical compound C1C=C2C[C@@H](O)CC[C@]2(C)[C@@H]2[C@@H]1[C@@H]1CC[C@H]([C@H](C)CCCC(C)C)[C@@]1(C)CC2 HVYWMOMLDIMFJA-DPAQBDIFSA-N 0.000 description 4
- 230000002452 interceptive effect Effects 0.000 description 4
- 239000000203 mixture Substances 0.000 description 4
- 238000006479 redox reaction Methods 0.000 description 4
- 230000035945 sensitivity Effects 0.000 description 4
- JVTAAEKCZFNVCJ-UHFFFAOYSA-M Lactate Chemical compound CC(O)C([O-])=O JVTAAEKCZFNVCJ-UHFFFAOYSA-M 0.000 description 3
- LEHOTFFKMJEONL-UHFFFAOYSA-N Uric Acid Chemical compound N1C(=O)NC(=O)C2=C1NC(=O)N2 LEHOTFFKMJEONL-UHFFFAOYSA-N 0.000 description 3
- TVWHNULVHGKJHS-UHFFFAOYSA-N Uric acid Natural products N1C(=O)NC(=O)C2NC(=O)NC21 TVWHNULVHGKJHS-UHFFFAOYSA-N 0.000 description 3
- 238000012546 transfer Methods 0.000 description 3
- 238000011282 treatment Methods 0.000 description 3
- 229940116269 uric acid Drugs 0.000 description 3
- RZVAJINKPMORJF-UHFFFAOYSA-N Acetaminophen Chemical compound CC(=O)NC1=CC=C(O)C=C1 RZVAJINKPMORJF-UHFFFAOYSA-N 0.000 description 2
- 238000004364 calculation method Methods 0.000 description 2
- 235000012000 cholesterol Nutrition 0.000 description 2
- 230000001276 controlling effect Effects 0.000 description 2
- 206010012601 diabetes mellitus Diseases 0.000 description 2
- 239000010432 diamond Substances 0.000 description 2
- 230000037213 diet Effects 0.000 description 2
- 235000005911 diet Nutrition 0.000 description 2
- 229940079593 drug Drugs 0.000 description 2
- 239000003814 drug Substances 0.000 description 2
- 230000007613 environmental effect Effects 0.000 description 2
- 238000012417 linear regression Methods 0.000 description 2
- 238000012544 monitoring process Methods 0.000 description 2
- 229920000642 polymer Polymers 0.000 description 2
- 102000004169 proteins and genes Human genes 0.000 description 2
- 108090000623 proteins and genes Proteins 0.000 description 2
- 230000027756 respiratory electron transport chain Effects 0.000 description 2
- CIWBSHSKHKDKBQ-JLAZNSOCSA-N Ascorbic acid Natural products OC[C@H](O)[C@H]1OC(=O)C(O)=C1O CIWBSHSKHKDKBQ-JLAZNSOCSA-N 0.000 description 1
- LFQSCWFLJHTTHZ-UHFFFAOYSA-N Ethanol Chemical compound CCO LFQSCWFLJHTTHZ-UHFFFAOYSA-N 0.000 description 1
- 102000017011 Glycated Hemoglobin A Human genes 0.000 description 1
- COLNVLDHVKWLRT-QMMMGPOBSA-N L-phenylalanine Chemical compound OC(=O)[C@@H](N)CC1=CC=CC=C1 COLNVLDHVKWLRT-QMMMGPOBSA-N 0.000 description 1
- 238000010521 absorption reaction Methods 0.000 description 1
- 238000007792 addition Methods 0.000 description 1
- 229960005070 ascorbic acid Drugs 0.000 description 1
- 235000010323 ascorbic acid Nutrition 0.000 description 1
- 239000011668 ascorbic acid Substances 0.000 description 1
- WQZGKKKJIJFFOK-VFUOTHLCSA-N beta-D-glucose Chemical compound OC[C@H]1O[C@@H](O)[C@H](O)[C@@H](O)[C@@H]1O WQZGKKKJIJFFOK-VFUOTHLCSA-N 0.000 description 1
- 239000011230 binding agent Substances 0.000 description 1
- 230000015556 catabolic process Effects 0.000 description 1
- 238000003869 coulometry Methods 0.000 description 1
- 238000006731 degradation reaction Methods 0.000 description 1
- 238000003745 diagnosis Methods 0.000 description 1
- 238000010790 dilution Methods 0.000 description 1
- 239000012895 dilution Substances 0.000 description 1
- 238000002848 electrochemical method Methods 0.000 description 1
- 230000005284 excitation Effects 0.000 description 1
- 210000003722 extracellular fluid Anatomy 0.000 description 1
- 239000000835 fiber Substances 0.000 description 1
- 239000000706 filtrate Substances 0.000 description 1
- 235000021588 free fatty acids Nutrition 0.000 description 1
- 108091005995 glycated hemoglobin Proteins 0.000 description 1
- 230000003993 interaction Effects 0.000 description 1
- 210000002977 intracellular fluid Anatomy 0.000 description 1
- 150000002576 ketones Chemical class 0.000 description 1
- TYQCGQRIZGCHNB-JLAZNSOCSA-N l-ascorbic acid Chemical compound OC[C@H](O)[C@H]1OC(O)=C(O)C1=O TYQCGQRIZGCHNB-JLAZNSOCSA-N 0.000 description 1
- 238000012886 linear function Methods 0.000 description 1
- 150000002632 lipids Chemical class 0.000 description 1
- 239000007788 liquid Substances 0.000 description 1
- 238000004519 manufacturing process Methods 0.000 description 1
- 239000000463 material Substances 0.000 description 1
- 238000012986 modification Methods 0.000 description 1
- 230000004048 modification Effects 0.000 description 1
- 230000003647 oxidation Effects 0.000 description 1
- 238000007254 oxidation reaction Methods 0.000 description 1
- 229960005489 paracetamol Drugs 0.000 description 1
- COLNVLDHVKWLRT-UHFFFAOYSA-N phenylalanine Natural products OC(=O)C(N)CC1=CC=CC=C1 COLNVLDHVKWLRT-UHFFFAOYSA-N 0.000 description 1
- 210000002381 plasma Anatomy 0.000 description 1
- 238000004313 potentiometry Methods 0.000 description 1
- 239000002244 precipitate Substances 0.000 description 1
- 238000012545 processing Methods 0.000 description 1
- 230000000750 progressive effect Effects 0.000 description 1
- 238000011002 quantification Methods 0.000 description 1
- 230000009467 reduction Effects 0.000 description 1
- 238000007670 refining Methods 0.000 description 1
- 210000003296 saliva Anatomy 0.000 description 1
- 239000004065 semiconductor Substances 0.000 description 1
- 210000002966 serum Anatomy 0.000 description 1
- 230000002277 temperature effect Effects 0.000 description 1
- 238000002834 transmittance Methods 0.000 description 1
- 150000003626 triacylglycerols Chemical class 0.000 description 1
- 210000002700 urine Anatomy 0.000 description 1
- 238000004832 voltammetry Methods 0.000 description 1
Images


Classifications
-
- G—PHYSICS
- G01—MEASURING; TESTING
- G01N—INVESTIGATING OR ANALYSING MATERIALS BY DETERMINING THEIR CHEMICAL OR PHYSICAL PROPERTIES
- G01N27/00—Investigating or analysing materials by the use of electric, electrochemical, or magnetic means
- G01N27/26—Investigating or analysing materials by the use of electric, electrochemical, or magnetic means by investigating electrochemical variables; by using electrolysis or electrophoresis
- G01N27/28—Electrolytic cell components
- G01N27/30—Electrodes, e.g. test electrodes; Half-cells
- G01N27/327—Biochemical electrodes, e.g. electrical or mechanical details for in vitro measurements
- G01N27/3271—Amperometric enzyme electrodes for analytes in body fluids, e.g. glucose in blood
- G01N27/3274—Corrective measures, e.g. error detection, compensation for temperature or hematocrit, calibration
-
- G—PHYSICS
- G01—MEASURING; TESTING
- G01N—INVESTIGATING OR ANALYSING MATERIALS BY DETERMINING THEIR CHEMICAL OR PHYSICAL PROPERTIES
- G01N27/00—Investigating or analysing materials by the use of electric, electrochemical, or magnetic means
- G01N27/26—Investigating or analysing materials by the use of electric, electrochemical, or magnetic means by investigating electrochemical variables; by using electrolysis or electrophoresis
- G01N27/28—Electrolytic cell components
- G01N27/30—Electrodes, e.g. test electrodes; Half-cells
- G01N27/327—Biochemical electrodes, e.g. electrical or mechanical details for in vitro measurements
- G01N27/3271—Amperometric enzyme electrodes for analytes in body fluids, e.g. glucose in blood
- G01N27/3272—Test elements therefor, i.e. disposable laminated substrates with electrodes, reagent and channels
-
- G—PHYSICS
- G01—MEASURING; TESTING
- G01N—INVESTIGATING OR ANALYSING MATERIALS BY DETERMINING THEIR CHEMICAL OR PHYSICAL PROPERTIES
- G01N27/00—Investigating or analysing materials by the use of electric, electrochemical, or magnetic means
- G01N27/26—Investigating or analysing materials by the use of electric, electrochemical, or magnetic means by investigating electrochemical variables; by using electrolysis or electrophoresis
- G01N27/28—Electrolytic cell components
- G01N27/30—Electrodes, e.g. test electrodes; Half-cells
- G01N27/327—Biochemical electrodes, e.g. electrical or mechanical details for in vitro measurements
- G01N27/3275—Sensing specific biomolecules, e.g. nucleic acid strands, based on an electrode surface reaction
Definitions
- Biosensor systems provide an analysis of a biological fluid sample, such as blood, serum, plasma, urine, saliva, interstitial, or intracellular fluid.
- a biological fluid sample such as blood, serum, plasma, urine, saliva, interstitial, or intracellular fluid.
- the systems include a measurement device (also referred to as a meter) that analyzes a sample residing in a test sensor (also referred to as a test strip or a sensor strip).
- the sample usually is a biological fluid, though may be a derivative, such as an extract, a dilution, a filtrate, or a reconstituted precipitate (as used from here on in, the term "biological fluid” includes derivatives thereof).
- the analysis performed by the biosensor system may determine the presence and/or concentration of one or more analytes, such as alcohol, glucose, uric acid, lactate, cholesterol, bilirubin, free fatty acids, triglycerides, proteins, ketones, phenylalanine or enzymes, in the biological fluid, which may be useful in the diagnosis and/or treatment of certain conditions.
- analytes such as alcohol, glucose, uric acid, lactate, cholesterol, bilirubin, free fatty acids, triglycerides, proteins, ketones, phenylalanine or enzymes
- a person with diabetes may use a biosensor system to determine the A1c (glycated hemoglobin) or glucose level in blood for adjustments to diet and/or medication.
- A1c glycogenated hemoglobin
- THb total hemoglobin
- A1c level %-A1c
- %-A1c is a reflection of the state of glucose control in a patient, providing insight into the average glucose control over the two to three months preceding the test.
- an accurate measurement of %-Ale provides a better indication of how well the individual is controlling blood glucose levels with diet and/or medication over a longer term than an instantaneous measure of blood glucose level, which only indicates blood glucose control at the time the measurement is made.
- Biosensor systems may be designed to analyze one or more analytes and may use different volumes of biological fluids. Some systems may analyze a single drop of blood, such as in a range of 0.25-15 microliters ( ⁇ L) in volume. Biosensor systems may be implemented using bench-top, portable, and other types of measurement devices. Portable measurement devices may be hand-held and allow for the identification and/or quantification of one or more analytes in a sample.
- Examples of portable measurement systems include the Contour ® meters of Bayer HealthCare (Whippany, New Jersey), while examples of bench-top measurement systems include the Electrochemical Workstation available from CH Instruments in Austin, Texas, and the bench-top model "YSI 2300 STAT Plus TM Glucose & Lactate Analyzer," and related models from the Yellow Springs Instrument Company, now known as YSI Inc. (referred to herein as "YSI" reference values).
- the test sensor may be adapted for use outside, inside, or partially inside a living organism.
- a sample of the biological fluid may be introduced into a sample reservoir in the test sensor, and the test sensor may be placed in the measurement device before, after, or during the introduction of the sample for analysis.
- the test sensor may be continually immersed in the sample, or the sample continuously flowed through the test sensor, such as for continuous monitoring; or the sample may be intermittently introduced to or flowed through the test sensor, such as for intermittent monitoring.
- the test sensor may include a reservoir that partially isolates a volume of the sample or be open to the sample. When open, the test sensor may take the form of a fiber or other structure placed in contact with the biological fluid.
- Biosensor systems typically provide one or more primary input signals (collectively referred to as the primary input signal) to a sample of biological fluid, and measure one or more primary output signals (collectively referred to as the primary output signal) generated from the sample to determine the analyte concentration.
- the primary output signal is generated as a result of an interaction between the primary input signal and the analyte, or between the primary input signal and a species indicative of the analyte, and is typically correlated with the analyte concentration.
- Biosensor systems may use optical and/or electrochemical methods to analyze the biological fluid.
- the primary input signal is typically a light beam generated from a light source, giving rise to a measurement of a sample's transmittance or reflectance of the light beam.
- the analyte or species indicative of the analyte may absorb or shift the wavelength of the incident light beam (primary input signal), so that the resulting primary (light) output signal has reduced intensity or is wavelength-shifted with respect to the primary input signal.
- a chemical indicator may fluoresce or emit light in response to the analyte when illuminated by a primary (light) input signal).
- the measured primary (light) output signal) may be converted into an electrical output signal, such as current or potential, and the system measures the primary (light) output signal and correlates the primary output signal with the analyte concentration of the sample.
- the analyte concentration of the sample is determined from an electrical signal generated by a redox reaction of the analyte or of a measurable species responsive to the analyte concentration when a primary (electrical) input signal is applied to the sample.
- the primary input signal may be a potential or current and may be constant, variable, or a combination thereof such as when an AC signal is applied with a DC signal offset.
- the primary input signal may be applied as a single pulse or in multiple pulses, sequences, or cycles.
- An enzyme or similar species may be added to the sample to enhance the electron transfer from the analyte during the redox reaction.
- the enzyme or similar species may react with a single analyte, thus providing specificity to a portion of the generated output signal.
- a redox mediator may be used as the measurable species to maintain the oxidation state of the enzyme and/or assist with electron transfer from the analyte to an electrode.
- an enzyme or similar species may transfer electrons between the analyte and the redox mediator, while the redox mediator transfers electrons between itself and an electrode of the test sensor.
- the measurement device of an electrochemical biosensor system applies a primary input signal through the electrical contacts to the electrical conductors of the test sensor.
- the electrical conductors convey the primary input signal through the electrodes into the sample present in the sample reservoir.
- the redox reaction of the analyte generates a primary (electrical) output signal in response to the primary input signal.
- the primary (electrical) output signal from the test sensor may be a current (as generated by amperometry or voltammetry), a potential (as generated by potentiometry/galvanometry), or an accumulated charge (as generated by coulometry).
- the measurement device may have the processing capability to measure and correlate the primary output signal with the presence and/or concentration of one or more analytes in the sample.
- the conversion of the primary output signal to indicate the presence and/or concentration of the target analyte(s) is typically accomplished using a conversion function.
- a conversion function is a calculation method that converts the primary output signal to a concentration of the target analyte(s).
- a conversion function may involve using a reference correlation between the primary output signal and the analyte concentration with a linear, nonlinear, or polynomial relationship.
- the conversion function reflects a correlation under a set of assumptions regarding the conditions of the testing and sample, and deviations from these assumptions may introduce error in the calculated analyte concentration.
- the generation and measurement of the primary output signal is designed to be primarily responsive to the analyte(s) concentration that is the target or objective of the biosensor measurement, but the measured primary output signal inevitably also includes contributions from extraneous stimuli, such as deviations from the assumptions underlying the correlation.
- extraneous stimuli include those arising from physical or environmental characteristics of the sample, such as interfering substances (e.g., hematocrit (Hct), acetaminophen, lipids, proteins, ascorbic acid, uric acid, etc.
- test sensor lots such as changes in the amount and/or activity of the reagents, changes in the electrode area and/or spacing, and the like; etc.
- Extraneous stimuli affect both the accuracy and precision of the measurement and analysis of the target analyte(s). Such erroneous measurements can cause frustration for the biosensor system's end user, who may need to discard test sensors and provide additional samples in order to repeat measurements, and who also may face uncertain treatment choices because of the inaccurate information. Thus, there has been an ongoing need to quantify and offset the effects of extraneous stimuli in order to remove or minimize those effects from the target analyte concentration.
- a secondary output signal that is either extracted from the primary output signal, or measured by dedicated means or a dedicated detection channel.
- a secondary output signal due to an interfering substance such as Hct
- Hct an interfering substance
- the primary output signals such as, for example, the current ratios of R4/3, R5/4 and R6/5 disclosed in PCT Publication No. WO 2009/108239 entitled, "Slope-Based Compensation” and the potential sequence of gated amperometry with a Hct pulse disclosed in PCT Publication No.
- a secondary output signal due to an interfering substance such as THb
- a dedicated optical channel focused at a wavelength or an angle indicative of the interfering substance such as, for example, the reflectance measurements disclosed in PCT Publication No.
- the secondary output signal may be correlated with a value for the extraneous stimulus; for example, a temperature sensor incorporated into a biosensor system may measure a secondary output signal due to temperature and correlate that secondary output signal with a temperature value, thus providing a separate measurement of the ambient temperature of the sample.
- secondary output signal may describe the raw signal extracted from the primary output signal or measured by a dedicated sensor, electrode, detection channel or the like, or may describe the extraneous stimulus value correlated with the raw signal, depending on the context of the particular measurement or calculation being done.
- the conversion function used to convert the primary output signal to analyte concentration may utilize the secondary output signals to compensate for the effects of those extraneous stimuli.
- the measured temperature value may be used to compensate the primary output signal to more accurately determine the analyte concentration, as discussed, for example, in U.S. Patent No. 7,781,222 ("Temperature-Adjusted Analyte Determination for Biosensor System").
- the conversion function may involve a multivariable regression with secondary output signals, as discussed, for example, in U.S. Patent No. 8,744,776 ("Method of Determining Analyte Concentration Based on Complex Index Functions") and PCT Publication No.
- WO 2011/119533 A1 Residual Compensation for a Biosensor
- Normalization may also be used to remove or minimize the effect of extraneous stimuli from the primary output signal, as discussed, for example, in PCT Publication No. WO 2014/159077 A1 ("Normalized Calibration of Analyte Concentration Determinations").
- the temperature measured by a temperature sensor incorporated in a biosensor system is assumed to reflect the temperature of the biological fluid sample, but that assumption may fail under certain operating conditions, such as when a hand-held measuring device is kept in a car during winter weather (e.g., 0°-10°C) or summer weather (e.g., 40°-45°C) and then used immediately with a test sensor that had been kept indoors at room temperature ( e . g ., 22°-25°C).
- a Hct signal measurement may itself be erroneous due, for example, to a failure of a dedicated electrode.
- Document GB 2 512 842 A discloses determining a first and second response of a sensor to calibration based on temperature.
- Document WO 2012/059743 A2 discloses using an optical gas absorption sensor in conjunction with making multiple measurements at different LED and photodiode temperatures and different concentrations of analyte gas.
- US 2011/203942 A1 discloses a sensor chip that uses temperature electrodes and a direct current voltage to reduce the effect of hematocrit on a temperature measurement.
- Document WO 2014/159077 A1 discloses the determination of an analyte concentration by measuring two quantified extraneous stimulus values.
- the present disclosure provides a method of determining an analyte concentration in a biological fluid sample.
- a primary output signal that is primarily responsive to the analyte concentration is measured, and a secondary output signal that is responsive to an extraneous stimulus that affects the primary output signal is generated.
- a secondary output signal is back-calculated based on the measured primary output signal, and the generated secondary output signal is adjusted using the back-calculated secondary output signal.
- the measured primary output signal is converted to an analyte concentration using a conversion function with the adjusted secondary output signal used to compensate for the effect of the extraneous stimulus on the measured output signal.
- the present disclosure provides a method of compensating an analyte measurement in an off-condition by measuring a primary output signal that is primarily responsive to the analyte concentration in a biological fluid sample and generating a secondary output signal that is responsive to an extraneous stimulus that affects the primary output signal.
- the measured primary output signal is converted to a preliminary analyte concentration using a conversion function with the generated secondary output signal to compensate for the effect of the extraneous stimulus on the measured primary output signal.
- a first back-calculated secondary output signal is determined based on the measured primary output signal and the preliminary analyte concentration.
- a first adjusted secondary output signal is determined using the first back-calculated secondary output signal to adjust the generated secondary output signal.
- the measured primary output signal is converted to a first analyte concentration value using the conversion function with the first adjusted secondary output signal to compensate for the effect of the extraneous stimulus on the primary output signal.
- a second back-calculated secondary output signal is determined based on the measured primary output signal and the first analyte concentration value; if an off-condition is determined to exist based on the first and second back-calculated secondary output signals, then a second adjusted secondary output signal is determined using the second back-calculated secondary output signal to adjust the first adjusted secondary output signal, and the measured primary output signal is converted to a second analyte concentration value using the conversion function and the second adjusted secondary output signal to compensate for the effect of the extraneous stimulus on the measured primary output signal.
- the present disclosure provides a method of compensating an analyte measurement in an off-temperature condition by measuring a primary output signal and generating a temperature measurement using a temperature sensor.
- the measured primary output signal is converted into a preliminary analyte concentration using a conversion function with the temperature measurement to compensate for the effect of temperature on the measured primary output signal.
- a first back-calculated temperature is determined from the measured primary output signal and the preliminary analyte concentration. If an off-temperature condition is determined to exist, then the temperature measurement is adjusted using the first back-calculated temperature, and the measured primary output signal converted into a first analyte concentration using the conversion function with the first adjusted temperature to adjust for the effect of the temperature on the measured primary output signal.
- the present disclosure provides a biosensor system for implementing one or more of the methods disclosed herein.
- the present disclosure introduces a concept of back-calculating a secondary output signal based on the measured primary output signal and using the back-calculated secondary output signal to help compensate for the effect of an extraneous stimulus on the primary output signal in an analyte determination.
- a back-calculated secondary output signal based on the measured primary output signal better reflects the effect of the extraneous stimulus under the actual conditions under which the primary output signal was measured, and so may be used to determine when an off-condition occurs and to help compensate for the errors introduced by the off-condition, thereby improving the accuracy of the analyte concentration determination.
- FIGURE 1A illustrates a conventional approach to compensating for the effect of an extraneous stimulus in an analyte determination.
- a biosensor system makes a measurement of a primary output signal.
- the measured primary output signal is primarily responsive to an analyte concentration in a biological fluid sample, but will include responses from extraneous stimuli (such as temperature, Hct, THb, etc. ) that will affect the accuracy and precision of the analyte determination.
- the biosensor system may generate a secondary output signal that is responsive to the extraneous stimulus, for example, by extracting the secondary output signal from the measured primary output signal, or by making a separate measurement of the secondary output signal.
- the measured primary output signal and the generated secondary output signal are inputted into a conversion function that uses the generated secondary output signal to compensate the measured primary output signal for the effect of the extraneous stimulus while converting the measured primary output signal into an analyte concentration.
- errors may arise, for example, when the generated secondary output signal itself is in error due to a faulty detection channel, such as may occur in detecting a THb signal, or due to a failure of a dedicated electrode, such as may occur in detecting a Hct signal, or when the generated secondary output signal does not reflect the actual condition of the biological fluid sample when the primary output signal is measured, such as may occur when the measuring device's temperature sensor does not represent the temperature of the sensor/sample.
- a large error may result when compensating the measured primary output signal for the effect of the extraneous stimulus, and so may compromise the accuracy of the analyte concentration determination.
- FIGURE 1B illustrates a cyclic approach, according to this present disclosure, for compensating for the effect of an extraneous stimulus in an analyte determination.
- the cyclic process may begin as above, with a measured primary output signal and a generated secondary output signal being inputted into a conversion function to determine a preliminary analyte concentration. The process then generates a new input to cycle back into the conversion function to better compensate for the effect of the extraneous stimulus.
- This cyclic process involves back-calculating a secondary output signal based on the measured primary output signal using, for example, the measured primary output signal itself, the preliminary analyte concentration and/or other information derived from the measured primary output signal and/or preliminary analyte concentration.
- the back-calculated secondary output signal is used to adjust the generated secondary output signal by, for example, adding a portion of the back-calculated secondary output signal or a parameter that depends on the back-calculated secondary output signal to the generated secondary output signal, or replacing the generated secondary output signal with the back-calculated secondary output signal.
- the adjusted secondary output signal (along with the measured primary output signal) is inputted into the conversion function to determine a first compensated analyte concentration. This cyclic process may be implemented for one cycle, or multiple cycles, for example, for a predetermined number of cycles, or until certain criteria are satisfied.
- the adjusted secondary output signal that is inputted into the conversion function better reflects the actual conditions under which the primary output signal was measured and also helps correct for errors in the generated secondary output signal.
- cyclic processes of the present disclosure may provide improved accuracy of analyte determinations.
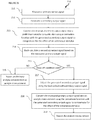
- FIGURES 2A-2D illustrate some steps involved in different implementations of a cyclic process according to the present disclosure.
- FIGURE 2A shows a flow chart 200 illustrating some steps in a one-cycle implementation of a method of determining an analyte concentration according to the present disclosure.
- a primary output signal is measured at step 201.
- the primary output signal is designed to be primarily responsive to the analyte concentration.
- a secondary output signal is generated.
- the secondary output signal is responsive to an extraneous stimulus that affects the measured primary output signal and may be generated, for example, by extracting the secondary output signal from the measured primary output signal (such as, for example, extracting the current ratios of R4/3, R5/4 and R6/5 as secondary output signals responsive to Hct levels, as disclosed in PCT Publication No.
- Steps 201 and 202 may be performed in any order, or may occur simultaneously.
- a back-calculated secondary output signal is determined based on the measured primary output signal using the measured primary output signal itself and/or information derived from the measured primary output signal, such as a preliminary analyte concentration.
- the back-calculated secondary output signal is used to adjust the secondary output signal generated by the biosensor system.
- the measured primary output signal is converted into the analyte concentration using a conversion function with the adjusted secondary output signal (from step 204) being used to compensate for the effect of the extraneous stimulus on the measured primary output signal.
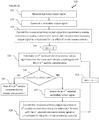
- FIGURE 2B shows a flow chart 210 illustrating some steps in a one-cycle implementation of a method of compensating an analyte measurement in an off-condition according to the present disclosure.
- a primary output signal is measured at step 211, and a secondary output signal generated at step 212. Steps 211 and 212 may be performed in any order, or may occur simultaneously.
- the measured primary output signal is converted into a preliminary analyte concentration using a conversion function with the generated secondary output signal used to compensate for the effect of an extraneous stimulus on the measured primary output signal.
- Step 214 a back-calculated secondary output signal is determined based on the measured primary output signal, as will be discussed further below and with regard to FIGURES 3A-3J .
- Step 215 queries whether an off-condition exists.
- An "off-condition" may occur when the generated secondary output signal does not match the reference value assumed by a compensation method incorporated into the conversion function and/or does not match the secondary output signal expected based on the measured primary output signal; some embodiments of a method for determining whether an off-condition exists will be shown and discussed below, with reference to FIGURES 4A and 4B .
- step 216 the preliminary analyte concentration may be reported by the biosensor system as the analyte measurement.
- the generated secondary output signal is adjusted using the back-calculated secondary output signal.
- the generated secondary output signal may be replaced by the back-calculated secondary output signal; in other words, the adjusted secondary output signal may be equated to the back-calculated secondary output signal.
- a portion of the back-calculated secondary output signal may be used to adjust the generated secondary output signal.
- a portion of the difference between the back-calculated secondary output signal and the generated secondary output signal may be added to the generated secondary output signal to adjust it.
- the measured primary output signal is converted into the analyte measurement using the conversion function with the adjusted secondary output signal to compensate for the effect of the extraneous stimulus, and the analyte measurement reported in step 219.
- FIGURE 2C shows a flow chart 220 that illustrates some steps in a multiple cycle implementation of a method of compensating an analyte measurement in an off-condition according to the present disclosure.
- cyclic compensation is repeated until an off-condition no longer exists.
- a primary output signal is measured at step 221, and a secondary output signal generated at step 222.
- Steps 221 and 222 may be performed in any order, or may occur simultaneously.
- the measured primary output signal is converted into a preliminary analyte concentration using a conversion function with the generated secondary output signal used to compensate for the effect of an extraneous stimulus on the measured primary output signal.
- a counter, n may be used to keep track of the number of cycles used, and at step 224, n is set to 1.
- Step 226 queries whether an off-condition exists; some embodiments of a method for determining whether an off-condition exists will be shown and discussed below, with reference to FIGURES 4A and 4B .
- the n th back-calculated secondary output signal may be used to replace the ( n -1) th adjusted secondary output signal; in other words, the n th adjusted secondary output signal may be equated to the n th back-calculated secondary output signal.
- a portion of the n th back-calculated secondary output signal may be used to adjust the ( n -1) th generated secondary output signal.
- a portion of the difference between the n th back-calculated secondary output signal and the ( n -1) th adjusted secondary output signal may be added to the ( n -1) th adjusted secondary output signal to determine the n th adjusted secondary output signal.
- the measured primary output signal is converted to an n th analyte concentration using the conversion function with the n th adjusted secondary output signal to compensate for the effect of the extraneous stimulus.
- the cycle (steps 225-229) is repeated until the off-condition no longer exists (i.e., the query of 226 returns "NO"), at which point the ( n -1) th analyte concentration is reported as the analyte measurement (step 230).
- FIGURE 2D shows a flow chart 240 that illustrates some steps in another multiple cycle implementation of a method of compensating an analyte measurement in an off-condition according to the present disclosure.
- cyclic compensation is repeated for a pre-determined (fixed) number of cycles.
- a primary output signal is measured at step 241, and a secondary output signal generated at step 242.
- Steps 241 and 242 may be performed in any order, or may occur simultaneously.
- the measured primary output signal is converted into a preliminary analyte concentration using a conversion function with the generated secondary output signal used to compensate for the effect of an extraneous stimulus on the measured primary output signal.
- Step 244 queries whether an off-condition exists; some embodiments of a method for determining whether an off-condition exists will be shown and discussed below, with reference to FIGURES 4A and 4B .
- a counter, n may be used to keep track of the number of cycles used, and at step 245, n is set to 1.
- the n th back-calculated secondary output signal may be used to replace the ( n -1) th adjusted secondary output signal; in other words, the n th adjusted secondary output signal may be equated to the n th back-calculated secondary output signal.
- a portion of the n th back-calculated secondary output signal may be used to adjust the ( n -1) th generated secondary output signal.
- a portion of the difference between the n th back-calculated secondary output signal and the ( n -1) th adjusted secondary output signal may be added to the ( n -1) th adjusted secondary output signal to determine the n th adjusted secondary output signal.
- the measured primary output signal is converted to an n th analyte concentration using the conversion function with the n th adjusted secondary output signal to compensate for the effect of the extraneous stimulus.
- a secondary output signal may be back-calculated from the measured primary output signal in different ways, such as using a correlation of the secondary output signal to a parameter or other information derived from the measured primary output signal.
- temperature may be back-calculated using a correlation between temperature and the decay constant parameter from a gated amperometry measurement, as discussed, for example, in U.S. Patent No. 8,425,757 .
- Another way of back-calculating a secondary output signal uses a correlation between the secondary output signals and normalized primary output signals.
- the measured primary output signal depends on a number of variables, primarily on analyte concentration but also on extraneous stimuli such as %-Hct, THb value, temperature, etc. Normalization reduces the dependency of the primary output signal from these many variables to fewer variables, preferably to just one variable.
- PCT Publication No. WO 2014/159077A1 entitled “Normalized Calibration of Analyte Concentration Determinations," provides a more detailed discussion of normalization generally.
- Normalization of the primary output signal to eliminate the dependency of the primary output signal on analyte concentration so that the primary output signal becomes dependent on an extraneous stimulus only may be accomplished by various methods.
- the primary output signal may be normalized by dividing the primary output signal by a unity function value of the analyte concentration; alternatively, a normalization function may be generated, and a ratio of the primary output signal to the normalization function value used as the normalized primary output signal.
- FIGURES 3A-3J illustrate some ways to generate a normalization function and a normalized primary output signal that has had its dependency on analyte concentration eliminated and is dependent only on a secondary output signal. Back-calculating the secondary output signal may be accomplished using a correlation between the secondary output signal and normalized primary output signal.
- FIGURE 3K shows a flowchart that summarizes some steps illustrated in FIGURES 3A-3I for generating a normalization function and normalized calibration information that may be used to back-calculate a secondary output signal.
- FIGURES 3A-3D illustrate some aspects of normalization as applied to normalize a primary output signal that is primarily responsive to glucose concentration to be dependent on temperature only.
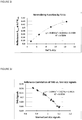
- FIGURE 3A shows a plot of glucose signal (the primary output signal in this example) as a function of temperature (the secondary output signal in this example) at three glucose concentrations.
- the glucose signals (reported as the ending current at 5.2 seconds in a gated amperometry potential sequence, "Currents at 5.2s (mV)") were measured from YSI glucose reference samples (glucose level of 78.4 mg/dL ( ⁇ ), 329.5 mg/dL ( ⁇ ), and 559.8 mg/dL( ⁇ )) are plotted against the temperature as measured by the temperature sensor in the meter ("Temperature, C").
- the sensor/sample temperature and the meter temperature were kept the same.
- a line is fitted through the plotted data for each YSI glucose reference sample, and the corresponding regression equation for each line also shown in FIGURE 3A .
- FIGURE 3B shows the glucose signals extrapolated to a designated temperature (22°C; see the vertical dashed line in FIGURE 3A ) and plotted against the reference glucose concentrations.
- the extrapolated glucose signal values were obtained by inputting the designated temperature (22°C) into the regression equations for each YSI glucose reference sample, resulting in the following three extrapolated values: 65.77, 316.86 and 553.12 (current counts, mV).
- a line is fitted through the extrapolated values plotted in FIGURE 3B and a regression analysis performed to produce a normalization function shown as follows (Eq.
- y 1.0122 x ⁇ 14.577
- y corresponds to the primary output signal value that may be used as a normalization function value
- x corresponds to glucose (analyte) concentration.
- the regression equation is a linear function of analyte concentration, but in other embodiments, the regression equation may be a polynomial or other type of function.
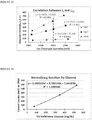
- FIGURE 3C plots normalized glucose signals ("Normalized Currents") against temperature (“Temperature, C”), which establishes the correlation between the normalized primary output signals and temperature.
- FIGURE 3C includes normalized glucose signals determined by two different normalization methods. Normalized glucose signals determined as a ratio of the measured glucose signals (i 5.2 ) to the unity function value of the known YSI reference glucose concentration value (i.e., a normalization current value taken at the numerical value of the known analyte concentration) are plotted using diamonds ( ⁇ ). Normalized glucose signals plotted using open squares ( ⁇ ) were determined by dividing the measured glucose signals (i 5.2 ) by the normalization function values for the known YSI reference glucose concentration values (x) determined by Eq. (1).
- normalized glucose signals and temperature may be used as normalized calibration information to back-calculated temperature (secondary output signal) by normalizing the measured glucose (primary output) signal to the normalization value derived from a corresponding glucose (analyte) concentration and applying the normalized calibration information to the normalized glucose (primary output) signal.
- FIGURE 3D shows the estimated accuracy of temperatures back-calculated using Equations (4) and (5).
- FIGURES 3E-3G illustrate some aspects of normalization as applied to normalize a primary output signal that is primarily responsive to glucose concentration to be dependent on Hct signal (secondary output signal) only.
- FIGURE 3E shows a plot of glucose signal (i G , the primary output signal in this example) as a function of Hct signal (i Hct , the secondary output signal in this example) at three glucose concentrations.
- the glucose signals (reported as the ending current at 5.2 seconds in a gated amperometry potential sequence, "Glucose Currents, i_5.2s") from each of the YSI glucose reference samples (glucose level of 74.9 mg/dL ( ⁇ ), 348.7 mg/dL ( ⁇ ), and 528.3 mg/dL( ⁇ )) are plotted against the Hct signals as measured by a dedicated Hct electrode ("Hct Electrode Currents (mV)").
- the expected average Hct current count is 2500 mV for 20% Hct, 2000 mV for 42% Hct, 1680 mV for 60% Hct and 1150 mV for 70% Hct, and both i G and i Hct decrease with increasing %Hct.
- FIGURE 3F shows glucose signals extrapolated to a designated value for the Hct Electrode Current (2000 mV; see vertical dashed line in FIGURE 3E ) and plotted against the YSI reference glucose levels (mg/dL).
- the extrapolated glucose signal values were obtained by inputting the designated Hct signal value (2000 mV) into the regression equation for each YSI reference glucose sample, resulting in the following three extrapolated values: 70.01, 352.8 and 585.7.
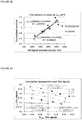
- FIGURE 3G plots normalized glucose signals ("Normalized currents") against Hct signal (mV), which establishes the correlation between the normalized glucose signals and Hct signal.
- FIGURE 3G includes normalized glucose signals determined by two different normalization methods. Normalized glucose signals determined as a ratio of the measured glucose signal (i 5.2 ) to the unity function value of the known YSI reference glucose concentration (i.e., a normalization current value taken at the numerical value of the known analyte concentration) are plotted using diamonds ( ⁇ ). Normalized glucose signals plotted using open squares ( ⁇ ) were determined by dividing the measured glucose signal (i 5.2 ) by the normalization function values for the known analyte concentration values (x) determined by Eq. (6).
- Equations (7) and (8) show the relationship between normalized glucose signals and Hct signal. Equations (7) and (8) may be rewritten to express Hct signal as a function of normalized glucose signal and used as normalized calibration information to back-calculate Hct (secondary output) signal by inputting the normalized measured glucose (primary output) signal corresponding to a glucose (analyte) concentration.
- FIGURES 3H-3J illustrate some aspects of normalization as applied to normalize a primary output signal that is primarily responsive to %-Alc level to be dependent on THb signal (secondary output signal) only.
- FIGURE 3H shows a plot of A1c signals (R A1c , the primary output signal in this example) as a function of THb signal (R THb , the secondary output signal in this example) at four %-Alc levels.
- the A1c signals (reported as reflectance of a first wavelength measured from a first detection zone using a laminar flow A1c biosensor system) from each of the reference samples (%A1c level of 4.8 ( ⁇ ), 6.5 ( ⁇ ), 9( ⁇ ) and 12.3 ( ⁇ )) are plotted against THb signals (measured as reflectance of a second wavelength from a second detection zone). Curves are fitted through data from each reference sample, and regression equations corresponding to each curve are also shown.
- FIGURE 3I shows the A1c signals extrapolated to a THb reflectance signal (R THb ) value of 0.7, which corresponds to an average THb concentration ( ⁇ 150 mg/mL) (see vertical dashed line in FIGURE 3H ), plotted against the reference %-Alc level.
- the extrapolated A1c signal values were obtained by inputting the R THb designated value (0.7) into the regression equation for each %-Alc reference sample, resulting in the following four extrapolated values: 0.31602, 0.35704, 0.40483 and 0.43732.
- a regression analysis of the extrapolated A1c signal data plotted in FIGURE 3I generates the normalization function (Eq.
- FIGURE 3J plots THb signals values against the normalized A1c signals , ,which establishes the correlation between THb signals and normalized A1c signals.
- the normalized A1c signals plotted in FIGURE 3J were determined as a ratio of the measured A1c signal to the normalization function value for the known analyte concentration values (x) determined by Eq. (9).
- FIGURE 3K summarizes some steps for one embodiment of generating a normalization function and normalized calibration information that may be used to back-calculate a secondary output signal in accordance with the present disclosure.
- a biosensor system is used to measure reference primary output signals from a plurality of reference samples at step 301.
- the reference primary output signals are primarily responsive to a primary stimulus, and each reference sample is associated with a known value of the primary stimulus.
- the biosensor system generates a secondary output signal for each measured reference primary output signal.
- the generated secondary output signal is responsive to an extraneous stimulus that affects the measured reference primary output signal.
- Steps 301 and 302 may be performed in any order, or may occur simultaneously.
- the measured reference primary output signals for each reference sample are correlated to the generated secondary output signals (from step 302).
- a regression analysis may be performed on the correlated data from step 303 to generate a regression equation that relates measured reference primary output signal to generated secondary output signal.
- a reference primary output signal value is extrapolated to a designated value of the secondary output signal.
- the designated value of the secondary output signal is typically a value around the mid-point of the range of generated secondary output signals (from step 302); however, any value within the range of generated secondary output signals may be used as the designated value to which a reference primary output signal value is extrapolated.
- the first regression equation may be used to extrapolate the reference primary output signal value by inputting the designated value of the secondary output signal.
- the extrapolated reference primary output signal values are correlated to their known primary stimulus values in order to generate a normalization function by, for example, regression analysis of the correlated data.
- the normalization function is then used, at step 306, to normalize each measured reference primary output signal at its corresponding known primary stimulus value. Normalization is typically carried out by dividing the measured primary output signal by a normalization function value. In this embodiment, the normalization function value is determined by inputting the known primary stimulus value into the normalization function generated at step 305.
- the normalized reference primary output signals are correlated to the generated secondary output signals (from step 302) to generate normalized calibration information.
- This normalized calibration information may be used in some embodiments of the present disclosure in order to back-calculate a secondary output signal based on the measured primary output signal.
- the normalized calibration information may be represented as a regression equation that relates normalized primary output signals to secondary output signals and results from a regression analysis of the correlated data from step 307.
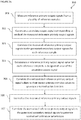
- FIGURES 4A-4B illustrate different embodiments to determine whether an off-condition exists.
- the flow chart 400 in FIGURE 4A illustrates some steps in determining whether an off-condition exists based on a difference between the generated secondary output signal and a reference value for the extraneous stimulus established during calibration of the biosensor system.
- the standard reference correlation of the primary output signal to analyte concentration is typically established at a reference temperature (such as 25°C) and a reference hematocrit level (such as 42%).
- the effect of temperature or hematocrit on the primary output signal is typically compensated by the conversion function so that the analyte concentration is reported at the reference temperature and hematocrit level values.
- the difference between the generated secondary output signal and the reference value is too large, an off-condition may exist and the typical compensation methods may introduce additional error into the analyte determination.
- a biosensor system In implementing the steps shown in the flow chart 400 , a biosensor system generates a secondary output signal at step 401 and determines a difference between the generated secondary output signal and a reference value at step 402. Step 403 queries whether the absolute value of the difference determined at step 402 is greater than or equal to a threshold value.
- a difference between an n th adjusted secondary output signal, or an n th back-calculated secondary output signal, and a reference value may be determined, and an off-condition may exist when the absolute value of this difference is greater than or equal to the threshold value.
- the threshold value is typically set depending on the sensitivity desired for detecting an off-condition, and may be varied (for example, progressively reduced) from one cycle to the next.
- step 403 If the query of step 403 returns "NO”, then an off-condition does not exist (as shown at 404). If the query of step 403 returns "YES”, then an off-condition does exist (as shown at 405), and, in some implementations, a notification of the off-condition may be provided at step 406.
- the notification may take any form, for example, a warning message on a display incorporated with the biosensor system, a red light indicator on the biosensor system indicating that an error may exist, and the like.
- the notification may also include instructions for correcting the off-condition or to repeat the measurement.
- the flow chart 410 of FIGURE 4B illustrates some steps in determining whether an off-condition exists based on a difference between the generated secondary output signal and an expected extraneous stimulus value based on the measured primary output signal.
- a biosensor system measures a primary output signal and generates a secondary output signal. Steps 411 and 412 may be performed in any order, or may occur simultaneously.
- a back-calculated secondary output signal is determined based on the measured primary output signal; the back-calculated secondary output signal reflects the expected extraneous stimulus value based on the measured output signal.
- a difference between the generated secondary output signal from step 412 and the back-calculated secondary output signal from step 413 is determined.
- Step 415 queries whether the absolute value of the difference determined at step 414 is greater than or equal to a preset value.
- a difference between an n th back-calculated secondary output signal and an ( n -1) th back-calculated, or ( n -1) th adjusted, secondary output signal and may be determined, and an off-condition may exist when the absolute value of this difference is greater than or equal to the preset value.
- the preset value is typically set depending on the sensitivity desired for detecting an off-condition, and may be varied (for example, progressively reduced) from one cycle to the next. If the query of step 415 returns "NO", then an off-condition does not exist (as shown at 416).
- an off-condition does exist (as shown at 418); in some implementations, a notification of the off-condition (as discussed previously, with regard to step 406 in FIGURE 4A ) may be provided at step 419.
- an off-condition may be determined based on a combination of the criteria discussed with regard to FIGs. 4A and 4B . That is, an off-condition may be determined to exist when the absolute value of the difference between the generated secondary output signal and the reference value is greater than or equal to a threshold value, and the absolute value of the difference between the generated secondary output signal and the back-calculated secondary output signal is greater than or equal to a preset value.
- FIGURES 5A-5C illustrate the effect of an "off-temperature condition"
- An off-temperature condition may occur, for example, when a hand-held meter is kept in a car during winter weather (e.g., 0° - 10° C) or summer weather (e.g., 40° - 45° C) and then used with a test sensor that had been kept at room temperature (e.g., 22° - 25° C). Given that heat transfer between the test sensor and the meter through the interfacing contacts is expected to be minimal within a short time, the test sensor/sample temperature is expected to remain relatively unchanged, regardless of the meter temperature.
- thermosensor When a temperature sensor or other temperature measuring device is incorporated into a biosensor system, it is assumed that the temperature measured by such device accurately reflects the temperature of the test sensor and of the sample, but such devices are typically incorporated into the meter, not the sensor. Methods that include temperature compensation for determining analyte concentration typically use the temperature measured by such devices to compensate the primary output signal. Under an off-temperature condition, however, the measured temperature may not accurately reflect the sensor/sample temperature, so temperature compensated measurements using the measured temperature will introduce error into the calculated analyte concentration.
- FIGURE 5A shows a plot of primary output signal (Currents at 5.2s (mV)) from samples with three different glucose concentrations (70, 350 and 550 mg/dL) as measured by a biosensor system at seven temperatures, with the meter and sensor/sample at the same temperature: 5°C ( ⁇ ), 10°C ( ⁇ ), 15°C (A), 25°C ( ⁇ ), 35°C ( ), 40°C ( ⁇ ) and 45°C (+).
- the measured primary output signals at different glucose concentrations varied with temperature, with the variance increasing as the concentration increases.
- Conversion functions including temperature compensation such as that discussed in U.S. Patent No. 7,781,222 ("Temperature-Adjusted Analyte Determination for Biosensor System"), have been developed to compensate for such temperature-related variances in primary output signals when converting the primary output signal into an analyte concentration.
- FIGURE 5B shows a plot of primary output signal (Current at 5.2s (mV)) from samples with four different glucose concentrations (86, 170, 335 and 564 mg/dL) as measured by a biosensor system with the sensor/sample at ⁇ 22°C and the meter stored at six different temperatures (22°C, 5°C, 10°C, 15°C, 35°C, 45°C) resulting in average temperature measurements as follows: 21.9°C ( ⁇ ), 6°C ( ⁇ ), 10.3°C ( ⁇ ), 15.7°C ( ⁇ ), 34.1°C ( ) and 43.7°C ( ⁇ ).
- the sensor/sample temperature remains relatively stable, as reflected in the measured primary output signals remaining relatively unchanged for each glucose concentration. If a conversion function with temperature compensation is applied to these data using the measured meter temperature to compensate for the effect of temperature, the measured meter temperature would introduce a potentially large error into the analyte determination.
- FIGURE 5C shows the error in glucose concentration (plotted as bias/%-bias) for data in FIGURE 5B determined using a conventional conversion function with temperature compensation due to an off-temperature condition, when the measured meter temperature does not accurately represent the sensor/sample temperature.
- the bias/%-bias data ( ⁇ ) are plotted sequentially along with the average meter temperatures ( ⁇ ) at 22°C, 5.5°C, 10.5°C, 15.5°C, 22.5°C, 34°C, 39.5°C, and 43.5°C (the sensor/sample were at ⁇ 22°C).
- the larger the difference between the sensor/sample and the measured meter temperature the larger the error in the analyte concentration.
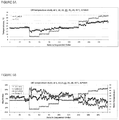
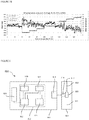
- FIGURE 6A shows back-calculated temperatures based on the primary output signals measured under off-temperature conditions (sensor/sample temperature at ⁇ 22°C; average meter temperatures at 22°C, 5.5°C, 10.5°C, 15.5°C, 22.5°C, 34°C, 39.5°C, and 43.5°C).
- the back-calculated temperatures ( ⁇ ) shown in FIGURE 6A were generated from the same data as the bias/%-bias data shown in FIGURE 5C , using the normalizing calibration information embodied by Equation (4), above (see also FIGURE 3C and accompanying text). These back-calculated temperatures are shown to be closer to the sensor/sample temperature of ⁇ 22°C than the measured meter temperatures ( ⁇ ). Furthermore, inputting the back-calculated temperatures into the same standard conversion function with temperature compensation that was used to generate the data shown in FIGURE 5C produces more accurate analyte concentration determinations with reduced error (smaller bias/%-bias), as shown in FIGURE 6B .
- FIGURE 6B shows the error in glucose concentration (plotted as bias/%-bias) determined using a one-way application of a conventional conversion function with temperature compensation as shown in FIGURE 1A ( ⁇ ) (this is the same data shown in FIGURE 5C ), a complete one cycle application of the same conventional conversion function with back-calculated temperature for compensation ( ⁇ ) (as outlined in FIGURE 2A ), and a selected one cycle application of the same conventional conversion function with back-calculated temperature for compensation applied only when an off-temperature condition is detected ( ⁇ ) (as outlined in FIGURE 2B ), plotted along with the average measured meter temperature ( ⁇ ).
- the one cycle application When applied during no off-temperature conditions (e.g., measured meter temperature ⁇ 22°C), the one cycle application had comparable error of ⁇ 10% as the conventional one-way approach; but applying compensation only during off-temperature conditions, as done in the selected one cycle application minimized the chance of producing unnecessary biases.
- no off-temperature conditions e.g., measured meter temperature ⁇ 22°C
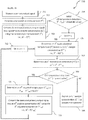
- FIGURES 7A-7B illustrate some steps and results from some embodiments of a method of compensating an analyte measurement in an off-temperature condition, using a cyclic compensation approach according to the present disclosure.
- the embodiment of a cyclic compensation process shown in FIGURE 7A includes the steps of back-calculating temperature based on a previously determined analyte concentration, determining a temperature difference between the back-calculated temperature and the temperature used for compensation in the previously determined analyte concentration, detecting an off-temperature condition using the determined temperature difference, and, if an off-temperature condition is detected, adjusting the temperature and re-calculating an analyte concentration using the adjusted temperature to compensate for the effect of temperature on the measured primary output signal; the process is repeated until no off-temperature condition is detected, at which point the determined analyte concentration is reported as the analyte measurement.
- the process begins at step 701, with a biosensor system measuring a primary output signal.
- a temperature measurement (T 0 ) is generated using the biosensor system (the superscript “0" used with "T” herein designates the temperature measurement made using the biosensor system, regardless of any subscript that may be appended to "T”).
- Steps 701 and 702 may be performed in any order, or may occur simultaneously.
- the measured primary output signal is converted into a preliminary analyte concentration (G 0 ) using a conversion function with the temperature measurement (T 0 ) to compensate for the effect of temperature on the measured primary output signal.
- an initial determination of whether an off-temperature condition may exist occurs at step 704.
- the initial determination in this embodiment is based on whether the absolute value of a difference between the temperature measurement (T 0 ) and a reference temperature (T ref ) is greater than or equal to a threshold value. For example, if the threshold value is set at 7°C, then an off-temperature condition may exist when
- the process may proceed directly to step 709 where the preliminary analyte concentration (G 0 ) may be reported as the analyte measurement.
- the threshold value may be set at any value (e.g., 10, 7, 5, 3, 2, or 1°C) depending on the sensitivity desired for detecting an off-temperature condition.
- an n th back-calculated temperature (T n ) is determined based on the ( n -1) th analyte concentration (G n -1 ).
- An off-temperature condition is detected by querying at step 708 whether the absolute value of the n th temperature difference is greater than or equal to a preset value, i.e.,
- the preset value may be set at any value (e.g., 10, 7, 5, 3, 2, or 1°C) depending on the sensitivity desired for detecting an off-temperature condition; it also may be set to progressively decrease, for example, with each cycle, or the like.
- T n adj T n ⁇ 1 adj + WC ⁇ T n
- T n adj T n ⁇ 1 adj + WC ⁇ T n
- the weighting coefficient (WC) is used to determine how much of the n th back-calculated temperature (T n ) to use to adjust the previously adjusted temperature (T n -1 adj ).
- T n -1 adj T n .
- an n th analyte concentration (G n ) is determined by converting the measured primary output signal (from step 701) using the conversion function with the n th adjusted temperature (T n adj , from step 710) to compensate for the effect of temperature on the measured primary output signal.
- steps 706-712 may be repeated until the query at 708 returns "NO" and an off-temperature condition is not detected based on the n th temperature difference ( ⁇ T n ), at which point the ( n -1) th analyte concentration (G n -1 ) is reported by the biosensor system as the analyte measurement at step 709.
- FIGURE 7B illustrate the effect of WC on a cyclic temperature compensation process applied for one cycle of steps 706 - 711 according to the implementation shown in FIGURE 7A .
- Using the back-calculated temperature to fully compensate for the effect of temperature may in some instances over-compensate for the effect of temperature, for example, at less extreme off-temperature conditions (e.g., measured meter temperature at ⁇ 35°C); thus, in some instances, it may be desirable to use WC ⁇ 1 to compensate for the effect of an extraneous stimulus in a more gradual manner.
- Table 1 shows data generated using an embodiment of a cyclic compensation method similar to that shown in the flowchart 700 of FIGURE 7A to compensate the temperature effect in an analyte determination during an off-temperature condition.
- the data in Table 1 were generated using a biosensor system, three YSI reference glucose samples (glucose concentration levels of 85.9, 169.8 and 84.0 mg/dL) and sensors stored at ⁇ 22°C and meters stored at 5°C, 22°C and 40°C.
- the back-calculated temperatures (T n ) were determined using the normalizing calibration information embodied by Equation (4), above (see also FIGURE 3C and accompanying text).
- the weighting coefficient (WC) was set equal to 1 ( i .
- T n adj T n .
- Table 1 Summary of cyclic compensation process for T n adj and G n YSI T 0 G 0 bias/ %-bias T 0 - T ref Initial Off- T Y/N? a - 85.9 21.9 87.4 1.6% -3.1 N - 169.8 5.7 201.5 18.7% -19.3 Y - 84.0 39.0 68.8 -15.2% 14.1 Y n YSI T n-1 adj G n-1 T n ⁇ T n Off- T Y/N?
- the process begins with a biosensor system measuring a primary output signal and generating a temperature measurement (T 0 ).
- a preliminary glucose concentration (G 0 ) is determined using the temperature measurement (T 0 ) to compensate for the effect of temperature on the measured primary output signal.
- an off-temperature condition may exist for YSI samples having glucose concentration levels of 169.8 and 84.0 mg/dL, but an off-temperature condition does not exist for the YSI sample having a glucose concentration of 85.9 mg/dL with a measured meter temperature of 21.9°C, so no cyclic compensation may be necessary for this sample measurement.
- the initial off-temperature criterion is not met, then no cyclic compensation is applied and back-calculating a temperature is not necessary.
- the data shown in Table 1 includes a first back-calculated temperature and
- ⁇ T 1 T 1 ⁇ T 0
- a second back-calculated temperature (T 2 ) is determined based on the first analyte concentration (G 1 ). If the preset value is kept the same, so that the same criterion of
- a third back-calculated temperature (T 3 ) is determined based on the second analyte concentration (G 2 ) for these two YSI samples (169.8 and 84.0 mg glucose/dL).
- G 2 second analyte concentration
- T 3 a third back-calculated temperature
- the preset value may be reduced further, for example, a criterion of
- a fourth back-calculated temperature (T 4 ) is determined based on the third analyte concentration (G 3 ) for the YSI sample having 84.0 mg glucose/dL. Applying the criterion of
- Table 2 shows data generated using an embodiment of a cyclic compensation method similar to that shown in flowchart 240 of FIGURE 2D to compensate the hematocrit effect in an analyte determination.
- the data in Table 2 were generated from a YSI reference sample having a glucose concentration level of 245 mg/dL and 38% Hct, using a biosensor system having a dedicated Hct electrode.
- the first line of data includes the data generated directly from the biosensor measurement (i 0 Hct , G 0 ).
- the off-condition criteria and bias/%-bias were calculated for each cycle.
- ⁇ i 1 Hct i 0 Hct - i 1 Hct
- 480.3 mV), which indicate an off-condition exists.
- the preliminary glucose concentration (G 0 ) has a %-bias of 38.3%.
- Table 2 Summary of cyclic compensation process for i 0 Hct and G n n YSI %Hct i 0 Hct G 0 (bias/ %-bias) i Hct-ref - i 0 Hct i n Hct G n (bias/ %-bias) i Hct-ref - i n Hct ⁇ i n Hct 1 245 38 791.5 338.2 (38.5%) 1208.5 1271.8 329.1 (34.6%) 728.2 480.3 2 - - - - - 1321.1 319.6 (30.7%) 678.9 49.3 3 - - - - - 1376.4 309.7 (26.7%) 623.6 55.2 4 - - - - - 1436.
- FIGURE 8 depicts a schematic representation of one embodiment of a biosensor system 800 in which the methods of the present disclosure may be implemented.
- the biosensor system 800 includes a measurement device 802 and a test sensor 804.
- the measurement device 802 may be implemented in an analytical instrument, including a bench-top device, a portable or hand-held device, or the like.
- the biosensor system 800 typically determines the analyte concentration of the sample using calibration information stored in the measurement device 802.
- the biosensor system 800 may be utilized to determine analyte concentrations, including those of glucose, A1c, uric acid, lactate, cholesterol, bilirubin, and the like. While a particular configuration is shown, the biosensor system 800 may have other configurations and may include additional components.
- the test sensor 804 typically has a base 806 that forms a reservoir 808 and a channel 810 with an opening 812.
- the reservoir 808 and the channel 810 may be covered by a lid with a vent.
- the reservoir 808 defines a partially-enclosed volume and may contain a composition that assists in retaining a liquid sample such as water-swellable polymers or porous polymer matrices.
- Reagents may be deposited in the reservoir 808 and/or the channel 810.
- the reagents may include one or more enzymes, binders, mediators, and like species, and/or a chemical indicator.
- the test sensor 804 has a sample interface 814 adjacent to the reservoir 808.
- the test sensor 804 may have other configurations.
- the sample interface 814 has conductors or contacts electrically connected to a working electrode (not shown) and a counter electrode (not shown) from which the output signal may be measured.
- the sample interface 814 also may include conductors or contacts electrically connected to one or more additional electrodes (not shown) from which secondary output signals may be measured.
- the electrodes may be substantially in the same plane or in more than one plane.
- the electrodes may be disposed on a surface of the base 806 that forms the reservoir 808. The electrodes may extend or project into the reservoir 808.
- a dielectric layer may partially cover the conductors and/or the electrodes.
- the sample interface 814 may have other electrodes and conductors and contacts.
- the sample interface 814 typically has one or more optical portals or apertures for probing the sample with light.
- the measurement device 802 includes electrical circuitry 816 connected to a sensor interface 818 and an optional display 820.
- the electrical circuitry 816 includes a processor 822 connected to a signal generator 824, a temperature sensor 826, and a storage medium 828.
- the signal generator 824 is capable of providing an electrical input signal to the sensor interface 818 in response to the processor 822.
- the electrical input signal may be used to operate or control the detector and light source in the sensor interface 818.
- the electrical input signal may be transmitted via the sensor interface 818 to the sample interface 814 to apply the electrical input signal to the sample of the biological fluid.
- the electrical input signal may be a potential or current and may be constant, variable, or a combination thereof, such as when an AC signal is applied with a DC signal offset.
- the electrical input signal may be applied continuously or as multiple excitations, sequences, or cycles.
- the signal generator 824 also may be capable of recording an output signal from the sensor interface as a generator-recorder.
- the temperature sensor 826 is capable of measuring the ambient temperature of the measurement device 802, and may be a thermister, thermometer, or other temperature sensing device.
- the storage medium 828 may be a magnetic, optical, or semiconductor memory, another storage device, or the like.
- the storage medium 828 may be a fixed memory device, a removable memory device, such as a memory card, remotely accessed, or the like.
- the storage medium 828 may store the computer-programmed instructions and calibration and other information used in the analyte measurement, analysis and/or methods of the present disclosure (such as threshold values and the preset values used to detect an off-condition).
- the storage medium 828 also may store a normalization function and/or normalized calibration information that may be used to back-calculate a secondary output signal from a measured primary output signal according to the methods of the present disclosure.
- a normalization function and/or normalized calibration information may be represented graphically, for example as shown in FIGs. 3B-3C , 3F-3G and 3I-3J , or mathematically, for example as shown in Equations (1)-(5), (6)-(8) and (9)-(10), or as a combination thereof, or the like.
- the normalization function and normalized calibration information are preferably represented as equations, which may be represented by a program number (PNA) table, another look-up table, or the like.
- PNA program number
- the processor 822 is configured to execute computer-programmed instructions to implement the analyte measurement and analysis including the methods of the present disclosure.
- the processor 822 also may be configured to interact with the signal generator 824 to, for example, provide the electrical input signal to the sensor interface 818; with the temperature sensor 826 to, for example, generate and receive a temperature measurement (T 0 ); and with the sensor interface 818 to, for example, receive a primary and/or other secondary output signal(s) from the test sensor 804.
- the primary output signal is measured using the working and counter electrodes in response to the reaction of the analyte in the sample. Secondary output signals also may be measured from additional electrodes. In optical systems, the detector or detectors of the sensor interface 818 may receive the primary and some secondary output signals.
- the processor 822 may be further configured to execute computer-programmed instructions to start the analyte measurement and analysis (including the methods of this disclosure) in response to the presence of the test sensor 804 at the sensor interface 818, the application of a sample to the test sensor 804, user input, or the like.
- the results of the analyte analysis may be outputted to the display 820, a remote receiver (not shown), and/or may be stored in the storage medium 828.
- Instructions to implement an analyte measurement may include determining an off-condition, back-calculating a secondary output signal based on a measured primary output signal, and/or cyclic compensation methods, may be provided by the computer readable software code stored in the storage medium 828.
- the code may be object code or any other code describing or controlling the described functionality.
- the data from the analyte analysis may be subjected to one or more data treatments, including the determination of decay rates, K constants, ratios, functions, and the like in the processor 822.
Claims (12)
- Procédé de détermination d'une concentration d'analyte de glucose dans un échantillon de fluide biologique sanguin par l'intermédiaire d'un système de biocapteur ayant un dispositif de mesure et un capteur de test, le procédé comprenant les étapes consistant à :mesurer un premier signal, le premier signal étant un signal de sortie primaire, à partir de l'échantillon de fluide biologique sanguin dans un réservoir du capteur de test en réponse à un signal d'entrée généré par le dispositif de mesure, le premier signal étant principalement sensible à la concentration en analyte de glucose dans l'échantillon de fluide biologique sanguin ;générer un deuxième signal, le deuxième signal étant un signal de sortie secondaire, mesuré séparément du premier signal, le deuxième signal étant sensible à un stimulus étranger de caractéristiques physiques ou environnementales de l'échantillon de fluide biologique sanguin affectant le premier signal mesuré ;rétro-calculer un troisième signal, le troisième signal étant un signal de sortie secondaire, basé sur le premier signal par l'intermédiaire d'un processeur sur le dispositif de mesure, le troisième signal étant sensible au stimulus étranger des caractéristiques physiques ou environnementales de l'échantillon de fluide biologique sanguin affectant le premier signal ;ajuster le deuxième signal en ajoutant une partie du troisième signal au deuxième signal pour dériver un quatrième signal, le quatrième signal étant un signal de sortie secondaire ajusté, par l'intermédiaire du processeur ; etconvertir le premier signal en valeur de concentration d'analyte en utilisant une fonction de conversion avec le quatrième signal pour compenser l'effet du Stimulus étranger sur le premier signal par l'intermédiaire du processeur.
- Procédé selon la revendication 1, dans lequel le stimulus étranger est l'un parmi la température, l'hématocrite (Hct) ou l'hémoglobine totale (THb).
- Procédé selon l'une quelconque des revendications 1 à 2, dans lequel le rétro-calcul du troisième signal sur la base du premier signal comprend les étapes consistant à :convertir le premier signal en une concentration préliminaire d'analyte de glucose en utilisant la fonction de conversion avec le deuxième signal pour compenser l'effet du Stimulus étranger sur le premier signal ;normaliser le premier signal mesuré par rapport à la concentration préliminaire d'analyte de glucose pour obtenir un premier signal normalisé ; etappliquer des informations d'étalonnage normalisées au premier signal normalisé, les informations d'étalonnage normalisées reliant le premier signal normalisé au signal de sortie secondaire.
- Procédé selon l'une quelconque des revendications 1 à 3, dans lequel l'ajustement du second signal comprend les étapes consistant à:déterminer une différence en soustrayant le deuxième signal du troisième signal ;déterminer une quantité d'ajustement en multipliant la différence par un coefficient de pondération, dans lequel le coefficient de pondération est un nombre positif non supérieur à 1 ; etajouter la quantité d'ajustement au deuxième signal.
- Procédé de compensation d'une mesure d'analyte de glucose dans une condition d'arrêt dans un système de biocapteur ayant un dispositif de mesure et un capteur de test, le procédé comprenant les étapes consistant à:mesurer un premier signal, le premier signal étant un signal de sortie primaire, à partir d'un échantillon de fluide biologique sanguin dans un réservoir du capteur de test en réponse à un signal d'entrée généré par le dispositif de mesure, le premier signal étant principalement sensible à une concentration d'analyte de glucose dans l'échantillon de fluide biologique sanguin ;générer un second signal, le second signal étant un signal de sortie secondaire, indépendant du premier signal mesuré, le second signal étant sensible à un stimulus étranger de caractéristiques physiques ou environnementales de l'échantillon de fluide biologique sanguin affectant le premier signal mesuré ;convertir le premier signal en une concentration préliminaire d'analyte de glucose en utilisant une fonction de conversion avec le deuxième signal pour compenser l'effet du stimulus étranger sur le premier signal mesuré via un processeur sur le dispositif de mesure ;déterminer un troisième signal, le troisième signal étant un premier signal de sortie secondaire rétro-calculé, à partir du premier signal mesuré et de la concentration d'analyte préliminaire par l'intermédiaire du processeur, le troisième signal étant sensible au stimulus étranger des caractéristiques physiques ou environnementales de l'échantillon de fluide biologique sanguin affectant le premier signal ;déterminer si une condition d'arrêt existe, dans lequel la condition d'arrêt est si la valeur absolue de la différence entre le deuxième signal et le troisième signal est supérieure ou égale à une valeur prédéfinie ; etsi la condition d'arrêt existe :déterminer un quatrième signal, le quatrième signal étant un premier signal de sortie secondaire ajusté, en ajoutant une partie du troisième signal au deuxième signal pour ajuster le deuxième signal par l'intermédiaire du processeur ; etconvertir le premier signal en une première concentration d'analyte de glucose en utilisant la fonction de conversion avec le quatrième signal pour compenser l'effet du stimulus étranger sur le premier signal mesuré par l'intermédiaire du processeur.
- Procédé selon la revendication 5, dans lequel la détermination d'un troisième signal à partir du premier signal et de la concentration préliminaire d'analyte de glucose comprend :la normalisation du premier signal par rapport à la concentration préliminaire d'analyte de glucose pour dériver un premier signal normalisé ; etl'application d'informations d'étalonnage normalisées au premier signal normalisé, les informations d'étalonnage normalisées reliant le premier signal normalisé au signal de sortie secondaire.
- Procédé selon l'une quelconque des revendications 5 à 6, dans lequel la détermination de l'existence d'une condition d'arrêt comprend les étapes consistant à :
déterminer une première différence entre le deuxième signal et le troisième signal, dans lequel la condition d'arrêt existe lorsque la valeur absolue de ladite première différence est supérieure ou égale à une première valeur prédéfinie. - Procédé selon l'une quelconque des revendications 5 à 6, dans lequel déterminer si une condition d'arrêt existe comprend :la détermination d'une deuxième différence entre le deuxième signal et une valeur de référence,dans lequel la condition d'arrêt existe lorsque la valeur absolue de ladite seconde différence est supérieure ou égale à une première valeur de seuil.
- Procédé de l'une quelconque des revendications 5 à 8, comprenant en outre les étapes consistant à:déterminer un cinquième signal, le cinquième signal étant un deuxième signal de sortie secondaire rétro-calculé, à partir du premier signal et de la première concentration d'analyte de glucose ;déterminer l'existence d'une deuxième condition d'arrêt sur la base du troisième signal ; et si la deuxième condition d'arrêt existe :déterminer un sixième signal, le sixième signal étant un deuxième signal de sortie secondaire ajusté, en utilisant le cinquième signal pour ajuster le quatrième signal ; etconvertir le premier signal en une deuxième concentration d'analyte de glucose en utilisant la fonction de conversion avec le sixième signal pour compenser l'effet du stimulus étranger sur le premier signal.
- Procédé selon la revendication 9, dans lequel la détermination d'un cinquième signal à partir du premier signal et de la première concentration d'analyte de glucose comprend :la normalisation du premier signal par rapport à la première concentration d'analyte de glucose pour dériver un premier signal normalisé ; etl'application d'informations d'étalonnage normalisées au premier signal normalisé, les informations d'étalonnage normalisées reliant le premier signal normalisé au signal de sortie secondaire.
- Système de biocapteur pour déterminer une concentration d'analyte de glucose dans un échantillon de fluide biologique sanguin, le système de biocapteur comprenant :un capteur de test ayant une base et une interface d'échantillon,la base ayant un réservoir formé à l'intérieur pour recevoir l'échantillon de fluide biologique sanguin, etl'interface d'échantillonnage étant disposée de manière adjacente au réservoir ; etun dispositif de mesure configuré pour s'interfacer avec le capteur de test et ayant une interface de capteur, un support de stockage et un processeur, le processeur étant connecté à l'interface de capteur et au support de stockage et étant configuré pour exécuter des instructions programmées par ordinateur pour :recevoir, par l'intermédiaire de l'interface du capteur, un premier signal mesuré à partir de l'échantillon de fluide biologique sanguin dans le réservoir, le premier signal étant un signal de sortie primaire, le premier signal étant principalement sensible à la concentration de l'analyte de glucose ;recevoir un deuxième signal, le deuxième signal étant un signal de sortie secondaire généré, mesuré séparément du premier signal, le deuxième signal étant sensible à un stimulus étranger de caractéristiques physiques ou environnementales de l'échantillon de fluide biologique sanguin affectant le premier signal ;retro-calculer un troisième signal, le troisième signal étant un signal de sortie secondaire, basé sur le premier signal, le troisième signal étant sensible au stimulus étranger des caractéristiques physiques ou environnementales de l'échantillon de fluide biologique sanguin affectant le premier signal ;ajuster le deuxième signal en ajoutant une partie du troisième signal au deuxième signal pour dériver un septième signal, le septième signal étant un signal de sortie secondaire généré ajusté ;
etconvertir le premier signal en concentration d'analyte de glucose en utilisant une fonction de conversion qui est stockée dans le support de stockage, dans lequel la fonction de conversion utilise le septième signal pour compenser l'effet du stimulus étranger sur le premier signal. - Système de biocapteur pour déterminer une concentration d'analyte de glucose dans un échantillon de fluide biologique sanguin dans une condition d'arrêt, le système de biocapteur comprenant :un capteur de test ayant une base et une interface d'échantillon, la base ayant un réservoir formé dans celle-ci pour recevoir l'échantillon de fluide biologique sanguin, et l'interface d'échantillon étant disposée de manière adjacente au réservoir ; etun dispositif de mesure configuré pour s'interfacer avec le capteur de test et ayant une interface de capteur, un support de stockage et un processeur, le processeur étant connecté à l'interface de capteur et au support de stockage et étant configuré pour exécuter des instructions programmées par ordinateur pour :recevoir, par l'intermédiaire de l'interface du capteur, un premier signal mesuré à partir de l'échantillon de fluide biologique sanguin dans le réservoir, le premier signal étant un signal de sortie primaire, le premier signal étant principalement sensible à la concentration de l'analyte ;recevoir un deuxième signal, le deuxième signal étant un signal de sortie secondaire généré, mesuré séparément du premier signal, le deuxième signal étant sensible à un stimulus étranger de caractéristiques physiques ou environnementales de l'échantillon de fluide biologique sanguin affectant le premier signal ;retro-calculer un troisième signal, le troisième signal étant un signal de sortie secondaire, basé sur le premier signal, le troisième signal étant sensible au stimulus étranger des caractéristiques physiques ou environnementales de l'échantillon de fluide biologique sanguin affectant le premier signal ;déterminer si une condition d'arrêt existe, dans lequel la condition d'arrêt est si la valeur absolue de la différence entre le deuxième signal et le troisième signal est supérieure ou égale à une valeur prédéfinie ; etsi la condition d'absence existe, ajuster le deuxième signal en utilisant le troisième signal en ajoutant une partie du troisième signal au deuxième signal pour dériver un septième signal, le septième signal étant un signal de sortie secondaire généré ajusté, et convertir le premier signal en concentration d'analyte en utilisant la fonction de conversion et le septième signal pour compenser l'effet du stimulus étranger.
Applications Claiming Priority (2)
| Application Number | Priority Date | Filing Date | Title |
|---|---|---|---|
| US201562162298P | 2015-05-15 | 2015-05-15 | |
| PCT/IB2016/052800 WO2016185352A1 (fr) | 2015-05-15 | 2016-05-13 | Meilleure mesure d'analyte de système de biocapteur |
Publications (2)
| Publication Number | Publication Date |
|---|---|
| EP3295159A1 EP3295159A1 (fr) | 2018-03-21 |
| EP3295159B1 true EP3295159B1 (fr) | 2021-12-01 |
Family
ID=56092948
Family Applications (1)
| Application Number | Title | Priority Date | Filing Date |
|---|---|---|---|
| EP16726185.8A Active EP3295159B1 (fr) | 2015-05-15 | 2016-05-13 | Meilleure mesure d'analyte de système de biocapteur |
Country Status (7)
| Country | Link |
|---|---|
| US (1) | US11644434B2 (fr) |
| EP (1) | EP3295159B1 (fr) |
| JP (1) | JP6789246B2 (fr) |
| CN (1) | CN107636452B (fr) |
| CA (1) | CA2984090A1 (fr) |
| HK (1) | HK1248818A1 (fr) |
| WO (1) | WO2016185352A1 (fr) |
Families Citing this family (4)
| Publication number | Priority date | Publication date | Assignee | Title |
|---|---|---|---|---|
| CA3089212A1 (fr) | 2018-01-23 | 2019-08-01 | Dexcom, Inc. | Systemes, dispositifs et procedes pour compenser des effets de temperature sur des capteurs |
| CN109491341B (zh) * | 2018-11-28 | 2021-04-13 | 北京迈斯康特测控技术有限公司 | 用于油田作业设备的监控与数据分析系统 |
| CN111272985B (zh) * | 2020-03-31 | 2022-09-30 | 武汉美网通科技发展有限公司 | 一种土壤盐分传感器温度补偿式高精度标定方法 |
| CN112986365B (zh) * | 2021-02-19 | 2023-10-13 | 三诺生物传感股份有限公司 | 一种电化学测量校正方法及系统 |
Family Cites Families (13)
| Publication number | Priority date | Publication date | Assignee | Title |
|---|---|---|---|---|
| JP5039062B2 (ja) * | 2006-02-27 | 2012-10-03 | バイエル・ヘルスケア・エルエルシー | バイオセンサー系における温度補正被分析物決定 |
| US20080248581A1 (en) * | 2007-04-06 | 2008-10-09 | Bayer Healthcare Llc | Method for performing correction of blood glucose assay bias using blood hemoglobin concentration |
| EP3438661B1 (fr) * | 2007-12-10 | 2022-08-03 | Ascensia Diabetes Care Holdings AG | Compensation basée sur la pente |
| JP2010061629A (ja) | 2008-09-02 | 2010-03-18 | Wisepocket:Kk | クライアントサーバシステムおよびその制御方法 |
| CA2742149C (fr) | 2008-11-28 | 2016-07-05 | Panasonic Corporation | Puce capteur, systeme biodetecteur, procede de mesure de temperature de prelevement biologique, procede de mesure de temperature de prelevement sanguin, et procede de mesure de concentration d'analyte dans un prelevement sanguin |
| WO2010077660A1 (fr) | 2008-12-08 | 2010-07-08 | Bayer Healthcare Llc | Système de biocapteur avec ajustement de signal |
| CN103003692B (zh) | 2010-03-22 | 2015-01-14 | 拜尔健康护理有限责任公司 | 用于生物传感器的剩余补偿 |
| BR112012031166A2 (pt) | 2010-06-07 | 2018-02-27 | Bayer Healthcare Llc | compensação baseada eminclinação incluindo sinais de saída secundários |
| GB201018418D0 (en) * | 2010-11-01 | 2010-12-15 | Gas Sensing Solutions Ltd | Temperature calibration methods and apparatus for optical absorption gas sensors, and optical absorption gas sensors thereby calibrated |
| US8702931B2 (en) * | 2011-04-18 | 2014-04-22 | Indian Institute Of Science | Low cost electrochemical disposable sensor for measuring glycated hemoglobin |
| ES2663097T3 (es) | 2011-09-21 | 2018-04-11 | Ascensia Diabetes Care Holdings Ag | Biosensor con compensación de error |
| CN105378484B (zh) * | 2013-03-14 | 2017-06-09 | 安晟信医疗科技控股公司 | 分析物浓度测定的标准化校准 |
| GB2512842A (en) * | 2013-04-08 | 2014-10-15 | Sphere Medical Ltd | Sensor calibration method and apparatus |
-
2016
- 2016-05-13 CA CA2984090A patent/CA2984090A1/fr not_active Abandoned
- 2016-05-13 CN CN201680027879.6A patent/CN107636452B/zh active Active
- 2016-05-13 JP JP2017559516A patent/JP6789246B2/ja active Active
- 2016-05-13 WO PCT/IB2016/052800 patent/WO2016185352A1/fr unknown
- 2016-05-13 EP EP16726185.8A patent/EP3295159B1/fr active Active
- 2016-05-13 US US15/573,737 patent/US11644434B2/en active Active
-
2018
- 2018-07-04 HK HK18108650.4A patent/HK1248818A1/zh unknown
Non-Patent Citations (1)
| Title |
|---|
| None * |
Also Published As
| Publication number | Publication date |
|---|---|
| CA2984090A1 (fr) | 2016-11-24 |
| CN107636452A (zh) | 2018-01-26 |
| EP3295159A1 (fr) | 2018-03-21 |
| US20180188199A1 (en) | 2018-07-05 |
| HK1248818A1 (zh) | 2018-10-19 |
| JP2018515776A (ja) | 2018-06-14 |
| CN107636452B (zh) | 2021-06-08 |
| WO2016185352A1 (fr) | 2016-11-24 |
| JP6789246B2 (ja) | 2020-11-25 |
| US11644434B2 (en) | 2023-05-09 |
Similar Documents
| Publication | Publication Date | Title |
|---|---|---|
| US10921278B2 (en) | Slope-based compensation including secondary output signals | |
| US20200348306A1 (en) | Slope-Based Compensation | |
| US20200271615A1 (en) | Biosensor Systems for Determining Analyte Concentration Based On Complex Index Functions | |
| US20170360712A1 (en) | Analysis Compensation Including Segmented Signals | |
| JP2011506966A5 (fr) | ||
| US11913898B2 (en) | System error compensation of analyte concentration determinations based on pseudo-reference concentration and signal-based anchor parameters | |
| EP3295159B1 (fr) | Meilleure mesure d'analyte de système de biocapteur | |
| JP2016517517A5 (fr) | ||
| EP2972398B1 (fr) | Approximation progressive d'une concentration d'analyte d'échantillon |
Legal Events
| Date | Code | Title | Description |
|---|---|---|---|
| STAA | Information on the status of an ep patent application or granted ep patent |
Free format text: STATUS: THE INTERNATIONAL PUBLICATION HAS BEEN MADE |
|
| PUAI | Public reference made under article 153(3) epc to a published international application that has entered the european phase |
Free format text: ORIGINAL CODE: 0009012 |
|
| STAA | Information on the status of an ep patent application or granted ep patent |
Free format text: STATUS: REQUEST FOR EXAMINATION WAS MADE |
|
| 17P | Request for examination filed |
Effective date: 20171114 |
|
| AK | Designated contracting states |
Kind code of ref document: A1 Designated state(s): AL AT BE BG CH CY CZ DE DK EE ES FI FR GB GR HR HU IE IS IT LI LT LU LV MC MK MT NL NO PL PT RO RS SE SI SK SM TR |
|
| AX | Request for extension of the european patent |
Extension state: BA ME |
|
| DAV | Request for validation of the european patent (deleted) | ||
| DAX | Request for extension of the european patent (deleted) | ||
| STAA | Information on the status of an ep patent application or granted ep patent |
Free format text: STATUS: EXAMINATION IS IN PROGRESS |
|
| 17Q | First examination report despatched |
Effective date: 20190329 |
|
| STAA | Information on the status of an ep patent application or granted ep patent |
Free format text: STATUS: EXAMINATION IS IN PROGRESS |
|
| GRAP | Despatch of communication of intention to grant a patent |
Free format text: ORIGINAL CODE: EPIDOSNIGR1 |
|
| STAA | Information on the status of an ep patent application or granted ep patent |
Free format text: STATUS: GRANT OF PATENT IS INTENDED |
|
| INTG | Intention to grant announced |
Effective date: 20210702 |
|
| GRAS | Grant fee paid |
Free format text: ORIGINAL CODE: EPIDOSNIGR3 |
|
| GRAA | (expected) grant |
Free format text: ORIGINAL CODE: 0009210 |
|
| STAA | Information on the status of an ep patent application or granted ep patent |
Free format text: STATUS: THE PATENT HAS BEEN GRANTED |
|
| AK | Designated contracting states |
Kind code of ref document: B1 Designated state(s): AL AT BE BG CH CY CZ DE DK EE ES FI FR GB GR HR HU IE IS IT LI LT LU LV MC MK MT NL NO PL PT RO RS SE SI SK SM TR |
|
| REG | Reference to a national code |
Ref country code: GB Ref legal event code: FG4D |
|
| REG | Reference to a national code |
Ref country code: AT Ref legal event code: REF Ref document number: 1452238 Country of ref document: AT Kind code of ref document: T Effective date: 20211215 Ref country code: CH Ref legal event code: EP |
|
| REG | Reference to a national code |
Ref country code: IE Ref legal event code: FG4D |
|
| REG | Reference to a national code |
Ref country code: DE Ref legal event code: R096 Ref document number: 602016066792 Country of ref document: DE |
|
| REG | Reference to a national code |
Ref country code: LT Ref legal event code: MG9D |
|
| REG | Reference to a national code |
Ref country code: NL Ref legal event code: MP Effective date: 20211201 |
|
| REG | Reference to a national code |
Ref country code: AT Ref legal event code: MK05 Ref document number: 1452238 Country of ref document: AT Kind code of ref document: T Effective date: 20211201 |
|
| PG25 | Lapsed in a contracting state [announced via postgrant information from national office to epo] |
Ref country code: RS Free format text: LAPSE BECAUSE OF FAILURE TO SUBMIT A TRANSLATION OF THE DESCRIPTION OR TO PAY THE FEE WITHIN THE PRESCRIBED TIME-LIMIT Effective date: 20211201 Ref country code: LT Free format text: LAPSE BECAUSE OF FAILURE TO SUBMIT A TRANSLATION OF THE DESCRIPTION OR TO PAY THE FEE WITHIN THE PRESCRIBED TIME-LIMIT Effective date: 20211201 Ref country code: FI Free format text: LAPSE BECAUSE OF FAILURE TO SUBMIT A TRANSLATION OF THE DESCRIPTION OR TO PAY THE FEE WITHIN THE PRESCRIBED TIME-LIMIT Effective date: 20211201 Ref country code: BG Free format text: LAPSE BECAUSE OF FAILURE TO SUBMIT A TRANSLATION OF THE DESCRIPTION OR TO PAY THE FEE WITHIN THE PRESCRIBED TIME-LIMIT Effective date: 20220301 Ref country code: AT Free format text: LAPSE BECAUSE OF FAILURE TO SUBMIT A TRANSLATION OF THE DESCRIPTION OR TO PAY THE FEE WITHIN THE PRESCRIBED TIME-LIMIT Effective date: 20211201 |
|
| PG25 | Lapsed in a contracting state [announced via postgrant information from national office to epo] |
Ref country code: SE Free format text: LAPSE BECAUSE OF FAILURE TO SUBMIT A TRANSLATION OF THE DESCRIPTION OR TO PAY THE FEE WITHIN THE PRESCRIBED TIME-LIMIT Effective date: 20211201 Ref country code: PL Free format text: LAPSE BECAUSE OF FAILURE TO SUBMIT A TRANSLATION OF THE DESCRIPTION OR TO PAY THE FEE WITHIN THE PRESCRIBED TIME-LIMIT Effective date: 20211201 Ref country code: NO Free format text: LAPSE BECAUSE OF FAILURE TO SUBMIT A TRANSLATION OF THE DESCRIPTION OR TO PAY THE FEE WITHIN THE PRESCRIBED TIME-LIMIT Effective date: 20220301 Ref country code: LV Free format text: LAPSE BECAUSE OF FAILURE TO SUBMIT A TRANSLATION OF THE DESCRIPTION OR TO PAY THE FEE WITHIN THE PRESCRIBED TIME-LIMIT Effective date: 20211201 Ref country code: HR Free format text: LAPSE BECAUSE OF FAILURE TO SUBMIT A TRANSLATION OF THE DESCRIPTION OR TO PAY THE FEE WITHIN THE PRESCRIBED TIME-LIMIT Effective date: 20211201 Ref country code: GR Free format text: LAPSE BECAUSE OF FAILURE TO SUBMIT A TRANSLATION OF THE DESCRIPTION OR TO PAY THE FEE WITHIN THE PRESCRIBED TIME-LIMIT Effective date: 20220302 Ref country code: ES Free format text: LAPSE BECAUSE OF FAILURE TO SUBMIT A TRANSLATION OF THE DESCRIPTION OR TO PAY THE FEE WITHIN THE PRESCRIBED TIME-LIMIT Effective date: 20211201 |
|
| PG25 | Lapsed in a contracting state [announced via postgrant information from national office to epo] |
Ref country code: NL Free format text: LAPSE BECAUSE OF FAILURE TO SUBMIT A TRANSLATION OF THE DESCRIPTION OR TO PAY THE FEE WITHIN THE PRESCRIBED TIME-LIMIT Effective date: 20211201 |
|
| PG25 | Lapsed in a contracting state [announced via postgrant information from national office to epo] |
Ref country code: SM Free format text: LAPSE BECAUSE OF FAILURE TO SUBMIT A TRANSLATION OF THE DESCRIPTION OR TO PAY THE FEE WITHIN THE PRESCRIBED TIME-LIMIT Effective date: 20211201 Ref country code: SK Free format text: LAPSE BECAUSE OF FAILURE TO SUBMIT A TRANSLATION OF THE DESCRIPTION OR TO PAY THE FEE WITHIN THE PRESCRIBED TIME-LIMIT Effective date: 20211201 Ref country code: RO Free format text: LAPSE BECAUSE OF FAILURE TO SUBMIT A TRANSLATION OF THE DESCRIPTION OR TO PAY THE FEE WITHIN THE PRESCRIBED TIME-LIMIT Effective date: 20211201 Ref country code: PT Free format text: LAPSE BECAUSE OF FAILURE TO SUBMIT A TRANSLATION OF THE DESCRIPTION OR TO PAY THE FEE WITHIN THE PRESCRIBED TIME-LIMIT Effective date: 20220401 Ref country code: EE Free format text: LAPSE BECAUSE OF FAILURE TO SUBMIT A TRANSLATION OF THE DESCRIPTION OR TO PAY THE FEE WITHIN THE PRESCRIBED TIME-LIMIT Effective date: 20211201 Ref country code: CZ Free format text: LAPSE BECAUSE OF FAILURE TO SUBMIT A TRANSLATION OF THE DESCRIPTION OR TO PAY THE FEE WITHIN THE PRESCRIBED TIME-LIMIT Effective date: 20211201 |
|
| REG | Reference to a national code |
Ref country code: DE Ref legal event code: R097 Ref document number: 602016066792 Country of ref document: DE |
|
| PG25 | Lapsed in a contracting state [announced via postgrant information from national office to epo] |
Ref country code: IS Free format text: LAPSE BECAUSE OF FAILURE TO SUBMIT A TRANSLATION OF THE DESCRIPTION OR TO PAY THE FEE WITHIN THE PRESCRIBED TIME-LIMIT Effective date: 20220401 |
|
| PLBE | No opposition filed within time limit |
Free format text: ORIGINAL CODE: 0009261 |
|
| STAA | Information on the status of an ep patent application or granted ep patent |
Free format text: STATUS: NO OPPOSITION FILED WITHIN TIME LIMIT |
|
| PG25 | Lapsed in a contracting state [announced via postgrant information from national office to epo] |
Ref country code: DK Free format text: LAPSE BECAUSE OF FAILURE TO SUBMIT A TRANSLATION OF THE DESCRIPTION OR TO PAY THE FEE WITHIN THE PRESCRIBED TIME-LIMIT Effective date: 20211201 Ref country code: AL Free format text: LAPSE BECAUSE OF FAILURE TO SUBMIT A TRANSLATION OF THE DESCRIPTION OR TO PAY THE FEE WITHIN THE PRESCRIBED TIME-LIMIT Effective date: 20211201 |
|
| 26N | No opposition filed |
Effective date: 20220902 |
|
| PG25 | Lapsed in a contracting state [announced via postgrant information from national office to epo] |
Ref country code: SI Free format text: LAPSE BECAUSE OF FAILURE TO SUBMIT A TRANSLATION OF THE DESCRIPTION OR TO PAY THE FEE WITHIN THE PRESCRIBED TIME-LIMIT Effective date: 20211201 |
|
| REG | Reference to a national code |
Ref country code: CH Ref legal event code: PL |
|
| REG | Reference to a national code |
Ref country code: BE Ref legal event code: MM Effective date: 20220531 |
|
| PG25 | Lapsed in a contracting state [announced via postgrant information from national office to epo] |
Ref country code: MC Free format text: LAPSE BECAUSE OF FAILURE TO SUBMIT A TRANSLATION OF THE DESCRIPTION OR TO PAY THE FEE WITHIN THE PRESCRIBED TIME-LIMIT Effective date: 20211201 Ref country code: LU Free format text: LAPSE BECAUSE OF NON-PAYMENT OF DUE FEES Effective date: 20220513 Ref country code: LI Free format text: LAPSE BECAUSE OF NON-PAYMENT OF DUE FEES Effective date: 20220531 Ref country code: CH Free format text: LAPSE BECAUSE OF NON-PAYMENT OF DUE FEES Effective date: 20220531 |
|
| PG25 | Lapsed in a contracting state [announced via postgrant information from national office to epo] |
Ref country code: IE Free format text: LAPSE BECAUSE OF NON-PAYMENT OF DUE FEES Effective date: 20220513 |
|
| PG25 | Lapsed in a contracting state [announced via postgrant information from national office to epo] |
Ref country code: BE Free format text: LAPSE BECAUSE OF NON-PAYMENT OF DUE FEES Effective date: 20220531 |
|
| P01 | Opt-out of the competence of the unified patent court (upc) registered |
Effective date: 20230510 |
|
| PGFP | Annual fee paid to national office [announced via postgrant information from national office to epo] |
Ref country code: IT Payment date: 20230519 Year of fee payment: 8 Ref country code: FR Payment date: 20230525 Year of fee payment: 8 Ref country code: DE Payment date: 20230530 Year of fee payment: 8 |
|
| PGFP | Annual fee paid to national office [announced via postgrant information from national office to epo] |
Ref country code: GB Payment date: 20230529 Year of fee payment: 8 |
|
| PG25 | Lapsed in a contracting state [announced via postgrant information from national office to epo] |
Ref country code: HU Free format text: LAPSE BECAUSE OF FAILURE TO SUBMIT A TRANSLATION OF THE DESCRIPTION OR TO PAY THE FEE WITHIN THE PRESCRIBED TIME-LIMIT; INVALID AB INITIO Effective date: 20160513 |