EP3240478B1 - System for performing histogram analysis of the time-based capnography signals and method of operation thereof - Google Patents
System for performing histogram analysis of the time-based capnography signals and method of operation thereof Download PDFInfo
- Publication number
- EP3240478B1 EP3240478B1 EP15823024.3A EP15823024A EP3240478B1 EP 3240478 B1 EP3240478 B1 EP 3240478B1 EP 15823024 A EP15823024 A EP 15823024A EP 3240478 B1 EP3240478 B1 EP 3240478B1
- Authority
- EP
- European Patent Office
- Prior art keywords
- data points
- accordance
- present system
- groups
- act
- Prior art date
- Legal status (The legal status is an assumption and is not a legal conclusion. Google has not performed a legal analysis and makes no representation as to the accuracy of the status listed.)
- Active
Links
- 238000000034 method Methods 0.000 title claims description 108
- 238000004458 analytical method Methods 0.000 title description 9
- 238000005070 sampling Methods 0.000 claims description 78
- 238000009423 ventilation Methods 0.000 claims description 37
- 230000029058 respiratory gaseous exchange Effects 0.000 claims description 27
- 238000012544 monitoring process Methods 0.000 claims description 21
- 230000003434 inspiratory effect Effects 0.000 claims description 14
- 238000001514 detection method Methods 0.000 claims description 13
- 238000009877 rendering Methods 0.000 claims description 13
- 239000000203 mixture Substances 0.000 claims description 6
- 238000004590 computer program Methods 0.000 claims description 3
- 230000008878 coupling Effects 0.000 claims description 3
- 238000010168 coupling process Methods 0.000 claims description 3
- 238000005859 coupling reaction Methods 0.000 claims description 3
- CURLTUGMZLYLDI-UHFFFAOYSA-N Carbon dioxide Chemical compound O=C=O CURLTUGMZLYLDI-UHFFFAOYSA-N 0.000 description 75
- 229910002092 carbon dioxide Inorganic materials 0.000 description 72
- 239000001569 carbon dioxide Substances 0.000 description 72
- 230000008569 process Effects 0.000 description 66
- 239000007789 gas Substances 0.000 description 52
- 230000015654 memory Effects 0.000 description 22
- 238000004422 calculation algorithm Methods 0.000 description 20
- 230000006870 function Effects 0.000 description 10
- 238000013507 mapping Methods 0.000 description 7
- QVGXLLKOCUKJST-UHFFFAOYSA-N atomic oxygen Chemical compound [O] QVGXLLKOCUKJST-UHFFFAOYSA-N 0.000 description 4
- 238000010586 diagram Methods 0.000 description 4
- 239000001301 oxygen Substances 0.000 description 4
- 229910052760 oxygen Inorganic materials 0.000 description 4
- 238000012935 Averaging Methods 0.000 description 3
- 239000003570 air Substances 0.000 description 3
- 230000008859 change Effects 0.000 description 3
- 238000007796 conventional method Methods 0.000 description 3
- IJGRMHOSHXDMSA-UHFFFAOYSA-N Atomic nitrogen Chemical compound N#N IJGRMHOSHXDMSA-UHFFFAOYSA-N 0.000 description 2
- 238000004364 calculation method Methods 0.000 description 2
- 239000003814 drug Substances 0.000 description 2
- 229940079593 drug Drugs 0.000 description 2
- 238000012545 processing Methods 0.000 description 2
- 210000002345 respiratory system Anatomy 0.000 description 2
- 230000004044 response Effects 0.000 description 2
- 230000000153 supplemental effect Effects 0.000 description 2
- 230000007704 transition Effects 0.000 description 2
- XLYOFNOQVPJJNP-UHFFFAOYSA-N water Chemical compound O XLYOFNOQVPJJNP-UHFFFAOYSA-N 0.000 description 2
- 238000005303 weighing Methods 0.000 description 2
- 206010038687 Respiratory distress Diseases 0.000 description 1
- 239000012080 ambient air Substances 0.000 description 1
- 230000000202 analgesic effect Effects 0.000 description 1
- 230000008901 benefit Effects 0.000 description 1
- 230000005494 condensation Effects 0.000 description 1
- 238000009833 condensation Methods 0.000 description 1
- 238000001839 endoscopy Methods 0.000 description 1
- 239000012530 fluid Substances 0.000 description 1
- 230000004907 flux Effects 0.000 description 1
- 230000003993 interaction Effects 0.000 description 1
- 230000002452 interceptive effect Effects 0.000 description 1
- 238000004519 manufacturing process Methods 0.000 description 1
- 238000002483 medication Methods 0.000 description 1
- 238000012986 modification Methods 0.000 description 1
- 230000004048 modification Effects 0.000 description 1
- 230000003287 optical effect Effects 0.000 description 1
- 230000002093 peripheral effect Effects 0.000 description 1
- 230000036387 respiratory rate Effects 0.000 description 1
- 239000000932 sedative agent Substances 0.000 description 1
- 230000001624 sedative effect Effects 0.000 description 1
- 239000004984 smart glass Substances 0.000 description 1
- 230000002269 spontaneous effect Effects 0.000 description 1
- 238000003860 storage Methods 0.000 description 1
- 238000002627 tracheal intubation Methods 0.000 description 1
Images


Classifications
-
- A—HUMAN NECESSITIES
- A61—MEDICAL OR VETERINARY SCIENCE; HYGIENE
- A61B—DIAGNOSIS; SURGERY; IDENTIFICATION
- A61B5/00—Measuring for diagnostic purposes; Identification of persons
- A61B5/08—Detecting, measuring or recording devices for evaluating the respiratory organs
- A61B5/083—Measuring rate of metabolism by using breath test, e.g. measuring rate of oxygen consumption
- A61B5/0836—Measuring rate of CO2 production
-
- A—HUMAN NECESSITIES
- A61—MEDICAL OR VETERINARY SCIENCE; HYGIENE
- A61B—DIAGNOSIS; SURGERY; IDENTIFICATION
- A61B5/00—Measuring for diagnostic purposes; Identification of persons
- A61B5/72—Signal processing specially adapted for physiological signals or for diagnostic purposes
- A61B5/7221—Determining signal validity, reliability or quality
-
- G—PHYSICS
- G06—COMPUTING; CALCULATING OR COUNTING
- G06F—ELECTRIC DIGITAL DATA PROCESSING
- G06F3/00—Input arrangements for transferring data to be processed into a form capable of being handled by the computer; Output arrangements for transferring data from processing unit to output unit, e.g. interface arrangements
- G06F3/01—Input arrangements or combined input and output arrangements for interaction between user and computer
Definitions
- the present system relates to monitoring capnography signals, such as for performing histogram analysis of a carbon dioxide (CO 2 ) waveform to identify periods of breath instability without a need to identify individual breaths, and a method of operation thereof.
- CO 2 carbon dioxide
- capnometry may be used to detect periods of slow and/or inadequate breathing in patients who may be at risk of inadequate ventilation such as those who are administered analgesic and/or sedative medications or otherwise in respiratory distress. Accordingly, it is desirable to monitor the stability of breaths of these patients using a capnogram so that proper medical care can be exercised.
- US 2012/010104 discloses a method of determining NO production in the lower respiratory tract of a subject in which a maximum airway wall NO flux (derived from an exhaled NO level and flow rate) is analyzed using a frequency analysis,
- system The system(s), device(s), method(s), arrangements(s), user interface(s), computer program(s), processes, etc. (hereinafter each of which will be referred to as system, unless the context indicates otherwise), described herein address problems in prior art systems.
- a gas concentration monitoring system which may include a processor which may be configured to detect a concentration of a selected gas in a sample gas flow obtained from a physical interface to a patient from a dataset including a plurality of data points, each data point corresponding to the detected concentration of the selected gas within the sample gas flow during a sampling time; group the data points according to a frequency of occurrence of the data points within the sampling time; and/or determine at least one of a signal confidence and signal quality based on relative characteristics between the groups of data points.
- the processor may be further configured to group the data points with each grouping corresponding to a different range of concentrations of the selected gas.
- the processor may be further configured to determine the at least one of a signal confidence and signal quality based upon a relative number of data points that are present within the groups of data points.
- the gas concentration monitoring system may further include a rendering device coupled to the processor, wherein the processor may be configured to render the groups of data points as a histogram on the rendering device.
- the processor may be further configured to identify two groups of data points that correspondingly have a largest and next largest number of data points amongst the groups of data points.
- the processor may be further configured to determine a number of data points between the two groups of data points and is configured to determine the at least one of a signal confidence and signal quality based upon the determined number of data points.
- the sampling time interval may encompass at least a plurality of breath cycles each breath cycle including inspiration and expiration phases or a period of at least 20 seconds, whichever may be determined to occur first.
- the physical interface may include a nasal cannula or mask (108) configured for coupling to the patient.
- the system may further include a pneumatic system controlled by the processor to provide a ventilation gas mixture to the physical interface for inhalation by the patient.
- a method of monitoring capnography signals may include acts of detecting a concentration of a selected gas in a sample gas flow obtained from a physical interface to a patient; forming a dataset including a plurality of data points, each data point corresponding to the detected concentration of the selected gas within the sample gas flow during a sampling time; grouping the data points according to a frequency of occurrence of the data points within the sampling time; and/or determining at least one of a signal confidence and signal quality based on relative characteristics between the groups of data points.
- the act of grouping the data points may further include an act of grouping the data points based on different ranges of concentrations of the selected gas.
- the act of determining the at least one of a signal confidence and signal quality may further include an act of determining a relative number of data points that are present within the groups of data points.
- the method may further include an act of rendering the groups of data points as a histogram on a rendering device.
- the method may further include an act of identifying two groups of data points that correspondingly have a largest and next largest number of data points amongst the groups of data points.
- the method may further include an act of determining a number of data points between the two groups of data points, wherein the act of determining the at least one of a signal confidence and signal quality is based upon the determined number of data points.
- the sampling time interval may encompasses at least a plurality of breath cycles each breath cycle including inspiration and expiration phases or a period of at least 20 seconds, whichever may be determined to occur first.
- a computer readable non-transitory medium having computer readable program code for operating on a computer for performing a method of monitoring capnography signals, the method may include acts of: detecting a concentration of a selected gas in a sample gas flow obtained from a physical interface (107) to a patient (101); forming a dataset including a plurality of data points, each data point corresponding to the detected concentration of the selected gas within the sample gas flow during a sampling time; grouping the data points according to a frequency of occurrence of the data points within the sampling time; and/or determining at least one of a signal confidence and signal quality based on relative characteristics between the groups of data points.
- the act of grouping the data points may include an act of grouping the data points based on different ranges of concentrations of the selected gas. It is further envisioned that the act of determining the at least one of a signal confidence and signal quality may include an act of determining a relative number of data points that are present within the groups of data points. Moreover, it is envisioned that the method may include an act of identifying two groups of data points that may correspondingly have a largest and next largest number of data points amongst the groups of data points. It is further envisioned that the method may include an act of determining a number of data points between the two groups of data points, wherein the act of determining the at least one of a signal confidence and signal quality is based upon the determined number of data points.
- capnograph information may be obtained by the system.
- the capnograph information may be obtained by any suitable capnography system such as side-stream capnography system.
- suitable capnography system such as side-stream capnography system.
- embodiments of the present system may be operative with other types of capnography systems such as main-stream capnography systems and the like.
- main-stream capnography systems such as main-stream capnography systems and the like.
- operation with a side-stream capnography system is described herein.
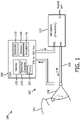
- FIG. 1 shows a block diagram of a side-stream capnometry system 100 (hereinafter system 100 for the sake of clarity) operating in accordance with embodiments of the present system.
- the system 100 may include a side-steam monitor (SSM) 160 which may be coupled to a ventilation portion 103 using any suitable method so as to receive a sample gas flow (SGF) at an input (SGF IN).
- SSM 160 may analyze at least a portion (e.g., a sample portion) of the SGF using one or more sensors 164, and output the SGF at an output (SGF RET).
- the output SGF may then be provided to a desired portion such as the ventilation portion 103 or vented to atmosphere, if desired.
- a side-steam capnometry system 100 is shown, in accordance with yet other embodiments, it is envisioned that a main-stream capnometry system may provide capnograph information to the system.
- the ventilation portion 103 may provide a gas for ventilation (hereinafter ventilation gas) of a patient 101.
- the ventilation portion may receive one or more gasses (e.g., O 2 , nitrogen (N 2 ), air, water vapor, etc.) at an input end (IN), mix these gasses to form the ventilation gas, and output the ventilation gas at an output (OUT).
- the ventilation gas may, depending upon system settings and/or time, include a single gas (e.g., O 2 ) or a gas mixture such as an N 2 and O 2 gas mixture, etc.
- the ventilation portion 103 may be coupled to a patient 101 using any suitable coupling such as a ventilation coupler 107 which may include one or more hoses 109 and/or a patient interface 108. While the hose typically is not bi-directional (i.e., fluid such as oxygen flows towards the patient 101) in accordance with embodiments of the present system, the hose might occasionally be bi-directional.
- the system is provided during spontaneous ventilation, when no ventilator is connected to the patient, since that is a time when breath detection is most unreliable.
- a ventilator it is usually known when a breath is delivered.
- the ventilation portion may simply be a hose that is coupled to a supply of supplemental oxygen. It is also possible to use this invention without any ventilation portion or when the ventilation portion is otherwise disabled and the patient is merely breathing ambient air (e.g., air that is not enhanced with the introduction of additional or primary gases).
- the patient interface 108 may be any suitable type of system interface such as an invasive (an intubation tube, etc.) and/or non-invasive (e.g., a mask as shown, a nasal adapter, a nasal cannula, etc.) type to provide the ventilation gas to the patient 101 for inspiration.
- the patient interface 108 may include a holding portion such as tabs, straps, etc., which may hold the patient interface 108 in position relative to the patient 101 during use, as desired.
- the ventilation coupler 107 may further receive exhaled gasses (e.g., expiration gasses) from the patient 101 such as gasses within the respiratory tract of the patient. Accordingly, the SGF may, at certain times, include at least some of these exhaled gasses as described herein.
- the ventilation portion 103 may include one or more pumps to pressurize an input gas such as air, and/or to provide a desired flow rate, pressure, etc. of the ventilation gas.
- the ventilation coupler 107 may include one or more passive or active valves such as passive one-way valves which may direct the flow of gasses within the ventilation coupler in a desired direction or directions.
- the ventilation gas may be provided to the patient 101 for inspiration and expiration gases from the patient 101 may be directed in a different direction.
- the ventilation coupler 107 may further include conditioners such as dryers which may, for example, remove moisture from the SGF and/or trap condensation, as desired.
- the ventilation portion 103 may include pumps, valves, and/or mixers operating under the control of the controller 110 to mix water vapor, and/or medication into the ventilation gas, as desired.
- the ventilation portion 103 may include a return port to receive a return gas for further processing, if desired. Thereafter, this return gas, or portions thereof, may be mixed with the ventilation gas to be output to the ventilation coupler 107 for reuse, if desired.
- this portion may include one or more of sensors 164, the controller 110, actuators 165, a pump 167, a sampling chamber 163, and a rendering portion 130.
- the controller 110 may control one or more portions of the overall operation of the SSM 160.
- the actuators 165 may include one or more motors, transducers, etc. which may provide a force to operate one or more valves, mixers, or the like of the SSM 160 under the control of the controller 110.
- the sampling chamber 163 may include one or more sampling chambers in which a sample portion of the SGF may be analyzed by the sensors 164.
- the pump 167 may be operative under the control of the controller 110 to control a flow of the SGF as described.
- the sensors 164 may include at least one sensor which may analyze at least a portion of the SGF within the sampling chamber 163. Further, the sensors 164 may include temperature, volume, concentration, and/or pressure sensors to detect temperature, volume, concentration, and/or pressure, respectively, of the SGF within the sampling chamber 163 in accordance with embodiments of the present system. In accordance with embodiments of the present system, the sensors 164 may include electro-optic sensors which may analyze the SGF and determine characteristics of one or more gasses within the SGF such as the presence, temperature, concentration, volume and/or pressure of one or more gasses within the SGF which may be located within the sampling chamber 163. The sensors 164 may then form corresponding sensor information and provide this information to the controller 110 for further processing.
- the controller 110 may then render the results of the analysis using any suitable rendering device 130 such as a display.
- the rendering device may be locally and/or remotely located and may communicate with the controller 110 via any suitable bus or network such as the Internet, etc.
- the sensors 164 may be tuned or otherwise configured to detect presence and/or characteristic of a desired gas (e.g., CO 2 , O 2 , N 2 , etc.). Accordingly, the sensors 164, may detect one or more corresponding gasses within the SGF such as carbon dioxide (CO 2 ), oxygen (O 2 ), nitrogen (N 2 ), etc., and may form corresponding sensor information.
- CO 2 carbon dioxide
- O 2 oxygen
- N 2 nitrogen
- the system will be described with regard to detection of only characteristics of carbon dioxide (CO 2 ) in the SGF by the sensors 164.
- CO 2 carbon dioxide
- characteristics of other gases and/or combinations thereof in the SGF may be sensed by the sensors 164 in accordance with embodiments of the present system.
- the controller 110 may then analyze the sensor information to determine characteristics of the sensed gas over time. Once characteristics of the one or more sensed gas are determined such as concentration, the controller 110 may then control the renderer 130 to render results of the determination.
- this portion may be controlled by a ventilation controller, the controller 110 and/or other controller so as to provide the ventilation gas for ventilating the patient 101 at a desired volume, flow, pressure, and/or mixture.
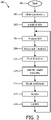
- FIG. 2 shows a functional flow diagram performed by a process 200 in accordance with embodiments of the present system.
- the process 200 may be performed using one or more processors, computers, controllers, etc., communicating over a network and may obtain information from, and/or store information to one or more memories which may be local and/or remote from each other.
- the process 200 may include one of more of the following acts.
- the acts of process 200 may be performed using one or more suitable gas monitoring system(s) such as a side-stream monitoring system (SSM) operating in accordance with embodiments of the present system.
- SSM side-stream monitoring system
- one or more of these acts may be combined, reordered, and/or separated into sub-acts, as desired. Further, one or more of these acts may be skipped depending upon settings.
- the process may start during act 201 and then proceed to act 203.
- the process may obtain initial operating parameters such as one or more sampling values, a sample flow rate (SFR) value, information about a ventilated patient (e.g., the patient to be ventilated), etc.
- the initial sampling value may denote a sampling time period (e.g., 120 sec.).
- a larger sampling volume may be accommodated by utilizing additional sensors and/or sensors provided with a larger sampling capacity without extending the sampling period.
- the sampling volume and/or other characteristic may be set by the system, a user and/or may be obtained from a memory of the system.
- the sampling time may be set such that capnometry information for a sufficient sampling time may be acquired for analysis.
- the capnometry information may include one or more capnographic signals such as a CO 2 signal.
- the sampling value may be set by the system and/or user and may be obtained from a memory of the system. In accordance with embodiments of the present system, the sampling value may be adjusted by the system in real time during operation of the current process, as desired. However, the sampling value should be set so that a data for a sufficient number of breaths (e.g., of a patient) may be collected and analyzed in accordance with embodiments of the present system. Further, the process may obtain a sample flow rate (SFR) value which may be used to initialize a sample gas flow pump of the system.
- SFR sample flow rate
- the SFR value may be set by the system and/or user and may be obtained from a memory or in real time, as desired.
- the process may adjust the parameters during operation as may be desired. After completing act 203, the process may continue to act 205.
- the process may establish a sample gas flow (SGF) of the system. Accordingly, the process may control an SGF pump to provide the SGF at a desired sample flow rate as may be set by the SFR value.
- the SGF may be obtained from one or more SGF tubes coupled to a sampling system interface such as a nasal cannula coupled to the patient and which receives a ventilation gas from the ventilation portion.
- the process may wait for a sample period of time to elapse (e.g., 20 sec., etc), so that at least a portion of the SGF may be provided to one or more sampling chambers of the system.
- the SGF is obtained from a patient interface (e.g., a physical interface) of the system.
- the process may further obtain sensor information to determine, for example, an ambient pressure within one or more of the sampling chambers.
- the process may further determine a sample flow rate of the SGF in real time.
- the process may control the SGF pump to maintain a fixed sample flow of the SGF in real time based upon the feedback information such as flow rate information obtained from one or more flow rate sensors of the system.
- the process may continue to act 207.
- the process may analyze at least a portion of the SGF and form corresponding capnometry information which may, for example, include information related to the concentration of one or more gasses within the SGF over time such as CO 2 .
- the capnometry information may include a capnogram signal (for a corresponding gas) which may for example be represented as a plurality of discrete data points (DPs) over time.
- DPs discrete data points
- each data point may represent a concentration of CO 2 at a corresponding time.
- These data points may be represented graphically as a capnogram signal or capnogram waveform (e.g., CO 2 ) in a rendered capnogram.
- FIG. 3 shows a graph 300 illustrating a capnogram showing CO 2 concentration in a sample gas flow over time in accordance with embodiments of the present system.
- the DPs may be represented as a capnogram signal 302 (which may also be referred to as a capnogram waveform) in time.
- Roughly approximated expiratory (Ep) and inspiratory (Ip) phases are labeled for illustration.
- a plurality of these data points for a corresponding gas (e.g., CO 2 ) may be grouped to form a data sample for the sampling time (t s ) which may correspond to the sampling period.
- the process may employ any suitable method or methods to analyze the SGF to form the capnometry information such as may be employed by capnography systems and the like. Although it is envisioned that embodiments of the present system may detect concentration of gasses such as CO 2 , O 2 , N 2 , etc., only concentration CO 2 is discussed herein for the sake of clarity. However, in accordance with embodiments of the present system, operations performed by the process with respect to CO 2 may be similarly performed with respect to the other gasses, as desired. After completing act 207, the process may continue to act 209.
- concentration of gasses such as CO 2 , O 2 , N 2 , etc.
- the process may perform a heuristic analysis in which the process may analyze the capnometry information obtained during the sampling time (ts) as a group to, for example, determine, relative frequency of occurrence of each DP of the DPs within the capnometry information during the period of time (e.g., the past 120 seconds) and may form corresponding histogram information using any suitable method.
- the process may analyze individual DPs of the capnometry information over the sampling period as a group (e.g., without reference to breathing cycles) and may determine a relative frequency of occurrence of each DP within the sampling time.
- the sampling time may be set such that it covers at least a plurality of breathing cycles (e.g., between 4-20 breathing cycles, etc. where each breathing cycle includes inspiratory and expiratory phases). Accordingly, during this act the process may form a dataset comprising a plurality of data points, with each data point corresponding to a detected concentration of a selected gas (e.g., CO 2 in the current example) within the SGF during the sampling time.
- a selected gas e.g., CO 2 in the current example
- the process may place the DPs within the sampling time (e.g., the dataset of all DPs) within groups (e.g., bins, groupings, etc.) according to a frequency of occurrence (e.g., by concentration) within the groups (e.g., the bins).
- a frequency of occurrence e.g., by concentration
- FIGs. 4A, 4B show histograms 400A, 400B of CO 2 signal samples generated in accordance with embodiments of the present system.
- These CO 2 signal samples may be represented as DPs obtained during the sampling time and may correspond with the DPs of capnometry information such as shown in FIG. 3 .
- FIG. 4A, 4B show histograms 400A, 400B of CO 2 signal samples generated in accordance with embodiments of the present system.
- These CO 2 signal samples may be represented as DPs obtained during the sampling time and may correspond with the DPs of capnometry information such as shown in FIG. 3 .
- the histogram 400B includes a plurality of bins 402 each of which has a width (W) which may represent a range of CO 2 for the corresponding DPs and may include a height which may correspond with a frequency of occurrence of corresponding DPs within the sampling period.
- W width
- the height of each bin 402 may represent a total number of DPs within the respective bin.
- the process may determine whether capnometry information is available for a period of time equal to the sampling value so that a full data set of DPs may be acquired. Accordingly, in a case wherein it is determined that capnometry information is available for a period of time equal to the sampling value (e.g., an elapsed time is equal to or greater than the sampling value), the process may perform heuristic analysis.
- the process may continue to collect capnometry information so that a full data set of DPs may be acquired. In this way, it may be ensured that a satisfactory amount of DPs are available to provide heuristic accuracy.
- the process may analyze the capnometry information available from a start of monitoring and/or may use a running time interval (e.g., the latest 20 seconds, etc.) each of which may define a sampling time (e.g., a sampling period) depending upon settings.
- a running time interval e.g., the latest 20 seconds, etc.
- the process may analyze capnometry information from a desired start time to a stop time and/or a desired interval of time which may define the sampling time.
- the process may analyze capnometry information that represents a most recent time interval (e.g., the latest 120 seconds).
- the process may form a graphical user interface (GUI) with which a user may interact to set these times (e.g., ts, tc, etc.) as desired.
- GUI graphical user interface
- the process may provide a user with sliders 307 and 309 which the user may slide to select tc and ts, respectively.
- sampling time may be predefined and may be stored in a memory of the system and may be obtained by the process during initialization. After completing act 209, the process may then continue to act 211.
- the process may perform peak detection to estimate an end-tidal (Et) CO 2 value for the sampling time.
- This value may represent an average value of the end tidal (Et) CO 2 for the sampling time which, in the current example, includes a plurality of breathing cycles during the sampling time.
- Peak detection may be performed in accordance with embodiments using a suitable method including for example detection of peaks 401 and 403 of a graph and/or detection of peaks through bin analysis.
- a peak detection method performed in accordance with embodiments of the present system may select the bins with the greatest number of DPs (e.g., the highest or largest bins).
- the process may select the largest group of DPs.
- the values of DPs in this selected group may then be averaged and an end-tidal CO 2 concentration value may then be set to the results of the averaging.
- the process may use a peak detection method to determine an end-tidal CO 2 concentration without identifying individual breath cycles. In accordance with embodiments of the present system, this may reduce system resources and erroneous data which may otherwise result when using conventional methods which may for example misidentify individual breath cycles.
- embodiments of the present system may employ a peak-detection method to determine an estimated end-tidal CO 2 concentration value without a need to detect individual breath cycles and/or phases (e.g., inspiratory and/or expiratory phases). Rather, the process in accordance with embodiments of the present system, may determine the estimated end-tidal CO 2 concentration value based upon an average of end-tidal CO 2 concentration values from a plurality of breath cycles during the sampling time and which therefore, need not be individually detected.
- phases e.g., inspiratory and/or expiratory phases
- histogram 400B shows bins 402 which have heights that correspond to the number of DPs (or the corresponding CO 2 signal) grouped within the corresponding bin 402 for the corresponding sampling time (ts).
- the majority of a time-based capnogram is comprised of the inspiratory phase (Ip) during which the CO 2 signal is near-zero and a plateau phase (PP) during which the CO 2 signal is relatively stable near the maximum (end-tidal (ET)) CO 2 level.
- Ip inspiratory phase
- PP plateau phase
- ET end-tidal
- the transition periods between the plateau and inspiratory phases are normally quite brief relative to the other two phases (e.g., the inspiratory and expiratory phases).
- a histogram of the CO 2 signal taken over a fixed time interval (e.g., the sampling time) has characteristic peaks indicating a large number of values (e.g., high frequency of occurrences) at each the low (inspiratory phase (Ip)) and the high (plateau phase (PP)) extremes (e.g., of the expiratory phase (Ep)) of the observed CO 2 signal values.
- the process may analyze the generated histogram to determine the relative frequency of CO 2 signal values (e.g. DPs) that land outside of these two peaks (e.g., the two largest bins of the bins 402 shown in FIG. 4B or the peaks 401 and 403 shown in FIG. 4A ) of the histogram. Further, the histogram may be used to identify unstable breathing without a need to detect individual breaths or time-based characteristic features of those breaths.
- the process may for example analyze the histogram 400A and select the two highest peaks (401 and 403 of all the peaks) or analyze the histogram 400B and select bins 402 with the two largest number of DPs assigned thereto within the histogram from all the bins 402. Of these two largest peaks (401 and 403) or bins 402, the process may determine which peaks/bin corresponds with a larger capnogram signal value (e.g., based upon an average of DPs for example within the corresponding bin 402) and set this peak or bin as a plateau phase (PP) peak (PP_Peak) and may set the other bin(s) 402 as the inspiratory peak (IP_Peak).
- PP plateau phase
- the process may determine an average of the capnogram signal at the plateau-phase peak (PP_Peak) (e.g., by averaging all the DPs within this peak or bin) and set this value as the estimated value of the end tidal (Et) CO 2 for the sampling time.
- the process may determine an average of the capnogram signal at the inspiratory peak (IP_Peak) (e.g., by averaging all the DPs within this bin) and set this value as the estimated value of the inspiratory CO 2 for the sampling time.
- IP_Peak average of the capnogram signal at the inspiratory peak
- the process may continue to act 214.
- the process may identify periods of breath instability without a need to identify individual breaths.
- breath instability may be identified in a histogram by observing for example a high number of samples in the middle concentration range, for example between 15 and 25 mmHg.
- the capnogram does not quickly alternate between low and high concentration points, but remains in the middle range for prolonged periods.
- the majority (>85%) of DPs are located in the two peaks (IP_peak and PP_peak).
- presence of data between these peaks is indicative of unstable breathing.
- the size (tidal volume) and rate of breaths changes, then the height of the individual plateaus combine in the histogram to create a lower PP_peak and possibly smaller peaks that are between the IP_peak and the PP_peak.
- Another source of DPs that are not part of the peaks is capnometry waveforms that do not contain a plateau. In this case, the PP_peak is low or nonexistent with a number of DPs between the IP_peak and the maximum CO 2 value found in the histogram.
- the process may determine signal confidence and/or signal quality during the sampling time.
- signal quality may be scored for example using a weighted sum of descriptive parameters calculated from the histogram.
- the average, or peak, of the PP_peak relative to the sampling time may be one parameter.
- the difference between the PP_peak location and the maximum CO 2 may be a descriptive parameter. A smaller difference is indicative of a better quality signal.
- the sum of DPs that are not part of either the IP_peak or the PP_peak relative to the sampling time may be another parameter. Ideally, the fraction of the DPs that are in neither of the peaks should be low (e.g., less than 20%).
- a signal quality score may be calculated for example by normalizing each of these parameters by subtracting an offset value and then scaling the parameters up or down by a multiplicative factor.
- the act of normalizing the inputs may be utilized for example when some parameters are fractions and others are difference values or counts of DPs etc.
- the signal confidence parameter may be calculated by multiplying each of the normalized descriptive parameters by a weighting factor and summing the results.
- the weighting factors may be selected for example based on the relative strength of the relationship between the parameter value and signal quality.
- the signal confidence and/or signal quality may represent a measure of how stable the respiration rate, breath volume (tidal volume) and end-tidal CO 2 values are for the sampling time.
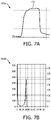
- FIG. 7A shows a portion of a capnogram 700A including a normal CO 2 waveform formed in accordance with embodiments of the present system.
- a normal capnogram may be considered to include a capnographic signal with a consistent expiratory plateau 711 for example as shown.
- FIG. 7B shows a portion of a histogram 700B corresponding to the capnogram 700A formed in accordance with embodiments of the present system.
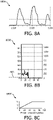
- FIG. 8A shows a portion of a capnogram 800A including a CO 2 waveform without a consistent expiratory plateau formed in accordance with embodiments of the present system.
- FIG. 8B shows a portion of a histogram 800B corresponding to the capnogram 800A formed in accordance with embodiments of the present system.
- the method may include an algorithm which may analyze histograms formed in accordance with embodiments of the present system.
- the algorithm may identify within the histogram baseline samples for example treating everything less than a threshold value, for example of (maxCO 2 - minCO 2 )/2 as baseline data.
- the algorithm in accordance with embodiments may identify all data within a range (e.g., peak location -5 mm Hg and the peak location +2 mm Hg) and set this data as plateau data.
- the percent plateau may then be calculated for example as 20 times the plateau sample count divided by the non-baseline sample count.
- the algorithm may update frequency for example every five seconds (however other update frequencies are also envisioned in accordance with embodiments of the present system).
- a feature mapping function is shown and may illustrate a percent of a signal within the plateau.
- an illustrative CO 2 PQI Weighting factor may be set for example equal to 0.25 although other weighting factors may be similarly applied.
- embodiments of the present system may include a method to identify when there may be breath-to-breath differences in a CO 2 waveform of a capnographic signal.
- This method is illustratively described with reference to FIG. 9 which shows a graph 900 of a feature mapping function generated in accordance with embodiments of the present system.
- the method may include an algorithm which may determine a difference between a plateau CO 2 (e.g., a plateau value) as calculated from a histogram and a max observed CO 2 during a period such as for example the past 30 seconds.
- the plateau value may be determined as a most commonly occurring CO 2 value that is higher than the midpoint between the max and min CO 2 during the prior 30 seconds.
- the update frequency for this algorithm may be set to any desired value such as 5 seconds.
- the algorithm may render a message such as "Unstable Breathing.” Accordingly, this parameter may be used to identify breath-to-breath differences in the CO 2 waveform such as a case wherein there may be for example a single elevated CO 2 value and the rest of the waveform plateaus are lower.
- the algorithm may consider the CO 2 signal during a period such as the previous 30 seconds, there may be a chance that a most commonly occurring plateau and the maximum CO 2 during the 30 second window are very different.
- the difference should be small, such as less than 4 mm Hg.
- a difference of 7 mm Hg or more may be utilized to indicate unstable breathing.
- a larger indication may be utilized to indicate very unstable breathing.
- a difference greater than 10 mm Hg may be utilized to indicate that the breathing is very unstable.
- FIG. 10 shows a portion of a histogram 1000 corresponding to a capnogram formed in accordance with embodiments of the present system.
- FIG. 11 shows a graph 1100 of a feature mapping function generated in accordance with embodiments of the present system.
- the method may include an algorithm which may analyze a histogram such as the histogram shown in FIG.
- the algorithm may include an update frequency of, for example, 5 seconds. Accordingly, the histogram may be analyzed every 5 seconds.
- a feature mapping function of this algorithm may be similar to that shown in FIG. 11 .
- the algorithm may include a weighing factor such as equal to 0.25. When it is determined that there is a low tidal volume, the algorithm may render a message such as "LOW TIDAL VOLUME DETECTED".
- the process may further compare the signal confidence or quality for the current sampling time with the signal confidence or quality, respectively, for a previous sampling time (e.g., a most recent or other selected sampling time as may be selected by the system and/or user) and determine a signal trend.
- a previous sampling time e.g., a most recent or other selected sampling time as may be selected by the system and/or user
- the signal quality trend indicator may be represented as a score such as 10 out of 10, 100 out of 100 (etc.), a "+" and/or a green highlight.
- the signal quality trend indicator may be represented as a score such as 1 out of 10, 1 out of 100 (etc.), a "-" and/or a red highlight.
- the signal quality trend indicator may be represented as a "0" as the same score as the previous signal quality indicator, and/or a gray highlight.
- the process may determine signal confidence trend indicators similarly.
- the process may render results of the process.
- the process may render one or more of the determined capnometry signals, the end-tidal CO 2 value, the estimated respiration rate, the signal confidence, the signal quality, the signal confidence trend indicator, and the signal quality trend indicator for the corresponding sampling time.
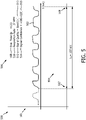
- FIG. 5 shows a graph 500 including a capnogram 501 rendered in accordance with embodiments of the present system. More particularly, the graph 500 may include information generated by the process such as one or more of a capnogram 501, a capnometry signal 502, a sampling time selection menu slider 504, for example including include sliders 507 and/or 509, and a menu 506.
- the sliders 507 and/or 509 may be utilized (e.g., moved) to select tc and ts, respectively.
- the user may drag the slider 507 to the left and set the slider 509 in a right-most position.
- the menu 506 may include results of the process such as information related to one or more of an end-tidal CO 2 value 508, respiratory rate 510, signal quality 512, and signal confidence 514. Further, as shown the signal quality 512 and signal confidence 514 may include corresponding signal trend indicators 513 and 515, respectively, illustratively shown in brackets. In accordance with embodiments of the present system, the present system may also display a clinical message related to the information contained in the histogram such as a message related to whether or not there are detected periods of slow and/or inadequate breathing. The process may further provide a method for a user to interact with the system, as desired.
- the process may provide an interactive menu (e.g., user interface, UI) for a user to interact with the system to change parameters, system settings, store information, etc.
- UI user interface
- the user may use the sliders 507 and/or 509 to change a sampling time in real time as may be desired.
- the process may continue to act 219.
- the process may update a system history which may be stored in a memory of the system to record results of the process.
- the process may thereafter repeat act 207, etc. as shown.
- the process may end when an end signal is detected.
- the end signal may be generated for example by a user and/or the system such as when disconnection of the physical interface is detected or otherwise indicated.
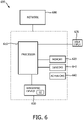
- FIG. 6 shows a portion of a system 600 in accordance with embodiments of the present system.
- a portion of the present system may include a processor 610 (e.g., a controller) operationally coupled to a memory 620, a rendering device such as a display 630, sensors 640, actuators 660, a network 680, and a user input device 670.
- the memory 620 may be any type of device for storing application data as well as other data related to the described operation.
- the application data and other data are received by the processor 610 for configuring (e.g., programming) the processor 610 to perform operation acts in accordance with the present system.
- the processor 610 so configured becomes a special purpose machine particularly suited for performing in accordance with embodiments of the present system.
- the user input 670 may include a keyboard, a mouse, a trackball, or other device, such as a touch-sensitive display, which may be stand alone or be a part of a system, such as part of a personal computer, a personal digital assistant (PDA), a mobile phone (e.g., a smart phone), a monitor, a wearable display (e.g., smart glasses, etc.), a smartor dumb-terminal or other device for communicating with the processor 610 via any operable link.
- PDA personal digital assistant
- the user input device 670 may be operable for interacting with the processor 610 including enabling interaction within a user interface (UI) as described herein.
- UI user interface
- the processor 610, the memory 620, display 630, and/or user input device 670 may all or partly be a portion of a computer system or other device such as a client and/or server type device.
- the actuators 660 may include one or more motors, transducers, etc. which may provide a force to operate one or more valves, mixers, or the like of the SSM 160 under the control of the processor 610.
- These valves may, for example, include pneumatic control valves which may control the flow of one or more gasses for ventilation, etc.
- the methods of the present system are particularly suited to be carried out by a computer software program, such program may contain one or more modules corresponding to one or more of the individual steps or acts described and/or envisioned by the present system.
- Such program may of course be embodied in a computer-readable medium, such as an integrated chip, a peripheral device or memory, such as the memory 620 or other memory coupled to the processor 610.
- the program and/or program portions contained in the memory 620 may configure the processor 610 to implement the methods, operational acts, and functions disclosed herein.
- the memories may be distributed, for example between the clients and/or servers, or local, and the processor 610, where additional processors may be provided, may also be distributed or may be singular.
- the memories may be implemented as electrical, magnetic or optical memory, or any combination of these or other types of storage devices.
- the term "memory" should be construed broadly enough to encompass any information able to be read from or written to an address in an addressable space accessible by the processor 610.
- the memory 620 may include a non-transitory memory. With this definition, information accessible through a network such as the network 680 is still within the memory, for instance, because the processor 610 may retrieve the information from the network 680 for operation in accordance with the present system.
- the processor 610 is operable for providing control signals and/or performing operations in response to input signals from the user input device 670 as well as in response to other devices of a network and executing instructions stored in the memory 620.
- the processor 610 may include one or more of a microprocessor, an applicationspecific or general-use integrated circuit(s), a logic device, etc. Further, the processor 610 may be a dedicated processor for performing in accordance with the present system or may be a general-purpose processor wherein only one of many functions operates for performing in accordance with the present system.
- the processor 610 may operate utilizing a program portion, multiple program segments, or may be a hardware device utilizing a dedicated or multi-purpose integrated circuit.
- embodiments, of the present system may provide an enhanced gas monitoring system such as a side-stream CO 2 monitoring system for in-patient as well as out-patient procedures and care which may analyze a capnometry signal to determine one or more characteristics of the signal such as signal quality, confidence, breaths-per-minute (BPM), and end-tidal CO 2 values.
- a side-stream CO 2 monitoring system may be used with, for example, critical-care ventilators, home ventilators, multi-parameter monitors and the like.
- CO 2 monitoring systems operating in accordance with embodiments of the present system may be used in various medical environments such as endoscopy suites, intensive-care units (ICU), operating rooms (OR), emergency rooms, ambulatory care, and/or other medical facilities.
- ICU intensive-care units
- OR operating rooms
- emergency rooms ambulatory care, and/or other medical facilities.
Description
- The present system relates to monitoring capnography signals, such as for performing histogram analysis of a carbon dioxide (CO2) waveform to identify periods of breath instability without a need to identify individual breaths, and a method of operation thereof.
- Typically, capnometry may be used to detect periods of slow and/or inadequate breathing in patients who may be at risk of inadequate ventilation such as those who are administered analgesic and/or sedative medications or otherwise in respiratory distress. Accordingly, it is desirable to monitor the stability of breaths of these patients using a capnogram so that proper medical care can be exercised.
- However, conventional algorithms which determine the stability of breaths based on a capnometry waveform require the detection of individual breaths, and comparison of characteristic features of the detected breaths over a time period to enable breathing parameters to be determined. Unfortunately, with conventional methods, if the breath detection algorithm fails, it is likely that the parameters derived from each of the detected breaths are also in error. These conventional algorithms require considerable system resources to properly identify each individual breath in real time. Further, the addition of supplemental oxygen may correspondingly increase the inaccuracy of capnogram readings making in more difficult to determine stability of breaths using conventional methods. Accordingly, embodiments of the present system may overcome these and/or other disadvantages in prior systems.
-
US 2012/010104 discloses a method of determining NO production in the lower respiratory tract of a subject in which a maximum airway wall NO flux (derived from an exhaled NO level and flow rate) is analyzed using a frequency analysis, - The system(s), device(s), method(s), arrangements(s), user interface(s), computer program(s), processes, etc. (hereinafter each of which will be referred to as system, unless the context indicates otherwise), described herein address problems in prior art systems.
- The invention is defined by the claims.
- In accordance with embodiments of the present system, there is disclosed a gas concentration monitoring system which may include a processor which may be configured to detect a concentration of a selected gas in a sample gas flow obtained from a physical interface to a patient from a dataset including a plurality of data points, each data point corresponding to the detected concentration of the selected gas within the sample gas flow during a sampling time; group the data points according to a frequency of occurrence of the data points within the sampling time; and/or determine at least one of a signal confidence and signal quality based on relative characteristics between the groups of data points.
- In accordance with embodiments of the present system, the processor may be further configured to group the data points with each grouping corresponding to a different range of concentrations of the selected gas. The processor may be further configured to determine the at least one of a signal confidence and signal quality based upon a relative number of data points that are present within the groups of data points. The gas concentration monitoring system may further include a rendering device coupled to the processor, wherein the processor may be configured to render the groups of data points as a histogram on the rendering device. The processor may be further configured to identify two groups of data points that correspondingly have a largest and next largest number of data points amongst the groups of data points.
- In accordance with embodiments of the present system, the processor may be further configured to determine a number of data points between the two groups of data points and is configured to determine the at least one of a signal confidence and signal quality based upon the determined number of data points. In accordance with yet further embodiments of the present system, the sampling time interval may encompass at least a plurality of breath cycles each breath cycle including inspiration and expiration phases or a period of at least 20 seconds, whichever may be determined to occur first. It is also envisioned that the physical interface may include a nasal cannula or mask (108) configured for coupling to the patient. Moreover, the system may further include a pneumatic system controlled by the processor to provide a ventilation gas mixture to the physical interface for inhalation by the patient.
- In accordance with embodiments of the present system, there is provided a method of monitoring capnography signals. The method may include acts of detecting a concentration of a selected gas in a sample gas flow obtained from a physical interface to a patient; forming a dataset including a plurality of data points, each data point corresponding to the detected concentration of the selected gas within the sample gas flow during a sampling time; grouping the data points according to a frequency of occurrence of the data points within the sampling time; and/or determining at least one of a signal confidence and signal quality based on relative characteristics between the groups of data points. The act of grouping the data points may further include an act of grouping the data points based on different ranges of concentrations of the selected gas. It is also envisioned that the act of determining the at least one of a signal confidence and signal quality may further include an act of determining a relative number of data points that are present within the groups of data points. The method may further include an act of rendering the groups of data points as a histogram on a rendering device. The method may further include an act of identifying two groups of data points that correspondingly have a largest and next largest number of data points amongst the groups of data points. The method may further include an act of determining a number of data points between the two groups of data points, wherein the act of determining the at least one of a signal confidence and signal quality is based upon the determined number of data points. In accordance with embodiments of the present system, the sampling time interval may encompasses at least a plurality of breath cycles each breath cycle including inspiration and expiration phases or a period of at least 20 seconds, whichever may be determined to occur first.
- In accordance with embodiments of the present system, there is provided a computer readable non-transitory medium having computer readable program code for operating on a computer for performing a method of monitoring capnography signals, the method may include acts of: detecting a concentration of a selected gas in a sample gas flow obtained from a physical interface (107) to a patient (101); forming a dataset including a plurality of data points, each data point corresponding to the detected concentration of the selected gas within the sample gas flow during a sampling time; grouping the data points according to a frequency of occurrence of the data points within the sampling time; and/or determining at least one of a signal confidence and signal quality based on relative characteristics between the groups of data points. It is further envisioned that the act of grouping the data points may include an act of grouping the data points based on different ranges of concentrations of the selected gas. It is further envisioned that the act of determining the at least one of a signal confidence and signal quality may include an act of determining a relative number of data points that are present within the groups of data points. Moreover, it is envisioned that the method may include an act of identifying two groups of data points that may correspondingly have a largest and next largest number of data points amongst the groups of data points. It is further envisioned that the method may include an act of determining a number of data points between the two groups of data points, wherein the act of determining the at least one of a signal confidence and signal quality is based upon the determined number of data points.
- The present invention is explained in further detail in the following exemplary embodiments and with reference to the figures, where identical or similar elements may be partly indicated by the same or similar reference numerals, and the features of various exemplary embodiments being combinable. In the drawings:
-
FIG. 1 shows a block diagram of a portion of system in accordance with embodiments of the present system; -
FIG. 2 shows a functional flow diagram performed by a process in accordance with embodiments of the present system; -
FIG. 3 shows a graph illustrating a capnogram showing CO2 concentration in a sample gas flow over time in accordance with embodiments of the present system; -
FIG. 4A shows a histogram of CO2 signal samples generated in accordance with embodiments of the present system; -
FIG. 4B shows a further histogram of CO2 signal samples generated in accordance with embodiments of the present system; -
FIG. 5 shows a graph of a screen rendering in accordance with embodiments of the present system; -
FIG. 6 shows a portion of a system in accordance with embodiments of the present system; -
FIG. 7A shows a portion of a capnogram including a CO2 waveform formed in accordance with embodiments of the present system; -
FIG. 7B shows a portion of a histogram corresponding to a capnogram formed in accordance with embodiments of the present system; -
FIG. 8A shows a portion of a capnogram including a CO2 waveform formed in accordance with embodiments of the present system; -
FIG. 8B shows a portion of a histogram corresponding to a capnogram formed in accordance with embodiments of the present system; -
FIG. 8C shows a graph of a feature mapping function generated in accordance with embodiments of the present system; -
FIG. 9 shows a graph of a feature mapping function generated in accordance with embodiments of the present system; -
FIG. 10 shows a portion of a histogram corresponding to a capnogram formed in accordance with embodiments of the present system; and -
FIG. 11 shows a graph of a feature mapping function generated in accordance with embodiments of the present system. - The following are descriptions of illustrative embodiments that when taken in conjunction with the following drawings will demonstrate the above noted features and advantages, as well as further ones. In the following description, for purposes of explanation rather than limitation, illustrative details are set forth such as architecture, interfaces, techniques, element attributes, etc. However, it will be apparent to those of ordinary skill in the art that other embodiments that depart from these details would still be understood to be within the scope of the appended claims. Moreover, for the purpose of clarity, detailed descriptions of well known devices, circuits, tools, techniques, and methods are omitted so as not to obscure the description of the present system. It should be expressly understood that the drawings are included for illustrative purposes and do not represent the entire scope of the present system. In the accompanying drawings, like reference numbers in different drawings may designate similar elements.
- In accordance with embodiments of the present system, capnograph information may be obtained by the system. The capnograph information may be obtained by any suitable capnography system such as side-stream capnography system. However, it is also envisioned that embodiments of the present system may be operative with other types of capnography systems such as main-stream capnography systems and the like. However, for the sake of clarity, operation with a side-stream capnography system is described herein.
- For example,
FIG. 1 shows a block diagram of a side-stream capnometry system 100 (hereinaftersystem 100 for the sake of clarity) operating in accordance with embodiments of the present system. Thesystem 100 may include a side-steam monitor (SSM) 160 which may be coupled to aventilation portion 103 using any suitable method so as to receive a sample gas flow (SGF) at an input (SGF IN). In accordance with embodiments of the present system, theSSM 160 may analyze at least a portion (e.g., a sample portion) of the SGF using one ormore sensors 164, and output the SGF at an output (SGF RET). The output SGF may then be provided to a desired portion such as theventilation portion 103 or vented to atmosphere, if desired. Although a side-steam capnometry system 100 is shown, in accordance with yet other embodiments, it is envisioned that a main-stream capnometry system may provide capnograph information to the system. - The ventilation portion 103 (e.g., a pneumatic portion) may provide a gas for ventilation (hereinafter ventilation gas) of a
patient 101. Accordingly, the ventilation portion may receive one or more gasses (e.g., O2, nitrogen (N2), air, water vapor, etc.) at an input end (IN), mix these gasses to form the ventilation gas, and output the ventilation gas at an output (OUT). Accordingly, the ventilation gas may, depending upon system settings and/or time, include a single gas (e.g., O2) or a gas mixture such as an N2 and O2 gas mixture, etc. Theventilation portion 103 may be coupled to apatient 101 using any suitable coupling such as aventilation coupler 107 which may include one ormore hoses 109 and/or apatient interface 108. While the hose typically is not bi-directional (i.e., fluid such as oxygen flows towards the patient 101) in accordance with embodiments of the present system, the hose might occasionally be bi-directional. - In accordance with embodiments of the present system, the system is provided during spontaneous ventilation, when no ventilator is connected to the patient, since that is a time when breath detection is most unreliable. With a ventilator, it is usually known when a breath is delivered. As such in accordance with embodiments of the present system, the ventilation portion may simply be a hose that is coupled to a supply of supplemental oxygen. It is also possible to use this invention without any ventilation portion or when the ventilation portion is otherwise disabled and the patient is merely breathing ambient air (e.g., air that is not enhanced with the introduction of additional or primary gases).
- The
patient interface 108 may be any suitable type of system interface such as an invasive (an intubation tube, etc.) and/or non-invasive (e.g., a mask as shown, a nasal adapter, a nasal cannula, etc.) type to provide the ventilation gas to thepatient 101 for inspiration. Thepatient interface 108 may include a holding portion such as tabs, straps, etc., which may hold thepatient interface 108 in position relative to thepatient 101 during use, as desired. In use, theventilation coupler 107 may further receive exhaled gasses (e.g., expiration gasses) from thepatient 101 such as gasses within the respiratory tract of the patient. Accordingly, the SGF may, at certain times, include at least some of these exhaled gasses as described herein. Theventilation portion 103 may include one or more pumps to pressurize an input gas such as air, and/or to provide a desired flow rate, pressure, etc. of the ventilation gas. - In accordance with embodiments of the present system, the
ventilation coupler 107 may include one or more passive or active valves such as passive one-way valves which may direct the flow of gasses within the ventilation coupler in a desired direction or directions. For example, the ventilation gas may be provided to thepatient 101 for inspiration and expiration gases from thepatient 101 may be directed in a different direction. In accordance with embodiments of the present system, theventilation coupler 107 may further include conditioners such as dryers which may, for example, remove moisture from the SGF and/or trap condensation, as desired. Further, in accordance with embodiments of the present system, theventilation portion 103 may include pumps, valves, and/or mixers operating under the control of thecontroller 110 to mix water vapor, and/or medication into the ventilation gas, as desired. Theventilation portion 103 may include a return port to receive a return gas for further processing, if desired. Thereafter, this return gas, or portions thereof, may be mixed with the ventilation gas to be output to theventilation coupler 107 for reuse, if desired. - Referring back to the
SSM 160, in accordance with embodiments of the present system, this portion may include one or more ofsensors 164, thecontroller 110, actuators 165, apump 167, a sampling chamber 163, and arendering portion 130. In accordance with embodiments of the present system, thecontroller 110 may control one or more portions of the overall operation of theSSM 160. For example, the actuators 165 may include one or more motors, transducers, etc. which may provide a force to operate one or more valves, mixers, or the like of theSSM 160 under the control of thecontroller 110. The sampling chamber 163 may include one or more sampling chambers in which a sample portion of the SGF may be analyzed by thesensors 164. Thepump 167 may be operative under the control of thecontroller 110 to control a flow of the SGF as described. - The
sensors 164 may include at least one sensor which may analyze at least a portion of the SGF within the sampling chamber 163. Further, thesensors 164 may include temperature, volume, concentration, and/or pressure sensors to detect temperature, volume, concentration, and/or pressure, respectively, of the SGF within the sampling chamber 163 in accordance with embodiments of the present system. In accordance with embodiments of the present system, thesensors 164 may include electro-optic sensors which may analyze the SGF and determine characteristics of one or more gasses within the SGF such as the presence, temperature, concentration, volume and/or pressure of one or more gasses within the SGF which may be located within the sampling chamber 163. Thesensors 164 may then form corresponding sensor information and provide this information to thecontroller 110 for further processing. - In accordance with embodiments of the present system, the
controller 110 may then render the results of the analysis using anysuitable rendering device 130 such as a display. The rendering device may be locally and/or remotely located and may communicate with thecontroller 110 via any suitable bus or network such as the Internet, etc. In accordance with embodiments of the present system, thesensors 164 may be tuned or otherwise configured to detect presence and/or characteristic of a desired gas (e.g., CO2, O2, N2, etc.). Accordingly, thesensors 164, may detect one or more corresponding gasses within the SGF such as carbon dioxide (CO2), oxygen (O2), nitrogen (N2), etc., and may form corresponding sensor information. For purposes of simplifying the description of embodiments of the present system, the system will be described with regard to detection of only characteristics of carbon dioxide (CO2) in the SGF by thesensors 164. However, as may be readily appreciated, characteristics of other gases and/or combinations thereof in the SGF may be sensed by thesensors 164 in accordance with embodiments of the present system. - The
controller 110 may then analyze the sensor information to determine characteristics of the sensed gas over time. Once characteristics of the one or more sensed gas are determined such as concentration, thecontroller 110 may then control therenderer 130 to render results of the determination. - Referring back to the
ventilation portion 103, in accordance with embodiments of the present system, this portion may be controlled by a ventilation controller, thecontroller 110 and/or other controller so as to provide the ventilation gas for ventilating thepatient 101 at a desired volume, flow, pressure, and/or mixture. -
FIG. 2 shows a functional flow diagram performed by aprocess 200 in accordance with embodiments of the present system. Theprocess 200 may be performed using one or more processors, computers, controllers, etc., communicating over a network and may obtain information from, and/or store information to one or more memories which may be local and/or remote from each other. Theprocess 200 may include one of more of the following acts. In accordance with embodiments of the present system, the acts ofprocess 200 may be performed using one or more suitable gas monitoring system(s) such as a side-stream monitoring system (SSM) operating in accordance with embodiments of the present system. Further, one or more of these acts may be combined, reordered, and/or separated into sub-acts, as desired. Further, one or more of these acts may be skipped depending upon settings. In operation, the process may start duringact 201 and then proceed to act 203. - During
act 203, the process may obtain initial operating parameters such as one or more sampling values, a sample flow rate (SFR) value, information about a ventilated patient (e.g., the patient to be ventilated), etc. In accordance with embodiments of the present system, the initial sampling value may denote a sampling time period (e.g., 120 sec.). In accordance with embodiments of the present system, a larger sampling volume may be accommodated by utilizing additional sensors and/or sensors provided with a larger sampling capacity without extending the sampling period. In either event, the sampling volume and/or other characteristic may be set by the system, a user and/or may be obtained from a memory of the system. The sampling time may be set such that capnometry information for a sufficient sampling time may be acquired for analysis. - The capnometry information may include one or more capnographic signals such as a CO2 signal. The sampling value may be set by the system and/or user and may be obtained from a memory of the system. In accordance with embodiments of the present system, the sampling value may be adjusted by the system in real time during operation of the current process, as desired. However, the sampling value should be set so that a data for a sufficient number of breaths (e.g., of a patient) may be collected and analyzed in accordance with embodiments of the present system. Further, the process may obtain a sample flow rate (SFR) value which may be used to initialize a sample gas flow pump of the system. The SFR value may be set by the system and/or user and may be obtained from a memory or in real time, as desired. In accordance with embodiments of the present system, the process may adjust the parameters during operation as may be desired. After completing
act 203, the process may continue to act 205. - During
act 205, the process may establish a sample gas flow (SGF) of the system. Accordingly, the process may control an SGF pump to provide the SGF at a desired sample flow rate as may be set by the SFR value. The SGF may be obtained from one or more SGF tubes coupled to a sampling system interface such as a nasal cannula coupled to the patient and which receives a ventilation gas from the ventilation portion. Before completing this act, the process may wait for a sample period of time to elapse (e.g., 20 sec., etc), so that at least a portion of the SGF may be provided to one or more sampling chambers of the system. For the sake of clarity, it will be assumed that the SGF is obtained from a patient interface (e.g., a physical interface) of the system. The process may further obtain sensor information to determine, for example, an ambient pressure within one or more of the sampling chambers. The process may further determine a sample flow rate of the SGF in real time. Further, the process may control the SGF pump to maintain a fixed sample flow of the SGF in real time based upon the feedback information such as flow rate information obtained from one or more flow rate sensors of the system. After completingact 205, the process may continue to act 207. - During
act 207, the process may analyze at least a portion of the SGF and form corresponding capnometry information which may, for example, include information related to the concentration of one or more gasses within the SGF over time such as CO2. More particularly, the capnometry information may include a capnogram signal (for a corresponding gas) which may for example be represented as a plurality of discrete data points (DPs) over time. Thus, each data point may represent a concentration of CO2 at a corresponding time. These data points may be represented graphically as a capnogram signal or capnogram waveform (e.g., CO2) in a rendered capnogram. -
FIG. 3 shows agraph 300 illustrating a capnogram showing CO2 concentration in a sample gas flow over time in accordance with embodiments of the present system. The DPs may be represented as a capnogram signal 302 (which may also be referred to as a capnogram waveform) in time. Roughly approximated expiratory (Ep) and inspiratory (Ip) phases are labeled for illustration. A plurality of these data points for a corresponding gas (e.g., CO2) may be grouped to form a data sample for the sampling time (ts) which may correspond to the sampling period. - The process may employ any suitable method or methods to analyze the SGF to form the capnometry information such as may be employed by capnography systems and the like. Although it is envisioned that embodiments of the present system may detect concentration of gasses such as CO2, O2, N2, etc., only concentration CO2 is discussed herein for the sake of clarity. However, in accordance with embodiments of the present system, operations performed by the process with respect to CO2 may be similarly performed with respect to the other gasses, as desired. After completing
act 207, the process may continue to act 209. - During
act 209, the process may perform a heuristic analysis in which the process may analyze the capnometry information obtained during the sampling time (ts) as a group to, for example, determine, relative frequency of occurrence of each DP of the DPs within the capnometry information during the period of time (e.g., the past 120 seconds) and may form corresponding histogram information using any suitable method. Thus, the process may analyze individual DPs of the capnometry information over the sampling period as a group (e.g., without reference to breathing cycles) and may determine a relative frequency of occurrence of each DP within the sampling time. In accordance with embodiments of the present system, the sampling time may be set such that it covers at least a plurality of breathing cycles (e.g., between 4-20 breathing cycles, etc. where each breathing cycle includes inspiratory and expiratory phases). Accordingly, during this act the process may form a dataset comprising a plurality of data points, with each data point corresponding to a detected concentration of a selected gas (e.g., CO2 in the current example) within the SGF during the sampling time. - In accordance with embodiments of the present system, the process may place the DPs within the sampling time (e.g., the dataset of all DPs) within groups (e.g., bins, groupings, etc.) according to a frequency of occurrence (e.g., by concentration) within the groups (e.g., the bins). This process is illustrated with reference to
FIGs. 4A, 4B which showhistograms FIG. 3 . InFIG. 4B ahistogram 400B is shown of CO2 signal samples generated in accordance with embodiments of the present system. Thehistogram 400B includes a plurality ofbins 402 each of which has a width (W) which may represent a range of CO2 for the corresponding DPs and may include a height which may correspond with a frequency of occurrence of corresponding DPs within the sampling period. In accordance with embodiments of the present system, the height of each bin 402 may represent a total number of DPs within the respective bin. - With regard to the sampling time, in accordance with embodiments of the present system, the process may determine whether capnometry information is available for a period of time equal to the sampling value so that a full data set of DPs may be acquired. Accordingly, in a case wherein it is determined that capnometry information is available for a period of time equal to the sampling value (e.g., an elapsed time is equal to or greater than the sampling value), the process may perform heuristic analysis. However, in a case wherein it is determined that capnometry information is not available for a period of time equal to the sampling value (e.g., the elapsed time is less than the sampling time), the process may continue to collect capnometry information so that a full data set of DPs may be acquired. In this way, it may be ensured that a satisfactory amount of DPs are available to provide heuristic accuracy.
- In accordance with embodiments of the present system, the process may analyze the capnometry information available from a start of monitoring and/or may use a running time interval (e.g., the latest 20 seconds, etc.) each of which may define a sampling time (e.g., a sampling period) depending upon settings. However, in accordance with embodiments of the present system, the process may analyze capnometry information from a desired start time to a stop time and/or a desired interval of time which may define the sampling time. For example, in accordance with embodiments of the present system, the process may analyze capnometry information that represents a most recent time interval (e.g., the latest 120 seconds). Thus, referring to
FIG. 3 , assuming the start time may be represented as the current time (tc) and the sampling time may be denoted by a (ts) = 120 seconds in the current example. This sampling period may be represented as tc - ts = tc - 120 seconds. It is further envisioned that the process may form a graphical user interface (GUI) with which a user may interact to set these times (e.g., ts, tc, etc.) as desired. For example, with reference toFIG. 3 , the process may provide a user withsliders act 209, the process may then continue to act 211. - During
act 211, the process may perform peak detection to estimate an end-tidal (Et) CO2 value for the sampling time. This value may represent an average value of the end tidal (Et) CO2 for the sampling time which, in the current example, includes a plurality of breathing cycles during the sampling time. Peak detection may be performed in accordance with embodiments using a suitable method including for example detection ofpeaks - For example, with reference to
FIG. 4B , a peak detection method performed in accordance with embodiments of the present system may select the bins with the greatest number of DPs (e.g., the highest or largest bins). Thus, assuming that each bin has a corresponding group of DPs, the process may select the largest group of DPs. In accordance with embodiments of the present system, the values of DPs in this selected group may then be averaged and an end-tidal CO2 concentration value may then be set to the results of the averaging. - Thus, in accordance with embodiments of the present system, the process may use a peak detection method to determine an end-tidal CO2 concentration without identifying individual breath cycles. In accordance with embodiments of the present system, this may reduce system resources and erroneous data which may otherwise result when using conventional methods which may for example misidentify individual breath cycles.
- Thus, embodiments of the present system may employ a peak-detection method to determine an estimated end-tidal CO2 concentration value without a need to detect individual breath cycles and/or phases (e.g., inspiratory and/or expiratory phases). Rather, the process in accordance with embodiments of the present system, may determine the estimated end-tidal CO2 concentration value based upon an average of end-tidal CO2 concentration values from a plurality of breath cycles during the sampling time and which therefore, need not be individually detected.
- In accordance with embodiments of the present system, a method to determine estimated average end tidal CO2 level and estimated value of the inspiratory CO2 for a sampling time is described with reference to
FIGs. 3, 4A and 4B . For example, with reference toFIG. 4B ,histogram 400B showsbins 402 which have heights that correspond to the number of DPs (or the corresponding CO2 signal) grouped within the correspondingbin 402 for the corresponding sampling time (ts). With reference toFIG. 3 , during a breathing cycle (e.g., encompassing inspiratory and expiratory phases), the majority of a time-based capnogram is comprised of the inspiratory phase (Ip) during which the CO2 signal is near-zero and a plateau phase (PP) during which the CO2 signal is relatively stable near the maximum (end-tidal (ET)) CO2 level. The transition periods between the plateau and inspiratory phases are normally quite brief relative to the other two phases (e.g., the inspiratory and expiratory phases). - Referring to
FIGs. 4A and 4B , during normal stable breathing, a histogram of the CO2 signal taken over a fixed time interval (e.g., the sampling time) has characteristic peaks indicating a large number of values (e.g., high frequency of occurrences) at each the low (inspiratory phase (Ip)) and the high (plateau phase (PP)) extremes (e.g., of the expiratory phase (Ep)) of the observed CO2 signal values. In accordance with embodiments of the present system, the process may analyze the generated histogram to determine the relative frequency of CO2 signal values (e.g. DPs) that land outside of these two peaks (e.g., the two largest bins of thebins 402 shown inFIG. 4B or thepeaks FIG. 4A ) of the histogram. Further, the histogram may be used to identify unstable breathing without a need to detect individual breaths or time-based characteristic features of those breaths. - To perform peak selection, the process may for example analyze the
histogram 400A and select the two highest peaks (401 and 403 of all the peaks) or analyze thehistogram 400B andselect bins 402 with the two largest number of DPs assigned thereto within the histogram from all thebins 402. Of these two largest peaks (401 and 403) orbins 402, the process may determine which peaks/bin corresponds with a larger capnogram signal value (e.g., based upon an average of DPs for example within the corresponding bin 402) and set this peak or bin as a plateau phase (PP) peak (PP_Peak) and may set the other bin(s) 402 as the inspiratory peak (IP_Peak). In accordance with embodiments of the present system, the process may determine an average of the capnogram signal at the plateau-phase peak (PP_Peak) (e.g., by averaging all the DPs within this peak or bin) and set this value as the estimated value of the end tidal (Et) CO2 for the sampling time. Similarly, the process may determine an average of the capnogram signal at the inspiratory peak (IP_Peak) (e.g., by averaging all the DPs within this bin) and set this value as the estimated value of the inspiratory CO2 for the sampling time. After completingact 211, the process may continue to act 214. - During
act 214, the process may identify periods of breath instability without a need to identify individual breaths. In accordance with embodiments of the present system, breath instability may be identified in a histogram by observing for example a high number of samples in the middle concentration range, for example between 15 and 25 mmHg. As recognized in accordance with embodiments of the present system, during breath instability, the capnogram does not quickly alternate between low and high concentration points, but remains in the middle range for prolonged periods. - For an ideal capnogram, the majority (>85%) of DPs are located in the two peaks (IP_peak and PP_peak). In accordance with embodiments of the present system, presence of data between these peaks is indicative of unstable breathing. When the size (tidal volume) and rate of breaths changes, then the height of the individual plateaus combine in the histogram to create a lower PP_peak and possibly smaller peaks that are between the IP_peak and the PP_peak. Another source of DPs that are not part of the peaks is capnometry waveforms that do not contain a plateau. In this case, the PP_peak is low or nonexistent with a number of DPs between the IP_peak and the maximum CO2 value found in the histogram. Another indication of unstable breathing is seen when the maximum CO2 value observed in the histogram is much less than the location of the PP_peak. In the ideal histogram, there is little difference between the location of the PP_peak and the maximum CO2 value as indicated by the highest CO2 value for which a DP is found in the histogram. A high difference between the PP_peak location and the max DP location is an indication of unstable breathing. After completing
act 214, the process may continue to act 215. - During
act 215, the process may determine signal confidence and/or signal quality during the sampling time. In accordance with embodiments of the present system, signal quality may be scored for example using a weighted sum of descriptive parameters calculated from the histogram. For example the average, or peak, of the PP_peak relative to the sampling time may be one parameter. The difference between the PP_peak location and the maximum CO2 may be a descriptive parameter. A smaller difference is indicative of a better quality signal. The sum of DPs that are not part of either the IP_peak or the PP_peak relative to the sampling time may be another parameter. Ideally, the fraction of the DPs that are in neither of the peaks should be low (e.g., less than 20%). A signal quality score may be calculated for example by normalizing each of these parameters by subtracting an offset value and then scaling the parameters up or down by a multiplicative factor. The act of normalizing the inputs may be utilized for example when some parameters are fractions and others are difference values or counts of DPs etc. - In accordance with embodiments of the present system, the signal confidence parameter may be calculated by multiplying each of the normalized descriptive parameters by a weighting factor and summing the results. The weighting factors may be selected for example based on the relative strength of the relationship between the parameter value and signal quality. The signal confidence and/or signal quality may represent a measure of how stable the respiration rate, breath volume (tidal volume) and end-tidal CO2 values are for the sampling time.
- Various methods in accordance with embodiments of the present system to determine signal confidence and/or quality for a sampling time are illustratively described with reference to
FIGs. 7 through 11 below. - For example, a method to identify when CO2 waveforms do not include a consistent expiratory plateau is shown and described with reference to
FIGs. 7A through 8A . This method may be referred to as a percent plateau method and may determine a CO2 parameter quality index (PQI). More particularly,FIG. 7A shows a portion of acapnogram 700A including a normal CO2 waveform formed in accordance with embodiments of the present system. For the sake of clarity, a normal capnogram may be considered to include a capnographic signal with a consistentexpiratory plateau 711 for example as shown.FIG. 7B shows a portion of ahistogram 700B corresponding to thecapnogram 700A formed in accordance with embodiments of the present system.FIG. 8A shows a portion of acapnogram 800A including a CO2 waveform without a consistent expiratory plateau formed in accordance with embodiments of the present system.FIG. 8B shows a portion of ahistogram 800B corresponding to thecapnogram 800A formed in accordance with embodiments of the present system. The method may include an algorithm which may analyze histograms formed in accordance with embodiments of the present system. The algorithm may identify within the histogram baseline samples for example treating everything less than a threshold value, for example of (maxCO2 - minCO2)/2 as baseline data. For example, the algorithm in accordance with embodiments may identify all data within a range (e.g., peak location -5 mm Hg and the peak location +2 mm Hg) and set this data as plateau data. The percent plateau may then be calculated for example as 20 times the plateau sample count divided by the non-baseline sample count. In accordance with embodiments of the present system, the algorithm may update frequency for example every five seconds (however other update frequencies are also envisioned in accordance with embodiments of the present system). With reference toFIG. 8C , a feature mapping function is shown and may illustrate a percent of a signal within the plateau. In accordance with embodiments of the present system, an illustrative CO2 PQI Weighting factor may be set for example equal to 0.25 although other weighting factors may be similarly applied. - It is further envisioned that embodiments of the present system may include a method to identify when there may be breath-to-breath differences in a CO2 waveform of a capnographic signal. This method is illustratively described with reference to
FIG. 9 which shows agraph 900 of a feature mapping function generated in accordance with embodiments of the present system. The method may include an algorithm which may determine a difference between a plateau CO2 (e.g., a plateau value) as calculated from a histogram and a max observed CO2 during a period such as for example the past 30 seconds. The plateau value may be determined as a most commonly occurring CO2 value that is higher than the midpoint between the max and min CO2 during the prior 30 seconds. The update frequency for this algorithm may be set to any desired value such as 5 seconds. Further, this algorithm may employ a weighing factor (e.g., a CO2 PQI Weighting factor = 0.25). - It should be noted that while the above illustrates algorithms for example in accordance with embodiments of the present system, other calculations (e.g., different plateau value calculations, weighting factors, etc.) are also considered in accordance with embodiments of the present system. For example, when unstable breathing is determined, the algorithm may render a message such as "Unstable Breathing." Accordingly, this parameter may be used to identify breath-to-breath differences in the CO2 waveform such as a case wherein there may be for example a single elevated CO2 value and the rest of the waveform plateaus are lower. In accordance with embodiments, the algorithm may consider the CO2 signal during a period such as the previous 30 seconds, there may be a chance that a most commonly occurring plateau and the maximum CO2 during the 30 second window are very different. In a stable capnogram, the difference should be small, such as less than 4 mm Hg. When there is a large difference between the plateau and the max (e.g., the max occurring CO2), this is an indication of unstable breathing. For example, a difference of 7 mm Hg or more may be utilized to indicate unstable breathing. In accordance with embodiments, a larger indication may be utilized to indicate very unstable breathing. For example, in accordance with embodiments, a difference greater than 10 mm Hg may be utilized to indicate that the breathing is very unstable.
- A method to identify when a capnogram lacks a common plateau value during an analysis period will now be described with reference to
FIGs. 10 and 11. FIG. 10 shows a portion of ahistogram 1000 corresponding to a capnogram formed in accordance with embodiments of the present system.FIG. 11 shows agraph 1100 of a feature mapping function generated in accordance with embodiments of the present system. Generally, when a capnogram spends a disproportionate time in the transition and not at either the plateau or trough, a value formed in accordance with embodiments of the present system may be low. The method may include an algorithm which may analyze a histogram such as the histogram shown inFIG. 10 to find a most commonly occurring high value (max) that may be used to represent a plateau of a plateau phase. Then, the algorithm may calculate an average histogram value in a range between a low peak (trough) +z and a location of a maximally occurring high peak -z, where z =5. Then, the algorithm may determine a difference between the max value and a mid-range value as shown. The algorithm may include an update frequency of, for example, 5 seconds. Accordingly, the histogram may be analyzed every 5 seconds. A feature mapping function of this algorithm may be similar to that shown inFIG. 11 . The algorithm may include a weighing factor such as equal to 0.25. When it is determined that there is a low tidal volume, the algorithm may render a message such as "LOW TIDAL VOLUME DETECTED". - In accordance with embodiments of the present system, the process may further compare the signal confidence or quality for the current sampling time with the signal confidence or quality, respectively, for a previous sampling time (e.g., a most recent or other selected sampling time as may be selected by the system and/or user) and determine a signal trend. For example, in a case wherein the signal quality of the current sampling time is determined to have improved, the signal quality trend indicator may be represented as a score such as 10 out of 10, 100 out of 100 (etc.), a "+" and/or a green highlight. Conversely, in a case wherein the signal quality of the current sampling time is determined to have not improved, the signal quality trend indicator may be represented as a score such as 1 out of 10, 1 out of 100 (etc.), a "-" and/or a red highlight. Finally, in a case wherein no change is detected in the signal quality, the signal quality trend indicator may be represented as a "0" as the same score as the previous signal quality indicator, and/or a gray highlight. In accordance with embodiments of the present system, the process may determine signal confidence trend indicators similarly.
- During
act 217, the process may render results of the process. For example, the process may render one or more of the determined capnometry signals, the end-tidal CO2 value, the estimated respiration rate, the signal confidence, the signal quality, the signal confidence trend indicator, and the signal quality trend indicator for the corresponding sampling time. For example,FIG. 5 shows agraph 500 including acapnogram 501 rendered in accordance with embodiments of the present system. More particularly, thegraph 500 may include information generated by the process such as one or more of acapnogram 501, acapnometry signal 502, a sampling timeselection menu slider 504, for example including includesliders 507 and/or 509, and amenu 506. Thesliders 507 and/or 509 may be utilized (e.g., moved) to select tc and ts, respectively. In accordance with embodiments of the present system, to increase the sampling time, the user may drag theslider 507 to the left and set theslider 509 in a right-most position. - The
menu 506 may include results of the process such as information related to one or more of an end-tidal CO2 value 508,respiratory rate 510,signal quality 512, and signalconfidence 514. Further, as shown thesignal quality 512 andsignal confidence 514 may include correspondingsignal trend indicators sliders 507 and/or 509 to change a sampling time in real time as may be desired. After completingact 217, the process may continue to act 219. - During
act 219, the process may update a system history which may be stored in a memory of the system to record results of the process. In accordance with embodiments of the present system, the process may thereafter repeatact 207, etc. as shown. In accordance with embodiments of the present system, the process may end when an end signal is detected. The end signal may be generated for example by a user and/or the system such as when disconnection of the physical interface is detected or otherwise indicated. -
FIG. 6 shows a portion of asystem 600 in accordance with embodiments of the present system. For example, a portion of the present system may include a processor 610 (e.g., a controller) operationally coupled to amemory 620, a rendering device such as adisplay 630,sensors 640,actuators 660, anetwork 680, and auser input device 670. Thememory 620 may be any type of device for storing application data as well as other data related to the described operation. The application data and other data are received by theprocessor 610 for configuring (e.g., programming) theprocessor 610 to perform operation acts in accordance with the present system. Theprocessor 610 so configured becomes a special purpose machine particularly suited for performing in accordance with embodiments of the present system. - The
user input 670 may include a keyboard, a mouse, a trackball, or other device, such as a touch-sensitive display, which may be stand alone or be a part of a system, such as part of a personal computer, a personal digital assistant (PDA), a mobile phone (e.g., a smart phone), a monitor, a wearable display (e.g., smart glasses, etc.), a smartor dumb-terminal or other device for communicating with theprocessor 610 via any operable link. Theuser input device 670 may be operable for interacting with theprocessor 610 including enabling interaction within a user interface (UI) as described herein. Clearly theprocessor 610, thememory 620,display 630, and/oruser input device 670 may all or partly be a portion of a computer system or other device such as a client and/or server type device. - The
actuators 660 may include one or more motors, transducers, etc. which may provide a force to operate one or more valves, mixers, or the like of theSSM 160 under the control of theprocessor 610. These valves may, for example, include pneumatic control valves which may control the flow of one or more gasses for ventilation, etc. - The methods of the present system are particularly suited to be carried out by a computer software program, such program may contain one or more modules corresponding to one or more of the individual steps or acts described and/or envisioned by the present system. Such program may of course be embodied in a computer-readable medium, such as an integrated chip, a peripheral device or memory, such as the
memory 620 or other memory coupled to theprocessor 610. - The program and/or program portions contained in the
memory 620 may configure theprocessor 610 to implement the methods, operational acts, and functions disclosed herein. The memories may be distributed, for example between the clients and/or servers, or local, and theprocessor 610, where additional processors may be provided, may also be distributed or may be singular. The memories may be implemented as electrical, magnetic or optical memory, or any combination of these or other types of storage devices. Moreover, the term "memory" should be construed broadly enough to encompass any information able to be read from or written to an address in an addressable space accessible by theprocessor 610. Thememory 620 may include a non-transitory memory. With this definition, information accessible through a network such as thenetwork 680 is still within the memory, for instance, because theprocessor 610 may retrieve the information from thenetwork 680 for operation in accordance with the present system. - The
processor 610 is operable for providing control signals and/or performing operations in response to input signals from theuser input device 670 as well as in response to other devices of a network and executing instructions stored in thememory 620. Theprocessor 610 may include one or more of a microprocessor, an applicationspecific or general-use integrated circuit(s), a logic device, etc. Further, theprocessor 610 may be a dedicated processor for performing in accordance with the present system or may be a general-purpose processor wherein only one of many functions operates for performing in accordance with the present system. Theprocessor 610 may operate utilizing a program portion, multiple program segments, or may be a hardware device utilizing a dedicated or multi-purpose integrated circuit. - Accordingly, embodiments, of the present system may provide an enhanced gas monitoring system such as a side-stream CO2 monitoring system for in-patient as well as out-patient procedures and care which may analyze a capnometry signal to determine one or more characteristics of the signal such as signal quality, confidence, breaths-per-minute (BPM), and end-tidal CO2 values. Accordingly, embodiments of the present system may provide a side-stream CO2 monitoring system that may be used with, for example, critical-care ventilators, home ventilators, multi-parameter monitors and the like. Further, it is envisioned that these CO2 monitoring systems operating in accordance with embodiments of the present system may be used in various medical environments such as endoscopy suites, intensive-care units (ICU), operating rooms (OR), emergency rooms, ambulatory care, and/or other medical facilities.
- While the present invention has been shown and described with reference to particular exemplary embodiments, it will be understood by those skilled in the art that present invention is not limited thereto, but that various changes in form and details, including the combination of various features and embodiments, may be made therein without departing from the scope of the invention.
- Further variations of the present system would readily occur to a person of ordinary skill in the art and are encompassed by the following claims.
- Finally, the above-discussion is intended to be merely illustrative of the present system and should not be construed as limiting the appended claims to any particular embodiment or group of embodiments. Thus, while the present system has been described with reference to exemplary embodiments, it should also be appreciated that numerous modifications and alternative embodiments may be devised by those having ordinary skill in the art without departing from the broader and intended scope of the present system as set forth in the claims that follow. Accordingly, the specification and drawings are to be regarded in an illustrative manner and are not intended to limit the scope of the appended claims.
- In interpreting the appended claims, it should be understood that:
- a) the word "comprising" does not exclude the presence of other elements or acts than those listed in a given claim;
- b) the word "a" or "an" preceding an element does not exclude the presence of a plurality of such elements;
- c) any reference signs in the claims do not limit their scope;
- d) several "means" may be represented by the same item or hardware or software implemented structure or function;
- e) any of the disclosed elements may be comprised of hardware portions (e.g., including discrete and integrated electronic circuitry), software portions (e.g., computer programming), and any combination thereof;
- f) hardware portions may be comprised of one or both of analog and digital portions;
- g) any of the disclosed devices or portions thereof may be combined together or separated into further portions unless specifically stated otherwise;
- h) no specific sequence of acts or steps is intended to be required unless specifically indicated;
- i) the term "plurality of" an element includes two or more of the claimed element, and does not imply any particular range of number of elements; that is, a plurality of elements may be as few as two elements, and may include an immeasurable number of elements; and
- j) the term and/or and formatives thereof should be understood to mean that only one or more of the listed elements may need to be suitably present in the system in accordance with the claims recitation and in accordance with one or more embodiments of the present system.
Claims (14)
- A gas concentration monitoring system (100, 600), comprising:a sensor (164) for detecting a concentration of a selected gas in a sample gas flow obtained from a physical interface (107) to a patient (101);a processor (110, 610) configured to:receive the detected concentration;form a dataset comprising a plurality of data points, each data point corresponding to the detected concentration of the selected gas within the sample gas flow at a corresponding time within a sampling time corresponding to a plurality of breathing cycles of the patient wherein each breathing cycles includes inspiratory and expiratory phases;group the data points according to a frequency of occurrence of the data points within the sampling time; andperform peak detection of the frequency of occurrence to determine at least one of a signal confidence and signal quality based on relative characteristics between the groups of data points and at least one of an end tidal concentration without detecting individual breath cycles and/or phases and breath instability without identifying individual breaths.
- The gas concentration monitoring system of claim 1, wherein the processor is configured to group the data points with each grouping corresponding to a different range of concentrations of the selected gas.
- The gas concentration monitoring system of claim 1, wherein the processor is configured to determine the at least one of a signal confidence and signal quality based upon a relative number of data points that are present within the groups of data points.
- The gas concentration monitoring system of claim 1, further comprising a rendering device (130, 630) coupled to the processor, wherein the processor is configured to render the groups of data points as a histogram on the rendering device.
- The gas concentration monitoring system of claim 1, wherein the processor is configured to identify two groups of data points that correspondingly have a largest and next largest number of data points amongst the groups of data points.
- The gas concentration monitoring system of claim 5, wherein the processor is configured to determine a number of data points between the two groups of data points and is configured to determine the at least one of a signal confidence and signal quality based upon the determined number of data points.
- The gas concentration monitoring system of claim 1, wherein the physical interface comprises a nasal cannula or mask (108) configured for coupling to the patient.
- The gas concentration monitoring system of claim 1, further comprising a pneumatic system (103) controlled by the processor to provide a ventilation gas mixture to the physical interface for inhalation by the patient.
- A method of monitoring capnography signals comprising: obtaining a concentration of a selected gas in a sample gas flow obtained from a physical interface (107) to a patient;forming a dataset comprising a plurality of data points, each data point corresponding to the detected concentration of the selected gas within the sample gas flow at a corresponding time within a sampling time corresponding to a plurality of breathing cycles of the patient wherein each breathing cycles includes inspiratory and expiratory phases;grouping the data points according to a frequency of occurrence of the data points within the sampling time;performing peak detection of the frequency of occurrence and determining at least one of a signal confidence and signal quality based on relative characteristics between the groups of data points and at least one of an end tidal concentration without detecting individual breath cycles and/or phases and detecting breath instability without identifying individual breaths.
- The method of claim 9, wherein the act of grouping the data points comprises an act of grouping the data points based on different ranges of concentrations of the selected gas.
- The method of claim 9, wherein the act of determining the at least one of a signal confidence and signal quality comprises an act of determining a relative number of data points that are present within the groups of data points.
- The method of claim 9, comprising an act of rendering the groups of data points as a histogram on the rendering device (130, 630).
- The method of claim 9, comprising an act of:identifying two groups of data points that correspondingly have a largest and next largest number of data points amongst the groups of data points; andoptionally determining a number of data points between the two groups of data points, wherein the act of determining the at least one of a signal confidence and signal quality is based upon the determined number of data points.
- A computer program comprising computer program code means which is adapted, when said program is run on a computer, to implement the method of any one of claims 9 to 13.
Applications Claiming Priority (2)
| Application Number | Priority Date | Filing Date | Title |
|---|---|---|---|
| US201462098367P | 2014-12-31 | 2014-12-31 | |
| PCT/IB2015/059652 WO2016108121A1 (en) | 2014-12-31 | 2015-12-16 | System for performing histogram analysis of the time-based capnography signals and method of operation thereof |
Publications (2)
| Publication Number | Publication Date |
|---|---|
| EP3240478A1 EP3240478A1 (en) | 2017-11-08 |
| EP3240478B1 true EP3240478B1 (en) | 2022-04-06 |
Family
ID=55080139
Family Applications (1)
| Application Number | Title | Priority Date | Filing Date |
|---|---|---|---|
| EP15823024.3A Active EP3240478B1 (en) | 2014-12-31 | 2015-12-16 | System for performing histogram analysis of the time-based capnography signals and method of operation thereof |
Country Status (5)
| Country | Link |
|---|---|
| US (1) | US10869614B2 (en) |
| EP (1) | EP3240478B1 (en) |
| JP (1) | JP6865686B2 (en) |
| CN (1) | CN107427259B (en) |
| WO (1) | WO2016108121A1 (en) |
Families Citing this family (6)
| Publication number | Priority date | Publication date | Assignee | Title |
|---|---|---|---|---|
| EP3334339B1 (en) * | 2015-08-11 | 2019-09-11 | Koninklijke Philips N.V. | Capnography with decision support system architecture |
| US20190365281A1 (en) * | 2017-01-16 | 2019-12-05 | Koninklijke Philips N.V. | Physiologic monitoring decision support system combining capnometry and oxygen saturation |
| US10909177B1 (en) * | 2017-01-17 | 2021-02-02 | Workday, Inc. | Percentile determination system |
| SG11202004017XA (en) | 2017-11-22 | 2020-06-29 | Fisher & Paykel Healthcare Ltd | Respiratory rate monitoring for respiratory flow therapy systems |
| CN111936944A (en) * | 2017-12-18 | 2020-11-13 | 三菱电机株式会社 | Display control device, display system, display device, display method, and display program |
| CN109621121B (en) * | 2018-12-29 | 2022-03-15 | 北京谊安医疗系统股份有限公司 | Detection method and detection system for mechanical control ventilation state |
Family Cites Families (26)
| Publication number | Priority date | Publication date | Assignee | Title |
|---|---|---|---|---|
| JP2791476B2 (en) * | 1988-06-08 | 1998-08-27 | フィガロ技研株式会社 | Gas detector |
| US6033368A (en) * | 1996-03-28 | 2000-03-07 | Nitromed, Inc. | Condensate colorimetric nitrogen oxide analyzer |
| US5971934A (en) * | 1996-10-04 | 1999-10-26 | Trustees Of The University Of Pennsylvania | Noninvasive method and apparatus for determining cardiac output |
| US6099481A (en) | 1997-11-03 | 2000-08-08 | Ntc Technology, Inc. | Respiratory profile parameter determination method and apparatus |
| US6534769B1 (en) * | 1999-12-31 | 2003-03-18 | Ge Medical Systems Information Technologies, Inc. | Low cost main stream gas analyzer system |
| DE10014427A1 (en) | 2000-03-24 | 2001-10-04 | Weinmann G Geraete Med | Method for controlling a ventilator and device for monitoring |
| WO2001082782A2 (en) * | 2000-04-29 | 2001-11-08 | The Regents Of The University Of California | Estimation of parameters indicating nitric oxide production |
| US7802571B2 (en) * | 2003-11-21 | 2010-09-28 | Tehrani Fleur T | Method and apparatus for controlling a ventilator |
| DE102004039194A1 (en) * | 2004-08-12 | 2006-02-23 | Universitätsklinikum Freiburg | Apparatus and method for detecting and evaluating expirograms |
| JP4593243B2 (en) * | 2004-11-18 | 2010-12-08 | 株式会社トプコン | Air particle monitoring device and vacuum processing device |
| US7427269B2 (en) * | 2005-12-12 | 2008-09-23 | The Regents Of The University Of California | Accurate method to characterize airway nitric oxide using different breath-hold times including axial diffusion of nitric oxide using heliox and breath hold |
| JP2009538720A (en) * | 2006-06-01 | 2009-11-12 | ビアンカメッド リミテッド | Apparatus, system, and method for monitoring physiological signs |
| US20080059224A1 (en) | 2006-08-31 | 2008-03-06 | Schechter Alan M | Systems and methods for developing a comprehensive patient health profile |
| DE202008007748U1 (en) * | 2008-06-05 | 2008-09-18 | Filt Lungen- Und Thoraxdiagnostik Gmbh | Apparatus for conditioning gases |
| US8398555B2 (en) | 2008-09-10 | 2013-03-19 | Covidien Lp | System and method for detecting ventilatory instability |
| US20110245705A1 (en) | 2008-12-09 | 2011-10-06 | Koninklijke Philips Electronics N.V. | Determining the functional residual capacity of a subject |
| NZ700304A (en) | 2009-04-20 | 2016-03-31 | Resmed Ltd | Discrimination of cheyne-stokes breathing patterns by use of oximetry signals |
| US8233987B2 (en) * | 2009-09-10 | 2012-07-31 | Respicardia, Inc. | Respiratory rectification |
| WO2011101776A1 (en) * | 2010-02-17 | 2011-08-25 | Koninklijke Philips Electronics N.V. | Nitric oxide measurement method and apparatus |
| JP5531715B2 (en) | 2010-03-30 | 2014-06-25 | コニカミノルタ株式会社 | Biological information measuring apparatus and method |
| CN103153183B (en) * | 2010-10-01 | 2015-11-25 | 皇家飞利浦电子股份有限公司 | For diagnosing the apparatus and method of obstructive sleep apnea |
| DE102010054397A1 (en) * | 2010-12-08 | 2012-06-14 | Aerocrine Ab | Method and apparatus for gas sampling |
| US9907511B2 (en) * | 2010-12-17 | 2018-03-06 | Koninklijke Philips N.V. | System and method of identifying breaths based solely on capnographic information |
| AU2012231762B2 (en) | 2011-03-23 | 2015-06-18 | Resmed Limited | Detection of ventilation sufficiency |
| US20140288440A1 (en) | 2013-03-22 | 2014-09-25 | Children's Medical Center Corporation | Systems and methods for quantitative capnogram analysis |
| WO2014203104A1 (en) * | 2013-06-19 | 2014-12-24 | Koninklijke Philips N.V. | Determining of subject zero flow using cluster analysis |
-
2015
- 2015-12-16 WO PCT/IB2015/059652 patent/WO2016108121A1/en active Application Filing
- 2015-12-16 JP JP2017534703A patent/JP6865686B2/en active Active
- 2015-12-16 EP EP15823024.3A patent/EP3240478B1/en active Active
- 2015-12-16 CN CN201580077060.6A patent/CN107427259B/en active Active
- 2015-12-16 US US15/540,151 patent/US10869614B2/en active Active
Also Published As
| Publication number | Publication date |
|---|---|
| CN107427259A (en) | 2017-12-01 |
| WO2016108121A1 (en) | 2016-07-07 |
| EP3240478A1 (en) | 2017-11-08 |
| JP2018501883A (en) | 2018-01-25 |
| JP6865686B2 (en) | 2021-04-28 |
| US20170367620A1 (en) | 2017-12-28 |
| US10869614B2 (en) | 2020-12-22 |
| CN107427259B (en) | 2021-03-16 |
Similar Documents
| Publication | Publication Date | Title |
|---|---|---|
| EP3240478B1 (en) | System for performing histogram analysis of the time-based capnography signals and method of operation thereof | |
| EP2651293B1 (en) | System and method for determining one or more breathing parameters of a subject | |
| CN101938939B (en) | Apparatus for measuring and predicting patients' respiratory stability | |
| JP6960913B2 (en) | Anomaly detectors and methods for estimating respiratory dynamics parameters | |
| US20120272962A1 (en) | Methods and systems for managing a ventilator patient with a capnometer | |
| JP5647984B2 (en) | System and method for detecting deficiency in breathing of a subject | |
| CN107106083B (en) | Capnometry system with supplemental oxygen detection and method of operating same | |
| US20140330155A1 (en) | Method and apparatus for monitoring and controlling a pressure support device | |
| US20110009764A1 (en) | Devices, systems, and methods for aiding in the detection of a physiological abnormality | |
| EP2651294B1 (en) | System and method of identifying breaths based solely on capnographic information | |
| US20190365281A1 (en) | Physiologic monitoring decision support system combining capnometry and oxygen saturation | |
| EP3334339B1 (en) | Capnography with decision support system architecture | |
| US20160058346A1 (en) | Determination of arterial co2 partial pressure | |
| US20100041062A1 (en) | Devices, systems, and methods for aiding in the detection of a physiological abnormality | |
| US20140236035A1 (en) | Method and system for automated ventilator monitoring to ensure lung-protective ventilation | |
| Ivanov et al. | Prediction of critical pulmonary shunts in infants | |
| US20180117271A1 (en) | System for pneumatic testing of gas flow module and method of operation thereof | |
| US11541162B2 (en) | Method of managing medical suction device through network and management server used for the same | |
| US20230094608A1 (en) | Pendelluft detection by acoustic interferometry through an endotracheal tube |
Legal Events
| Date | Code | Title | Description |
|---|---|---|---|
| STAA | Information on the status of an ep patent application or granted ep patent |
Free format text: STATUS: THE INTERNATIONAL PUBLICATION HAS BEEN MADE |
|
| PUAI | Public reference made under article 153(3) epc to a published international application that has entered the european phase |
Free format text: ORIGINAL CODE: 0009012 |
|
| STAA | Information on the status of an ep patent application or granted ep patent |
Free format text: STATUS: REQUEST FOR EXAMINATION WAS MADE |
|
| 17P | Request for examination filed |
Effective date: 20170731 |
|
| AK | Designated contracting states |
Kind code of ref document: A1 Designated state(s): AL AT BE BG CH CY CZ DE DK EE ES FI FR GB GR HR HU IE IS IT LI LT LU LV MC MK MT NL NO PL PT RO RS SE SI SK SM TR |
|
| AX | Request for extension of the european patent |
Extension state: BA ME |
|
| DAV | Request for validation of the european patent (deleted) | ||
| DAX | Request for extension of the european patent (deleted) | ||
| RAP1 | Party data changed (applicant data changed or rights of an application transferred) |
Owner name: KONINKLIJKE PHILIPS N.V. |
|
| GRAP | Despatch of communication of intention to grant a patent |
Free format text: ORIGINAL CODE: EPIDOSNIGR1 |
|
| STAA | Information on the status of an ep patent application or granted ep patent |
Free format text: STATUS: GRANT OF PATENT IS INTENDED |
|
| GRAJ | Information related to disapproval of communication of intention to grant by the applicant or resumption of examination proceedings by the epo deleted |
Free format text: ORIGINAL CODE: EPIDOSDIGR1 |
|
| GRAP | Despatch of communication of intention to grant a patent |
Free format text: ORIGINAL CODE: EPIDOSNIGR1 |
|
| STAA | Information on the status of an ep patent application or granted ep patent |
Free format text: STATUS: GRANT OF PATENT IS INTENDED |
|
| INTG | Intention to grant announced |
Effective date: 20211011 |
|
| INTG | Intention to grant announced |
Effective date: 20211027 |
|
| GRAS | Grant fee paid |
Free format text: ORIGINAL CODE: EPIDOSNIGR3 |
|
| GRAA | (expected) grant |
Free format text: ORIGINAL CODE: 0009210 |
|
| STAA | Information on the status of an ep patent application or granted ep patent |
Free format text: STATUS: THE PATENT HAS BEEN GRANTED |
|
| AK | Designated contracting states |
Kind code of ref document: B1 Designated state(s): AL AT BE BG CH CY CZ DE DK EE ES FI FR GB GR HR HU IE IS IT LI LT LU LV MC MK MT NL NO PL PT RO RS SE SI SK SM TR |
|
| REG | Reference to a national code |
Ref country code: GB Ref legal event code: FG4D |
|
| REG | Reference to a national code |
Ref country code: CH Ref legal event code: EP |
|
| REG | Reference to a national code |
Ref country code: AT Ref legal event code: REF Ref document number: 1480533 Country of ref document: AT Kind code of ref document: T Effective date: 20220415 |
|
| REG | Reference to a national code |
Ref country code: DE Ref legal event code: R096 Ref document number: 602015078082 Country of ref document: DE |
|
| REG | Reference to a national code |
Ref country code: IE Ref legal event code: FG4D |
|
| REG | Reference to a national code |
Ref country code: LT Ref legal event code: MG9D |
|
| REG | Reference to a national code |
Ref country code: NL Ref legal event code: MP Effective date: 20220406 |
|
| REG | Reference to a national code |
Ref country code: AT Ref legal event code: MK05 Ref document number: 1480533 Country of ref document: AT Kind code of ref document: T Effective date: 20220406 |
|
| PG25 | Lapsed in a contracting state [announced via postgrant information from national office to epo] |
Ref country code: NL Free format text: LAPSE BECAUSE OF FAILURE TO SUBMIT A TRANSLATION OF THE DESCRIPTION OR TO PAY THE FEE WITHIN THE PRESCRIBED TIME-LIMIT Effective date: 20220406 |
|
| PG25 | Lapsed in a contracting state [announced via postgrant information from national office to epo] |
Ref country code: SE Free format text: LAPSE BECAUSE OF FAILURE TO SUBMIT A TRANSLATION OF THE DESCRIPTION OR TO PAY THE FEE WITHIN THE PRESCRIBED TIME-LIMIT Effective date: 20220406 Ref country code: PT Free format text: LAPSE BECAUSE OF FAILURE TO SUBMIT A TRANSLATION OF THE DESCRIPTION OR TO PAY THE FEE WITHIN THE PRESCRIBED TIME-LIMIT Effective date: 20220808 Ref country code: NO Free format text: LAPSE BECAUSE OF FAILURE TO SUBMIT A TRANSLATION OF THE DESCRIPTION OR TO PAY THE FEE WITHIN THE PRESCRIBED TIME-LIMIT Effective date: 20220706 Ref country code: LT Free format text: LAPSE BECAUSE OF FAILURE TO SUBMIT A TRANSLATION OF THE DESCRIPTION OR TO PAY THE FEE WITHIN THE PRESCRIBED TIME-LIMIT Effective date: 20220406 Ref country code: HR Free format text: LAPSE BECAUSE OF FAILURE TO SUBMIT A TRANSLATION OF THE DESCRIPTION OR TO PAY THE FEE WITHIN THE PRESCRIBED TIME-LIMIT Effective date: 20220406 Ref country code: GR Free format text: LAPSE BECAUSE OF FAILURE TO SUBMIT A TRANSLATION OF THE DESCRIPTION OR TO PAY THE FEE WITHIN THE PRESCRIBED TIME-LIMIT Effective date: 20220707 Ref country code: FI Free format text: LAPSE BECAUSE OF FAILURE TO SUBMIT A TRANSLATION OF THE DESCRIPTION OR TO PAY THE FEE WITHIN THE PRESCRIBED TIME-LIMIT Effective date: 20220406 Ref country code: ES Free format text: LAPSE BECAUSE OF FAILURE TO SUBMIT A TRANSLATION OF THE DESCRIPTION OR TO PAY THE FEE WITHIN THE PRESCRIBED TIME-LIMIT Effective date: 20220406 Ref country code: BG Free format text: LAPSE BECAUSE OF FAILURE TO SUBMIT A TRANSLATION OF THE DESCRIPTION OR TO PAY THE FEE WITHIN THE PRESCRIBED TIME-LIMIT Effective date: 20220706 Ref country code: AT Free format text: LAPSE BECAUSE OF FAILURE TO SUBMIT A TRANSLATION OF THE DESCRIPTION OR TO PAY THE FEE WITHIN THE PRESCRIBED TIME-LIMIT Effective date: 20220406 |
|
| PG25 | Lapsed in a contracting state [announced via postgrant information from national office to epo] |
Ref country code: RS Free format text: LAPSE BECAUSE OF FAILURE TO SUBMIT A TRANSLATION OF THE DESCRIPTION OR TO PAY THE FEE WITHIN THE PRESCRIBED TIME-LIMIT Effective date: 20220406 Ref country code: PL Free format text: LAPSE BECAUSE OF FAILURE TO SUBMIT A TRANSLATION OF THE DESCRIPTION OR TO PAY THE FEE WITHIN THE PRESCRIBED TIME-LIMIT Effective date: 20220406 Ref country code: LV Free format text: LAPSE BECAUSE OF FAILURE TO SUBMIT A TRANSLATION OF THE DESCRIPTION OR TO PAY THE FEE WITHIN THE PRESCRIBED TIME-LIMIT Effective date: 20220406 Ref country code: IS Free format text: LAPSE BECAUSE OF FAILURE TO SUBMIT A TRANSLATION OF THE DESCRIPTION OR TO PAY THE FEE WITHIN THE PRESCRIBED TIME-LIMIT Effective date: 20220806 |
|
| REG | Reference to a national code |
Ref country code: DE Ref legal event code: R097 Ref document number: 602015078082 Country of ref document: DE |
|
| PG25 | Lapsed in a contracting state [announced via postgrant information from national office to epo] |
Ref country code: SM Free format text: LAPSE BECAUSE OF FAILURE TO SUBMIT A TRANSLATION OF THE DESCRIPTION OR TO PAY THE FEE WITHIN THE PRESCRIBED TIME-LIMIT Effective date: 20220406 Ref country code: SK Free format text: LAPSE BECAUSE OF FAILURE TO SUBMIT A TRANSLATION OF THE DESCRIPTION OR TO PAY THE FEE WITHIN THE PRESCRIBED TIME-LIMIT Effective date: 20220406 Ref country code: RO Free format text: LAPSE BECAUSE OF FAILURE TO SUBMIT A TRANSLATION OF THE DESCRIPTION OR TO PAY THE FEE WITHIN THE PRESCRIBED TIME-LIMIT Effective date: 20220406 Ref country code: EE Free format text: LAPSE BECAUSE OF FAILURE TO SUBMIT A TRANSLATION OF THE DESCRIPTION OR TO PAY THE FEE WITHIN THE PRESCRIBED TIME-LIMIT Effective date: 20220406 Ref country code: DK Free format text: LAPSE BECAUSE OF FAILURE TO SUBMIT A TRANSLATION OF THE DESCRIPTION OR TO PAY THE FEE WITHIN THE PRESCRIBED TIME-LIMIT Effective date: 20220406 Ref country code: CZ Free format text: LAPSE BECAUSE OF FAILURE TO SUBMIT A TRANSLATION OF THE DESCRIPTION OR TO PAY THE FEE WITHIN THE PRESCRIBED TIME-LIMIT Effective date: 20220406 |
|
| PGFP | Annual fee paid to national office [announced via postgrant information from national office to epo] |
Ref country code: DE Payment date: 20220628 Year of fee payment: 8 |
|
| PLBE | No opposition filed within time limit |
Free format text: ORIGINAL CODE: 0009261 |
|
| STAA | Information on the status of an ep patent application or granted ep patent |
Free format text: STATUS: NO OPPOSITION FILED WITHIN TIME LIMIT |
|
| 26N | No opposition filed |
Effective date: 20230110 |
|
| PG25 | Lapsed in a contracting state [announced via postgrant information from national office to epo] |
Ref country code: AL Free format text: LAPSE BECAUSE OF FAILURE TO SUBMIT A TRANSLATION OF THE DESCRIPTION OR TO PAY THE FEE WITHIN THE PRESCRIBED TIME-LIMIT Effective date: 20220406 |
|
| PG25 | Lapsed in a contracting state [announced via postgrant information from national office to epo] |
Ref country code: SI Free format text: LAPSE BECAUSE OF FAILURE TO SUBMIT A TRANSLATION OF THE DESCRIPTION OR TO PAY THE FEE WITHIN THE PRESCRIBED TIME-LIMIT Effective date: 20220406 |
|
| REG | Reference to a national code |
Ref country code: CH Ref legal event code: PL |
|
| GBPC | Gb: european patent ceased through non-payment of renewal fee |
Effective date: 20221216 |
|
| REG | Reference to a national code |
Ref country code: BE Ref legal event code: MM Effective date: 20221231 |
|
| PG25 | Lapsed in a contracting state [announced via postgrant information from national office to epo] |
Ref country code: LU Free format text: LAPSE BECAUSE OF NON-PAYMENT OF DUE FEES Effective date: 20221216 |
|
| PG25 | Lapsed in a contracting state [announced via postgrant information from national office to epo] |
Ref country code: LI Free format text: LAPSE BECAUSE OF NON-PAYMENT OF DUE FEES Effective date: 20221231 Ref country code: IE Free format text: LAPSE BECAUSE OF NON-PAYMENT OF DUE FEES Effective date: 20221216 Ref country code: GB Free format text: LAPSE BECAUSE OF NON-PAYMENT OF DUE FEES Effective date: 20221216 Ref country code: CH Free format text: LAPSE BECAUSE OF NON-PAYMENT OF DUE FEES Effective date: 20221231 |
|
| PG25 | Lapsed in a contracting state [announced via postgrant information from national office to epo] |
Ref country code: FR Free format text: LAPSE BECAUSE OF NON-PAYMENT OF DUE FEES Effective date: 20221231 Ref country code: BE Free format text: LAPSE BECAUSE OF NON-PAYMENT OF DUE FEES Effective date: 20221231 |
|
| PG25 | Lapsed in a contracting state [announced via postgrant information from national office to epo] |
Ref country code: IT Free format text: LAPSE BECAUSE OF FAILURE TO SUBMIT A TRANSLATION OF THE DESCRIPTION OR TO PAY THE FEE WITHIN THE PRESCRIBED TIME-LIMIT Effective date: 20220406 |
|
| PG25 | Lapsed in a contracting state [announced via postgrant information from national office to epo] |
Ref country code: HU Free format text: LAPSE BECAUSE OF FAILURE TO SUBMIT A TRANSLATION OF THE DESCRIPTION OR TO PAY THE FEE WITHIN THE PRESCRIBED TIME-LIMIT; INVALID AB INITIO Effective date: 20151216 |