EP3236597A1 - Network control apparatus and transmission quality margin calculation method - Google Patents
Network control apparatus and transmission quality margin calculation method Download PDFInfo
- Publication number
- EP3236597A1 EP3236597A1 EP17163027.0A EP17163027A EP3236597A1 EP 3236597 A1 EP3236597 A1 EP 3236597A1 EP 17163027 A EP17163027 A EP 17163027A EP 3236597 A1 EP3236597 A1 EP 3236597A1
- Authority
- EP
- European Patent Office
- Prior art keywords
- osnr
- ber
- noise intensity
- reception
- margin
- Prior art date
- Legal status (The legal status is an assumption and is not a legal conclusion. Google has not performed a legal analysis and makes no representation as to the accuracy of the status listed.)
- Withdrawn
Links
- 230000005540 biological transmission Effects 0.000 title claims abstract description 120
- 238000004364 calculation method Methods 0.000 title claims description 11
- 238000012937 correction Methods 0.000 claims description 66
- 238000004891 communication Methods 0.000 claims description 13
- 230000003287 optical effect Effects 0.000 description 36
- 238000005259 measurement Methods 0.000 description 19
- 238000012545 processing Methods 0.000 description 14
- 238000000034 method Methods 0.000 description 12
- 239000000470 constituent Substances 0.000 description 5
- 230000006870 function Effects 0.000 description 5
- 239000013307 optical fiber Substances 0.000 description 4
- 238000001228 spectrum Methods 0.000 description 4
- 238000013461 design Methods 0.000 description 3
- 238000010586 diagram Methods 0.000 description 3
- 239000000835 fiber Substances 0.000 description 2
- 238000012544 monitoring process Methods 0.000 description 2
- 230000010363 phase shift Effects 0.000 description 2
- 230000002269 spontaneous effect Effects 0.000 description 2
- 230000006866 deterioration Effects 0.000 description 1
- 230000010354 integration Effects 0.000 description 1
Images


Classifications
-
- H—ELECTRICITY
- H04—ELECTRIC COMMUNICATION TECHNIQUE
- H04B—TRANSMISSION
- H04B10/00—Transmission systems employing electromagnetic waves other than radio-waves, e.g. infrared, visible or ultraviolet light, or employing corpuscular radiation, e.g. quantum communication
- H04B10/07—Arrangements for monitoring or testing transmission systems; Arrangements for fault measurement of transmission systems
- H04B10/075—Arrangements for monitoring or testing transmission systems; Arrangements for fault measurement of transmission systems using an in-service signal
- H04B10/079—Arrangements for monitoring or testing transmission systems; Arrangements for fault measurement of transmission systems using an in-service signal using measurements of the data signal
- H04B10/0795—Performance monitoring; Measurement of transmission parameters
- H04B10/07953—Monitoring or measuring OSNR, BER or Q
-
- H—ELECTRICITY
- H04—ELECTRIC COMMUNICATION TECHNIQUE
- H04B—TRANSMISSION
- H04B10/00—Transmission systems employing electromagnetic waves other than radio-waves, e.g. infrared, visible or ultraviolet light, or employing corpuscular radiation, e.g. quantum communication
- H04B10/07—Arrangements for monitoring or testing transmission systems; Arrangements for fault measurement of transmission systems
- H04B10/075—Arrangements for monitoring or testing transmission systems; Arrangements for fault measurement of transmission systems using an in-service signal
- H04B10/079—Arrangements for monitoring or testing transmission systems; Arrangements for fault measurement of transmission systems using an in-service signal using measurements of the data signal
- H04B10/0793—Network aspects, e.g. central monitoring of transmission parameters
-
- H—ELECTRICITY
- H04—ELECTRIC COMMUNICATION TECHNIQUE
- H04B—TRANSMISSION
- H04B10/00—Transmission systems employing electromagnetic waves other than radio-waves, e.g. infrared, visible or ultraviolet light, or employing corpuscular radiation, e.g. quantum communication
- H04B10/07—Arrangements for monitoring or testing transmission systems; Arrangements for fault measurement of transmission systems
- H04B10/075—Arrangements for monitoring or testing transmission systems; Arrangements for fault measurement of transmission systems using an in-service signal
- H04B10/079—Arrangements for monitoring or testing transmission systems; Arrangements for fault measurement of transmission systems using an in-service signal using measurements of the data signal
- H04B10/0795—Performance monitoring; Measurement of transmission parameters
- H04B10/07955—Monitoring or measuring power
-
- H—ELECTRICITY
- H04—ELECTRIC COMMUNICATION TECHNIQUE
- H04B—TRANSMISSION
- H04B10/00—Transmission systems employing electromagnetic waves other than radio-waves, e.g. infrared, visible or ultraviolet light, or employing corpuscular radiation, e.g. quantum communication
- H04B10/07—Arrangements for monitoring or testing transmission systems; Arrangements for fault measurement of transmission systems
- H04B10/075—Arrangements for monitoring or testing transmission systems; Arrangements for fault measurement of transmission systems using an in-service signal
- H04B10/079—Arrangements for monitoring or testing transmission systems; Arrangements for fault measurement of transmission systems using an in-service signal using measurements of the data signal
- H04B10/0795—Performance monitoring; Measurement of transmission parameters
- H04B10/07957—Monitoring or measuring wavelength
-
- H—ELECTRICITY
- H04—ELECTRIC COMMUNICATION TECHNIQUE
- H04J—MULTIPLEX COMMUNICATION
- H04J14/00—Optical multiplex systems
- H04J14/02—Wavelength-division multiplex systems
-
- H—ELECTRICITY
- H04—ELECTRIC COMMUNICATION TECHNIQUE
- H04L—TRANSMISSION OF DIGITAL INFORMATION, e.g. TELEGRAPHIC COMMUNICATION
- H04L1/00—Arrangements for detecting or preventing errors in the information received
- H04L1/24—Testing correct operation
- H04L1/242—Testing correct operation by comparing a transmitted test signal with a locally generated replica
- H04L1/243—Testing correct operation by comparing a transmitted test signal with a locally generated replica at the transmitter, using a loop-back
Definitions
- the embodiments discussed herein are related to a network control apparatus and a transmission quality margin calculation method.
- System design of an optical communication network is performed before operation of communication service, based on preset system conditions, such as fiber parameters, the signal modulation format, the bit rate, and the fiber input light power.
- a system transmitting high-density wavelength division multiplex signal light requires prior design to deal with dynamic path switching in operation, wavelength increase, and change in the modulation method, in addition to consideration of penalty for interference between wavelength signals in transmission.
- an excessive margin may cause deterioration in transmission distance and transmission quality of the whole system. For this reason, in the actual situation, there is a demand for operation of a system with a margin suppressed to a minimum and operation of a dynamic optical network.
- an error vector magnitude (EVM) is measured for each of optical transmission devices in the system, and an electrical signal to noise ratio (ESNR) is acquired from a measurement result.
- EVM error vector magnitude
- ESNR electrical signal to noise ratio
- OSNR optical signal to noise ratio
- a network control apparatus includes a processor.
- the processor calculates a first OSNR corresponding to an allowable limit BER from an OSNR-BER characteristic of a loopback transmission end in a node of a transmission end that transmits a wavelength signal.
- the processor acquires a reception BER of a reception end node receiving the wavelength signal, and calculates a second OSNR corresponding to the reception BER from the OSNR-BER characteristic of the transmission end.
- the processor calculates a first noise intensity corresponding to the allowable limit BER from the first OSNR.
- the processor calculates a second noise intensity corresponding to the reception BER from the second OSNR.
- the processor calculates a noise intensity margin, based on the first noise intensity and the second noise intensity.
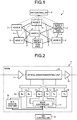
- FIG. 1 is an explanatory drawing illustrating an example of an optical transmission system 1 according to a first embodiment.
- the optical transmission system 1 illustrated in FIG. 1 includes a plurality of nodes 2, and a network (NW) controller 3.
- the nodes 2 are, for example, seven optical transmission devices formed of node "A" to node "G" that are connected to perform communications through optical fibers 4.
- Each node 2 is, for example, a color-less direction-less (CD) reconfigurable optical add-drop multiplexer (ROADM) or a color-less direction less contention-less (CDC) ROADM.
- CD color-less direction-less
- ROADM reconfigurable optical add-drop multiplexer
- CDC contention-less
- the optical transmission system 1 is, for example, a wavelength multiplexing optical transmission system in which a plurality of optical wavelength paths are multiplexed.
- the NW controller 3 is a device collecting various types of information, such as signal quality, of each of the nodes 2 in the optical transmission system 1.
- the NW controller 3 is a device calculating an amplified spontaneous emission (ASE) noise margin from a bit error rate (BER) in operation.
- ASE amplified spontaneous emission
- BER bit error rate
- FIG. 2 is an explanatory drawing illustrating an example of hardware configuration of each node 2 in the first embodiment.
- Each node 2 illustrated in FIG. 2 includes an input amplifier 11, an output amplifier 12, a plurality of receivers (Rx) 13, a plurality of transmitters (Tx) 14, an optical branch inserting unit 15, a BER acquisition unit 16, and a node controller 17.
- the input amplifier 11 is an optical amplifier amplifying an optical signal input from the optical fiber 4.
- the output amplifier 12 is an optical amplifier amplifying an optical signal to be output to the optical fiber 4.
- Each Rx 13 is a receiver receiving an optical signal.
- Each Tx 14 is a transmitter transmitting an optical signal.
- the optical branch inserting unit 15 has a function of optically branching part of an optical signal communicated through the wavelength path and optically inserting a new optical signal into the optical signal communicated through the wavelength path, and a function of adjusting the power of the optical signal communicated through the wavelength path.
- the optical branch inserting unit 15 optically branches an optical signal, and transmits the optically branched optical signal to a certain Rx 13.
- the optical branch inserting unit 15 optically inserts an optical signal from the Tx 14 into an optical signal, and outputs the optically inserted optical signal to the optical fiber 4 through the output amplifier 12.
- the BER acquisition unit 16 measures a BER of the reception path at the Rx 13.
- the node controller 17 is connected and communicates with the NW controller 3, measures a BER of the wavelength path at the Rx 13, and notifies the NW controller 3 of information including a result of measurement of the BER.
- the information includes path identification information to identify the wavelength path, and a BER of the wavelength path.
- FIG. 3 is an explanatory drawing illustrating an example of the NW controller 3 according to the first embodiment.
- the NW controller 3 illustrated in FIG. 3 includes a communication unit 21, a storage unit 22, a first margin arithmetic unit 23, and a controller 24.
- the communication unit 21 is a communication interface communicating with each node 2.
- the storage unit 22 is a region storing various types of information therein.
- the storage unit 22 includes a first storage unit 31 and a second storage unit 32.
- the first storage unit 31 serves as a storage unit managing a transmission end OSNR yield strength curve associating the OSNR with the BER.
- the transmission end OSNR yield strength curve is a curve indicating correspondence relation between BER and OSNR of loopback communication between the Tx 14 and the Rx 13 in the transmission end node 2 of "A", that is, B to B.
- the second storage unit 32 is a region storing parameters ⁇ and ⁇ of the Tx characteristic therein.
- the first margin arithmetic unit 23 calculates an amplified spontaneous emission (ASE) noise margin P ase margin from the transmission end OSNR yield strength curve and the reception BER mea in operation.
- the reception BER is an actually measured BER measured at the reception end node 2 of "C” receiving a wavelength signal from the transmission end node 2 of "A".
- the controller 24 controls the whole NW controller 3.
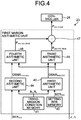
- FIG. 4 is an explanatory drawing illustrating an example of the first margin arithmetic unit 23.
- the first margin arithmetic unit 23 illustrated in FIG. 4 includes a transmission condition memory 41, a setting BER memory 42, a first arithmetic unit 43, a second arithmetic unit 44, a third arithmetic unit 45, a fourth arithmetic unit 46, and a calculator 47.
- the transmission condition memory 41 stores a noise bandwidth B n and a signal symbol rate R s therein.
- the setting BER memory 42 stores a BER FEC serving as an allowable limit of the optical transmission system 1 therein.
- the BER FEC of the allowable limit is a BER serving as a limit allowable in the optical transmission system 1.
- the first arithmetic unit 43 calculates OSNR total FEC by substituting a noise bandwidth B n , a signal symbol rate R s , and a BER FEC of the allowable limit for symbols in Numerical Expression (1).
- Numerical Expression (1) is applicable to the case where the modulation method is quadrature phase shift keying (QPSK).
- BER FEC 1 2 erfc OSNR total FEC ⁇ B n 2 R s B n : Noise Bandwidth , R s : Signal Symbol Rate
- the second arithmetic unit 44 calculates OSNR total mea by substituting the noise bandwidth B n , the signal symbol rate R s , and the reception BER mea for the symbols in Numerical Expression (2).
- Numerical Expression (2) is also applicable to the case where the modulation method is quadrature phase shift keying (QPSK).
- BER mea 1 2 erfc OSNR total mea ⁇ B n 2 R s
- the third arithmetic unit 45 calculates ASE noise intensity P ase FEC BtoB by substituting the OSNR total FEC from the first arithmetic unit 43, and the parameters ⁇ and ⁇ of the Tx characteristic for the symbols in Numerical Expression (3).
- Numerical Expression (4) is established based on the relation with the ASE noise intensity P ase FEC trans in operation and nonlinear noise intensity P NLI .
- the fourth arithmetic unit 46 calculates the ASE noise intensity P ase mea BtoB , by substituting the OSNR total mea from the second arithmetic unit 44, and the parameters ⁇ and ⁇ of the Tx characteristic for the symbols in Numerical Expression (5).
- the calculator 47 subtracts the ASE noise intensity P ase mea BtoB calculated in the fourth arithmetic unit 46 from the ASE noise intensity P ase FEC BtoB calculated in the third arithmetic unit 45, and calculates a subtraction result as the ASE noise margin P ase margin .
- Numerical Expression (7) is established, and consequently Numerical Expression (8) is obtained.
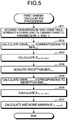
- FIG. 5 is a flowchart illustrating an example of processing operations of the first margin arithmetic unit 23 in the NW controller 3 relating to first margin calculation processing.
- the first margin arithmetic unit 23 acquires the transmission end OSNR yield strength curve from the first storage unit 31, and acquires the Tx characteristic parameters ⁇ and ⁇ from the second storage unit 32 (Step S11).
- FIG. 6 is an explanatory drawing illustrating an example of a transmission end OSNR yield strength curve on a BER-OSNR characteristic.
- the vertical axis indicates BER
- the horizontal axis indicates OSNR.
- the characteristic illustrated in FIG. 6 illustrates the transmission end OSNR yield strength curve and BER FEC .
- the first arithmetic unit 43 in the first margin arithmetic unit 23 reads a BER FEC of the allowable limit from the setting BER memory 42, and substitutes the noise bandwidth B n , the signal symbol rate R s , and BER fec for the symbols of Numerical Expression (1).
- the first arithmetic unit 43 calculates OSNR total FEC corresponding to BER FEC (Step S12).
- FIG. 7 is an explanatory drawing illustrating an example of OSNR total FEC corresponding to BER FEC on the BER-OSNR characteristic.
- the P sig /P ase FEC BtoB illustrated in FIG. 7 is OSNR total FEC corresponding to BER FEC .
- the third arithmetic unit 45 in the first margin arithmetic unit 23 calculates ASE noise intensity P ase FEC BtoB from OSNR total FEC (Step S13).
- the second arithmetic unit 44 in the first margin arithmetic unit 23 acquires reception BER mea in operation of the reception end node 2 (Step S14).
- the reception BER mea of the reception end node 2 is a reception BER in operation that is measured by the reception end node 2.
- FIG. 8 is an explanatory drawing illustrating an example of the reception BER mea in operation on the BER-OSNR characteristic. The characteristic illustrated in FIG. 8 illustrates the reception BER mea in operation.
- the second arithmetic unit 44 substitutes the noise bandwidth B n , the signal symbol rate R s , and the reception BER mea for the symbols in Numerical Expression (2), and calculates OSNR total mea corresponding to the reception BER mea in operation (Step S15).
- FIG. 9 is an explanatory drawing illustrating an example of OSNR total mea corresponding to the reception BER mea on the BER-OSNR characteristic.
- the P sig /P ase mea BtoB illustrated in FIG. 9 is OSNR total mea corresponding to BER mea .
- the calculator 47 in the first margin arithmetic unit 23 calculates an ASE noise margin P ase margin (Step S17) based on the ASE noise intensity P ase FEC BtoB and ASE noise intensity P ase mea BtoB , and ends the processing operations illustrated in FIG. 5 .
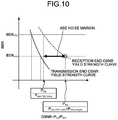
- FIG. 10 is an explanatory drawing illustrating an example of the ASE noise margin P ase margin in operation on the BER-OSNR characteristic.
- the characteristic illustrated in FIG. 10 illustrates the ASE noise margin P ase margin .
- the reception end OSNR yield strength curve is a curve of a BER-OSNR characteristic of the node 2 of the reception end in operation.
- the NW controller 3 in the first embodiment calculates an OSNR total FEC corresponding to the allowable limit BER FEC from the transmission end OSNR yield strength curve, and calculates an OSNR total mea corresponding to the reception BER mea from the transmission end OSNR yield strength curve.
- the NW controller 3 calculates ASE noise intensity P ase FEC BtoB from the OSNR total FEC , and calculates ASE noise intensity P ase mea BtoB from the OSNR total mea .
- the NW controller 3 subtracts the ASE noise intensity P ase mea BtoB from the ASE noise intensity P ase FEC BtoB , and calculates a subtraction result as the ASE noise margin P ase margin . Consequently, an ASE noise margin is calculated with high accuracy from the reception BER.
- the NW controller 3 in the first embodiment described above acquires the reception BER mea in operation from the reception end node 2.
- the following is an explanation of an embodiment serving as a second embodiment, in the case where a reception OSNR is acquired from the reception end node 2, as well as the reception BER mea in operation.
- Constituent elements that are the same as those of the optical transmission system 1 according to the first embodiment will be denoted by the same reference numerals as those of the first embodiment, and the explanation of overlapping structures and operations will be omitted.
- FIG. 11 is a block diagram illustrating an example of hardware configuration of a node 2A according to a second embodiment.
- the node 2A illustrated in FIG. 11 is different from the node 2 illustrated in FIG. 2 , in that the node 2A includes an OSNR monitor 18.
- the node 2A acquires a reception BER mea of the reception end with the BER acquisition unit 16, and acquires a reception OSNR 1 of the reception end with the OSNR monitor 18.
- the node controller 17 notifies a NW controller 3A of the acquired reception BER mea of the reception end node 2A and the acquired reception OSNR 1 of the reception end node 2A.
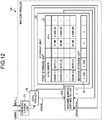
- FIG. 12 is an explanatory drawing illustrating an example of the NW controller 3A according to the second embodiment.
- the NW controller 3A illustrated in FIG. 12 is different from the NW controller 3 illustrated in FIG. 3 , in that the NW controller 3A includes a second margin arithmetic unit 23A calculating an OSNR margin OSNR margin , based on the reception BER mea acquired from the reception end node 2A and the reception OSNR 1 of the reception end node 2A.
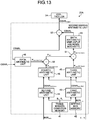
- FIG. 13 is an explanatory drawing illustrating an example of the second margin arithmetic unit 23A.
- the second margin arithmetic unit 23A illustrated in FIG. 13 further includes a fifth arithmetic unit 48, a sixth arithmetic unit 49, a first calculator 50, a second calculator 51, and a third calculator 52.
- the fifth arithmetic unit 48 acquires the reception OSNR 1 , and substitutes the acquired reception OSNR 1 for the symbol in Numerical Expression (9), to calculate ASE noise intensity P ase mea trans .
- OSNR 1 P sig P ase mea trans
- the first calculator 50 subtracts the ASE noise intensity P ase mea BtoB calculated in the fourth arithmetic unit 46 from the ASE noise intensity P ase mea trans calculated in the fifth arithmetic unit 48, based on Numerical Expression (10), to calculate nonlinear noise intensity P NLI .
- the first calculator 50 inputs the calculated nonlinear noise intensity P NLI to the second calculator 51.
- the second calculator 51 subtracts the nonlinear noise intensity P NLI calculated in the first calculator 50 from the ASE noise intensity P ase FEC BtoB calculated in the third arithmetic unit 45, to calculate ASE noise intensity P ase FEC trans .
- the second calculator 51 also inputs the calculated ASE noise intensity P ase FEC trans to the sixth arithmetic unit 49.
- the sixth arithmetic unit 49 calculates OSNR 2 corresponding to the setting BER FEC in operation from the ASE noise intensity P ase FEC trans , and inputs the calculated OSNR 2 to the third calculator 52.
- the third calculator 52 subtracts the OSNR 2 calculated in the sixth arithmetic unit 49 from the reception OSNR 1 calculated with the fifth arithmetic unit 48, based on Numerical Expression (11), to calculate the OSNR margin OSNR margin .
- the third calculator 52 inputs the calculated OSNR margin to the controller 24.
- FIG. 14 is a flowchart illustrating an example of processing operations of the second margin arithmetic unit 23A in the NW controller 3A relating to second margin calculation processing.
- the second margin arithmetic unit 23A acquires the transmission end OSNR yield strength curve from the first storage unit 31, and acquires the Tx characteristic parameters ⁇ and ⁇ from the second storage unit 32 (Step S21).
- the first arithmetic unit 43 in the second margin arithmetic unit 23A reads the BER FEC from the setting BER memory 42, and substitutes the noise bandwidth B n , the signal symbol rate R s , and BER FEC for the symbols in Numerical Expression (1), based on Numerical Expression (1).
- the first arithmetic unit 43 calculates an OSNR total FEC corresponding to the BER FEC (Step S22).
- the third arithmetic unit 45 in the second margin arithmetic unit 23A calculates ASE noise intensity P ase FEC BtoB from the OSNR total FEC (Step S23).
- the second arithmetic unit 44 in the second margin arithmetic unit 23A acquires the reception BER mea in operation of the reception end node 2 (Step S24).
- the second arithmetic unit 44 substitutes the noise bandwidth B n , the signal symbol rate R s , and the reception BER mea for the symbols in Numerical Expression (2), to calculate an OSNR total mea corresponding to the reception BER mea in operation (Step S25).
- the fourth arithmetic unit 46 in the second margin arithmetic unit 23A calculates ASE noise intensity P ase mea BtoB from OSNR total mea (Step S26).
- the fifth arithmetic unit 48 in the second margin arithmetic unit 23A acquires a reception OSNR 1 of the reception end node 2 (Step S27).
- FIG. 15 is an explanatory drawing illustrating an example of the reception OSNR 1 in operation on a BER-OSNR characteristic. The characteristic illustrated in FIG. 15 illustrates the reception OSNR 1 corresponding to the reception BER mea in operation.
- the fifth arithmetic unit 48 calculates ASE noise intensity P ase mea trans , nonlinear noise intensity P NLi , and ASE noise intensity P ase FEC trans from the reception OSNR 1 of the reception end node 2 (Step S28).
- the fifth arithmetic unit 48 calculates an OSNR yield strength curve in operation, based on the ASE noise intensity P ase mea trans , nonlinear noise intensity P NLI , and ASE noise intensity P ase FEC trans .
- FIG. 16 is an explanatory drawing illustrating an example of the OSNR yield strength curve in operation on a BER-OSNR characteristic. The characteristic illustrated in FIG. 16 illustrates a reception end OSNR yield strength curve in operation in the node 2 of the reception end.
- the sixth arithmetic unit 49 in the second margin arithmetic unit 23A calculates an OSNR 2 from the ASE noise intensity P ase FEC trans (Step S29).
- FIG. 17 is an explanatory drawing illustrating an example of the OSNR 2 on the OSNR yield strength curve in operation on the BER-OSNR characteristic. The characteristic illustrated in FIG. 17 illustrates the OSNR 2 on the OSNR yield strength curve in operation.
- the third calculator 52 in the second margin arithmetic unit 23A subtracts the OSNR 2 from the reception OSNR 1 from the fifth arithmetic unit 48 to calculate an OSNR margin (Step S30), and ends the processing operations illustrated in FIG. 14 .
- FIG. 18 is an explanatory drawing illustrating an example of the OSNR margin OSNR margin in operation on a BER-OSNR characteristic. The characteristic illustrated in FIG. 18 illustrates the OSNR margin OSNR margin .
- the NW controller 3A of the second embodiment calculates an OSNR total FEC corresponding to the allowable limit BER FEC from the transmission end OSNR yield strength curve, and calculates an OSNR total mea corresponding to the reception BER mea from the transmission end OSNR yield strength curve.
- the NW controller 3A calculates ASE noise intensity P ase FEC BtoB from the OSNR total FEC , and calculates ASE noise intensity P ase mea BtoB from the OSNR total mea .
- the NW controller 3A acquires a result of measurement of the reception OSNR 1 corresponding to the reception BER mea , and calculates ASE noise intensity P ase mea trans from the acquired reception OSNR 1 , to calculate nonlinear noise intensity P NLI from the ASE noise intensity P ase mea trans .
- the NW controller 3A subtracts the nonlinear noise intensity P NLI from the ASE noise intensity P ase FEC BtoB , to calculate ASE noise intensity P ase FEC trans .
- the NW controller 3A calculates an OSNR 2 from the ASE noise intensity P ase FEC trans , and subtracts the OSNR 2 from the reception OSNR 1 , to calculate an OSNR margin . This structure enables calculation of an OSNR margin OSNR margin with high accuracy from the reception BER measured at the reception end node 2 and the reception OSNR 1 .
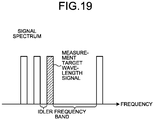
- the NW controller 3A calculates an OSNR margin OSNR margin using nonlinear noise intensity P NLI when a measurement wavelength signal (channel) is disposed in an idler frequency band in the signal spectrum.
- the nonlinear noise intensity changes when a wavelength is increased or wavelength arrangement is changed. For this reason, to deal with such a situation, an embodiment will be explained hereinafter as a third embodiment.
- the OSNR margin OSNR margin is corrected in accordance with a change amount of an idler frequency band of the measurement wavelength signal from an adjacent wavelength signal.
- FIG. 19 is an explanatory drawing illustrating an example of relation between a measurement target wavelength signal and adjacent wavelength signals.
- the measurement target wavelength signal is a signal serving as a target for which an OSNR margin is to be calculated.
- the nonlinear noise intensity changes in accordance with a change amount of the idler frequency band between the measurement target wavelength signal and an adjacent wavelength signal adjacent to the measurement target wavelength signal in the signal spectrum. Accordingly, the OSNR margin OSNR margin is corrected in accordance with the change amount of the idler frequency band between the measurement target wavelength signal and the adjacent wavelength signal.
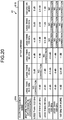
- the controller 24 in the NW controller 3A refers to a correction table 61, to correct the OSNR margin OSNR margin calculated with the second margin arithmetic unit 23A.
- FIG. 20 is an explanatory drawing illustrating an example of the correction table 61 according to the third embodiment.
- the correction table 61 illustrated in FIG. 20 manages correction values to correct the OSNR margin OSNR margin for each of an idler frequency band 61A before change and an idler frequency band 61B after change.
- the idler frequency band 61A before change is less than 12.5 GHz
- no correction value is applied when the idler frequency band 61B after change is less than 12.5 GHz
- a correction value is 3 dB when the idler frequency band 61B after change is less than 25 GHz.
- a correction value is 4 dB when the idler frequency band 61B after change is less than 50 GHz or less than 100 GHz
- a correction value is 5 dB when the idler frequency band 61B after change is less than 150 GHz or equal to or higher than 150 GHz.
- a correction value is -3 dB when the idler frequency band 61B after change is less than 12.5 GHz, and no correction value is applied when the idler frequency band 61B after change is less than 25 GHz.
- a correction value is 1 dB when the idler frequency band 61B after change is less than 50 GHz
- a correction value is 1.5 dB when the idler frequency band 61B after change is less than 100 GHz
- a correction value is 2 dB when the idler frequency band 61B after change is less than 150 GHz.
- a correction value is 2.5 dB when the idler frequency band 61B after change is 150 GHz or more.
- a correction value is -4 dB when the idler frequency band 61B after change is less than 12.5 GHz, and a correction value is -1 dB when the idler frequency band 61B after change is less than 25 GHz.
- no correction value is applied when the idler frequency band 61B after change is less than 50 GHz, a correction value is 0.5 dB when the idler frequency band 61B after change is less than 100 GHz, and a correction value is 1 dB when the idler frequency band 61B after change is less than 150 GHz.
- a correction value is 1 dB when the idler frequency band 61B after change is 150 GHz or more.
- a correction value is -4 dB when the idler frequency band 61B after change is less than 12.5 GHz, and a correction value is -1.5 dB when the idler frequency band 61B after change is less than 25 GHz.
- a correction value is -0.5 dB when the idler frequency band 61B after change is less than 50 GHz, and no correction value is applied when the idler frequency band 61B after change is less than 100 GHz, less than 150 GHz, or 150 GHz or more.
- FIG. 21 is an explanatory drawing illustrating an example of the OSNR margin OSNR margin before and after correction according to the third embodiment.
- the controller 24 corrects the OSNR margin OSNR margin as illustrated in FIG. 20 , based on the acquired correction value.
- the NW controller 3A acquires a correction value corresponding to idler frequency band amounts before and after change, and corrects the OSNR margin OSNR margin , based on the acquired correction value.
- This structure enables provision of an OSNR margin OSNR margin in consideration of nonlinear noise intensity fluctuating in accordance with the idler frequency band amount of the measurement target wavelength signal.
- the NW controller 3A calculates the OSNR margin OSNR margin using the nonlinear noise intensity P NLI when, for example, the measurement target wavelength signal in the signal spectrum is changed.
- the nonlinear noise intensity changes also when the transmission path input power is changed. For this reason, to deal with such a situation, an embodiment will be explained hereinafter as a fourth embodiment.
- the OSNR margin OSNR margin is corrected in accordance with a change amount of a transmission path input power of the measurement target wavelength signal.
- Nonlinear noise intensity changes in accordance with a change amount of the transmission path input power between the measurement target wavelength signal and an adjacent wavelength signal adjacent to the measurement target wavelength signal in the signal spectrum.
- the OSNR margin OSNR margin is corrected in accordance with the change amount of the transmission path input power of the measurement target wavelength signal.
- the controller 24 in the NW controller 3A refers to a correction table 62, to correct the OSNR margin OSNR margin calculated in the second margin arithmetic unit 23A.
- FIG. 22 is an explanatory drawing illustrating an example of the correction table 62 according to the fourth embodiment.
- the correction table 62 illustrated in FIG. 22 manages correction values to correct the OSNR margin OSNR margin for each of a transmission path input power 62A before change and a transmission path input power 62B after change. For example, in the case where the transmission path input power 62A before change is -1.5 dBm/ch, no correction value is applied when the transmission path input power 62B after change is -1.5 dBm/ch, -1 dBm/ch, or -0.5 dBm/ch.
- a correction value is -1 dB when the transmission path input power 62B after change is 0 dBm/ch, a correction value is - 2.5 dB when the transmission path input power 62B after change is 0.5 dBm/ch, and a correction value is -5 dB when the transmission path input power 62B after change is 1 dBm/ch.
- no correction value is applied when the transmission path input power 62B after change is -1.5 dBm/ch, -1 dBm/ch, or -0.5 dBm/ch.
- a correction value is -1 dB when the transmission path input power 62B after change is 0 dBm/ch
- a correction value is - 2 dB when the transmission path input power 62B after change is 0.5 dBm/ch
- a correction value is -5 dB when the transmission path input power 62B after change is 1 dBm/ch.
- a correction value is 2.5 dB when the transmission path input power 62B after change is -1.5 dBm/ch, and a correction value is 2 dB when the transmission path input power 62B after change is -1 dBm/ch.
- a correction value is 1.5 dB when the transmission path input power 62B after change is -0.5 dBm/ch, and a correction value is 1 dB when the transmission path input power 62B after change is 0 dBm/ch.
- No correction value is applied when the transmission path input power 62B after change is 0.5 dBm/ch, and a correction value is -3 dB when the transmission path input power 62B after change is 1 dBm/ch.
- FIG. 23 is an explanatory drawing illustrating an example of the OSNR margin OSNR margin before and after correction according to the fourth embodiment.
- the controller 24 corrects the OSNR margin OSNR margin as illustrated in FIG. 23 , based on the acquired correction value.
- the NW controller 3A acquires a correction value corresponding to the transmission path input power amounts before and after change, and corrects the OSNR margin OSNR margin , based on the acquired correction value.
- This structure provides an OSNR margin OSNR margin in consideration of nonlinear noise intensity fluctuating in accordance with the transmission input powers of the measurement wavelength signal before and after change.
- the NW controller 3A stores, in the first storage unit 31 in advance, a transmission end OSNR yield strength curve associating the B-to-B BER with OSNR in loopback communication between the Tx 14 and Rx 13 in the transmission end node 2.
- various model numbers exist for the Tx 14 and the Rx 13 in the transmission end node 2, and the transmission end OSNR yield strength curve differs in accordance with a combination of the Tx 14 and the Rx 13 of each model number.
- a NW controller 3B is capable of a transmission end OSNR yield strength curve in accordance with a combination of the Tx 14 and the Rx 13 of each model number.
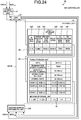
- FIG. 24 is an explanatory drawing illustrating an example of a NW controller 3B according to a fifth embodiment.
- the NW controller 3B illustrated in FIG. 24 includes the communication unit 21, the second margin arithmetic unit 23A, the controller 24, and the storage unit 22.
- the storage unit 22 includes a path storage unit 33, and a third storage unit 34, in addition to the second storage unit 32.
- the path storage unit 33 is a region to manage the transmission end node 33B, the reception end node 33C, the relay node 33D, the model number 33E of the Tx 14, and the model number 33F of the Rx 13 in the transmission end node 2, in association with each ch number 33A to identify the channel of the wavelength signal.
- the third storage unit 34 stores therein a transmission end OSNR yield strength curve associating BER with OSNR in accordance with the combination of the model number 33E of the Tx 14 and the model number 33F of the Rx 13.
- the controller 24 acquires a transmission end OSNR yield strength curve from the third storage unit 34, in accordance with the combination of the model number 33E of the Tx 14 and the model number 33F of the Rx 13 in the transmission end node 2.
- the NW controller 3B acquires a transmission end OSNR yield strength curve in accordance with the combination of the model number 33E of the Tx 14 and the model number 33F of the Rx 13, the NW controller 3B provides various types of transmission end OSNR yield strength curves in accordance with the combination of the model number 33E of the Tx 14 and the model number 33F of the Rx 13.
- the NW controller 3 acquires a transmission end OSNR yield strength curve corresponding to the Tx 14 and the Rx 13 in the transmission end node 2 from the first storage unit 31.
- the structure is not limited to the case of acquiring a transmission end OSNR yield strength curve from the first storage unit 31, but a transmission end OSNR yield strength curve may be acquired through communication between the Tx 14 and the Rx 13 in the transmission end node 2.
- An embodiment in this case will be explained hereinafter as a sixth embodiment.
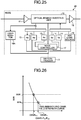
- FIG. 25 is an explanatory drawing illustrating an example of hardware configuration of a node 2B according to a sixth embodiment. Constituent elements that are the same as those of the node 2 according to the first embodiment will be denoted by the same reference numerals as those of the first embodiment, and the explanation of overlapping structures and operations will be omitted.
- the node 2B illustrated in FIG. 25 is different from the node 2 illustrated in FIG. 2 , in that the node 2B is provided with an ASE light source 19 on the Tx 14 side, and an OSNR monitor 18A on the Rx side.
- the ASE light source 19 is a light source emitting light of ASE noise to enable adjustment of the ASE noise intensity.
- the OSNR monitor 18A monitors OSNR between the Tx 14 and the Rx 13 in accordance with change of the ASE noise from the ASE light source 19 on the Tx 14 side.
- FIG. 26 is an explanatory drawing illustrating an example of a method for acquiring an OSNR yield strength curve according to the sixth embodiment.
- the OSNR monitor 18A successively acquires values of the BER and the OSNR in accordance with change of the ASE noise intensity of the ASE light source 19 as illustrated in FIG. 26 , and notifies the NW controller 3 of the successively acquired values of the BER and the OSNR.
- the NW controller 3 generates a transmission end OSNR yield strength curve based on the values of the BER and the OSNR successively acquired from the transmission end node 2B. Specifically, the NW controller 3 is capable of acquiring a transmission end OSNR yield strength curve in accordance with change of the ASE noise.
- the NW controller 3 acquires the Tx characteristic parameters ⁇ and ⁇ , based on the generated transmission end OSNR yield strength curve and the reception BER acquired from the reception end node 2, and stores the acquired Tx characteristic parameters and ⁇ in the second storage unit 32.
- the transmission end node 2B successively acquires values of the reception BER and the reception OSNR in accordance with change of the ASE noise of the ASE light source 19, and notifies the NW controller 3 of the successively acquired values of the reception BER and the reception OSNR.
- the NW controller 3 is capable of generating a transmission end OSNR yield strength curve in accordance with the successively acquired values of the reception BER and the reception OSNR.
- the NW controller 3 acquires a transmission end OSNR yield strength curve corresponding to the Tx 14 and the Rx 13 in the transmission end node 2 from the first storage unit 31.
- the structure is not limited to the case of acquiring a transmission end OSNR yield strength curve from the first storage unit 31, but a transmission end OSNR yield strength curve may be acquired through communication between the Tx 14 and the Rx 13 in the transmission end node 2.
- An embodiment in this case will be explained hereinafter as a seventh embodiment.
- FIG. 27 is an explanatory drawing illustrating an example of hardware configuration of a node 2C according to a seventh embodiment. Constituent elements that are the same as those of the node 2 according to the first embodiment will be denoted by the same reference numerals as those of the first embodiment, and the explanation of overlapping structures and operations will be omitted.
- the node 2C illustrated in FIG. 27 is different from the node 2 illustrated in FIG. 2 , in that the node 2C is provided with a noise addition unit 71 in the Rx 13A, a noise controller 72 in the Rx 13A, a BER acquisition unit 73 in the Rx 13A, and an OSNR monitor 18B.
- the noise addition unit 71 adds a noise addition amount to a demodulated electrical signal.
- the noise controller 72 adjusts a noise addition amount P noise Rx Add of the noise addition unit 71.
- the BER acquisition unit 73 acquires the reception BER in accordance with adjustment of the noise addition amount.
- the OSNR monitor 18B monitors the OSNR with the Tx 14.
- the node controller 17 collects the noise addition amount, the reception BER and a result of monitoring the OSNR, and notifies the NW controller 3 of the collected noise addition amount, the reception BER, and the OSNR monitoring result.
- FIG. 28 is an explanatory drawing illustrating an example of a method for acquiring an OSNR yield strength curve according to the seventh embodiment.
- the controller 24 in the NW controller 3 calculates OSNR TX from the transmission end node 2C and OSNR TX2 corresponding to the reception BER acquired in addition of noise, as illustrated in FIG. 28 .
- the controller 24 measures the reception BER and OSNR while changing the noise addition amount, to acquire the transmission end OSNR yield strength curve and the Tx characteristic parameters ⁇ and ⁇ .
- the NW controller 3 acquires the transmission end OSNR yield strength curve and the Tx characteristic parameters ⁇ and ⁇ from the transmission end node 2C, and stores them in the second storage unit 32.
- the transmission end node 2C successively acquires values of the reception BER and the reception OSNR in accordance with change of the noise addition amount added to the demodulated electrical signal, and notifies the NW controller 3 of the successively acquired values of the reception BER and the reception OSNR.
- the NW controller 3 is capable of generating a transmission end OSNR yield strength curve in accordance with the successively acquired values of the reception BER and the reception OSNR.
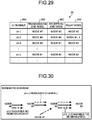
- the NW controller 3 includes a path storage unit 36 storing path information for each channel therein.
- FIG. 29 is an explanatory drawing illustrating an example of the path storage unit 36.
- the path storage unit 36 illustrated in FIG. 29 manages a ch number 36A, a transmission end node 36B, a reception end node 36C, and a relay node 36D in association with each other.
- the ch number 36A is a number to identify a channel of a wavelength signal.
- the transmission end node 36B is a transmission end node transmitting a wavelength signal of the channel.
- the reception end node 36C is a reception end node receiving a wavelength signal of the channel.
- the relay node 36D is a node relaying a wavelength signal of the channel.
- the transmission end node 36B is “node #7”
- the reception end node 36C is “node #3”
- the relay node 36D is "node #2”.
- the transmission end node 36B is "node #6”
- the reception end node 36C is "node #3”
- the relay node 36D is "node #1 and node #2”.
- FIG. 30 is an explanatory drawing illustrating an example of a method for determining a reception end node.
- the NW controller 3 refers to the path storage unit 36, and acquires the reception BER mea of the reception end node, by designating each of the channels ch1 and ch2 passing through the reception node "node #3" corresponding to the increased channel "chx" as the reception end node.
- constituent elements of the illustrated components are not necessarily configured physically as illustrated. Specifically, specific forms of distribution and integration of the components are not limited to the illustrated ones, but all or part of them may be configured to be functionally or physically distributed or integrated in any unit, according to various loads and use conditions.
- CPU central processing unit
- MPU micro processing unit
- MCU micro controller unit
- all or any part of the various types of processing functions may be executed on a program analyzed and executed by a CPU (or a microcomputer such as an MPU and an MCU), or hardware by a wired logic.
- An aspect of the embodiments enables calculation of a margin of the transmission quality with accuracy.
Abstract
A network control apparatus(3) includes a first arithmetic unit(43), a second arithmetic unit(44), a third arithmetic unit(45), a fourth arithmetic unit(46), and a calculator(47). The first arithmetic unit calculates a first OSNR corresponding to an allowable limit BER from an OSNR yield strength curve of a transmission end in a node of a transmission end. The second arithmetic unit acquires a reception BER of a second node of a reception end, and calculates a second OSNR corresponding to the reception BER from the OSNR yield strength curve of the transmission end. The third arithmetic unit calculates a first noise intensity corresponding to the allowable limit BER from the first OSNR. The fourth arithmetic unit calculates a second noise intensity corresponding to the reception BER from the second OSNR. The calculator calculates a noise intensity margin, based on the first noise intensity and the second noise intensity.
Description
- The embodiments discussed herein are related to a network control apparatus and a transmission quality margin calculation method.
- System design of an optical communication network is performed before operation of communication service, based on preset system conditions, such as fiber parameters, the signal modulation format, the bit rate, and the fiber input light power.
- A system transmitting high-density wavelength division multiplex signal light requires prior design to deal with dynamic path switching in operation, wavelength increase, and change in the modulation method, in addition to consideration of penalty for interference between wavelength signals in transmission. However, in prior design, an excessive margin may cause deterioration in transmission distance and transmission quality of the whole system. For this reason, in the actual situation, there is a demand for operation of a system with a margin suppressed to a minimum and operation of a dynamic optical network.
- For this reason, an error vector magnitude (EVM) is measured for each of optical transmission devices in the system, and an electrical signal to noise ratio (ESNR) is acquired from a measurement result. In addition, a method is well known in which an optical signal to noise ratio (OSNR) is calculated from the acquired ESNR, and an OSNR margin is calculated based on the OSNR. A conventional example is described in Japanese Laid-open Patent Publication No.
2015-50600 - However, the case of using an optical transmission device including no function of measuring EVM is also supposed, there are cases where measurement of EVM fails, which causes a problem. Accordingly, in the actual situation, a margin of the transmission quality is not accurately measured.
- Accordingly, it is an object in one aspect of an embodiment of the invention to provide a network control apparatus and a transmission quality margin calculation method that enable calculation of a margin of the transmission quality with accuracy.
- According to an aspect of an embodiment, a network control apparatus includes a processor. The processor calculates a first OSNR corresponding to an allowable limit BER from an OSNR-BER characteristic of a loopback transmission end in a node of a transmission end that transmits a wavelength signal. The processor acquires a reception BER of a reception end node receiving the wavelength signal, and calculates a second OSNR corresponding to the reception BER from the OSNR-BER characteristic of the transmission end. The processor calculates a first noise intensity corresponding to the allowable limit BER from the first OSNR. The processor calculates a second noise intensity corresponding to the reception BER from the second OSNR. The processor calculates a noise intensity margin, based on the first noise intensity and the second noise intensity.
-
-
FIG. 1 is an explanatory drawing illustrating an example of an optical transmission system according to a first embodiment; -
FIG. 2 is a block diagram illustrating an example of hardware configuration of a node according to the first embodiment; -
FIG. 3 is an explanatory drawing illustrating an example of a NW controller according to the first embodiment; -
FIG. 4 is an explanatory drawing illustrating an example of a first margin arithmetic unit; -
FIG. 5 is a flowchart illustrating an example of processing operations of the first margin arithmetic unit in the NW controller relating to first margin calculation processing; -
FIG. 6 is an explanatory drawing illustrating an example of a transmission end OSNR yield strength curve on a BER-OSNR characteristic; -
FIG. 7 is an explanatory drawing illustrating an example of OSNRtotal FEC corresponding to BERFEC on the BER-OSNR characteristic; -
FIG. 8 is an explanatory drawing illustrating an example of reception BERmea in operation on the BER-OSNR characteristic; -
FIG. 9 is an explanatory drawing illustrating an example of OSNRtotal mea corresponding to reception BERmea in operation on the BER-OSNR characteristic; -
FIG. 10 is an explanatory drawing illustrating an example of ASE noise margin Pase margin in operation on the BER-OSNR characteristic; -
FIG. 11 is a block diagram illustrating an example of hardware configuration of a node according to a second embodiment; -
FIG. 12 is an explanatory drawing illustrating an example of the NW controller according to the second embodiment; -
FIG. 13 is an explanatory drawing illustrating an example of a second margin arithmetic unit; -
FIG. 14 is a flowchart illustrating an example of processing operations of the second margin arithmetic unit in the NW controller relating to second margin calculation processing; -
FIG. 15 is an explanatory drawing illustrating an example of reception OSNR1 in operation on the BER-OSNR characteristic; -
FIG. 16 is an explanatory drawing illustrating an example of an OSNR yield strength curve in operation on the BER-OSNR characteristic; -
FIG. 17 is an explanatory drawing illustrating an example of OSNR2 on an OSNR yield strength curve in operation on the BER-OSNR characteristic; -
FIG. 18 is an explanatory drawing illustrating an example of an OSNR margin OSNRmargin in operation on the BER-OSNR characteristic; -
FIG. 19 is an explanatory drawing illustrating an example of relation between a measurement target wavelength signal and adjacent wavelength signals; -
FIG. 20 is an explanatory drawing illustrating an example of a correction table according to a third embodiment; -
FIG. 21 is an explanatory drawing illustrating an example of an OSNR margin OSNRmargin before and after correction according to the third embodiment; -
FIG. 22 is an explanatory drawing illustrating an example of a correction table according to a fourth embodiment; -
FIG. 23 is an explanatory drawing illustrating an example of an OSNR margin OSNRmargin before and after correction according to the fourth embodiment; -
FIG. 24 is an explanatory drawing illustrating an example of the NW controller according to a fifth embodiment; -
FIG. 25 is an explanatory drawing illustrating an example of hardware configuration of the node according to a sixth embodiment; -
FIG. 26 is an explanatory drawing illustrating an example of a method for acquiring an OSNR yield strength curve according to the sixth embodiment; -
FIG. 27 is an explanatory drawing illustrating an example of hardware configuration of the node according to a seventh embodiment; -
FIG. 28 is an explanatory drawing illustrating an example of a method for acquiring an OSNR yield strength curve according to the seventh embodiment; -
FIG. 29 is an explanatory drawing illustrating an example of a path storage unit; and -
FIG. 30 is an explanatory drawing illustrating an example of a method for determining a reception end node. - Preferred embodiments of the present invention will be explained with reference to accompanying drawings. The present embodiments do not limit the disclosed technique. The embodiments illustrated hereinafter may be properly combined within a range that does not cause contradiction.
-
FIG. 1 is an explanatory drawing illustrating an example of anoptical transmission system 1 according to a first embodiment. Theoptical transmission system 1 illustrated inFIG. 1 includes a plurality ofnodes 2, and a network (NW)controller 3. Thenodes 2 are, for example, seven optical transmission devices formed of node "A" to node "G" that are connected to perform communications throughoptical fibers 4. Eachnode 2 is, for example, a color-less direction-less (CD) reconfigurable optical add-drop multiplexer (ROADM) or a color-less direction less contention-less (CDC) ROADM. For the sake of convenience of explanation, the number ofnodes 2 is set to seven, but the number is not limited thereto. The number ofnodes 2 may properly be changed. Theoptical transmission system 1 is, for example, a wavelength multiplexing optical transmission system in which a plurality of optical wavelength paths are multiplexed. - The
NW controller 3 is a device collecting various types of information, such as signal quality, of each of thenodes 2 in theoptical transmission system 1. TheNW controller 3 is a device calculating an amplified spontaneous emission (ASE) noise margin from a bit error rate (BER) in operation. -
FIG. 2 is an explanatory drawing illustrating an example of hardware configuration of eachnode 2 in the first embodiment. Eachnode 2 illustrated inFIG. 2 includes aninput amplifier 11, anoutput amplifier 12, a plurality of receivers (Rx) 13, a plurality of transmitters (Tx) 14, an opticalbranch inserting unit 15, aBER acquisition unit 16, and anode controller 17. Theinput amplifier 11 is an optical amplifier amplifying an optical signal input from theoptical fiber 4. Theoutput amplifier 12 is an optical amplifier amplifying an optical signal to be output to theoptical fiber 4. EachRx 13 is a receiver receiving an optical signal. EachTx 14 is a transmitter transmitting an optical signal. The opticalbranch inserting unit 15 has a function of optically branching part of an optical signal communicated through the wavelength path and optically inserting a new optical signal into the optical signal communicated through the wavelength path, and a function of adjusting the power of the optical signal communicated through the wavelength path. The opticalbranch inserting unit 15 optically branches an optical signal, and transmits the optically branched optical signal to acertain Rx 13. The opticalbranch inserting unit 15 optically inserts an optical signal from theTx 14 into an optical signal, and outputs the optically inserted optical signal to theoptical fiber 4 through theoutput amplifier 12. - The
BER acquisition unit 16 measures a BER of the reception path at theRx 13. Thenode controller 17 is connected and communicates with theNW controller 3, measures a BER of the wavelength path at theRx 13, and notifies theNW controller 3 of information including a result of measurement of the BER. The information includes path identification information to identify the wavelength path, and a BER of the wavelength path. -
FIG. 3 is an explanatory drawing illustrating an example of theNW controller 3 according to the first embodiment. TheNW controller 3 illustrated inFIG. 3 includes acommunication unit 21, astorage unit 22, a firstmargin arithmetic unit 23, and acontroller 24. Thecommunication unit 21 is a communication interface communicating with eachnode 2. Thestorage unit 22 is a region storing various types of information therein. Thestorage unit 22 includes afirst storage unit 31 and asecond storage unit 32. Thefirst storage unit 31 serves as a storage unit managing a transmission end OSNR yield strength curve associating the OSNR with the BER. The transmission end OSNR yield strength curve is a curve indicating correspondence relation between BER and OSNR of loopback communication between theTx 14 and theRx 13 in thetransmission end node 2 of "A", that is, B to B. Thesecond storage unit 32 is a region storing parameters η and κ of the Tx characteristic therein. The firstmargin arithmetic unit 23 calculates an amplified spontaneous emission (ASE) noise margin Pase margin from the transmission end OSNR yield strength curve and the reception BERmea in operation. The reception BER is an actually measured BER measured at thereception end node 2 of "C" receiving a wavelength signal from thetransmission end node 2 of "A". Thecontroller 24 controls thewhole NW controller 3. -
FIG. 4 is an explanatory drawing illustrating an example of the firstmargin arithmetic unit 23. The firstmargin arithmetic unit 23 illustrated inFIG. 4 includes atransmission condition memory 41, a settingBER memory 42, a firstarithmetic unit 43, a secondarithmetic unit 44, a thirdarithmetic unit 45, a fourtharithmetic unit 46, and acalculator 47. Thetransmission condition memory 41 stores a noise bandwidth Bn and a signal symbol rate Rs therein. The settingBER memory 42 stores a BERFEC serving as an allowable limit of theoptical transmission system 1 therein. The BERFEC of the allowable limit is a BER serving as a limit allowable in theoptical transmission system 1. - The first
arithmetic unit 43 calculates OSNRtotal FEC by substituting a noise bandwidth Bn, a signal symbol rate Rs, and a BERFEC of the allowable limit for symbols in Numerical Expression (1). Numerical Expression (1) is applicable to the case where the modulation method is quadrature phase shift keying (QPSK).
- The second
arithmetic unit 44 calculates OSNRtotal mea by substituting the noise bandwidth Bn, the signal symbol rate Rs, and the reception BERmea for the symbols in Numerical Expression (2). Numerical Expression (2) is also applicable to the case where the modulation method is quadrature phase shift keying (QPSK).
- The third
arithmetic unit 45 calculates ASE noise intensity Pase FEC BtoB by substituting the OSNRtotal FEC from the firstarithmetic unit 43, and the parameters η and κ of the Tx characteristic for the symbols in Numerical Expression (3). For the ASE noise intensity Pase FEC BtoB, Numerical Expression (4) is established based on the relation with the ASE noise intensity Pase FEC trans in operation and nonlinear noise intensity PNLI.

- The fourth
arithmetic unit 46 calculates the ASE noise intensity Pase mea BtoB, by substituting the OSNRtotal mea from the secondarithmetic unit 44, and the parameters η and κ of the Tx characteristic for the symbols in Numerical Expression (5). For the ASE noise intensity Pase mea BtoB, Numerical Expression (6) is established based on the relation with the ASE noise intensity Pase mea trans in operation and nonlinear noise intensity PNLI

- The
calculator 47 subtracts the ASE noise intensity Pase mea BtoB calculated in the fourtharithmetic unit 46 from the ASE noise intensity Pase FEC BtoB calculated in the thirdarithmetic unit 45, and calculates a subtraction result as the ASE noise margin Pase margin. For the ASE noise margin Pase margin, Numerical Expression (7) is established, and consequently Numerical Expression (8) is obtained.

- The following is an explanation of operations of the
NW controller 3 according to the first embodiment.FIG. 5 is a flowchart illustrating an example of processing operations of the firstmargin arithmetic unit 23 in theNW controller 3 relating to first margin calculation processing. - In
FIG. 5 , the firstmargin arithmetic unit 23 acquires the transmission end OSNR yield strength curve from thefirst storage unit 31, and acquires the Tx characteristic parameters η and κ from the second storage unit 32 (Step S11).FIG. 6 is an explanatory drawing illustrating an example of a transmission end OSNR yield strength curve on a BER-OSNR characteristic. In the BER-OSNR characteristic, the vertical axis indicates BER, and the horizontal axis indicates OSNR. The characteristic illustrated inFIG. 6 illustrates the transmission end OSNR yield strength curve and BERFEC. - The first
arithmetic unit 43 in the firstmargin arithmetic unit 23 reads a BERFEC of the allowable limit from the settingBER memory 42, and substitutes the noise bandwidth Bn, the signal symbol rate Rs, and BERfec for the symbols of Numerical Expression (1). The firstarithmetic unit 43 calculates OSNRtotal FEC corresponding to BERFEC (Step S12).FIG. 7 is an explanatory drawing illustrating an example of OSNRtotal FEC corresponding to BERFEC on the BER-OSNR characteristic. The Psig/Pase FEC BtoB illustrated inFIG. 7 is OSNRtotal FEC corresponding to BERFEC. - The third
arithmetic unit 45 in the firstmargin arithmetic unit 23 calculates ASE noise intensity Pase FEC BtoB from OSNRtotal FEC (Step S13). - The second
arithmetic unit 44 in the firstmargin arithmetic unit 23 acquires reception BERmea in operation of the reception end node 2 (Step S14). The reception BERmea of thereception end node 2 is a reception BER in operation that is measured by thereception end node 2.FIG. 8 is an explanatory drawing illustrating an example of the reception BERmea in operation on the BER-OSNR characteristic. The characteristic illustrated inFIG. 8 illustrates the reception BERmea in operation. - The second
arithmetic unit 44 substitutes the noise bandwidth Bn, the signal symbol rate Rs, and the reception BERmea for the symbols in Numerical Expression (2), and calculates OSNRtotal mea corresponding to the reception BERmea in operation (Step S15). - The fourth
arithmetic unit 46 in the firstmargin arithmetic unit 23 substitutes the OSNRtotal mea from the secondarithmetic unit 44 and the Tx characteristic parameters η and κ for the symbols in Numerical Expression (5), to calculate ASE noise intensity Pase mea BtoB (Step S16)FIG. 9 is an explanatory drawing illustrating an example of OSNRtotal mea corresponding to the reception BERmea on the BER-OSNR characteristic. The Psig/Pase mea BtoB illustrated inFIG. 9 is OSNRtotal mea corresponding to BERmea. - The
calculator 47 in the firstmargin arithmetic unit 23 calculates an ASE noise margin Pase margin (Step S17) based on the ASE noise intensity Pase FEC BtoB and ASE noise intensity Pase mea BtoB, and ends the processing operations illustrated inFIG. 5 .FIG. 10 is an explanatory drawing illustrating an example of the ASE noise margin Pase margin in operation on the BER-OSNR characteristic. The characteristic illustrated inFIG. 10 illustrates the ASE noise margin Pase margin. The reception end OSNR yield strength curve is a curve of a BER-OSNR characteristic of thenode 2 of the reception end in operation. - The
NW controller 3 in the first embodiment calculates an OSNRtotal FEC corresponding to the allowable limit BERFEC from the transmission end OSNR yield strength curve, and calculates an OSNRtotal mea corresponding to the reception BERmea from the transmission end OSNR yield strength curve. TheNW controller 3 calculates ASE noise intensity Pase FEC BtoB from the OSNRtotal FEC, and calculates ASE noise intensity Pase mea BtoB from the OSNRtotal mea. TheNW controller 3 subtracts the ASE noise intensity Pase mea BtoB from the ASE noise intensity Pase FEC BtoB, and calculates a subtraction result as the ASE noise margin Pase margin. Consequently, an ASE noise margin is calculated with high accuracy from the reception BER. - The
NW controller 3 in the first embodiment described above acquires the reception BERmea in operation from thereception end node 2. The following is an explanation of an embodiment serving as a second embodiment, in the case where a reception OSNR is acquired from thereception end node 2, as well as the reception BERmea in operation. Constituent elements that are the same as those of theoptical transmission system 1 according to the first embodiment will be denoted by the same reference numerals as those of the first embodiment, and the explanation of overlapping structures and operations will be omitted. -
FIG. 11 is a block diagram illustrating an example of hardware configuration of anode 2A according to a second embodiment. Thenode 2A illustrated inFIG. 11 is different from thenode 2 illustrated inFIG. 2 , in that thenode 2A includes an OSNR monitor 18. Thenode 2A acquires a reception BERmea of the reception end with theBER acquisition unit 16, and acquires a reception OSNR1 of the reception end with the OSNR monitor 18. In addition, thenode controller 17 notifies aNW controller 3A of the acquired reception BERmea of thereception end node 2A and the acquired reception OSNR1 of thereception end node 2A. -
FIG. 12 is an explanatory drawing illustrating an example of theNW controller 3A according to the second embodiment. TheNW controller 3A illustrated inFIG. 12 is different from theNW controller 3 illustrated inFIG. 3 , in that theNW controller 3A includes a secondmargin arithmetic unit 23A calculating an OSNR margin OSNRmargin, based on the reception BERmea acquired from thereception end node 2A and the reception OSNR1 of thereception end node 2A. -
FIG. 13 is an explanatory drawing illustrating an example of the secondmargin arithmetic unit 23A. The secondmargin arithmetic unit 23A illustrated inFIG. 13 further includes a fiftharithmetic unit 48, a sixtharithmetic unit 49, afirst calculator 50, asecond calculator 51, and athird calculator 52. - The fifth
arithmetic unit 48 acquires the reception OSNR1, and substitutes the acquired reception OSNR1 for the symbol in Numerical Expression (9), to calculate ASE noise intensity Pase mea trans.
- The
first calculator 50 subtracts the ASE noise intensity Pase mea BtoB calculated in the fourtharithmetic unit 46 from the ASE noise intensity Pase mea trans calculated in the fiftharithmetic unit 48, based on Numerical Expression (10), to calculate nonlinear noise intensity PNLI. Thefirst calculator 50 inputs the calculated nonlinear noise intensity PNLI to thesecond calculator 51.
- The
second calculator 51 subtracts the nonlinear noise intensity PNLI calculated in thefirst calculator 50 from the ASE noise intensity Pase FEC BtoB calculated in the thirdarithmetic unit 45, to calculate ASE noise intensity Pase FEC trans. Thesecond calculator 51 also inputs the calculated ASE noise intensity Pase FEC trans to the sixtharithmetic unit 49. The sixtharithmetic unit 49 calculates OSNR2 corresponding to the setting BERFEC in operation from the ASE noise intensity Pase FEC trans, and inputs the calculated OSNR2 to thethird calculator 52. - The
third calculator 52 subtracts the OSNR2 calculated in the sixtharithmetic unit 49 from the reception OSNR1 calculated with the fiftharithmetic unit 48, based on Numerical Expression (11), to calculate the OSNR margin OSNRmargin. Thethird calculator 52 inputs the calculated OSNRmargin to thecontroller 24.
- The following is an explanation of operations of the
NW controller 3A according to the second embodiment.FIG. 14 is a flowchart illustrating an example of processing operations of the secondmargin arithmetic unit 23A in theNW controller 3A relating to second margin calculation processing. - In
FIG. 14 , the secondmargin arithmetic unit 23A acquires the transmission end OSNR yield strength curve from thefirst storage unit 31, and acquires the Tx characteristic parameters η and κ from the second storage unit 32 (Step S21). The firstarithmetic unit 43 in the secondmargin arithmetic unit 23A reads the BERFEC from the settingBER memory 42, and substitutes the noise bandwidth Bn, the signal symbol rate Rs, and BERFEC for the symbols in Numerical Expression (1), based on Numerical Expression (1). The firstarithmetic unit 43 calculates an OSNRtotal FEC corresponding to the BERFEC (Step S22). - The third
arithmetic unit 45 in the secondmargin arithmetic unit 23A calculates ASE noise intensity Pase FEC BtoB from the OSNRtotal FEC (Step S23). The secondarithmetic unit 44 in the secondmargin arithmetic unit 23A acquires the reception BERmea in operation of the reception end node 2 (Step S24). The secondarithmetic unit 44 substitutes the noise bandwidth Bn, the signal symbol rate Rs, and the reception BERmea for the symbols in Numerical Expression (2), to calculate an OSNRtotal mea corresponding to the reception BERmea in operation (Step S25). In addition, the fourtharithmetic unit 46 in the secondmargin arithmetic unit 23A calculates ASE noise intensity Pase mea BtoB from OSNRtotal mea (Step S26). - The fifth
arithmetic unit 48 in the secondmargin arithmetic unit 23A acquires a reception OSNR1 of the reception end node 2 (Step S27).FIG. 15 is an explanatory drawing illustrating an example of the reception OSNR1 in operation on a BER-OSNR characteristic. The characteristic illustrated inFIG. 15 illustrates the reception OSNR1 corresponding to the reception BERmea in operation. The fiftharithmetic unit 48 calculates ASE noise intensity Pase mea trans, nonlinear noise intensity PNLi, and ASE noise intensity Pase FEC trans from the reception OSNR1 of the reception end node 2 (Step S28). The fiftharithmetic unit 48 calculates an OSNR yield strength curve in operation, based on the ASE noise intensity Pase mea trans, nonlinear noise intensity PNLI, and ASE noise intensity Pase FEC trans.FIG. 16 is an explanatory drawing illustrating an example of the OSNR yield strength curve in operation on a BER-OSNR characteristic. The characteristic illustrated inFIG. 16 illustrates a reception end OSNR yield strength curve in operation in thenode 2 of the reception end. - The sixth
arithmetic unit 49 in the secondmargin arithmetic unit 23A calculates an OSNR2 from the ASE noise intensity Pase FEC trans (Step S29).FIG. 17 is an explanatory drawing illustrating an example of the OSNR2 on the OSNR yield strength curve in operation on the BER-OSNR characteristic. The characteristic illustrated inFIG. 17 illustrates the OSNR2 on the OSNR yield strength curve in operation. - The
third calculator 52 in the secondmargin arithmetic unit 23A subtracts the OSNR2 from the reception OSNR1 from the fiftharithmetic unit 48 to calculate an OSNRmargin (Step S30), and ends the processing operations illustrated inFIG. 14 .FIG. 18 is an explanatory drawing illustrating an example of the OSNR margin OSNRmargin in operation on a BER-OSNR characteristic. The characteristic illustrated inFIG. 18 illustrates the OSNR margin OSNRmargin. - The
NW controller 3A of the second embodiment calculates an OSNRtotal FEC corresponding to the allowable limit BERFEC from the transmission end OSNR yield strength curve, and calculates an OSNRtotal mea corresponding to the reception BERmea from the transmission end OSNR yield strength curve. TheNW controller 3A calculates ASE noise intensity Pase FEC BtoB from the OSNRtotal FEC, and calculates ASE noise intensity Pase mea BtoB from the OSNRtotal mea. TheNW controller 3A acquires a result of measurement of the reception OSNR1 corresponding to the reception BERmea, and calculates ASE noise intensity Pase mea trans from the acquired reception OSNR1, to calculate nonlinear noise intensity PNLI from the ASE noise intensity Pase mea trans. TheNW controller 3A subtracts the nonlinear noise intensity PNLI from the ASE noise intensity Pase FEC BtoB, to calculate ASE noise intensity Pase FEC trans. In addition, theNW controller 3A calculates an OSNR2 from the ASE noise intensity Pase FEC trans, and subtracts the OSNR2 from the reception OSNR1, to calculate an OSNRmargin. This structure enables calculation of an OSNR margin OSNRmargin with high accuracy from the reception BER measured at thereception end node 2 and the reception OSNR1. - The
NW controller 3A according to the second embodiment described above calculates an OSNR margin OSNRmargin using nonlinear noise intensity PNLI when a measurement wavelength signal (channel) is disposed in an idler frequency band in the signal spectrum. However, the nonlinear noise intensity changes when a wavelength is increased or wavelength arrangement is changed. For this reason, to deal with such a situation, an embodiment will be explained hereinafter as a third embodiment. In the third embodiment, the OSNR margin OSNRmargin is corrected in accordance with a change amount of an idler frequency band of the measurement wavelength signal from an adjacent wavelength signal. -
FIG. 19 is an explanatory drawing illustrating an example of relation between a measurement target wavelength signal and adjacent wavelength signals. The measurement target wavelength signal is a signal serving as a target for which an OSNR margin is to be calculated. The nonlinear noise intensity changes in accordance with a change amount of the idler frequency band between the measurement target wavelength signal and an adjacent wavelength signal adjacent to the measurement target wavelength signal in the signal spectrum. Accordingly, the OSNR margin OSNRmargin is corrected in accordance with the change amount of the idler frequency band between the measurement target wavelength signal and the adjacent wavelength signal. - The
controller 24 in theNW controller 3A refers to a correction table 61, to correct the OSNR margin OSNRmargin calculated with the secondmargin arithmetic unit 23A.FIG. 20 is an explanatory drawing illustrating an example of the correction table 61 according to the third embodiment. The correction table 61 illustrated inFIG. 20 manages correction values to correct the OSNR margin OSNRmargin for each of anidler frequency band 61A before change and anidler frequency band 61B after change. - For example, in the case where the
idler frequency band 61A before change is less than 12.5 GHz, no correction value is applied when theidler frequency band 61B after change is less than 12.5 GHz, and a correction value is 3 dB when theidler frequency band 61B after change is less than 25 GHz. In addition, a correction value is 4 dB when theidler frequency band 61B after change is less than 50 GHz or less than 100 GHz, and a correction value is 5 dB when theidler frequency band 61B after change is less than 150 GHz or equal to or higher than 150 GHz. - For example, in the case where the
idler frequency band 61A before change is less than 25 GHz, a correction value is -3 dB when theidler frequency band 61B after change is less than 12.5 GHz, and no correction value is applied when theidler frequency band 61B after change is less than 25 GHz. In addition, a correction value is 1 dB when theidler frequency band 61B after change is less than 50 GHz, a correction value is 1.5 dB when theidler frequency band 61B after change is less than 100 GHz, and a correction value is 2 dB when theidler frequency band 61B after change is less than 150 GHz. A correction value is 2.5 dB when theidler frequency band 61B after change is 150 GHz or more. - In the case where the
idler frequency band 61A before change is less than 50 GHz, a correction value is -4 dB when theidler frequency band 61B after change is less than 12.5 GHz, and a correction value is -1 dB when theidler frequency band 61B after change is less than 25 GHz. In addition, no correction value is applied when theidler frequency band 61B after change is less than 50 GHz, a correction value is 0.5 dB when theidler frequency band 61B after change is less than 100 GHz, and a correction value is 1 dB when theidler frequency band 61B after change is less than 150 GHz. A correction value is 1 dB when theidler frequency band 61B after change is 150 GHz or more. - In the case where the
idler frequency band 61A before change is less than 100 GHz, a correction value is -4 dB when theidler frequency band 61B after change is less than 12.5 GHz, and a correction value is -1.5 dB when theidler frequency band 61B after change is less than 25 GHz. In addition, a correction value is -0.5 dB when theidler frequency band 61B after change is less than 50 GHz, and no correction value is applied when theidler frequency band 61B after change is less than 100 GHz, less than 150 GHz, or 150 GHz or more. - When the OSNR margin OSNRmargin is calculated in the second
margin arithmetic unit 23A, thecontroller 24 acquires a correction value from the correction table 61, in accordance with theidler frequency band 61A before change and theidler frequency band 61B after change.FIG. 21 is an explanatory drawing illustrating an example of the OSNR margin OSNRmargin before and after correction according to the third embodiment. In addition, thecontroller 24 corrects the OSNR margin OSNRmargin as illustrated inFIG. 20 , based on the acquired correction value. - The
NW controller 3A according to the third embodiment acquires a correction value corresponding to idler frequency band amounts before and after change, and corrects the OSNR margin OSNRmargin, based on the acquired correction value. This structure enables provision of an OSNR margin OSNRmargin in consideration of nonlinear noise intensity fluctuating in accordance with the idler frequency band amount of the measurement target wavelength signal. - The
NW controller 3A according to the second embodiment described above calculates the OSNR margin OSNRmargin using the nonlinear noise intensity PNLI when, for example, the measurement target wavelength signal in the signal spectrum is changed. However, the nonlinear noise intensity changes also when the transmission path input power is changed. For this reason, to deal with such a situation, an embodiment will be explained hereinafter as a fourth embodiment. In the embodiment, the OSNR margin OSNRmargin is corrected in accordance with a change amount of a transmission path input power of the measurement target wavelength signal. - Nonlinear noise intensity changes in accordance with a change amount of the transmission path input power between the measurement target wavelength signal and an adjacent wavelength signal adjacent to the measurement target wavelength signal in the signal spectrum. As a result, the OSNR margin OSNRmargin is corrected in accordance with the change amount of the transmission path input power of the measurement target wavelength signal.
- The
controller 24 in theNW controller 3A refers to a correction table 62, to correct the OSNR margin OSNRmargin calculated in the secondmargin arithmetic unit 23A.FIG. 22 is an explanatory drawing illustrating an example of the correction table 62 according to the fourth embodiment. - The correction table 62 illustrated in
FIG. 22 manages correction values to correct the OSNR margin OSNRmargin for each of a transmission path inputpower 62A before change and a transmission path inputpower 62B after change. For example, in the case where the transmission path inputpower 62A before change is -1.5 dBm/ch, no correction value is applied when the transmission path inputpower 62B after change is -1.5 dBm/ch, -1 dBm/ch, or -0.5 dBm/ch. A correction value is -1 dB when the transmission path inputpower 62B after change is 0 dBm/ch, a correction value is - 2.5 dB when the transmission path inputpower 62B after change is 0.5 dBm/ch, and a correction value is -5 dB when the transmission path inputpower 62B after change is 1 dBm/ch. - For example, in the case where the transmission path input
power 62A before change is -1 dBm/ch, no correction value is applied when the transmission path inputpower 62B after change is -1.5 dBm/ch, -1 dBm/ch, or -0.5 dBm/ch. A correction value is -1 dB when the transmission path inputpower 62B after change is 0 dBm/ch, a correction value is - 2 dB when the transmission path inputpower 62B after change is 0.5 dBm/ch, and a correction value is -5 dB when the transmission path inputpower 62B after change is 1 dBm/ch. - For example, in the case where the transmission path input
power 62A before change is 0.5 dBm/ch, a correction value is 2.5 dB when the transmission path inputpower 62B after change is -1.5 dBm/ch, and a correction value is 2 dB when the transmission path inputpower 62B after change is -1 dBm/ch. A correction value is 1.5 dB when the transmission path inputpower 62B after change is -0.5 dBm/ch, and a correction value is 1 dB when the transmission path inputpower 62B after change is 0 dBm/ch. No correction value is applied when the transmission path inputpower 62B after change is 0.5 dBm/ch, and a correction value is -3 dB when the transmission path inputpower 62B after change is 1 dBm/ch. - When the OSNR margin OSNRmargin is calculated in the second
margin arithmetic unit 23A, thecontroller 24 acquires a correction value corresponding to the transmission path inputpower 62A before change and the transmission path inputpower 62B after change from the correction table 62.FIG. 23 is an explanatory drawing illustrating an example of the OSNR margin OSNRmargin before and after correction according to the fourth embodiment. In addition, thecontroller 24 corrects the OSNR margin OSNRmargin as illustrated inFIG. 23 , based on the acquired correction value. - The
NW controller 3A according to the fourth embodiment acquires a correction value corresponding to the transmission path input power amounts before and after change, and corrects the OSNR margin OSNRmargin, based on the acquired correction value. This structure provides an OSNR margin OSNRmargin in consideration of nonlinear noise intensity fluctuating in accordance with the transmission input powers of the measurement wavelength signal before and after change. - The
NW controller 3A according to the second embodiment described above stores, in thefirst storage unit 31 in advance, a transmission end OSNR yield strength curve associating the B-to-B BER with OSNR in loopback communication between theTx 14 andRx 13 in thetransmission end node 2. However, various model numbers exist for theTx 14 and theRx 13 in thetransmission end node 2, and the transmission end OSNR yield strength curve differs in accordance with a combination of theTx 14 and theRx 13 of each model number. For this reason, an embodiment will be explained hereinafter as a fifth embodiment. In the embodiment, aNW controller 3B is capable of a transmission end OSNR yield strength curve in accordance with a combination of theTx 14 and theRx 13 of each model number. Constituent elements that are the same as those of theNW controller 3A according to the second embodiment will be denoted by the same reference numerals as those of the second embodiment, and the explanation of overlapping structures and operations will be omitted. -
FIG. 24 is an explanatory drawing illustrating an example of aNW controller 3B according to a fifth embodiment. TheNW controller 3B illustrated inFIG. 24 includes thecommunication unit 21, the secondmargin arithmetic unit 23A, thecontroller 24, and thestorage unit 22. Thestorage unit 22 includes apath storage unit 33, and athird storage unit 34, in addition to thesecond storage unit 32. Thepath storage unit 33 is a region to manage thetransmission end node 33B, thereception end node 33C, therelay node 33D, themodel number 33E of theTx 14, and themodel number 33F of theRx 13 in thetransmission end node 2, in association with eachch number 33A to identify the channel of the wavelength signal. - The
third storage unit 34 stores therein a transmission end OSNR yield strength curve associating BER with OSNR in accordance with the combination of themodel number 33E of theTx 14 and themodel number 33F of theRx 13. - The
controller 24 acquires a transmission end OSNR yield strength curve from thethird storage unit 34, in accordance with the combination of themodel number 33E of theTx 14 and themodel number 33F of theRx 13 in thetransmission end node 2. - Because the
NW controller 3B according to the fifth embodiment acquires a transmission end OSNR yield strength curve in accordance with the combination of themodel number 33E of theTx 14 and themodel number 33F of theRx 13, theNW controller 3B provides various types of transmission end OSNR yield strength curves in accordance with the combination of themodel number 33E of theTx 14 and themodel number 33F of theRx 13. - The
NW controller 3 according to the first embodiment described above acquires a transmission end OSNR yield strength curve corresponding to theTx 14 and theRx 13 in thetransmission end node 2 from thefirst storage unit 31. However, the structure is not limited to the case of acquiring a transmission end OSNR yield strength curve from thefirst storage unit 31, but a transmission end OSNR yield strength curve may be acquired through communication between theTx 14 and theRx 13 in thetransmission end node 2. An embodiment in this case will be explained hereinafter as a sixth embodiment. -
FIG. 25 is an explanatory drawing illustrating an example of hardware configuration of anode 2B according to a sixth embodiment. Constituent elements that are the same as those of thenode 2 according to the first embodiment will be denoted by the same reference numerals as those of the first embodiment, and the explanation of overlapping structures and operations will be omitted. - The
node 2B illustrated inFIG. 25 is different from thenode 2 illustrated inFIG. 2 , in that thenode 2B is provided with an ASElight source 19 on theTx 14 side, and anOSNR monitor 18A on the Rx side. The ASElight source 19 is a light source emitting light of ASE noise to enable adjustment of the ASE noise intensity. The OSNR monitor 18A monitors OSNR between theTx 14 and theRx 13 in accordance with change of the ASE noise from the ASElight source 19 on theTx 14 side. - The
node controller 17 adjusts the ASElight source 19 during B-to-B loopback communication between theTx 14 and theRx 13.FIG. 26 is an explanatory drawing illustrating an example of a method for acquiring an OSNR yield strength curve according to the sixth embodiment. The OSNR monitor 18A successively acquires values of the BER and the OSNR in accordance with change of the ASE noise intensity of the ASElight source 19 as illustrated inFIG. 26 , and notifies theNW controller 3 of the successively acquired values of the BER and the OSNR. - The
NW controller 3 generates a transmission end OSNR yield strength curve based on the values of the BER and the OSNR successively acquired from thetransmission end node 2B. Specifically, theNW controller 3 is capable of acquiring a transmission end OSNR yield strength curve in accordance with change of the ASE noise. TheNW controller 3 acquires the Tx characteristic parameters η and κ, based on the generated transmission end OSNR yield strength curve and the reception BER acquired from thereception end node 2, and stores the acquired Tx characteristic parameters and κ in thesecond storage unit 32. - The
transmission end node 2B according to the sixth embodiment successively acquires values of the reception BER and the reception OSNR in accordance with change of the ASE noise of the ASElight source 19, and notifies theNW controller 3 of the successively acquired values of the reception BER and the reception OSNR. In addition, theNW controller 3 is capable of generating a transmission end OSNR yield strength curve in accordance with the successively acquired values of the reception BER and the reception OSNR. - The
NW controller 3 according to the first embodiment described above acquires a transmission end OSNR yield strength curve corresponding to theTx 14 and theRx 13 in thetransmission end node 2 from thefirst storage unit 31. However, the structure is not limited to the case of acquiring a transmission end OSNR yield strength curve from thefirst storage unit 31, but a transmission end OSNR yield strength curve may be acquired through communication between theTx 14 and theRx 13 in thetransmission end node 2. An embodiment in this case will be explained hereinafter as a seventh embodiment. -
FIG. 27 is an explanatory drawing illustrating an example of hardware configuration of anode 2C according to a seventh embodiment. Constituent elements that are the same as those of thenode 2 according to the first embodiment will be denoted by the same reference numerals as those of the first embodiment, and the explanation of overlapping structures and operations will be omitted. - The
node 2C illustrated inFIG. 27 is different from thenode 2 illustrated inFIG. 2 , in that thenode 2C is provided with a noise addition unit 71 in theRx 13A, a noise controller 72 in theRx 13A, a BER acquisition unit 73 in theRx 13A, and anOSNR monitor 18B. - The noise addition unit 71 adds a noise addition amount to a demodulated electrical signal. The noise controller 72 adjusts a noise addition amount Pnoise Rx Add of the noise addition unit 71. The BER acquisition unit 73 acquires the reception BER in accordance with adjustment of the noise addition amount. The OSNR monitor 18B monitors the OSNR with the
Tx 14. Thenode controller 17 collects the noise addition amount, the reception BER and a result of monitoring the OSNR, and notifies theNW controller 3 of the collected noise addition amount, the reception BER, and the OSNR monitoring result. -
FIG. 28 is an explanatory drawing illustrating an example of a method for acquiring an OSNR yield strength curve according to the seventh embodiment. Thecontroller 24 in theNW controller 3 calculates OSNRTX from thetransmission end node 2C and OSNRTX2 corresponding to the reception BER acquired in addition of noise, as illustrated inFIG. 28 . As a result, thecontroller 24 measures the reception BER and OSNR while changing the noise addition amount, to acquire the transmission end OSNR yield strength curve and the Tx characteristic parameters η and κ. - The
NW controller 3 acquires the transmission end OSNR yield strength curve and the Tx characteristic parameters η and κ from thetransmission end node 2C, and stores them in thesecond storage unit 32. - The
transmission end node 2C according to the seventh embodiment successively acquires values of the reception BER and the reception OSNR in accordance with change of the noise addition amount added to the demodulated electrical signal, and notifies theNW controller 3 of the successively acquired values of the reception BER and the reception OSNR. In addition, theNW controller 3 is capable of generating a transmission end OSNR yield strength curve in accordance with the successively acquired values of the reception BER and the reception OSNR. - The following is an explanation of a method for determining the
reception end node 2 of theNW controller 3 according to the first embodiment described above. Suppose that thereception end node 2 is areception end node 2 receiving a wavelength signal when a wavelength signal of the increased channel is increased. TheNW controller 3 includes apath storage unit 36 storing path information for each channel therein.FIG. 29 is an explanatory drawing illustrating an example of thepath storage unit 36. Thepath storage unit 36 illustrated inFIG. 29 manages ach number 36A, atransmission end node 36B, areception end node 36C, and arelay node 36D in association with each other. Thech number 36A is a number to identify a channel of a wavelength signal. Thetransmission end node 36B is a transmission end node transmitting a wavelength signal of the channel. Thereception end node 36C is a reception end node receiving a wavelength signal of the channel. Therelay node 36D is a node relaying a wavelength signal of the channel. - For example, when the
ch number 36A is "ch1", thetransmission end node 36B is "node # 7", thereception end node 36C is "node # 3", and therelay node 36D is "node # 2". When thech number 36A is "ch2", thetransmission end node 36B is "node # 6", thereception end node 36C is "node # 3", and therelay node 36D is "node # 1 andnode # 2". When thech number 36A of the increased channel is "chx", thetransmission end node 36B is "node # 1", thereception end node 36C is "node # 3", and therelay node 36D is "node # 2". -
FIG. 30 is an explanatory drawing illustrating an example of a method for determining a reception end node. When a channel with thech number 36A being "chx" is increased, theNW controller 3 refers to thepath storage unit 36, and acquires the reception BERmea of the reception end node, by designating each of the channels ch1 and ch2 passing through the reception node "node # 3" corresponding to the increased channel "chx" as the reception end node. - The constituent elements of the illustrated components are not necessarily configured physically as illustrated. Specifically, specific forms of distribution and integration of the components are not limited to the illustrated ones, but all or part of them may be configured to be functionally or physically distributed or integrated in any unit, according to various loads and use conditions.
- In addition, all or any part of the various types of processing functions performed in the devices may be executed on a central processing unit (CPU) (or a microcomputer such as a micro processing unit (MPU) and a micro controller unit (MCU)). In addition, all or any part of the various types of processing functions may be executed on a program analyzed and executed by a CPU (or a microcomputer such as an MPU and an MCU), or hardware by a wired logic.
- An aspect of the embodiments enables calculation of a margin of the transmission quality with accuracy.
Claims (7)
- A network control apparatus (3) comprising:a first arithmetic unit (43) that calculates a first OSNR corresponding to an allowable limit BER from an OSNR-BER characteristic of a loopback transmission end in a node of a transmission end that transmits a wavelength signal;a second arithmetic unit (44) that acquires a reception BER of a reception end node receiving the wavelength signal, and calculates a second OSNR corresponding to the reception BER from the OSNR-BER characteristic of the transmission end;a third arithmetic unit (45) that calculates a first noise intensity corresponding to the allowable limit BER from the first OSNR;a fourth arithmetic unit (46) that calculates a second noise intensity corresponding to the reception BER from the second OSNR; anda calculator (47) that calculates a noise intensity margin, based on the first noise intensity and the second noise intensity.
- The network control apparatus according to claim 1, further comprising:a fifth arithmetic unit (48) that acquires a third OSNR of a reception side corresponding to the reception BER from the reception end node, and calculates a third noise intensity of the reception side from the third OSNR;a noise intensity calculator (50,51) that calculates a fourth noise intensity of the reception side corresponding to the allowable limit BER, based on the third noise intensity, the second noise intensity, and the first noise intensity;a sixth arithmetic unit (49) that calculates a fourth OSNR of the reception side corresponding to the allowable limit BER from the fourth noise intensity; anda margin calculator (52) that calculates an OSNR margin, based on the third OSNR and the fourth OSNR.
- The network control apparatus according to claim 2, wherein the noise intensity calculator includes:a first calculator (50) that calculates a nonlinear noise intensity, based on the third noise intensity and the second noise intensity; anda second calculator (51) that calculates the fourth noise intensity of the reception side corresponding to the allowable limit BER, based on the first noise intensity and the nonlinear noise intensity.
- The network control apparatus according to claim 2 or 3, further comprising:a correction table (61) that stores therein a correction value associated with an idler frequency band amount of the wavelength signal before change and an idler frequency band amount of the wavelength signal after change; anda controller (24) that acquires the correction value corresponding to the idler frequency band amount before change and the idler frequency band amount after change, and corrects the OSNR margin based on the acquired correction value.
- The network control apparatus according to claim 2 or 3, further comprising:a correction table (62) that stores therein a correction value associated with an input power amount of the wavelength signal before change and an input power amount of the wavelength signal after change; anda controller (24) that acquires the correction value corresponding to the input power amount before change and the input power amount after change, and corrects the OSNR margin based on the acquired correction value.
- The network control apparatus according to any one of claims 1 to 5, wherein the first arithmetic unit (43) acquires the OSNR-BER characteristic of the transmission end corresponding to values of OSNR and BER successively measured in loopback communication of the wavelength signal between a transmitter (14) and a receiver (13) in the node of the transmission end, from the node of the transmission end.
- A transmission quality margin calculation method comprising:calculating, by a processor of a network control apparatus, a first OSNR corresponding to an allowable limit BER from an OSNR-BER characteristic of a loopback transmission end in a node of a transmission end that transmits a wavelength signal;acquiring, by the processor, a reception BER of a reception end node receiving the wavelength signal, and calculating, by the processor, a second OSNR corresponding to the reception BER from the OSNR-BER characteristic of the transmission end;calculating, by the processor, a first noise intensity corresponding to the allowable limit BER from the first OSNR;calculating, by the processor, a second noise intensity corresponding to the reception BER from the second OSNR; andcalculating, by the processor, a noise intensity margin, based on the first noise intensity and the second noise intensity.
Applications Claiming Priority (1)
| Application Number | Priority Date | Filing Date | Title |
|---|---|---|---|
| JP2016083995A JP6638535B2 (en) | 2016-04-19 | 2016-04-19 | Network control device and transmission quality margin calculation method |
Publications (1)
| Publication Number | Publication Date |
|---|---|
| EP3236597A1 true EP3236597A1 (en) | 2017-10-25 |
Family
ID=58489483
Family Applications (1)
| Application Number | Title | Priority Date | Filing Date |
|---|---|---|---|
| EP17163027.0A Withdrawn EP3236597A1 (en) | 2016-04-19 | 2017-03-27 | Network control apparatus and transmission quality margin calculation method |
Country Status (3)
| Country | Link |
|---|---|
| US (1) | US10177843B2 (en) |
| EP (1) | EP3236597A1 (en) |
| JP (1) | JP6638535B2 (en) |
Cited By (1)
| Publication number | Priority date | Publication date | Assignee | Title |
|---|---|---|---|---|
| CN111010234A (en) * | 2019-12-23 | 2020-04-14 | 烽火通信科技股份有限公司 | Relay node selection method and system |
Families Citing this family (3)
| Publication number | Priority date | Publication date | Assignee | Title |
|---|---|---|---|---|
| US10587339B1 (en) * | 2018-11-27 | 2020-03-10 | Ciena Corporation | Systems and methods for achieving best effort home route capacity on protection paths during optical restoration |
| EP3758258B1 (en) * | 2019-06-27 | 2023-04-12 | Viavi Solutions Inc. | Measuring linear and non-linear transmission perturbations in optical transmission systems |
| CN111049579B (en) | 2019-12-13 | 2021-05-04 | 苏州大学 | Protection method and system for preventing transmission quality prediction failure based on artificial intelligence |
Citations (3)
| Publication number | Priority date | Publication date | Assignee | Title |
|---|---|---|---|---|
| EP1011221A2 (en) * | 1998-12-18 | 2000-06-21 | Fujitsu Limited | An apparatus and method for making transmission characteristics uniform in a wavelength division multiplexing optical communications system |
| JP2015050600A (en) | 2013-08-30 | 2015-03-16 | 日本電信電話株式会社 | Penalty calculation method, penalty calculator, and digital coherent optical transmission system |
| WO2015132776A1 (en) * | 2014-03-03 | 2015-09-11 | Eci Telecom Ltd. | Osnr margin monitoring for optical coherent signals |
Family Cites Families (2)
| Publication number | Priority date | Publication date | Assignee | Title |
|---|---|---|---|---|
| EP2706708B1 (en) * | 2011-05-24 | 2015-09-16 | Huawei Technologies Co., Ltd. | Method and apparatus for path selection |
| RU2696560C2 (en) * | 2015-03-09 | 2019-08-05 | ИСиАй ТЕЛЕКОМ ЛТД. | Method of controlling operation of channels and optical communication system |
-
2016
- 2016-04-19 JP JP2016083995A patent/JP6638535B2/en active Active
-
2017
- 2017-03-27 US US15/470,409 patent/US10177843B2/en active Active
- 2017-03-27 EP EP17163027.0A patent/EP3236597A1/en not_active Withdrawn
Patent Citations (3)
| Publication number | Priority date | Publication date | Assignee | Title |
|---|---|---|---|---|
| EP1011221A2 (en) * | 1998-12-18 | 2000-06-21 | Fujitsu Limited | An apparatus and method for making transmission characteristics uniform in a wavelength division multiplexing optical communications system |
| JP2015050600A (en) | 2013-08-30 | 2015-03-16 | 日本電信電話株式会社 | Penalty calculation method, penalty calculator, and digital coherent optical transmission system |
| WO2015132776A1 (en) * | 2014-03-03 | 2015-09-11 | Eci Telecom Ltd. | Osnr margin monitoring for optical coherent signals |
Non-Patent Citations (1)
| Title |
|---|
| STARK ANDREW J ET AL: "System Performance Prediction With the Gaussian Noise Model in 100G PDM-QPSK Coherent Optical Networks", JOURNAL OF LIGHTWAVE TECHNOLOGY, IEEE SERVICE CENTER, NEW YORK, NY, US, vol. 31, no. 21, 1 November 2013 (2013-11-01), pages 3352 - 3360, XP011528717, ISSN: 0733-8724, [retrieved on 20131003], DOI: 10.1109/JLT.2013.2281358 * |
Cited By (1)
| Publication number | Priority date | Publication date | Assignee | Title |
|---|---|---|---|---|
| CN111010234A (en) * | 2019-12-23 | 2020-04-14 | 烽火通信科技股份有限公司 | Relay node selection method and system |
Also Published As
| Publication number | Publication date |
|---|---|
| US20170302372A1 (en) | 2017-10-19 |
| JP6638535B2 (en) | 2020-01-29 |
| US10177843B2 (en) | 2019-01-08 |
| JP2017195479A (en) | 2017-10-26 |
Similar Documents
| Publication | Publication Date | Title |
|---|---|---|
| US10256903B2 (en) | Network controller and signal quality estimating method | |
| EP3236597A1 (en) | Network control apparatus and transmission quality margin calculation method | |
| US8655170B2 (en) | OSNR monitor device and OSNR measurement device | |
| US10735091B2 (en) | Optical transmission system, control apparatus of wavelength selective switch, and insertion loss correction method | |
| US6040933A (en) | Method and apparatus for channel equalization in wavelength division multiplexed systems | |
| US10003429B2 (en) | Optical transmission device that transmits wavelength division multiplexed optical signal and optical transmission system | |
| US8620160B2 (en) | Optical transmission apparatus | |
| JP5564692B2 (en) | Optical transmission system and optical node | |
| US7912370B2 (en) | Optical power measurement apparatus and optical power measurement method | |
| US10608775B2 (en) | Optical transmission apparatus, optical transmission method, and optical transmission system | |
| US20100129081A1 (en) | Distributed raman amplifier and optical communication system | |
| US8055129B2 (en) | Alien wavelength channel balancing and line amplifier optimization | |
| US9037002B2 (en) | Pre-emphasis control method and optical transmission system | |
| US10171163B2 (en) | Signal quality measurement device and signal quality measurement method | |
| US9638574B2 (en) | Measurement apparatus and method of measuring signal light quality | |
| US20100220998A1 (en) | Network management system, repeater, and repeating method | |
| US7123834B2 (en) | Transmission system and method for equalization of channels in the system | |
| US7075710B2 (en) | Raman amplification method, Raman amplification pumping unit, and WDM optical communication system | |
| JP2018133720A (en) | Optical transmission device and wavelength deviation detection method | |
| US11870553B2 (en) | Fiber-optic communication apparatus, fiber-optic communication system, and optical power control method | |
| US20160226580A1 (en) | Optical signal quality monitoring apparatus, optical signal quality monitoring method and optical repeater | |
| US8831430B2 (en) | Optical signal correction apparatus and optical signal correction method | |
| EP2983311A1 (en) | Optical transmission apparatus, optical trasmission system, and control method of optical transmission system | |
| EP3754868A1 (en) | All-optical intra-channel multi-wavelength linear-to-nonlinear power ratio monitor | |
| EP2945305B1 (en) | Monitoring of optical performance in an optical data transmission network |
Legal Events
| Date | Code | Title | Description |
|---|---|---|---|
| PUAI | Public reference made under article 153(3) epc to a published international application that has entered the european phase |
Free format text: ORIGINAL CODE: 0009012 |
|
| AK | Designated contracting states |
Kind code of ref document: A1 Designated state(s): AL AT BE BG CH CY CZ DE DK EE ES FI FR GB GR HR HU IE IS IT LI LT LU LV MC MK MT NL NO PL PT RO RS SE SI SK SM TR |
|
| AX | Request for extension of the european patent |
Extension state: BA ME |
|
| STAA | Information on the status of an ep patent application or granted ep patent |
Free format text: STATUS: THE APPLICATION IS DEEMED TO BE WITHDRAWN |
|
| 18D | Application deemed to be withdrawn |
Effective date: 20180426 |