EP3234197B2 - Fine mapping and validation of qtl underlying fiber content and seed coat color traits and identification of snp markers for marker assisted selection of these traits derived from yellow seed coat (ysc) canola line yn01-429 and its lineage - Google Patents
Fine mapping and validation of qtl underlying fiber content and seed coat color traits and identification of snp markers for marker assisted selection of these traits derived from yellow seed coat (ysc) canola line yn01-429 and its lineage Download PDFInfo
- Publication number
- EP3234197B2 EP3234197B2 EP15871207.5A EP15871207A EP3234197B2 EP 3234197 B2 EP3234197 B2 EP 3234197B2 EP 15871207 A EP15871207 A EP 15871207A EP 3234197 B2 EP3234197 B2 EP 3234197B2
- Authority
- EP
- European Patent Office
- Prior art keywords
- seq
- snp
- brassica napus
- dna
- seed coat
- Prior art date
- Legal status (The legal status is an assumption and is not a legal conclusion. Google has not performed a legal analysis and makes no representation as to the accuracy of the status listed.)
- Active
Links
- 239000000835 fiber Substances 0.000 title claims description 94
- 239000003550 marker Substances 0.000 title claims description 23
- 240000000385 Brassica napus var. napus Species 0.000 title description 59
- 235000004977 Brassica sinapistrum Nutrition 0.000 title description 52
- 235000014698 Brassica juncea var multisecta Nutrition 0.000 title description 50
- 235000006008 Brassica napus var napus Nutrition 0.000 title description 50
- 235000006618 Brassica rapa subsp oleifera Nutrition 0.000 title description 50
- 238000013507 mapping Methods 0.000 title description 23
- 241000231392 Gymnosiphon Species 0.000 title description 7
- 238000010200 validation analysis Methods 0.000 title description 6
- 240000002791 Brassica napus Species 0.000 claims description 130
- 235000011293 Brassica napus Nutrition 0.000 claims description 116
- 241000196324 Embryophyta Species 0.000 claims description 23
- 238000000034 method Methods 0.000 claims description 17
- 108700028369 Alleles Proteins 0.000 claims description 13
- OBMBUODDCOAJQP-UHFFFAOYSA-N 2-chloro-4-phenylquinoline Chemical compound C=12C=CC=CC2=NC(Cl)=CC=1C1=CC=CC=C1 OBMBUODDCOAJQP-UHFFFAOYSA-N 0.000 claims description 9
- 150000007523 nucleic acids Chemical class 0.000 claims description 7
- 102000039446 nucleic acids Human genes 0.000 claims description 6
- 108020004707 nucleic acids Proteins 0.000 claims description 6
- 102000054766 genetic haplotypes Human genes 0.000 claims description 2
- 235000012054 meals Nutrition 0.000 description 18
- 108090000623 proteins and genes Proteins 0.000 description 16
- 239000003921 oil Substances 0.000 description 14
- 235000019198 oils Nutrition 0.000 description 14
- 235000016709 nutrition Nutrition 0.000 description 12
- 230000002068 genetic effect Effects 0.000 description 11
- 230000001488 breeding effect Effects 0.000 description 10
- 238000004497 NIR spectroscopy Methods 0.000 description 9
- 238000009395 breeding Methods 0.000 description 8
- 238000012217 deletion Methods 0.000 description 8
- 230000037430 deletion Effects 0.000 description 8
- 238000009826 distribution Methods 0.000 description 8
- 238000003780 insertion Methods 0.000 description 8
- 230000037431 insertion Effects 0.000 description 8
- 241001465754 Metazoa Species 0.000 description 7
- 235000018102 proteins Nutrition 0.000 description 7
- 102000004169 proteins and genes Human genes 0.000 description 7
- 230000000996 additive effect Effects 0.000 description 6
- 238000004458 analytical method Methods 0.000 description 6
- 239000003795 chemical substances by application Substances 0.000 description 6
- 238000011160 research Methods 0.000 description 6
- 239000000463 material Substances 0.000 description 5
- 235000014113 dietary fatty acids Nutrition 0.000 description 4
- 229930195729 fatty acid Natural products 0.000 description 4
- 239000000194 fatty acid Substances 0.000 description 4
- 150000004665 fatty acids Chemical class 0.000 description 4
- 125000004383 glucosinolate group Chemical group 0.000 description 4
- 239000002773 nucleotide Substances 0.000 description 4
- HUJXHFRXWWGYQH-UHFFFAOYSA-O sinapine Chemical compound COC1=CC(\C=C\C(=O)OCC[N+](C)(C)C)=CC(OC)=C1O HUJXHFRXWWGYQH-UHFFFAOYSA-O 0.000 description 4
- 244000068687 Amelanchier alnifolia Species 0.000 description 3
- 235000009027 Amelanchier alnifolia Nutrition 0.000 description 3
- 240000008100 Brassica rapa Species 0.000 description 3
- 238000005481 NMR spectroscopy Methods 0.000 description 3
- 235000019764 Soybean Meal Nutrition 0.000 description 3
- 230000000433 anti-nutritional effect Effects 0.000 description 3
- 239000000828 canola oil Substances 0.000 description 3
- 235000019519 canola oil Nutrition 0.000 description 3
- 238000010276 construction Methods 0.000 description 3
- 230000000694 effects Effects 0.000 description 3
- 235000019387 fatty acid methyl ester Nutrition 0.000 description 3
- 238000004519 manufacturing process Methods 0.000 description 3
- 238000005259 measurement Methods 0.000 description 3
- 239000000203 mixture Substances 0.000 description 3
- VLKZOEOYAKHREP-UHFFFAOYSA-N n-Hexane Chemical compound CCCCCC VLKZOEOYAKHREP-UHFFFAOYSA-N 0.000 description 3
- 125000003729 nucleotide group Chemical group 0.000 description 3
- 239000004455 soybean meal Substances 0.000 description 3
- 229920001864 tannin Polymers 0.000 description 3
- 239000001648 tannin Substances 0.000 description 3
- 235000018553 tannin Nutrition 0.000 description 3
- 244000178993 Brassica juncea Species 0.000 description 2
- DPUOLQHDNGRHBS-UHFFFAOYSA-N Brassidinsaeure Natural products CCCCCCCCC=CCCCCCCCCCCCC(O)=O DPUOLQHDNGRHBS-UHFFFAOYSA-N 0.000 description 2
- 235000019750 Crude protein Nutrition 0.000 description 2
- URXZXNYJPAJJOQ-UHFFFAOYSA-N Erucic acid Natural products CCCCCCC=CCCCCCCCCCCCC(O)=O URXZXNYJPAJJOQ-UHFFFAOYSA-N 0.000 description 2
- 241000287828 Gallus gallus Species 0.000 description 2
- IMQLKJBTEOYOSI-GPIVLXJGSA-N Inositol-hexakisphosphate Chemical compound OP(O)(=O)O[C@H]1[C@H](OP(O)(O)=O)[C@@H](OP(O)(O)=O)[C@H](OP(O)(O)=O)[C@H](OP(O)(O)=O)[C@@H]1OP(O)(O)=O IMQLKJBTEOYOSI-GPIVLXJGSA-N 0.000 description 2
- IMQLKJBTEOYOSI-UHFFFAOYSA-N Phytic acid Natural products OP(O)(=O)OC1C(OP(O)(O)=O)C(OP(O)(O)=O)C(OP(O)(O)=O)C(OP(O)(O)=O)C1OP(O)(O)=O IMQLKJBTEOYOSI-UHFFFAOYSA-N 0.000 description 2
- 241000656145 Thyrsites atun Species 0.000 description 2
- 239000000654 additive Substances 0.000 description 2
- 230000009418 agronomic effect Effects 0.000 description 2
- 150000001413 amino acids Chemical class 0.000 description 2
- 210000002421 cell wall Anatomy 0.000 description 2
- 238000006243 chemical reaction Methods 0.000 description 2
- 239000002131 composite material Substances 0.000 description 2
- 230000003247 decreasing effect Effects 0.000 description 2
- 235000005911 diet Nutrition 0.000 description 2
- 235000019621 digestibility Nutrition 0.000 description 2
- DPUOLQHDNGRHBS-KTKRTIGZSA-N erucic acid Chemical compound CCCCCCCC\C=C/CCCCCCCCCCCC(O)=O DPUOLQHDNGRHBS-KTKRTIGZSA-N 0.000 description 2
- 238000000605 extraction Methods 0.000 description 2
- 230000007614 genetic variation Effects 0.000 description 2
- 229920005610 lignin Polymers 0.000 description 2
- 235000015097 nutrients Nutrition 0.000 description 2
- 230000000050 nutritive effect Effects 0.000 description 2
- 229940068041 phytic acid Drugs 0.000 description 2
- 235000002949 phytic acid Nutrition 0.000 description 2
- 239000000467 phytic acid Substances 0.000 description 2
- 238000007430 reference method Methods 0.000 description 2
- 210000001519 tissue Anatomy 0.000 description 2
- TWQHGBJNKVFWIU-UHFFFAOYSA-N 8-[4-(4-quinolin-2-ylpiperazin-1-yl)butyl]-8-azaspiro[4.5]decane-7,9-dione Chemical compound C1C(=O)N(CCCCN2CCN(CC2)C=2N=C3C=CC=CC3=CC=2)C(=O)CC21CCCC2 TWQHGBJNKVFWIU-UHFFFAOYSA-N 0.000 description 1
- 208000016444 Benign adult familial myoclonic epilepsy Diseases 0.000 description 1
- 235000011331 Brassica Nutrition 0.000 description 1
- 241000219198 Brassica Species 0.000 description 1
- 240000007124 Brassica oleracea Species 0.000 description 1
- 238000007400 DNA extraction Methods 0.000 description 1
- 244000068988 Glycine max Species 0.000 description 1
- 235000010469 Glycine max Nutrition 0.000 description 1
- 239000004165 Methyl ester of fatty acids Substances 0.000 description 1
- 101000963957 Naja atra Probable weak neurotoxin NNAM2 Proteins 0.000 description 1
- ZYFVNVRFVHJEIU-UHFFFAOYSA-N PicoGreen Chemical compound CN(C)CCCN(CCCN(C)C)C1=CC(=CC2=[N+](C3=CC=CC=C3S2)C)C2=CC=CC=C2N1C1=CC=CC=C1 ZYFVNVRFVHJEIU-UHFFFAOYSA-N 0.000 description 1
- 108700005079 Recessive Genes Proteins 0.000 description 1
- 102000052708 Recessive Genes Human genes 0.000 description 1
- 241000282849 Ruminantia Species 0.000 description 1
- 238000000944 Soxhlet extraction Methods 0.000 description 1
- 230000003466 anti-cipated effect Effects 0.000 description 1
- 238000003556 assay Methods 0.000 description 1
- 239000003225 biodiesel Substances 0.000 description 1
- 235000014633 carbohydrates Nutrition 0.000 description 1
- 150000001720 carbohydrates Chemical class 0.000 description 1
- 210000004027 cell Anatomy 0.000 description 1
- 238000012832 cell culture technique Methods 0.000 description 1
- 210000000349 chromosome Anatomy 0.000 description 1
- 230000002860 competitive effect Effects 0.000 description 1
- 230000002596 correlated effect Effects 0.000 description 1
- 230000000875 corresponding effect Effects 0.000 description 1
- 230000037213 diet Effects 0.000 description 1
- 230000000378 dietary effect Effects 0.000 description 1
- 235000013399 edible fruits Nutrition 0.000 description 1
- 238000005516 engineering process Methods 0.000 description 1
- 230000007613 environmental effect Effects 0.000 description 1
- 238000002474 experimental method Methods 0.000 description 1
- 208000016427 familial adult myoclonic epilepsy Diseases 0.000 description 1
- ZGNITFSDLCMLGI-UHFFFAOYSA-N flubendiamide Chemical compound CC1=CC(C(F)(C(F)(F)F)C(F)(F)F)=CC=C1NC(=O)C1=CC=CC(I)=C1C(=O)NC(C)(C)CS(C)(=O)=O ZGNITFSDLCMLGI-UHFFFAOYSA-N 0.000 description 1
- 238000004817 gas chromatography Methods 0.000 description 1
- 238000003205 genotyping method Methods 0.000 description 1
- 244000144972 livestock Species 0.000 description 1
- 230000008774 maternal effect Effects 0.000 description 1
- 235000021315 omega 9 monounsaturated fatty acids Nutrition 0.000 description 1
- 239000000049 pigment Substances 0.000 description 1
- 238000004161 plant tissue culture Methods 0.000 description 1
- 230000000644 propagated effect Effects 0.000 description 1
- 235000004252 protein component Nutrition 0.000 description 1
- 238000011002 quantification Methods 0.000 description 1
- 238000012216 screening Methods 0.000 description 1
- 230000010153 self-pollination Effects 0.000 description 1
- 241000894007 species Species 0.000 description 1
- 238000012090 tissue culture technique Methods 0.000 description 1
- 235000013311 vegetables Nutrition 0.000 description 1
- 238000007704 wet chemistry method Methods 0.000 description 1
Images


Classifications
-
- C—CHEMISTRY; METALLURGY
- C12—BIOCHEMISTRY; BEER; SPIRITS; WINE; VINEGAR; MICROBIOLOGY; ENZYMOLOGY; MUTATION OR GENETIC ENGINEERING
- C12Q—MEASURING OR TESTING PROCESSES INVOLVING ENZYMES, NUCLEIC ACIDS OR MICROORGANISMS; COMPOSITIONS OR TEST PAPERS THEREFOR; PROCESSES OF PREPARING SUCH COMPOSITIONS; CONDITION-RESPONSIVE CONTROL IN MICROBIOLOGICAL OR ENZYMOLOGICAL PROCESSES
- C12Q1/00—Measuring or testing processes involving enzymes, nucleic acids or microorganisms; Compositions therefor; Processes of preparing such compositions
- C12Q1/68—Measuring or testing processes involving enzymes, nucleic acids or microorganisms; Compositions therefor; Processes of preparing such compositions involving nucleic acids
- C12Q1/6876—Nucleic acid products used in the analysis of nucleic acids, e.g. primers or probes
- C12Q1/6888—Nucleic acid products used in the analysis of nucleic acids, e.g. primers or probes for detection or identification of organisms
- C12Q1/6895—Nucleic acid products used in the analysis of nucleic acids, e.g. primers or probes for detection or identification of organisms for plants, fungi or algae
-
- A—HUMAN NECESSITIES
- A01—AGRICULTURE; FORESTRY; ANIMAL HUSBANDRY; HUNTING; TRAPPING; FISHING
- A01H—NEW PLANTS OR NON-TRANSGENIC PROCESSES FOR OBTAINING THEM; PLANT REPRODUCTION BY TISSUE CULTURE TECHNIQUES
- A01H1/00—Processes for modifying genotypes ; Plants characterised by associated natural traits
- A01H1/04—Processes of selection involving genotypic or phenotypic markers; Methods of using phenotypic markers for selection
- A01H1/045—Processes of selection involving genotypic or phenotypic markers; Methods of using phenotypic markers for selection using molecular markers
-
- A—HUMAN NECESSITIES
- A01—AGRICULTURE; FORESTRY; ANIMAL HUSBANDRY; HUNTING; TRAPPING; FISHING
- A01H—NEW PLANTS OR NON-TRANSGENIC PROCESSES FOR OBTAINING THEM; PLANT REPRODUCTION BY TISSUE CULTURE TECHNIQUES
- A01H5/00—Angiosperms, i.e. flowering plants, characterised by their plant parts; Angiosperms characterised otherwise than by their botanic taxonomy
- A01H5/10—Seeds
-
- A—HUMAN NECESSITIES
- A01—AGRICULTURE; FORESTRY; ANIMAL HUSBANDRY; HUNTING; TRAPPING; FISHING
- A01H—NEW PLANTS OR NON-TRANSGENIC PROCESSES FOR OBTAINING THEM; PLANT REPRODUCTION BY TISSUE CULTURE TECHNIQUES
- A01H6/00—Angiosperms, i.e. flowering plants, characterised by their botanic taxonomy
- A01H6/20—Brassicaceae, e.g. canola, broccoli or rucola
- A01H6/202—Brassica napus [canola]
-
- A—HUMAN NECESSITIES
- A23—FOODS OR FOODSTUFFS; TREATMENT THEREOF, NOT COVERED BY OTHER CLASSES
- A23L—FOODS, FOODSTUFFS, OR NON-ALCOHOLIC BEVERAGES, NOT COVERED BY SUBCLASSES A21D OR A23B-A23J; THEIR PREPARATION OR TREATMENT, e.g. COOKING, MODIFICATION OF NUTRITIVE QUALITIES, PHYSICAL TREATMENT; PRESERVATION OF FOODS OR FOODSTUFFS, IN GENERAL
- A23L19/00—Products from fruits or vegetables; Preparation or treatment thereof
-
- C—CHEMISTRY; METALLURGY
- C12—BIOCHEMISTRY; BEER; SPIRITS; WINE; VINEGAR; MICROBIOLOGY; ENZYMOLOGY; MUTATION OR GENETIC ENGINEERING
- C12Q—MEASURING OR TESTING PROCESSES INVOLVING ENZYMES, NUCLEIC ACIDS OR MICROORGANISMS; COMPOSITIONS OR TEST PAPERS THEREFOR; PROCESSES OF PREPARING SUCH COMPOSITIONS; CONDITION-RESPONSIVE CONTROL IN MICROBIOLOGICAL OR ENZYMOLOGICAL PROCESSES
- C12Q2600/00—Oligonucleotides characterized by their use
- C12Q2600/13—Plant traits
-
- C—CHEMISTRY; METALLURGY
- C12—BIOCHEMISTRY; BEER; SPIRITS; WINE; VINEGAR; MICROBIOLOGY; ENZYMOLOGY; MUTATION OR GENETIC ENGINEERING
- C12Q—MEASURING OR TESTING PROCESSES INVOLVING ENZYMES, NUCLEIC ACIDS OR MICROORGANISMS; COMPOSITIONS OR TEST PAPERS THEREFOR; PROCESSES OF PREPARING SUCH COMPOSITIONS; CONDITION-RESPONSIVE CONTROL IN MICROBIOLOGICAL OR ENZYMOLOGICAL PROCESSES
- C12Q2600/00—Oligonucleotides characterized by their use
- C12Q2600/158—Expression markers
Definitions
- the disclosure relates to fine mapping of quantitative trait loci (QTLs) associated with low fiber content and YSC traits and identification of SNP markers for marker assisted selection of these traits in Brassica napus.
- QTLs quantitative trait loci
- Canola meal the fraction of the seed remaining after crushing and oil extraction, is approximately 55% of the volume of canola seed.
- Canola meal consists of several components including protein, fiber, residual oil, carbohydrates, and anti-nutritional factors.
- Canola meal contains approximately 75% of the protein of 48% protein soybean meal, 80% of the energy value, and 300% of the crude fiber, as well as higher levels of anti-nutritional factors such as glucosinolates, tannins, phytic acid, sinapine and erucic acid, and is sold as livestock feed at 60%-70% of the price of soybean meal.
- anti-nutritional factors such as glucosinolates, tannins, phytic acid, sinapine and erucic acid
- livestock feed at 60%-70% of the price of soybean meal.
- YSC yellow seed coat
- BSC black seed coat
- napus line such as higher protein, lower fiber, increased amino acid digestibility and metabolizable energy content, and improved nutrient and energy utilization based on feed to gain ratio in broiler chickens and monogastric animal species (Hickling, 2009; Slominski et al., 2010).
- the invention is defined by the appended claims.
- Disclosed herein is a method for identifying quantitative trait locus associated with desirable nutritional traits in canola.
- the method includes analyzing a population of canola plants or germplasm for desirable nutritional traits.
- the genotype of the canola plants or germplasm is determined using at least one marker selected from the group consisting of SEQ ID NO:1 through SEQ ID NO:111.
- the canola plants or germplasm are mapped for the presence of a quantitative trait locus (QTL) associated with the markers.
- QTL quantitative trait locus
- Another embodiment relates to an isolated and/or recombinant nucleic acid having a sequence associated with a QTL.
- the QTL is associated with a desirable nutritional trait in a canola plant or germplasm.
- the QTL is further associated with at least one marker selected from the group consisting of SEQ ID NO:1 through SEQ ID NO:111.
- Yet another embodiment relates to a method for selecting a canola plant or germplasm that comprises desirable nutritional traits.
- the method includes detecting in the canola plant or germplasm at least one marker linked with a QTL that is selected from the group consisting of SEQ ID NO:1 through SEQ ID NO:111, wherein the QTL is associated with a desirable nutritional trait in the canola plant or germplasm.
- a canola plant or germplasm is then selected based on the presence of the marker.
- SNP markers and high-density genetic maps for fine mapping and validation of quantitative trait loci (QTL) underlying fiber content and seed coat color traits.
- SNP markers tightly linked to fiber content and seed coat color traits may be used for marker-assisted selection (MAS) of desirable nutritional traits in yellow-seeded canola (YSC) lines.
- YSC line may be AAFC YSC line YN01-429 and its lineage.
- a major QTL which explains 59.2% to 74.7% of the variance of fiber content and seed coat color traits, is described on N09 in two DH populations
- a minor QTL which explains 1.4% to 7.2% of the variance of fiber content and seed coat color traits, is described on N11 in two DH populations.
- YSC lines (YN86-37, YN90-1016, YN97-262 and YN01-429) of low hull proportion with a thinner seed coat, low fiber and high oil as compared to black seed coat (BSC) canola (Rakow et al., 2011) also have been developed. Feeding studies comparing yellow-seeded canola meal from AAFC line YN01-429 to B. juncea, B. rapa, and brown-seeded B. napus have demonstrated the advantages of the YSC B.
- napus line including higher protein, lower fiber, increased amino acid digestibility and metabolizable energy content, and improved nutrient and energy utilization based on feed to gain ratio in broiler chickens and monogastric animal species (Hickling, 2009; Slominski et al., 2010).
- the disclosure describes a method for identifying and mapping quantitative trait loci (QTL) associated with low fiber content and yellow seed coat (YSC) traits in Brassica napus using single-nucleotide polymorphism (SNP) markers.
- QTL quantitative trait loci
- YSC yellow seed coat
- SNP single-nucleotide polymorphism
- the QTLs are defined in YSC line YN01-429.
- the markers may be used for marker-assisted selection of low fiber content and YSC traits derived from YSC line YN01-429 and its lineage
- the 183 DH lines of the YSC population were developed from a cross between AAFC yellow seeded/low fiber line YN01-429 and DAS Nexera black seeded/high fiber variety Nex828, and grown along with the two parents in paired row plots at the AAFC Saskatoon research farm and the DAS Rosthern research farm in Canada in 2007 for phenotyping. Seed samples from two locations were analyzed by AAFC using near-infrared spectroscopy (NIR) ADF (named ADF_A in Figures 3 and 4 ) and using Hunter lab for seed coat color White Index (named WI_A in Figures 3 and 4 ) measurement in 2007.
- NIR near-infrared spectroscopy
- the population was also analyzed by DAS Analytical Technologies Group in Indianapolis for ADF (named ADF_A in Figures 3 and 4 ) using the AOAC reference method (AOAC Official Method 973.18) and by DAS Bioprocess Group in Indianapolis for seed coat color White Index (named WI_D in Figures 3 and 4 ) and Hunter Lab Lightness Index (named L in Figures 3 and 4 ) measurement in 2011.
- the 400 DH lines of the YDN population were developed from a cross between YN01-429 and DAS Nexera black seeded/high fiber variety DN051493.
- the YDN population was grown along with the two parents at Pike Lake and Cudworth, Canada in 2011 for phenotyping.
- ADF seed coat color White Index
- WI seed coat color White Index
- Hunter lab Lightness Index name L in the Figures 5 and 6 .
- a third DH population of 181 DH lines was added for consensus map construction in addition to YSC and YDN populations for QTL mapping of fiber content and seed coat color traits; TN population did not segregate for fiber content and seed coat color traits.
- the three DH populations were genotyped with 12,000 SNP markers and a consensus map was constructed with individual map of the YSC, YDN and TN populations.
- Composite Interval Mapping (CIM) was used for a whole genome QTL scan. After QTL mapping, the SNP markers within 0.0-5.0 cM of the QTL underlying fiber content and seed coat color traits were converted to KASPar assays for MAS of these traits derived from YN01-429 and its lineage.
- the YSC genetic map was constructed with 174 DH and 2,982 polymorphic SNP markers, a total length of 2,515.8 cM and an average length of 0.80 cM/marker.
- the YDN population was constructed with 397 DH lines and 2,972 SNP markers, a total length of 2,189 cM and an average length of 0.74 cM/marker.
- the TN genetic map was constructed with 181 DH lines and 2,716 polymorphic SNP markers, a total length of 1905.7 cM and an average length of 0.70 cM/marker.
- the disclosure describes a consensus map of 5,500 SNP markers with an average of 0.47 cM constructed with the YDN, YSC and TN populations ( Figure 7 ).
- YSC and YDN populations segregated for fiber content and seed coat color traits and were used for QTL mapping, which further confirmed that seed coat color traits and fiber content traits were highly correlated ( Figures 3-6 ).
- QTL mapping indicated that a major QTL was identified on linkage group (LG) N09 and a minor QTL was identified on LG N11 for all the seed coat color traits (WI and L) and ADF content in both populations ( Figures 4-6 ).
- seed coat color indexes (WI and L) were good indicators for the fiber content in canola seed if YSC line YN01-429 or its lineage is used as a low ADF content source in breeding programs..
- the disclosure describes a major QTL which explains 59.2-74.7% of the phenotypic variance of fiber content and seed coat color traits in two dihaploid (DH) plant populations.
- a minor QTL has been found to explain 1.4-7.2% of the phenotypic variance of these traits in two dihaploid plant populations.
- High correlation is disclosed between seed coat color traits (WI and L) and ADF content in both populations.
- a set of high throughput markers closely linked to fiber content and seed coat color traits from YSC line YN01-419.
- nucleic acid sequences linked to QTL's are associated with desirable nutritional traits.
- the sequence can be derived from yellow-seeded coat (YSC) line YN01-429 or its lineage.
- YSC yellow-seeded coat
- the SNP markers include those markers identified as DBSNP357222 through DBSNP2222111 in Figure 7 , which flanked by DSNP01120 and DSNP02172.
- the SNP markers include DBSNP357223, DBSNP357224, DBSNP357226, DBSNP357227, DBSNP357228, DBSNP357230, DBSNP357231, DBSNP357233, DBSNP357234, DBSNP357244, DBSNP357247, DBSNP357250, DBSNP357252, DBSNP357253, DBSNP357254, DBSNP357255, DBSNP357256, DBSNP357257, DBSNP357258, DBSNP357273, DBSNP357287, DBSNP357288, DBSNP357290, DBSNP357291, DBSNP357292, DBSNP357293, and DBSNP357294, as shown in Figure 7
- Certain embodiments related to a method for selecting canola plants or germplasm for a desirable nutritional trait associated with QTL's using marker-assisted selection may be used.
- Seed color measurement may be used to replace costly and time-consuming wet chemistry analysis of fiber content.
- SNP markers disclosed to be within 4.9 cM of the major fiber content and seed coat color QTL on N09 or the minor fiber content and seed coat color QTL on N11 can be used for MAS, and will greatly expedite the breeding of canola lines with low fiber content, one of the most important components of DAS Low Fiber product concept.
- Particular embodiments describe a method for using the identified QTL in marker-assisted selection (MAS) of the complex fiber content and seed coat color traits from the YSC line YN01-429 to facilitate breeding in Brassica and more efficient selection of desirable nutritional traits.
- MAS marker-assisted selection
- Particular embodiments are directed to marker-assisted selection of canola varieties to increase the nutritive value of canola meal, particularly for feed animals, including monogastric animals and ruminants.
- the method may be used to select canola seed or germplasm comprising, on average, at least about 44% crude protein, and not more than about 14% acid detergent fiber as determined by NIR on a dry mass basis.
- the canola seed or germplasm may further comprise, on average, at least about 49% crude protein content.
- the canola seed or germplasm may comprise on average, not more than about 12% acid detergent fiber content.
- the canola seed or germplasm selected by the disclosed method may further comprise the following traits: reduced glucosinolate content, low tannin content, and/or low residual cell wall content.
- Allotetraploid generally refers to a hybrid organism that has a chromosome set that is four times that of a haploid organism.
- Canola oil refers to oil extracted from commercial varieties of rapeseed. To produce canola oil, seed is typically graded and blended at grain elevators to produce an acceptably uniform product. The blended seed is then crushed, and the oil is typically extracted with hexane and subsequently refined. The resulting oil may then be sold for use. Oil content is typically measured as a percentage of the whole dried seed, and particular oil contents are characteristic of different varieties of canola. Oil content can be readily and routinely determined using various analytical techniques, for example and without limitation: NMR; NIR; and Soxhlet extraction.
- the percent composition of total fatty acids is typically determined by extracting a sample of oil from seed, producing methyl esters of fatty acids present in the oil sample, and analyzing the proportions of the various fatty acids in the sample using gas chromatography.
- the fatty acid composition may also be a distinguishing characteristic of particular varieties.
- Elite line means any line that has resulted from breeding and selection for superior agronomic performance.
- An elite plant is any plant from an elite line.
- Enhanced canola meal means canola meal, produced from canola seeds, which has decreased fiber content, and may have increased protein and true metabolizable energy content, as well as reduced anti-nutritional factors such as glucosinolates, tannins, phytic acid, sinapine and erucic acid. Meal with some or all of these characteristics could allow increasing inclusion rates in the diet of animal species especially in monogastric animals.
- Plant line refers to a group of plants that display little genetic variation (e.g., no genetic variation) between individuals for at least one trait. Inbred lines may be created by several generations of self-pollination and selection or, alternatively, by vegetative propagation from a single parent using tissue or cell culture techniques. As used herein, the terms “cultivar,” “variety,” and “type” are synonymous, and these terms refer to a line that is used for commercial production.
- Plant material refers to any processed or unprocessed material derived, in whole or in part, from a plant.
- a plant material may be a plant part, a seed, a fruit, a leaf, a root, a plant tissue, a plant tissue culture, a plant explant, or a plant cell.
- Quantitative trait may refer to a trait or phenotype that is expressed in varying degrees, along a generally continuous gradient and is frequently linked to two or more genes and is affected by environment.
- Quantitative trait locus refers to a segment or region of DNA containing or linked to a gene or genes underlying a quantitative trait.
- seed color In some embodiments, this disclosure refers to canola varieties (e.g., inbred canola lines and hybrids) characterized by seed color.
- Canola seed color rating or “seed color” is generally scored on a 1-5 scale, based on seeds obtained from healthy plants at or near complete seed maturity. "1” signifies a good yellow color. “2” signifies mainly yellow with some brown. “3” indicates a mixture of brown and yellow. "4" and “5" signify brown and black, respectively.
- Whiteness index (WI) scores also may be used to describe canola varieties. For example, yellow-seeded lines YN97-262 and 9592 have whiteness index scores of -34.6 and -33.2, respectively, and seed color scores of 1.
- Dark-seeded lines, Nex 715 and Nex 705, have whiteness index scores of -0.2 and -4.4, respectively, and seed color scores of 4.
- Dark-seeded lines 46A65 and Q2 have whiteness index scores of 0.3 and -3.9, respectively, and seed color scores of 5.
- Color of particular seeds may also be described in terms of a percentage, or other ratio, as compared to any of these lines.
- Stability refers to a given plant component that is maintained at substantially the same level through multiple generations. For example, a stable component may be maintained for at least three generations at substantially the same level. In this context, the term “substantially the same” may refer in some embodiments to a component maintained to within 25% between two different generations; within 20%; within 15%; within 10%; within 5%; within 3%; within 2%; and/or within 1%, as well as a component that is maintained perfectly between two different generations.
- a stable plant component may be, for example and without limitation, an oil component; a protein component; a fiber component; a pigment component; a glucosinolate component; and a lignin component.
- the stability of a component may be affected by one or more environment factors.
- the stability of an oil component may be affected by, for example and without limitation: temperature; location; stress; and the time of planting. Subsequent generations of a plant having a stable component under field conditions will be expected to produce the plant component in a similar manner, for example, as set forth above.
- Trait or phenotype The terms “trait” and “phenotype” are used interchangeably herein.
- the traits of particular interest are low fiber content and seed coat color.
- Some canola varieties exhibit a yellow seed coat, while further varieties exhibit a dark (e.g., black, dark, and mottled) seed coat.
- a “variety” or “cultivar” is a plant line that is used for commercial production which is distinct, stable and uniform in its characteristics when propagated.
- YSC yellow seed coat
- YDN two dihaploid populations
- YSC and YDN were developed from crosses between spring canola lines in 2007 and 2010, respectively.
- the 176 DH lines of YSC population were developed from a cross between the Agriculture and Agri-Food Canada (AAFC) yellow seeded, low fiber line YN01-429 and the DAS Nexera black seeded, high fiber variety Nex828.
- the 399 DH lines of the YDN population were developed from a cross between YN01-429 and DAS Nexera black seeded, high fiber variety DN051493.
- the DH population, TN was derived from a cross between the European winter cultivar Tapidor and the Chinese semi-winter cultivar Ningyou7. This population was a reference mapping population widely used for trait mapping and genomics studies by the international canola research community (Shi et al. 2009), and was not segregating for fiber content and seed coat color traits. It was used for consensus map construction along with the YSC and YDN populations to identify more Single Nucleotide Polymorphic (SNP) markers tightly linked to the fiber content and seed coat color traits.
- SNP Single Nucleotide Polymorphic
- Genomic DNA for the populations was extracted from 8 leaf punches per sample using the DAS Biocel extraction method (Bohl et al. 2009). DNA samples were quantified with Quant-iT TM PicoGreen ® Quantification Kit (Invitrogen, Carlsbad, CA) using the manufacturer's instructions or with the Nanodrop 8000 Spectrophotometer (Thermo Scientific, Waltham, MA) per manufacturer's instructions.
- the 176 DH lines from the YSC population were grown along with the two parents as checks in paired row plots at the AAFC Saskatoon research farm and the DAS Rosthern research farm at Canada in 2007 for phenotyping. Seed samples from all established plots were collected from both locations and analyzed by AAFC using Near Infrared Spectroscopy (NIR) for Acid Detergent Fiber (ADF) and seed coat color White Index (WI). The population was also analyzed for ADF using the AOAC reference method (AOAC Official Method 973.18) in 2007 and for seed coat color White Index and Hunter Lab Lightness Index (L) in 2011.
- NIR Near Infrared Spectroscopy
- ADF Acid Detergent Fiber
- WI seed coat color White Index
- the population was also analyzed for ADF using the AOAC reference method (AOAC Official Method 973.18) in 2007 and for seed coat color White Index and Hunter Lab Lightness Index (L) in 2011.
- the YDN population was grown along with the two parents as checks in paired row plots at Pike Lake and Cudworth, Canada in 2011 for phenotyping. Seed samples from 361 DH lines were analyzed for ADF using two NIR models and for seed coat color White Index and the HunterLab Lightness Index in 2011.
- the individual maps of the YSC, YDN and TN populations were constructed with MAPMAKER/EXP 3.0 (Lander et al. 1987; Lincoln et al. 1992) at LOD score 10.0 and Haldane's mapping function, and the consensus map was constructed with Phenomap Enterprise 3.0 (GeneFlow Inc., Centreville, VA).
- the YSC genetic map was constructed with 176 DH lines and 2,982 polymorphic SNP markers, and had a total length of 2,515.8 cM and an average length of 0.80 cM/marker.
- the YDN genetic map was constructed with 399 DH lines and 2,972 SNP markers, and had a total length of 2,189 cM and an average of 0.74 cM/marker.
- the TN genetic map was constructed with 181 DH lines and 2,716 polymorphic SNP markers, and had a total length of 1905.7 cM and an average of 0.70 cM/marker.
- a consensus map of 5,500 SNP markers was constructed with the YDN, YSC and TN populations.
- the Composite Interval Mapping (CIM), as implemented in QTL Cartographer V2.5 (Wang et al. 2011), was used for QTL mapping.
- Table 2 shows the details of the QTLs identified for seed coat color and fiber content. Results indicated that a major QTL was identified on linkage group (LG) N09 and a minor QTL was identified on N11 for the seed coat color traits, WI and L, and fiber content trait ADF, in both YSC and YDN populations.
- LG linkage group
- ADF fiber content trait
- the major QTL identified for ADF on N09 coincided with the major QTL for WI and L at LOD scores ranged from 136 to 143.
- the minor QTL identified for ADF on N11 coincided with the minor QTL for WI and L at LOD scores ranging from 7 to 26.
- Table 2 The phenotypic variance explained (R2) by significant QTL underlying ADF content and seed coat color traits (WI and L) in YSC and YDN populations with LOD scores ⁇ 3.
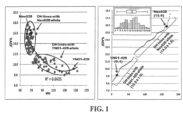
- the DH lines with YN01-429 alleles had an average of 10.0 ⁇ 1.0% of ADF and the DH lines with Nex828 alleles had an average of 14.0 ⁇ 1.6% of ADF in canola seeds ( Figure 1 ).
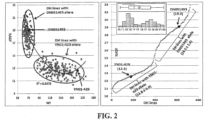
- the DH lines with YN01-429 alleles had an average of 12.8 ⁇ 0.9% of ADF and the DH lines with DN051493 alleles had an average of 18.5 ⁇ 1.4% of ADF in canola seeds ( Figure 2 ).
- FIG. 7 shows the map location of the major ADF and WI QTL, ADF_09 and WI_09, on the YDN population map of N09.
- the YDN population was later used for fine mapping and validation of the major QTL on N09.
- a new genetic map of N09 was constructed with 1387 SNPs. Flanking markers DBSNP01120 and DBSNP02172 defined a QTL interval of 4.9 cM, corresponding to 0.46 Mb on the B. napus reference genome, DH12075, which was sequenced at AAFC through an industry consortium.
- the major QTL has an R 2 of 75% on N09. Blind screenings of the markers within the QTL interval with multiple DAS proprietary DH populations from the breeding program confirmed that the concordance between marker-predicated phenotype and actual phenotype was ⁇ 98%.
- Figure 3 shows the genetic map of the ADF QTL interval along with the ADF_09 and WI_09 loci.
- SNP markers within the 4.9 cM QTL interval on N09, 111 SNP markers were identified, including the flanking markers DBSNP01120 and DBSNP02172. Table 3 lists the SNPs, their genetic positions in cM, the YN01-429 allele as well as the physical positions of the SNPs on the B. napus reference genome (DH12075). Table 3: SNP markers within the 4.9 cM QTL interval for ADF mapped on N09 with the YDN population.
- SNP_Name SEQ ID NO: Map Position (cM) SNP_Type SNP_Forward YN01429 genotype Physical Pos on Ref Genome (bp) DBSNP01120 1 117.4 SNP [T/G] GG N9:35982462..35983088 DBSNP357202 2 117.4 SNP [C/G] GG N9:35982582..35984072 DBSNP357203 3 117.4 SNP [T/G] TT N9:35982826..35984316 DBSNP222203 4 117.4 SNP [A/C] AC N9:35987647..35987947 DBSNP357208 5 117.4 SNP [T/G] GG N9:35994219..35995219 DBSNP357214 6 117.7 SNP [A/G] AA N9:36025967..36026963 DBSNP222206 7 117.7 SNP [A/G
- a sub-interval was defined in which the markers are most desired for marker assisted selection. Flanking markers DBSNP35722 and DBSNP222211 define a 0.5 cM sub-interval haplotype region unique to the donor YN01-429. The DBSNP35722 and DBSNP222211 flanking markers and the markers within the sub-interval can be used for marker assisted selection to track the QTL on N09 when breeding for enhanced ACM attributes.
Description
- The disclosure relates to fine mapping of quantitative trait loci (QTLs) associated with low fiber content and YSC traits and identification of SNP markers for marker assisted selection of these traits in Brassica napus.
- Canola (Brassica napus L., 2n = 4x = 38, AACC), an allotetraploid formed from diploids B. rapa (2n = 2x = 20, AA) and B. oleracea (2n = 2x = 18, CC), is one of the most important vegetable oilseed crops in the world, especially in China, Canada, the European Union and Australia. Canola meal, the fraction of the seed remaining after crushing and oil extraction, is approximately 55% of the volume of canola seed.
Canola meal consists of several components including protein, fiber, residual oil, carbohydrates, and anti-nutritional factors. Canola meal contains approximately 75% of the protein of 48% protein soybean meal, 80% of the energy value, and 300% of the crude fiber, as well as higher levels of anti-nutritional factors such as glucosinolates, tannins, phytic acid, sinapine and erucic acid, and is sold as livestock feed at 60%-70% of the price of soybean meal. See, e.g., Hickling (2007) Canola meal competitive situation and Canola Council of Canada goals, Canola Meal Research Meeting, Saskatoon, Canada; Newkirk (2009) Canola meal feed industry guide (4th Edition),. The relatively high fiber content of canola meal is a significant limiting factor for its use in monogastric animal species (Hickling, 2007; Newkirk, 2009). Since meal comprises half of the seed volume of canola, and demand for biodiesel could drive a 67% increase in rapeseed seed production from 2006 to 2015 (Hickling, 2007), there is a need to modify the compositional properties of canola meal and thereby increasing its nutritional value relative to soybean. - Scientists at Agriculture and Agri-Foods Canada (AAFC) have developed yellow seed coat (YSC) lines (YN86-37, YN90-1016, YN97-262 and YN01-429) of low hull proportion with thinner seed coat, low fiber and high oil compared to the black seed coat (BSC) canola (Rakow et al., 2011). Feeding studies, comparing yellow seeded canola meal from AAFC line YN01-429 to B. juncea, B. rapa, and brown-seeded B. napus, demonstrated the advantages of YSC B. napus line such as higher protein, lower fiber, increased amino acid digestibility and metabolizable energy content, and improved nutrient and energy utilization based on feed to gain ratio in broiler chickens and monogastric animal species (Hickling, 2009; Slominski et al., 2010).
- The breeding of low fiber content has been greatly hampered by a poor understanding of the inheritance and stability of the low fiber content traits, as well as a lack of robust,high-throughput markers tightly linked to the trait. Due to allotetraploidy, effect of multiple genes, maternal effects and environmental effects, the inheritance of low fiber content trait is complex, and identification of markers tightly linked to this trait is very challenging. Somers et al, (2001) reported identification of eight random amplified polymorphic DNA (RAPD) markers for a major gene (pigment1) associated with yellow seed coat trait from YSC line YN90-1016, the low fiber content source of YN97-262 and YN01-429 used in the applicant's Low Fiber breeding program (Rakow et al., 2011). The major gene explained 72.3% of the variation in seed color, while two additional genes that appeared to be additive explained 21.5% of the color variation (Somers et al., 2001).
- It has been suggested that the low fiber content of AAFC YSC line YN01-429 and its lineage might be controlled by three recessive genes (Kubik and Thompson, 2009). Current selection of lower fiber canola lines has primarily been based on fiber content data obtained using cost and labor intensive analytical methods, or seed coat color, because of its high correlation with low fiber in the AAFC YSC lines YN97-262 and YN01-429. Liu L. et al. ("A High-Density SNP Map for Accurate Mapping of Seed Fibre QTL in Brassica napus L.", PLoS ONE 8(12): e83052 (2013)) describes the identification of QTL that are associated with seed colour and fiber traits and the selection of plant or germplasm based thereon.
- The invention is defined by the appended claims. Disclosed herein is a method for identifying quantitative trait locus associated with desirable nutritional traits in canola. The method includes analyzing a population of canola plants or germplasm for desirable nutritional traits. The genotype of the canola plants or germplasm is determined using at least one marker selected from the group consisting of SEQ ID NO:1 through SEQ ID NO:111. The canola plants or germplasm are mapped for the presence of a quantitative trait locus (QTL) associated with the markers. The QTL is associated with the desirable nutritional trait.
- Another embodiment relates to an isolated and/or recombinant nucleic acid having a sequence associated with a QTL. The QTL is associated with a desirable nutritional trait in a canola plant or germplasm. The QTL is further associated with at least one marker selected from the group consisting of SEQ ID NO:1 through SEQ ID NO:111.
- Yet another embodiment relates to a method for selecting a canola plant or germplasm that comprises desirable nutritional traits. The method includes detecting in the canola plant or germplasm at least one marker linked with a QTL that is selected from the group consisting of SEQ ID NO:1 through SEQ ID NO:111, wherein the QTL is associated with a desirable nutritional trait in the canola plant or germplasm. A canola plant or germplasm is then selected based on the presence of the marker.
- The foregoing and other features will become more apparent from the following detailed description of several embodiments, which proceeds with reference to the accompanying figures.
-
-
FIG. 1 shows the distribution of White Index (WI) and %ADF in Nex828 x YN01-429 (YSC) DH lines. The left figure shows the White Index (WI) of seed coat color plotted against % of ADF in canola seed. The right figure shows the distribution of %ADF among DH lines. The number in bracket indicated % of ADF in canola seed. -
FIG. 2 shows the distribution of White Index (WI) and %ADF in DN051493 x YN01-429 (YDN) DH lines. The left figure shows White Index (WI) of seed coat color plotted against % of ADF canola seed. The right figure shows the distribution of %ADF among DH lines. The number in bracket indicated % of ADF in canola seed. -
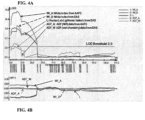
FIG. 3A shows the location (X-axis) and significance (LOD score on Y-axis) of the QTL identified on N09.FIG. 3B shows the additive effect of the QTL identified on N09. -
FIG. 4A shows the location (X-axis) and significance (LOD score on Y-axis) of the QTL identified on N11.FIG. 4B shows the additive effect of the QTL identified on N09. -
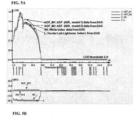
FIG. 5A shows the location (X-axis) and significance (LOD score on Y-axis) of the QTL identified on N09.FIG. 5B shows the additive effect of the QTL identified on N09. -
FIG. 6A shows the location (X-axis) and significance (LOD score on Y-axis) of the QTL identified on N11.FIG. 6B shows the additive effect of the QTL identified on N11. -
FIG. 7 shows a Map of the major ADF QTL interval on N09, constructed with the YDN DH population. Within the 4.9 cM QTL interval, 111 SNP markers were identified, including the flanking markers DBSNP01120 and DBSNP02172. The ADF_9 and WI_9 loci are also mapped within the interval. -
FIG. 8 shows a map of N09 constructed with N09 of YDN, YSC and TN DH populations, showing 18 SNP markers identified within 0.0-4.9 cM to a major QTL underlying fiber content (ADF_9) and seed coat color (WI_9) on N09. - Described herein are high-throughput single nucleotide polymorphism (SNP) markers and high-density genetic maps for fine mapping and validation of quantitative trait loci (QTL) underlying fiber content and seed coat color traits. In some embodiments, SNP markers tightly linked to fiber content and seed coat color traits may be used for marker-assisted selection (MAS) of desirable nutritional traits in yellow-seeded canola (YSC) lines. In particular embodiments, the YSC line may be AAFC YSC line YN01-429 and its lineage.
- Also disclosed is a method of leveraging SNP markers and high-density genetic maps based on fiber content and seed coat color traits from AAFC YSC line YN01-429, using an extensive set of phenotypic data of two DH populations. In a particular embodiment, a major QTL, which explains 59.2% to 74.7% of the variance of fiber content and seed coat color traits, is described on N09 in two DH populations, and a minor QTL, which explains 1.4% to 7.2% of the variance of fiber content and seed coat color traits, is described on N11 in two DH populations. High correlation (R2 = 0.67-0.85) exists between seed coat color traits (WI and L) and ADF content in both populations.
- Also disclosed herein are 18 SNP markers within 0.0-4.9 cM of the major fiber content and seed coat color QTL on N09 (see
Figure 8 ), and 40 SNP markers within 0.0-4.1 cM of the minor fiber content and seed coat color QTL on N11, which may be used in embodiments for marker-assisted selection of complex low fiber content and YSC traits from YSC line YN01-429 and its lineage, and thus may improve the breeding process of canola lines with low ADF content if YN01-429 or it lineage is used as a low fiber content source in breeding programs. - An Low Fiber product which aims to improve the nutritional value of commercial canola meal to 85-90% of the value of 48% protein soybean meal by increasing protein content (from 36% to 44%) and true metabolizable energy (TME) (a 16%-20% increase), and decreasing fiber content (from 15-19% to less than 10%) has been developed. These improvements are anticipated to increase the nutritive value of canola meal, particularly in monogastric species, and should allow increasing dietary inclusion rates.
- YSC lines (YN86-37, YN90-1016, YN97-262 and YN01-429) of low hull proportion with a thinner seed coat, low fiber and high oil as compared to black seed coat (BSC) canola (Rakow et al., 2011) also have been developed. Feeding studies comparing yellow-seeded canola meal from AAFC line YN01-429 to B. juncea, B. rapa, and brown-seeded B. napus have demonstrated the advantages of the YSC B. napus line, including higher protein, lower fiber, increased amino acid digestibility and metabolizable energy content, and improved nutrient and energy utilization based on feed to gain ratio in broiler chickens and monogastric animal species (Hickling, 2009; Slominski et al., 2010).
- Combinations of the yellow seeded/low fiber traits from YSC lines YN97-262 and YN01-419 with the
Omega 9 fatty acid profile, as well as other desirable agronomic and seed quality attributes, have been studied. - In a preferred embodiment, the disclosure describes a method for identifying and mapping quantitative trait loci (QTL) associated with low fiber content and yellow seed coat (YSC) traits in Brassica napus using single-nucleotide polymorphism (SNP) markers. In embodiments, the QTLs are defined in YSC line YN01-429. In some embodiments, the markers may be used for marker-assisted selection of low fiber content and YSC traits derived from YSC line YN01-429 and its lineage
- SNP markers and high-density genetic maps were leveraged, and fiber content and seed coat color traits were fine mapped and validated from AAFC YSC line YN01-429 with an extensive set of phenotypic data from two dihaploid (DH) populations. These experiments are outlined in greater detail in Examples 1-5. Two DH populations, YSC and YDN, were developed from spring canola line crosses. The 183 DH lines of the YSC population were developed from a cross between AAFC yellow seeded/low fiber line YN01-429 and DAS Nexera black seeded/high fiber variety Nex828, and grown along with the two parents in paired row plots at the AAFC Saskatoon research farm and the DAS Rosthern research farm in Canada in 2007 for phenotyping. Seed samples from two locations were analyzed by AAFC using near-infrared spectroscopy (NIR) ADF (named ADF_A in
Figures 3 and4 ) and using Hunter lab for seed coat color White Index (named WI_A inFigures 3 and4 ) measurement in 2007. The population was also analyzed by DAS Analytical Technologies Group in Indianapolis for ADF (named ADF_A inFigures 3 and4 ) using the AOAC reference method (AOAC Official Method 973.18) and by DAS Bioprocess Group in Indianapolis for seed coat color White Index (named WI_D inFigures 3 and4 ) and Hunter Lab Lightness Index (named L inFigures 3 and4 ) measurement in 2011. The 400 DH lines of the YDN population were developed from a cross between YN01-429 and DAS Nexera black seeded/high fiber variety DN051493. The YDN population was grown along with the two parents at Pike Lake and Cudworth, Canada in 2011 for phenotyping. Seed samples were analyzed for ADF (named ADF_M1 and ADF_M2 inFigures 5 and6 ), seed coat color White Index (named WI inFigures 5 and6 ) and Hunter lab Lightness Index (name L in theFigures 5 and6 ). A third DH population of 181 DH lines (named TN population) from a cross between Tapidor (a European winter cultivar) and Ningyou7 (a Chinese semi-winter cultivar) was added for consensus map construction in addition to YSC and YDN populations for QTL mapping of fiber content and seed coat color traits; TN population did not segregate for fiber content and seed coat color traits.. The three DH populations were genotyped with 12,000 SNP markers and a consensus map was constructed with individual map of the YSC, YDN and TN populations. Composite Interval Mapping (CIM) was used for a whole genome QTL scan. After QTL mapping, the SNP markers within 0.0-5.0 cM of the QTL underlying fiber content and seed coat color traits were converted to KASPar assays for MAS of these traits derived from YN01-429 and its lineage. - High correlation was also observed between the seed coat color traits WI and L (R2 = 0.81-0.99) and between seed coat color traits and ADF content (R2 = 0.66-0.85) in both populations (
Figures 1 and2 ). Because of the large effect of the major QTL (R2= 59.2%-74.7%) on N09, and bi-modal distributions of fiber content and seed coat color traits in DH lines (Figures 1 and2 ), quantitative fiber content and seed coat color traits can be treated as qualitative traits. After conversion of the quantitative traits of ADF and WI into qualitative traits, the ADF (ADF_09) and WI (WI_09) were mapped to the same genomic region where the major QTL were located on N09 in both YSC and YDN populations.Figure 7 shows the map location of major ADF and WI QTL, ADF_09 and WI_09 on the consensus map of N09 constructed with YSC, YDN and TN populations and 323 SNP markers. - Somers et al. (2001) and Rakow et al. (2011) indicated that the YSC line from AAFC delivers consistently low fiber content across multiple environments, and low lignin content is always associated with the yellow seed color. The YSC genetic map was constructed with 174 DH and 2,982 polymorphic SNP markers, a total length of 2,515.8 cM and an average length of 0.80 cM/marker. The YDN population was constructed with 397 DH lines and 2,972 SNP markers, a total length of 2,189 cM and an average length of 0.74 cM/marker. The TN genetic map was constructed with 181 DH lines and 2,716 polymorphic SNP markers, a total length of 1905.7 cM and an average length of 0.70 cM/marker. In embodiments, the disclosure describes a consensus map of 5,500 SNP markers with an average of 0.47 cM constructed with the YDN, YSC and TN populations (
Figure 7 ). - YSC and YDN populations segregated for fiber content and seed coat color traits and were used for QTL mapping, which further confirmed that seed coat color traits and fiber content traits were highly correlated (
Figures 3-6 ). QTL mapping indicated that a major QTL was identified on linkage group (LG) N09 and a minor QTL was identified on LG N11 for all the seed coat color traits (WI and L) and ADF content in both populations (Figures 4-6 ). - In the YSC population, the major QTL identified on N09 explained 71.5% of ADF variance, and coincided with major QTL which explained 59.2% of WI and 60.8% of Lightness Index (L) variance at LOD scores ranged from 40 to 47 (
Figure 3 ). The minor QTL identified on N11 explained 2.4% of ADF variance, and coincided with the minor QTL which respectively explained 7.2% of WI and 6.3% of Lightness Index (L) variance at LOD scores ranged from 5 to 9 in Nex828 x YN01-429 population (Figure 4 ).. - QTL analysis of YDN population further confirmed the results from YSC population. The major QTL identified on N09 explained 73.4% of ADF variance and coincided with the major QTL which respectively explained 74.0% of WI and 74.7% of Lightness Index (L) variance at LOD score 143 (
Figure 5 ). The minor QTL identified on N11 explained 1.4% of ADF variance, and coincided with the minor QTL which respectively explained 5.9% of WI and 5.7% of Lightness Index (L) variance at LOD scores ranged from 3 to 32 (Figure 6 ). The results were in accordance with Somers et al. (2001) results, which indicated that a major gene explained 72.3% of the variation in seed color, as well as two additional genes that appeared to be additive and explained 21.5% of the color variation. Since seed coat color QTL (WI and L) perfectly coincided with QTL for fiber content and explained the almost the same percentage of phenotypic variance (R2 = 77.4%) as QTL for ADF content in both YN01-429 derived DH populations, seed coat color indexes (WI and L) were good indicators for the fiber content in canola seed if YSC line YN01-429 or its lineage is used as a low ADF content source in breeding programs.. - In some embodiments, the disclosure describes a major QTL which explains 59.2-74.7% of the phenotypic variance of fiber content and seed coat color traits in two dihaploid (DH) plant populations. In particular embodiments, a minor QTL has been found to explain 1.4-7.2% of the phenotypic variance of these traits in two dihaploid plant populations. High correlation is disclosed between seed coat color traits (WI and L) and ADF content in both populations.
- In an alternative embodiment, a set of high throughput markers closely linked to fiber content and seed coat color traits from YSC line YN01-419. In other embodiments, nucleic acid sequences linked to QTL's are associated with desirable nutritional traits. The sequence can be derived from yellow-seeded coat (YSC) line YN01-429 or its lineage. Particular embodiments related to a set of 18 SNP markers that lie within 0.0-4.9 cM of the major ADF and seed color (WI) QTL identified in Nex828 x YN01-429 (YSC) and DN051493 x YN01-429 (YDN) DH populations.
- In a particular embodiment, the SNP markers include those markers identified as DBSNP357222 through DBSNP2222111 in
Figure 7 , which flanked by DSNP01120 and DSNP02172. In another embodiment, the SNP markers include DBSNP357223, DBSNP357224, DBSNP357226, DBSNP357227, DBSNP357228, DBSNP357230, DBSNP357231, DBSNP357233, DBSNP357234, DBSNP357244, DBSNP357247, DBSNP357250, DBSNP357252, DBSNP357253, DBSNP357254, DBSNP357255, DBSNP357256, DBSNP357257, DBSNP357258, DBSNP357273, DBSNP357287, DBSNP357288, DBSNP357290, DBSNP357291, DBSNP357292, DBSNP357293, and DBSNP357294, as shown inFigure 7 . - Certain embodiments related to a method for selecting canola plants or germplasm for a desirable nutritional trait associated with QTL's using marker-assisted selection (MAS). For example, the YSC line YN01-429 may be used. Seed color measurement may be used to replace costly and time-consuming wet chemistry analysis of fiber content. SNP markers disclosed to be within 4.9 cM of the major fiber content and seed coat color QTL on N09 or the minor fiber content and seed coat color QTL on N11 can be used for MAS, and will greatly expedite the breeding of canola lines with low fiber content, one of the most important components of DAS Low Fiber product concept.
- Particular embodiments describe a method for using the identified QTL in marker-assisted selection (MAS) of the complex fiber content and seed coat color traits from the YSC line YN01-429 to facilitate breeding in Brassica and more efficient selection of desirable nutritional traits. Particular embodiments are directed to marker-assisted selection of canola varieties to increase the nutritive value of canola meal, particularly for feed animals, including monogastric animals and ruminants.
- According to certain embodiments, the method may be used to select canola seed or germplasm comprising, on average, at least about 44% crude protein, and not more than about 14% acid detergent fiber as determined by NIR on a dry mass basis. In alternative embodiments, the canola seed or germplasm may further comprise, on average, at least about 49% crude protein content. In other embodiments, the canola seed or germplasm may comprise on average, not more than about 12% acid detergent fiber content. Additionally, the canola seed or germplasm selected by the disclosed method may further comprise the following traits: reduced glucosinolate content, low tannin content, and/or low residual cell wall content.
-
- ADF
- acid detergent fiber
- AME
- apparent metabolizable energy
- DAS
- Dow AgroSciences
- DH
- dihaploid
- FAME
- fatty acid/fatty acid methyl esters
- NMR
- nuclear magnetic resonance
- NIR
- near-infrared spectroscopy
- QTL
- quantitative trait locus
- RAPD
- random amplified polymorphic DNA
- SNP
- Single nucleotide polymorphism
- RCW
- residual cell walls
- Allotetraploid: As used herein, "allotetraploid" generally refers to a hybrid organism that has a chromosome set that is four times that of a haploid organism.
- Canola oil: Canola oil refers to oil extracted from commercial varieties of rapeseed. To produce canola oil, seed is typically graded and blended at grain elevators to produce an acceptably uniform product. The blended seed is then crushed, and the oil is typically extracted with hexane and subsequently refined. The resulting oil may then be sold for use. Oil content is typically measured as a percentage of the whole dried seed, and particular oil contents are characteristic of different varieties of canola. Oil content can be readily and routinely determined using various analytical techniques, for example and without limitation: NMR; NIR; and Soxhlet extraction. The percent composition of total fatty acids is typically determined by extracting a sample of oil from seed, producing methyl esters of fatty acids present in the oil sample, and analyzing the proportions of the various fatty acids in the sample using gas chromatography. The fatty acid composition may also be a distinguishing characteristic of particular varieties.
- Elite line: As used herein, the term "elite line" means any line that has resulted from breeding and selection for superior agronomic performance. An elite plant is any plant from an elite line.
- Enhanced canola meal: As used herein, the term "enhanced canola meal" means canola meal, produced from canola seeds, which has decreased fiber content, and may have increased protein and true metabolizable energy content, as well as reduced anti-nutritional factors such as glucosinolates, tannins, phytic acid, sinapine and erucic acid. Meal with some or all of these characteristics could allow increasing inclusion rates in the diet of animal species especially in monogastric animals.
- Plant line: As used herein, a "line" refers to a group of plants that display little genetic variation (e.g., no genetic variation) between individuals for at least one trait. Inbred lines may be created by several generations of self-pollination and selection or, alternatively, by vegetative propagation from a single parent using tissue or cell culture techniques. As used herein, the terms "cultivar," "variety," and "type" are synonymous, and these terms refer to a line that is used for commercial production.
- Plant material: As used herein, the term "plant material" refers to any processed or unprocessed material derived, in whole or in part, from a plant. For example and without limitation, a plant material may be a plant part, a seed, a fruit, a leaf, a root, a plant tissue, a plant tissue culture, a plant explant, or a plant cell.
- Quantitative trait: As used herein, a "quantitative trait" may refer to a trait or phenotype that is expressed in varying degrees, along a generally continuous gradient and is frequently linked to two or more genes and is affected by environment.
- Quantitative trait locus: As used herein, a "quantitative trait locus" refers to a segment or region of DNA containing or linked to a gene or genes underlying a quantitative trait.
- Seed color: In some embodiments, this disclosure refers to canola varieties (e.g., inbred canola lines and hybrids) characterized by seed color. Canola seed color rating or "seed color" is generally scored on a 1-5 scale, based on seeds obtained from healthy plants at or near complete seed maturity. "1" signifies a good yellow color. "2" signifies mainly yellow with some brown. "3" indicates a mixture of brown and yellow. "4" and "5" signify brown and black, respectively. Whiteness index (WI) scores also may be used to describe canola varieties. For example, yellow-seeded lines YN97-262 and 9592 have whiteness index scores of -34.6 and -33.2, respectively, and seed color scores of 1. Dark-seeded lines, Nex 715 and Nex 705, have whiteness index scores of -0.2 and -4.4, respectively, and seed color scores of 4. Dark-seeded lines 46A65 and Q2 have whiteness index scores of 0.3 and -3.9, respectively, and seed color scores of 5. Color of particular seeds may also be described in terms of a percentage, or other ratio, as compared to any of these lines.
- Stability: As used herein, the term "stability," or "stable," refers to a given plant component that is maintained at substantially the same level through multiple generations. For example, a stable component may be maintained for at least three generations at substantially the same level. In this context, the term "substantially the same" may refer in some embodiments to a component maintained to within 25% between two different generations; within 20%; within 15%; within 10%; within 5%; within 3%; within 2%; and/or within 1%, as well as a component that is maintained perfectly between two different generations. In some embodiments, a stable plant component may be, for example and without limitation, an oil component; a protein component; a fiber component; a pigment component; a glucosinolate component; and a lignin component. The stability of a component may be affected by one or more environment factors. For example, the stability of an oil component may be affected by, for example and without limitation: temperature; location; stress; and the time of planting. Subsequent generations of a plant having a stable component under field conditions will be expected to produce the plant component in a similar manner, for example, as set forth above.
- Trait or phenotype: The terms "trait" and "phenotype" are used interchangeably herein. For the purposes of the present disclosure, the traits of particular interest are low fiber content and seed coat color. Some canola varieties exhibit a yellow seed coat, while further varieties exhibit a dark (e.g., black, dark, and mottled) seed coat.
- A "variety" or "cultivar" is a plant line that is used for commercial production which is distinct, stable and uniform in its characteristics when propagated.
- Unless indicated otherwise, the terms "a" and "an" as used herein refer to at least one.
- The following Examples are provided to illustrate certain particular features and/or aspects. These Examples should not be construed to limit the disclosure to the particular features or aspects described.
- For fine mapping and validation of low fiber content and seed coat color traits from yellow seed coat (YSC) line YN01-429, two dihaploid (DH) populations, YSC and YDN, were developed from crosses between spring canola lines in 2007 and 2010, respectively. The 176 DH lines of YSC population were developed from a cross between the Agriculture and Agri-Food Canada (AAFC) yellow seeded, low fiber line YN01-429 and the DAS Nexera black seeded, high fiber variety Nex828. The 399 DH lines of the YDN population were developed from a cross between YN01-429 and DAS Nexera black seeded, high fiber variety DN051493. The DH population, TN, was derived from a cross between the European winter cultivar Tapidor and the Chinese semi-winter cultivar Ningyou7. This population was a reference mapping population widely used for trait mapping and genomics studies by the international canola research community (Shi et al. 2009), and was not segregating for fiber content and seed coat color traits. It was used for consensus map construction along with the YSC and YDN populations to identify more Single Nucleotide Polymorphic (SNP) markers tightly linked to the fiber content and seed coat color traits.
- Genomic DNA for the populations was extracted from 8 leaf punches per sample using the DAS Biocel extraction method (Bohl et al. 2009). DNA samples were quantified with Quant-iT™ PicoGreen® Quantification Kit (Invitrogen, Carlsbad, CA) using the manufacturer's instructions or with the Nanodrop 8000 Spectrophotometer (Thermo Scientific, Waltham, MA) per manufacturer's instructions.
- The 176 DH lines from the YSC population were grown along with the two parents as checks in paired row plots at the AAFC Saskatoon research farm and the DAS Rosthern research farm at Canada in 2007 for phenotyping. Seed samples from all established plots were collected from both locations and analyzed by AAFC using Near Infrared Spectroscopy (NIR) for Acid Detergent Fiber (ADF) and seed coat color White Index (WI). The population was also analyzed for ADF using the AOAC reference method (AOAC Official Method 973.18) in 2007 and for seed coat color White Index and Hunter Lab Lightness Index (L) in 2011.
- The YDN population was grown along with the two parents as checks in paired row plots at Pike Lake and Cudworth, Canada in 2011 for phenotyping. Seed samples from 361 DH lines were analyzed for ADF using two NIR models and for seed coat color White Index and the HunterLab Lightness Index in 2011.
- Significant differences were observed between the two mapping parents for fiber content and seed coat color for both populations, as illustrated in Table 1. Distributions of fiber content in DH lines revealed bi-modal distributions skewed towards the higher fiber range in both populations (
Figures 1 and2 ). High correlation was observed between the seed coat color traits WI and L (R2 = 0.81-0.99) and between seed coat color traits and fiber content traits (R2 = 0.66-0.85) in both populations (Figures 1 and2 ).Table 1: The %ADF and seed coat color data, WI and L of the parents and DH lines in YSC and YDN populations. Trait YSC population YDN population Nex828 YN01-429 DH lines with Nex828 alleles DH lines with YN01-429 alleles DN0514 93 YN01-429 DH lines with DN051493 alleles DH lines with YN01-429 alleles % ADF 15.6% 9.1% 14.0 ± 1.6% 10.0 ± 1.0% 19.0% 12.6% 18.5 ± 1.4% 12.8 ± 0.9% WI 68.0 145.6 67.1 ± 4.2 100.4 ± 19.2 67.9 159.3 68.0 ± 5.0 123.5 ± 19.6 L 74.4 157.7 73.1 ± 5.0 109.9 ± 20.8 74.4 172.1 74.1 ± 5.9 134.8 ± 20.8 - The three DH populations, YSC, YDN, and TN, were genotyped with 12,000 SNP markers developed at DAS on two Illumina Infinium chips on the BeadStation 500 G per manufacturer's protocol (Illumina, San Diego, CA). Genotypic data was analyzed using the GenomeStudio Genotyping Analysis Module v1.8.4 (Illumina, San Diego, CA), which converts fluorescent signals for each SNP into A and B signals whose values reflect the relative abundance of arbitrarily assigned A and B alleles. Signal is converted into polar coordinates, using the Manhattan distance metric for the intensity R, and with Theta∈[0,1] representing angle ∈[0,90] degrees. Each marker is clustered in Cartesian coordinates, and the genotypes {AA, AB, BB} are assigned to samples in clusters close to Theta={0, ½, 1}.
- The individual maps of the YSC, YDN and TN populations were constructed with MAPMAKER/EXP 3.0 (Lander et al. 1987; Lincoln et al. 1992) at LOD score 10.0 and Haldane's mapping function, and the consensus map was constructed with Phenomap Enterprise 3.0 (GeneFlow Inc., Centreville, VA).
- The YSC genetic map was constructed with 176 DH lines and 2,982 polymorphic SNP markers, and had a total length of 2,515.8 cM and an average length of 0.80 cM/marker. The YDN genetic map was constructed with 399 DH lines and 2,972 SNP markers, and had a total length of 2,189 cM and an average of 0.74 cM/marker. The TN genetic map was constructed with 181 DH lines and 2,716 polymorphic SNP markers, and had a total length of 1905.7 cM and an average of 0.70 cM/marker. A consensus map of 5,500 SNP markers was constructed with the YDN, YSC and TN populations.
- The Composite Interval Mapping (CIM), as implemented in QTL Cartographer V2.5 (Wang et al. 2011), was used for QTL mapping. A LOD score of 3.0 was used as threshold to identify genomic regions significantly affecting the seed coat color and fiber content traits.
- Table 2 shows the details of the QTLs identified for seed coat color and fiber content. Results indicated that a major QTL was identified on linkage group (LG) N09 and a minor QTL was identified on N11 for the seed coat color traits, WI and L, and fiber content trait ADF, in both YSC and YDN populations. In the YSC population, the major QTL identified for ADF on N09 coincided with a major QTL for WI and L at LOD scores ranging from 40 to 47. The minor QTL identified for ADF on N11 coincided with a minor QTL for WI and L at LOD scores ranging from 3 to 9 in the YSC population. QTL analysis of the YDN population further confirmed the results from the YSC population. For the YDN population, the major QTL identified for ADF on N09 coincided with the major QTL for WI and L at LOD scores ranged from 136 to 143. The minor QTL identified for ADF on N11 coincided with the minor QTL for WI and L at LOD scores ranging from 7 to 26.
Table 2: The phenotypic variance explained (R2) by significant QTL underlying ADF content and seed coat color traits (WI and L) in YSC and YDN populations with LOD scores ≥ 3. Population Trait Linkage Group % of Variance Explained (R2) LOD YSC (n=176) Seed coat color_L N09 60.8 41 Seed coat color WI N09 59.2 40 Fiber content_ADF N09 71.5 47 Seed coat color_L N11 6.3 8 Seed coat color_WI N11 7.2 9 Fiber content ADF N11 2.4 3 YDN (n=399) Seed coat color_L N09 74.7 143 Seed coat color_WI N09 74 141 Fiber content_ADF N09 73.4 136 Seed coat color_L N11 5.7 26 Seed coat color_WI N11 5.9 26 Fiber content ADF N11 1.4 7 - Because of the large effect of the major QTL (R2= 59.2%-74.7%) on N09, and the bi-modal distributions of fiber content and seed coat color traits in the DH lines (
Figures 1 and2 ), quantitative fiber content and seed coat color traits can be treated as qualitative traits. Based on their ADF content and seed coat color WI, DH lines of both populations were divided into two groups, one with low fiber /high WI and homozygous YN01-429 alleles and the other group with high fiber/low WI and homozygous Nex828 or DN051493 alleles (Figures 1 and2 ). - In the YSC population, the DH lines with YN01-429 alleles had an average of 10.0 ± 1.0% of ADF and the DH lines with Nex828 alleles had an average of 14.0 ± 1.6% of ADF in canola seeds (
Figure 1 ). In the YDN population, the DH lines with YN01-429 alleles had an average of 12.8 ± 0.9% of ADF and the DH lines with DN051493 alleles had an average of 18.5 ± 1.4% of ADF in canola seeds (Figure 2 ). After conversion of the quantitative traits of ADF and WI into qualitative traits, the ADF (ADF_09) and WI (WI_09) were mapped to the same genomic region where the major QTL were located on N09 in both the YSC and YDN populations.Figure 7 shows the map location of the major ADF and WI QTL, ADF_09 and WI_09, on the YDN population map of N09. - The YDN population was later used for fine mapping and validation of the major QTL on N09. A new genetic map of N09 was constructed with 1387 SNPs. Flanking markers DBSNP01120 and DBSNP02172 defined a QTL interval of 4.9 cM, corresponding to 0.46 Mb on the B. napus reference genome, DH12075, which was sequenced at AAFC through an industry consortium. The major QTL has an R2 of 75% on N09. Blind screenings of the markers within the QTL interval with multiple DAS proprietary DH populations from the breeding program confirmed that the concordance between marker-predicated phenotype and actual phenotype was ≥ 98%.
Figure 3 shows the genetic map of the ADF QTL interval along with the ADF_09 and WI_09 loci. - Within the 4.9 cM QTL interval on N09, 111 SNP markers were identified, including the flanking markers DBSNP01120 and DBSNP02172. Table 3 lists the SNPs, their genetic positions in cM, the YN01-429 allele as well as the physical positions of the SNPs on the B. napus reference genome (DH12075).
Table 3: SNP markers within the 4.9 cM QTL interval for ADF mapped on N09 with the YDN population. SNP_Name SEQ ID NO: Map Position (cM) SNP_Type SNP_Forward YN01429 genotype Physical Pos on Ref Genome (bp) DBSNP01120 1 117.4 SNP [T/G] GG N9:35982462..35983088 DBSNP357202 2 117.4 SNP [C/G] GG N9:35982582..35984072 DBSNP357203 3 117.4 SNP [T/G] TT N9:35982826..35984316 DBSNP222203 4 117.4 SNP [A/C] AC N9:35987647..35987947 DBSNP357208 5 117.4 SNP [T/G] GG N9:35994219..35995219 DBSNP357214 6 117.7 SNP [A/G] AA N9:36025967..36026963 DBSNP222206 7 117.7 SNP [A/G] AA N9:36027874..36028174 DBSNP357215 8 118.2Q INDEL [-/A] AA N9:36030593..36031612 DBSNP357216 9 118.2Q SNP [T/G] TG N9:36030597..36031616 DBSNP357217 10 118.2Q INDEL 

N9:36030617..36031636 DBSNP357218 11 118.2Q SNP [A/G] GG N9:36030736..36031756 DBSNP357219 12 118.7 SNP [A/G] GG N9:36030916..36031808 DBSNP357221 13 119 SNP [C/G] CC N9:36038430..36039006 DBSNP357222 14 119 SNP [T/G] TT N9:36038430..36039335 DBSNP357223 15 119 SNP [A/G] GG N9:36038516..36039516 DBSNP357224 16 119 SNP [T/C] CC N9:36038712.36039712 DBSNP222208 17 119 SNP [T/C] CC N9:36039152..36039272 DBSNP357226 18 119 SNP [C/G] GG N9:36039465..36040465 DBSNP357227 19 119 SNP [A/C] CC N9:36039710..36040708 DBSNP357228 20 119 SNP [T/C] CC N9:36039738..36040726 DBSNP357229 21 119.3 SNP [T/G] GG N9:36040629..36041743 DBSNP357230 22 119.8 SNP [T/C] CC N9:36041302..36042269 DBSNP357231 23 119.8 SNP [A/G] AA N9:36041326..36042293 DBSNP357232 24 119.8 SNP [T/C] CC N9:36041431..36042398 DBSNP357233 25 119.8 SNP [T/C] CC N9:36041470..36042437 DBSNP357234 26 119.8 SNP [T/C] CC N9:36041587..36042554 DBSNP357235 27 119.8 SNP [A/T] AA N9:36042193..36043188 DBSNP357236 28 119.8 INDEL [+/TT] TT N9:36042318..36043314 DBSNP357237 29 119.8 SNP [T/C] TT N9:36042320..36043316 DBSNP357238 30 119.8 SNP [A/T] TT N9:36042626..36043621 DBSNP357239 31 119.8 SNP [T/C] TT N9:36042629..36043624 DBSNP357240 32 119.8 INDEL [+/A] + N9:36042765..36043760 DBSNP357241 33 119.8 SNP [A/G] AG N9:36043110..36044110 DBSNP357242 34 119.8 INDEL [-/T] T N9:36043117..36044117 DBSNP357244 35 119.8 SNP [T/C] TT N9:36043219..36044219 DBSNP357245 36 119.8 SNP [T/C] CC N9:36043480..36044475 DBSNP357246 37 119.8 SNP [A/T] TT N9:36044691..36045691 DBSNP357247 38 119.8 SNP [A/T] TT N9:36045200..36046200 DBSNP04324 39 119.8 SNP [T/C] CC N9:36046568..36047839 DBSNP357249 40 119.8 SNP [A/G] AA N9:36046761..36047762 DBSNP357250 41 119.8 SNP [A/G] AA N9:36046762..36047763 DBSNP357251 42 119.8 SNP [A/G] AA N9:36046778..36047779 DBSNP357252 43 119.8 SNP [A/G] GG N9:36046868..36047869 DBSNP357253 44 119.8 SNP [A/G] GG N9:36046920..36047921 DBSNP357254 45 119.8 INDEL [+/T] + N9:36047652..36048534 DBSNP357255 46 119.8 SNP [T/C] TT N9:36047710..36048534 DBSNP357256 47 119.8 SNP [A/G] GG N9:36047752..36048534 DBSNP357257 48 119.8 SNP [T/C] CC N9:36047876..36048534 DBSNP357258 49 119.8 SNP [A/G] AA N9:36047941..36048534 DBSNP357259 50 119.8 SNP [T/C] TT N9:36048002..36048534 DBSNP357260 51 119.8 SNP [C/G] GG N9:36048012..36048534 DBSNP357262 52 119.8 INDEL [+/A] + N9:36048530..36049322 DBSNP357263 53 119.8 SNP [A/T] TT N9:36048530..36049347 DBSNP357264 54 119.8 SNP [A/T] TT N9:36048530..36049442 DBSNP357265 55 119.8 SNP [A/G] AG N9:36048530..36049520 DBSNP357266 56 119.8 SNP [A/G] AA N9:36048564..36049565 DBSNP357267 57 119.8 SNP [C/G] CG N9:36048641..36049642 DBSNP357268 58 119.8 SNP [A/C] CC N9:36048645..36049646 DBSNP357269 59 119.8 SNP [T/C] TC N9:36048651..36049652 DBSNP357270 60 119.8 SNP [C/G] CC N9:36048792..36049793 DBSNP357271 61 119.8 SNP [T/C] CC N9:36048794..36049795 DBSNP357272 62 119.8 INDEL [+/A] + N9:36048932..36049933 DBSNP357273 63 119.8 SNP [A/T] TT N9:36048985..36049986 DBSNP357274 64 119.8 SNP [A/G] AG N9:36049082..36050083 DBSNP357275 65 119.8 SNP [T/C] TC N9:36049455..36050457 SNP_Name SEQ ID NO: Map Position (cM) SNP_Type SNP_Forward YN01429 genotype Physical Pos on RefGenome(bp) DBSNP357276 66 119.8 SNP [A/G] AA N9:36049482..36050484 DBSNP357278 67 119.8 SNP [C/G] CC N9:36049554..36050556 DBSNP357280 68 119.8 SNP [T/G] TT N9:36049653..36050643 DBSNP357282 69 119.8 SNP [T/G] TT N9:36049758..36050643 DBSNP357286 70 119.8 SNP [A/G] AA N9:36054018..36055018 DBSNP222210 71 119.8 SNP [A/G] AG N9:36054461..36054578 DBSNP357287 72 119.8 SNP [A/T] TT N9:36054757..36055757 DBSNP357288 73 119.8 SNP [A/G] GG N9:36054789..36055789 DBSNP357289 74 119.8 SNP [T/C] CC N9:36054810..36055810 DBSNP357290 75 119.8 SNP [A/G] AA N9:36054813..36055813 DBSNP357291 76 119.8 SNP [A/C] AA N9:36054956..36055956 DBSNP357292 77 119.8 SNP [C/G] CC N9:36054966..36055966 DBSNP357293 78 119.8 SNP [T/C] TT N9:36054983..36055983 DBSNP357294 79 119.8 SNP [T/C] TT N9:36055008..36056008 DBSNP84508 80 119.8 SNP [A/C] AC N9:36055121..36055879 DBSNP222211 81 119.8 SNP [A/G] GG N9:36060768..36060968 DBSNP222212 82 119.8 SNP [A/G] GG N9:36061805..36061924 DBSNP222214 83 119.8 SNP [A/G] AA N9:36076182..36076301 DBSNP222219 84 119.8 SNP (dominant) [T/G] -- N9:36096659..36096732 DBSNP222220 85 119.8 SNP (dominant) [A/C] -- N9:36096733..36096814 DBSNP240715 86 119.8 SNP [A/G] AG N9:36100799..36100917 DBSNP222222 87 119.8 SNP [A/G] GG N9:36119793..36119830 DBSNP38295 88 119.8 SNP [A/G] GG N9:36132536..36133536 DBSNP222225 89 119.8 SNP [A/G] GG N9:36132936..36133136 DBSNP222226 90 119.8 SNP [A/G] AA N9:36136254..36136558 DBSNP08212 91 119.8 SNP [A/G] AA N9:36143105..36143329 DBSNP08214 92 119.8 SNP [T/G] TT N9:36143105..36143329 DBSNP222228 93 119.8 SNP [T/C] CC N9:36147820..36147940 DBSNP222229 94 120.1 SNP [A/G] AA N9:36156553..36156673 DBSNP42126 95 120.1 SNP [T/G] GG N9:36157370..36158339 DBSNP222231 96 120.1 SNP [T/C] TT N9:36165969..36166169 DBSNP222233 97 120.6 SNP [A/G] AA N9:36175905..36176121 DBSNP222235 98 120.6 SNP [A/G] AA N9:36190213..36190333 SNP_Name SEQ ID NO: Map Position (cM) SNP_Type SNP_Forward YN01429 genotype Physical Poson Ref Genome (bp) DBSNP146598 99 120.6 SNP [T/C] TC N9:36207823..36208597 DBSNP147032 100 120.6 SNP [A/G] AG N9:36212362..36213110 DBSNP94819 101 120.6 SNP [T/G] TG N9:36213988..36214561 DBSNP158066 102 120.6 SNP [A/T] TA N9:36214885..36215409 DBSNP158078 103 120.6 SNP [T/C] CC N9:36214926..36215606 DBSNP63288 104 121.4 SNP [T/G] TG N9:36278558..36279063 DBSNP52362 105 121.4 SNP [T/C] + N9:36279239..36280186 DBSNP222241 106 121.4 SNP [T/C] -- N9:36291810..36291930 DBSNP222242 107 121.4 SNP [T/C] TT N9:36308543..36308663 DBSNP189108 108 121.4 SNP [T/C] TC N9:36308946..36309355 DBSNP222244 109 121.7 SNP [T/C] CC N9:36353147..36353447 DBSNP222246 110 122 SNP [T/G] TT N9:36372163..36372403 DBSNP02172 111 122.3 SNP [C/G] CC N9:36447139..36448664 - Within the 4.9 cm ADF QTL interval, flanked by DBSNP01120 and DBSNP02172, a sub-interval was defined in which the markers are most desired for marker assisted selection. Flanking markers DBSNP35722 and DBSNP222211 define a 0.5 cM sub-interval haplotype region unique to the donor YN01-429. The DBSNP35722 and DBSNP222211 flanking markers and the markers within the sub-interval can be used for marker assisted selection to track the QTL on N09 when breeding for enhanced ACM attributes.
-
- <110> DOW AGROSCIENCES, LLC
Tang, Shunxue
Ripley, Van
Patterson, Tom G.
Wiggins, Michelle
Flook, Josh
Ochsenfeld, Cherie
Parliament, Kelly
Garcia, Daniel
Rizvi, Syed Masood
Tahir, Muhammed
Pruess, Ryan
Knievel, Donna
Rounsely, Steve
Ehlert, Zoe - <120> FINE MAPPING AND VALIDATION OF QTL UNDERLYING FIBER CONTENT AND SEED COAT COLOR TRAITS AND IDENTIFICATION OF SNP MARKERS FOR MARKER ASSISTED SELECTION OF THESE TRAITS DERIVED FROM YELLOW SEED COAT (YSC) CANOLA LINE YN01-429 AND ITS LINEAGE
- <130> 72430-US-NP
- <160> 111
- <210> 1
<211> 532
<212> DNA
<213> Brassica napus - <220>
<221> misc_feature
<222> (295)..(295)
<223> where n is a, t, c, or g - <220>
<221> misc_feature
<222> (369)..(369)
<223> where n is a, t, c, or g - <220>
<221> misc_feature
<222> (441)..(441)
<223> where n is a, t, c, or g - <220>
<221> misc_feature
<222> (452)..(452)
<223> where n is a, t, c, or g - <220>
<221> misc_feature
<222> (473)..(473)
<223> where n is a, t, c, or g - <400> 1

- <210> 2
<211> 1001
<212> DNA
<213> Brassica napus - <400> 2

- <210> 3
<211> 1001
<212> DNA
<213> Brassica napus - <400> 3

- <210> 4
<211> 301
<212> DNA
<213> Brassica napus - <400> 4

- <210> 5
<211> 1001
<212> DNA
<213> Brassica napus - <400> 5

- <210> 6
<211> 1001
<212> DNA
<213> Brassica napus - <400> 6

- <210> 7
<211> 301
<212> DNA
<213> Brassica napus - <400> 7

- <210> 8
<211> 1001
<212> DNA
<213> Brassica napus - <220>
<221> misc_feature
<222> (501)..(501)
<223> where n is an insertion/deletion [-/A] - <400> 8
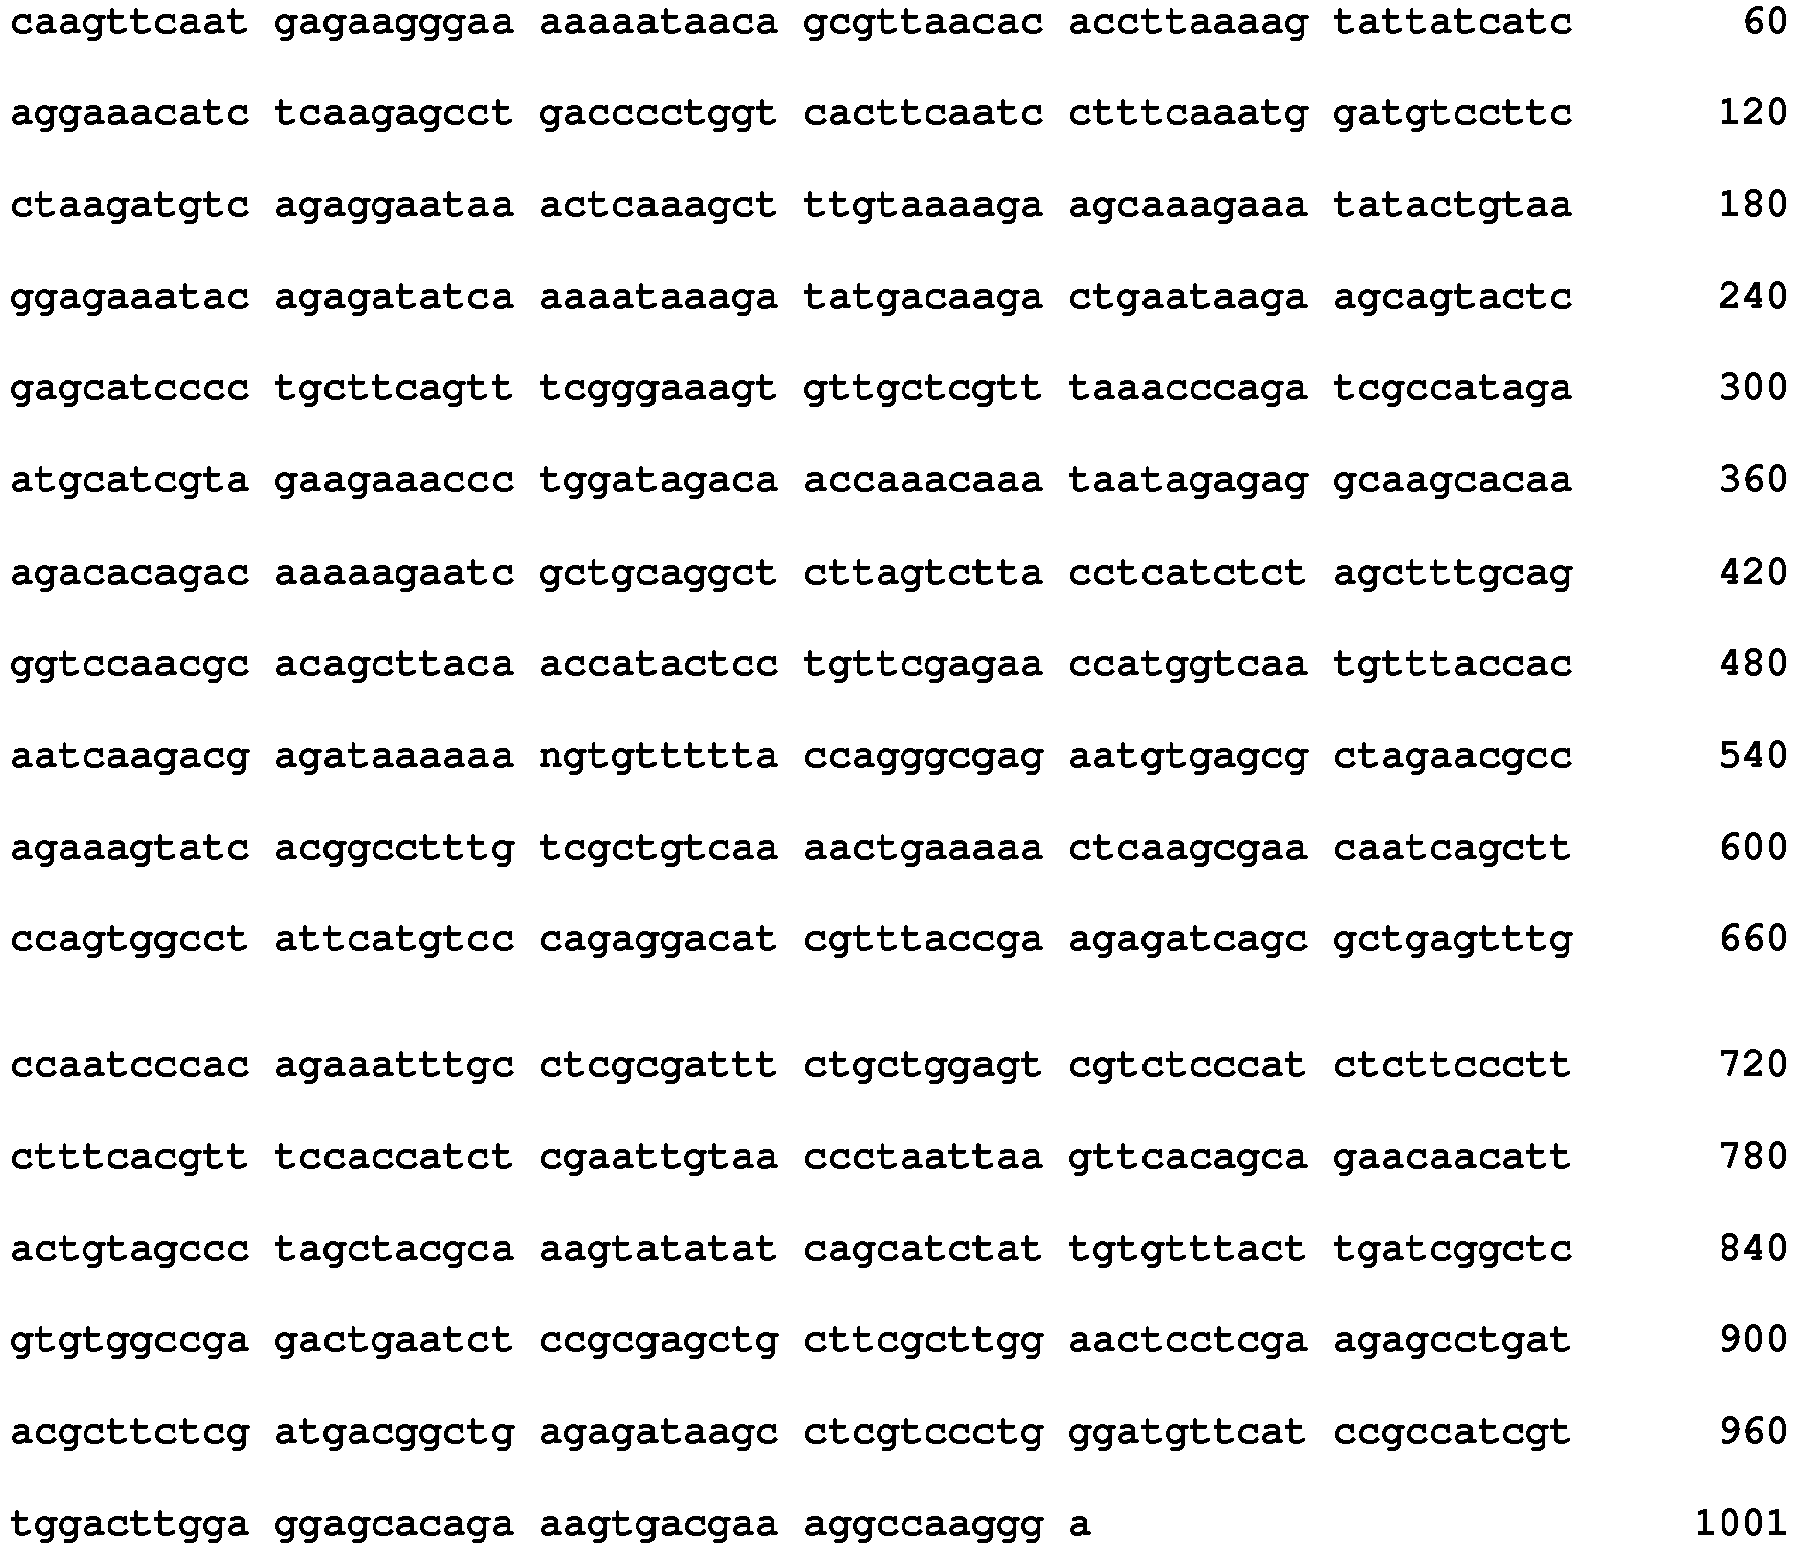
- <210> 9
<211> 1001
<212> DNA
<213> Brassica napus - <400> 9

- <210> 10
<211> 1002
<212> DNA
<213> Brassica napus - <220>
<221> misc_feature
<222> (502)..(502)
<223> where n is an insertion/deletion [+/ATCACGCACCTGCAAATGT] - <400> 10

- <210> 11
<211> 1001
<212> DNA
<213> Brassica napus - <400> 11

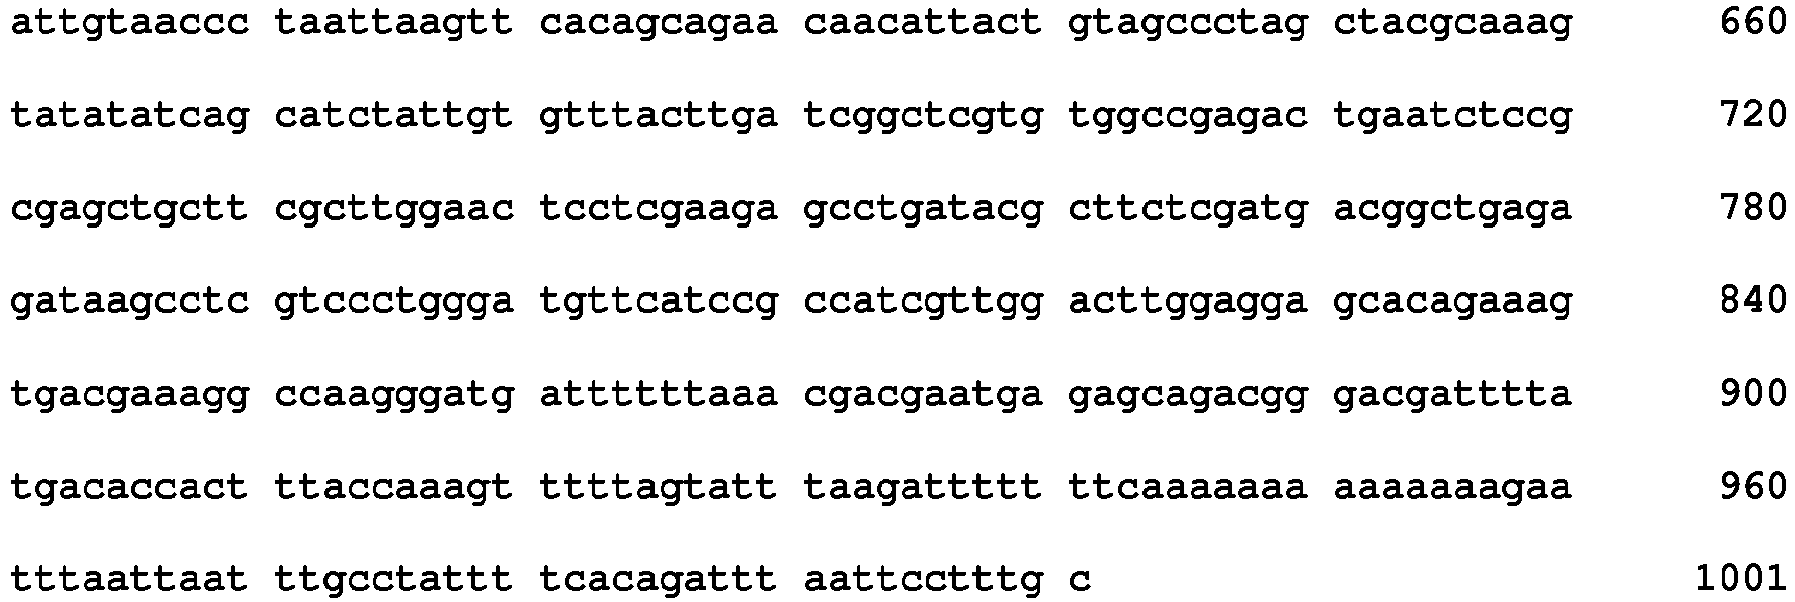
- <210> 12
<211> 1001
<212> DNA
<213> Brassica napus - <400> 12

- <210> 13
<211> 1001
<212> DNA
<213> Brassica napus - <400> 13

- <210> 14
<211> 1001
<212> DNA
<213> Brassica napus - <400> 14

- <210> 15
<211> 1001
<212> DNA
<213> Brassica napus - <400> 15

- <210> 16
<211> 1001
<212> DNA
<213> Brassica napus - <400> 16


- <210> 17
<211> 121
<212> DNA
<213> Brassica napus - <400> 17

- <210> 18
<211> 1001
<212> DNA
<213> Brassica napus - <400> 18

- <210> 19
<211> 1001
<212> DNA
<213> Brassica napus - <400> 19

- <210> 20
<211> 1001
<212> DNA
<213> Brassica napus - <400> 20

- <210> 21
<211> 1001
<212> DNA
<213> Brassica napus - <400> 21


- <210> 22
<211> 1001
<212> DNA
<213> Brassica napus - <400> 22

- <210> 23
<211> 1001
<212> DNA
<213> Brassica napus - <400> 23

- <210> 24
<211> 1001
<212> DNA
<213> Brassica napus - <400> 24

- <210> 25
<211> 1001
<212> DNA
<213> Brassica napus - <400> 25

- <210> 26
<211> 1001
<212> DNA
<213> Brassica napus - <400> 26

- <210> 27
<211> 1001
<212> DNA
<213> Brassica napus - <400> 27
- <210> 28
<211> 1002
<212> DNA
<213> Brassica napus - <220>
<221> misc_feature
<222> (502)..(502)
<223> where n is an insertion/deletion [+/TT] - <400> 28
- <210> 29
<211> 1001
<212> DNA
<213> Brassica napus - <400> 29

- <210> 30
<211> 1001
<212> DNA
<213> Brassica napus - <400> 30


- <210> 31
<211> 1001
<212> DNA
<213> Brassica napus - <400> 31

- <210> 32
<211> 1002
<212> DNA
<213> Brassica napus - <220>
<221> misc_feature
<222> (502)..(502)
<223> where n is an insertion/deletion [+/A] - <400> 32

- <210> 33
<211> 1001
<212> DNA
<213> Brassica napus - <400> 33
- <210> 34
<211> 1001
<212> DNA
<213> Brassica napus - <220>
<221> misc_feature
<222> (501)..(501)
<223> where n is an insertion/deletion [-/T] - <400> 34

- <210> 35
<211> 1001
<212> DNA
<213> Brassica napus - <400> 35
- <210> 36
<211> 1001
<212> DNA
<213> Brassica napus - <400> 36


- <210> 37
<211> 1001
<212> DNA
<213> Brassica napus - <400> 37

- <210> 38
<211> 1001
<212> DNA
<213> Brassica napus - <400> 38

- <210> 39
<211> 685
<212> DNA
<213> Brassica napus - <400> 39


- <210> 40
<211> 1001
<212> DNA
<213> Brassica napus - <400> 40

- <210> 41
<211> 1001
<212> DNA
<213> Brassica napus - <400> 41

- <210> 42
<211> 1001
<212> DNA
<213> Brassica napus - <400> 42

- <210> 43
<211> 1001
<212> DNA
<213> Brassica napus - <400> 43

- <210> 44
<211> 1001
<212> DNA
<213> Brassica napus - <400> 44
- <210> 45
<211> 1002
<212> DNA
<213> Brassica napus - <220>
<221> misc-feature
<222> (502)..(502)
<223> where n is an insertion/deletion [+/T] - <400> 45
- <210> 46
<211> 1001
<212> DNA
<213> Brassica napus - <400> 46

- <210> 47
<211> 1001
<212> DNA
<213> Brassica napus - <400> 47


- <210> 48
<211> 1001
<212> DNA
<213> Brassica napus - <400> 48

- <210> 49
<211> 1001
<212> DNA
<213> Brassica napus - <400> 49

- <210> 50
<211> 1001
<212> DNA
<213> Brassica napus - <400> 50


- <210> 51
<211> 1001
<212> DNA
<213> Brassica napus - <400> 51

- <210> 52
<211> 1002
<212> DNA
<213> Brassica napus - <220>
<221> misc-feature
<222> (502)..(502)
<223> where n is an insertion/deletion [+/A] - <400> 52

- <210> 53
<211> 1001
<212> DNA
<213> Brassica napus - <400> 53


- <210> 54
<211> 1001
<212> DNA
<213> Brassica napus - <400> 54

- <210> 55
<211> 1001
<212> DNA
<213> Brassica napus - <400> 55

- <210> 56
<211> 1001
<212> DNA
<213> Brassica napus - <400> 56


- <210> 57
<211> 1001
<212> DNA
<213> Brassica napus - <400> 57
- <210> 58
<211> 1001
<212> DNA
<213> Brassica napus - <400> 58

- <210> 59
<211> 1001
<212> DNA
<213> Brassica napus - <400> 59


- <210> 60
<211> 1001
<212> DNA
<213> Brassica napus - <400> 60

- <210> 61
<211> 1001
<212> DNA
<213> Brassica napus - <400> 61

- <210> 62
<211> 1002
<212> DNA
<213> Brassica napus - <220>
<221> misc-feature
<222> (502)..(502)
<223> where n is an insertion/deletion [+/A] - <400> 62

- <210> 63
<211> 1001
<212> DNA
<213> Brassica napus - <400> 63

- <210> 64
<211> 1001
<212> DNA
<213> Brassica napus - <400> 64

- <210> 65
<211> 1001
<212> DNA
<213> Brassica napus - <400> 65


- <210> 66
<211> 1001
<212> DNA
<213> Brassica napus - <400> 66

- <210> 67
<211> 1001
<212> DNA
<213> Brassica napus - <400> 67

- <210> 68
<211> 1001
<212> DNA
<213> Brassica napus - <400> 68


- <210> 69
<211> 1001
<212> DNA
<213> Brassica napus - <400> 69

- <210> 70
<211> 1001
<212> DNA
<213> Brassica napus - <400> 70
- <210> 71
<211> 121
<212> DNA
<213> Brassica napus - <400> 71

- <210> 72
<211> 1001
<212> DNA
<213> Brassica napus - <400> 72

- <210> 73
<211> 1001
<212> DNA
<213> Brassica napus - <400> 73

- <210> 74
<211> 1001
<212> DNA
<213> Brassica napus - <400> 74

- <210> 75
<211> 1001
<212> DNA
<213> Brassica napus - <400> 75

- <210> 76
<211> 1001
<212> DNA
<213> Brassica napus - <400> 76

- <210> 77
<211> 1001
<212> DNA
<213> Brassica napus - <400> 77
- <210> 78
<211> 1001
<212> DNA
<213> Brassica napus - <400> 78

- <210> 79
<211> 1001
<212> DNA
<213> Brassica napus - <400> 79

- <210> 80
<211> 760
<212> DNA
<213> Brassica napus - <400> 80

- <210> 81
<211> 201
<212> DNA
<213> Brassica napus - <400> 81

- <210> 82
<211> 121
<212> DNA
<213> Brassica napus - <400> 82

- <210> 83
<211> 121
<212> DNA
<213> Brassica napus - <400> 83

- <210> 84
<211> 121
<212> DNA
<213> Brassica napus - <400> 84
- <210> 85
<211> 121
<212> DNA
<213> Brassica napus - <400> 85
- <210> 86
<211> 121
<212> DNA
<213> Brassica napus - <400> 86

- <210> 87
<211> 121
<212> DNA
<213> Brassica napus - <400> 87

- <210> 88
<211> 1001
<212> DNA
<213> Brassica napus - <400> 88
- <210> 89
<211> 201
<212> DNA
<213> Brassica napus - <400> 89

- <210> 90
<211> 301
<212> DNA
<213> Brassica napus - <400> 90

- <210> 91
<211> 229
<212> DNA
<213> Brassica napus - <400> 91
- <210> 92
<211> 229
<212> DNA
<213> Brassica napus - <400> 92

- <210> 93
<211> 121
<212> DNA
<213> Brassica napus - <400> 93
- <210> 94
<211> 121
<212> DNA
<213> Brassica napus - <400> 94

- <210> 95
<211> 970
<212> DNA
<213> Brassica napus - <400> 95

- <210> 96
<211> 201
<212> DNA
<213> Brassica napus - <400> 96

- <210> 97
<211> 301
<212> DNA
<213> Brassica napus - <400> 97

- <210> 98
<211> 121
<212> DNA
<213> Brassica napus - <400> 98

- <210> 99
<211> 698
<212> DNA
<213> Brassica napus - <400> 99
- <210> 100
<211> 749
<212> DNA
<213> Brassica napus - <400> 100

- <210> 101
<211> 574
<212> DNA
<213> Brassica napus - <400> 101

- <210> 102
<211> 524
<212> DNA
<213> Brassica napus - <400> 102

- <210> 103
<211> 681
<212> DNA
<213> Brassica napus - <400> 103

- <210> 104
<211> 519
<212> DNA
<213> Brassica napus - <400> 104

- <210> 105
<211> 946
<212> DNA
<213> Brassica napus - <400> 105

- <210> 106
<211> 121
<212> DNA
<213> Brassica napus - <400> 106
- <210> 107
<211> 121
<212> DNA
<213> Brassica napus - <400> 107

- <210> 108
<211> 408
<212> DNA
<213> Brassica napus - <400> 108

- <210> 109
<211> 301
<212> DNA
<213> Brassica napus - <400> 109

- <210> 110
<211> 301
<212> DNA
<213> Brassica napus - <220>
<221> misc_feature
<222> (242)..(271)
<223> where n is a, t, c, or g - <400> 110

- <210> 111
<211> 1212
<212> DNA
<213> Brassica napus - <220>
<221> misc_feature
<222> (78)..(78)
<223> where n is a, t, c, or g - <220>
<221> misc_feature
<222> (1113)..(1113)
<223> where n is a, t, c, or g - <400> 111
Claims (5)
- Use of an isolated nucleic acid having a sequence associated with low acid detergent fiber content in Brassica napus, wherein the isolated nucleic acid is selected from the group consisting of SEQ ID NOs: 1-111, for selecting a Brassica napus plant or germplasm that comprises a low acid detergent fiber content, wherein the Brassica napus plant comprises low acid detergent fiber content derived from line YN01-429.
- The use of claim 1, wherein the isolated nucleic acid is selected from the group consisting of SEQ ID NO:15, SEQ ID NO:16, SEQ ID NO:18, SEQ ID NO:19, SEQ ID NO:20, SEQ ID NO:22, SEQ ID NO:23, SEQ ID NO:25, SEQ ID NO:26, SEQ ID NO:35, SEQ ID NO:38, SEQ ID NO:41, SEQ ID NO:43, SEQ ID NO:44, SEQ ID NO:45, SEQ ID NO:46, SEQ ID NO:47, SEQ ID NO:48, SEQ ID NO:49, SEQ ID NO:63, SEQ ID NO:72, SEQ ID NO:73, SEQ ID NO:75, SEQ ID NO:76, SEQ ID NO:77, SEQ ID NO:78, and SEQ ID NO:79.
- A method for selecting a Brassica napus plant or germplasm that comprises a low acid detergent fiber content, the method comprising:
selecting a Brassica napus plant or germplasm based on the presence in the plant or germplasm of a SNP in a nucleic acid selected from the group consisting of SEQ ID NOs:1-111, wherein the Brassica napus plant or germplasm comprises low acid detergent fiber content and YSC traits from the YSC line YN01-429. - The method according to claim 3, wherein the nucleic acid is selected from the group consisting of SEQ ID NO:15, SEQ ID NO:16, SEQ ID NO:18, SEQ ID NO:19, SEQ ID NO:20, SEQ ID NO:22, SEQ ID NO:23, SEQ ID NO:25, SEQ ID NO:26, SEQ ID NO:35, SEQ ID NO:38, SEQ ID NO:41, SEQ ID NO:43, SEQ ID NO:44, SEQ ID NO:45, SEQ ID NO:46, SEQ ID NO:47, SEQ ID NO:48, SEQ ID NO:49, SEQ ID NO:63, SEQ ID NO:72, SEQ ID NO:73, SEQ ID NO:75, SEQ ID NO:76, SEQ ID NO:77, SEQ ID NO:78, and SEQ ID NO:79.
- The method according to any one of claims 3-4, wherein the Brassica napus plant or germplasm is selected on the basis of presence or absence of a haplotype comprising a plurality of the marker alleles.
Priority Applications (3)
| Application Number | Priority Date | Filing Date | Title |
|---|---|---|---|
| EP20206561.1A EP3831955A1 (en) | 2014-12-18 | 2015-12-18 | Fine mapping and validation of qtl underlying fiber content and seed coat color traits and identification of snp markers for marker assisted selection of these traits derived from yellow seed coat (ysc) canola line yn01-429 and its lineage |
| PL15871207T PL3234197T3 (en) | 2014-12-18 | 2015-12-18 | Fine mapping and validation of qtl underlying fiber content and seed coat color traits and identification of snp markers for marker assisted selection of these traits derived from yellow seed coat (ysc) canola line yn01-429 and its lineage |
| RS20210024A RS61283B1 (en) | 2014-12-18 | 2015-12-18 | Fine mapping and validation of qtl underlying fiber content and seed coat color traits and identification of snp markers for marker assisted selection of these traits derived from yellow seed coat (ysc) canola line yn01-429 and its lineage |
Applications Claiming Priority (2)
| Application Number | Priority Date | Filing Date | Title |
|---|---|---|---|
| US201462093963P | 2014-12-18 | 2014-12-18 | |
| PCT/US2015/066813 WO2016100883A1 (en) | 2014-12-18 | 2015-12-18 | Fine mapping and validation of qtl underlying fiber content and seed coat color traits and identification of snp markers for marker assisted selection of these traits derived from yellow seed coat (ysc) canola line yn01-429 and its lineage |
Related Child Applications (2)
| Application Number | Title | Priority Date | Filing Date |
|---|---|---|---|
| EP20206561.1A Division-Into EP3831955A1 (en) | 2014-12-18 | 2015-12-18 | Fine mapping and validation of qtl underlying fiber content and seed coat color traits and identification of snp markers for marker assisted selection of these traits derived from yellow seed coat (ysc) canola line yn01-429 and its lineage |
| EP20206561.1A Division EP3831955A1 (en) | 2014-12-18 | 2015-12-18 | Fine mapping and validation of qtl underlying fiber content and seed coat color traits and identification of snp markers for marker assisted selection of these traits derived from yellow seed coat (ysc) canola line yn01-429 and its lineage |
Publications (4)
| Publication Number | Publication Date |
|---|---|
| EP3234197A1 EP3234197A1 (en) | 2017-10-25 |
| EP3234197A4 EP3234197A4 (en) | 2018-06-13 |
| EP3234197B1 EP3234197B1 (en) | 2020-11-11 |
| EP3234197B2 true EP3234197B2 (en) | 2024-04-24 |
Family
ID=56127712
Family Applications (2)
| Application Number | Title | Priority Date | Filing Date |
|---|---|---|---|
| EP20206561.1A Pending EP3831955A1 (en) | 2014-12-18 | 2015-12-18 | Fine mapping and validation of qtl underlying fiber content and seed coat color traits and identification of snp markers for marker assisted selection of these traits derived from yellow seed coat (ysc) canola line yn01-429 and its lineage |
| EP15871207.5A Active EP3234197B2 (en) | 2014-12-18 | 2015-12-18 | Fine mapping and validation of qtl underlying fiber content and seed coat color traits and identification of snp markers for marker assisted selection of these traits derived from yellow seed coat (ysc) canola line yn01-429 and its lineage |
Family Applications Before (1)
| Application Number | Title | Priority Date | Filing Date |
|---|---|---|---|
| EP20206561.1A Pending EP3831955A1 (en) | 2014-12-18 | 2015-12-18 | Fine mapping and validation of qtl underlying fiber content and seed coat color traits and identification of snp markers for marker assisted selection of these traits derived from yellow seed coat (ysc) canola line yn01-429 and its lineage |
Country Status (14)
| Country | Link |
|---|---|
| US (3) | US10791692B2 (en) |
| EP (2) | EP3831955A1 (en) |
| CN (1) | CN107002144A (en) |
| AR (1) | AR103166A1 (en) |
| AU (3) | AU2015364304B2 (en) |
| CA (1) | CA2969547A1 (en) |
| CL (1) | CL2017001409A1 (en) |
| ES (1) | ES2843271T3 (en) |
| HU (1) | HUE052648T2 (en) |
| PL (1) | PL3234197T3 (en) |
| RS (1) | RS61283B1 (en) |
| RU (1) | RU2017118904A (en) |
| TW (1) | TW201629228A (en) |
| WO (1) | WO2016100883A1 (en) |
Families Citing this family (6)
| Publication number | Priority date | Publication date | Assignee | Title |
|---|---|---|---|---|
| RS61283B1 (en) | 2014-12-18 | 2021-02-26 | Dow Agrosciences Llc | Fine mapping and validation of qtl underlying fiber content and seed coat color traits and identification of snp markers for marker assisted selection of these traits derived from yellow seed coat (ysc) canola line yn01-429 and its lineage |
| CN108531562A (en) * | 2018-04-20 | 2018-09-14 | 青海省农林科学院 | A method of auxiliary identification broad bean seed coat is without tannin character |
| WO2020131600A1 (en) * | 2018-12-20 | 2020-06-25 | Agrigenetics, Inc. | Snp markers and selection of low fiber in brassica |
| CN111118203B (en) * | 2020-02-25 | 2023-04-14 | 贵州省油菜研究所 | A06 chromosome major QTL site with first effective branching number character of brassica napus, SNP molecular marker and application |
| CN113652499B (en) * | 2021-09-16 | 2023-06-09 | 中国农业科学院油料作物研究所 | Molecular marker closely linked with rape selenium efficient property main effect QTL locus qSe.C07 and application |
| CN114457184A (en) * | 2022-02-21 | 2022-05-10 | 广东省农业科学院蔬菜研究所 | SNP molecular marker and KASP primer for identifying color of luffa seed coat and application thereof |
Family Cites Families (8)
| Publication number | Priority date | Publication date | Assignee | Title |
|---|---|---|---|---|
| JP5313672B2 (en) * | 2005-08-01 | 2013-10-09 | ハー マジェスティ ザ クイーン イン ライト オブ カナダ アズ リプレゼンティッド バイ ザ ミニスター オブ アグリカルチャー アンド アグリ−フード カナダ | Low fiber yellow canola seeds containing high oleic and low linolenic oils |
| WO2008101342A1 (en) * | 2007-02-21 | 2008-08-28 | University Of Manitoba | Brassica rapa transparent testa genes for controlling seed colour in brassica species |
| CN102021235B (en) * | 2010-03-10 | 2013-03-27 | 华中农业大学 | Brassica napus L. grain weight major QTLs molecular marker and application thereof |
| CN101962640B (en) * | 2010-05-04 | 2013-03-27 | 华中农业大学 | Specific molecular markers of related genes of brassica napus grain weight and application thereof |
| CN102703438B (en) * | 2010-05-04 | 2013-11-06 | 华中农业大学 | Molecular marker of brassica napus L. grain weight character and preparation method and application |
| EP2655657B1 (en) * | 2010-12-22 | 2018-12-05 | Pioneer Hi-Bred International, Inc. | QTLs ASSOCIATED WITH AND METHODS FOR IDENTIFYING WHOLE PLANT FIELD RESISTANCE TO SCLEROTINIA |
| CN102226189B (en) * | 2011-06-09 | 2012-11-21 | 中国农业科学院油料作物研究所 | Seed number per pod character major gene site of rape and application thereof |
| RS61283B1 (en) | 2014-12-18 | 2021-02-26 | Dow Agrosciences Llc | Fine mapping and validation of qtl underlying fiber content and seed coat color traits and identification of snp markers for marker assisted selection of these traits derived from yellow seed coat (ysc) canola line yn01-429 and its lineage |
-
2015
- 2015-12-18 RS RS20210024A patent/RS61283B1/en unknown
- 2015-12-18 PL PL15871207T patent/PL3234197T3/en unknown
- 2015-12-18 AU AU2015364304A patent/AU2015364304B2/en active Active
- 2015-12-18 TW TW104142791A patent/TW201629228A/en unknown
- 2015-12-18 EP EP20206561.1A patent/EP3831955A1/en active Pending
- 2015-12-18 CN CN201580065324.6A patent/CN107002144A/en active Pending
- 2015-12-18 AR ARP150104185A patent/AR103166A1/en unknown
- 2015-12-18 US US15/731,561 patent/US10791692B2/en active Active
- 2015-12-18 HU HUE15871207A patent/HUE052648T2/en unknown
- 2015-12-18 WO PCT/US2015/066813 patent/WO2016100883A1/en active Application Filing
- 2015-12-18 EP EP15871207.5A patent/EP3234197B2/en active Active
- 2015-12-18 CA CA2969547A patent/CA2969547A1/en active Pending
- 2015-12-18 ES ES15871207T patent/ES2843271T3/en active Active
- 2015-12-18 RU RU2017118904A patent/RU2017118904A/en not_active Application Discontinuation
-
2017
- 2017-06-02 CL CL2017001409A patent/CL2017001409A1/en unknown
-
2019
- 2019-02-08 AU AU2019200923A patent/AU2019200923B2/en active Active
-
2020
- 2020-10-06 US US17/064,284 patent/US11713490B2/en active Active
-
2021
- 2021-10-07 AU AU2021245186A patent/AU2021245186A1/en active Pending
-
2023
- 2023-06-29 US US18/344,018 patent/US20230407417A1/en active Pending
Non-Patent Citations (2)
| Title |
|---|
| CLARKE WAYNE E.ET AL: "Genomic DNA Enrichment Using Sequence Capture Microarrays: a Novel Approach to Discover Sequence Nucleotide Polymorphisms (SNP) in Brassica napus L", PLOS ONE, vol. 8, no. 12, 2013, pages 1 - 14 † |
| LIU LIEZHAO ET AL: "A High-Density SNP Map for Accurate Mapping of Seed Fibre QTL in Brassica napus L", PLOS ONE, vol. 8, no. 12, 2013, pages 1 - 19, DOI: 10.1371/journal.pone.0083052 † |
Also Published As
| Publication number | Publication date |
|---|---|
| AU2015364304A1 (en) | 2017-06-01 |
| HUE052648T2 (en) | 2021-05-28 |
| AU2019200923A1 (en) | 2019-02-28 |
| ES2843271T3 (en) | 2021-07-16 |
| CN107002144A (en) | 2017-08-01 |
| AU2015364304B2 (en) | 2018-11-08 |
| RS61283B1 (en) | 2021-02-26 |
| AR103166A1 (en) | 2017-04-19 |
| CA2969547A1 (en) | 2016-06-23 |
| PL3234197T3 (en) | 2021-04-19 |
| EP3234197A4 (en) | 2018-06-13 |
| AU2019200923B2 (en) | 2021-07-08 |
| US11713490B2 (en) | 2023-08-01 |
| CL2017001409A1 (en) | 2018-01-05 |
| US20230407417A1 (en) | 2023-12-21 |
| EP3831955A1 (en) | 2021-06-09 |
| EP3234197A1 (en) | 2017-10-25 |
| AU2021245186A1 (en) | 2021-11-04 |
| WO2016100883A1 (en) | 2016-06-23 |
| US10791692B2 (en) | 2020-10-06 |
| US20170332593A1 (en) | 2017-11-23 |
| US20210092921A1 (en) | 2021-04-01 |
| TW201629228A (en) | 2016-08-16 |
| RU2017118904A (en) | 2019-01-18 |
| EP3234197B1 (en) | 2020-11-11 |
Similar Documents
| Publication | Publication Date | Title |
|---|---|---|
| US11713490B2 (en) | Marker assisted selection of traits for producing meal from Brassica napus | |
| CN101090970B (en) | There is the high yielding soybean plants of low linolenic | |
| CN101415841A (en) | Prediction of heterosis and other traits by transcriptome analysis | |
| CN103975841B (en) | The soybean with high β conglycinins content of Agronomically elite | |
| CN110157829B (en) | Molecular marker SNPA9-5 associated with thousand seed weight of rape and application | |
| CN110184373B (en) | Molecular marker associated with thousand seed weight of rape and application thereof | |
| Esuma et al. | Genetic diversity of provitamin A cassava in Uganda | |
| US20210169029A1 (en) | Brassica plant with pod shattering tolerance | |
| CN107624135A (en) | The Brassica plants of seed oil composition with modification | |
| Meng et al. | Ploidy effect and genetic architecture exploration of stalk traits using DH and its corresponding haploid populations in maize | |
| Asekova et al. | Novel quantitative trait loci for forage quality traits in a cross between PI 483463 and ‘Hutcheson’in soybean | |
| KINGSTON‐SMITH et al. | Strategies of plant breeding for improved rumen function | |
| WO2011084047A2 (en) | Identification of molecular markers associated with fatty acid composition in plants | |
| Wolko et al. | Genetic variation of traits affecting meal quality in black× yellow seeded doubled haploid population of winter oilseed rape | |
| CN114480721B (en) | Method for identifying whether melon variety to be detected is thin-skin melon or thick-skin melon and special SNP primer combination thereof | |
| Arnold et al. | Mining QTLs for elevated protein and other major seed composition traits from diverse soybean germplasm | |
| US20220017975A1 (en) | Snp markers and selection of low fiber in brassica | |
| Snape et al. | The impact of genomics and genetics on wheat quality improvement | |
| Muktar et al. | Genetic diversity among and within accessions of a lablab (Lablab purpureus) collection maintained in the ILRI forage genebank | |
| WO2024076956A2 (en) | N15 deletion qtl for low fiber, compositions and methods in brassica | |
| Prenger | Genetic improvement of soybean seed composition | |
| Shrestha | Understanding the Genetic Basis of Shattering in Pearl Millet | |
| Erasmus | Genetic diversity of proprietary inbred lines of sunflower, determined by mapped SSR markers and total protein analysis. | |
| Ferrara et al. | Breeding Innovations in Underutilized Temperate Fruit Trees | |
| NAHARUDIN | GENETICS AND QUANTITATIVE TRAIT LOCI MAPPING OF BIOMASS YIELD AND QUALITY TRAITS IN MAIZE (Zea mays L.) FOR FORAGE UTILIZATION |
Legal Events
| Date | Code | Title | Description |
|---|---|---|---|
| STAA | Information on the status of an ep patent application or granted ep patent |
Free format text: STATUS: THE INTERNATIONAL PUBLICATION HAS BEEN MADE |
|
| PUAI | Public reference made under article 153(3) epc to a published international application that has entered the european phase |
Free format text: ORIGINAL CODE: 0009012 |
|
| STAA | Information on the status of an ep patent application or granted ep patent |
Free format text: STATUS: REQUEST FOR EXAMINATION WAS MADE |
|
| 17P | Request for examination filed |
Effective date: 20170530 |
|
| AK | Designated contracting states |
Kind code of ref document: A1 Designated state(s): AL AT BE BG CH CY CZ DE DK EE ES FI FR GB GR HR HU IE IS IT LI LT LU LV MC MK MT NL NO PL PT RO RS SE SI SK SM TR |
|
| AX | Request for extension of the european patent |
Extension state: BA ME |
|
| RIN1 | Information on inventor provided before grant (corrected) |
Inventor name: FLOOK, JOSH Inventor name: GARCIA, DANIEL Inventor name: PARLIAMENT, KELLY Inventor name: ROUNSLEY, STEVE Inventor name: TANG, SHUNXUE Inventor name: EHLERT, ZOE Inventor name: RIPLEY, VAN Inventor name: KNIEVEL, DONNA Inventor name: WIGGINS, MICHELLE Inventor name: RIZVI, SYED, MASOOD Inventor name: OCHSENFELD, CHERIE Inventor name: TAHIR, MUHAMMAD Inventor name: PREUSS, RYAN Inventor name: PATTERSON, TOM, G. |
|
| DAV | Request for validation of the european patent (deleted) | ||
| DAX | Request for extension of the european patent (deleted) | ||
| A4 | Supplementary search report drawn up and despatched |
Effective date: 20180515 |
|
| RIC1 | Information provided on ipc code assigned before grant |
Ipc: C12N 15/29 20060101ALI20180508BHEP Ipc: A23L 19/00 20160101ALI20180508BHEP Ipc: A01H 5/10 20060101ALI20180508BHEP Ipc: C12Q 1/68 20060101AFI20180508BHEP |
|
| STAA | Information on the status of an ep patent application or granted ep patent |
Free format text: STATUS: EXAMINATION IS IN PROGRESS |
|
| 17Q | First examination report despatched |
Effective date: 20190517 |
|
| GRAP | Despatch of communication of intention to grant a patent |
Free format text: ORIGINAL CODE: EPIDOSNIGR1 |
|
| STAA | Information on the status of an ep patent application or granted ep patent |
Free format text: STATUS: GRANT OF PATENT IS INTENDED |
|
| RIC1 | Information provided on ipc code assigned before grant |
Ipc: A01H 5/10 20180101ALI20200116BHEP Ipc: C12N 15/29 20060101ALI20200116BHEP Ipc: C12Q 1/6895 20180101AFI20200116BHEP Ipc: A23L 19/00 20160101ALI20200116BHEP |
|
| INTG | Intention to grant announced |
Effective date: 20200203 |
|
| TPAC | Observations filed by third parties |
Free format text: ORIGINAL CODE: EPIDOSNTIPA |
|
| GRAJ | Information related to disapproval of communication of intention to grant by the applicant or resumption of examination proceedings by the epo deleted |
Free format text: ORIGINAL CODE: EPIDOSDIGR1 |
|
| STAA | Information on the status of an ep patent application or granted ep patent |
Free format text: STATUS: EXAMINATION IS IN PROGRESS |
|
| INTC | Intention to grant announced (deleted) | ||
| RIC1 | Information provided on ipc code assigned before grant |
Ipc: A01H 1/04 20060101AFI20200710BHEP |
|
| REG | Reference to a national code |
Ref country code: DE Ref legal event code: R079 Ref document number: 602015061997 Country of ref document: DE Free format text: PREVIOUS MAIN CLASS: C12Q0001680000 Ipc: C12Q0001689500 |
|
| RIC1 | Information provided on ipc code assigned before grant |
Ipc: A01H 5/10 20180101AFI20200730BHEP |
|
| GRAS | Grant fee paid |
Free format text: ORIGINAL CODE: EPIDOSNIGR3 |
|
| STAA | Information on the status of an ep patent application or granted ep patent |
Free format text: STATUS: GRANT OF PATENT IS INTENDED |
|
| GRAP | Despatch of communication of intention to grant a patent |
Free format text: ORIGINAL CODE: EPIDOSNIGR1 |
|
| RIC1 | Information provided on ipc code assigned before grant |
Ipc: A01H 5/10 20180101ALI20200902BHEP Ipc: A01H 1/04 20060101ALI20200902BHEP Ipc: C12Q 1/6895 20180101AFI20200902BHEP |
|
| GRAA | (expected) grant |
Free format text: ORIGINAL CODE: 0009210 |
|
| STAA | Information on the status of an ep patent application or granted ep patent |
Free format text: STATUS: THE PATENT HAS BEEN GRANTED |
|
| INTG | Intention to grant announced |
Effective date: 20200917 |
|
| AK | Designated contracting states |
Kind code of ref document: B1 Designated state(s): AL AT BE BG CH CY CZ DE DK EE ES FI FR GB GR HR HU IE IS IT LI LT LU LV MC MK MT NL NO PL PT RO RS SE SI SK SM TR |
|
| REG | Reference to a national code |
Ref country code: GB Ref legal event code: FG4D |
|
| REG | Reference to a national code |
Ref country code: CH Ref legal event code: EP |
|
| REG | Reference to a national code |
Ref country code: AT Ref legal event code: REF Ref document number: 1333528 Country of ref document: AT Kind code of ref document: T Effective date: 20201115 |
|
| REG | Reference to a national code |
Ref country code: DE Ref legal event code: R096 Ref document number: 602015061997 Country of ref document: DE |
|
| REG | Reference to a national code |
Ref country code: IE Ref legal event code: FG4D |
|
| REG | Reference to a national code |
Ref country code: RO Ref legal event code: EPE |
|
| REG | Reference to a national code |
Ref country code: SK Ref legal event code: T3 Ref document number: E 36188 Country of ref document: SK |
|
| REG | Reference to a national code |
Ref country code: NL Ref legal event code: MP Effective date: 20201111 |
|
| REG | Reference to a national code |
Ref country code: AT Ref legal event code: MK05 Ref document number: 1333528 Country of ref document: AT Kind code of ref document: T Effective date: 20201111 |
|
| PG25 | Lapsed in a contracting state [announced via postgrant information from national office to epo] |
Ref country code: GR Free format text: LAPSE BECAUSE OF FAILURE TO SUBMIT A TRANSLATION OF THE DESCRIPTION OR TO PAY THE FEE WITHIN THE PRESCRIBED TIME-LIMIT Effective date: 20210212 Ref country code: NO Free format text: LAPSE BECAUSE OF FAILURE TO SUBMIT A TRANSLATION OF THE DESCRIPTION OR TO PAY THE FEE WITHIN THE PRESCRIBED TIME-LIMIT Effective date: 20210211 Ref country code: FI Free format text: LAPSE BECAUSE OF FAILURE TO SUBMIT A TRANSLATION OF THE DESCRIPTION OR TO PAY THE FEE WITHIN THE PRESCRIBED TIME-LIMIT Effective date: 20201111 Ref country code: PT Free format text: LAPSE BECAUSE OF FAILURE TO SUBMIT A TRANSLATION OF THE DESCRIPTION OR TO PAY THE FEE WITHIN THE PRESCRIBED TIME-LIMIT Effective date: 20210311 |
|
| REG | Reference to a national code |
Ref country code: HU Ref legal event code: AG4A Ref document number: E052648 Country of ref document: HU |
|
| PG25 | Lapsed in a contracting state [announced via postgrant information from national office to epo] |
Ref country code: AT Free format text: LAPSE BECAUSE OF FAILURE TO SUBMIT A TRANSLATION OF THE DESCRIPTION OR TO PAY THE FEE WITHIN THE PRESCRIBED TIME-LIMIT Effective date: 20201111 Ref country code: LV Free format text: LAPSE BECAUSE OF FAILURE TO SUBMIT A TRANSLATION OF THE DESCRIPTION OR TO PAY THE FEE WITHIN THE PRESCRIBED TIME-LIMIT Effective date: 20201111 Ref country code: IS Free format text: LAPSE BECAUSE OF FAILURE TO SUBMIT A TRANSLATION OF THE DESCRIPTION OR TO PAY THE FEE WITHIN THE PRESCRIBED TIME-LIMIT Effective date: 20210311 Ref country code: SE Free format text: LAPSE BECAUSE OF FAILURE TO SUBMIT A TRANSLATION OF THE DESCRIPTION OR TO PAY THE FEE WITHIN THE PRESCRIBED TIME-LIMIT Effective date: 20201111 |
|
| REG | Reference to a national code |
Ref country code: LT Ref legal event code: MG9D |
|
| PG25 | Lapsed in a contracting state [announced via postgrant information from national office to epo] |
Ref country code: HR Free format text: LAPSE BECAUSE OF FAILURE TO SUBMIT A TRANSLATION OF THE DESCRIPTION OR TO PAY THE FEE WITHIN THE PRESCRIBED TIME-LIMIT Effective date: 20201111 |
|
| REG | Reference to a national code |
Ref country code: ES Ref legal event code: FG2A Ref document number: 2843271 Country of ref document: ES Kind code of ref document: T3 Effective date: 20210716 |
|
| PG25 | Lapsed in a contracting state [announced via postgrant information from national office to epo] |
Ref country code: SM Free format text: LAPSE BECAUSE OF FAILURE TO SUBMIT A TRANSLATION OF THE DESCRIPTION OR TO PAY THE FEE WITHIN THE PRESCRIBED TIME-LIMIT Effective date: 20201111 Ref country code: LT Free format text: LAPSE BECAUSE OF FAILURE TO SUBMIT A TRANSLATION OF THE DESCRIPTION OR TO PAY THE FEE WITHIN THE PRESCRIBED TIME-LIMIT Effective date: 20201111 Ref country code: EE Free format text: LAPSE BECAUSE OF FAILURE TO SUBMIT A TRANSLATION OF THE DESCRIPTION OR TO PAY THE FEE WITHIN THE PRESCRIBED TIME-LIMIT Effective date: 20201111 |
|
| REG | Reference to a national code |
Ref country code: CH Ref legal event code: PL |
|
| REG | Reference to a national code |
Ref country code: DE Ref legal event code: R026 Ref document number: 602015061997 Country of ref document: DE |
|
| PLBI | Opposition filed |
Free format text: ORIGINAL CODE: 0009260 |
|
| PLAX | Notice of opposition and request to file observation + time limit sent |
Free format text: ORIGINAL CODE: EPIDOSNOBS2 |
|
| PG25 | Lapsed in a contracting state [announced via postgrant information from national office to epo] |
Ref country code: DK Free format text: LAPSE BECAUSE OF FAILURE TO SUBMIT A TRANSLATION OF THE DESCRIPTION OR TO PAY THE FEE WITHIN THE PRESCRIBED TIME-LIMIT Effective date: 20201111 Ref country code: MC Free format text: LAPSE BECAUSE OF FAILURE TO SUBMIT A TRANSLATION OF THE DESCRIPTION OR TO PAY THE FEE WITHIN THE PRESCRIBED TIME-LIMIT Effective date: 20201111 |
|
| REG | Reference to a national code |
Ref country code: BE Ref legal event code: MM Effective date: 20201231 |
|
| 26 | Opposition filed |
Opponent name: NEUEFEIND, REGINA Effective date: 20210809 |
|
| PG25 | Lapsed in a contracting state [announced via postgrant information from national office to epo] |
Ref country code: AL Free format text: LAPSE BECAUSE OF FAILURE TO SUBMIT A TRANSLATION OF THE DESCRIPTION OR TO PAY THE FEE WITHIN THE PRESCRIBED TIME-LIMIT Effective date: 20201111 Ref country code: IE Free format text: LAPSE BECAUSE OF NON-PAYMENT OF DUE FEES Effective date: 20201218 Ref country code: NL Free format text: LAPSE BECAUSE OF FAILURE TO SUBMIT A TRANSLATION OF THE DESCRIPTION OR TO PAY THE FEE WITHIN THE PRESCRIBED TIME-LIMIT Effective date: 20201111 Ref country code: LU Free format text: LAPSE BECAUSE OF NON-PAYMENT OF DUE FEES Effective date: 20201218 |
|
| PG25 | Lapsed in a contracting state [announced via postgrant information from national office to epo] |
Ref country code: SI Free format text: LAPSE BECAUSE OF FAILURE TO SUBMIT A TRANSLATION OF THE DESCRIPTION OR TO PAY THE FEE WITHIN THE PRESCRIBED TIME-LIMIT Effective date: 20201111 Ref country code: CH Free format text: LAPSE BECAUSE OF NON-PAYMENT OF DUE FEES Effective date: 20201231 Ref country code: LI Free format text: LAPSE BECAUSE OF NON-PAYMENT OF DUE FEES Effective date: 20201231 |
|
| REG | Reference to a national code |
Ref country code: DE Ref legal event code: R081 Ref document number: 602015061997 Country of ref document: DE Owner name: CORTEVA AGRISCIENCE LLC, INDIANAPOLIS, US Free format text: FORMER OWNER: DOW AGROSCIENCES LLC, INDIANAPOLIS, IND., US |
|
| PLBB | Reply of patent proprietor to notice(s) of opposition received |
Free format text: ORIGINAL CODE: EPIDOSNOBS3 |
|
| REG | Reference to a national code |
Ref country code: HU Ref legal event code: HC9C Owner name: CORTEVA AGRISCIENCE LLC, US Free format text: FORMER OWNER(S): DOW AGROSCIENCES LLC, US |
|
| REG | Reference to a national code |
Ref country code: SK Ref legal event code: TC4A Ref document number: E 36188 Country of ref document: SK Owner name: CORTEVA AGRISCIENCE LLC, INDIANAPOLIS, IN, US Effective date: 20220511 |
|
| PG25 | Lapsed in a contracting state [announced via postgrant information from national office to epo] |
Ref country code: IS Free format text: LAPSE BECAUSE OF FAILURE TO SUBMIT A TRANSLATION OF THE DESCRIPTION OR TO PAY THE FEE WITHIN THE PRESCRIBED TIME-LIMIT Effective date: 20210311 Ref country code: TR Free format text: LAPSE BECAUSE OF FAILURE TO SUBMIT A TRANSLATION OF THE DESCRIPTION OR TO PAY THE FEE WITHIN THE PRESCRIBED TIME-LIMIT Effective date: 20201111 Ref country code: MT Free format text: LAPSE BECAUSE OF FAILURE TO SUBMIT A TRANSLATION OF THE DESCRIPTION OR TO PAY THE FEE WITHIN THE PRESCRIBED TIME-LIMIT Effective date: 20201111 Ref country code: CY Free format text: LAPSE BECAUSE OF FAILURE TO SUBMIT A TRANSLATION OF THE DESCRIPTION OR TO PAY THE FEE WITHIN THE PRESCRIBED TIME-LIMIT Effective date: 20201111 |
|
| PG25 | Lapsed in a contracting state [announced via postgrant information from national office to epo] |
Ref country code: MK Free format text: LAPSE BECAUSE OF FAILURE TO SUBMIT A TRANSLATION OF THE DESCRIPTION OR TO PAY THE FEE WITHIN THE PRESCRIBED TIME-LIMIT Effective date: 20201111 |
|
| PG25 | Lapsed in a contracting state [announced via postgrant information from national office to epo] |
Ref country code: BE Free format text: LAPSE BECAUSE OF NON-PAYMENT OF DUE FEES Effective date: 20201231 |
|
| REG | Reference to a national code |
Ref country code: ES Ref legal event code: PC2A Owner name: CORTEVA AGRISCIENCE LLC Effective date: 20220901 |
|
| PGFP | Annual fee paid to national office [announced via postgrant information from national office to epo] |
Ref country code: SK Payment date: 20221115 Year of fee payment: 8 Ref country code: RS Payment date: 20221117 Year of fee payment: 8 Ref country code: IT Payment date: 20221111 Year of fee payment: 8 Ref country code: DE Payment date: 20221102 Year of fee payment: 8 |
|
| PGFP | Annual fee paid to national office [announced via postgrant information from national office to epo] |
Ref country code: PL Payment date: 20221117 Year of fee payment: 8 |
|
| PGFP | Annual fee paid to national office [announced via postgrant information from national office to epo] |
Ref country code: ES Payment date: 20230112 Year of fee payment: 8 |
|
| P01 | Opt-out of the competence of the unified patent court (upc) registered |
Effective date: 20230526 |
|
| PGFP | Annual fee paid to national office [announced via postgrant information from national office to epo] |
Ref country code: GB Payment date: 20231220 Year of fee payment: 9 |
|
| PGFP | Annual fee paid to national office [announced via postgrant information from national office to epo] |
Ref country code: RO Payment date: 20231128 Year of fee payment: 9 Ref country code: HU Payment date: 20231123 Year of fee payment: 9 Ref country code: FR Payment date: 20231226 Year of fee payment: 9 Ref country code: CZ Payment date: 20231122 Year of fee payment: 9 Ref country code: BG Payment date: 20231128 Year of fee payment: 9 |
|
| PUAH | Patent maintained in amended form |
Free format text: ORIGINAL CODE: 0009272 |
|
| STAA | Information on the status of an ep patent application or granted ep patent |
Free format text: STATUS: PATENT MAINTAINED AS AMENDED |
|
| PGFP | Annual fee paid to national office [announced via postgrant information from national office to epo] |
Ref country code: ES Payment date: 20240112 Year of fee payment: 9 |
|
| 27A | Patent maintained in amended form |
Effective date: 20240424 |
|
| AK | Designated contracting states |
Kind code of ref document: B2 Designated state(s): AL AT BE BG CH CY CZ DE DK EE ES FI FR GB GR HR HU IE IS IT LI LT LU LV MC MK MT NL NO PL PT RO RS SE SI SK SM TR |
|
| REG | Reference to a national code |
Ref country code: DE Ref legal event code: R102 Ref document number: 602015061997 Country of ref document: DE |