EP3220161A1 - Image generation apparatus and image generation method - Google Patents
Image generation apparatus and image generation method Download PDFInfo
- Publication number
- EP3220161A1 EP3220161A1 EP17161315.1A EP17161315A EP3220161A1 EP 3220161 A1 EP3220161 A1 EP 3220161A1 EP 17161315 A EP17161315 A EP 17161315A EP 3220161 A1 EP3220161 A1 EP 3220161A1
- Authority
- EP
- European Patent Office
- Prior art keywords
- ultrasonic
- selection range
- image
- scanning
- scan line
- Prior art date
- Legal status (The legal status is an assumption and is not a legal conclusion. Google has not performed a legal analysis and makes no representation as to the accuracy of the status listed.)
- Granted
Links
Images






Classifications
-
- G—PHYSICS
- G01—MEASURING; TESTING
- G01S—RADIO DIRECTION-FINDING; RADIO NAVIGATION; DETERMINING DISTANCE OR VELOCITY BY USE OF RADIO WAVES; LOCATING OR PRESENCE-DETECTING BY USE OF THE REFLECTION OR RERADIATION OF RADIO WAVES; ANALOGOUS ARRANGEMENTS USING OTHER WAVES
- G01S7/00—Details of systems according to groups G01S13/00, G01S15/00, G01S17/00
- G01S7/52—Details of systems according to groups G01S13/00, G01S15/00, G01S17/00 of systems according to group G01S15/00
- G01S7/52017—Details of systems according to groups G01S13/00, G01S15/00, G01S17/00 of systems according to group G01S15/00 particularly adapted to short-range imaging
- G01S7/52023—Details of receivers
- G01S7/52036—Details of receivers using analysis of echo signal for target characterisation
- G01S7/52038—Details of receivers using analysis of echo signal for target characterisation involving non-linear properties of the propagation medium or of the reflective target
-
- G—PHYSICS
- G01—MEASURING; TESTING
- G01N—INVESTIGATING OR ANALYSING MATERIALS BY DETERMINING THEIR CHEMICAL OR PHYSICAL PROPERTIES
- G01N29/00—Investigating or analysing materials by the use of ultrasonic, sonic or infrasonic waves; Visualisation of the interior of objects by transmitting ultrasonic or sonic waves through the object
- G01N29/34—Generating the ultrasonic, sonic or infrasonic waves, e.g. electronic circuits specially adapted therefor
- G01N29/348—Generating the ultrasonic, sonic or infrasonic waves, e.g. electronic circuits specially adapted therefor with frequency characteristics, e.g. single frequency signals, chirp signals
-
- G—PHYSICS
- G06—COMPUTING OR CALCULATING; COUNTING
- G06T—IMAGE DATA PROCESSING OR GENERATION, IN GENERAL
- G06T12/00—Tomographic reconstruction from projections
-
- G—PHYSICS
- G01—MEASURING; TESTING
- G01N—INVESTIGATING OR ANALYSING MATERIALS BY DETERMINING THEIR CHEMICAL OR PHYSICAL PROPERTIES
- G01N29/00—Investigating or analysing materials by the use of ultrasonic, sonic or infrasonic waves; Visualisation of the interior of objects by transmitting ultrasonic or sonic waves through the object
- G01N29/44—Processing the detected response signal, e.g. electronic circuits specially adapted therefor
- G01N29/4463—Signal correction, e.g. distance amplitude correction [DAC], distance gain size [DGS], noise filtering
-
- G—PHYSICS
- G01—MEASURING; TESTING
- G01S—RADIO DIRECTION-FINDING; RADIO NAVIGATION; DETERMINING DISTANCE OR VELOCITY BY USE OF RADIO WAVES; LOCATING OR PRESENCE-DETECTING BY USE OF THE REFLECTION OR RERADIATION OF RADIO WAVES; ANALOGOUS ARRANGEMENTS USING OTHER WAVES
- G01S7/00—Details of systems according to groups G01S13/00, G01S15/00, G01S17/00
- G01S7/52—Details of systems according to groups G01S13/00, G01S15/00, G01S17/00 of systems according to group G01S15/00
- G01S7/52017—Details of systems according to groups G01S13/00, G01S15/00, G01S17/00 of systems according to group G01S15/00 particularly adapted to short-range imaging
- G01S7/52046—Techniques for image enhancement involving transmitter or receiver
- G01S7/52047—Techniques for image enhancement involving transmitter or receiver for elimination of side lobes or of grating lobes; for increasing resolving power
-
- G—PHYSICS
- G01—MEASURING; TESTING
- G01N—INVESTIGATING OR ANALYSING MATERIALS BY DETERMINING THEIR CHEMICAL OR PHYSICAL PROPERTIES
- G01N29/00—Investigating or analysing materials by the use of ultrasonic, sonic or infrasonic waves; Visualisation of the interior of objects by transmitting ultrasonic or sonic waves through the object
- G01N29/34—Generating the ultrasonic, sonic or infrasonic waves, e.g. electronic circuits specially adapted therefor
-
- G—PHYSICS
- G01—MEASURING; TESTING
- G01N—INVESTIGATING OR ANALYSING MATERIALS BY DETERMINING THEIR CHEMICAL OR PHYSICAL PROPERTIES
- G01N29/00—Investigating or analysing materials by the use of ultrasonic, sonic or infrasonic waves; Visualisation of the interior of objects by transmitting ultrasonic or sonic waves through the object
- G01N29/44—Processing the detected response signal, e.g. electronic circuits specially adapted therefor
-
- G—PHYSICS
- G01—MEASURING; TESTING
- G01S—RADIO DIRECTION-FINDING; RADIO NAVIGATION; DETERMINING DISTANCE OR VELOCITY BY USE OF RADIO WAVES; LOCATING OR PRESENCE-DETECTING BY USE OF THE REFLECTION OR RERADIATION OF RADIO WAVES; ANALOGOUS ARRANGEMENTS USING OTHER WAVES
- G01S15/00—Systems using the reflection or reradiation of acoustic waves, e.g. sonar systems
- G01S15/88—Sonar systems specially adapted for specific applications
- G01S15/89—Sonar systems specially adapted for specific applications for mapping or imaging
- G01S15/8906—Short-range imaging systems; Acoustic microscope systems using pulse-echo techniques
- G01S15/8977—Short-range imaging systems; Acoustic microscope systems using pulse-echo techniques using special techniques for image reconstruction, e.g. FFT, geometrical transformations, spatial deconvolution, time deconvolution
-
- G—PHYSICS
- G06—COMPUTING OR CALCULATING; COUNTING
- G06T—IMAGE DATA PROCESSING OR GENERATION, IN GENERAL
- G06T2207/00—Indexing scheme for image analysis or image enhancement
- G06T2207/10—Image acquisition modality
- G06T2207/10132—Ultrasound image
Definitions
- a steering vector a ⁇ which is specified on the basis of the direction of the scan line of interest L11, is used to determine weights from the resultant correlation matrix.
- the calculated weights are then used to perform weighted summation of the signals having been received with the elements 161 and having undergone the phasing process.
- ⁇ the angle of a scan line L (scan line angle)
- the angular range of the main robe width ⁇ m associated with the scanning along the scan line L ranges from ⁇ - ⁇ /2 to ⁇ + ⁇ /2. Therefore, when the scan line angle ⁇ of each of the scan lines L is expressed by the following Expression (10), the scan lines L within the main robe can be identified by extraction of the elements in Expression (10) in accordance with the following Expression (11).
- ⁇ represents the scan angle
- ⁇ p the scan angle interval.
- Each of the angles used herein is an azimuth angle and is determined with respect, for example, to the direction corresponding to the angle of incidence of 0°.
- A ⁇ ⁇ / 2 ⁇ ⁇ / 2 + ⁇ P ⁇ ⁇ / 2 + 2 ⁇ P ... ⁇ ⁇ / 2 ⁇ ⁇ ⁇ / 2 ⁇ A ⁇ ⁇ + ⁇ / 2
- the simulations were performed under the two conditions shown in Fig. 4 .
- the transmission frequency was set at 5.0 MHz assuming a case where a shallow position close to a body surface in a measurement site is observed.
- the opening width was a fixed value of 19.2 mm, and the scan angle interval was also a fixed value of 0.05°.
- Scatterers were disposed as an object under observation at a depth level of 50 mm and at intervals of 0.5 mm. Ultrasonic measurement was performed under the above conditions to generate an ultrasonic image.
- the transmission frequency was set at 2.5 MHz assuming a case where a deep region in a measurement site is observed.
- the opening width and the scan angle interval were the same fixed values as those in the simulation condition (1).
- Scatterers were disposed as an object under observation at a depth level of 100 mm and at intervals of 3 mm. Ultrasonic measurement was performed under the above conditions to generate an ultrasonic image.
- the operation input section 310 has a transmission frequency dial 311 for inputting a transmission frequency indicating value and a measurement mode switch button 313 for selectively switching the measurement mode between a normal mode and the harmonic mode.
- Each of the transmission frequency dial 311 and the measurement mode switch button 313 is not necessarily achieved by a physical switch, such as a dial switch and a button switch, and may be achieved, for example, by a software-based key switch using a touch panel that also serves as the display section 320. In this case, the user touches and operates the touch panel to input an observation depth indicating value or switch the measurement mode (between normal mode and harmonic mode).
- Fig. 19 is a flowchart showing the procedure of the process of generating an ultrasonic image in the present embodiment. The process that will be described in this section can be achieved when the processing section 350 reads and executes the image generation program 510 from the storage section 500 and causes the sections in the image generation apparatus 10 to operate. Before ultrasonic measurement, the user puts the ultrasonic probe 16 on a body surface of the subject 2.
- step S35 After the processes in the loop A are carried out for all the scan lines of interest, necessary processing is performed on each of the resultant images associated with the corresponding scanning to generate an ultrasonic image (step S35). The processes corresponding to one frame is thus completed. The generated ultrasonic image is displayed by the display section 320 as appropriate.
- the procedure of generating an ultrasonic image is not limited to the procedure described with reference to Fig. 19 in which ultrasonic measurement corresponding to one frame is first performed and an image associated with each scanning is then sequentially generated.
- the multi-beam process in the loop A may be carried concurrently with the ultrasonic measurement in step S11. In this case, at least after the scanning corresponding to the number of selected scan lines 560 set in step S9 is completed, the process in the loop A may be initiated.
Landscapes
- Engineering & Computer Science (AREA)
- Physics & Mathematics (AREA)
- General Physics & Mathematics (AREA)
- Remote Sensing (AREA)
- Radar, Positioning & Navigation (AREA)
- Computer Networks & Wireless Communication (AREA)
- Pathology (AREA)
- Chemical & Material Sciences (AREA)
- Analytical Chemistry (AREA)
- Biochemistry (AREA)
- General Health & Medical Sciences (AREA)
- Immunology (AREA)
- Life Sciences & Earth Sciences (AREA)
- Health & Medical Sciences (AREA)
- Nonlinear Science (AREA)
- Signal Processing (AREA)
- Theoretical Computer Science (AREA)
- Ultra Sonic Daignosis Equipment (AREA)
Abstract
Description
- The present invention relates to an image generation apparatus and image generation method for generating an ultrasonic image.
- There is a known image generation apparatus of related art that scans an object with an ultrasonic beam by use of a probe having a plurality of ultrasonic elements (ultrasonic vibrators) to generate an image of the interior of a living body. To generate an image, a beamforming process of transmitting an ultrasonic wave from a body surface of a subject toward the interior of the living body and summing signals each carrying a received reflected ultrasonic wave is carried out. However, since a simple beamforming process only allows generation of a low-resolution image, a technology for obtaining a higher-resolution image has been developed. An example of the technology is the MVB (minimum variance beamforming) process described in
JP-A-2015-71028 - According to related art represented by the MVB process, certain-level resolution is provided. As for an ultrasonic image, however, the higher the resolution, the better the image. If the resolution of an ultrasonic image can be increased with no increase in the number of ultrasonic elements or the frequency at which the ultrasonic elements are driven, everything works out as desired.
- An advantage of some aspects of the invention is to propose a novel approach to a beamforming process capable of achieving higher resolution.
- A first aspect of the invention is directed to an image generation apparatus including a computation processing section that generates an ultrasonic image from a received signal associated with each scanning in which an ultrasonic wave is transmitted and received, and the computation processing section sets, for each scanning, a selection range over which the received signal is received and which includes a direction of the scanning, calculates weights used in a beamforming process based on the received signals within the selection range, and carries out the beamforming process based on the weights to generate an image associated with the scanning.
- As another aspect of the invention, the invention may be configured as an image generation method for generating an ultrasonic image from a received signal associated with each scanning in which an ultrasonic wave is transmitted and received, the method including setting, for each scanning, a selection range over which the received signal is received and which includes a direction of the scanning, calculating weights used in a beamforming process based on the received signals within the selection range, and carrying out the beamforming process based on the weights to generate an image associated with the scanning.
- According to the first aspect and the like of the invention, when an ultrasonic image is generated, weights used in the beamforming process can be calculated from a plurality of transmitted/received signals within the selection range including the direction of the scanning of the ultrasonic wave. An adaptive beam forming process can then be carried out on the basis of the calculated weights, whereby an ultrasonic image having resolution higher than that of an image obtained in related art.
- A second aspect of the invention is directed to the image generation apparatus according to the first aspect of the invention, in which the setting of the selection range includes setting the selection range in accordance with a drive condition associated with the scanning.
- According to the second aspect of the invention, the selection range can be set in accordance with the drive condition associated with the scanning of the ultrasonic wave.
- A third aspect of the invention is directed to the image generation apparatus according to the second aspect of the invention, in which the setting of the selection range according to the drive condition includes setting a narrower selection range when a higher transmission frequency of the ultrasonic wave is used.
- According to the third aspect of the invention, a narrower selection range can be set when a higher transmission frequency of the ultrasonic wave is used.
- A fourth aspect of the invention is directed to the image generation apparatus according to the second or third aspect of the invention, in which the setting of the selection range according to the drive condition includes setting a narrower selection range when a drive element associated with the scanning has a wider opening width.
- According to the fourth aspect of the invention, a narrower selection range can be set when the drive element has a wider opening width.
- A fifth aspect of the invention is directed to the image generation apparatus according to any of the first to fourth aspects of the invention, in which the generation of an image is allowed to be accompanied or not by a predetermined harmonic process when an image associated with the scanning is generated, and the setting of the selection range includes setting a narrower selection range in a case where the harmonic imaging process is carried out than in a case where no harmonic imaging process is carried out.
- According to the fifth aspect of the invention, a narrower selection range can be set in the case where the harmonic imaging process is carried out than in the case where no harmonic imaging process is carried out.
- The invention will be described with reference to the accompanying drawings, wherein like numbers reference like elements.
-
Fig. 1 shows an example of the system configuration of an image generation apparatus. -
Fig. 2 describes the ultrasonic image. -
Fig. 3 describes an overview of a spatial averaging process of related art. -
Fig. 4 shows simulation conditions (1) and (2). -
Fig. 5 shows an ultrasonic image obtained in the simulation condition (1). -
Fig. 6 shows another ultrasonic image obtained in the simulation condition (1). -
Fig. 7 shows another ultrasonic image obtained in the simulation condition (1). -
Fig. 8 shows another ultrasonic image obtained in the simulation condition (1). -
Fig. 9 shows an ultrasonic image obtained in the simulation condition (2). -
Fig. 10 shows another ultrasonic image obtained in the simulation condition (2). -
Fig. 11 shows another ultrasonic wave obtained in the simulation condition (2). -
Fig. 12 shows another ultrasonic wave obtained in the simulation condition (2). -
Fig. 13 shows conditions under which data are acquired by an actual apparatus when a harmonic mode is selected. -
Fig. 14 shows an ultrasonic image obtained in a harmonic wave condition. -
Fig. 15 shows an ultrasonic image obtained in a fundamental wave condition. -
Fig. 16 shows the signal intensity obtained in the harmonic wave condition and the signal intensity in the fundamental wave condition in the form of graphs. -
Fig. 17 is a block diagram showing an example of the functional configuration of the image generation apparatus. -
Fig. 18 shows an example of the data configuration of a parameter setting table. -
Fig. 19 is a flowchart showing the procedure of the process of generating an ultrasonic image. - A preferable embodiment of the invention will be described below with reference to the drawings. The embodiment that will be described below is not intended to limit the invention, and a form to which the invention is applicable is not limited to the following embodiment. Further, in the drawings, the same portions have the same reference characters.
-
Fig. 1 shows an example of the system configuration of animage generation apparatus 10 in the present embodiment. Theimage generation apparatus 10 includes atouch panel 12, which serves both as a section for displaying a measurement result and operation information in the form of an image and a section for inputting operation, akeyboard 14 for inputting operation, anultrasonic probe 16, and aprocessor 30 and acquires biological information on asubject 2 by using ultrasonic measurement. - The
processor 30 incorporates acontrol substrate 31, which is so connected to thetouch panel 12, thekeyboard 14, theultrasonic probe 16, and other sections of the apparatus as to be capable of transmitting and receiving signals thereto and therefrom. On thecontrol substrate 31 are mounted a CPU (central processing unit) 32, an ASIC (application specific integrated circuit) 32, an FPGA (field programmable gate array), and a variety of integrated circuits as well as astorage medium 33, such as an IC (integrate circuit) memory and a hard disk drive, and acommunication IC 34, which establishes data communication with an external apparatus. Theprocessor 30 causes theCPU 32 or any other component to execute a program stored on thestorage medium 33 to carry out processes necessary for acquisition of biological information, such as ultrasonic measurement as a representative example. - Specifically, the
image generation apparatus 10 transmits an ultrasonic beam from theultrasonic probe 16 into thesubject 2 and receives a reflected ultrasonic wave for ultrasonic measurement under the control of theprocessor 30. A signal carrying the received reflected wave is then caused to undergo amplification and signal processing to create reflected wave data containing, for example, positional information on and time-course change in the internal structure of thesubject 2. The ultrasonic measurement is repeatedly performed in a predetermined cycle. The measurement unit repeated in the predetermined cycle is called a "frame." The measurement site on which theultrasonic probe 16 is put is not limited to a neck region shown inFig. 1 and may be a region of thesubject 2 according to the purpose of the measurement, such as a wrist, an arm, and an abdominal region. - The reflected wave data contains images in the following modes: what is called an A mode; a B mode; an M mode; and a color Doppler mode. The A mode is a mode in which the amplitude of the reflected wave (A-mode image) is displayed with a first axis representing the distance from a predetermined body surface position in the depth direction and a second axis representing the intensity of the signal carrying the received reflected wave. The B mode is a mode in which the amplitude of the reflected wave (A-mode image) produced by scanning a living body with the ultrasonic beam over a predetermined probe scan range (scan angle) is visualized in the form of an image by converting the amplitude into a brightness value and the resultant two-dimensional ultrasonic image (B-mode image) of the internal structure of the living body is displayed.
-
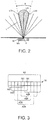
Fig. 2 describes the ultrasonic image and shows, in a simplified manner, a state in which theultrasonic probe 16 is put on a measurement site (body surface) of the subject 2 for the ultrasonic measurement. - The
ultrasonic probe 16 has a plurality of built-in ultrasonic elements (ultrasonic vibrators) 161, which are drive elements arranged in a single row or multiple rows. In the present embodiment, theultrasonic probe 16 will be described as a device that performs ultrasonic measurement in what is called a sector scan scheme, in which an ultrasonic beam is radially transmitted and received along a plurality of scan lines L starting from a base point P in a predetermined body surface position with the angle of incidence of the ultrasonic beam changed by a predetermined angle (scan angle interval) to scan a fan-shaped predetermined angular range, which is a scan angle. Theimage generation apparatus 10 generates, on the basis of a signal received with each of theultrasonic elements 161 associated with the scanning along each of the scan lines L, an image according to the scanning along the scan line L. An ultrasonic image is thus obtained. - To generate an image according to each scanning, a beamforming process of summing signals received with the ultrasonic element (hereinafter also simply referred to as "element") 161 associated with the scanning is carried out. In the following sections, the beamforming process in the present embodiment will be described by focusing on a certain scan line (scan line L11 in
Fig. 2 , for example). - The ultrasonic beam is so transmitted that the acoustic pressure in the direction of a scan line of interest L (scan line of interest L11 to be focused on, for example) by causing each of the
elements 161 to operate with a delay period at the time of transmission of the ultrasonic beam (main robe hatched inFig. 2 ). In practice, however, in addition to the ultrasonic beam having the main robe, low-sensitivity ultrasonic beams (side robes) are also radiated in oblique directions separate away from the direction of the scan line of interest L11. Further, since an ultrasonic wave is characterized by spreading in a spherical shape, the main robe itself has a certain width (hereinafter referred to as "main robe width") θm. Each received signal therefore contains not only a reflected wave (desired wave) from a reflector on the scan line of interest L11 but also a reflected wave (unnecessary wave) from a reflector present in a position separate away from the direction of the scan line of interest. As described above, since an ultrasonic beam is also sensitive to unnecessary waves traveling along directions other than the scan line of interest L11, simply summing signals received with each of theelements 161 causes a problem of degradation in resolution. It is noted that the main robe inFig. 2 is intentionally enlarged for ease of understanding, and the size of the main robe differs in practice from an actual size. - As a technology for solving the problem described above, the MVB process, which is also called adaptive beamforming, has been known. The MVB process, which is a beamforming process carried out with a directional constraint that allows an ultrasonic beam to be sensitive only to a desired wave but prevents the ultrasonic beam from being sensitive to unnecessary waves, allows improvement in resolution.
- An overview of the MVB process will be briefly described. In the MVB process, a phasing process is first carried out. The phasing process is a process of delaying a signal received with each of the
elements 161 by a pre-specified delay period. - Subsequently, a correlation matrix is calculated and used to calculate weights. In the calculation of the correlation matrix, to reduce correlation between a desired wave and an unnecessary wave, a spatial averaging method is applied (spatial averaging process).
Fig. 3 describes an overview of the spatial averaging process and shows a simplified element arrangement of the plurality ofultrasonic elements 161, which form theultrasonic probe 16. The overall width (element opening) A2 of the arranged elements is also referred to as an opening width. - The spatial averaging process is implemented as a process for suppressing the effect of an interference wave (unnecessary wave) that interferes with a desired wave by focusing on the fact that the desired wave and the interference wave correlate with each other. Specifically, the spatial averaging process is a process of calculating correlation matrices from signals received through partial element openings (sub-arrays) A21 to A26 each formed of part of the
elements 161, which form theultrasonic probe 16, and averaging the resultant correlation matrices associated with the sub-arrays A21 to A26 to determine a correlation matrix associated with the overall opening width A2. The spatial averaging process, in which correlation matrices are determined based on the sub-arrays A21 to A26 selectively shifted in the direction in which the sub-arrays are arranged, allows reduction in correlation between the desired wave and the interference wave on the basis of an effect provided by the averaging. - Subsequently, a steering vector aθ, which is specified on the basis of the direction of the scan line of interest L11, is used to determine weights from the resultant correlation matrix. The calculated weights are then used to perform weighted summation of the signals having been received with the
elements 161 and having undergone the phasing process. - The MVB process has, however, the following problem, because the spatial averaging method is applied to the calculation of a correlation matrix. That is, in the spatial averaging process, since a correlation matrix is calculated by using a calculation unit formed of each of the sub-arrays A21 to A26, each of which has an element opening narrower than the actual opening width A2, and weights are then determined, the weighted summation using the calculated weights is also performed by using a summation unit formed of each of the sub-arrays A21 to A26. As a result, the signals received with each of the
elements 161 are summed with the element opening thereof narrowed. Improvement in resolution is therefore naturally limited. In other words, if the suppression of the effect of the interference wave and the weighted summation using the summation unit equal to the opening width A1 can be achieved at the same time, the resolution can be further increased. - In view of the consideration described above, to perform the weight calculation, the present embodiment employs a novel method using signals received with the
elements 161 associated with the scanning along a plurality of scan lines L including a scan line in the direction of a desired wave. Since part of the contents of the novel process approximates to the MVB process, the novel process is referred to as a "multi-beam MVB process" in the present embodiment. In the following description, the range over which scan lines used in the weight calculation are selected is called a "scan line selection range, " and the scan lines in the scan line selection range are called "in-range scan lines." The scan line selection range is an angular range having a center line extending along the direction of the scan line of interest L11, and the in-range scan lines L include at least the scan line of interest L11. - In the multi-beam MVB process, the same phasing process as that in the MVB process is carried out for each of the in-range scan lines L.
- The steering vector aθ is subsequently calculated. The steering vector aθ is expressed by the following Expression (1). In Expression (1), θ represents a phase shift angle. The phase shift angle θ corresponds to the angle of the corresponding in-range scan line L (scan line angle χ, which will be described later). M represents the number of elements (number of ultrasonic elements 161). The steering vector aθ used in the MVB process described above is fixed to be 1 (aθ=1, θ=0).

- The steering vector aθ is calculated for each of the in-range scan lines L to provide A [n] expressed by the following Expression (2). A[n] is an MxK matrix, and K represents the scan line number of each of the in-range scans line L.

- The phase shift process is subsequently carried out. The phase shift process is carried out by determining, in accordance with the following Expression (3), an Hadamard product X∼[n] of signals X[n] having been received with the
elements 161 for each of the in-range scan lines L and having undergone the phasing process multiplied by A[n] determined by using Expression (2). X∼ corresponds to the symbol written in Expression (3) or "X" with "∼" labeled thereabove.
- X[n] in Expression (3) is expressed by the following Expression (4) and is an M×K matrix, as A[n] is. xi[n] (i=1, 2,..., K) represents a signal having been received with each of the
elements 161 associated with scanning along the in-range scan line L having the scan line number i and having undergone the phasing process.
- The signals X∼[n] having been received with the
elements 161 for each of the in-range scan lines L and having undergone the phasing process are subsequently used to calculate a correlation matrix R [n] in accordance with the following Expression (5). R^ corresponds to the symbol written in Expression (5) or "R" with "∼" labeled thereabove.
- The minimization problem shown in the following Expressions (6) and (7) is subsequently solved to calculate a weight w of each of the
elements 161.

- Thereafter, in accordance with the following Expression (8) and on the basis of the determined weight w of each of the
elements 161, signals xt ∼[n] having been received with theelements 161 associated with the scanning along the scan line of interest L11 and having undergone the phase shift process are weighted and summed. The subscript t in Expression (8) represents the scan line number of the scan line of interest L11. xt corresponds to the symbol written in Expression (8) or "xt" with "∼" labeled thereabove.
- In the multi-beam MVB process described above, the correlation between the desired wave and the unnecessary waves can be reduced by using received signals obtained at transmitted beam angles other than that of the scan line of interest L11 as well as the received signal associated with the scan line of interest L11 (observation line) . The weighted summation with the effect of the interference wave suppressed can therefore be achieved without narrowing the element opening as in the MVB process of related art but by using a summation unit equal to the opening width A2. In this case, however, choice of the in-range scan lines L (how to set scan line selection range) is an issue to be solved. It is preferable to select at least scan lines L that provide not only a signal intensity roughly equal to that provided by the scan line of interest L11 but also a small amount of variation in the intensity. In view of the above consideration, the resolution is studied in a plurality of simulations in which the main robe width θm is used as a guideline of the scan line selection range and the scan line selection range is so changed as to be wider and narrower than the main robe width θm.
- First of all, the main robe width θm is expressed, for example, by the following Expression (9). The main robe width θm decreases when the transmission frequency f increases and decreases as well when the opening width D increases. In Expression (9), f represents the transmission frequency, D represents the opening width, c represents the sound speed in a medium, and λ represents the wavelength.

- Now, let χ be the angle of a scan line L (scan line angle), and the angular range of the main robe width θm associated with the scanning along the scan line L ranges from χ-θ/2 to χ+θ/2. Therefore, when the scan line angle χ of each of the scan lines L is expressed by the following Expression (10), the scan lines L within the main robe can be identified by extraction of the elements in Expression (10) in accordance with the following Expression (11). In Expression (10), α represents the scan angle, and φp represents the scan angle interval. Each of the angles used herein is an azimuth angle and is determined with respect, for example, to the direction corresponding to the angle of incidence of 0°.


- The expression for calculation of the main robe width θm is not limited to Expression (9). The main robe width θm, which varies in accordance also with the element shape of the
ultrasonic elements 161, whether or not apodization is performed, the distance from the focal position, and other factors, is desirably determined in consideration of the factors described above. - The transmission frequency, which is one of the parameters in Expression (9), which in practice determines the main robe width θm, is one of conditions under which the
ultrasonic probe 16, which is responsible for transmission and reception of an ultrasonic beam, is driven, and the setting of the transmission frequency is changed in accordance, for example, with the depth (distance from ultrasonic probe 16) of an object under observation (also called region of interest). Specifically, the transmission frequency is set at a large value when a shallow position close to a body surface is observed and set at a small value when a deep position is observed. Since an ultrasonic wave propagating in a living body tends to attenuate in proportion to the transmission frequency, a low frequency, which reduces the amount of attenuation, is used when a deep region is observed, whereas a high frequency, which allows high resolution from the nature of the frequency, is used when a shallow position (shallow region) is observed. The transmission frequency setting described above is performed through the drive condition setting. - The simulations were performed under the two conditions shown in
Fig. 4 . First, in a simulation condition (1), the transmission frequency was set at 5.0 MHz assuming a case where a shallow position close to a body surface in a measurement site is observed. The opening width was a fixed value of 19.2 mm, and the scan angle interval was also a fixed value of 0.05°. Scatterers were disposed as an object under observation at a depth level of 50 mm and at intervals of 0.5 mm. Ultrasonic measurement was performed under the above conditions to generate an ultrasonic image. - Next, in the simulation condition (2), the transmission frequency was set at 2.5 MHz assuming a case where a deep region in a measurement site is observed. The opening width and the scan angle interval were the same fixed values as those in the simulation condition (1). Scatterers were disposed as an object under observation at a depth level of 100 mm and at intervals of 3 mm. Ultrasonic measurement was performed under the above conditions to generate an ultrasonic image.
- The scan line selection range in the simulations was changed (in-range scan lines L were chosen) by using the following Expression (12), which is a variation of Expression (11), and setting a correction coefficient C as a variable. When C=1.0, the scan line selection range coincides with the main robe width θm. When C is set at a value smaller than 1.0, the scan line selection range is narrower than the main robe width θm, and when C is set at a value greater than 1.0, the scan line selection range is wider than the main robe width θm. For example, consider the scan line of interest L11 in the example shown in
Fig. 2 . When C=1.0, three scan lines L11, L13, and L15, which fall within the main robe and include the scan line of interest L11, are chosen.
-
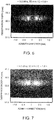
Figs. 5 to 8 show ultrasonic images obtained in the simulation condition (1) with the correction coefficient C set at 0.6 inFig. 5 , C=0.8 inFig. 6 , C=1.0 inFig. 7 , and C=1.2 inFig. 8 .Figs. 9 to 12 show ultrasonic images obtained in the simulation condition (2) with the correction coefficient C set at 0.6 inFig. 9 , C=0.8 inFig. 10 , C=1.0 inFig. 11 , and C=1.2 inFig. 12 . - Both in the simulation conditions (1) and (2), when C is set to be smaller than or equal to 1.0, that is, the scan line selection range is set to be narrower than or equal to the main robe width θm, images showing visible boundaries between the scatterers were obtained, and the resolution was satisfactory. In contrast, in the case where C=1.2 or the scan line selection range was wider than the main robe width θm, a low-resolution image in which the boundaries between the scatterers were hardly visible and right and left two scatterers were considered to be united to each other was obtained.
- Comparison between the results obtained in the simulation condition (1) and the results obtained in the simulation condition (2) shows that the scan line selection ranges are roughly the same angular range in the case where C=1.2 in the simulation condition (1) shown in
Fig. 8 and the case where C=0.6 in the simulation condition (2) shown inFig. 9 because the transmission frequency in the simulation condition (1) (5.0 MHz) is twice the transmission frequency in the simulation condition (2) (2.5 MHz). Comparison between the images inFigs. 8 and 9 shows that the resolution is satisfactory in the image shown inFig. 9 because the scan line selection range is narrower than or equal to the main robe width θm, and that in the image shown inFig. 8 , the resolution is lower than the resolution in the other conditions because the scan line selection range is wider than the main robe width θm. That is, in the case where the same scan line selection range is set, in which the lower the transmission frequency, the higher the resolution improvement effect, it can be said that with increasing transmission frequency but maintaining the resolution improvement effect requires the scan line selection range to be set at a relatively narrow range. - The
ultrasonic probe 16 performs ultrasonic measurement, for example, in a harmonic mode, which is one of ultrasonic measurement modes. The harmonic mode is a mode in which an ultrasonic image is generated by carrying out a harmonic imaging process in which harmonic components (harmonic wave components) are extracted. According to the harmonic imaging process, harmonic wave components produced in the course in which the ultrasonic wave propagates in a living body can be visualized in the form of an image, whereby the resolution and contrast can be improved. An advantageous effect provided by scan line selection range settings in the harmonic mode is also studied. -
Fig. 13 shows conditions under which data are acquired by an actual apparatus. The harmonic imaging process was carried out by separating a fundamental wave component and harmonic wave components from each other through a frequency filter (high-pass filter) and extracting the second-order harmonic wave component. To this end, the transmission frequency f substituted into Expression (9) in the calculation of the main robe width θm was not set at 2.6 MHz, which was an actual transmission frequency, but was set at 5 .2 MHz, which is twice the actual transmission frequency. Further, as Comparative Example to be compared with the present actual apparatus study, an ultrasonic image was generated by setting the transmission frequency f substituted into Expression (9) at 2.6 MHz, which is the actual transmission frequency. An object under observation was formed of resolution evaluation phantoms (wires) disposed at a depth level of 50 mm and at intervals of 0.5 mm. -
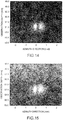
Fig. 14 shows an ultrasonic image obtained in the multi-beam MVB process as an actual apparatus harmonic imaging process under the following conditions: the frequency f is 5.2 MHz; and C=1.0, andFig. 15 shows an ultrasonic image obtained in the multi-beam MVB process described above under the following conditions: the frequency f is 2.6 MHz; and C=1.0 (fundamental wave condition). Comparison between the two images shows that the image inFig. 14 (harmonic wave condition) has resolution higher than that of the image inFig. 15 (fundamental wave condition) in terms of clarity of the boundaries between the resolution evaluation phantoms (wires).Fig. 16 shows both the signal intensity obtained in the harmonic wave condition and the signal intensity obtained in the fundamental wave condition in the form of graphs. The boundary between resolution evaluation phantoms (wires) is located in the direction at an azimuth angle of 0°. Comparison between the harmonic wave condition and the fundamental wave condition in terms of change in the signal intensity on both sides of the azimuth angle of 0° shows that a steeper peak of the signal intensity and hence a higher-resolution image are obtained in the harmonic wave condition than in the fundamental wave condition. - Therefore, in the harmonic mode, it is preferable that the frequency of a harmonic wave component to be extracted is used as a reference and a narrower scan line selection range is set when the frequency is higher.
-
Fig. 17 is a block diagram showing an example of the functional configuration of theimage generation apparatus 10. Theimage generation apparatus 10 includes theprocessor 30 and theultrasonic probe 16, and theprocessor 30 includes anoperation input section 310, adisplay section 320, acommunication section 340, aprocessing section 350 as a computation processing section, and astorage section 500. - The
ultrasonic probe 16 includes a plurality ofultrasonic elements 161, each of which transmits an ultrasonic wave in response to pulsed voltage outputted from the processor 30 (in more detail, ultrasonicmeasurement control section 351 in processing section 350). Theultrasonic probe 16 then receives a reflected wave resulting from the transmitted ultrasonic wave and outputs a received signal to the ultrasonicmeasurement control section 351. - The
operation input section 310 accepts a variety of operation inputs from a user and outputs operation input signals according to the operation inputs to theprocessing section 350. Theoperation input section 310 can be achieved with a button switch, a lever switch, a dial switch, a trackpad, a mouse, and other components. InFig. 1 , thetouch panel 12 and thekeyboard 14 correspond to theoperation input section 310. - The
operation input section 310 has atransmission frequency dial 311 for inputting a transmission frequency indicating value and a measurementmode switch button 313 for selectively switching the measurement mode between a normal mode and the harmonic mode. Each of thetransmission frequency dial 311 and the measurementmode switch button 313 is not necessarily achieved by a physical switch, such as a dial switch and a button switch, and may be achieved, for example, by a software-based key switch using a touch panel that also serves as thedisplay section 320. In this case, the user touches and operates the touch panel to input an observation depth indicating value or switch the measurement mode (between normal mode and harmonic mode). - The
display section 320 is achieved by a display device, such as an LCD (liquid crystal display) and performs a variety of types of display operation based on a display signal from theprocessing section 350. InFig. 1 , thetouch panel 12 corresponds to thedisplay section 320. - The
communication section 340 is a communication device for transmitting and receiving data to and from an external apparatus under the control of theprocessing section 350. Examples of the communication scheme in accordance with which thecommunication section 340 operates may include a wired connection scheme via a cable that complies with a predetermined communication standard, a connection scheme via an intermediate device that also serves as a charger called, for example, a cradle, a wireless connection scheme using wireless communication, and a variety of other schemes. InFig. 1 , thecommunication IC 34 corresponds to thecommunication section 340. - The
processing section 350 is achieved, for example, by a CPU, a GPU (graphics processing unit), and other microprocessors, and an ASIC, a FPGA, an IC memory, and other electronic parts. Theprocessing section 350 controls input and output of data from and to each of the functional sections and carries out a variety of computation processes based, for example, on a predetermined program or data, the operation input signals from theoperation input section 310, the signals received with theelements 161 in theultrasonic probe 16 to acquire biological information on thesubject 2. InFig. 1 , theCPU 32 corresponds to theprocessing section 350. Each section that forms theprocessing section 350 may instead be formed of hardware, such as a dedicated module circuit. - The
processing section 350 includes the ultrasonicmeasurement control section 351 and animage generation section 400. - The ultrasonic
measurement control section 351, along with theultrasonic probe 16, forms anultrasonic measurement section 20, which performs ultrasonic measurement. The ultrasonicmeasurement control section 351 controls the timing at which theultrasonic probe 16 transmits ultrasonic pulses, produces pulsed voltage at the transmission timing, and outputs the voltage to theultrasonic probe 16. In this process, a transmission delay process is carried out to adjust the timing at which the pulsed voltage is outputted to each of theelements 161. The ultrasonicmeasurement control section 351 further filters or otherwise processes signals inputted from theultrasonic probe 16 and received with theelements 161 and outputs the signals received with theelements 161 and processed (measurement result) are outputted to theimage generation section 400. - The
image generation section 400 generates an ultrasonic image on the basis of the signals received with theelements 161 and inputted from the ultrasonicmeasurement control section 351. Theimage generation section 400 includes the following functional sections: aparameter setting section 410; aharmonic processing section 420; and abeamforming processing section 440. Each of the functional sections may be achieved by software that causes theprocessing section 350 to execute animage generation program 510 or may be achieved by a dedicated electronic circuit. In the present embodiment, the description will be made with reference to the former case. - The
parameter setting section 410 sets drivecondition information 550 and the number of selectedscan lines 560 on the basis of the dial position of thetransmission frequency dial 311 and the selection state of the measurementmode switch button 313. - The
harmonic processing section 420 carries out the harmonic imaging process of extracting harmonic components (harmonic wave components) from the signals received with theelements 161 and inputted from the ultrasonicmeasurement control section 351. - The
beamforming processing section 440 is a functional section that carries out the multi-beam MVB process. Thebeamforming processing section 440 can be divided in correspondence with the steps that form the multi-beam MVB process described above into an in-range scanline choice section 441, which chooses in-range scan lines within a scan line selection range, aphasing processing section 442, which carries out the phasing process, a steeringvector calculation section 443, which calculates steering vectors, a phaseshift processing section 444, which carries out the phase shift process, a correlationmatrix calculation section 445, which calculates a correlation matrix, aweight calculation section 446, which calculates weights, and aweighted summation section 447, which weighs the signals received with theelements 161 by using the weights and sums the weighted signals. Thebeamforming processing section 440 carries out the beamforming process for each scan line. Each of the functional sections may instead be formed of a dedicated electronic circuit. - The
storage section 500 is achieved by a storage medium, such as an IC memory, a hard disk drive, and an optical disk. Thestorage section 500 stores a program for operating theimage generation apparatus 10 and achieving a variety of functions provided by theimage generation apparatus 10, data used during the execution of the program, and other pieces of information in advance or temporarily whenever a process is carried out. InFig. 1 , thestorage medium 33 mounted on thecontrol substrate 31 corresponds to thestorage section 500. The connection between theprocessing section 350 and thestorage section 500 is not limited to connection based on an in-apparatus internal bus circuit and may instead be achieved by a communication line, such as a LAN (local area network) and the Internet. In this case, thestorage section 500 may be achieved by an external storage device separate from theimage generation apparatus 10. - The
storage section 500 stores theimage generation program 510, a parameter setting table 520, receivedsignal data 530, reflectedwave data 540, thedrive condition information 550, and the number of selectedscan lines 560. - The
processing section 350 reads and executes theimage generation program 510 to achieve the functions of the ultrasonicmeasurement control section 351, theimage generation section 400, and other sections. In a case where each of the functional sections is achieved by hardware, such as an electronic circuit, part of the program for achieving the functions can be omitted. - The parameter setting table 520 is referred to when the
parameter setting section 410 sets thedrive condition information 550 and the number of selectedscan lines 560, and the transmission frequency, the scan line selection range, and the number of scan lines are set in advance in accordance with the relationship between the transmission frequency and the scan line selection range described above. The parameter setting table 520 contains a table for thenormal mode 521 and a table for theharmonic mode 523. The two tables have the same table structure, have the same ascending/descending tendency of vertically arranged values in the tables shown inFig. 18 , and contain values set in advance suitable for the measurement modes. -
Fig. 18 shows an example of the data configuration of the parameter setting table 520. The parameter setting table 520 is a data table that sets the relationship among a value indicated in the dial position of the transmission frequency dial 311 (transmission frequency dial indicated value), the scan line selection range, and the number of scan lines, as shown inFig. 18 . - In the column of the scan line selection range, the values thereof are so set as to smaller in an upper row where the corresponding transmission frequency is higher, and in the column of the number of scan lines, the number of scan lines within the corresponding scan line selection range is set on the basis of the scan angle interval. In more detail, each value set in the column of the scan line selection range in the table for the
normal mode 521 is set, as a precondition, to be smaller than or equal to the main robe width determined by substitution of the corresponding transmission frequency and opening width (fixed in the present embodiment). On the other hand, each value set in the column of the scan line selection range in the table for theharmonic mode 523 is set to be smaller than or equal to the main robe width determined by substitution of the frequency of a harmonic wave component specified by the corresponding transmission frequency (for example, the value twice the transmission frequency in a case where the second-order harmonic wave component is extracted) and a fixed opening width. - In the present embodiment, the
parameter setting section 410 refers to the parameter setting table 520 and sets, astransmission frequency information 553, a transmission frequency specified by the transmission frequency dial indicated value being selected with thetransmission frequency dial 311 and further sets, as the number of selectedscan lines 560, the number of scan lines corresponding to the transmission frequency dial indicated value. The in-range scanline choice section 441 then chooses, as the in-range scan lines, scan lines specified in terms of number by the number of selectedscan lines 560 and including a scan line of interest of the beamforming process as the center scan line. The scan line selection range is thus set. - The received
signal data 530 stores the signals received with theelements 161 associated with scanning along the scan lines and resulting from ultrasonic measurement. - The reflected
wave data 540 stores reflected wave data obtained in ultrasonic measurement repeated on a frame basis. The reflectedwave data 540 contains data on the B-mode image, which is an ultrasonic image, on a frame basis. - The
drive condition information 550 storesmeasurement mode information 551,transmission frequency information 553, andopening width information 555. Themeasurement mode information 551 indicates whether the measurement mode being selected with the measurementmode switch button 313 is the normal mode or the harmonic mode. In thetransmission frequency information 553, the transmission frequency dial indicated value being selected with thetransmission frequency dial 311 is set by theparameter setting section 410, as described above. In theopening width information 555, the opening width A2 (seeFig. 3 ) of theultrasonic probe 16 is set in advance as a fixed value. - The stored number of selected
scan lines 560 is the number of in-range scan lines within the scan range selection range. The number of selectedscan lines 560 is set along with thedrive condition information 550 by theparameter setting section 410 before ultrasonic measurement. -
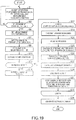
Fig. 19 is a flowchart showing the procedure of the process of generating an ultrasonic image in the present embodiment. The process that will be described in this section can be achieved when theprocessing section 350 reads and executes theimage generation program 510 from thestorage section 500 and causes the sections in theimage generation apparatus 10 to operate. Before ultrasonic measurement, the user puts theultrasonic probe 16 on a body surface of thesubject 2. - The
image generation apparatus 10 first accepts the user' s operation input performed on theoperation input section 310. In this process, theimage generation apparatus 10 accepts operation performed on thetransmission frequency dial 311 and the measurement mode switch button 313 (step S1) and waits until predetermined measurement start operation is inputted (step S3: NO). - When the measurement start operation is inputted (step S3: YES), the
parameter setting section 410 first acquires the selection state of the measurementmode switch button 313 and sets the measurement mode information 551 (step S5). Theparameter setting section 410 subsequently sets, on the basis of the dial position of thetransmission frequency dial 311, the transmission frequency dial indicated value in the transmission frequency information 553 (step S7). Theparameter setting section 410 further reads the number of scan lines corresponding to the transmission frequency dial indicated value indicated by the transmission frequency dial 311 from the parameter setting table 520 and sets the number of selected scan lines 560 (step S9). Thetransmission frequency information 553 and the number of selectedscan lines 560 are set by referring to the table for thenormal mode 521 as the parameter setting table 520 when the measurement mode is the normal mode, whereas by referring to the table for theharmonic mode 523 as when the measurement mode is the harmonic mode. - After the
drive condition information 550 and the number of selectedscan lines 560 are set, theultrasonic measurement section 20 performs ultrasonic measurement in accordance with the drive condition information 550 (step S11). The process in step S11 allows data corresponding to one frame to be stored in the receivedsignal data 530. - Subsequently, the measurement mode is identified, and in the harmonic mode (step S13: YES), the
harmonic processing section 420 causes the received signals obtained in the ultrasonic measurement in step S11 to undergo the harmonic imaging process (step S15). - Subsequently, the
beamforming processing section 440 repeats the processes in a loop A on a scan line basis to carry out the multi-beam MVB process (steps S17 to S33). Thebeamforming processing section 440 first chooses, as the in-range scan lines, scan lines specified in terms of number by the number of selectedscan lines 560 and including a scan line of interest of the beamforming process as the center scan line (step S19). - Having chosen the in-range scan lines, the
phasing processing section 442 carries out the phasing process of delaying the signal received with theelement 161 associated with the scanning along each of the in-range scan lines by a delay period (step S21). In this process, when the measurement mode is the harmonic mode, the phasing is performed on the signal having been received with each of the elements and having undergone the harmonic imaging process in step S15. - The steering
vector calculation section 443 then calculates the steering vector specified by Expression (1) for each of the in-range scan lines in accordance with Expression (2) (step S23). The phaseshift processing section 444 then uses the steering vector to cause the signals having been received with theelements 161 for each of the in-range scan lines and having undergone the phasing process to undergo the phase shift process in accordance with Expressions (3) and (4) (step S25). The correlationmatrix calculation section 445 then calculates a correlation matrix in accordance with Expression (5) from the signals having been received with theelements 161 for each of the in-range scan lines and having undergone the phase shift process (step S27). Theweight calculation section 446 then uses the steering vectors and the correlation matrices to calculate weights in accordance with Expressions (6) and (7) (step S29). Theweighted summation section 447 then uses the weights determined in step S29 to weigh the signals having been received with theelements 161 for the scan line of interest and having undergone the phase shift process and sums the weighted signals (step S31). - After the processes in the loop A are carried out for all the scan lines of interest, necessary processing is performed on each of the resultant images associated with the corresponding scanning to generate an ultrasonic image (step S35). The processes corresponding to one frame is thus completed. The generated ultrasonic image is displayed by the
display section 320 as appropriate. - As described above, according to the present embodiment, in-range scan lines within a selected scan lines range are chosen on a scan line basis for the multi-beam MVB process. In this process, a narrower scan line selection range can be set when a higher transmission frequency is used to achieve a high-resolution ultrasonic image. In the setting of the scan line selection range, for example, when a higher transmission frequency is used, a smaller number of scan lines is set as the number of selected
scan lines 560 before ultrasonic measurement. The beamforming process can be carried out on a scan line basis by choosing, as the in-range scan lines, scan lines specified by the number of selectedscan lines 560 and including a scan line of interest as the center scan line. - In the harmonic mode, with reference to the frequency of a harmonic wave component to be extracted, a narrower scan line selection range can be employed (the number of in-range scan lines can be reduced) when the frequency is higher, whereby the resolution can be further increased, and a high-definition ultrasonic image can be obtained.
- In the embodiment described above, the sector scan scheme is presented as an example of the scan scheme of the
ultrasonic probe 16. In a case where another scan scheme, such as a linear scan scheme, can be used, the embodiment described above is applicable as well. In the linear scan scheme, ultrasonic beams are transmitted and received along a plurality of scan lines parallel to each other with the positions where the ultrasonic beams are incident shifted along the direction in which theultrasonic elements 161 are arranged. The setting of the opening width (drive opening) can therefore be changed as required. Therefore, in the case where the linear scan scheme is employed, the scan line selection range may be set (in-range scan lines may be chosen) in accordance with the opening width. In this case, it is preferable to set a narrower scan line selection range (a smaller number of in-range scan lines are chosen) for higher resolution when a wider opening width is used. - Further, even in the case where the sector scan scheme is employed as in the embodiment described above, it is conceivable to perform ultrasonic measurement by changing the
ultrasonic probe 16 to another having a different opening width. Assuming such a case, a narrower scan line selection range may be set (a smaller number of in-range scan lines may be chosen) when a wider opening width is used, as in the case where the linear scan scheme is employed. This can be achieved, for example, by preparing parameter setting tables on an opening width basis. Specifically, when values of the scan line selection range corresponding to the same transmission frequency dial indicated value in the parameter setting tables are compared with one another, a narrower scan line selection range and hence a smaller number of scan lines are set when a parameter setting table for a wider opening width is used. The resolution can thus be further increased. - Further, in the embodiment described above, the description has been made with reference to the case where the scan angle interval is fixed. In some cases, the scan angle interval is so controlled as to be, for example, smaller in the vicinity of the center of the scan angle and greater in the vicinity of the ends of the scan angle. In this case, the elements in Expression (10) only need to be set in accordance with the actual scan angle interval. According to the configuration described above, in the beamforming process, the scan line selection range can be set in accordance with the scan angle interval between a scan line of interest and a scan line adjacent thereto.
- Further, the procedure of generating an ultrasonic image is not limited to the procedure described with reference to
Fig. 19 in which ultrasonic measurement corresponding to one frame is first performed and an image associated with each scanning is then sequentially generated. Instead, the multi-beam process in the loop A may be carried concurrently with the ultrasonic measurement in step S11. In this case, at least after the scanning corresponding to the number of selectedscan lines 560 set in step S9 is completed, the process in the loop A may be initiated. According to the configuration described above, a storage area large enough to store received data corresponding to the number of scan lines settable as the number of selectedscan lines 560 only needs to be provided, but all received data corresponding to one frame are not required to be stored, whereby the multi-beam MVB process can be carried out with a small amount of memory.
The image generation apparatus according to the embodiment of the invention is not limited to an ultrasonic diagnostic apparatus that performs ultrasonic measurement of the subject 2, as in the embodiment described above, and can be used in a sonar apparatus, an ultrasonic defect inspection apparatus for nondestructive inspection, and other apparatus.
Claims (6)
- An image generation apparatus (10) comprising a computation processing section (350) that is configured to generate an ultrasonic image from a received signal associated with each scanning in which an ultrasonic wave is transmitted and received,
wherein the computation processing section (350) is further configured to:set, for each scanning, a selection range over which the received signal is received and which includes a direction of the scanning,calculate weights used in a beamforming process based on the received signals within the selection range, and tocarry out the beamforming process based on the weights to generate an image associated with the scanning. - The image generation apparatus (10) according to claim 1,
wherein the setting of the selection range includes setting the selection range in accordance with a drive condition associated with the scanning. - The image generation apparatus (10) according to claim 2,
wherein the setting of the selection range according to the drive condition includes setting a narrower selection range when a higher transmission frequency of the ultrasonic wave is used. - The image generation apparatus (10) according to claim 2,
wherein the setting of the selection range according to the drive condition includes setting a narrower selection range when a drive element associated with the scanning has a wider opening width. - The image generation apparatus (10) according to claim 1,
wherein the generation of an image is allowed to be accompanied or not by a predetermined harmonic process when an image associated with the scanning is generated, and
the setting of the selection range includes setting a narrower selection range in a case where the harmonic imaging process is carried out than in a case where no harmonic imaging process is carried out. - An image generation method for generating an ultrasonic image from a received signal associated with each scanning in which an ultrasonic wave is transmitted and received, the method comprising:setting, for each scanning, a selection range over which the received signal is received and which includes a direction of the scanning;calculating weights used in a beamforming process based on the received signals within the selection range; andcarrying out the beamforming process based on the weights to generate an image associated with the scanning.
Applications Claiming Priority (1)
| Application Number | Priority Date | Filing Date | Title |
|---|---|---|---|
| JP2016054944A JP2017164408A (en) | 2016-03-18 | 2016-03-18 | Image generating apparatus and image generating method |
Publications (2)
| Publication Number | Publication Date |
|---|---|
| EP3220161A1 true EP3220161A1 (en) | 2017-09-20 |
| EP3220161B1 EP3220161B1 (en) | 2021-04-28 |
Family
ID=58464151
Family Applications (1)
| Application Number | Title | Priority Date | Filing Date |
|---|---|---|---|
| EP17161315.1A Active EP3220161B1 (en) | 2016-03-18 | 2017-03-16 | Image generation apparatus and image generation method |
Country Status (4)
| Country | Link |
|---|---|
| US (1) | US10444200B2 (en) |
| EP (1) | EP3220161B1 (en) |
| JP (1) | JP2017164408A (en) |
| CN (1) | CN107204020B (en) |
Cited By (1)
| Publication number | Priority date | Publication date | Assignee | Title |
|---|---|---|---|---|
| CN108354626A (en) * | 2018-03-31 | 2018-08-03 | 华南理工大学 | A variety of MV high clearing systems fast medical ultrasonic image systems based on GPU |
Families Citing this family (3)
| Publication number | Priority date | Publication date | Assignee | Title |
|---|---|---|---|---|
| US11029289B2 (en) * | 2016-12-22 | 2021-06-08 | Olympus America Inc. | Ultrasonic TFM with calculated angle beams |
| TWI743411B (en) * | 2017-11-08 | 2021-10-21 | 美商富士膠片索諾聲公司 | Ultrasound system with high frequency detail |
| CN110058219B (en) * | 2018-12-30 | 2021-11-09 | 上海微波技术研究所(中国电子科技集团公司第五十研究所) | MIMO harmonic radar |
Citations (2)
| Publication number | Priority date | Publication date | Assignee | Title |
|---|---|---|---|---|
| EP2815701A1 (en) * | 2012-02-15 | 2014-12-24 | Hitachi, Ltd. | Ultrasonic imaging device |
| JP2015071028A (en) | 2013-09-05 | 2015-04-16 | セイコーエプソン株式会社 | Ultrasonic measuring device, ultrasonic imaging device, and ultrasonic measuring method |
Family Cites Families (11)
| Publication number | Priority date | Publication date | Assignee | Title |
|---|---|---|---|---|
| KR100511292B1 (en) * | 2002-04-30 | 2005-08-31 | 엘지전자 주식회사 | Update method for beamforming weight vector of rake receiver and receiving apparatus using beamforming weight vector |
| JP6218400B2 (en) * | 2012-03-15 | 2017-10-25 | 東芝メディカルシステムズ株式会社 | Ultrasonic diagnostic apparatus and control program for ultrasonic diagnostic apparatus |
| KR20140056597A (en) * | 2012-10-30 | 2014-05-12 | 삼성전자주식회사 | Method for determining a coefficient for beam-forming, beam-forming method and ultrasonic diagnostic apparatus |
| KR102185415B1 (en) * | 2013-01-11 | 2020-12-02 | 삼성전자주식회사 | Beam forming module, ultrasonic imaging apparatus using the same, method for beam forming using the beam forming module and method for controlling a ultrasonic imaging apparatus using the same |
| KR20150008261A (en) * | 2013-07-11 | 2015-01-22 | 삼성전자주식회사 | Beam former, method for beam forming, ultrasonic imaging apparatus and method for controlling the ultrasonic imaging apparatus |
| JP2015077393A (en) * | 2013-09-10 | 2015-04-23 | セイコーエプソン株式会社 | Ultrasonic measurement apparatus, ultrasonic image apparatus, and ultrasonic measurement method |
| KR20150118734A (en) * | 2014-04-15 | 2015-10-23 | 삼성전자주식회사 | Ultrasound imaging apparatus and control method for the same |
| KR101645590B1 (en) * | 2014-08-22 | 2016-08-05 | 한국지이초음파 유한회사 | Method and Apparatus of adaptive beamforming |
| JP6398614B2 (en) | 2014-10-30 | 2018-10-03 | セイコーエプソン株式会社 | Ultrasonic measuring device, ultrasonic diagnostic device and ultrasonic measuring method |
| WO2016072541A1 (en) * | 2014-11-07 | 2016-05-12 | 삼성전자주식회사 | Ultrasonic imaging device and method for controlling same |
| KR20160097862A (en) * | 2015-02-10 | 2016-08-18 | 삼성전자주식회사 | Portable ultrasound apparatus, and control method for same |
-
2016
- 2016-03-18 JP JP2016054944A patent/JP2017164408A/en active Pending
-
2017
- 2017-03-06 CN CN201710129834.6A patent/CN107204020B/en active Active
- 2017-03-13 US US15/456,897 patent/US10444200B2/en active Active
- 2017-03-16 EP EP17161315.1A patent/EP3220161B1/en active Active
Patent Citations (2)
| Publication number | Priority date | Publication date | Assignee | Title |
|---|---|---|---|---|
| EP2815701A1 (en) * | 2012-02-15 | 2014-12-24 | Hitachi, Ltd. | Ultrasonic imaging device |
| JP2015071028A (en) | 2013-09-05 | 2015-04-16 | セイコーエプソン株式会社 | Ultrasonic measuring device, ultrasonic imaging device, and ultrasonic measuring method |
Non-Patent Citations (1)
| Title |
|---|
| ARE CHARLES JENSEN ET AL: "An approach to multibeam covariance matrices for adaptive beamforming in ultrasonography", IEEE TRANSACTIONS ON ULTRASONICS, FERROELECTRICS AND FREQUENCY CONTROL, IEEE, US, vol. 59, no. 6, 1 June 2012 (2012-06-01), pages 1139 - 1148, XP011447666, ISSN: 0885-3010, DOI: 10.1109/TUFFC.2012.2304 * |
Cited By (2)
| Publication number | Priority date | Publication date | Assignee | Title |
|---|---|---|---|---|
| CN108354626A (en) * | 2018-03-31 | 2018-08-03 | 华南理工大学 | A variety of MV high clearing systems fast medical ultrasonic image systems based on GPU |
| WO2019184343A1 (en) * | 2018-03-31 | 2019-10-03 | 华南理工大学 | Gpu-based multiple mv high-definition algorithm fast medical ultrasound imaging system |
Also Published As
| Publication number | Publication date |
|---|---|
| US20170269040A1 (en) | 2017-09-21 |
| US10444200B2 (en) | 2019-10-15 |
| CN107204020A (en) | 2017-09-26 |
| CN107204020B (en) | 2023-06-23 |
| JP2017164408A (en) | 2017-09-21 |
| EP3220161B1 (en) | 2021-04-28 |
Similar Documents
| Publication | Publication Date | Title |
|---|---|---|
| JP5373308B2 (en) | Ultrasonic imaging apparatus and ultrasonic imaging method | |
| CN101176675B (en) | Ultrasonic diagnostic apparatus, ultrasonic image processing method | |
| EP3220161B1 (en) | Image generation apparatus and image generation method | |
| EP2846169A1 (en) | Ultrasonic measurement apparatus, ultrasonic imaging apparatus, and ultrasonic measurement method | |
| JP6733478B2 (en) | Ultrasonic signal processing device, ultrasonic signal processing method, and ultrasonic diagnostic device | |
| EP2944266A1 (en) | Ultrasonic imaging device | |
| CN107569254B (en) | Ultrasonic signal processing device, ultrasonic signal processing method, and ultrasonic diagnostic device | |
| JP6025456B2 (en) | Subject information acquisition apparatus, display method, and program | |
| JP6819184B2 (en) | Ultrasonic measuring device and control method of ultrasonic measuring device | |
| WO2015146227A1 (en) | Acoustic wave processing device, method for processing signals in acoustic wave processing device, and program | |
| US20220225964A1 (en) | Ultrasound imaging device, signal processing device, and signal processing method | |
| JP2022122023A (en) | ULTRASOUND DIAGNOSTIC APPARATUS, SETTING CONTROL METHOD AND SETTING CONTROL PROGRAM | |
| JP6387903B2 (en) | Ultrasonic signal processor | |
| JP5504357B1 (en) | Ultrasonic diagnostic equipment | |
| JP7211150B2 (en) | ULTRASOUND DIAGNOSTIC DEVICE, ULTRASOUND IMAGE GENERATING METHOD AND PROGRAM | |
| US11366223B2 (en) | Ultrasound imaging apparatus, image processing apparatus, and image processing program | |
| US20180059229A1 (en) | Vector Velocity Estimation Using Transverse Oscillation (TO) and Synthetic Aperture Sequential Beamforming (SASB) | |
| JP2012135523A (en) | Ultrasonic diagnostic apparatus | |
| JP6776766B2 (en) | Ultrasonic measuring device and control method of ultrasonic measuring device | |
| EP4575569A2 (en) | Ultrasound diagnostic apparatus | |
| JP6143541B2 (en) | Ultrasonic diagnostic apparatus and control program | |
| US20170153322A1 (en) | Ultrasonic imaging device and method of generating ultrasonic image | |
| JP4610781B2 (en) | Ultrasonic beam adjustment method and apparatus, and ultrasonic diagnostic apparatus | |
| JP6878886B2 (en) | Ultrasonic measuring device and control method of ultrasonic measuring device | |
| JP2010011904A (en) | Ultrasonic diagnostic apparatus, medical image processor and medical image processing program |
Legal Events
| Date | Code | Title | Description |
|---|---|---|---|
| PUAI | Public reference made under article 153(3) epc to a published international application that has entered the european phase |
Free format text: ORIGINAL CODE: 0009012 |
|
| STAA | Information on the status of an ep patent application or granted ep patent |
Free format text: STATUS: THE APPLICATION HAS BEEN PUBLISHED |
|
| AK | Designated contracting states |
Kind code of ref document: A1 Designated state(s): AL AT BE BG CH CY CZ DE DK EE ES FI FR GB GR HR HU IE IS IT LI LT LU LV MC MK MT NL NO PL PT RO RS SE SI SK SM TR |
|
| AX | Request for extension of the european patent |
Extension state: BA ME |
|
| STAA | Information on the status of an ep patent application or granted ep patent |
Free format text: STATUS: REQUEST FOR EXAMINATION WAS MADE |
|
| 17P | Request for examination filed |
Effective date: 20180123 |
|
| RBV | Designated contracting states (corrected) |
Designated state(s): AL AT BE BG CH CY CZ DE DK EE ES FI FR GB GR HR HU IE IS IT LI LT LU LV MC MK MT NL NO PL PT RO RS SE SI SK SM TR |
|
| RIC1 | Information provided on ipc code assigned before grant |
Ipc: G01S 15/89 20060101ALI20201217BHEP Ipc: G01S 7/52 20060101AFI20201217BHEP |
|
| GRAP | Despatch of communication of intention to grant a patent |
Free format text: ORIGINAL CODE: EPIDOSNIGR1 |
|
| STAA | Information on the status of an ep patent application or granted ep patent |
Free format text: STATUS: GRANT OF PATENT IS INTENDED |
|
| INTG | Intention to grant announced |
Effective date: 20210122 |
|
| GRAS | Grant fee paid |
Free format text: ORIGINAL CODE: EPIDOSNIGR3 |
|
| GRAA | (expected) grant |
Free format text: ORIGINAL CODE: 0009210 |
|
| STAA | Information on the status of an ep patent application or granted ep patent |
Free format text: STATUS: THE PATENT HAS BEEN GRANTED |
|
| AK | Designated contracting states |
Kind code of ref document: B1 Designated state(s): AL AT BE BG CH CY CZ DE DK EE ES FI FR GB GR HR HU IE IS IT LI LT LU LV MC MK MT NL NO PL PT RO RS SE SI SK SM TR |
|
| REG | Reference to a national code |
Ref country code: GB Ref legal event code: FG4D |
|
| REG | Reference to a national code |
Ref country code: CH Ref legal event code: EP |
|
| REG | Reference to a national code |
Ref country code: AT Ref legal event code: REF Ref document number: 1387690 Country of ref document: AT Kind code of ref document: T Effective date: 20210515 |
|
| REG | Reference to a national code |
Ref country code: DE Ref legal event code: R096 Ref document number: 602017037429 Country of ref document: DE |
|
| REG | Reference to a national code |
Ref country code: IE Ref legal event code: FG4D |
|
| REG | Reference to a national code |
Ref country code: LT Ref legal event code: MG9D |
|
| REG | Reference to a national code |
Ref country code: AT Ref legal event code: MK05 Ref document number: 1387690 Country of ref document: AT Kind code of ref document: T Effective date: 20210428 |
|
| PG25 | Lapsed in a contracting state [announced via postgrant information from national office to epo] |
Ref country code: LT Free format text: LAPSE BECAUSE OF FAILURE TO SUBMIT A TRANSLATION OF THE DESCRIPTION OR TO PAY THE FEE WITHIN THE PRESCRIBED TIME-LIMIT Effective date: 20210428 Ref country code: FI Free format text: LAPSE BECAUSE OF FAILURE TO SUBMIT A TRANSLATION OF THE DESCRIPTION OR TO PAY THE FEE WITHIN THE PRESCRIBED TIME-LIMIT Effective date: 20210428 Ref country code: HR Free format text: LAPSE BECAUSE OF FAILURE TO SUBMIT A TRANSLATION OF THE DESCRIPTION OR TO PAY THE FEE WITHIN THE PRESCRIBED TIME-LIMIT Effective date: 20210428 Ref country code: BG Free format text: LAPSE BECAUSE OF FAILURE TO SUBMIT A TRANSLATION OF THE DESCRIPTION OR TO PAY THE FEE WITHIN THE PRESCRIBED TIME-LIMIT Effective date: 20210728 Ref country code: AT Free format text: LAPSE BECAUSE OF FAILURE TO SUBMIT A TRANSLATION OF THE DESCRIPTION OR TO PAY THE FEE WITHIN THE PRESCRIBED TIME-LIMIT Effective date: 20210428 Ref country code: NL Free format text: LAPSE BECAUSE OF FAILURE TO SUBMIT A TRANSLATION OF THE DESCRIPTION OR TO PAY THE FEE WITHIN THE PRESCRIBED TIME-LIMIT Effective date: 20210428 |
|
| PG25 | Lapsed in a contracting state [announced via postgrant information from national office to epo] |
Ref country code: GR Free format text: LAPSE BECAUSE OF FAILURE TO SUBMIT A TRANSLATION OF THE DESCRIPTION OR TO PAY THE FEE WITHIN THE PRESCRIBED TIME-LIMIT Effective date: 20210729 Ref country code: IS Free format text: LAPSE BECAUSE OF FAILURE TO SUBMIT A TRANSLATION OF THE DESCRIPTION OR TO PAY THE FEE WITHIN THE PRESCRIBED TIME-LIMIT Effective date: 20210828 Ref country code: LV Free format text: LAPSE BECAUSE OF FAILURE TO SUBMIT A TRANSLATION OF THE DESCRIPTION OR TO PAY THE FEE WITHIN THE PRESCRIBED TIME-LIMIT Effective date: 20210428 Ref country code: RS Free format text: LAPSE BECAUSE OF FAILURE TO SUBMIT A TRANSLATION OF THE DESCRIPTION OR TO PAY THE FEE WITHIN THE PRESCRIBED TIME-LIMIT Effective date: 20210428 Ref country code: SE Free format text: LAPSE BECAUSE OF FAILURE TO SUBMIT A TRANSLATION OF THE DESCRIPTION OR TO PAY THE FEE WITHIN THE PRESCRIBED TIME-LIMIT Effective date: 20210428 Ref country code: NO Free format text: LAPSE BECAUSE OF FAILURE TO SUBMIT A TRANSLATION OF THE DESCRIPTION OR TO PAY THE FEE WITHIN THE PRESCRIBED TIME-LIMIT Effective date: 20210728 Ref country code: PT Free format text: LAPSE BECAUSE OF FAILURE TO SUBMIT A TRANSLATION OF THE DESCRIPTION OR TO PAY THE FEE WITHIN THE PRESCRIBED TIME-LIMIT Effective date: 20210830 Ref country code: PL Free format text: LAPSE BECAUSE OF FAILURE TO SUBMIT A TRANSLATION OF THE DESCRIPTION OR TO PAY THE FEE WITHIN THE PRESCRIBED TIME-LIMIT Effective date: 20210428 |
|
| REG | Reference to a national code |
Ref country code: NL Ref legal event code: MP Effective date: 20210428 |
|
| PG25 | Lapsed in a contracting state [announced via postgrant information from national office to epo] |
Ref country code: SK Free format text: LAPSE BECAUSE OF FAILURE TO SUBMIT A TRANSLATION OF THE DESCRIPTION OR TO PAY THE FEE WITHIN THE PRESCRIBED TIME-LIMIT Effective date: 20210428 Ref country code: SM Free format text: LAPSE BECAUSE OF FAILURE TO SUBMIT A TRANSLATION OF THE DESCRIPTION OR TO PAY THE FEE WITHIN THE PRESCRIBED TIME-LIMIT Effective date: 20210428 Ref country code: EE Free format text: LAPSE BECAUSE OF FAILURE TO SUBMIT A TRANSLATION OF THE DESCRIPTION OR TO PAY THE FEE WITHIN THE PRESCRIBED TIME-LIMIT Effective date: 20210428 Ref country code: CZ Free format text: LAPSE BECAUSE OF FAILURE TO SUBMIT A TRANSLATION OF THE DESCRIPTION OR TO PAY THE FEE WITHIN THE PRESCRIBED TIME-LIMIT Effective date: 20210428 Ref country code: DK Free format text: LAPSE BECAUSE OF FAILURE TO SUBMIT A TRANSLATION OF THE DESCRIPTION OR TO PAY THE FEE WITHIN THE PRESCRIBED TIME-LIMIT Effective date: 20210428 Ref country code: RO Free format text: LAPSE BECAUSE OF FAILURE TO SUBMIT A TRANSLATION OF THE DESCRIPTION OR TO PAY THE FEE WITHIN THE PRESCRIBED TIME-LIMIT Effective date: 20210428 Ref country code: ES Free format text: LAPSE BECAUSE OF FAILURE TO SUBMIT A TRANSLATION OF THE DESCRIPTION OR TO PAY THE FEE WITHIN THE PRESCRIBED TIME-LIMIT Effective date: 20210428 |
|
| REG | Reference to a national code |
Ref country code: DE Ref legal event code: R097 Ref document number: 602017037429 Country of ref document: DE |
|
| PLBE | No opposition filed within time limit |
Free format text: ORIGINAL CODE: 0009261 |
|
| STAA | Information on the status of an ep patent application or granted ep patent |
Free format text: STATUS: NO OPPOSITION FILED WITHIN TIME LIMIT |
|
| 26N | No opposition filed |
Effective date: 20220131 |
|
| PG25 | Lapsed in a contracting state [announced via postgrant information from national office to epo] |
Ref country code: IS Free format text: LAPSE BECAUSE OF FAILURE TO SUBMIT A TRANSLATION OF THE DESCRIPTION OR TO PAY THE FEE WITHIN THE PRESCRIBED TIME-LIMIT Effective date: 20210828 Ref country code: AL Free format text: LAPSE BECAUSE OF FAILURE TO SUBMIT A TRANSLATION OF THE DESCRIPTION OR TO PAY THE FEE WITHIN THE PRESCRIBED TIME-LIMIT Effective date: 20210428 |
|
| PG25 | Lapsed in a contracting state [announced via postgrant information from national office to epo] |
Ref country code: IT Free format text: LAPSE BECAUSE OF FAILURE TO SUBMIT A TRANSLATION OF THE DESCRIPTION OR TO PAY THE FEE WITHIN THE PRESCRIBED TIME-LIMIT Effective date: 20210428 |
|
| PG25 | Lapsed in a contracting state [announced via postgrant information from national office to epo] |
Ref country code: MC Free format text: LAPSE BECAUSE OF FAILURE TO SUBMIT A TRANSLATION OF THE DESCRIPTION OR TO PAY THE FEE WITHIN THE PRESCRIBED TIME-LIMIT Effective date: 20210428 |
|
| REG | Reference to a national code |
Ref country code: CH Ref legal event code: PL |
|
| REG | Reference to a national code |
Ref country code: BE Ref legal event code: MM Effective date: 20220331 |
|
| PG25 | Lapsed in a contracting state [announced via postgrant information from national office to epo] |
Ref country code: LU Free format text: LAPSE BECAUSE OF NON-PAYMENT OF DUE FEES Effective date: 20220316 Ref country code: LI Free format text: LAPSE BECAUSE OF NON-PAYMENT OF DUE FEES Effective date: 20220331 Ref country code: IE Free format text: LAPSE BECAUSE OF NON-PAYMENT OF DUE FEES Effective date: 20220316 Ref country code: CH Free format text: LAPSE BECAUSE OF NON-PAYMENT OF DUE FEES Effective date: 20220331 |
|
| PG25 | Lapsed in a contracting state [announced via postgrant information from national office to epo] |
Ref country code: BE Free format text: LAPSE BECAUSE OF NON-PAYMENT OF DUE FEES Effective date: 20220331 |
|
| PG25 | Lapsed in a contracting state [announced via postgrant information from national office to epo] |
Ref country code: HU Free format text: LAPSE BECAUSE OF FAILURE TO SUBMIT A TRANSLATION OF THE DESCRIPTION OR TO PAY THE FEE WITHIN THE PRESCRIBED TIME-LIMIT; INVALID AB INITIO Effective date: 20170316 |
|
| PG25 | Lapsed in a contracting state [announced via postgrant information from national office to epo] |
Ref country code: MK Free format text: LAPSE BECAUSE OF FAILURE TO SUBMIT A TRANSLATION OF THE DESCRIPTION OR TO PAY THE FEE WITHIN THE PRESCRIBED TIME-LIMIT Effective date: 20210428 Ref country code: CY Free format text: LAPSE BECAUSE OF FAILURE TO SUBMIT A TRANSLATION OF THE DESCRIPTION OR TO PAY THE FEE WITHIN THE PRESCRIBED TIME-LIMIT Effective date: 20210428 |
|
| PG25 | Lapsed in a contracting state [announced via postgrant information from national office to epo] |
Ref country code: TR Free format text: LAPSE BECAUSE OF FAILURE TO SUBMIT A TRANSLATION OF THE DESCRIPTION OR TO PAY THE FEE WITHIN THE PRESCRIBED TIME-LIMIT Effective date: 20210428 |
|
| PG25 | Lapsed in a contracting state [announced via postgrant information from national office to epo] |
Ref country code: MT Free format text: LAPSE BECAUSE OF FAILURE TO SUBMIT A TRANSLATION OF THE DESCRIPTION OR TO PAY THE FEE WITHIN THE PRESCRIBED TIME-LIMIT Effective date: 20210428 |
|
| PGFP | Annual fee paid to national office [announced via postgrant information from national office to epo] |
Ref country code: GB Payment date: 20260202 Year of fee payment: 10 |
|
| PGFP | Annual fee paid to national office [announced via postgrant information from national office to epo] |
Ref country code: DE Payment date: 20260128 Year of fee payment: 10 |
|
| PGFP | Annual fee paid to national office [announced via postgrant information from national office to epo] |
Ref country code: FR Payment date: 20260209 Year of fee payment: 10 |