EP3218675B1 - Method and apparatus for detecting, assessing and displaying measured values of motors of electric drives - Google Patents
Method and apparatus for detecting, assessing and displaying measured values of motors of electric drives Download PDFInfo
- Publication number
- EP3218675B1 EP3218675B1 EP15788407.3A EP15788407A EP3218675B1 EP 3218675 B1 EP3218675 B1 EP 3218675B1 EP 15788407 A EP15788407 A EP 15788407A EP 3218675 B1 EP3218675 B1 EP 3218675B1
- Authority
- EP
- European Patent Office
- Prior art keywords
- data
- measurement values
- values
- time
- colour
- Prior art date
- Legal status (The legal status is an assumption and is not a legal conclusion. Google has not performed a legal analysis and makes no representation as to the accuracy of the status listed.)
- Active
Links
- 238000000034 method Methods 0.000 title claims description 24
- 238000005259 measurement Methods 0.000 claims description 25
- 238000011156 evaluation Methods 0.000 claims description 18
- 230000008569 process Effects 0.000 claims description 10
- 238000012545 processing Methods 0.000 claims description 10
- 230000008859 change Effects 0.000 claims description 4
- 238000012423 maintenance Methods 0.000 description 3
- 230000004888 barrier function Effects 0.000 description 2
- 239000003086 colorant Substances 0.000 description 2
- 230000001419 dependent effect Effects 0.000 description 2
- 238000011161 development Methods 0.000 description 2
- 230000018109 developmental process Effects 0.000 description 2
- 238000011835 investigation Methods 0.000 description 2
- 230000002123 temporal effect Effects 0.000 description 2
- 230000001960 triggered effect Effects 0.000 description 2
- 230000001154 acute effect Effects 0.000 description 1
- 230000005540 biological transmission Effects 0.000 description 1
- 125000004122 cyclic group Chemical group 0.000 description 1
- 230000007613 environmental effect Effects 0.000 description 1
- 230000008439 repair process Effects 0.000 description 1
- 230000007704 transition Effects 0.000 description 1
Images

Classifications
-
- G—PHYSICS
- G01—MEASURING; TESTING
- G01D—MEASURING NOT SPECIALLY ADAPTED FOR A SPECIFIC VARIABLE; ARRANGEMENTS FOR MEASURING TWO OR MORE VARIABLES NOT COVERED IN A SINGLE OTHER SUBCLASS; TARIFF METERING APPARATUS; MEASURING OR TESTING NOT OTHERWISE PROVIDED FOR
- G01D7/00—Indicating measured values
- G01D7/02—Indicating value of two or more variables simultaneously
- G01D7/08—Indicating value of two or more variables simultaneously using a common indicating element for two or more variables
- G01D7/10—Indicating value of two or more variables simultaneously using a common indicating element for two or more variables giving indication in co-ordinate form
-
- G—PHYSICS
- G07—CHECKING-DEVICES
- G07C—TIME OR ATTENDANCE REGISTERS; REGISTERING OR INDICATING THE WORKING OF MACHINES; GENERATING RANDOM NUMBERS; VOTING OR LOTTERY APPARATUS; ARRANGEMENTS, SYSTEMS OR APPARATUS FOR CHECKING NOT PROVIDED FOR ELSEWHERE
- G07C3/00—Registering or indicating the condition or the working of machines or other apparatus, other than vehicles
Definitions
- the invention relates to a method for detecting, evaluating and displaying measured values of motors of electric drives and to a device for implementing the method.
- Umstellvor bland between mechanical states using electric motors are realized. Frequently, the switching processes are cyclical in the sense that always between at least two defined states and is made. Examples of such electrically driven systems are barriers for level crossings, drives for changing over the points position in rail-bound traffic or drives for opening and closing windows, gates, etc.
- the positioning motors run in a reproducible manner from defined initial to defined end points and back again. If the functionality and the technical condition of such systems are to be monitored, it is necessary, among other things, to make a statement about the sluggishness of the system. For this purpose, for example, the electrical characteristic curves of the drive motors are determined and evaluated.
- an evaluation of the measured value data is required. For point drives, for example, the current profile during a changeover process is recorded and compared with a reference curve. The data is displayed on an output device which has an ordinary coordinate system in which the abscissa is the measuring time and the ordinate is the current intensity or the difference between the measured current values and the reference curve. In such a representation, however, a comparison with earlier or later measurements is difficult to make clear.
- the DE 197 33 001 A1 describes a method for the acquisition, evaluation and display of measured values, in which the measured or comparison values are displayed in alphanumeric Form are shown, wherein the alphanumeric representation of a measurement or comparison value is assigned in each case a color value in the representation, which is selected in each case depending on the determined comparison value.
- the document DE 32 37 407 A1 shows a method and device for acquiring, evaluating and displaying measured values of motors, in which a speed sensor measures measured values and transmits them to a computer, which processes them and displays the measurement results on a display as a family of curves that codes in color can be.
- Object of the present invention is to provide a method by which the technical condition of electric motors motors can not only be assessed at a given time, but also the temporal evolution of the state is detected and illustrated, so also statements about an expected maintenance can be made and conclusions about the causes of state changes can be drawn. Furthermore, a device is to be provided, which implements the method.
- the method according to the invention as claimed in claim 1 represents a measuring method in which the measured values of motors of electric drives are recorded, evaluated and displayed.
- the electrical characteristic values of the motor measured by at least one sensor can be used as measured values.
- frame parameters such as temperature, humidity, etc. can also be measured and included in the evaluation.
- the measured values are transmitted to a data processing system where they are stored and evaluated.
- an evaluation function can compare the measured values with reference values under the given conditions and use only the differences between the measured values and the reference values as further data to be considered.
- the measured values can be compared with one another over a period of time that is dependent on the mechanical position of the driven components. If, for example, the startup behavior of the Engine changes due to a wear-related mechanical stiffness, the power consumption of the drive will gradually increase over time. In order to be able to recognize such a trend at an early stage, the data from a longer period must be compared with each other.
- a multidimensional representation is only clear when the information is edited. This is done according to the invention by considering two time coordinates.
- the measured values within one revolution cycle of the drive are described as a function of the one time coordinate, which is referred to as the circulation time T U.
- both coordinate axes are selected perpendicular to one another. In the x direction, for example, T V can be represented, while the y direction is characterized by T U.
- the zi values are color-coded.
- the sequence of colored data points in the y direction indicates the difference between the data value and the reference value within a circulation time T U , which was measured during one revolution at time T Vi .
- T U circulation time
- the amount of information is reduced in that not every single z-value, but only certain value classes are coded, which are based on defined tolerance values for the data.
- the data points along a parallels to the comparison time axis are then analyzed to determine whether a change in the data points takes place in the direction of a tolerance limit to be defined. If a data value gradually exceeds ever higher tolerance thresholds during a certain phase of the drive, it is to be expected that a critical state of the drive follows, so that here too a message appears at the output unit indicating that the system is being serviced by the service personnel must be examined.
- Claims 4 to 6 relate to a device for implementing the method of the previous claims.
- a device which records, stores, evaluates and displays the measured values of motors of electric drives.
- the device consists of at least one measuring sensor, which is connected to a data processing system which has an output unit for displaying the evaluation results and means for data input.
- the evaluation of the measured data takes place with the help of the data processing system.
- the electrical characteristic values of the motor measured by at least one sensor can be used as measured values.
- the device also measure frame parameters such as temperature, humidity, etc. and include them in the evaluation. For the evaluation of the data, it may be advantageous if the device processes the measured values appropriately.
- the device can compare the measured values with reference values under the given boundary conditions and use only the differences between the measured values and the reference values as further data to be considered.
- the device according to the invention considers two time coordinates. It describes the measured values within a circulation cycle of the drive as a function of the orbital period T U.
- the representation of the data takes place in a two-dimensional coordinate system with two mutually perpendicular coordinate axes, with T V as the abscissa (x-axis) and T U as the ordinate (y-axis).
- the device displays on its output unit the values of the data belonging to each (yi; zi) pair in the coordinate system by projecting the measured values onto the T U axis and thereby the measured values given by the zi values. color coded.
- the sequence of colored data points in the y direction indicates the difference between the data value and the reference value within a circulation time T U , which was measured during one revolution at time T Vi .
- the device displays on its output unit the data values at T V (i + 1) in the same way. Since the (y (i + 1); z (i + 1)) value pairs For the (yi; zi) value pairs in the direction of the T V axis are parallel shifted, the two juxtaposed measurements can be easily compared with each other for evaluation.
- the device reduces the amount of information in that it does not encode each individual measured value in the measuring area with its own color, but only certain value classes, which are based on defined tolerance values for the data.
- the device assigns only a few colors correspondingly to the z values. Based on Color of the data point is thus recognizable which tolerance limit of the data point (y; z) is exceeded.
- the device advantageously indicates an investigation requirement of the drive. This occurs, for example, when a data point has reached a tolerance limit to be defined, which is known as proof of damage or a threat to the drive, at least once.
- the device analyzes the data points along a parallel to the comparison time axis to determine whether a change of the data points takes place in the direction of a tolerance limit to be defined. If a data value gradually exceeds ever higher tolerance thresholds during a certain phase of the drive's revolution, the device at the output unit issues a message indicating that the system must be inspected by service personnel.
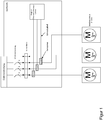
- Fig. 1 shows an example of the analysis of points in the rail network of a track-bound transport system.
- magnetic field sensors that are designed, for example, as 3D or multidimensional magnetic field sensors
- the measured magnetic fields from a data processing system determine the current strength and the direction of rotation of the point machine.
- the current waveform is used in the analysis of the data as a measure of the stiffness of the switch.
- each 4-wire turnout drive cable is assigned a single stroke;
- the diagnostic device measures directly on the existing cabling of the respective point machine drive, near a terminal block. Ideally, the terminal strip between the outer cable and the inner cable is used for this purpose.
- the transmission of the measured data takes place by means of a suitable interface.
- a suitable interface In this example a 4-20 mA interface is used.
- wired interfaces are possible, as well as wireless, eg wireless interfaces.
- the control of the measurement process, the preparation of the measurement data and the forwarding to a diagnostic system are functions of the connected data processing.
- Fig. 2 shows an exemplary representation of the measured data for the evaluation of the data of the points drive.
- the measured current values are subtracted from the reference values of an intact drive stored in a database.
- the differences from the reference values, ⁇ I are divided into tolerance ranges. No or only slight deviations from the reference value are assigned to the tolerance range T0 in this example. Larger deviations in the tolerance ranges T1 to T4. When the tolerance range T4 is reached, there is an acute danger to the functionality of the drive. Negative deviations indicate better drive stiffness compared to the reference values.
- These measured values are assigned to the tolerance range T-1. Each tolerance range is now assigned its own color when displaying the measured values.
- the color green is assigned to the tolerance range T0 in this example and thus stands for a correspondence of the measured data with the reference values or an insignificant deviation.
- T1 to T4 are assigned, for example, the colors yellow, orange, bright red and dark red, T-1 the color blue.
- the comparison time T V is plotted in the x direction, and the y direction shows the measured values during one revolution (T U ) of the drive.
- T U The comparison time
- a prediction of the expected temporal course of damage is displayed by comparison with data stored in the database. Based on this forecast, the optimal maintenance time can be determined.
- the optimal maintenance time can be determined in the upper area of the FIG. 2 (Left-hand rotation) is an example of how a sudden transition from green color values to red occurs.
- an event has caused a damage to the switch, which must be rectified immediately. Accordingly, an alarm message is issued and an immediate check of the system is triggered.
- the spare parts needed for the repair are determined and displayed by comparison with the data stored in a database.
Description
Die Erfindung betrifft ein Verfahren zur Erfassung, Auswertung und Darstellung von Messwerten von Motoren elektrischer Antriebe und eine Vorrichtung zur Umsetzung des Verfahrens.The invention relates to a method for detecting, evaluating and displaying measured values of motors of electric drives and to a device for implementing the method.
In zahlreichen technischen Vorrichtungen werden Umstellvorgänge zwischen mechanischen Zuständen mithilfe von Elektromotoren realisiert. Häufig sind die Umstellvorgänge in dem Sinne zyklisch, dass immer zwischen mindestens zwei definierten Zuständen hin- und hergestellt wird. Beispiele für solche elektrisch angetriebenen Anlagen sind Schranken für Bahnübergänge, Antriebe zum Umstellen der Weichenlage bei schienengebundenem Verkehr oder Antriebe zum Öffnen und Schließen von Fenstern, Toren, etc. Die Stellmotoren laufen dabei in reproduzierbarer Weise von definierten Anfangs- zu definierten Endpunkten und wieder zurück.
Wenn die Funktionsfähigkeit und der technische Zustand solcher Anlagen überwacht werden sollen, ist es u.a. erforderlich, eine Aussage über die Schwergängigkeit der Anlage zu treffen. Hierzu werden beispielsweise die elektrischen Kennkurven der Antriebsmotoren ermittelt und ausgewertet. Eine Schwergängigkeit, die z.B. durch Verschleiß hervorgerufen werden kann, würde sich dadurch bemerkbar machen, dass eine höhere Leistungsaufnahme des Motors gemessen wird, als durch Referenzwerte vorgegeben ist.
Um den technischen Zustand der elektrisch angetriebenen Anlage beurteilen zu können, ist eine Auswertung der Messwert-Daten erforderlich.
Bei Weichenantrieben wird beispielsweise hierfür der Stromverlauf während eines Umstellvorgangs aufgenommen und mit einer Referenzkurve verglichen.
Die Darstellung der Daten erfolgt dabei an einem Ausgabegerät, das ein gewöhnliches Koordinatensystem aufweist, bei dem als Abszisse die Messzeit und als Ordinate die Stromstärke bzw. die Differenz zwischen den gemessenen Stromwerten und der Referenzkurve gewählt wird.
Bei einer solchen Darstellung ist jedoch ein Vergleich mit früheren oder späteren Messungen nur schwer anschaulich zu machen.In numerous technical devices Umstellvorgänge between mechanical states using electric motors are realized. Frequently, the switching processes are cyclical in the sense that always between at least two defined states and is made. Examples of such electrically driven systems are barriers for level crossings, drives for changing over the points position in rail-bound traffic or drives for opening and closing windows, gates, etc. The positioning motors run in a reproducible manner from defined initial to defined end points and back again.
If the functionality and the technical condition of such systems are to be monitored, it is necessary, among other things, to make a statement about the sluggishness of the system. For this purpose, for example, the electrical characteristic curves of the drive motors are determined and evaluated. A stiffness, which can be caused by wear, for example, would be noticeable by the fact that a higher power consumption of the engine is measured than specified by reference values.
In order to assess the technical condition of the electrically driven system, an evaluation of the measured value data is required.
For point drives, for example, the current profile during a changeover process is recorded and compared with a reference curve.
The data is displayed on an output device which has an ordinary coordinate system in which the abscissa is the measuring time and the ordinate is the current intensity or the difference between the measured current values and the reference curve.
In such a representation, however, a comparison with earlier or later measurements is difficult to make clear.
Die
Das Dokument
Aufgabe der vorliegenden Erfindung ist es, ein Verfahren bereitzustellen, mit dem der technische Zustand von Motoren elektrischer Antriebe nicht nur zu einem gegebenen Zeitpunkt beurteilt werden kann, sondern auch die zeitliche Entwicklung des Zustands erfasst und veranschaulicht wird, sodass auch Aussagen über einen zu erwartenden Wartungsaufwand getroffen werden können und Rückschlüsse bzgl. der Ursachen von Zustandsänderungen gezogen werden können. Weiterhin soll eine Vorrichtung bereitgestellt werden, welche das Verfahren umsetzt.Object of the present invention is to provide a method by which the technical condition of electric motors motors can not only be assessed at a given time, but also the temporal evolution of the state is detected and illustrated, so also statements about an expected maintenance can be made and conclusions about the causes of state changes can be drawn. Furthermore, a device is to be provided, which implements the method.
Diese Aufgaben werden durch das erfindungsgemäße Verfahren gemäß Anspruch 1 und die zugehörige Vorrichtung gemäß Anspruch 4 gelöst. Vorteilhafte Weiterbildungen sind Gegenstände der abhängigen Ansprüche. Das erfindungsgemäße Verfahren nach Anspruch 1 stellt ein Messverfahren dar, bei dem die Messwerte von Motoren elektrischer Antriebe erfasst, ausgewertet und dargestellt werden. Als Messwerte können insbesondere die von mindestens einem Sensor gemessenen elektrischen Kennwerte des Motors verwendet werden. Weiterhin können auch noch Rahmenparameter wie Temperatur, Feuchtigkeit, etc. gemessen und in die Auswertung einbezogen werden. Die Messwerte werden an eine Datenverarbeitungsanlage übermittelt und dort gespeichert und ausgewertet. Bei der Auswertung kann es vorteilhaft sein, die Messwerte geeignet zu bearbeiten. So kann eine Auswertefunktion beispielsweise die Messwerte mit Referenzwerten unter den gegebenen Rahmenbedingungen vergleichen und als weiter zu betrachtende Daten nur die Differenzen zwischen den Messwerten und den Referenzwerten verwenden. Da elektrische Motoren, wie sie z.B. bei Schranken-, Weichen-, Fenster- oder Torantrieben verwendet werden, ein zyklisches Betriebsmuster haben, lassen sich die Messwerte in Abhängigkeit von der mechanischen Stellung der angetriebenen Komponenten über einen mehrere Stellvorgänge umfassenden Zeitraum hinweg miteinander vergleichen. Wenn sich beispielsweise das Anlaufverhalten des Motors aufgrund einer verschleißbedingten Schwergängigkeit der Mechanik verändert, wird sich der Leistungsaufnahmebedarf des Antriebs über die Zeit allmählich erhöhen. Um solch einen Trend bereits frühzeitig erkennen zu können, müssen die Daten aus einem längeren Zeitraum miteinander verglichen werden. Bei einer Anzeige der Daten auf einer zweidimensionalen Bildschirmoberfläche oder einem zweidimensionalen Papierausdruck ist eine mehrdimensionale Darstellung nur dann übersichtlich, wenn die Information aufbereitet wird. Dies erfolgt erfindungsgemäß, indem zwei Zeitkoordinaten betrachtet werden. Die Messwerte innerhalb eines Umlaufzyklus des Antriebs werden in Abhängigkeit von der einen Zeitkoordinate beschrieben, die als Umlaufzeit TU bezeichnet wird. Die zweite Zeitkoordinate wird als Vergleichszeit TV bezeichnet und gibt den Zeitpunkt jedes einzelnen Umlaufs an. Zwei oder mehr aufeinanderfolgende Umläufe des Antriebs finden demnach zu zwei oder mehr unterschiedlichen Zeitpunkten TV1 und TV2, etc. statt. Zu jedem dieser Zeitpunkte gibt es einen Messwerteverlauf während eines Umlaufs z = fTVi(TU). Um die Abhängigkeit der Daten von beiden Zeitkoordinaten zu beschreiben, werden erfindungsgemäß beide Koordinatenachsen senkrecht zueinander gewählt. In x-Richtung kann beispielsweise TV dargestellt werden, während die y-Richtung durch TU charakterisiert wird. Um nun auf einer zweidimensionalen Darstellungsebene auch noch die zu jedem (yi; zi)-Paar gehörenden Werte der Daten im Koordinatensystem anzuzeigen, könnte eine perspektivische Darstellung gewählt werden. Da diese jedoch schnell unübersichtlich werden kann, wird erfindungsgemäß eine Projektion der z-Achse auf die x-y-Ebene betrachtet. Um dabei eine Information über die Zahlenwerte der Daten darstellen zu können, werden die zi-Werte farblich kodiert. Die Abfolge von farbigen Datenpunkten in y-Richtung zeigt dabei die Differenz zwischen Datenwert und Referenzwert innerhalb einer Umlaufzeit TU an, die bei einem Umlauf zur Zeit TVi gemessen wurde. Beim nächsten Umlauf des Stellantriebs in die gleiche Richtung werden die Datenwerte bei TV(i+1) in der gleichen Weise dargestellt. Da die (y(i+1); z(i+1))-Wertepaare zu den (yi; zi)-Wertepaaren in Richtung der TV-Achse parallelverschoben sind, werden beide Messungen nebeneinander dargestellt und können zur Auswertung leicht miteinander verglichen werden. Datenwerte für gleiche Phasen des Umstellvorgangs bei unterschiedlichen Stellvorgängen liegen dabei immer auf einer Parallelen zur TV-Achse. Dadurch kann die Entwicklung der Messwerte bei jeder Phase des Umstellvorgangs effizient ausgewertet werden, indem man die Entwicklung der Farbe entlang von Parallelen zur x- bzw. TV-Achse analysiert.These objects are achieved by the method according to
Besonders vorteilhaft wird die Informationsmenge dadurch reduziert, dass nicht jeder einzelne z-Wert, sondern nur bestimmte Werteklassen kodiert werden, die sich nach definierten Toleranzwerten für die Daten richten. Durch Vergleich der Daten mit Referenzwerten und einer Vorgabe von einem bis wenigen Toleranzbereichen wird mithilfe von wenigen Farbwerten eine aussagekräftige Darstellung erreicht. Anhand der Farbe des Datenpunkts ist somit erkennbar, welche Toleranzgrenze von dem Datenpunkt (y; z) überschritten wird.Particularly advantageously, the amount of information is reduced in that not every single z-value, but only certain value classes are coded, which are based on defined tolerance values for the data. By comparing the data with reference values and setting from one to a few tolerance ranges, a meaningful representation is achieved with the help of a few color values. On the basis of the color of the data point, it can thus be recognized which tolerance limit is exceeded by the data point (y; z).
Weiterhin ist es vorteilhaft, wenn bei der Auswertung der Daten auf einen Untersuchungsbedarf des Antriebs hingewiesen wird. Dies kann beispielsweise dann erfolgen, wenn ein Datenpunkt eine zu definierende Toleranzgrenze, die als Nachweis eines Schadens oder einer Gefährdung des Antriebs bekannt ist, mindestens einmal erreicht hat.Furthermore, it is advantageous if, in the evaluation of the data, an investigation requirement of the drive is pointed out. This can be done, for example, when a data point has reached a tolerance limit to be defined, which is known as proof of damage or a threat to the drive, at least once.
Weiterhin werden die Datenpunkte entlang einer Parallelen zur Vergleichszeit-Achse daraufhin analysiert, ob eine Veränderung der Datenpunkte in Richtung einer zu definierenden Toleranzgrenze erfolgt. Wenn also ein Datenwert bei einer bestimmten Umlaufphase des Antriebs allmählich immer höhere Toleranzschwellen überschreitet, ist damit zu rechnen, dass ein kritischer Zustand des Antriebs folgt, sodass auch hier eine Meldung an der Ausgabeeinheit erfolgt, die darauf hinweist, dass die Anlage vom Service-Personal untersucht werden muss.Furthermore, the data points along a parallels to the comparison time axis are then analyzed to determine whether a change in the data points takes place in the direction of a tolerance limit to be defined. If a data value gradually exceeds ever higher tolerance thresholds during a certain phase of the drive, it is to be expected that a critical state of the drive follows, so that here too a message appears at the output unit indicating that the system is being serviced by the service personnel must be examined.
Die Ansprüche 4 bis 6 betreffen eine Vorrichtung zur Realisierung des Verfahrens aus den vorigen Ansprüchen.
Erfindungsgemäß vorgesehen ist eine Vorrichtung, welche die Messwerte von Motoren elektrischer Antriebe erfasst, speichert, auswertet und darstellt.
Die Vorrichtung besteht aus mindestens einem Mess-Sensor, der mit einer Datenverarbeitungsanlage verbunden ist, die über eine Ausgabeeinheit zur Darstellung der Auswerteergebnisse sowie über Mittel zur Dateneingabe verfügt. Die Auswertung der Messdaten erfolgt mit Hilfe der Datenverarbeitungsanlage. Als Messwerte können insbesondere die von mindestens einem Sensor gemessenen elektrischen Kennwerte des Motors verwendet werden. Weiterhin kann die Vorrichtung auch noch Rahmenparameter wie Temperatur, Feuchtigkeit, etc. messen und in die Auswertung einbeziehen.
Für die Auswertung der Daten kann es vorteilhaft sein, wenn die Vorrichtung die Messwerte geeignet bearbeitet. So kann die Vorrichtung beispielsweise mit Hilfe einer Auswertefunktion die Messwerte mit Referenzwerten unter den gegebenen Rahmenbedingungen vergleichen und als weiter zu betrachtende Daten nur die Differenzen zwischen den Messwerten und den Referenzwerten verwenden. Die Vorrichtung betrachtet erfindungsgemäß zwei Zeitkoordinaten. Sie beschreibt die Messwerte innerhalb eines Umlaufzyklus des Antriebs in Abhängigkeit von der Umlaufzeit TU. Die zweite Zeitkoordinate wird als Vergleichszeit TV bezeichnet und gibt den Zeitpunkt jedes einzelnen Umlaufs an. Zwei oder mehr aufeinanderfolgende Umläufe des Antriebs finden demnach zu zwei oder mehr unterschiedlichen Zeitpunkten TV1 und TV2, etc. statt. Zu jedem dieser Zeitpunkte gibt es einen Messwerteverlauf während eines Umlaufs z = fTVi(TU).
Die Darstellung der Daten erfolgt in einem zweidimensionalen Koordinatensystem mit zwei senkrecht zueinander stehenden Koordinatenachsen, mit TV als Abszisse (x-Achse) und TU als Ordinate (y-Achse).
Die Vorrichtung zeigt auf ihrer Ausgabeeinheit die zu jedem (yi; zi)-Paar gehörenden Werte der Daten im Koordinatensystem an, indem sie die Messwerte auf die TU-Achse projiziert und dabei die durch die zi-Werte gegebenen Messwerte. farblich kodiert. Die Abfolge von farbigen Datenpunkten in y-Richtung zeigt dabei die Differenz zwischen Datenwert und Referenzwert innerhalb einer Umlaufzeit TU an, die bei einem Umlauf zur Zeit TVi gemessen wurde. Beim nächsten Umlauf des Stellantriebs in die gleiche Richtung stellt die Vorrichtung auf ihrer Ausgabeeinheit die Datenwerte bei TV(i+1) in der gleichen Weise dar. Da die (y(i+1); z(i+1))-Wertepaare zu den (yi; zi)-Wertepaaren in Richtung der TV-Achse parallelverschoben sind, können die beiden nebeneinander dargestellten Messungen zur Auswertung leicht miteinander verglichen werden.According to the invention, a device is provided which records, stores, evaluates and displays the measured values of motors of electric drives.
The device consists of at least one measuring sensor, which is connected to a data processing system which has an output unit for displaying the evaluation results and means for data input. The evaluation of the measured data takes place with the help of the data processing system. In particular, the electrical characteristic values of the motor measured by at least one sensor can be used as measured values. Furthermore, can the device also measure frame parameters such as temperature, humidity, etc. and include them in the evaluation.
For the evaluation of the data, it may be advantageous if the device processes the measured values appropriately. For example, with the aid of an evaluation function, the device can compare the measured values with reference values under the given boundary conditions and use only the differences between the measured values and the reference values as further data to be considered. The device according to the invention considers two time coordinates. It describes the measured values within a circulation cycle of the drive as a function of the orbital period T U. The second time coordinate is referred to as comparison time T V and indicates the time of each individual cycle. Two or more consecutive revolutions of the drive therefore take place at two or more different times T V1 and T V2 , etc. At each of these times, there is a measured value course during one revolution z = f TVi (T U ).
The representation of the data takes place in a two-dimensional coordinate system with two mutually perpendicular coordinate axes, with T V as the abscissa (x-axis) and T U as the ordinate (y-axis).
The device displays on its output unit the values of the data belonging to each (yi; zi) pair in the coordinate system by projecting the measured values onto the T U axis and thereby the measured values given by the zi values. color coded. The sequence of colored data points in the y direction indicates the difference between the data value and the reference value within a circulation time T U , which was measured during one revolution at time T Vi . The next time the actuator rotates in the same direction, the device displays on its output unit the data values at T V (i + 1) in the same way. Since the (y (i + 1); z (i + 1)) value pairs For the (yi; zi) value pairs in the direction of the T V axis are parallel shifted, the two juxtaposed measurements can be easily compared with each other for evaluation.
Besonders vorteilhaft reduziert die Vorrichtung die Informationsmenge dadurch, dass sie nicht jeden einzelnen Messwert im Messbereich mit einer eigenen Farbe kodiert, sondern nur bestimmte Werteklassen, die sich nach definierten Toleranzwerten für die Daten richten. Durch Vergleich der Daten mit Referenzwerten und einer Vorgabe von einem bis wenigen Toleranzbereichen weist die Vorrichtung den z-Werten nur wenige Farben entsprechend zu. Anhand der Farbe des Datenpunkts ist somit erkennbar, welche Toleranzgrenze von dem Datenpunkt (y; z) überschritten wird.
Vorteilhaft weist die Vorrichtung bei der Auswertung der Daten auf einen Untersuchungsbedarf des Antriebs hin. Dies erfolgt beispielsweise dann, wenn ein Datenpunkt eine zu definierende Toleranzgrenze, die als Nachweis eines Schadens oder einer Gefährdung des Antriebs bekannt ist, mindestens einmal erreicht hat.
Weiterhin analysiert die Vorrichtung die Datenpunkte entlang einer Parallelen zur Vergleichszeit-Achse daraufhin, ob eine Veränderung der Datenpunkte in Richtung einer zu definierenden Toleranzgrenze erfolgt. Wenn ein Datenwert bei einer bestimmten Umlaufphase des Antriebs allmählich immer höhere Toleranzschwellen überschreitet, gibt die Vorrichtung an der Ausgabeeinheit eine Meldung aus, die darauf hinweist, dass die Anlage vom Service-Personal untersucht werden muss.Particularly advantageously, the device reduces the amount of information in that it does not encode each individual measured value in the measuring area with its own color, but only certain value classes, which are based on defined tolerance values for the data. By comparing the data with reference values and a specification of one to a few tolerance ranges, the device assigns only a few colors correspondingly to the z values. Based on Color of the data point is thus recognizable which tolerance limit of the data point (y; z) is exceeded.
In the evaluation of the data, the device advantageously indicates an investigation requirement of the drive. This occurs, for example, when a data point has reached a tolerance limit to be defined, which is known as proof of damage or a threat to the drive, at least once.
Furthermore, the device analyzes the data points along a parallel to the comparison time axis to determine whether a change of the data points takes place in the direction of a tolerance limit to be defined. If a data value gradually exceeds ever higher tolerance thresholds during a certain phase of the drive's revolution, the device at the output unit issues a message indicating that the system must be inspected by service personnel.
Die Erfindung wird im Folgenden anhand eines Ausführungsbeispiels, das durch zwei Figuren dargestellt wird, näher erläutert.The invention will be explained in more detail below with reference to an embodiment which is represented by two figures.
Die Stromverlaufskurve wird bei der Analyse der Daten als Maß für die Schwergängigkeit der Weiche verwendet.
In der Abbildung ist jedem 4-adrigen Weichenantriebskabel ein einfacher Strich zugewiesen; es werden also 3 Weichen mit der Diagnosevorrichtung überwacht. Die Diagnosevorrichtung misst direkt an der bestehenden Verkabelung des jeweiligen Weichenantriebs, in der Nähe einer Klemmleiste. Idealerweise wird hierfür die Klemmleiste zwischen Außenkabel und Innenkabel verwendet.
The current waveform is used in the analysis of the data as a measure of the stiffness of the switch.
In the figure, each 4-wire turnout drive cable is assigned a single stroke; Thus, 3 points are monitored with the diagnostic device. The diagnostic device measures directly on the existing cabling of the respective point machine drive, near a terminal block. Ideally, the terminal strip between the outer cable and the inner cable is used for this purpose.
Die Übertragung der Messdaten erfolgt mithilfe einer geeigneten Schnittstelle. In diesem Beispiel wird eine 4-20 mA Schnittstelle verwendet. Je nach Umweltbedingungen und Entfernungen sind auch andere drahtgebundene Schnittstellen möglich, genauso wie drahtlose, z.B. Funkschnittstellen.The transmission of the measured data takes place by means of a suitable interface. In this example a 4-20 mA interface is used. Depending on environmental conditions and distances, other wired interfaces are possible, as well as wireless, eg wireless interfaces.
Die Steuerung des Messvorgangs, die Aufbereitung der Messdaten und die Weiterleitung an ein Diagnosesystem sind Funktionen der angeschlossenen Datenverarbeitung.The control of the measurement process, the preparation of the measurement data and the forwarding to a diagnostic system are functions of the connected data processing.
Die Unterschiede zu den Referenzwerten, ΔI, werden in Toleranzbereiche eingeteilt. Keine oder nur geringe Abweichungen vom Referenzwert sind in diesem Beispiel dem Toleranzbereich T0 zugeordnet. Größere Abweichungen den Toleranzbereichen T1 bis T4. Bei Erreichen des Toleranzbereichs T4 ist eine akute Gefährdung der Funktionsfähigkeit des Antriebs gegeben.
Negative Abweichungen weisen auf eine bessere Schwergängigkeit des Antriebs im Vergleich zu den Referenzwerten auf. Diese Messwerte sind dem Toleranzbereich T-1 zugeordnet. Jedem Toleranzbereich ist nun eine eigene Farbe bei der Darstellung der Messwerte zugewiesen.
Die Farbe Grün ist in diesem Beispiel dem Toleranzbereich T0 zugewiesen und steht somit für eine Übereinstimmung der Messdaten mit den Referenzwerten bzw. eine nur unerhebliche Abweichung. T1 bis T4 sind beispielsweise die Farben Gelb, Orange, Hellrot und Dunkelrot zugeordnet, T-1 die Farbe Blau.
The differences from the reference values, ΔI, are divided into tolerance ranges. No or only slight deviations from the reference value are assigned to the tolerance range T0 in this example. Larger deviations in the tolerance ranges T1 to T4. When the tolerance range T4 is reached, there is an acute danger to the functionality of the drive.
Negative deviations indicate better drive stiffness compared to the reference values. These measured values are assigned to the tolerance range T-1. Each tolerance range is now assigned its own color when displaying the measured values.
The color green is assigned to the tolerance range T0 in this example and thus stands for a correspondence of the measured data with the reference values or an insignificant deviation. T1 to T4 are assigned, for example, the colors yellow, orange, bright red and dark red, T-1 the color blue.
In x-Richtung ist die Vergleichszeit TV aufgetragen, die y-Richtung zeigt die Messwerte während eines Umlaufs (TU) des Antriebs. Dabei ist ausgehend von der x-Achse in der Mitte der Figur nach unten die Bewegung des Weichenantriebs in eine Rechtslage dargestellt, während die Daten, die von der Mitte nach oben dargestellt sind, eine Auslenkung des Antriebs in die Linkslage beschreiben. Entlang der TV -Achse sind mehrere Umläufe nebeneinander dargestellt. Der Weichenantrieb kommt dabei jeweils nach etwa der gleichen Umlaufzeit TUE in die Endlage. Gleiche Phasen des Umlaufes sind daher entlang von Parallelen zur TV -Achse miteinander vergleichbar.
Im unteren Abschnitt der
Dies ist ein Hinweis darauf, dass sich der Zustand des Antriebs verschlechtert hat im Vergleich zum Beginn der Messungen und somit ein Wartungsbedarf besteht, bevor der Antrieb einen kritischen Zustand erreicht. Bei der Analyse der Daten wird daher ein Auftrag zur Inspektion des Weichenantriebs ausgelöst. Hierbei wird durch Vergleich mit in der Datenbank abgelegten Daten eine Vorhersage über den zu erwartenden zeitlichen Schadensverlauf angezeigt. Anhand dieser Prognose kann der optimale Wartungszeitpunkt festgelegt werden.
Im oberen Bereich der
In the lower section of the
This is an indication that the state of the drive has deteriorated compared to the beginning of the measurements and thus requires maintenance before the drive reaches a critical state. When analyzing the data, therefore, an order to inspect the points drive is triggered. In this case, a prediction of the expected temporal course of damage is displayed by comparison with data stored in the database. Based on this forecast, the optimal maintenance time can be determined.
In the upper area of the
Claims (6)
- Method for detecting, evaluating and displaying measurement values of motors of electric drives, wherein there are measured by at least one sensor measurement values which are transmitted to a data processing unit, characterised in that two time coordinates are considered, wherein the measurement values are described within a rotation cycle of the drive in accordance with one time coordinate, which is called the rotation time, and the sequential rotations of the drive are described in accordance with the second time coordinate, which is called the comparison time, wherein the measurement values of a rotation cycle of the electric drive are stored and where applicable processed with an evaluation function, these data are then compared with a reference line, wherein the deviations between the data and the reference line are colour-coded and indicated on an output unit in such a manner that the two time coordinates are displayed perpendicularly to each other, and the colour-coded data points are each indicated at a position of the two-dimensional display surface which corresponds to the associated coordinates along the rotation time axis and the comparison time axis so that, in the event of a plurality of measurement cycles, a sequential arrangement of the colour-coded data points is produced.
- Method for detecting, evaluating and displaying measurement values of motors of electric drives according to claim 1, wherein the encoding of the colour values for the deviations of the data from the reference values is selected in accordance with tolerance ranges so that with reference to the colour of the data point it can be identified when the data are output which tolerance limit is exceeded by the measurement values at the respective data point.
- Method for detecting, evaluating and displaying measurement values of motors of electric drives according to any of the preceding claims 1 to 2, wherein a requirement for examination of the drive is indicated when a data point has reached a tolerance limit which is intended to be defined at least once or when the comparison of the data points along a parallel line with respect to the comparison time axis produces a change of the data points in the direction of a tolerance limit which is intended to be defined.
- Device for detecting, evaluating and displaying measurement values of motors of electric drives, wherein at least one sensor measures measurement values and transmits these to a data processing unit, characterised in that the data processing unit is configured in such a manner that it uses time coordinates for evaluation, wherein it describes the measurement values within a rotation cycle of the drive in accordance with one time coordinate, which is called the rotation time, and it describes the sequential rotations of the drive in accordance with the second time coordinate, which is called the comparison time, wherein it stores the measurement values of a rotation cycle of the electric drive and where applicable processes them with an evaluation function, then compares these data with a reference line, wherein it colour-codes the deviations between the data and the reference line and indicates them on an output unit in such a manner that it displays the two time coordinates perpendicularly to each other and in this instance indicates the colour-coded data points at a position of the two-dimensional display surface which corresponds to the associated coordinates along the rotation time axis and the comparison time axis so that, in the event of a plurality of measurement cycles, a sequential arrangement of the colour-coded data points is produced.
- Device for detecting, evaluating and displaying measurement values of motors of electric drives according to claim 4, wherein the data processing unit is configured in such a manner that it selects the encoding of the colour values for the deviations of the data from the reference values in accordance with tolerance ranges so that, with reference to the colour of the data point on the output unit, it can be seen which tolerance limit the measurement values exceed at the respective data point.
- Device for detecting, evaluating and displaying measurement values of motors of electric drives according to any of the preceding claims 4 to 5, wherein the processing data unit is configured in such a mannerthat it indicates using a notification a requirement for examination of the drive when a data point has reached a tolerance limit which is intended to be defined at least once or when the comparison of the data points along a parallel line with the comparison time axis produces a change of the data points in the direction of a tolerance limit which is intended to be defined.
Priority Applications (2)
| Application Number | Priority Date | Filing Date | Title |
|---|---|---|---|
| PL15788407T PL3218675T3 (en) | 2014-11-14 | 2015-11-02 | Method and apparatus for detecting, assessing and displaying measured values of motors of electric drives |
| SI201530644T SI3218675T1 (en) | 2014-11-14 | 2015-11-02 | Method and apparatus for detecting, assessing and displaying measured values of motors of electric drives |
Applications Claiming Priority (2)
| Application Number | Priority Date | Filing Date | Title |
|---|---|---|---|
| DE102014223251.1A DE102014223251B3 (en) | 2014-11-14 | 2014-11-14 | Method and device for detecting, evaluating and displaying measured values of motors of electric drives |
| PCT/EP2015/075443 WO2016074967A1 (en) | 2014-11-14 | 2015-11-02 | Method and apparatus for detecting, evaluating and displaying measurement values of motors of electric drives |
Publications (2)
| Publication Number | Publication Date |
|---|---|
| EP3218675A1 EP3218675A1 (en) | 2017-09-20 |
| EP3218675B1 true EP3218675B1 (en) | 2019-01-09 |
Family
ID=54366226
Family Applications (1)
| Application Number | Title | Priority Date | Filing Date |
|---|---|---|---|
| EP15788407.3A Active EP3218675B1 (en) | 2014-11-14 | 2015-11-02 | Method and apparatus for detecting, assessing and displaying measured values of motors of electric drives |
Country Status (14)
| Country | Link |
|---|---|
| EP (1) | EP3218675B1 (en) |
| KR (1) | KR20170092572A (en) |
| CN (1) | CN107110671B (en) |
| AU (1) | AU2015345343A1 (en) |
| CA (1) | CA2970403C (en) |
| DE (1) | DE102014223251B3 (en) |
| EA (1) | EA032103B1 (en) |
| ES (1) | ES2717121T3 (en) |
| LT (1) | LT3218675T (en) |
| PL (1) | PL3218675T3 (en) |
| PT (1) | PT3218675T (en) |
| SG (1) | SG11201704698UA (en) |
| SI (1) | SI3218675T1 (en) |
| WO (1) | WO2016074967A1 (en) |
Families Citing this family (3)
| Publication number | Priority date | Publication date | Assignee | Title |
|---|---|---|---|---|
| DE102018211846A1 (en) * | 2018-07-17 | 2020-01-23 | Ziehl-Abegg Se | Method and system for evaluating the vibration behavior of an electric motor |
| DE102018220804A1 (en) * | 2018-12-03 | 2020-06-04 | Lufthansa Technik Aktiengesellschaft | Condition monitoring method and device |
| KR102112871B1 (en) * | 2019-07-01 | 2020-06-04 | 서준식 | Motor inspection system |
Family Cites Families (13)
| Publication number | Priority date | Publication date | Assignee | Title |
|---|---|---|---|---|
| DE1506630B2 (en) * | 1967-04-15 | 1972-01-27 | Dormer AG, 7990 Friedrichshafen | FLIGHT INSTRUMENTATION WITH ELECTRONIC. DISPLAY |
| JPS5862515A (en) * | 1981-10-09 | 1983-04-14 | Honda Motor Co Ltd | Indicator for vehicle |
| NO843698L (en) * | 1984-09-17 | 1986-03-18 | Norway Geophysical Co | PROCESS FOR PROCESSING SEISMIC DATA. |
| JPH06103310B2 (en) * | 1985-06-26 | 1994-12-14 | 株式会社日立製作所 | Display method of quality control data of automatic analyzer |
| EP0788624B1 (en) * | 1994-10-26 | 1998-08-26 | Siemens Aktiengesellschaft | Process for analysing a measurement and measurement analyser for implementing it |
| DE19733001A1 (en) * | 1997-07-31 | 1999-02-04 | Volkswagen Ag | Process for recording, evaluating and displaying measured values |
| KR20090030902A (en) * | 2007-09-21 | 2009-03-25 | 엘지전자 주식회사 | Input apparatus of dish washer and controlling method for the same, input apparatus of laundry machine and controlling method for the same |
| JP5243910B2 (en) * | 2008-09-29 | 2013-07-24 | 本田技研工業株式会社 | Device for instructing the driver on driving operation to improve fuel efficiency |
| EP2424455A4 (en) * | 2009-04-27 | 2017-08-02 | Smith & Nephew, Inc. | System and method for identifying a landmark |
| DE102009023867A1 (en) * | 2009-06-04 | 2010-12-09 | Bayerische Motoren Werke Aktiengesellschaft | Method for providing information e.g. number of revolutions, to driver of motor vehicle, involves showing information about past driving behavior of driver in indicating region i.e. inner shell, of indicator |
| DE102009035998A1 (en) * | 2009-07-27 | 2011-02-03 | Pilz Gmbh & Co. Kg | Method and device for fail-safe monitoring of a movement quantity on an electric drive |
| PL2309282T3 (en) * | 2009-08-11 | 2021-07-05 | Diehl Ako Stiftung & Co. Kg | Method for detecting faults when controlling a rotating field motor |
| DE102010055797A1 (en) * | 2010-12-23 | 2012-06-28 | Continental Automotive Gmbh | Electric motor vehicle with a display device |
-
2014
- 2014-11-14 DE DE102014223251.1A patent/DE102014223251B3/en not_active Expired - Fee Related
-
2015
- 2015-11-02 LT LTEP15788407.3T patent/LT3218675T/en unknown
- 2015-11-02 SG SG11201704698UA patent/SG11201704698UA/en unknown
- 2015-11-02 AU AU2015345343A patent/AU2015345343A1/en not_active Abandoned
- 2015-11-02 CN CN201580067132.9A patent/CN107110671B/en not_active Expired - Fee Related
- 2015-11-02 EP EP15788407.3A patent/EP3218675B1/en active Active
- 2015-11-02 ES ES15788407T patent/ES2717121T3/en active Active
- 2015-11-02 PL PL15788407T patent/PL3218675T3/en unknown
- 2015-11-02 SI SI201530644T patent/SI3218675T1/en unknown
- 2015-11-02 CA CA2970403A patent/CA2970403C/en active Active
- 2015-11-02 KR KR1020177015627A patent/KR20170092572A/en unknown
- 2015-11-02 WO PCT/EP2015/075443 patent/WO2016074967A1/en active Application Filing
- 2015-11-02 PT PT15788407T patent/PT3218675T/en unknown
- 2015-11-02 EA EA201791022A patent/EA032103B1/en not_active IP Right Cessation
Non-Patent Citations (1)
| Title |
|---|
| None * |
Also Published As
| Publication number | Publication date |
|---|---|
| AU2015345343A1 (en) | 2017-06-29 |
| ES2717121T3 (en) | 2019-06-19 |
| SI3218675T1 (en) | 2019-05-31 |
| PL3218675T3 (en) | 2019-06-28 |
| CN107110671A (en) | 2017-08-29 |
| DE102014223251B3 (en) | 2016-03-24 |
| EA032103B1 (en) | 2019-04-30 |
| PT3218675T (en) | 2019-04-03 |
| EA201791022A1 (en) | 2017-09-29 |
| CA2970403A1 (en) | 2016-05-19 |
| LT3218675T (en) | 2019-04-10 |
| WO2016074967A1 (en) | 2016-05-19 |
| EP3218675A1 (en) | 2017-09-20 |
| CN107110671B (en) | 2019-05-07 |
| CA2970403C (en) | 2023-12-19 |
| SG11201704698UA (en) | 2017-07-28 |
| KR20170092572A (en) | 2017-08-11 |
Similar Documents
| Publication | Publication Date | Title |
|---|---|---|
| DE102014223234B3 (en) | Method and device for diagnosing electrical switches | |
| EP2877383B1 (en) | Diagnostic method for rail vehicles | |
| EP3033289A1 (en) | Monitoring system of a lift installation | |
| EP3218675B1 (en) | Method and apparatus for detecting, assessing and displaying measured values of motors of electric drives | |
| DE19929455A1 (en) | Sliding door drive has integrated door movement diagnosis, sensor wheel, sensor connected to processing unit; processing unit, motor controller are connected to central data processing unit | |
| DE102016221479A1 (en) | Method and device for switch diagnostics | |
| EP2047118B1 (en) | Method for fault localization and diagnosis in a fluidic installation | |
| DE102016212175A1 (en) | Method and device for determining and / or controlling a position of an electrically commutatable electric motor, in particular for a clutch actuation system of a vehicle | |
| DE102015210716B4 (en) | Position sensor and method for operating a position sensor | |
| WO2011023463A1 (en) | Attachment module with life monitoring for an electromagnetic switching device, and associated method | |
| EP2956348B1 (en) | Monitoring of coupling elements of a vehicle | |
| WO2018019619A1 (en) | Device for diagnosing a mechanical system which is driven by means of an electric drive motor | |
| EP2899559B1 (en) | Method for diagnosing a converter | |
| EP2988419B1 (en) | Method for determining the state of a reporting element which forms a short circuit | |
| DE102016208649A1 (en) | Device and method for detecting a change in position of a signal transmitter wheel | |
| DE102019107242A1 (en) | Diagnostic method, diagnostic system and motor vehicle | |
| DE102014225658A1 (en) | Method and measuring system for sensing a rotational and linear movement in a switching actuator | |
| EP4002680B1 (en) | Method and system for status-based maintenance of access device | |
| CH713324B1 (en) | Method and device for monitoring at least one relay. | |
| DE102017000821A1 (en) | Electric drive unit with intelligent maintenance requirement monitoring | |
| DE102010048750A1 (en) | Circuit device for evaluation of switching states of e.g. multistage rotary switch used for operating windscreen wiper of motor car, has control unit combining analog and digital evaluation results to discriminate switching states | |
| DE102020116022A1 (en) | Method for condition-based maintenance of an access device | |
| EP3889098A1 (en) | Industrial truck with a communication network and diagnostic method for an industrial truck with a communication network | |
| EP3975066A1 (en) | Method for checking a technical function of an electrical and / or mechanical first device of a railway system | |
| DE102012001761A1 (en) | Method for diagnosis and / or condition monitoring and / or service life prediction of a functional element |
Legal Events
| Date | Code | Title | Description |
|---|---|---|---|
| STAA | Information on the status of an ep patent application or granted ep patent |
Free format text: STATUS: THE INTERNATIONAL PUBLICATION HAS BEEN MADE |
|
| PUAI | Public reference made under article 153(3) epc to a published international application that has entered the european phase |
Free format text: ORIGINAL CODE: 0009012 |
|
| STAA | Information on the status of an ep patent application or granted ep patent |
Free format text: STATUS: REQUEST FOR EXAMINATION WAS MADE |
|
| 17P | Request for examination filed |
Effective date: 20170502 |
|
| AK | Designated contracting states |
Kind code of ref document: A1 Designated state(s): AL AT BE BG CH CY CZ DE DK EE ES FI FR GB GR HR HU IE IS IT LI LT LU LV MC MK MT NL NO PL PT RO RS SE SI SK SM TR |
|
| AX | Request for extension of the european patent |
Extension state: BA ME |
|
| DAV | Request for validation of the european patent (deleted) | ||
| DAX | Request for extension of the european patent (deleted) | ||
| RAP1 | Party data changed (applicant data changed or rights of an application transferred) |
Owner name: DEUTSCHE BAHN AG |
|
| GRAP | Despatch of communication of intention to grant a patent |
Free format text: ORIGINAL CODE: EPIDOSNIGR1 |
|
| STAA | Information on the status of an ep patent application or granted ep patent |
Free format text: STATUS: GRANT OF PATENT IS INTENDED |
|
| RIC1 | Information provided on ipc code assigned before grant |
Ipc: G01D 7/10 20060101AFI20180615BHEP Ipc: G07C 3/00 20060101ALI20180615BHEP |
|
| INTG | Intention to grant announced |
Effective date: 20180712 |
|
| GRAS | Grant fee paid |
Free format text: ORIGINAL CODE: EPIDOSNIGR3 |
|
| GRAA | (expected) grant |
Free format text: ORIGINAL CODE: 0009210 |
|
| STAA | Information on the status of an ep patent application or granted ep patent |
Free format text: STATUS: THE PATENT HAS BEEN GRANTED |
|
| AK | Designated contracting states |
Kind code of ref document: B1 Designated state(s): AL AT BE BG CH CY CZ DE DK EE ES FI FR GB GR HR HU IE IS IT LI LT LU LV MC MK MT NL NO PL PT RO RS SE SI SK SM TR |
|
| REG | Reference to a national code |
Ref country code: GB Ref legal event code: FG4D Free format text: NOT ENGLISH |
|
| REG | Reference to a national code |
Ref country code: CH Ref legal event code: EP Ref country code: AT Ref legal event code: REF Ref document number: 1087890 Country of ref document: AT Kind code of ref document: T Effective date: 20190115 |
|
| REG | Reference to a national code |
Ref country code: IE Ref legal event code: FG4D Free format text: LANGUAGE OF EP DOCUMENT: GERMAN |
|
| REG | Reference to a national code |
Ref country code: DE Ref legal event code: R096 Ref document number: 502015007641 Country of ref document: DE |
|
| REG | Reference to a national code |
Ref country code: CH Ref legal event code: NV Representative=s name: VALIPAT S.A. GEVERS SA, CH |
|
| REG | Reference to a national code |
Ref country code: CH Ref legal event code: PCAR Free format text: NEW ADDRESS: RUE DES NOYERS 11, 2000 NEUCHATEL (CH) |
|
| REG | Reference to a national code |
Ref country code: PT Ref legal event code: SC4A Ref document number: 3218675 Country of ref document: PT Date of ref document: 20190403 Kind code of ref document: T Free format text: AVAILABILITY OF NATIONAL TRANSLATION Effective date: 20190322 |
|
| REG | Reference to a national code |
Ref country code: SE Ref legal event code: TRGR |
|
| REG | Reference to a national code |
Ref country code: NL Ref legal event code: FP |
|
| REG | Reference to a national code |
Ref country code: EE Ref legal event code: FG4A Ref document number: E017173 Country of ref document: EE Effective date: 20190321 |
|
| REG | Reference to a national code |
Ref country code: NO Ref legal event code: T2 Effective date: 20190109 |
|
| REG | Reference to a national code |
Ref country code: GR Ref legal event code: EP Ref document number: 20190400864 Country of ref document: GR Effective date: 20190524 |
|
| REG | Reference to a national code |
Ref country code: ES Ref legal event code: FG2A Ref document number: 2717121 Country of ref document: ES Kind code of ref document: T3 Effective date: 20190619 |
|
| PG25 | Lapsed in a contracting state [announced via postgrant information from national office to epo] |
Ref country code: HR Free format text: LAPSE BECAUSE OF FAILURE TO SUBMIT A TRANSLATION OF THE DESCRIPTION OR TO PAY THE FEE WITHIN THE PRESCRIBED TIME-LIMIT Effective date: 20190109 Ref country code: IS Free format text: LAPSE BECAUSE OF FAILURE TO SUBMIT A TRANSLATION OF THE DESCRIPTION OR TO PAY THE FEE WITHIN THE PRESCRIBED TIME-LIMIT Effective date: 20190509 Ref country code: BG Free format text: LAPSE BECAUSE OF FAILURE TO SUBMIT A TRANSLATION OF THE DESCRIPTION OR TO PAY THE FEE WITHIN THE PRESCRIBED TIME-LIMIT Effective date: 20190409 Ref country code: RS Free format text: LAPSE BECAUSE OF FAILURE TO SUBMIT A TRANSLATION OF THE DESCRIPTION OR TO PAY THE FEE WITHIN THE PRESCRIBED TIME-LIMIT Effective date: 20190109 |
|
| REG | Reference to a national code |
Ref country code: DE Ref legal event code: R097 Ref document number: 502015007641 Country of ref document: DE |
|
| PG25 | Lapsed in a contracting state [announced via postgrant information from national office to epo] |
Ref country code: SK Free format text: LAPSE BECAUSE OF FAILURE TO SUBMIT A TRANSLATION OF THE DESCRIPTION OR TO PAY THE FEE WITHIN THE PRESCRIBED TIME-LIMIT Effective date: 20190109 Ref country code: AL Free format text: LAPSE BECAUSE OF FAILURE TO SUBMIT A TRANSLATION OF THE DESCRIPTION OR TO PAY THE FEE WITHIN THE PRESCRIBED TIME-LIMIT Effective date: 20190109 Ref country code: DK Free format text: LAPSE BECAUSE OF FAILURE TO SUBMIT A TRANSLATION OF THE DESCRIPTION OR TO PAY THE FEE WITHIN THE PRESCRIBED TIME-LIMIT Effective date: 20190109 Ref country code: CZ Free format text: LAPSE BECAUSE OF FAILURE TO SUBMIT A TRANSLATION OF THE DESCRIPTION OR TO PAY THE FEE WITHIN THE PRESCRIBED TIME-LIMIT Effective date: 20190109 Ref country code: RO Free format text: LAPSE BECAUSE OF FAILURE TO SUBMIT A TRANSLATION OF THE DESCRIPTION OR TO PAY THE FEE WITHIN THE PRESCRIBED TIME-LIMIT Effective date: 20190109 |
|
| PLBE | No opposition filed within time limit |
Free format text: ORIGINAL CODE: 0009261 |
|
| STAA | Information on the status of an ep patent application or granted ep patent |
Free format text: STATUS: NO OPPOSITION FILED WITHIN TIME LIMIT |
|
| PG25 | Lapsed in a contracting state [announced via postgrant information from national office to epo] |
Ref country code: SM Free format text: LAPSE BECAUSE OF FAILURE TO SUBMIT A TRANSLATION OF THE DESCRIPTION OR TO PAY THE FEE WITHIN THE PRESCRIBED TIME-LIMIT Effective date: 20190109 |
|
| 26N | No opposition filed |
Effective date: 20191010 |
|
| PG25 | Lapsed in a contracting state [announced via postgrant information from national office to epo] |
Ref country code: TR Free format text: LAPSE BECAUSE OF FAILURE TO SUBMIT A TRANSLATION OF THE DESCRIPTION OR TO PAY THE FEE WITHIN THE PRESCRIBED TIME-LIMIT Effective date: 20190109 |
|
| PG25 | Lapsed in a contracting state [announced via postgrant information from national office to epo] |
Ref country code: MC Free format text: LAPSE BECAUSE OF FAILURE TO SUBMIT A TRANSLATION OF THE DESCRIPTION OR TO PAY THE FEE WITHIN THE PRESCRIBED TIME-LIMIT Effective date: 20190109 |
|
| PG25 | Lapsed in a contracting state [announced via postgrant information from national office to epo] |
Ref country code: CY Free format text: LAPSE BECAUSE OF FAILURE TO SUBMIT A TRANSLATION OF THE DESCRIPTION OR TO PAY THE FEE WITHIN THE PRESCRIBED TIME-LIMIT Effective date: 20190109 |
|
| PG25 | Lapsed in a contracting state [announced via postgrant information from national office to epo] |
Ref country code: MT Free format text: LAPSE BECAUSE OF FAILURE TO SUBMIT A TRANSLATION OF THE DESCRIPTION OR TO PAY THE FEE WITHIN THE PRESCRIBED TIME-LIMIT Effective date: 20190109 Ref country code: HU Free format text: LAPSE BECAUSE OF FAILURE TO SUBMIT A TRANSLATION OF THE DESCRIPTION OR TO PAY THE FEE WITHIN THE PRESCRIBED TIME-LIMIT; INVALID AB INITIO Effective date: 20151102 |
|
| PG25 | Lapsed in a contracting state [announced via postgrant information from national office to epo] |
Ref country code: MK Free format text: LAPSE BECAUSE OF FAILURE TO SUBMIT A TRANSLATION OF THE DESCRIPTION OR TO PAY THE FEE WITHIN THE PRESCRIBED TIME-LIMIT Effective date: 20190109 |
|
| PGFP | Annual fee paid to national office [announced via postgrant information from national office to epo] |
Ref country code: PL Payment date: 20221026 Year of fee payment: 8 Ref country code: BE Payment date: 20221118 Year of fee payment: 8 |
|
| PGFP | Annual fee paid to national office [announced via postgrant information from national office to epo] |
Ref country code: NL Payment date: 20231023 Year of fee payment: 9 |
|
| PGFP | Annual fee paid to national office [announced via postgrant information from national office to epo] |
Ref country code: LU Payment date: 20231023 Year of fee payment: 9 |
|
| PGFP | Annual fee paid to national office [announced via postgrant information from national office to epo] |
Ref country code: GR Payment date: 20231020 Year of fee payment: 9 Ref country code: GB Payment date: 20231120 Year of fee payment: 9 |
|
| PGFP | Annual fee paid to national office [announced via postgrant information from national office to epo] |
Ref country code: ES Payment date: 20231218 Year of fee payment: 9 |
|
| PGFP | Annual fee paid to national office [announced via postgrant information from national office to epo] |
Ref country code: SI Payment date: 20231023 Year of fee payment: 9 Ref country code: SE Payment date: 20231117 Year of fee payment: 9 Ref country code: PT Payment date: 20231018 Year of fee payment: 9 Ref country code: NO Payment date: 20231024 Year of fee payment: 9 Ref country code: LV Payment date: 20231020 Year of fee payment: 9 Ref country code: LT Payment date: 20231023 Year of fee payment: 9 Ref country code: IT Payment date: 20231110 Year of fee payment: 9 Ref country code: IE Payment date: 20231019 Year of fee payment: 9 Ref country code: FR Payment date: 20231124 Year of fee payment: 9 Ref country code: FI Payment date: 20231020 Year of fee payment: 9 Ref country code: EE Payment date: 20231023 Year of fee payment: 9 Ref country code: DE Payment date: 20231107 Year of fee payment: 9 Ref country code: CH Payment date: 20231201 Year of fee payment: 9 Ref country code: AT Payment date: 20231020 Year of fee payment: 9 |
|
| PGFP | Annual fee paid to national office [announced via postgrant information from national office to epo] |
Ref country code: PL Payment date: 20231030 Year of fee payment: 9 Ref country code: BE Payment date: 20231113 Year of fee payment: 9 |