EP3203912B1 - System and method for a non-invasive medical sensor - Google Patents
System and method for a non-invasive medical sensor Download PDFInfo
- Publication number
- EP3203912B1 EP3203912B1 EP14903626.1A EP14903626A EP3203912B1 EP 3203912 B1 EP3203912 B1 EP 3203912B1 EP 14903626 A EP14903626 A EP 14903626A EP 3203912 B1 EP3203912 B1 EP 3203912B1
- Authority
- EP
- European Patent Office
- Prior art keywords
- signal
- detector
- light
- wavelength
- light source
- Prior art date
- Legal status (The legal status is an assumption and is not a legal conclusion. Google has not performed a legal analysis and makes no representation as to the accuracy of the status listed.)
- Active
Links
- 238000000034 method Methods 0.000 title claims description 42
- 230000003595 spectral effect Effects 0.000 claims description 39
- QVGXLLKOCUKJST-UHFFFAOYSA-N atomic oxygen Chemical compound [O] QVGXLLKOCUKJST-UHFFFAOYSA-N 0.000 claims description 35
- 229910052760 oxygen Inorganic materials 0.000 claims description 35
- 239000001301 oxygen Substances 0.000 claims description 35
- 230000004044 response Effects 0.000 claims description 30
- 238000010521 absorption reaction Methods 0.000 claims description 25
- 230000003287 optical effect Effects 0.000 claims description 22
- 230000033001 locomotion Effects 0.000 claims description 20
- 238000005070 sampling Methods 0.000 claims description 5
- 230000005855 radiation Effects 0.000 description 65
- 239000000523 sample Substances 0.000 description 50
- 239000000463 material Substances 0.000 description 31
- 239000008280 blood Substances 0.000 description 26
- 210000004369 blood Anatomy 0.000 description 26
- 238000012545 processing Methods 0.000 description 18
- 238000004891 communication Methods 0.000 description 17
- 230000008569 process Effects 0.000 description 13
- 230000000875 corresponding effect Effects 0.000 description 11
- 238000005259 measurement Methods 0.000 description 11
- 238000009792 diffusion process Methods 0.000 description 8
- 230000009977 dual effect Effects 0.000 description 8
- 238000010586 diagram Methods 0.000 description 7
- 238000004519 manufacturing process Methods 0.000 description 6
- 230000008859 change Effects 0.000 description 5
- 239000000470 constituent Substances 0.000 description 5
- 230000008901 benefit Effects 0.000 description 4
- 230000001427 coherent effect Effects 0.000 description 4
- 238000005286 illumination Methods 0.000 description 4
- XUIMIQQOPSSXEZ-UHFFFAOYSA-N Silicon Chemical compound [Si] XUIMIQQOPSSXEZ-UHFFFAOYSA-N 0.000 description 3
- 230000017531 blood circulation Effects 0.000 description 3
- 239000012530 fluid Substances 0.000 description 3
- 238000012544 monitoring process Methods 0.000 description 3
- 239000004065 semiconductor Substances 0.000 description 3
- 229910052710 silicon Inorganic materials 0.000 description 3
- 239000010703 silicon Substances 0.000 description 3
- BPYKTIZUTYGOLE-IFADSCNNSA-N Bilirubin Chemical compound N1C(=O)C(C)=C(C=C)\C1=C\C1=C(C)C(CCC(O)=O)=C(CC2=C(C(C)=C(\C=C/3C(=C(C=C)C(=O)N\3)C)N2)CCC(O)=O)N1 BPYKTIZUTYGOLE-IFADSCNNSA-N 0.000 description 2
- 208000012641 Pigmentation disease Diseases 0.000 description 2
- 230000005540 biological transmission Effects 0.000 description 2
- 230000008081 blood perfusion Effects 0.000 description 2
- 238000004364 calculation method Methods 0.000 description 2
- 230000002596 correlated effect Effects 0.000 description 2
- 230000007547 defect Effects 0.000 description 2
- 238000001514 detection method Methods 0.000 description 2
- 238000009532 heart rate measurement Methods 0.000 description 2
- 239000011344 liquid material Substances 0.000 description 2
- 238000004886 process control Methods 0.000 description 2
- 238000003908 quality control method Methods 0.000 description 2
- 239000011343 solid material Substances 0.000 description 2
- UGFAIRIUMAVXCW-UHFFFAOYSA-N Carbon monoxide Chemical compound [O+]#[C-] UGFAIRIUMAVXCW-UHFFFAOYSA-N 0.000 description 1
- 108010003320 Carboxyhemoglobin Proteins 0.000 description 1
- WQZGKKKJIJFFOK-GASJEMHNSA-N Glucose Natural products OC[C@H]1OC(O)[C@H](O)[C@@H](O)[C@@H]1O WQZGKKKJIJFFOK-GASJEMHNSA-N 0.000 description 1
- 108010054147 Hemoglobins Proteins 0.000 description 1
- 102000001554 Hemoglobins Human genes 0.000 description 1
- 108010064719 Oxyhemoglobins Proteins 0.000 description 1
- 239000000853 adhesive Substances 0.000 description 1
- 230000001070 adhesive effect Effects 0.000 description 1
- 238000013459 approach Methods 0.000 description 1
- 238000005452 bending Methods 0.000 description 1
- 230000009286 beneficial effect Effects 0.000 description 1
- 229910002091 carbon monoxide Inorganic materials 0.000 description 1
- 238000012937 correction Methods 0.000 description 1
- 230000007123 defense Effects 0.000 description 1
- 238000011161 development Methods 0.000 description 1
- 210000000624 ear auricle Anatomy 0.000 description 1
- 238000005516 engineering process Methods 0.000 description 1
- 230000006870 function Effects 0.000 description 1
- 239000008103 glucose Substances 0.000 description 1
- 230000003760 hair shine Effects 0.000 description 1
- 238000012806 monitoring device Methods 0.000 description 1
- 239000013307 optical fiber Substances 0.000 description 1
- 238000002496 oximetry Methods 0.000 description 1
- 238000006213 oxygenation reaction Methods 0.000 description 1
- 230000010412 perfusion Effects 0.000 description 1
- 230000037081 physical activity Effects 0.000 description 1
- 230000009467 reduction Effects 0.000 description 1
- 238000011160 research Methods 0.000 description 1
- 230000004043 responsiveness Effects 0.000 description 1
- 229920006395 saturated elastomer Polymers 0.000 description 1
- 238000001228 spectrum Methods 0.000 description 1
- 239000000126 substance Substances 0.000 description 1
- 239000000758 substrate Substances 0.000 description 1
- 230000001360 synchronised effect Effects 0.000 description 1
Images


Classifications
-
- A—HUMAN NECESSITIES
- A61—MEDICAL OR VETERINARY SCIENCE; HYGIENE
- A61B—DIAGNOSIS; SURGERY; IDENTIFICATION
- A61B5/00—Measuring for diagnostic purposes; Identification of persons
- A61B5/145—Measuring characteristics of blood in vivo, e.g. gas concentration, pH value; Measuring characteristics of body fluids or tissues, e.g. interstitial fluid, cerebral tissue
- A61B5/1455—Measuring characteristics of blood in vivo, e.g. gas concentration, pH value; Measuring characteristics of body fluids or tissues, e.g. interstitial fluid, cerebral tissue using optical sensors, e.g. spectral photometrical oximeters
- A61B5/14551—Measuring characteristics of blood in vivo, e.g. gas concentration, pH value; Measuring characteristics of body fluids or tissues, e.g. interstitial fluid, cerebral tissue using optical sensors, e.g. spectral photometrical oximeters for measuring blood gases
-
- A—HUMAN NECESSITIES
- A61—MEDICAL OR VETERINARY SCIENCE; HYGIENE
- A61B—DIAGNOSIS; SURGERY; IDENTIFICATION
- A61B5/00—Measuring for diagnostic purposes; Identification of persons
- A61B5/145—Measuring characteristics of blood in vivo, e.g. gas concentration, pH value; Measuring characteristics of body fluids or tissues, e.g. interstitial fluid, cerebral tissue
- A61B5/1455—Measuring characteristics of blood in vivo, e.g. gas concentration, pH value; Measuring characteristics of body fluids or tissues, e.g. interstitial fluid, cerebral tissue using optical sensors, e.g. spectral photometrical oximeters
-
- A—HUMAN NECESSITIES
- A61—MEDICAL OR VETERINARY SCIENCE; HYGIENE
- A61B—DIAGNOSIS; SURGERY; IDENTIFICATION
- A61B5/00—Measuring for diagnostic purposes; Identification of persons
- A61B5/68—Arrangements of detecting, measuring or recording means, e.g. sensors, in relation to patient
- A61B5/6801—Arrangements of detecting, measuring or recording means, e.g. sensors, in relation to patient specially adapted to be attached to or worn on the body surface
- A61B5/6813—Specially adapted to be attached to a specific body part
- A61B5/6825—Hand
- A61B5/6826—Finger
-
- A—HUMAN NECESSITIES
- A61—MEDICAL OR VETERINARY SCIENCE; HYGIENE
- A61B—DIAGNOSIS; SURGERY; IDENTIFICATION
- A61B5/00—Measuring for diagnostic purposes; Identification of persons
- A61B5/68—Arrangements of detecting, measuring or recording means, e.g. sensors, in relation to patient
- A61B5/6801—Arrangements of detecting, measuring or recording means, e.g. sensors, in relation to patient specially adapted to be attached to or worn on the body surface
- A61B5/683—Means for maintaining contact with the body
- A61B5/6832—Means for maintaining contact with the body using adhesives
-
- A—HUMAN NECESSITIES
- A61—MEDICAL OR VETERINARY SCIENCE; HYGIENE
- A61B—DIAGNOSIS; SURGERY; IDENTIFICATION
- A61B5/00—Measuring for diagnostic purposes; Identification of persons
- A61B5/68—Arrangements of detecting, measuring or recording means, e.g. sensors, in relation to patient
- A61B5/6801—Arrangements of detecting, measuring or recording means, e.g. sensors, in relation to patient specially adapted to be attached to or worn on the body surface
- A61B5/6844—Monitoring or controlling distance between sensor and tissue
-
- A—HUMAN NECESSITIES
- A61—MEDICAL OR VETERINARY SCIENCE; HYGIENE
- A61B—DIAGNOSIS; SURGERY; IDENTIFICATION
- A61B5/00—Measuring for diagnostic purposes; Identification of persons
- A61B5/72—Signal processing specially adapted for physiological signals or for diagnostic purposes
- A61B5/7221—Determining signal validity, reliability or quality
-
- A—HUMAN NECESSITIES
- A61—MEDICAL OR VETERINARY SCIENCE; HYGIENE
- A61B—DIAGNOSIS; SURGERY; IDENTIFICATION
- A61B5/00—Measuring for diagnostic purposes; Identification of persons
- A61B5/145—Measuring characteristics of blood in vivo, e.g. gas concentration, pH value; Measuring characteristics of body fluids or tissues, e.g. interstitial fluid, cerebral tissue
- A61B5/1455—Measuring characteristics of blood in vivo, e.g. gas concentration, pH value; Measuring characteristics of body fluids or tissues, e.g. interstitial fluid, cerebral tissue using optical sensors, e.g. spectral photometrical oximeters
- A61B5/14551—Measuring characteristics of blood in vivo, e.g. gas concentration, pH value; Measuring characteristics of body fluids or tissues, e.g. interstitial fluid, cerebral tissue using optical sensors, e.g. spectral photometrical oximeters for measuring blood gases
- A61B5/14552—Details of sensors specially adapted therefor
-
- A—HUMAN NECESSITIES
- A61—MEDICAL OR VETERINARY SCIENCE; HYGIENE
- A61B—DIAGNOSIS; SURGERY; IDENTIFICATION
- A61B5/00—Measuring for diagnostic purposes; Identification of persons
- A61B5/68—Arrangements of detecting, measuring or recording means, e.g. sensors, in relation to patient
- A61B5/6801—Arrangements of detecting, measuring or recording means, e.g. sensors, in relation to patient specially adapted to be attached to or worn on the body surface
- A61B5/683—Means for maintaining contact with the body
- A61B5/6838—Clamps or clips
-
- A—HUMAN NECESSITIES
- A61—MEDICAL OR VETERINARY SCIENCE; HYGIENE
- A61B—DIAGNOSIS; SURGERY; IDENTIFICATION
- A61B5/00—Measuring for diagnostic purposes; Identification of persons
- A61B5/72—Signal processing specially adapted for physiological signals or for diagnostic purposes
- A61B5/7203—Signal processing specially adapted for physiological signals or for diagnostic purposes for noise prevention, reduction or removal
- A61B5/7207—Signal processing specially adapted for physiological signals or for diagnostic purposes for noise prevention, reduction or removal of noise induced by motion artifacts
-
- G—PHYSICS
- G01—MEASURING; TESTING
- G01N—INVESTIGATING OR ANALYSING MATERIALS BY DETERMINING THEIR CHEMICAL OR PHYSICAL PROPERTIES
- G01N2201/00—Features of devices classified in G01N21/00
- G01N2201/12—Circuits of general importance; Signal processing
- G01N2201/121—Correction signals
Definitions
- the present invention relates generally to non-invasive medical sensing devices, and in particular to error correction for a medical sensor.
- Monochromatic light sources are utilized in a broad range of applications in many distinct fields of technology including the consumer, industrial, medical, defense and scientific fields.
- an emitter-receiver pair of monochromatic light sources in form of light-emitting diodes (LEDs) or similar devices are often utilized in medical sensing devices to obtain accurate non-invasive measurements.
- An example application of such a medical sensing device may include a blood constituent monitoring system and/or a non-invasive oximeter that may be utilized to monitor arterial oxygen saturation.
- monochromatic light having a known specific wavelength is typically transmitted from an emitter LED through a target, such as biological tissue carrying blood, to a photodetector.
- the photodetector receives and measures a portion of transmitted coherent light that is neither absorbed nor reflected from the blood in the biological tissue in order to determine the oxygen saturation (SP02) within the blood
- an example of an industrial application may include a non-invasive sensor system having a monochromatic light of a known specific wavelength transmitted from a coherent light source (such as an LED emitter) through a target, such as a fluid or material, to a photodetector.
- the change in drive circuit current drives the LED to a specific wavelength.
- these systems include a scheme for determining the wavelength shift of the photodiodes via a series of filters, diffusers and a plurality of photodetectors. Unfortunately, this approach is too complex and expensive for practical manufacturing techniques and cannot be employed in each sensor being used with monitoring devices.
- patent publication US 8 271 063 B2 discloses a system and method for a non-invasive medical sensor.
- a sensor having one or more coherent light sources, one broadband light source and one or more light detectors. At least one of the detectors produces an output in response to received light.
- electrical circuitry in response to the output generates a pulse waveform proportional to the arterial and venous pulse of a human body, wherein the pulse waveform is used to synchronize an arterial-pulse measurement of the absorption or reflectance of one or more coherent light sources.
- the centroid wavelength of any given monochromatic light source or the spectral density peak of the broadband light source may be determined.
- patent publication US 2014/0275882 A1 discloses methods and systems for determining a probe-off condition in a medical device.
- a physiological monitoring system uses one or more characteristics of an ambient light component to determine a probe-off condition.
- the present invention is directed to a non-invasive sensing system according to claim 9.
- the system may comprise electrical circuitry which responsive to the output of the light detectors generates a pulse waveform proportional to the arterial and venous pulse of a human body, wherein the pulse waveform is used to synchronize an arterial-pulse measurement of the absorption or reflectance of one or more monochromatic or non-monochromatic light sources.
- a method according to claim 1 is provided.
- the method includes providing a first detector and second detector in a noninvasive optical sensor and emitting light from a non-monochromatic light source in the noninvasive optical sensor periodically.
- a first signal from the first detector and a second signal from the second detector are generated, resulting from light periodically emitted the non-monochromatic light source sampled by the first detector and the second detector, both detectors having well defined and differing spectral responses.
- a third signal is generated using a ratio of first signal and the second signal to determine an average spectral absorption and any changes in spectral absorption generated by the occurrence of an arterial pulse and base spectral absorption of tissue located within the non-invasive optical sensor.
- Oxygen saturation data is generated using the first signal and the second signal, and the oxygen saturation data is substituted for oxygen saturation data obtained based on a monochromatic light source if the ratio of the first signal and the second signal is not within an acceptable system range.
- At least one light emitter emitting red light and at least one light emitter emitting infrared light is provided in the non-invasive optical sensor.
- a red light signal level from emitted red light received the first detector and the second detector may be generated and infrared signal level received from emitted infrared light received by the first detector and the second detector may be generated.
- a ratio of the light signal level to the infrared signal level may be correlated to a corresponding value sampled at an arterial peak while the non-monochromatic light source is emitting light in order to generate oxygen saturation data in the tissue.
- Oxygen saturation data may be generated using the first signal and the second signal if a motion event occurs with the tissue located within the non-invasive optical sensor.
- a ratio of non-monochromatic light received by the first detector and the second detector is measured. If the ratio of received non-monochromatic light is above or below a threshold, a notification may be generated.
- a centroid wavelength of emitted red light may be measured. If the measured centroid wavelength is determined to be outside an acceptable centroid range, and alert may be generated.
- the first detector and second detector may have different spectral response curves, and the different spectral response curves may be utilized to derive a fourth signal proportional to the centroid wavelength of emitted red light.
- the first detector and second detector are provided in a non-invasive optical sensor.
- Light may be emitted from a non-monochromatic light source in the non-invasive optical sensor periodically, and an amplitude of non-monochromatic light received by the first detector and the second detector may be measured.
- a notification may be generated if the amplitude of received non-monochromatic light is above or below a threshold.
- FIGURE 1 illustrates a block diagram of a self-calibrating sensor system (SCSS) 100.
- the SCSS 100 may include a probe 102, a calibration circuit 104, a controller 106, software 108 located on in memory (not shown) and optional lookup table ("LUT") 110.
- the probe 102 is in signal communication, via signal path 112, to the calibration circuit 104.
- the calibration circuit 106 may be a divider and/or comparator circuit.
- the calibration circuit 104 is in signal communication to the controller 106 and an external output device (not shown) via signal paths 114 and 116, respectively.
- the controller 106 is in signal communication to software 108 and optional LUT 110 via signal paths 118 and 120, respectively.
- the controller 106 may be any general-purpose processor such as an Intel XXX86, Motorola 68XXX or PowerPC, DEC Alpha or other equivalent processor. Alternatively, a specific circuit or oriented device may selectively be utilized as the controller 106. Additionally, the controller 106 may also be integrated into a signal semiconductor chip such as an Application Specific Integrated Chip (ASIC) or Reduced Instruction Set Computer (RISC), or may be implemented via a Digital Signal Processor (DSP) chip. Examples of a specific circuit or oriented device for the controller 106 may also be a mixed sionac ASIC.
- ASIC Application Specific Integrated Chip
- RISC Reduced Instruction Set Computer
- DSP Digital Signal Processor
- the software 108 may be resident in memory (not shown) located either internally or externally to the controller 106.
- the software 108 includes both logic enabling the controller 106 to operate and also logic for self-calibrating the SCSS 100.
- An example of the external output device may be an oximeter such as a NPB40 manufactured by Nellcor of Pleasanton, Calif., a 9840 Series pulse oximeter manufactured by Nonin Medical, Inc. of Madison, Minn., or an equivalent device.
- FIGURE 2 shows an example implementation of probe 102.
- Probe 102 may include a probe light source 200 and wavelength sensor 202.
- Probe light source 200 may include a first light source 204 and second light source 206.
- First light source 204 and second light source 206 may be implemented utilizing light-emitting diodes (LEDs).
- first light source 204 may be an LED emitting light radiation at a wavelength of approximately 660 nm
- second light source 206 may be an LED emitting light radiation at a wavelength of approximately 880 nm.
- Wavelength sensor 202 may be implemented utilizing a double diffusion photodiode. It is appreciated by those of skill in the art that probe light source 200 may also include multiple light sources in the order of three or more.
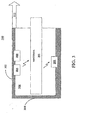
- probe 300 may be a medical device such as a transmissive blood oxygen saturation and pulse rate sensor. However, it would be appreciated by one skilled in the art that probe 300 may also be a reflective sensor. Additionally, probe 300 may also be utilized for measuring other blood constituents including, but not limited to, oxyhemoglobin, bilirubin, carboxy-hemoglobin, and glucose. Probe 300 may include a rigid casing 302 having a cavity 304 and casing butt 306, first light source 204, second light source 206 and wavelength sensor 202. Probe 300 is connected to calibration circuit 104, FIGURE 1 , via signal path 112. A material 308, FIGURE 3 , such as a finger may be inserted into the cavity 304.
- a material 308, FIGURE 3 such as a finger may be inserted into the cavity 304.
- first light source 204 and second light source 206 may be two LED emitters that produce light radiation at a wavelength of approximately 660 nm and 880 nm, respectively.
- Wavelength sensor 202 is supported within the rigid casing 302 opposite first light source 204 and second light source 206.
- First light source 204 and second light source 206 and wavelength sensor 202 may be in signal communication with a control cable (not shown).
- the control cable is in signal communication with an oximeter (not shown) via signal path 112.
- the oximeter determines the oxygen saturation of the blood in the material 308 (in this example a finger) by measuring and processing the amount of incident light radiation reaching wavelength sensor 202 from a pulse of light radiation from first light source 204.
- the SCSS 100, FIGURE 1 performs a self-calibration procedure prior to and while measuring any of the properties of the material 308, FIGURE 3 .
- This self-calibration procedure includes emitting a pulse of light radiation from the first light source 204 that is received as incident light radiation by wavelength sensor 202 prior to inserting material 308 into the cavity 304.
- the oximeter utilizes the measured incident light radiation received by wavelength sensor 202 to determine the operating wavelength of the first light source 204.
- the SCSS 100, FIGURE 1 is utilized in combination with the oximeter to accurately determine blood oxygen saturation of the material 308.
- the continuous self-calibration procedure is beneficial because it is appreciated by those skilled in the art that light radiation output by first light source 204 of 660 nm in this example implementation is in the red spectral region. It is the absorption of this red light radiation that the oximeter utilizes to determine the oxygen saturation of the blood. As such, a relatively small variation in operating wavelength may results in inaccurate readings at the oximeter. As an example, without the self-calibration procedure, if the light radiation output by first light source 204 varied in excess of .+-.2 nm from an operating wavelength required by the oximeter, the results would be inaccurate.
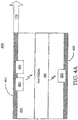
- FIGURE 4A illustrates a cross-sectional view of another example implementation of probe 400.
- probe 400 may include a rigid or flexible casing 402 having a cavity 404, first light source 204, second light source 206 and wavelength sensor 202. Similar to the previous example implementation, probe 400 is connected to calibration circuit 104, FIGURE 1 , via signal path 112, however, probe 400, FIGURE 4A , does not have a cavity butt. A material 406 may be inserted into the cavity 404.
- first light source 204 and second light source 206 may be two LED emitters that produce light radiation at different wavelengths.
- Wavelength sensor 202 is supported within the rigid casing 402 opposite first light source 204 and second light source 206.
- First light source 204 and second light source 206 and wavelength sensor 202 may be in signal communication with a control cable (not shown).
- the control cable is in signal communication with a measuring device (not shown) via signal path 112.
- the measuring device determines the properties in the material 406 by measuring and processing the amount of incident light radiation reaching wavelength sensor 202 from a pulse of light radiation from first light source 204.
- the material 406 may be a fluid, liquid or solid material that exhibits optical transmissive characteristics that may be measured and utilized to determine the properties of the material.
- An example implementation would include measuring the properties of the material for process or quality control purposes.
- the SCSS 100, FIGURE 1 performs a self-calibration procedure prior to measuring any of the properties of the material 406, FIGURE 4A .
- This self-calibration procedure includes emitting a pulse of light radiation from the first light source 204 that is received as incident light radiation by wavelength sensor 202 prior to inserting material 406 into the cavity 404.
- the measuring device utilizes the measured incident light radiation received by wavelength sensor 202 to determine the operating wavelength of the first light source 204. Once the operating wavelength of the first light source 204 is known, the SCSS 100, FIGURE 1 , is utilized in combination with the measuring device to accurately determine the properties of the material 406.
- FIGURE 4B illustrates a cross-sectional view of an example reflective implementation of probe 408.
- probe 408 may include a rigid or flexible casing 410 having a cavity 412, first light source 204, second light source 206 and wavelength sensor 202. Similar to the previous example implementation, probe 408 is connected to calibration circuit 104, FIGURE 1 , via signal path 112, however, probe 408, FIGURE 4B , does not have a cavity butt. A material 412 may be inserted into the cavity 412.
- first light source 204 and second light source 206 may be two LED emitters that produce light radiation at different wavelengths.
- wavelength sensor 202 is supported within the rigid casing 410 adjacent to first light source 204 and second light source 206.
- First light source 204 and second light source 206 and wavelength sensor 202 may be in signal communication with a control cable (not shown).
- the control cable is in signal communication with a measuring device (not shown) via signal path 112.
- the measuring device determines the properties in the material 412 by measuring and processing the amount of incident light radiation reflected by material 412 and reaching wavelength sensor 202 from a pulse of light radiation from first light source 204.
- the material 412 may be a fluid, liquid or solid material that exhibits optical transmissive characteristics that may be measured and utilized to determine the properties of the material.
- An example implementation would include measuring the properties of the material for process or quality control purposes.
- the SCSS 100, FIGURE 1 performs a self-calibration procedure prior to measuring any of the properties of the material 412, FIGURE 4B .
- This self-calibration procedure includes emitting a pulse of light radiation from the first light source 204 that is reflected by flexible casing 410 and later received as incident light radiation by wavelength sensor 202 prior to inserting material 412 into the cavity 410.
- the measuring device utilizes the measured incident light radiation received by wavelength sensor 202 to determine the operating wavelength of the first light source 204. Once the operating wavelength of the first light source 204 is known, the SCSS 100, FIGURE 1 , is utilized in combination with the measuring device to accurately determine the properties of the material 412.
- Probe 500 may include first light source 204, second light source 206 and wavelength sensor 202.
- probe 500 is a blood oxygen saturation and pulse rate sensor that utilizes the flexible strip 502 to attach to a material, such as a body part (not shown).
- the probe 500 is connected to an oximeter (not shown) via signal path 112.
- the flexible strip 502 may be wrapped around the body part and affixed to itself via an attachment strip (such as an adhesive strip) 504.
- Example body parts would include a finger, toe, ear-lobe, arm, leg or other similar parts.
- first light source 204 and second light source 206 may be two LED emitters that produce light radiation at a wavelength of approximately 660 nm and 880 nm, respectively.
- Wavelength sensor 202 is supported within the flexible strip 502 and placed opposite first light source 204 and second light source 206 when the flexible strip 502 is wrapped around a body part.
- First light source 204 and second light source 206 and wavelength sensor 202 may be in signal communication with a control cable (not shown).
- the control cable is in signal communication with an oximeter (not shown) via signal path 112.
- the oximeter determines the oxygen saturation of the blood in the body part by measuring and processing the amount of incident light radiation reaching wavelength sensor 202 from a pulse of light radiation from first light source 204.
- the SCSS 100 performs a self-calibration procedure prior to measuring any of the properties of the body part.
- This self-calibration procedure includes, prior to wrapping flexible strip 502 around the body part, bending the flexible strip 502 so that the first light source 204 and second light source 206 are opposite in special orientation to wavelength sensor 202 and then emitting a pulse of light radiation from the first light source 204 that is received as incident light radiation by wavelength sensor 202.
- the oximeter utilizes the measured incident light radiation received by wavelength sensor 202 to determine the operating wavelength of the first light source 204.
- the wavelength sensor 202 measures the incident light radiation emitted by the first light source 204 and passing through the blood flowing within the body part.
- the SCSS 100 FIGURE 1 , is then utilized in combination with the oximeter to accurately determine blood oxygen saturation of the body part.
- FIGURE 6 a cross-sectional view of the probe 500 is shown in a wrap type position.
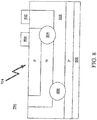
- Probe 700 includes probe light source 702 and wavelength sensor 704.
- Probe light source 702 includes first light source 706 and second light source 708.
- First light source 706 may include LED 710 and second light source may include LED 712.
- Wavelength sensor 704 is a double diffusion photodiode.
- LED 710 and LED 712 may have their cathodes grounded in common at signal path 714 and may emit light radiation 716 at wavelengths 660 nm and 880 nm, respectively, when a voltage is applied at anodes 718 and 720, respectively.
- the emitted light radiation 716 is incident on material 722.
- a part of the emitted light radiation 716 is transmitted through material 722 and is received as incident light radiation 724 by wavelength sensor 704.
- the SCSS 100, FIGURE 1 performs a self-calibration procedure.
- the SCSS 100, FIGURE 1 performs a self-calibration procedure prior to measuring any of the properties of the material 722.
- This self-calibration procedure includes emitting a pulse of light radiation 716 from LED 710 that is received as incident light radiation 724 by wavelength sensor 704 prior to inserting material 722 between the probe light source 702 and wavelength sensor 704.
- the oximeter utilizes the measured incident light radiation 724 received by wavelength sensor 704 to determine the operating wavelength of LED 710. Once the operating wavelength of LED 710 is known, the SCSS 100, FIGURE 1 , is utilized in combination with the oximeter to accurately determine blood oxygen saturation of the material 722.
- FIGURE 8 illustrates a cross-sectional view of the wavelength sensor 704 receiving incident light radiation 724 utilizing a double diffusion photodiode (also known as a double junction photodiode).
- Photodiodes with double diffusion are typically utilized to accurately measure the centroid wavelength of light sources such as LEDs 710 and 712.
- Double diffusion photodiodes are processed with two junctions, one on the top surface and one on the back surface of a semiconductor photodiode (such as a Si-photodiode), each junction typically exhibits a different and well-defined spectral response. As result, by measuring the quotient of signals generated by the two junctions, the centroid wavelength of any given monochromatic light source may be determined.
- the wavelength sensor 704 has two p-n junctions constructed vertically on a common silicon substrate.
- the wavelength sensor 704 includes a first anode 800, common cathode 802, first diode 804 (also known as an upper diode), second diode 806 (also known as a lower diode), second anode 808, and a thin active region 810.
- the first anode 800 is positioned on the top surface above the common cathode 802 forming the first diode 804.
- the thickness of the first diode 804 is chosen so that the energy of the shortest wavelength being measured from the incident light radiation 724 is absorbed entirely therein.
- the second diode 806 is formed between the common cathode 802 and the second anode 808 that placed on the bottom surface with the thin active region 810 between the common cathode 802 and the second anode 808.
- the thickness of the thin active region 810 is selected to allow for absorption of substantially all of the longest measured wavelength of incident light radiation 724.
- FIGURE 9 illustrates a typical plot 900 of the spectral response of the wavelength sensor 704, FIGURE 8 .
- the plot 900, FIGURE 9 has a vertical axis 902 representing relative response, in percentage, of the wavelength sensor 704, FIGURE 8 , and a horizontal axis 904, FIGURE 9 , representing the wavelength of the incident light radiation 724, FIGURE 8 .
- the plot 900, FIGURE 9 shows two response curves 906 and 908 representing the relative response versus wavelength for the first diode 804, FIGURE 8 , and the second diode 806, respectively.
- the first diode 804 may have an enhanced blue response and the second diode 806 may have an enhanced red response.
- the absorbed radiation of the incident light radiation 724 between the red and blue responses (such as between 450 and 900 nm) generates two photocurrent signals proportional to the wavelength of the incident light radiation 724. The quotient of these photocurrent signals is independent of the light level up to the saturation point of the wavelength sensor 704. Utilizing this example, the wavelength of either monochromatic incident light radiation 724 or the spectral density peak of polychromatic incident light radiation 724 may be determined.
- An example of the wavelength sensor 704 may be a PSS WS-7.56 wavelength sensor produced by Pacific Silicon Sensor, Inc. of Westlake Village, Calif.
- FIGURE 10 a schematic diagram depicting an exemplary implementation of the calibration circuit 1000 is shown.
- the calibration circuit 1000 is in signal communication with the probe 1002 and controller 106, FIGURE 1 , via signal paths 112 and 114, respectively.
- the calibration circuit 1000 may include a pair of amplifiers 1004 and 1006 (such as log amplifiers) in signal communication with first anode 800, FIGURE 8 and second anode 808 of wavelength sensor 1008, FIGURE 10 , and a differential amplifier 1010, via signal paths 1010, 1012 and 1014, respectively.
- the differential amplifier 1008 is in signal communication with the controller 106, FIGURE 1 , via signal path 112.
- the wavelength sensor 1004 produces two photocurrent signals from the two junctions (i.e., photodiodes 804 and 806) in the double diffusion photodiode.
- Each junction in the wavelength sensor 1004 exhibits a different and well-defined spectral response, which is know to the controller 106, FIGURE 1 , and the magnitude of these two resulting photocurrent signals are proportional to the wavelength of the measured incident light radiation 724, which corresponds to one of the light sources (either 204 or 206, FIG. 2 ) in probe 1002, FIGURE 10 .
- the photocurrent signals are amplified by amplifiers 1004 and 1006 via signal paths 1010 and 1012, respectively, and input into the differential amplifier 1008 via signal path 1018 and 1020.
- the differential output signal 1022 of the differential amplifier 1008 is almost equal to zero. Once the differential output signal 1022 is almost equal to zero the wavelength of the incident light radiation is determined and the SCSS 100, FIGURE 1 , is calibrated.
- the differential output signal 1022 is the utilized as a reference by the controller 106, FIGURE 1 .
- the controller 106 determines the wavelength of the incident light radiation 724 by knowing the spectral response of the photodiodes 804 and 806, FIGURE 8 .
- the controller 106 either determines the wavelength of the incident light radiation 724 utilizing software 108 or other hardware (not shown) located in the SCSS 100.
- the software 108 may include logic that allows the controller 106 to calculate the wavelength values in real-time from the measure values received from the wavelength sensor 1004.
- the controller 106 may determine the wavelength of the incident light radiation 724 utilizing the lookup ("LUT") table 110.
- the LUT 110 may be resident in memory (not shown) resident either internally or externally to the controller 106.
- the LUT 110 includes a tabulation of known spectral response in voltage versus wavelength for each photodiode 804 and 806, FIGURE 8 .
- the SCSS 100 is also capable of temperature compensating for variation in the wavelength of the incident light radiation 724 due to temperature variations.
- the SCSS 100 may compensate for temperature variations by the same process utilized to self-calibrate.
- FIGURE 11 is another exemplary implementation of the SCSS 100, FIGURE 1 , with the calibration circuit 1100, FIG. 1 , in an oximeter device 1102.
- the oximeter device 1102 is in signal communication with probe 1104, via signal path 112, and includes calibration circuit 1100, controller 1106, first driver 1108 and second driver 1110.
- the probe 1104 includes wavelength sensor 1112 and probe light source 1114 having first light source 1116 and second light source 1118.
- the first driver 1108 drives the first light source 1116 and the second driver 1110 drives the second light source 1118.
- First light source 1116 and the second light source 1118 may individually produce light radiation which is incident of the wavelength sensor 1112.
- the wavelength sensor 1112 produces two photocurrent signals from the two junctions (i.e., photodiodes 804 and 806) in the double diffusion photodiode. Again, each junction in the wavelength sensor 1112 exhibits a different and well-defined spectral response, which is know to the controller 1106 and the magnitude of these two resulting photocurrent signals are proportional to the wavelength of the measured incident light radiation, which corresponds to one of the light sources (either 1116 or 1118) in probe 1104.
- the photocurrent signals 1120 and 1122 processed and input into the differential amplifier 1224. If the photocurrent signals 1120 and 1122 are approximately equal the corresponding differential output signal 1126 of the differential amplifier 1124 is almost equal to zero. Once the differential output signal 1126 is almost equal to zero the wavelength of the incident light radiation is determined and the SCSS 100, FIGURE 1 , is calibrated.
- the corresponding differential output signal 1126 will vary according to the difference in magnitude value between the photocurrent signals 1120 and 1122.
- the differential output signal 1126 is the utilized as a reference by the controller 1106.
- the controller 1106 determines the wavelength of the incident light radiation by knowing the spectral response of the photodiodes 804 and 806.
- the controller 1106 either determines the wavelength of the incident light radiation utilizing software 108, FIGURE 1 , or other hardware (not shown) located in the SCSS 100.
- the software 108 may include logic that allows the controller 1106, FIGURE 11 , to calculate the wavelength values in real-time from the measure values received from the wavelength sensor 1112.
- the controller 1106 may determine the wavelength of the incident light radiation utilizing the lookup LUT 110, FIG. 1 .
- the LUT 110 may be resident in memory (not shown) resident either internally or externally to the controller 1106, FIGURE 11 .
- the LUT 110, FIGURE 1 includes the tabulation of known spectral response in voltage versus wavelength for each photodiode 804 and 806.
- the controller 1106 measures the differential output signal 1126, FIGURE 11 , the software 108, FIGURE 1 , compares the value of the differential output signal 1126, FIGURE 11 , against values stored in the LUT 110, FIGURE 1 , and then retrieves a corresponding wavelength value.
- the controller 1106, FIGURE 11 then utilizes the retrieved wavelength wave to self-calibrate the SCSS 100, FIGURE 1 .
- FIGURE 12 illustrates the process performed by the SCSS 100, FIGURE 1 .
- the process begins in step 1200, FIGURE 12 .
- the wavelength sensor 202, FIGURE 2 receives incident light radiation 200 from the probe light source 200.
- the first diode 804, FIGURE 8 receives short wavelengths from the incident light radiation 200, in step 1204, FIGURE 12 , and the second diode 806, FIGURE 8 , receives long wavelengths from the incident light radiation 200 in step 1206, FIGURE 12 .
- step 1208 the first diode 804 produces a first photocurrent signal 1010, FIGURE 10 , in response to receiving short wavelengths from the incident light radiation 200 and the second diode 806 produces a second photocurrent signal 1012, FIGURE 10 , in response to receiving short wavelengths from the incident light radiation 200 in step 1210, FIGURE 12 .
- step 1212 the calibration circuit 104 and/or controller 106, FIGURE 1 , determine the wavelength of the incident light radiation 200 by comparing the first photocurrent signal 1010 to the second photocurrent signal 1012. The process then ends in step 1214.
- the SCSS 100 may be selectively implemented in software, hardware, or a combination of hardware and software.
- the elements of the SCSS 100 may be implemented in software 108 stored in a memory (not shown) located in a controller 106.
- the controller 106 may be in signal communication with a DSP or ASIC chip via communication link 112 (which may selectively be a system bus).
- the software 108 configures and drives the DSP or ASIC chip and performs the steps illustrated in FIGURE 12 .
- the software 108 comprises an ordered listing of executable instructions for implementing logical functions.
- the software 108 may be embodied in any computer-readable medium for use by or in connection with an instruction execution system, apparatus, or device, such as a computer-based system, processor-containing system, or other system that may selectively fetch the instructions from the instruction execution system, apparatus, or device and execute the instructions.
- a "computer-readable medium” is any means that may contain, store, communicate, propagate, or transport the program for use by or in connection with the instruction execution system, apparatus, or device.
- the computer readable medium may be for example, but not limited to, an electronic, magnetic, optical, electromagnetic, infrared, or semiconductor system, apparatus, device, or propagation medium.
- the computer-readable medium would include the following: an electrical connection (electronic) having one or more wires, a portable computer diskette (magnetic), a RAM (electronic), a read-only memory (ROM) (electronic), an erasable programmable read-only memory (EPROM or Flash memory) (electronic), an optical fiber (optical), and a portable compact disc read-only memory (CDROM) (optical).
- an electrical connection having one or more wires
- a portable computer diskette magnetic
- RAM random access memory
- ROM read-only memory
- EPROM or Flash memory erasable programmable read-only memory
- CDROM portable compact disc read-only memory
- the computer-readable medium may even be paper or another suitable medium upon which the program is printed, as the program can be electronically captured, via for instance optical scanning of the paper or other medium, then compiled, interpreted or otherwise processed in a suitable manner if necessary, and then stored in a computer memory.
- a non-invasive medical sensor for detecting blood constituents of any kind.
- the sensor 1310 can be for detecting oxygen saturation of hemoglobin or other parameters.
- the sensor 1310 can, but not necessarily, have one or more monochromatic light sources 1312,1313, one or more broadband, non-monochromatic light source 1314 and one or more light detectors 1316.
- the light sources and the detectors are mounted oppose to each other as shown in FIGURE 13 .
- the senor 1310 is placed on a finger 1318 or other extremity of the human body and shines light from the one or more light sources through the extremity.
- FIGURE 14 provides a depiction of a typical spectral transmission of both oxygenated (arterial) hbO2 and deoxygenated (venous) hb haemoglobin molecules (hg).
- the light is reflected off the skin of a part of the human body, instead of being shined through the extremity.
- the senor 1310 includes a wavelength detector 1316, such as a dual photodiode or any other type, which produces an output indicating the centroid wavelength of the received light.
- FIGURE 15 depicts responsiveness of a dual junction wavelength detector for both hbO2 (arterial) and hb (venous) blood flow using a broad spectrum light source.
- the sensor 1310 can further include a light source that emits light of a wide light spectrum from, for instance, 200nm to 2000nm or any portion thereof, such as a white LED or any other broad emission device.
- the sensor 1310 can be connected to a processing system 1610 ( FIGURE 16 ) that drives the light sources, including the broad emission device, and also receives signals from the photodiodes and the wavelength detector.
- the processing system 1610 contains, among other things, computer media 1612, memory 1614, and signal processing circuitry 1616 used to calculate various parameters of the blood stream through comparison of the signals received by the photodiodes of the sensor 1310. Moreover, the processing system 1610 can be used to illuminate the tissue with light generated from the broad emission light source within the sensor.
- the wavelength detector 1316 generates a signal proportional to the strongest transmission wavelength of the light emitted from the broad emission light source 1314 after the light either passes through the body part 1318 or is reflected from the skin of a human.
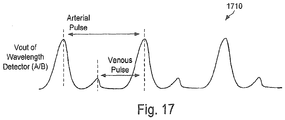
- a signal derived from the wavelength detector 1316 can be further processed by circuitry and computer processing, via the processing system 1610, to obtain a pulse waveform 1710 proportional to the arterial and venous pulse of the human body.
- the time domain and amplitude properties of both arterial and venous pulse can be stored and further used to synchronize an arterial-pulse synchronized measurement of the absorption or reflectance of one or more monochromatic light-sources 1312,1313 through the body's extremity 1318. These signals can then be used in calculating oxygen saturation, carbon-monoxide concentration, haemoglobin or any other parameter of the blood.
- the arterial and venous pulse coinciding wavelength detector signals can be used to eliminate or reduce false pulses commonly caused by motion of the human body or extremity, commonly labeled motion artifact, that could cause erroneous measurements.
- Utilizing the non-invasive sensor shown in Fig. 13 may allow for the system to make additional measurements and calculations as well.
- the senor may contain at least one monochromatic light source, at least one non-monochromatic broad spectrum emission light source, at least one light detector, and at least one wavelength detector.
- the light sources and detectors may be mounted opposing each other, or may be mounted adjacent each other.
- the sensor may be placed on tissue like a finger (as shown in Fig. 13 ) or other extremity, or any other positon that provides sufficient blood perfusion for measurement for measurement.
- perfusion may result from emitted light passing through the finger or other body part.
- the emitted light may be reflected off the skin or other body part, which may provide adequate blood perfusion for measurement.
- the detector module may be a dual element light receiver or a dual junction detector element.
- the dual detector module utilized in the system may, for example, include two photodiodes (detector A and detector B) with different and tightly controlled spectral response curves.
- the photodiodes may be constructed, for example, on a single chip epitaxial silicon die.
- the system relies on the characteristics of the detector module to derive a signal proportional to the centroid wavelength of impinging light.
- a typical response curve of the detector can be seen, for example, in Fig. 18 where curve 1810 shows the responsive curve of detector A, while curve 1820 shows the response curve of detector B.
- the sensor and system may include at least one or more light sources which emit non-monochromatic light energy of a broad spectrum, like for example, a white LED.
- the broad spectrum may cover the range of 200nm to 1300nm or any portion thereof.
- the sensor and system may further include one or more monochromatic light elements.
- the sensor and system may include a red LED and an IR emitter which emit light to be received by the detector module through or across an extremity or tissue.
- the sensor may be connected to a processing system which drives the light sources in a sequential, pulsed mode.
- the processing system may receive signals from the light receiver elements and the centroid wavelength detector.
- the processing system may include computer media, memory, and signal processing circuitry which is used to process the signals derived from light detectors contained in the sensor and derive various physiological parameters from these signals.
- the processing system may also provide control signals to the sensor.
- the signals may be used to illuminate the light sources which in turn illuminate the tissue or extremity in contact with the sensor. Illumination may occur from the at least one monochromatic light source as well as any one non-monochromatic light sources.
- the photodiodes and centroid wavelength detector module may generate a signal proportional to the highest light intensity wavelength as filtered and either passed through an extremity or tissue, or reflected through the skin or tissue.
- the signal may be further processed to determine modulation in the signal proportional to the arterial pulse and spectral absorption changes between the peak and trough of the arterial pulse.
- the signal received from the sensor may be further used to correlate changes in spectral absorption to the pulse by pulse blood oxygen concentration as well as other blood constituents.
- Fig. 19 represents the change in spectral absorption generated by the arterial pulse blood flow with a broad emission illumination emitter as detected by a centroid wavelength detector and processed by the system described herein.
- Fig. 20 depicts the peak and valley of such signal in the time domain, the valley coinciding with the peak of the arterial pulse of a patient.
- Fig. 21 shows the signal proportional to blood oxygen saturation derived and processed from centroid wavelength detector ratios (2110) and the pulse by pulse blood oxygen saturation derived from monochromatic light sources used in traditional oximeters (2120).
- centroid wavelength detector ratios 2110
- pulse blood oxygen saturation derived from monochromatic light sources used in traditional oximeters 2120.
- utilizing the centroid wavelength detector ratios provides a reasonably accurate and dynamically updated oxygen saturation measurement.
- a reliable data stream for blood oxygen concentrations or other blood constituent parameters during motion events occurring at the sensor site may be obtained and calculated. Events that normally would mask or invalidate data derived from only monochromatic illumination of tissue can be corrected or replaced.
- the substitute data derived from the changes in spectral absorption of the non-monochromatic illuminated tissue derived from a sensor for data normally derived from monochromatic light sources such as found in traditional pulse-oximeter systems may be used to correct or replace inaccurate data from the traditional monochromatic light sources.
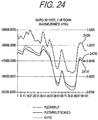
- Figs. 22-24 show the process by which pulse detection may be read and provided through a motion event occurring with the patient.
- the non-monochromatic broad spectrum light emitting element may be illuminated and the emitted light pass through a patient's tissue before being detected and received by the dual detector element.
- the arterial pulse will change the spectral absorption enough to allow the system to detect the pulse occurring.
- the needed analogue data generated by turning on the broad spectrum element periodically, like for example 30 times per second for a brief duration and sampling of the signals at both the detector A and detector B at the same gain (2220).
- the ratio of these two signals may be calculated (2230) and a result in a generated signal that reflects the average and changes in spectral absorption generated by both the occurrence of the arterial pulse and base line spectral absorption of the tissue.
- the system will then find the minimum peak signal which corresponds to the arterial pulse (2240) and determine whether or not the minimum peak occurred (2250). If the minimum peak did not occur, the system will reset the equal gain for detectors A and B and resample and recalculate the ratio.
- the minimum peak it will sample and hold the ratio (2260). Using the sampled and held Rs, an average ratio of the previous 25 samplings will be continuously updated to create a moving point average. The system will then take the ratio and look up the corresponding SpO2 value from a stored table (2270), shown in Fig. 22B , and determine if a motion flag should has been set (2280). If the currently measured ratio is within the acceptable range in the system, the process will repeat for the next sample. If the measured ratio is not within the acceptable range in the system, the system will substitute the SpO2 value obtained based on the non-monochromatic LED for any monochromatic Red/IR SpO2 value (2290).
- the ratio signal is used to establish a fall-back data stream in the event of a motion event occurring that makes it impossible to accurately calculate the oxygen saturation from the AC component ratio of red LED and IR emitter.
- the oxygen saturation data from the red to IR ratio needs to be correlated to a corresponding value (preferably sampled at the arterial peak) of signal level derived from the ratio of the two elements while the broad spectrum light source is on. If a motion even occurs, the system will revert back to that broad spectrum light source derived data stream to generate accurate oxygen saturation data during the motion event by substituting that data for the saturation data normally calculated from the red to IR ratio. For this reason, the non-monochromatic broad spectrum light source must be turned on in sequence every time the red LED and IR emitter are activated.
- Fig. 23 The plot typically derived from tissue illuminated by the non-monochromatic or white LED or ⁇ n a patient at rest and normal saturation levels can be seen in Fig. 23 , where curve 2310 shows the pleth of detector A and curve 2320 shows the pleth of detector B.
- the "Ratio" of detected light by photodiode A and photodiode B is also calculated as seen by ratio curve 2330.
- Fig. 24 shows the acquired pleth and A/B ratio during a rapid extremity wave or movement motion event on a normally saturated extremity. As seen in Fig. 24 , the excursions of the pleth amplitude, which a traditional oximeter relies on, are in excess of 21%, the A/B ratio which represents only spectral absorption, changes only 1.5%.
- the system may also be configured to measure the centroid wavelength of light produced by the non-monochromatic light source . Measuring the centroid wavelength allows for the system to detect when a probe or device is operating outside a centroid wavelength range in order to insure accuracy. The measurement may occur while the probe is applied to the patient and when the red light source is energized.
- the centroid wavelength data may be collected periodically, like for example every five (5) seconds or every 150 pulses based on an emitter pulse rate of 30 per second.
- the centroid data may be calculated by sampling both detector A and B in the dual detector element while the red LED is energized.
- the ratio of A to B corresponds to the centroid wavelength of the light emitted by the red LED and can be compared to limits embedded in the system and compared to acceptable values that assure accurate saturation measurements. It is not necessary to collect data for the IR emitter as the centroid wavelength of the IR emitter does not have a direct bearing on the accuracy of the saturation calculation. Since the measurement is taken on the patient, the system will detect shifts in the centroid wavelength induced by, for example, substances on the patient's extremity or skin pigmentation, skin defects, or the like. A system message can be generated if the centroid falls outside the limits within the system, alerting the user to replace the probe as readings may be inaccurate. Such readings may result from a motion event, as discussed above, or may be the result of the sensor becoming disengaged from the patient.
- Figs. 25 and 26 show the raw data provided from the wavelength detector using non-monochromatic broad-band (white) light source and non-perfused object and a perfused object. Ratio based amplitudes of 110 or higher indicate a non-perfused object, while amplitudes of 90 or lower indicate the presence of a perfused subject.
- the detector can accurately determine whether or not an extremity or tissue is located within the sensor, and whether or not the light is passing through the tissue or being directly provided to the sensor.
Description
- None.
- The present invention relates generally to non-invasive medical sensing devices, and in particular to error correction for a medical sensor.
- None.
- Monochromatic light sources are utilized in a broad range of applications in many distinct fields of technology including the consumer, industrial, medical, defense and scientific fields. In the medical field an emitter-receiver pair of monochromatic light sources in form of light-emitting diodes (LEDs) or similar devices are often utilized in medical sensing devices to obtain accurate non-invasive measurements. An example application of such a medical sensing device may include a blood constituent monitoring system and/or a non-invasive oximeter that may be utilized to monitor arterial oxygen saturation.
- In non-invasive oximetry, monochromatic light having a known specific wavelength is typically transmitted from an emitter LED through a target, such as biological tissue carrying blood, to a photodetector. The photodetector receives and measures a portion of transmitted coherent light that is neither absorbed nor reflected from the blood in the biological tissue in order to determine the oxygen saturation (SP02) within the blood Similarly, an example of an industrial application may include a non-invasive sensor system having a monochromatic light of a known specific wavelength transmitted from a coherent light source (such as an LED emitter) through a target, such as a fluid or material, to a photodetector.
- Unfortunately, these types of non-invasive sensor systems utilizing a monochromatic light source require accurate prior knowledge of the wavelength of the monochromatic light source in order to determine the amount of monochromatic light that is absorbed or reflected through the target. One way of having the prior knowledge of the wavelength is to select monochromatic light source emitters that have wavelengths within a certain range of tolerance. As such, attempts at determining the wavelength have included a binning process of selecting LEDs within the required nominal wavelength specifications and/or encoding data corresponding to the wavelength employed in a sensor as part of the sensor by means of a resistor, memory device or similar component.
- However, it is appreciated by those skilled in the art and familiar with the production of emitter-photodiode sensing devices that there is a need to be able to select from a wider variation of emitter output wavelengths in reducing the production costs and defect rates of the sensing devices. As an example, typical production techniques require selection of an emitter within 2 nm of a target wavelength, which may lead to rejection of 40-60% of the component emitters. Moreover, an additional problem is that a selected emitter, which was within the target wavelength at time of production, will typically degrade over time, vary with temperature and drive current, and further the drive circuit may become unstable and cause a wavelength shift. Attempts to solve the wavelength shift problem have included systems that correlate the wavelength shift to a change in drive circuit current. The change in drive circuit current drives the LED to a specific wavelength. Typically, these systems include a scheme for determining the wavelength shift of the photodiodes via a series of filters, diffusers and a plurality of photodetectors. Unfortunately, this approach is too complex and expensive for practical manufacturing techniques and cannot be employed in each sensor being used with monitoring devices.
- There is also a significant need to be able to reduce or eliminate variations resulting from patient movement, also commonly referred to as 'Motion Artefacts', differences in skin pigmentation and to detect fault situations, like for example, when a sensor becomes disengaged from a patient and is no longer able to deliver accurate information. Using current sensors and monitoring systems, such situations are generally difficult to detect and can lead to false readings and risk to the patient.
- Therefore, there is a need for a non-invasive sensor system that is capable of measuring the wavelength of a light source without requiring prior knowledge of the wavelength of the light source and is not complex or expensive to manufacture. Moreover, there is a need for error reduction is such sensor systems.
- There is also a need for a non-invasive sensor system which is capable of providing reliable data during motion events, or when the subject is engaged in movement or other physical activity or to provide a satisfactory notification or warning resulting from a patient disengaging the non-invasive sensor.
- It is noted that patent publication
US 8 271 063 B2 discloses a system and method for a non-invasive medical sensor. A sensor is disclosed having one or more coherent light sources, one broadband light source and one or more light detectors. At least one of the detectors produces an output in response to received light. Also, electrical circuitry in response to the output generates a pulse waveform proportional to the arterial and venous pulse of a human body, wherein the pulse waveform is used to synchronize an arterial-pulse measurement of the absorption or reflectance of one or more coherent light sources. By measuring the quotient of signals generated by two detectors having different spectral responses, the centroid wavelength of any given monochromatic light source or the spectral density peak of the broadband light source may be determined. - It is further noted that patent publication
US 2014/0275882 A1 discloses methods and systems for determining a probe-off condition in a medical device. A physiological monitoring system uses one or more characteristics of an ambient light component to determine a probe-off condition. - The present invention is directed to a non-invasive sensing system according to
claim 9. - The system may comprise electrical circuitry which responsive to the output of the light detectors generates a pulse waveform proportional to the arterial and venous pulse of a human body, wherein the pulse waveform is used to synchronize an arterial-pulse measurement of the absorption or reflectance of one or more monochromatic or non-monochromatic light sources.
- According to one aspect of the invention, a method according to
claim 1 is provided. - The method includes providing a first detector and second detector in a noninvasive optical sensor and emitting light from a non-monochromatic light source in the noninvasive optical sensor periodically. A first signal from the first detector and a second signal from the second detector are generated, resulting from light periodically emitted the non-monochromatic light source sampled by the first detector and the second detector, both detectors having well defined and differing spectral responses. A third signal is generated using a ratio of first signal and the second signal to determine an average spectral absorption and any changes in spectral absorption generated by the occurrence of an arterial pulse and base spectral absorption of tissue located within the non-invasive optical sensor. Oxygen saturation data is generated using the first signal and the second signal, and the oxygen saturation data is substituted for oxygen saturation data obtained based on a monochromatic light source if the ratio of the first signal and the second signal is not within an acceptable system range.
- According to a preferred embodiment of the invention, at least one light emitter emitting red light and at least one light emitter emitting infrared light is provided in the non-invasive optical sensor. A red light signal level from emitted red light received the first detector and the second detector may be generated and infrared signal level received from emitted infrared light received by the first detector and the second detector may be generated. A ratio of the light signal level to the infrared signal level may be correlated to a corresponding value sampled at an arterial peak while the non-monochromatic light source is emitting light in order to generate oxygen saturation data in the tissue.
- Oxygen saturation data may be generated using the first signal and the second signal if a motion event occurs with the tissue located within the non-invasive optical sensor.
- According to the invention, a ratio of non-monochromatic light received by the first detector and the second detector is measured. If the ratio of received non-monochromatic light is above or below a threshold, a notification may be generated.
- According to a preferred embodiment of the invention, a centroid wavelength of emitted red light may be measured. If the measured centroid wavelength is determined to be outside an acceptable centroid range, and alert may be generated. According to a preferred embodiment of the invention, the first detector and second detector may have different spectral response curves, and the different spectral response curves may be utilized to derive a fourth signal proportional to the centroid wavelength of emitted red light.
- According to a preferred embodiment, the first detector and second detector are provided in a non-invasive optical sensor. Light may be emitted from a non-monochromatic light source in the non-invasive optical sensor periodically, and an amplitude of non-monochromatic light received by the first detector and the second detector may be measured. A notification may be generated if the amplitude of received non-monochromatic light is above or below a threshold.
- Other embodiments, systems, methods, features, and advantages of the present invention will be, or become, apparent to one having ordinary skill in the art upon examination of the following drawings and detailed description. It is intended that all such additional systems, methods, features, and advantages included within this description be within the scope of the present invention, and be protected by the accompanying claims.
- The invention may be better understood with reference to the following figures. The components in the figures are not necessarily to scale, emphasis instead being placed upon clearly illustrating the principles of the invention. Moreover, in the figures, like reference numerals designate corresponding parts throughout the several views:
- FIGURE] illustrates a block diagram of an example implementation of a self-calibrating sensor system (SCSS);
-
FIGURE 2 illustrates a block diagram of an example implementation of the probe block of the SCSS shownFIGURE 1 ; -
FIGURE 3 illustrates a cross-sectional view of an example implementation of the probe shown inFIGURE 2 ; -
FIGURE 4A illustrates a cross-sectional view of another example implementation of the probe shown inFIGURE 2 ; -
FIGURE 4B illustrates a cross-sectional view of example reflective implementation of the probe shown inFIGURE 2 ; -
FIGURE 5 is a top view of an example implementation of the probe shown inFIGURE 4 ; -
FIGURE 6 is a cross-sectional view of the probe implementation ofFIGURE 5 ; -
FIGURE 7 illustrates an example implementation of the probe block shown inFIGURE 2 utilizing photodiodes; -
FIGURE 8 illustrates a cross-sectional view of an example implementation of the wavelength sensor block shown inFIGURE 7 utilizing a double diffusion photodiode; -
FIGURE 9 is a graph of the response curve of the wavelength sensor shown inFIGURE 8 ; -
FIGURE 10 is schematic diagram depicting an exemplary implementation of the calibration circuit block shown inFIGURE 1 ; -
FIGURE 11 is schematic diagram depicting another exemplary implementation of the calibration circuit block shown inFIGURE 1 ; -
FIGURE 12 is a flow chart illustrating the process performed by the SCSS shown inFIGURE 1 ; -
FIGURE 13 is a simplified cross-sectional view of a sensor in accordance with the present invention; -
FIGURE 14 is a chart depicting the typical spectral absorption characteristics of an arterial and venous pulse; -
FIGURE 15 is a chart depicting response of the wavelength sensor to both arterial and venous pulses; -
FIGURE 16 is a simplified block diagram of a processing system for use with the sensor ofFIGURE 13 ; -
FIGURE 17 is a chart depicting a pulse waveform proportional to the arterial and venous pulse of the human body as produced after processing the signals from the wavelength sensor; -
FIGURE 18 is a chart depicting the response curves of the detectors of a dual detector module contemplated by the invention; -
FIGURE 19 is a chart depicting the change in spectral absorption generated by the arterial pulse blood flow with a broad emission illumination emitter as detected by a centroid wavelength detector as contemplated by the invention; -
FIGURE 20 is a chart depicting the peak and valley of the spectral absorption in the time domain; -
FIGURE 21 is a chart which depicts a signal proportional to the blood oxygen saturation level; -
FIGURE 22A is a flow chart showing the process through which pulse detection may be read and provided by the system through a motion event; -
FIGURE 22B shows an exemplary look up table utilized in the process shown inFIGURE 22A ; -
FIGURE 23 is a chart depicting saturation levels of a patient at rest; -
FIGURE 24 is a chart depicting saturation levels detected during a motion event; -
FIGURE 25 is a chart depicting raw data provided by a wavelength detector resulting from a non-perfused signal; and -
FIGURE 26 is a chart depicting raw data provided by a wavelength detector resulting from a perfused signal. - The following descriptions of detailed embodiments are for exemplifying the principles and advantages of the inventions claimed herein. They are not to be taken in any way as limitations on the scope of the inventions.
-
FIGURE 1 illustrates a block diagram of a self-calibrating sensor system (SCSS) 100. TheSCSS 100 may include aprobe 102, acalibration circuit 104, acontroller 106,software 108 located on in memory (not shown) and optional lookup table ("LUT") 110. Theprobe 102 is in signal communication, viasignal path 112, to thecalibration circuit 104. Thecalibration circuit 106 may be a divider and/or comparator circuit. - The
calibration circuit 104 is in signal communication to thecontroller 106 and an external output device (not shown) viasignal paths controller 106 is in signal communication tosoftware 108 andoptional LUT 110 viasignal paths - The
controller 106 may be any general-purpose processor such as an Intel XXX86, Motorola 68XXX or PowerPC, DEC Alpha or other equivalent processor. Alternatively, a specific circuit or oriented device may selectively be utilized as thecontroller 106. Additionally, thecontroller 106 may also be integrated into a signal semiconductor chip such as an Application Specific Integrated Chip (ASIC) or Reduced Instruction Set Computer (RISC), or may be implemented via a Digital Signal Processor (DSP) chip. Examples of a specific circuit or oriented device for thecontroller 106 may also be a mixed sionac ASIC. - The
software 108 may be resident in memory (not shown) located either internally or externally to thecontroller 106. Thesoftware 108 includes both logic enabling thecontroller 106 to operate and also logic for self-calibrating theSCSS 100. - An example of the external output device may be an oximeter such as a NPB40 manufactured by Nellcor of Pleasanton, Calif., a 9840 Series pulse oximeter manufactured by Nonin Medical, Inc. of Plymouth, Minn., or an equivalent device.
-
FIGURE 2 shows an example implementation ofprobe 102.Probe 102 may include a probelight source 200 andwavelength sensor 202. Probelight source 200 may include a firstlight source 204 and secondlight source 206. Firstlight source 204 and secondlight source 206 may be implemented utilizing light-emitting diodes (LEDs). As an example implementation in oximeter application, firstlight source 204 may be an LED emitting light radiation at a wavelength of approximately 660 nm and secondlight source 206 may be an LED emitting light radiation at a wavelength of approximately 880 nm.Wavelength sensor 202 may be implemented utilizing a double diffusion photodiode. It is appreciated by those of skill in the art that probelight source 200 may also include multiple light sources in the order of three or more. - In
FIGURE 3 , a cross-sectional view of an example implementation of theprobe 300 is shown. In this example, probe 300 may be a medical device such as a transmissive blood oxygen saturation and pulse rate sensor. However, it would be appreciated by one skilled in the art that probe 300 may also be a reflective sensor. Additionally, probe 300 may also be utilized for measuring other blood constituents including, but not limited to, oxyhemoglobin, bilirubin, carboxy-hemoglobin, and glucose.Probe 300 may include arigid casing 302 having acavity 304 andcasing butt 306, firstlight source 204, secondlight source 206 andwavelength sensor 202.Probe 300 is connected tocalibration circuit 104,FIGURE 1 , viasignal path 112. Amaterial 308,FIGURE 3 , such as a finger may be inserted into thecavity 304. - As an example, first
light source 204 and secondlight source 206 may be two LED emitters that produce light radiation at a wavelength of approximately 660 nm and 880 nm, respectively.Wavelength sensor 202 is supported within therigid casing 302 opposite firstlight source 204 and secondlight source 206. Firstlight source 204 and secondlight source 206 andwavelength sensor 202 may be in signal communication with a control cable (not shown). The control cable is in signal communication with an oximeter (not shown) viasignal path 112. The oximeter determines the oxygen saturation of the blood in the material 308 (in this example a finger) by measuring and processing the amount of incident light radiation reachingwavelength sensor 202 from a pulse of light radiation from firstlight source 204. - In operation, the
SCSS 100,FIGURE 1 , performs a self-calibration procedure prior to and while measuring any of the properties of thematerial 308,FIGURE 3 . This self-calibration procedure includes emitting a pulse of light radiation from the firstlight source 204 that is received as incident light radiation bywavelength sensor 202 prior to insertingmaterial 308 into thecavity 304. The oximeter utilizes the measured incident light radiation received bywavelength sensor 202 to determine the operating wavelength of the firstlight source 204. Once the operating wavelength of the first light source 203 is known, theSCSS 100,FIGURE 1 , is utilized in combination with the oximeter to accurately determine blood oxygen saturation of thematerial 308. - The continuous self-calibration procedure is beneficial because it is appreciated by those skilled in the art that light radiation output by first
light source 204 of 660 nm in this example implementation is in the red spectral region. It is the absorption of this red light radiation that the oximeter utilizes to determine the oxygen saturation of the blood. As such, a relatively small variation in operating wavelength may results in inaccurate readings at the oximeter. As an example, without the self-calibration procedure, if the light radiation output by firstlight source 204 varied in excess of .+-.2 nm from an operating wavelength required by the oximeter, the results would be inaccurate. -
FIGURE 4A illustrates a cross-sectional view of another example implementation ofprobe 400. In this example, probe 400 may include a rigid orflexible casing 402 having acavity 404, firstlight source 204, secondlight source 206 andwavelength sensor 202. Similar to the previous example implementation,probe 400 is connected tocalibration circuit 104,FIGURE 1 , viasignal path 112, however,probe 400,FIGURE 4A , does not have a cavity butt. Amaterial 406 may be inserted into thecavity 404. - Similar to the previous example, first
light source 204 and secondlight source 206 may be two LED emitters that produce light radiation at different wavelengths.Wavelength sensor 202 is supported within therigid casing 402 opposite firstlight source 204 and secondlight source 206. Firstlight source 204 and secondlight source 206 andwavelength sensor 202 may be in signal communication with a control cable (not shown). The control cable is in signal communication with a measuring device (not shown) viasignal path 112. The measuring device determines the properties in thematerial 406 by measuring and processing the amount of incident light radiation reachingwavelength sensor 202 from a pulse of light radiation from firstlight source 204. - As an industrial example, the
material 406 may be a fluid, liquid or solid material that exhibits optical transmissive characteristics that may be measured and utilized to determine the properties of the material. An example implementation would include measuring the properties of the material for process or quality control purposes. - Again in operation, the
SCSS 100,FIGURE 1 , performs a self-calibration procedure prior to measuring any of the properties of thematerial 406,FIGURE 4A . This self-calibration procedure includes emitting a pulse of light radiation from the firstlight source 204 that is received as incident light radiation bywavelength sensor 202 prior to insertingmaterial 406 into thecavity 404. The measuring device utilizes the measured incident light radiation received bywavelength sensor 202 to determine the operating wavelength of the firstlight source 204. Once the operating wavelength of the firstlight source 204 is known, theSCSS 100,FIGURE 1 , is utilized in combination with the measuring device to accurately determine the properties of thematerial 406. -
FIGURE 4B illustrates a cross-sectional view of an example reflective implementation ofprobe 408. In this example, probe 408 may include a rigid orflexible casing 410 having acavity 412, firstlight source 204, secondlight source 206 andwavelength sensor 202. Similar to the previous example implementation,probe 408 is connected tocalibration circuit 104,FIGURE 1 , viasignal path 112, however,probe 408,FIGURE 4B , does not have a cavity butt. Amaterial 412 may be inserted into thecavity 412. - Similar to the previous example, first
light source 204 and secondlight source 206 may be two LED emitters that produce light radiation at different wavelengths. However, in this example,wavelength sensor 202 is supported within therigid casing 410 adjacent to firstlight source 204 and secondlight source 206. Firstlight source 204 and secondlight source 206 andwavelength sensor 202 may be in signal communication with a control cable (not shown). The control cable is in signal communication with a measuring device (not shown) viasignal path 112. The measuring device determines the properties in thematerial 412 by measuring and processing the amount of incident light radiation reflected bymaterial 412 and reachingwavelength sensor 202 from a pulse of light radiation from firstlight source 204. - Again, as an industrial example, the
material 412 may be a fluid, liquid or solid material that exhibits optical transmissive characteristics that may be measured and utilized to determine the properties of the material. An example implementation would include measuring the properties of the material for process or quality control purposes. - Again in operation, the
SCSS 100,FIGURE 1 , performs a self-calibration procedure prior to measuring any of the properties of thematerial 412,FIGURE 4B . This self-calibration procedure includes emitting a pulse of light radiation from the firstlight source 204 that is reflected byflexible casing 410 and later received as incident light radiation bywavelength sensor 202 prior to insertingmaterial 412 into thecavity 410. The measuring device utilizes the measured incident light radiation received bywavelength sensor 202 to determine the operating wavelength of the firstlight source 204. Once the operating wavelength of the firstlight source 204 is known, theSCSS 100,FIGURE 1 , is utilized in combination with the measuring device to accurately determine the properties of thematerial 412. - It is appreciated by of skill in the art that it is possible to generate signals from the
wavelength sensor 202,FIGURE 2 during operation of thelight sources material 308,FIGURE 3 , 406,FIGURE 4A , and/or 414,FIGURE 4B ) being inspected. It is also possible to generate the same signals using light reflected off the medium. Therefore, it is not necessary to couple thelight sources 204,FIGURE 2 and 206 directly to thewavelength sensor 202 as long as the medium either transmits or reflects enough light to generate processable signals from thewavelength sensor 202. - In
FIGURE 5 , a top view of an example medical implementation ofprobe 500 having a flexible casing (i.e., flexible strip) 502 is shown.Probe 500 may include firstlight source 204, secondlight source 206 andwavelength sensor 202. In this example implementation,probe 500 is a blood oxygen saturation and pulse rate sensor that utilizes theflexible strip 502 to attach to a material, such as a body part (not shown). Theprobe 500 is connected to an oximeter (not shown) viasignal path 112. Theflexible strip 502 may be wrapped around the body part and affixed to itself via an attachment strip (such as an adhesive strip) 504. Example body parts would include a finger, toe, ear-lobe, arm, leg or other similar parts. - As an example, first
light source 204 and secondlight source 206 may be two LED emitters that produce light radiation at a wavelength of approximately 660 nm and 880 nm, respectively.Wavelength sensor 202 is supported within theflexible strip 502 and placed opposite firstlight source 204 and secondlight source 206 when theflexible strip 502 is wrapped around a body part. Firstlight source 204 and secondlight source 206 andwavelength sensor 202 may be in signal communication with a control cable (not shown). The control cable is in signal communication with an oximeter (not shown) viasignal path 112. The oximeter determines the oxygen saturation of the blood in the body part by measuring and processing the amount of incident light radiation reachingwavelength sensor 202 from a pulse of light radiation from firstlight source 204. - As before, in operation, the
SCSS 100,FIGURE 1 , performs a self-calibration procedure prior to measuring any of the properties of the body part. This self-calibration procedure includes, prior to wrappingflexible strip 502 around the body part, bending theflexible strip 502 so that the firstlight source 204 and secondlight source 206 are opposite in special orientation towavelength sensor 202 and then emitting a pulse of light radiation from the firstlight source 204 that is received as incident light radiation bywavelength sensor 202. The oximeter utilizes the measured incident light radiation received bywavelength sensor 202 to determine the operating wavelength of the firstlight source 204. Once the operating wavelength of the firstlight source 204 is known, placed around a body part and thewavelength sensor 202 measures the incident light radiation emitted by the firstlight source 204 and passing through the blood flowing within the body part. TheSCSS 100,FIGURE 1 , is then utilized in combination with the oximeter to accurately determine blood oxygen saturation of the body part. InFIGURE 6 , a cross-sectional view of theprobe 500 is shown in a wrap type position. - In
FIGURE 7 , an example implementation of theprobe 700 is shown utilizing photodiodes. Similar toFIGURE 2 ,Probe 700,FIGURE 7 , includes probelight source 702 andwavelength sensor 704. Probelight source 702 includes firstlight source 706 and secondlight source 708. Firstlight source 706 may include LED 710 and second light source may includeLED 712.Wavelength sensor 704 is a double diffusion photodiode. - As an example of operation, LED 710 and
LED 712 may have their cathodes grounded in common atsignal path 714 and may emit light radiation 716 atwavelengths 660 nm and 880 nm, respectively, when a voltage is applied atanodes material 722. A part of the emitted light radiation 716 is transmitted throughmaterial 722 and is received as incidentlight radiation 724 bywavelength sensor 704. As before, in order to properly measure the properties of the material 722 from the received incidentlight radiation 724, theSCSS 100,FIGURE 1 performs a self-calibration procedure. - The
SCSS 100,FIGURE 1 , performs a self-calibration procedure prior to measuring any of the properties of thematerial 722. This self-calibration procedure includes emitting a pulse of light radiation 716 from LED 710 that is received as incidentlight radiation 724 bywavelength sensor 704 prior to insertingmaterial 722 between the probelight source 702 andwavelength sensor 704. The oximeter utilizes the measured incidentlight radiation 724 received bywavelength sensor 704 to determine the operating wavelength of LED 710. Once the operating wavelength of LED 710 is known, theSCSS 100,FIGURE 1 , is utilized in combination with the oximeter to accurately determine blood oxygen saturation of thematerial 722. -
FIGURE 8 illustrates a cross-sectional view of thewavelength sensor 704 receiving incidentlight radiation 724 utilizing a double diffusion photodiode (also known as a double junction photodiode). Photodiodes with double diffusion are typically utilized to accurately measure the centroid wavelength of light sources such asLEDs 710 and 712. Double diffusion photodiodes are processed with two junctions, one on the top surface and one on the back surface of a semiconductor photodiode (such as a Si-photodiode), each junction typically exhibits a different and well-defined spectral response. As result, by measuring the quotient of signals generated by the two junctions, the centroid wavelength of any given monochromatic light source may be determined. - The
wavelength sensor 704 has two p-n junctions constructed vertically on a common silicon substrate. Thewavelength sensor 704 includes afirst anode 800,common cathode 802, first diode 804 (also known as an upper diode), second diode 806 (also known as a lower diode),second anode 808, and a thinactive region 810. Thefirst anode 800 is positioned on the top surface above thecommon cathode 802 forming thefirst diode 804. The thickness of thefirst diode 804 is chosen so that the energy of the shortest wavelength being measured from the incidentlight radiation 724 is absorbed entirely therein. Thesecond diode 806 is formed between thecommon cathode 802 and thesecond anode 808 that placed on the bottom surface with the thinactive region 810 between thecommon cathode 802 and thesecond anode 808. The thickness of the thinactive region 810 is selected to allow for absorption of substantially all of the longest measured wavelength of incidentlight radiation 724. -
FIGURE 9 illustrates atypical plot 900 of the spectral response of thewavelength sensor 704,FIGURE 8 . Theplot 900,FIGURE 9 , has avertical axis 902 representing relative response, in percentage, of thewavelength sensor 704,FIGURE 8 , and ahorizontal axis 904,FIGURE 9 , representing the wavelength of the incidentlight radiation 724,FIGURE 8 . Theplot 900,FIGURE 9 , shows tworesponse curves first diode 804,FIGURE 8 , and thesecond diode 806, respectively. - As an example of operation of the
wavelength sensor 704, thefirst diode 804 may have an enhanced blue response and thesecond diode 806 may have an enhanced red response. In this example, the absorbed radiation of the incidentlight radiation 724 between the red and blue responses (such as between 450 and 900 nm) generates two photocurrent signals proportional to the wavelength of the incidentlight radiation 724. The quotient of these photocurrent signals is independent of the light level up to the saturation point of thewavelength sensor 704. Utilizing this example, the wavelength of either monochromatic incidentlight radiation 724 or the spectral density peak of polychromatic incidentlight radiation 724 may be determined. An example of thewavelength sensor 704 may be a PSS WS-7.56 wavelength sensor produced by Pacific Silicon Sensor, Inc. of Westlake Village, Calif. - In
FIGURE 10 , a schematic diagram depicting an exemplary implementation of thecalibration circuit 1000 is shown. Thecalibration circuit 1000 is in signal communication with theprobe 1002 andcontroller 106,FIGURE 1 , viasignal paths calibration circuit 1000 may include a pair ofamplifiers 1004 and 1006 (such as log amplifiers) in signal communication withfirst anode 800,FIGURE 8 andsecond anode 808 ofwavelength sensor 1008,FIGURE 10 , and adifferential amplifier 1010, viasignal paths differential amplifier 1008 is in signal communication with thecontroller 106,FIGURE 1 , viasignal path 112. - In operation, the
wavelength sensor 1004 produces two photocurrent signals from the two junctions (i.e.,photodiodes 804 and 806) in the double diffusion photodiode. Each junction in thewavelength sensor 1004 exhibits a different and well-defined spectral response, which is know to thecontroller 106,FIGURE 1 , and the magnitude of these two resulting photocurrent signals are proportional to the wavelength of the measured incidentlight radiation 724, which corresponds to one of the light sources (either 204 or 206,FIG. 2 ) inprobe 1002,FIGURE 10 . The photocurrent signals are amplified byamplifiers signal paths differential amplifier 1008 viasignal path photocurrent signals differential output signal 1022 of thedifferential amplifier 1008 is almost equal to zero. Once thedifferential output signal 1022 is almost equal to zero the wavelength of the incident light radiation is determined and theSCSS 100,FIGURE 1 , is calibrated. - When the amplified
photocurrent signals differential output signal 1022 will vary according to the difference in magnitude value between the amplifiedphotocurrent signals differential output signal 1022 is the utilized as a reference by thecontroller 106,FIGURE 1 . Thecontroller 106 determines the wavelength of the incidentlight radiation 724 by knowing the spectral response of thephotodiodes FIGURE 8 . Thecontroller 106 either determines the wavelength of the incidentlight radiation 724 utilizingsoftware 108 or other hardware (not shown) located in theSCSS 100. Thesoftware 108 may include logic that allows thecontroller 106 to calculate the wavelength values in real-time from the measure values received from thewavelength sensor 1004. - Alternatively, the
controller 106 may determine the wavelength of the incidentlight radiation 724 utilizing the lookup ("LUT") table 110. TheLUT 110 may be resident in memory (not shown) resident either internally or externally to thecontroller 106. TheLUT 110 includes a tabulation of known spectral response in voltage versus wavelength for eachphotodiode FIGURE 8 . Once thecontroller 106 measures thedifferential output signal 1022,FIGURE 10 , thesoftware 108,FIGURE 1 , compares the value of thedifferential output signal 1022,FIGURE 10 , against values stored in theLUT 110,FIGURE 1 , and then retrieves a corresponding wavelength value. Thecontroller 106 then utilizes the retrieved wavelength wave to self-calibrate theSCSS 100. - Besides self-calibration, the
SCSS 100 is also capable of temperature compensating for variation in the wavelength of the incidentlight radiation 724 due to temperature variations. TheSCSS 100 may compensate for temperature variations by the same process utilized to self-calibrate. -
FIGURE 11 is another exemplary implementation of theSCSS 100,FIGURE 1 , with thecalibration circuit 1100,FIG. 1 , in anoximeter device 1102. Theoximeter device 1102 is in signal communication with probe 1104, viasignal path 112, and includescalibration circuit 1100,controller 1106,first driver 1108 andsecond driver 1110. The probe 1104 includeswavelength sensor 1112 and probelight source 1114 havingfirst light source 1116 and secondlight source 1118. - In operation, the
first driver 1108 drives thefirst light source 1116 and thesecond driver 1110 drives the secondlight source 1118. Firstlight source 1116 and the secondlight source 1118 may individually produce light radiation which is incident of thewavelength sensor 1112. Thewavelength sensor 1112 produces two photocurrent signals from the two junctions (i.e.,photodiodes 804 and 806) in the double diffusion photodiode. Again, each junction in thewavelength sensor 1112 exhibits a different and well-defined spectral response, which is know to thecontroller 1106 and the magnitude of these two resulting photocurrent signals are proportional to the wavelength of the measured incident light radiation, which corresponds to one of the light sources (either 1116 or 1118) in probe 1104. The photocurrent signals 1120 and 1122 processed and input into the differential amplifier 1224. If the photocurrent signals 1120 and 1122 are approximately equal the correspondingdifferential output signal 1126 of thedifferential amplifier 1124 is almost equal to zero. Once thedifferential output signal 1126 is almost equal to zero the wavelength of the incident light radiation is determined and theSCSS 100,FIGURE 1 , is calibrated. - When the photocurrent signals 1120 and 1122 are not approximately equal the corresponding
differential output signal 1126 will vary according to the difference in magnitude value between the photocurrent signals 1120 and 1122. Thedifferential output signal 1126 is the utilized as a reference by thecontroller 1106. Thecontroller 1106 determines the wavelength of the incident light radiation by knowing the spectral response of thephotodiodes - The
controller 1106 either determines the wavelength of the incident lightradiation utilizing software 108,FIGURE 1 , or other hardware (not shown) located in theSCSS 100. Thesoftware 108 may include logic that allows thecontroller 1106,FIGURE 11 , to calculate the wavelength values in real-time from the measure values received from thewavelength sensor 1112. - Alternatively, the
controller 1106 may determine the wavelength of the incident light radiation utilizing thelookup LUT 110,FIG. 1 . TheLUT 110 may be resident in memory (not shown) resident either internally or externally to thecontroller 1106,FIGURE 11 . TheLUT 110,FIGURE 1 , includes the tabulation of known spectral response in voltage versus wavelength for eachphotodiode controller 1106 measures thedifferential output signal 1126,FIGURE 11 , thesoftware 108,FIGURE 1 , compares the value of thedifferential output signal 1126,FIGURE 11 , against values stored in theLUT 110,FIGURE 1 , and then retrieves a corresponding wavelength value. Thecontroller 1106,FIGURE 11 , then utilizes the retrieved wavelength wave to self-calibrate theSCSS 100,FIGURE 1 . -
FIGURE 12 illustrates the process performed by theSCSS 100,FIGURE 1 . The process begins instep 1200,FIGURE 12 . Instep 1202, thewavelength sensor 202,FIGURE 2 , receives incidentlight radiation 200 from the probelight source 200. Within thewavelength sensor 202, thefirst diode 804,FIGURE 8 , receives short wavelengths from the incidentlight radiation 200, instep 1204,FIGURE 12 , and thesecond diode 806,FIGURE 8 , receives long wavelengths from the incidentlight radiation 200 instep 1206,FIGURE 12 . Instep 1208, thefirst diode 804 produces afirst photocurrent signal 1010,FIGURE 10 , in response to receiving short wavelengths from the incidentlight radiation 200 and thesecond diode 806 produces asecond photocurrent signal 1012,FIGURE 10 , in response to receiving short wavelengths from the incidentlight radiation 200 instep 1210,FIGURE 12 . Finally, instep 1212, thecalibration circuit 104 and/orcontroller 106,FIGURE 1 , determine the wavelength of the incidentlight radiation 200 by comparing thefirst photocurrent signal 1010 to thesecond photocurrent signal 1012. The process then ends instep 1214. - The
SCSS 100 may be selectively implemented in software, hardware, or a combination of hardware and software. For example, the elements of theSCSS 100 may be implemented insoftware 108 stored in a memory (not shown) located in acontroller 106. Thecontroller 106 may be in signal communication with a DSP or ASIC chip via communication link 112 (which may selectively be a system bus). Thesoftware 108 configures and drives the DSP or ASIC chip and performs the steps illustrated inFIGURE 12 . - The
software 108 comprises an ordered listing of executable instructions for implementing logical functions. Thesoftware 108 may be embodied in any computer-readable medium for use by or in connection with an instruction execution system, apparatus, or device, such as a computer-based system, processor-containing system, or other system that may selectively fetch the instructions from the instruction execution system, apparatus, or device and execute the instructions. In the context of this document, a "computer-readable medium" is any means that may contain, store, communicate, propagate, or transport the program for use by or in connection with the instruction execution system, apparatus, or device. The computer readable medium may be for example, but not limited to, an electronic, magnetic, optical, electromagnetic, infrared, or semiconductor system, apparatus, device, or propagation medium. More specific examples (a non-exhaustive list) of the computer-readable medium would include the following: an electrical connection (electronic) having one or more wires, a portable computer diskette (magnetic), a RAM (electronic), a read-only memory (ROM) (electronic), an erasable programmable read-only memory (EPROM or Flash memory) (electronic), an optical fiber (optical), and a portable compact disc read-only memory (CDROM) (optical). Note that the computer-readable medium may even be paper or another suitable medium upon which the program is printed, as the program can be electronically captured, via for instance optical scanning of the paper or other medium, then compiled, interpreted or otherwise processed in a suitable manner if necessary, and then stored in a computer memory. - Turning to
FIGURE 13 , in an embodiment, a non-invasive medical sensor is provided for detecting blood constituents of any kind. For instance, thesensor 1310 can be for detecting oxygen saturation of hemoglobin or other parameters. - The
sensor 1310 can, but not necessarily, have one or more monochromaticlight sources light source 1314 and one or morelight detectors 1316. In an embodiment, the light sources and the detectors are mounted oppose to each other as shown inFIGURE 13 . - In an embodiment, the
sensor 1310 is placed on afinger 1318 or other extremity of the human body and shines light from the one or more light sources through the extremity.FIGURE 14 provides a depiction of a typical spectral transmission of both oxygenated (arterial) hbO2 and deoxygenated (venous) hb haemoglobin molecules (hg). Alternatively, the light is reflected off the skin of a part of the human body, instead of being shined through the extremity. - As indicated previously, the
sensor 1310 includes awavelength detector 1316, such as a dual photodiode or any other type, which produces an output indicating the centroid wavelength of the received light.FIGURE 15 depicts responsiveness of a dual junction wavelength detector for both hbO2 (arterial) and hb (venous) blood flow using a broad spectrum light source. - The
sensor 1310 can further include a light source that emits light of a wide light spectrum from, for instance, 200nm to 2000nm or any portion thereof, such as a white LED or any other broad emission device. Thesensor 1310 can be connected to a processing system 1610 (FIGURE 16 ) that drives the light sources, including the broad emission device, and also receives signals from the photodiodes and the wavelength detector. - In an embodiment, the
processing system 1610 contains, among other things,computer media 1612,memory 1614, andsignal processing circuitry 1616 used to calculate various parameters of the blood stream through comparison of the signals received by the photodiodes of thesensor 1310. Moreover, theprocessing system 1610 can be used to illuminate the tissue with light generated from the broad emission light source within the sensor. - Moreover, in an embodiment, the
wavelength detector 1316 generates a signal proportional to the strongest transmission wavelength of the light emitted from the broademission light source 1314 after the light either passes through thebody part 1318 or is reflected from the skin of a human. Turning toFIGURE 17 , a signal derived from thewavelength detector 1316 can be further processed by circuitry and computer processing, via theprocessing system 1610, to obtain apulse waveform 1710 proportional to the arterial and venous pulse of the human body. - Via the
processing system 1610, the time domain and amplitude properties of both arterial and venous pulse can be stored and further used to synchronize an arterial-pulse synchronized measurement of the absorption or reflectance of one or more monochromatic light-sources extremity 1318. These signals can then be used in calculating oxygen saturation, carbon-monoxide concentration, haemoglobin or any other parameter of the blood. - In an embodiment, the arterial and venous pulse coinciding wavelength detector signals can be used to eliminate or reduce false pulses commonly caused by motion of the human body or extremity, commonly labeled motion artifact, that could cause erroneous measurements.
- Utilizing the non-invasive sensor shown in
Fig. 13 may allow for the system to make additional measurements and calculations as well. - As discussed herein, the sensor may contain at least one monochromatic light source, at least one non-monochromatic broad spectrum emission light source, at least one light detector, and at least one wavelength detector. The light sources and detectors may be mounted opposing each other, or may be mounted adjacent each other. The sensor may be placed on tissue like a finger (as shown in
Fig. 13 ) or other extremity, or any other positon that provides sufficient blood perfusion for measurement for measurement. When the light sources are mounted opposite the detectors, perfusion may result from emitted light passing through the finger or other body part. When mounted adjacent, the emitted light may be reflected off the skin or other body part, which may provide adequate blood perfusion for measurement. - As already described herein, the detector module may be a dual element light receiver or a dual junction detector element. The dual detector module utilized in the system may, for example, include two photodiodes (detector A and detector B) with different and tightly controlled spectral response curves. The photodiodes may be constructed, for example, on a single chip epitaxial silicon die. The system relies on the characteristics of the detector module to derive a signal proportional to the centroid wavelength of impinging light. A typical response curve of the detector can be seen, for example, in
Fig. 18 wherecurve 1810 shows the responsive curve of detector A, whilecurve 1820 shows the response curve of detector B. - The sensor and system may include at least one or more light sources which emit non-monochromatic light energy of a broad spectrum, like for example, a white LED. The broad spectrum may cover the range of 200nm to 1300nm or any portion thereof. The sensor and system may further include one or more monochromatic light elements. For example, the sensor and system may include a red LED and an IR emitter which emit light to be received by the detector module through or across an extremity or tissue.
- The sensor may be connected to a processing system which drives the light sources in a sequential, pulsed mode. The processing system may receive signals from the light receiver elements and the centroid wavelength detector. The processing system may include computer media, memory, and signal processing circuitry which is used to process the signals derived from light detectors contained in the sensor and derive various physiological parameters from these signals. The processing system may also provide control signals to the sensor. The signals may be used to illuminate the light sources which in turn illuminate the tissue or extremity in contact with the sensor. Illumination may occur from the at least one monochromatic light source as well as any one non-monochromatic light sources.
- The photodiodes and centroid wavelength detector module may generate a signal proportional to the highest light intensity wavelength as filtered and either passed through an extremity or tissue, or reflected through the skin or tissue. The signal may be further processed to determine modulation in the signal proportional to the arterial pulse and spectral absorption changes between the peak and trough of the arterial pulse. The signal received from the sensor may be further used to correlate changes in spectral absorption to the pulse by pulse blood oxygen concentration as well as other blood constituents.
-
Fig. 19 represents the change in spectral absorption generated by the arterial pulse blood flow with a broad emission illumination emitter as detected by a centroid wavelength detector and processed by the system described herein.Fig. 20 depicts the peak and valley of such signal in the time domain, the valley coinciding with the peak of the arterial pulse of a patient. - The benefit to using the present system and method for determining blood oxygenation, for example, can be seen in
Fig. 21 which shows the signal proportional to blood oxygen saturation derived and processed from centroid wavelength detector ratios (2110) and the pulse by pulse blood oxygen saturation derived from monochromatic light sources used in traditional oximeters (2120). As seen inFig. 21 , utilizing the centroid wavelength detector ratios provides a reasonably accurate and dynamically updated oxygen saturation measurement. - Utilizing the pulse blood oxygen saturation data from the non-monochromatic light element, a reliable data stream for blood oxygen concentrations or other blood constituent parameters during motion events occurring at the sensor site may be obtained and calculated. Events that normally would mask or invalidate data derived from only monochromatic illumination of tissue can be corrected or replaced. The substitute data derived from the changes in spectral absorption of the non-monochromatic illuminated tissue derived from a sensor for data normally derived from monochromatic light sources such as found in traditional pulse-oximeter systems may be used to correct or replace inaccurate data from the traditional monochromatic light sources.
-
Figs. 22-24 show the process by which pulse detection may be read and provided through a motion event occurring with the patient. The non-monochromatic broad spectrum light emitting element may be illuminated and the emitted light pass through a patient's tissue before being detected and received by the dual detector element. The arterial pulse will change the spectral absorption enough to allow the system to detect the pulse occurring. After an equal gain is set for detectors A and B (2210), the needed analogue data generated by turning on the broad spectrum element periodically, like for example 30 times per second for a brief duration and sampling of the signals at both the detector A and detector B at the same gain (2220). The ratio of these two signals may be calculated (2230) and a result in a generated signal that reflects the average and changes in spectral absorption generated by both the occurrence of the arterial pulse and base line spectral absorption of the tissue. The system will then find the minimum peak signal which corresponds to the arterial pulse (2240) and determine whether or not the minimum peak occurred (2250). If the minimum peak did not occur, the system will reset the equal gain for detectors A and B and resample and recalculate the ratio. - If the minimum peak has occurred, it will sample and hold the ratio (2260). Using the sampled and held Rs, an average ratio of the previous 25 samplings will be continuously updated to create a moving point average. The system will then take the ratio and look up the corresponding SpO2 value from a stored table (2270), shown in
Fig. 22B , and determine if a motion flag should has been set (2280). If the currently measured ratio is within the acceptable range in the system, the process will repeat for the next sample. If the measured ratio is not within the acceptable range in the system, the system will substitute the SpO2 value obtained based on the non-monochromatic LED for any monochromatic Red/IR SpO2 value (2290). - The ratio signal is used to establish a fall-back data stream in the event of a motion event occurring that makes it impossible to accurately calculate the oxygen saturation from the AC component ratio of red LED and IR emitter. During normal operation the oxygen saturation data from the red to IR ratio needs to be correlated to a corresponding value (preferably sampled at the arterial peak) of signal level derived from the ratio of the two elements while the broad spectrum light source is on. If a motion even occurs, the system will revert back to that broad spectrum light source derived data stream to generate accurate oxygen saturation data during the motion event by substituting that data for the saturation data normally calculated from the red to IR ratio. For this reason, the non-monochromatic broad spectrum light source must be turned on in sequence every time the red LED and IR emitter are activated.
- The plot typically derived from tissue illuminated by the non-monochromatic or white LED or\n a patient at rest and normal saturation levels can be seen in
Fig. 23 , wherecurve 2310 shows the pleth of detector A andcurve 2320 shows the pleth of detector B. The "Ratio" of detected light by photodiode A and photodiode B is also calculated as seen byratio curve 2330.Fig. 24 shows the acquired pleth and A/B ratio during a rapid extremity wave or movement motion event on a normally saturated extremity. As seen inFig. 24 , the excursions of the pleth amplitude, which a traditional oximeter relies on, are in excess of 21%, the A/B ratio which represents only spectral absorption, changes only 1.5%. - The system may also be configured to measure the centroid wavelength of light produced by the non-monochromatic light source . Measuring the centroid wavelength allows for the system to detect when a probe or device is operating outside a centroid wavelength range in order to insure accuracy. The measurement may occur while the probe is applied to the patient and when the red light source is energized. The centroid wavelength data may be collected periodically, like for example every five (5) seconds or every 150 pulses based on an emitter pulse rate of 30 per second. The centroid data may be calculated by sampling both detector A and B in the dual detector element while the red LED is energized. The ratio of A to B corresponds to the centroid wavelength of the light emitted by the red LED and can be compared to limits embedded in the system and compared to acceptable values that assure accurate saturation measurements. It is not necessary to collect data for the IR emitter as the centroid wavelength of the IR emitter does not have a direct bearing on the accuracy of the saturation calculation. Since the measurement is taken on the patient, the system will detect shifts in the centroid wavelength induced by, for example, substances on the patient's extremity or skin pigmentation, skin defects, or the like. A system message can be generated if the centroid falls outside the limits within the system, alerting the user to replace the probe as readings may be inaccurate. Such readings may result from a motion event, as discussed above, or may be the result of the sensor becoming disengaged from the patient.
-
Figs. 25 and 26 show the raw data provided from the wavelength detector using non-monochromatic broad-band (white) light source and non-perfused object and a perfused object. Ratio based amplitudes of 110 or higher indicate a non-perfused object, while amplitudes of 90 or lower indicate the presence of a perfused subject. By setting limits and detecting the raw data in the wavelength detector, the detector can accurately determine whether or not an extremity or tissue is located within the sensor, and whether or not the light is passing through the tissue or being directly provided to the sensor. - While various implementations of the application have been described, it will be apparent to those of ordinary skill in the art that many more embodiments and implementations are possible that are within the scope of the invention as defined in the claims.
Claims (9)
- A method for eliminating error when using a non-invasive optical sensing system comprising:providing a first detector (1316) and a second detector (1316) in a non-invasive optical sensor;emitting light from a non-monochromatic light source (1314) in the non-invasive optical sensor periodically;generating a first signal from the first detector (1316) and a second signal from the second detector (1316) resulting from light periodically emitted by the non-monochromatic light source sampled by the first detector and the second detector;generating (2230) a third signal using a ratio of the first signal and the second signal to determine an average spectral absorption and any changes in spectral absorption generated by the occurrence of an arterial pulse and base line spectral absorption of tissue located within the non-invasive optical sensor,further comprising the steps of:generating (2270) oxygen saturation data (2110) using the first signal and the second signal, andsubstituting (2290) the oxygen saturation data (2110) for oxygen saturation data (2120) obtained based on a monochromatic light source (1312, 1313) if the ratio of the first signal and the second signal is not within an acceptable system range.
- The method of claim 1 further comprising providing at least one light emitter emitting red light and at least one light emitter emitting infrared light in the non-invasive optical sensor.
- The method of claim 2 further comprising the steps of:generating a red light signal level from emitted red light received by the first detector and the second detector;generating an infrared signal level received from emitted infrared light received by the first detector and the second detector;correlating a ratio of the red light signal level to the infrared signal level to a corresponding value sampled at an arterial peak in order to generate oxygen saturation data in the tissue.
- The method of any one of claims 1-3 further comprising the step of generating oxygen saturation data using the first signal and the second signal if a motion event occurs with the tissue located within the non-invasive optical sensor.
- The method of any one of claims 1-4 further comprising the step of generating arterial pulse rate data using the first signal and the second signal if a motion event occurs with the tissue located within the non-invasive optical sensor.
- The method of any one of claims 1 -5 further comprising the steps of:measuring an amplitude of non-monochromatic light received by the first detector and the second detector; andgenerating a notification if the ratio of received non-monochromatic light is above or below a threshold.
- The method of any one of claims 1-6 further comprising the steps of:measuring a centroid wavelength of emitted red light;determining if the measured centroid wavelength is outside an acceptable centroid range;generating an alert if the measured centroid wavelength is outside the acceptable centroid range.
- The method of any one of claims 1 -7 further wherein the first detector and second detector have different spectral response curves, and the different spectral response curves are utilized to derive a fourth signal proportional to the centroid wavelength of emitted red light.
- A non-invasive optical sensing system capable of eliminating errors, the system comprising:a non-monochromatic light source (1314) arranged for periodically emitting light;a first detector (1316) arranged for sampling light periodically emitted by the light source and for generating a first signal resulting from the light sampled by the first detector (1316);a second detector (1316) arranged for sampling light periodically emitted by the light source and for generating a second signal resulting from the light sampled by the second detector (1316);wherein the system is arranged for generating a third signal using a ratio of the first signal and the second signal to determine an average spectral absorption and any changes in spectral absorption generated by the occurrence of an arterial pulse and base line spectral absorption of tissue located within the non-invasive optical sensing system,wherein the system is further arranged for generating oxygen saturation data (2110) using the first signal and the second signal, and substituting the oxygen saturation data (2110) for oxygen saturation data (2120) obtained based on a monochromatic light source (1312, 1313) if the ratio of the first signal and the second signal is not within an acceptable system range.
Applications Claiming Priority (1)
| Application Number | Priority Date | Filing Date | Title |
|---|---|---|---|
| PCT/US2014/060004 WO2016057042A1 (en) | 2014-10-10 | 2014-10-10 | System and method for a non-invasive medical sensor |
Publications (3)
| Publication Number | Publication Date |
|---|---|
| EP3203912A1 EP3203912A1 (en) | 2017-08-16 |
| EP3203912A4 EP3203912A4 (en) | 2018-05-23 |
| EP3203912B1 true EP3203912B1 (en) | 2021-03-10 |
Family
ID=55653486
Family Applications (1)
| Application Number | Title | Priority Date | Filing Date |
|---|---|---|---|
| EP14903626.1A Active EP3203912B1 (en) | 2014-10-10 | 2014-10-10 | System and method for a non-invasive medical sensor |
Country Status (4)
| Country | Link |
|---|---|
| US (3) | US10485463B2 (en) |
| EP (1) | EP3203912B1 (en) |
| CN (1) | CN106999112A (en) |
| WO (1) | WO2016057042A1 (en) |
Families Citing this family (3)
| Publication number | Priority date | Publication date | Assignee | Title |
|---|---|---|---|---|
| US10485463B2 (en) | 2014-10-10 | 2019-11-26 | Medtor Llc | System and method for a non-invasive medical sensor |
| US20190261859A1 (en) * | 2018-02-26 | 2019-08-29 | Medtor Llc | System and Method for a Wearable Vital Signs Monitor |
| US20240057882A1 (en) * | 2022-08-18 | 2024-02-22 | Biointellisense, Inc. | Torso sensor device |
Family Cites Families (93)
| Publication number | Priority date | Publication date | Assignee | Title |
|---|---|---|---|---|
| US3638640A (en) | 1967-11-01 | 1972-02-01 | Robert F Shaw | Oximeter and method for in vivo determination of oxygen saturation in blood using three or more different wavelengths |
| US3799672A (en) | 1972-09-15 | 1974-03-26 | Us Health Education & Welfare | Oximeter for monitoring oxygen saturation in blood |
| JPS5725217B2 (en) | 1974-10-14 | 1982-05-28 | ||
| US4770179A (en) | 1982-09-02 | 1988-09-13 | Nellcor Incorporated | Calibrated optical oximeter probe |
| US4621643A (en) | 1982-09-02 | 1986-11-11 | Nellcor Incorporated | Calibrated optical oximeter probe |
| US4700708A (en) | 1982-09-02 | 1987-10-20 | Nellcor Incorporated | Calibrated optical oximeter probe |
| US4653498A (en) | 1982-09-13 | 1987-03-31 | Nellcor Incorporated | Pulse oximeter monitor |
| US4603700A (en) | 1983-12-09 | 1986-08-05 | The Boc Group, Inc. | Probe monitoring system for oximeter |
| US4869253A (en) | 1986-08-18 | 1989-09-26 | Physio-Control Corporation | Method and apparatus for indicating perfusion and oxygen saturation trends in oximetry |
| US4913150A (en) | 1986-08-18 | 1990-04-03 | Physio-Control Corporation | Method and apparatus for the automatic calibration of signals employed in oximetry |
| US5259381A (en) | 1986-08-18 | 1993-11-09 | Physio-Control Corporation | Apparatus for the automatic calibration of signals employed in oximetry |
| JPS6365845A (en) | 1986-09-05 | 1988-03-24 | ミノルタ株式会社 | Oximeter apparatus |
| US4824242A (en) | 1986-09-26 | 1989-04-25 | Sensormedics Corporation | Non-invasive oximeter and method |
| US4714080A (en) | 1986-10-06 | 1987-12-22 | Nippon Colin Co., Ltd. | Method and apparatus for noninvasive monitoring of arterial blood oxygen saturation |
| US4834532A (en) | 1986-12-05 | 1989-05-30 | The State Of Oregon Acting By And Through The State Board Of Higher Education On Behalf Of Oregon Health Sciences University | Devices and procedures for in vitro calibration of pulse oximetry monitors |
| JPS63252239A (en) | 1987-04-09 | 1988-10-19 | Sumitomo Electric Ind Ltd | Reflection type oxymeter |
| US4796636A (en) | 1987-09-10 | 1989-01-10 | Nippon Colin Co., Ltd. | Noninvasive reflectance oximeter |
| DE3884191T2 (en) * | 1988-05-09 | 1994-01-13 | Hewlett Packard Gmbh | Processing method of signals, especially for oximetry measurements in living human tissue. |
| US5564417A (en) | 1991-01-24 | 1996-10-15 | Non-Invasive Technology, Inc. | Pathlength corrected oximeter and the like |
| US5111817A (en) | 1988-12-29 | 1992-05-12 | Medical Physics, Inc. | Noninvasive system and method for enhanced arterial oxygen saturation determination and arterial blood pressure monitoring |
| US5058588A (en) | 1989-09-19 | 1991-10-22 | Hewlett-Packard Company | Oximeter and medical sensor therefor |
| US5216598A (en) | 1989-10-04 | 1993-06-01 | Colin Electronics Co., Ltd. | System for correction of trends associated with pulse wave forms in oximeters |
| US5190038A (en) * | 1989-11-01 | 1993-03-02 | Novametrix Medical Systems, Inc. | Pulse oximeter with improved accuracy and response time |
| DE3938759A1 (en) | 1989-11-23 | 1991-05-29 | Philips Patentverwaltung | NON-INVASIVE OXIMETER ARRANGEMENT |
| JPH0614922B2 (en) | 1991-02-15 | 1994-03-02 | 日本光電工業株式会社 | Calibration test equipment for pulse oximeter |
| JP3363150B2 (en) | 1991-03-07 | 2003-01-08 | マシモ・コーポレイション | Pulse oximeter and processor in pulse oximeter |
| US5632272A (en) | 1991-03-07 | 1997-05-27 | Masimo Corporation | Signal processing apparatus |
| US5490505A (en) | 1991-03-07 | 1996-02-13 | Masimo Corporation | Signal processing apparatus |
| US5218962A (en) | 1991-04-15 | 1993-06-15 | Nellcor Incorporated | Multiple region pulse oximetry probe and oximeter |
| US5934277A (en) | 1991-09-03 | 1999-08-10 | Datex-Ohmeda, Inc. | System for pulse oximetry SpO2 determination |
| US5246002A (en) | 1992-02-11 | 1993-09-21 | Physio-Control Corporation | Noise insensitive pulse transmittance oximeter |
| US5377674A (en) | 1992-05-08 | 1995-01-03 | Kuestner; J. Todd | Method for non-invasive and in-vitro hemoglobin concentration measurement |
| JP3091929B2 (en) | 1992-05-28 | 2000-09-25 | 日本光電工業株式会社 | Pulse oximeter |
| DE4227813A1 (en) | 1992-08-21 | 1994-02-24 | Kim Yoon Ok | Device for the qualitative and / or quantitative determination of a sample to be analyzed |
| US5368224A (en) | 1992-10-23 | 1994-11-29 | Nellcor Incorporated | Method for reducing ambient noise effects in electronic monitoring instruments |
| US5645059A (en) | 1993-12-17 | 1997-07-08 | Nellcor Incorporated | Medical sensor with modulated encoding scheme |
| US5421329A (en) | 1994-04-01 | 1995-06-06 | Nellcor, Inc. | Pulse oximeter sensor optimized for low saturation |
| US5503148A (en) | 1994-11-01 | 1996-04-02 | Ohmeda Inc. | System for pulse oximetry SPO2 determination |
| US5758644A (en) | 1995-06-07 | 1998-06-02 | Masimo Corporation | Manual and automatic probe calibration |
| US6041247A (en) | 1995-11-29 | 2000-03-21 | Instrumentarium Corp | Non-invasive optical measuring sensor and measuring method |
| US6226540B1 (en) | 1995-12-13 | 2001-05-01 | Peter Bernreuter | Measuring process for blood gas analysis sensors |
| US5807247A (en) | 1995-12-20 | 1998-09-15 | Nellcor Puritan Bennett Incorporated | Method and apparatus for facilitating compatibility between pulse oximeters and sensor probes |
| US6253097B1 (en) | 1996-03-06 | 2001-06-26 | Datex-Ohmeda, Inc. | Noninvasive medical monitoring instrument using surface emitting laser devices |
| DE59704665D1 (en) | 1996-04-01 | 2001-10-25 | Linde Medical Sensors Ag Basel | DETECTION OF INTERFERENCE SIGNALS IN PULSOXYMETRIC MEASUREMENT |
| US5692505A (en) | 1996-04-25 | 1997-12-02 | Fouts; James Michael | Data processing systems and methods for pulse oximeters |
| US5842981A (en) | 1996-07-17 | 1998-12-01 | Criticare Systems, Inc. | Direct to digital oximeter |
| US6163715A (en) | 1996-07-17 | 2000-12-19 | Criticare Systems, Inc. | Direct to digital oximeter and method for calculating oxygenation levels |
| US5782756A (en) | 1996-09-19 | 1998-07-21 | Nellcor Puritan Bennett Incorporated | Method and apparatus for in vivo blood constituent analysis |
| US6018673A (en) | 1996-10-10 | 2000-01-25 | Nellcor Puritan Bennett Incorporated | Motion compatible sensor for non-invasive optical blood analysis |
| US5830137A (en) | 1996-11-18 | 1998-11-03 | University Of South Florida | Green light pulse oximeter |
| US6397093B1 (en) | 1996-12-05 | 2002-05-28 | Essential Medical Devices, Inc. | Non-invasive carboxyhemoglobin analyzer |
| US5921921A (en) | 1996-12-18 | 1999-07-13 | Nellcor Puritan-Bennett | Pulse oximeter with sigma-delta converter |
| US5827182A (en) | 1997-03-31 | 1998-10-27 | Ohmeda Inc. | Multiple LED sets in oximetry sensors |
| US6002952A (en) * | 1997-04-14 | 1999-12-14 | Masimo Corporation | Signal processing apparatus and method |
| US6215295B1 (en) | 1997-07-25 | 2001-04-10 | Smith, Iii Richard S. | Photonic field probe and calibration means thereof |
| US6115621A (en) | 1997-07-30 | 2000-09-05 | Nellcor Puritan Bennett Incorporated | Oximetry sensor with offset emitters and detector |
| US5841536A (en) | 1997-08-01 | 1998-11-24 | The United States Of America As Represented By The Director Of The National Security Agency | Polarization interferometer apparatus using the polarization dependent phase lag in a birefringent retarder |
| US5987343A (en) | 1997-11-07 | 1999-11-16 | Datascope Investment Corp. | Method for storing pulse oximetry sensor characteristics |
| US5995858A (en) | 1997-11-07 | 1999-11-30 | Datascope Investment Corp. | Pulse oximeter |
| US6117643A (en) | 1997-11-25 | 2000-09-12 | Ut Battelle, Llc | Bioluminescent bioreporter integrated circuit |
| AU4214199A (en) | 1998-06-03 | 1999-12-20 | Masimo Corporation | Stereo pulse oximeter |
| JP2000083933A (en) | 1998-07-17 | 2000-03-28 | Nippon Koden Corp | Instrument for measuring concentration of light absorptive material in vital tissue |
| EP1117326A1 (en) | 1998-09-29 | 2001-07-25 | Mallinckrodt Inc. | Oximeter sensor with encoded temperature characteristic |
| US6667803B1 (en) | 1999-06-03 | 2003-12-23 | Hutchinson Technology, Inc. | Calibration mode recognition and calibration algorithm for spectrophotometric instrument |
| US6611320B1 (en) | 1999-09-08 | 2003-08-26 | Optoq Ab | Method and apparatus |
| NZ518142A (en) | 1999-10-07 | 2003-11-28 | Alexander K | Optical determination of blood characteristics accounting for heart/limb relative height |
| US6594511B2 (en) | 2000-03-29 | 2003-07-15 | Robert T. Stone | Method and apparatus for determining physiological characteristics |
| AU2001281231A1 (en) | 2000-08-11 | 2002-02-25 | Elekon Industries, Inc. | System and method for a self-calibrating non-invasive sensor |
| US6889153B2 (en) | 2001-08-09 | 2005-05-03 | Thomas Dietiker | System and method for a self-calibrating non-invasive sensor |
| US6628975B1 (en) | 2000-08-31 | 2003-09-30 | Mallinckrodt Inc. | Oximeter sensor with digital memory storing data |
| US6741876B1 (en) | 2000-08-31 | 2004-05-25 | Cme Telemetrix Inc. | Method for determination of analytes using NIR, adjacent visible spectrum and discrete NIR wavelenths |
| US6600940B1 (en) | 2000-08-31 | 2003-07-29 | Mallinckrodt Inc. | Oximeter sensor with digital memory |
| US6501974B2 (en) | 2001-01-22 | 2002-12-31 | Datex-Ohmeda, Inc. | Compensation of human variability in pulse oximetry |
| US6591122B2 (en) | 2001-03-16 | 2003-07-08 | Nellcor Puritan Bennett Incorporated | Device and method for monitoring body fluid and electrolyte disorders |
| AU2002952144A0 (en) | 2002-10-17 | 2002-10-31 | Perfusion Diagnostics Pty Ltd | Method and apparatus for measuring tissue perfusion |
| KR100499139B1 (en) | 2003-01-07 | 2005-07-04 | 삼성전자주식회사 | Method of removing abnormal data and blood constituent analysing system using spectroscopy employing the same |
| US8271063B2 (en) | 2006-06-16 | 2012-09-18 | Medtor Llc | System and method for a non-invasive medical sensor |
| WO2008116835A1 (en) * | 2007-03-23 | 2008-10-02 | Enverdis Gmbh | Method for the continuous non-invasive determination of the concentration of blood constituents |
| US9301697B2 (en) | 2008-09-30 | 2016-04-05 | Nellcor Puritan Bennett Ireland | Systems and methods for recalibrating a non-invasive blood pressure monitor |
| US8725226B2 (en) * | 2008-11-14 | 2014-05-13 | Nonin Medical, Inc. | Optical sensor path selection |
| US9603559B2 (en) | 2009-12-24 | 2017-03-28 | Children's Medical Center Corporation | Capillary refill time diagnostic apparatus and methods |
| CN101884541B (en) * | 2010-07-05 | 2013-01-16 | 北京航空航天大学 | Non-invasive detector and detecting method for biochemical parameters of human blood |
| CN102499694B (en) * | 2011-09-22 | 2013-11-27 | 中国人民解放军第三军医大学野战外科研究所 | Method for eliminating interference to blood oxygen saturation monitoring |
| US9186101B2 (en) * | 2012-09-11 | 2015-11-17 | Covidien Lp | Methods and systems for qualifying a correlation lag value based on a correlation value at a different lag |
| US20140275882A1 (en) * | 2013-03-12 | 2014-09-18 | Covidien Lp | Methods and Systems for Determining a Probe-Off Condition in a Medical Device |
| CN104068865B (en) | 2014-04-24 | 2017-05-31 | 辛勤 | A kind of method and portable set for measuring blood oxygen saturation |
| CN104019908A (en) | 2014-06-16 | 2014-09-03 | 常州工学院 | LED junction temperature or average LED array junction temperature measuring method |
| US10485463B2 (en) | 2014-10-10 | 2019-11-26 | Medtor Llc | System and method for a non-invasive medical sensor |
| MX2018000124A (en) | 2015-07-10 | 2018-03-23 | Koninklijke Philips Nv | Gear for holding a physiological sensor. |
| US10307100B2 (en) | 2015-07-20 | 2019-06-04 | iFeel Healthy Ltd. | Methods and systems of controlling a subject's body feature having a periodic wave function |
| EP3834710A1 (en) | 2015-09-25 | 2021-06-16 | Sanmina Corporation | System and method for health monitoring using a non-invasive, multi-band biosensor |
| US20180014793A1 (en) | 2016-07-14 | 2018-01-18 | Audrey Sharon Bejo-Huerto | System and Method for Health Monitoring |
| US20190261859A1 (en) | 2018-02-26 | 2019-08-29 | Medtor Llc | System and Method for a Wearable Vital Signs Monitor |
-
2014
- 2014-10-10 US US15/517,477 patent/US10485463B2/en active Active
- 2014-10-10 WO PCT/US2014/060004 patent/WO2016057042A1/en active Application Filing
- 2014-10-10 CN CN201480083746.1A patent/CN106999112A/en active Pending
- 2014-10-10 EP EP14903626.1A patent/EP3203912B1/en active Active
-
2019
- 2019-11-25 US US16/694,867 patent/US11350861B2/en active Active
-
2022
- 2022-05-11 US US17/742,106 patent/US20220338766A1/en active Pending
Non-Patent Citations (1)
| Title |
|---|
| None * |
Also Published As
| Publication number | Publication date |
|---|---|
| EP3203912A4 (en) | 2018-05-23 |
| US11350861B2 (en) | 2022-06-07 |
| US20220338766A1 (en) | 2022-10-27 |
| US20170311855A1 (en) | 2017-11-02 |
| WO2016057042A1 (en) | 2016-04-14 |
| US20200163600A1 (en) | 2020-05-28 |
| US10485463B2 (en) | 2019-11-26 |
| EP3203912A1 (en) | 2017-08-16 |
| CN106999112A (en) | 2017-08-01 |
Similar Documents
| Publication | Publication Date | Title |
|---|---|---|
| US8271063B2 (en) | System and method for a non-invasive medical sensor | |
| US20220338766A1 (en) | System and method for a non-invasive medical sensor | |
| US20200305777A1 (en) | Active-pulse blood analysis system | |
| US7124048B2 (en) | System and method for a self-calibrating non-invasive sensor | |
| US7254431B2 (en) | Physiological parameter tracking system | |
| US20120165629A1 (en) | Systems and methods of monitoring a patient through frequency-domain photo migration spectroscopy | |
| US8109882B2 (en) | System and method for venous pulsation detection using near infrared wavelengths | |
| US20080221414A1 (en) | Method for detection of aberrant tissue spectra | |
| US20170127981A1 (en) | Hemoglobin detection and photoplethysmography using spectral modulation | |
| US8923944B2 (en) | Cancellation of light shunting | |
| US20140343382A1 (en) | Methods And Systems For Using A Thermistor In Probe Identification Circuits In Or Associated With Pulse Oximeter Sensors | |
| US20180303358A1 (en) | Vital signs sensor and method of measuring vital signs of a user | |
| US20080221426A1 (en) | Methods and apparatus for detecting misapplied optical sensors | |
| US20090326347A1 (en) | Synchronous Light Detection Utilizing CMOS/CCD Sensors For Oximetry Sensing | |
| EP1307708B1 (en) | System and method for a self-calibrating non-invasive sensor | |
| JP5353790B2 (en) | Biological information measuring apparatus and method | |
| CN109157224B (en) | Pulse blood oxygen monitoring system and method with additional reference light source calibration | |
| JP7091090B2 (en) | Pulse oximeter and blood characteristic measuring device | |
| US20230113268A1 (en) | Light emitting diode temperature estimation | |
| EP3936035A1 (en) | Biological information measuring device | |
| JPH0629850B2 (en) | Oxygen saturation measuring device |
Legal Events
| Date | Code | Title | Description |
|---|---|---|---|
| STAA | Information on the status of an ep patent application or granted ep patent |
Free format text: STATUS: THE INTERNATIONAL PUBLICATION HAS BEEN MADE |
|
| PUAI | Public reference made under article 153(3) epc to a published international application that has entered the european phase |
Free format text: ORIGINAL CODE: 0009012 |
|
| STAA | Information on the status of an ep patent application or granted ep patent |
Free format text: STATUS: REQUEST FOR EXAMINATION WAS MADE |
|
| 17P | Request for examination filed |
Effective date: 20170419 |
|
| AK | Designated contracting states |
Kind code of ref document: A1 Designated state(s): AL AT BE BG CH CY CZ DE DK EE ES FI FR GB GR HR HU IE IS IT LI LT LU LV MC MK MT NL NO PL PT RO RS SE SI SK SM TR |
|
| AX | Request for extension of the european patent |
Extension state: BA ME |
|
| DAX | Request for extension of the european patent (deleted) | ||
| A4 | Supplementary search report drawn up and despatched |
Effective date: 20180424 |
|
| RIC1 | Information provided on ipc code assigned before grant |
Ipc: G01N 21/31 20060101ALI20180419BHEP Ipc: A61B 5/1455 20060101AFI20180419BHEP Ipc: G01N 21/27 20060101ALI20180419BHEP |
|
| GRAP | Despatch of communication of intention to grant a patent |
Free format text: ORIGINAL CODE: EPIDOSNIGR1 |
|
| STAA | Information on the status of an ep patent application or granted ep patent |
Free format text: STATUS: GRANT OF PATENT IS INTENDED |
|
| INTG | Intention to grant announced |
Effective date: 20201027 |
|
| GRAS | Grant fee paid |
Free format text: ORIGINAL CODE: EPIDOSNIGR3 |
|
| STAA | Information on the status of an ep patent application or granted ep patent |
Free format text: STATUS: GRANT OF PATENT IS INTENDED |
|
| GRAA | (expected) grant |
Free format text: ORIGINAL CODE: 0009210 |
|
| STAA | Information on the status of an ep patent application or granted ep patent |
Free format text: STATUS: THE PATENT HAS BEEN GRANTED |
|
| AK | Designated contracting states |
Kind code of ref document: B1 Designated state(s): AL AT BE BG CH CY CZ DE DK EE ES FI FR GB GR HR HU IE IS IT LI LT LU LV MC MK MT NL NO PL PT RO RS SE SI SK SM TR |
|
| REG | Reference to a national code |
Ref country code: GB Ref legal event code: FG4D |
|
| REG | Reference to a national code |
Ref country code: AT Ref legal event code: REF Ref document number: 1368882 Country of ref document: AT Kind code of ref document: T Effective date: 20210315 Ref country code: CH Ref legal event code: EP |
|
| REG | Reference to a national code |
Ref country code: DE Ref legal event code: R096 Ref document number: 602014075670 Country of ref document: DE |
|
| REG | Reference to a national code |
Ref country code: IE Ref legal event code: FG4D |
|
| REG | Reference to a national code |
Ref country code: LT Ref legal event code: MG9D |
|
| PG25 | Lapsed in a contracting state [announced via postgrant information from national office to epo] |
Ref country code: LT Free format text: LAPSE BECAUSE OF FAILURE TO SUBMIT A TRANSLATION OF THE DESCRIPTION OR TO PAY THE FEE WITHIN THE PRESCRIBED TIME-LIMIT Effective date: 20210310 Ref country code: GR Free format text: LAPSE BECAUSE OF FAILURE TO SUBMIT A TRANSLATION OF THE DESCRIPTION OR TO PAY THE FEE WITHIN THE PRESCRIBED TIME-LIMIT Effective date: 20210611 Ref country code: FI Free format text: LAPSE BECAUSE OF FAILURE TO SUBMIT A TRANSLATION OF THE DESCRIPTION OR TO PAY THE FEE WITHIN THE PRESCRIBED TIME-LIMIT Effective date: 20210310 Ref country code: HR Free format text: LAPSE BECAUSE OF FAILURE TO SUBMIT A TRANSLATION OF THE DESCRIPTION OR TO PAY THE FEE WITHIN THE PRESCRIBED TIME-LIMIT Effective date: 20210310 Ref country code: BG Free format text: LAPSE BECAUSE OF FAILURE TO SUBMIT A TRANSLATION OF THE DESCRIPTION OR TO PAY THE FEE WITHIN THE PRESCRIBED TIME-LIMIT Effective date: 20210610 Ref country code: NO Free format text: LAPSE BECAUSE OF FAILURE TO SUBMIT A TRANSLATION OF THE DESCRIPTION OR TO PAY THE FEE WITHIN THE PRESCRIBED TIME-LIMIT Effective date: 20210610 |
|
| REG | Reference to a national code |
Ref country code: AT Ref legal event code: MK05 Ref document number: 1368882 Country of ref document: AT Kind code of ref document: T Effective date: 20210310 |
|
| REG | Reference to a national code |
Ref country code: NL Ref legal event code: MP Effective date: 20210310 |
|
| PG25 | Lapsed in a contracting state [announced via postgrant information from national office to epo] |
Ref country code: SE Free format text: LAPSE BECAUSE OF FAILURE TO SUBMIT A TRANSLATION OF THE DESCRIPTION OR TO PAY THE FEE WITHIN THE PRESCRIBED TIME-LIMIT Effective date: 20210310 Ref country code: RS Free format text: LAPSE BECAUSE OF FAILURE TO SUBMIT A TRANSLATION OF THE DESCRIPTION OR TO PAY THE FEE WITHIN THE PRESCRIBED TIME-LIMIT Effective date: 20210310 Ref country code: LV Free format text: LAPSE BECAUSE OF FAILURE TO SUBMIT A TRANSLATION OF THE DESCRIPTION OR TO PAY THE FEE WITHIN THE PRESCRIBED TIME-LIMIT Effective date: 20210310 |
|
| PG25 | Lapsed in a contracting state [announced via postgrant information from national office to epo] |
Ref country code: NL Free format text: LAPSE BECAUSE OF FAILURE TO SUBMIT A TRANSLATION OF THE DESCRIPTION OR TO PAY THE FEE WITHIN THE PRESCRIBED TIME-LIMIT Effective date: 20210310 |
|
| PG25 | Lapsed in a contracting state [announced via postgrant information from national office to epo] |
Ref country code: AT Free format text: LAPSE BECAUSE OF FAILURE TO SUBMIT A TRANSLATION OF THE DESCRIPTION OR TO PAY THE FEE WITHIN THE PRESCRIBED TIME-LIMIT Effective date: 20210310 Ref country code: CZ Free format text: LAPSE BECAUSE OF FAILURE TO SUBMIT A TRANSLATION OF THE DESCRIPTION OR TO PAY THE FEE WITHIN THE PRESCRIBED TIME-LIMIT Effective date: 20210310 Ref country code: EE Free format text: LAPSE BECAUSE OF FAILURE TO SUBMIT A TRANSLATION OF THE DESCRIPTION OR TO PAY THE FEE WITHIN THE PRESCRIBED TIME-LIMIT Effective date: 20210310 Ref country code: SM Free format text: LAPSE BECAUSE OF FAILURE TO SUBMIT A TRANSLATION OF THE DESCRIPTION OR TO PAY THE FEE WITHIN THE PRESCRIBED TIME-LIMIT Effective date: 20210310 |
|
| PG25 | Lapsed in a contracting state [announced via postgrant information from national office to epo] |
Ref country code: IS Free format text: LAPSE BECAUSE OF FAILURE TO SUBMIT A TRANSLATION OF THE DESCRIPTION OR TO PAY THE FEE WITHIN THE PRESCRIBED TIME-LIMIT Effective date: 20210710 Ref country code: PL Free format text: LAPSE BECAUSE OF FAILURE TO SUBMIT A TRANSLATION OF THE DESCRIPTION OR TO PAY THE FEE WITHIN THE PRESCRIBED TIME-LIMIT Effective date: 20210310 Ref country code: PT Free format text: LAPSE BECAUSE OF FAILURE TO SUBMIT A TRANSLATION OF THE DESCRIPTION OR TO PAY THE FEE WITHIN THE PRESCRIBED TIME-LIMIT Effective date: 20210712 Ref country code: SK Free format text: LAPSE BECAUSE OF FAILURE TO SUBMIT A TRANSLATION OF THE DESCRIPTION OR TO PAY THE FEE WITHIN THE PRESCRIBED TIME-LIMIT Effective date: 20210310 Ref country code: RO Free format text: LAPSE BECAUSE OF FAILURE TO SUBMIT A TRANSLATION OF THE DESCRIPTION OR TO PAY THE FEE WITHIN THE PRESCRIBED TIME-LIMIT Effective date: 20210310 |
|
| REG | Reference to a national code |
Ref country code: DE Ref legal event code: R097 Ref document number: 602014075670 Country of ref document: DE |
|
| PLBE | No opposition filed within time limit |
Free format text: ORIGINAL CODE: 0009261 |
|
| STAA | Information on the status of an ep patent application or granted ep patent |
Free format text: STATUS: NO OPPOSITION FILED WITHIN TIME LIMIT |
|
| PG25 | Lapsed in a contracting state [announced via postgrant information from national office to epo] |
Ref country code: AL Free format text: LAPSE BECAUSE OF FAILURE TO SUBMIT A TRANSLATION OF THE DESCRIPTION OR TO PAY THE FEE WITHIN THE PRESCRIBED TIME-LIMIT Effective date: 20210310 Ref country code: ES Free format text: LAPSE BECAUSE OF FAILURE TO SUBMIT A TRANSLATION OF THE DESCRIPTION OR TO PAY THE FEE WITHIN THE PRESCRIBED TIME-LIMIT Effective date: 20210310 Ref country code: DK Free format text: LAPSE BECAUSE OF FAILURE TO SUBMIT A TRANSLATION OF THE DESCRIPTION OR TO PAY THE FEE WITHIN THE PRESCRIBED TIME-LIMIT Effective date: 20210310 |
|
| 26N | No opposition filed |
Effective date: 20211213 |
|
| PG25 | Lapsed in a contracting state [announced via postgrant information from national office to epo] |
Ref country code: SI Free format text: LAPSE BECAUSE OF FAILURE TO SUBMIT A TRANSLATION OF THE DESCRIPTION OR TO PAY THE FEE WITHIN THE PRESCRIBED TIME-LIMIT Effective date: 20210310 |
|
| PG25 | Lapsed in a contracting state [announced via postgrant information from national office to epo] |
Ref country code: IT Free format text: LAPSE BECAUSE OF FAILURE TO SUBMIT A TRANSLATION OF THE DESCRIPTION OR TO PAY THE FEE WITHIN THE PRESCRIBED TIME-LIMIT Effective date: 20210310 |
|
| PG25 | Lapsed in a contracting state [announced via postgrant information from national office to epo] |
Ref country code: IS Free format text: LAPSE BECAUSE OF FAILURE TO SUBMIT A TRANSLATION OF THE DESCRIPTION OR TO PAY THE FEE WITHIN THE PRESCRIBED TIME-LIMIT Effective date: 20210710 |
|
| REG | Reference to a national code |
Ref country code: BE Ref legal event code: MM Effective date: 20211031 |
|
| PG25 | Lapsed in a contracting state [announced via postgrant information from national office to epo] |
Ref country code: MC Free format text: LAPSE BECAUSE OF FAILURE TO SUBMIT A TRANSLATION OF THE DESCRIPTION OR TO PAY THE FEE WITHIN THE PRESCRIBED TIME-LIMIT Effective date: 20210310 |
|
| PG25 | Lapsed in a contracting state [announced via postgrant information from national office to epo] |
Ref country code: LU Free format text: LAPSE BECAUSE OF NON-PAYMENT OF DUE FEES Effective date: 20211010 Ref country code: BE Free format text: LAPSE BECAUSE OF NON-PAYMENT OF DUE FEES Effective date: 20211031 |
|
| PG25 | Lapsed in a contracting state [announced via postgrant information from national office to epo] |
Ref country code: IE Free format text: LAPSE BECAUSE OF NON-PAYMENT OF DUE FEES Effective date: 20211010 |
|
| PG25 | Lapsed in a contracting state [announced via postgrant information from national office to epo] |
Ref country code: HU Free format text: LAPSE BECAUSE OF FAILURE TO SUBMIT A TRANSLATION OF THE DESCRIPTION OR TO PAY THE FEE WITHIN THE PRESCRIBED TIME-LIMIT; INVALID AB INITIO Effective date: 20141010 |
|
| P01 | Opt-out of the competence of the unified patent court (upc) registered |
Effective date: 20230512 |
|
| PG25 | Lapsed in a contracting state [announced via postgrant information from national office to epo] |
Ref country code: CY Free format text: LAPSE BECAUSE OF FAILURE TO SUBMIT A TRANSLATION OF THE DESCRIPTION OR TO PAY THE FEE WITHIN THE PRESCRIBED TIME-LIMIT Effective date: 20210310 |
|
| PGFP | Annual fee paid to national office [announced via postgrant information from national office to epo] |
Ref country code: GB Payment date: 20231003 Year of fee payment: 10 |
|
| PGFP | Annual fee paid to national office [announced via postgrant information from national office to epo] |
Ref country code: FR Payment date: 20231004 Year of fee payment: 10 Ref country code: DE Payment date: 20231011 Year of fee payment: 10 Ref country code: CH Payment date: 20231102 Year of fee payment: 10 |