EP3188093A1 - System und verfahren zur vorhersage der reaktionszeit eines unternehmenssystems - Google Patents
System und verfahren zur vorhersage der reaktionszeit eines unternehmenssystems Download PDFInfo
- Publication number
- EP3188093A1 EP3188093A1 EP16189812.7A EP16189812A EP3188093A1 EP 3188093 A1 EP3188093 A1 EP 3188093A1 EP 16189812 A EP16189812 A EP 16189812A EP 3188093 A1 EP3188093 A1 EP 3188093A1
- Authority
- EP
- European Patent Office
- Prior art keywords
- time series
- series data
- variables
- output time
- historical output
- Prior art date
- Legal status (The legal status is an assumption and is not a legal conclusion. Google has not performed a legal analysis and makes no representation as to the accuracy of the status listed.)
- Ceased
Links
Images


Classifications
-
- G—PHYSICS
- G06—COMPUTING; CALCULATING OR COUNTING
- G06N—COMPUTING ARRANGEMENTS BASED ON SPECIFIC COMPUTATIONAL MODELS
- G06N20/00—Machine learning
-
- G—PHYSICS
- G06—COMPUTING; CALCULATING OR COUNTING
- G06N—COMPUTING ARRANGEMENTS BASED ON SPECIFIC COMPUTATIONAL MODELS
- G06N5/00—Computing arrangements using knowledge-based models
- G06N5/02—Knowledge representation; Symbolic representation
- G06N5/022—Knowledge engineering; Knowledge acquisition
-
- G—PHYSICS
- G06—COMPUTING; CALCULATING OR COUNTING
- G06Q—INFORMATION AND COMMUNICATION TECHNOLOGY [ICT] SPECIALLY ADAPTED FOR ADMINISTRATIVE, COMMERCIAL, FINANCIAL, MANAGERIAL OR SUPERVISORY PURPOSES; SYSTEMS OR METHODS SPECIALLY ADAPTED FOR ADMINISTRATIVE, COMMERCIAL, FINANCIAL, MANAGERIAL OR SUPERVISORY PURPOSES, NOT OTHERWISE PROVIDED FOR
- G06Q10/00—Administration; Management
- G06Q10/04—Forecasting or optimisation specially adapted for administrative or management purposes, e.g. linear programming or "cutting stock problem"
-
- G—PHYSICS
- G05—CONTROLLING; REGULATING
- G05B—CONTROL OR REGULATING SYSTEMS IN GENERAL; FUNCTIONAL ELEMENTS OF SUCH SYSTEMS; MONITORING OR TESTING ARRANGEMENTS FOR SUCH SYSTEMS OR ELEMENTS
- G05B2219/00—Program-control systems
- G05B2219/30—Nc systems
- G05B2219/37—Measurements
- G05B2219/37514—Detect normality, novelty in time series for online monitoring
-
- G—PHYSICS
- G05—CONTROLLING; REGULATING
- G05B—CONTROL OR REGULATING SYSTEMS IN GENERAL; FUNCTIONAL ELEMENTS OF SUCH SYSTEMS; MONITORING OR TESTING ARRANGEMENTS FOR SUCH SYSTEMS OR ELEMENTS
- G05B23/00—Testing or monitoring of control systems or parts thereof
- G05B23/02—Electric testing or monitoring
- G05B23/0205—Electric testing or monitoring by means of a monitoring system capable of detecting and responding to faults
- G05B23/0218—Electric testing or monitoring by means of a monitoring system capable of detecting and responding to faults characterised by the fault detection method dealing with either existing or incipient faults
- G05B23/0221—Preprocessing measurements, e.g. data collection rate adjustment; Standardization of measurements; Time series or signal analysis, e.g. frequency analysis or wavelets; Trustworthiness of measurements; Indexes therefor; Measurements using easily measured parameters to estimate parameters difficult to measure; Virtual sensor creation; De-noising; Sensor fusion; Unconventional preprocessing inherently present in specific fault detection methods like PCA-based methods
-
- G—PHYSICS
- G05—CONTROLLING; REGULATING
- G05B—CONTROL OR REGULATING SYSTEMS IN GENERAL; FUNCTIONAL ELEMENTS OF SUCH SYSTEMS; MONITORING OR TESTING ARRANGEMENTS FOR SUCH SYSTEMS OR ELEMENTS
- G05B23/00—Testing or monitoring of control systems or parts thereof
- G05B23/02—Electric testing or monitoring
- G05B23/0205—Electric testing or monitoring by means of a monitoring system capable of detecting and responding to faults
- G05B23/0218—Electric testing or monitoring by means of a monitoring system capable of detecting and responding to faults characterised by the fault detection method dealing with either existing or incipient faults
- G05B23/0224—Process history based detection method, e.g. whereby history implies the availability of large amounts of data
- G05B23/024—Quantitative history assessment, e.g. mathematical relationships between available data; Functions therefor; Principal component analysis [PCA]; Partial least square [PLS]; Statistical classifiers, e.g. Bayesian networks, linear regression or correlation analysis; Neural networks
-
- G—PHYSICS
- G06—COMPUTING; CALCULATING OR COUNTING
- G06F—ELECTRIC DIGITAL DATA PROCESSING
- G06F18/00—Pattern recognition
- G06F18/20—Analysing
- G06F18/21—Design or setup of recognition systems or techniques; Extraction of features in feature space; Blind source separation
- G06F18/213—Feature extraction, e.g. by transforming the feature space; Summarisation; Mappings, e.g. subspace methods
- G06F18/2135—Feature extraction, e.g. by transforming the feature space; Summarisation; Mappings, e.g. subspace methods based on approximation criteria, e.g. principal component analysis
Definitions
- the present subject matter described herein in general, relates to predictive analytics, and more particularly to predicting enterprise system response time using causal forecasting models.
- An enterprise system is a large-scale system of integrated applications that helps organization to manage business functions, and automate many back office functions.
- the enterprise system integrates all facets of an operation, including products planning, development, manufacturing, sales and marketing, and thus acts as a backbone for the enterprise.
- Unplanned downtimes of the enterprise system due to unforeseen failures in hardware or software are extremely costly to the organization.
- the source of unplanned downtime can be in any of layers that make up the complete software and hardware environment, and it is hard to trace the source due to large size of the enterprise system and large scale of usage of the enterprise system. For the same reason, it is very hard to build physics based dynamical system models that can analyze enterprise system performance.
- Massive or large data sets are generated in today's information-centric world by ubiquitous communication, imaging systems, mobile devices, surveillance cameras and drones, medical and e-commerce platforms, social networking sites. These large data sets need to be processed appropriately to provide timely insights, improved decision quality, risk mitigation of unplanned events, and appropriate planning of enterprise operations. These large data sets are processed by large size enterprise systems.
- An average dialog response time (referred to as 'response time' of the enterprise system hereafter) is an important indicator of a health of the enterprise system, and is affected by many factors associated with an operating system, or databases or application servers. Predicting well in advance, a potential failure of the large enterprise system is extremely important, so that timely interventions can be actuated to prevent performance degradation.
- the system response time is used as a measure for system performance, and the factors affecting the system response time are identified and concurrently measured.
- a method for predicting response time of an enterprise system comprising pre-processing, by a processor, a plurality of causal variables of an historical output time series data.
- the plurality of causal variables affect the response time of the enterprise system.
- the plurality of causal variables are pre-processed to select a subset of the plurality of causal variables by applying one or more regression techniques to obtain significant causal variables.
- the historical output time series data shows the response time of the enterprise system.
- the method further comprises deriving, by the processor, a plurality of dummy variables from the historical output time series data, by using a threshold value based method.
- the plurality of dummy variables are specific to at least one of a peak detection and a trough detection in the output time series data.
- the method further comprises training, by the processor, at least one predictive model using 1) the historical output time series data, 2) the plurality of significant causal variables, and 3) the plurality of dummy variables to generate at least one trained predictive model.
- the at least one predictive model is designed using at least one machine learning technique.
- the at least one machine learning technique may be selected based on a type of forecast methodology used for forecasting input time series data.
- the method further comprises predicting, by the processor, the response time of the enterprise system by using the at least one trained predictive model and input time series data or a lag between the input time series data and the historical output time series data.
- a system for predicting a response time of an enterprise system comprises a processor and a memory coupled to the processor, wherein the processor executes a plurality of modules stored in the memory.
- the plurality of modules comprises a pre-processing module, a variable generating module and a prediction module.
- the pre-processing module pre-processes a plurality of causal variables of historical output time series data to select a subset of the plurality of causal variables affecting the response time of the enterprise system by applying one or more regression techniques to obtain significant causal variables.
- the historic output time series data shows the response time of the enterprise system.
- the variable generating module derives a plurality of dummy variables from the historical output time series data by using a threshold based method.
- the plurality of dummy variables are specific to at least one of a peak detection and/or a trough detection in the output time series data.
- the prediction module trains at least one predictive model using 1) the historical output time series data, 2) the plurality of significant causal variables, and 3) the plurality of dummy variables to generate at least one trained predictive model.
- the at least one predictive model is designed using at least one machine learning technique.
- the at least one machine learning technique is selected based on a type of forecast methodology used for forecasting input time series data.
- the prediction module further predicts the response time of the enterprise system by using the at least one trained predictive model and input time series data or a lag between the input time series data and the historical output time series data.
- a non-transitory computer readable medium embodying a program executable in a computing device for predicting response time of an enterprise system comprises a program code for pre-processing, a plurality of causal variables of historical output time series data, affecting the response time of the enterprise system, to select a subset of the plurality of causal variables by applying one or more regression techniques to obtain significant causal variables.
- the historical output time series data shows the response time of the enterprise system.
- the program further comprises a program code for the historical output time series data to add one or more missing values in the historical output time series data.
- the program further comprises a program code for deriving, a plurality of dummy variables from the historical output time series data, by using a threshold value based method.
- the plurality of dummy variables are specific to at least one of a peak detection and/or a trough detection in the historical output time series data.
- the program further comprises a program code for training at least one predictive model using 1) the historical output time series data, 2) the plurality of significant causal variables, and 3) the plurality of dummy variables to generate at least one trained predictive model, wherein the at least one predictive model is designed using at least one machine learning technique, and wherein the at least one machine learning technique is selected based on a type of forecast methodology used for forecasting input time series data.
- the program further comprises a program code for predicting, the response time of the enterprise system by using the at least one trained predictive model and an input time series data or a lag between the input time series data and the historical output time series data.
- Systems and methods for predicting a response time of an enterprise system is disclosed. More particularly, the present disclosure discusses a system and method for implementing a variety of techniques to predict the response time of the enterprise system.
- the method receives historical output time series data showing response time of the enterprise system and a plurality of causal variables (may be >50) of the historical output time series data that are affecting the response time of the enterprise system, as an input. Further, the plurality of causal variables are pre-processed to select a subset of the plurality of causal variables by applying one or more regression techniques to obtain significant causal variables.
- the historical output time series data is also pre-processed to derive a plurality of dummy variables from the historical output time series data by using a threshold value based method.
- the plurality of dummy variables may be specific to at least one of a peak detection and/or a trough detection in the output time series data. Further, at least one of predictive models is trained using the historic time series data, the plurality of significant causal variables, and the plurality of dummy variables.
- a response time of the enterprise system is predicted by using at least one of trained predictive models designed using at least one machine learning technique.
- the at least one machine learning techniques may be selected based on a type of forecast methodology used for forecasting input time series data.
- Data-driven and machine learning techniques are adapted to glean functional relationship between variables of the historical output time series data and the input time series data to devise a functional map in a parameterized form that can model non-stationary relationships that are time dependent.
- the time dependent parametric from is learnt from the historical output time series data and the input time series data.
- Advanced prediction of the response time of the enterprise system obtained from the functional map can be used to design appropriate predictive maintenance schedules to take preventive actions against outages of the enterprise system.
- the present disclosure describes a comprehensive methodology that includes techniques to treat missing values in the historical output time series data and the input time series data, identification of new features that is dummy variables in the historical output time series data and the input time series data for improved prediction accuracy, and design of predictive models that explain functional relationship between the historical output time series data and multiple individual input time series of influential factors.
- the predictive models forecasts uncontrolled input factors for at least for next 24 hours' time period.
- the predictive models are specially designed to focus on accuracy at critical thresholds beyond which the enterprise system performance is likely to degrade.
- the response time values of the enterprise system beyond the critical threshold are termed as 'peaks' (or high values). Further, accurate prediction of the peaks is important for administering alerts to take precautionary measures.
- the machine learning techniques such as (i) Weighted Least Squares Linear Regression (LR) (ii) Support Vector Regression (SVR) and (iii) Artificial Neural Networks (ANN) may be used to build predictive models for predicting the response time by including the dummy variable in addition to the plurality of causal variables.
- the predictive models are appropriately designed to predict the 'troughs' (or low values of response times) also with good accuracy to keep an overall prediction error low.
- the present system and method is also capable of predicting an output of the enterprise system for 24 hours in advance by forecasting the inputs using different methods like Modified Naive, Mean & Mode, and SVR.
- the present disclosure presents a basket of technical solutions from which the appropriate predictive model may be chosen using a recommendation methodology depending upon a service on demand.
- a network implementation 100 of a system 102 for predicting the response time of the enterprise system is illustrated, in accordance with an embodiment of the present subject matter.
- the system 102 may also be implemented as a variety of computing systems, such as a laptop computer, a desktop computer, a notebook, a workstation, a mainframe computer, a server, a network server, a tablet, a mobile phone, and the like.
- the system 102 may be implemented in a cloud-based environment.
- the system 102 may be accessed by multiple users through one or more user devices 104-1, 104-2...104-N, collectively referred to as user 104 hereinafter, or applications residing on the user devices 104.
- user devices 104 may include, but are not limited to, a portable computer, a personal digital assistant, a handheld device, and a workstation.
- the user devices 104 are communicatively coupled to the system 102 through a network 106.
- the network 106 may be a wireless network, a wired network or a combination thereof.
- the network 106 can be implemented as one of the different types of networks, such as intranet, local area network (LAN), wide area network (WAN), the internet, and the like.
- the network 106 may either be a dedicated network or a shared network.
- the shared network represents an association of the different types of networks that use a variety of protocols, for example, Hypertext Transfer Protocol (HTTP), Transmission Control Protocol/Internet Protocol (TCP/IP), Wireless Application Protocol (WAP), and the like, to communicate with one another.
- the network 106 may include a variety of network devices, including routers, bridges, servers, computing devices, storage devices, and the like.
- the system 102 may include at least one processor 202, an input/output (I/O) interface 204, and a memory 206.
- the at least one processor 202 may be implemented as one or more microprocessors, microcomputers, microcontrollers, digital signal processors, central processing units, state machines, logic circuitries, and/or any devices that manipulate signals based on operational instructions.
- the at least one processor 202 is configured to fetch and execute computer-readable instructions or modules stored in the memory 206.
- the I/O interface 204 may include a variety of software and hardware interfaces, for example, a web interface, a graphical user interface, and the like.
- the I/O interface 204 may allow the system 102 to interact with a user directly or through the client devices 104. Further, the I/O interface 204 may enable the system 102 to communicate with other computing devices, such as web servers and external data servers (not shown).
- the I/O interface 204 can facilitate multiple communications within a wide variety of networks and protocol types, including wired networks, for example, LAN, cable, etc., and wireless networks, such as WLAN, cellular, or satellite.
- the I/O interface 204 may include one or more ports for connecting a number of devices to one another or to another server.
- the memory 206 may include any computer-readable medium or computer program product known in the art including, for example, volatile memory, such as static random access memory (SRAM) and dynamic random access memory (DRAM), and/or nonvolatile memory, such as read only memory (ROM), erasable programmable ROM, flash memories, hard disks, optical disks, a compact disks (CDs), digital versatile disc or digital video disc (DVDs) and magnetic tapes.
- volatile memory such as static random access memory (SRAM) and dynamic random access memory (DRAM)
- nonvolatile memory such as read only memory (ROM), erasable programmable ROM, flash memories, hard disks, optical disks, a compact disks (CDs), digital versatile disc or digital video disc (DVDs) and magnetic tapes.
- ROM read only memory
- ROM erasable programmable ROM
- flash memories such as compact disks (CDs), digital versatile disc or digital video disc (DVDs) and magnetic tapes.
- CDs compact disks
- the modules 208 include routines, programs, programmed instructions, objects, components, data structures, etc., which perform particular tasks or implement particular abstract data types.
- the modules 208 may include a pre-processing module 210, a variable generating module 212, a prediction module 214, and other modules 220.
- the other modules 220 may include programs or coded instructions that supplement applications and functions of the system 102.
- the data 222 serves as a repository for storing data processed, received, and generated by one or more of the modules 208.
- the data 222 may also include rules and exception database 224, and other data 226.
- the present disclosure relates to prediction of the response time of the enterprise system by using non stationary function approximation. More particularly, the response time of the enterprise system is predicted by learning a relationship between the response time and factors (causal variables) affecting the response time. Data driven models are developed to learn the relationship between the response time and the factors (causal variables) affecting the response time.
- a large scale production order system of an enterprise is taken as an exemplary enterprise system.
- Multiple types of jobs are generated by users with processing requests through the large scale production order system.
- Some salient operational features of the enterprise system are highlighted. Responsiveness of the enterprise system at any time is dependent on types of jobs and operational workload at any time. The responsiveness of the enterprise system can degrade depending on various factors, eventually heading to failure of the enterprise system if unattended. Three important system failure modes may be identified such as 1) Users are able to login but business process is at halt, 2) Users are able to login but system response is slow, and 3) Users are unable to login.
- KPI key performance indicator
- a dialog response time which is an elapsed time between initiation of dialog dispatch to completion of the dialog.
- the dialog response time is dependent on various factors associated with the Operating System, Database, and Application Servers.
- Sample factors (input factors/causal variables) responsible for deciding the dialog response time are listed in Table 1 below. In one example, approximately 50 input factors (causal variables) are identified and values of the input factors and the dialog response for different requests are measured at hourly intervals. Time series of average values or of appropriate statistics such as maximum delay faced by a job of the input factors (causal variables) are collected for analysis.
- Table 1 List of Input Factors (Causal Variables) Sr. No Input Factors (Causal Variables) Description 1 X5 No. of Application Servers 2 X10 No. of Dialog Steps 3 X21 No. of ABAP Dumps 4 X25 No. of Instant Dialog Steps 5 X27 Transactional Remote Function Call Failures 6 X30 Extended Memory Utilization 7 X31 Private Memory 8 X34 Logged ON User Count 9 X37 Roll Area 10 X38 Page Area 11 X41 Memory Usage 12 X42 Swap Usage 13 X44 % File 14 X5 No. of Application Server 15 X10 No. of Dialog Steps
- the enterprise system is considered to work under normal operational conditions if an average response time is below 1000 milliseconds (or Is), and to enter a warning zone if the average falls between 1500 to 2200 milliseconds.
- the enterprise system with the response time crossing a warning zone is likely to head towards failure or an outage. Since downtimes of the enterprise system could be prohibitively costly for an organization, advanced prediction of potential failures can help in timely actuation of failure preventive interventions.
- the present disclosure discloses a causal-factor based response prediction model for identifying right interventions. Various time dependent function approximations on data are devised and input-output relationships are modelled.
- a system 102 is disclosed for predicting the response time of the enterprise system.
- the system executes a method comprising a set of tasks including data preprocessing, dimensionality reduction, new features creation, designing predictive models, forecasting of inputs and predicting the output by developing a prediction model.
- Figure 3 illustrates a workflow of the system 102 for predicting the response time of the enterprise system.
- the pre-processing module 210 may receive historical output time series data.
- enterprise server data comprising the historical output time series data may be received by the pre-processing module 210.
- the historic output time series data may show the response time of the enterprise system.
- the historical output time series data may be a multivariate time series data of the enterprise system.
- the historical output time series data may be indexed by 't' with independent variables (input) labeled as X i ( t ) and the dependent variable (output) labeled as Y ( t ) .
- the historical output time series data may be measured at predefined sampling intervals. In another example, the historical output time series data may be computed using an aggregation scheme for long intervals. Further the pre-processing module 210 may receive a plurality of causal variables of the historical output time series data. The plurality of causal variables of historical output time series data may affect the response time of the enterprise system. The plurality of causal variables may be measured simultaneously with respect to a time measurement frame of the historical output time series. In one example, the pre-processing module 210 may receive the historical output time series data and the plurality of causal variables from an enterprise server data.
- the pre-processing module 210 may pre-process the plurality of causal variables to select a subset of the plurality of causal variables.
- the subset of the plurality of causal variables may be selected by applying one or more regression techniques on the plurality of causal variables to obtain significant causal variables. Applying the one or more regression techniques may comprise selecting the subset of the plurality of causal variables by evaluating a temporal relationship in the form of cross-correlation function after removing auto-correlation component repeated among the plurality of causal variables.
- selecting the significant causal variables from the plurality of causal variables is also termed as 'dimensionality reduction'.
- Dimensionality Reduction is described here.
- a stepwise linear regression technique is employed by ignoring the temporal relationship among the plurality of causal variables given as input. It is observed that majority of the causal variables have exactly similar temporal pattern as that of the response variable, supporting the use of such regression (under the first-cut assumption of linear relationship). Referring to Fig.
- a stepwise regression starts off by choosing a regression equation containing a single significant causal variable and then attempts to build up with subsequent additions of significant causal variables one at a time as long as the additions of the significant causal variables are worthwhile.
- partial F-test is used to determine an order of addition of the significant causal variables. After iterative executions, a number of significant causal variables has been reduced (obtained) from 50 to 13.
- the historical output time series data given as an input to the preprocessing module 210 may have many incomplete values with a sizable portion of the values missing due to possible disparate origins.
- the pre-processing module 210 may pre-process the historical output time series data to add one or more missing values in the historical output time series data.
- the one or more missing values may be added in the historical output time series data using at least one of a linear interpolation method, a mean based method or a linear regression method on the input time series data.
- the one or more missing values may be added to the historical output time series data at one or more historical time instants depending on an enterprise system state at that instant, or at one or more previous instants, or at subsequent instants of the historical output time series data.
- the one or more missing values may be added to the historical output time series data, at a historical time instant based on time of the historical time instant, and based on the enterprise system state at one or more previous or subsequent instances of the historical output time series data.
- the one or more missing values may be added to the historical output time series data to achieve smoothness in the historical output time series data.
- the enterprise system state may be represented by values of the input and historical output time series data.
- Causal variables (as described in above paragraph 0030 and Table 1) are extracted using pre-processing module 210 periodically to build a time series of causal variables. Missing values in each originally extracted input variable (plurality of causal variables) and response variables under study are imputed based on one or more methods.
- the one or more methods may comprise (i) Linear interpolation and (ii) Mean-based method.
- value of a missing value at t is a linear interpolation of the latest value available at a time earlier than t and the earliest value available at a time later than t.
- Mean-based method the missing value at time t is an average of values corresponding to same-day, same-time of all previous weeks.
- Y miss t average Y t ⁇ 7 ⁇ 1 ⁇ 24 , Y t ⁇ 7 ⁇ 2 ⁇ 24 . , Y t ⁇ 7 ⁇ N ⁇ 24
- N is a natural number satisfying t -(7x N X 24 )>0
- the variable generating module 214 may derive a plurality of dummy variables (new features) from the historical output time series data.
- the variable generating module 214 may derive the plurality of dummy variables from the historical output time series data by using a threshold value based method.
- the plurality of dummy variables may be derived from the historical output time series data to assist a prediction model in (i) predicting 'peaks' in the response time with high accuracy; (ii) predicting 'troughs' with good accuracy and (iii) capturing the temporal/seasonal patterns in an output time series data.
- a threshold based method may be used to derive the plurality of dummy variables and the plurality of dummy variables may be further used to train the predictive models.
- the threshold values may be computed automatically by studying the historical output time series data.
- the dummy variables may also be termed as 'new input features'.
- the plurality of dummy variables may be specific to a peak detection or a trough detection in the historical output time series data.
- the plurality of dummy variables may be specific to both the peak detection and the trough detection in the historical output time series data.
- the threshold values may be either preset values, based on historical knowledge on peak or trough values that occurred in the past, or design specifications of System described in [102] or values set based on peaks and troughs observed until current time in the ongoing response variable time series.
- the plurality of dummy variables may be selected based on capturing temporal and seasonal patterns in the historical output time series data. The plurality of dummy variables assist in capturing the temporal and seasonal patterns in the historical output time series data while predicting the response time of the enterprise system.
- the threshold based method may comprise automatic computation of one or more thresholds.
- a first threshold and a second threshold from the one or more thresholds correspond to a first set of values of Y(t)
- a third threshold and a fourth threshold from the one or more thresholds correspond to a second set of values of Y(t).
- the first threshold, the second threshold, the third threshold and the fourth threshold are calculated after removing outliers from Y (t). Computation of the outliers is based on multiple of standard deviation on either side of the mean value of Y(t) until t. Forecasting of the time of occurrence of the thresholds is based on mode of the dummy variable values at the corresponding time instants in the historical output time series data.
- two thresholds H1 and H2 to cater for high values and two thresholds L1 and L2 for low values of Y (t).
- the four thresholds values are calculated after removing outliers from Y (t).
- the outlier computation is based on one sample standard deviation on either side.
- a new sample mean and sample standard deviation are computed from Y (t) after the removal of the outliers.
- the threshold values are set at one and two sample standard deviations on either side of the new sample mean (obtained after outlier removal) as shown in below mentioned equations 2 to 5.
- H 1 sample mean + 2 * sample Std dev .
- H 2 sample mean + sample Std dev .
- L 1 sample mean ⁇ 2 * sample Std dev .
- L 2 sample mean ⁇ sample Std dev .
- the thresholds are adaptive in nature and vary with time, and hence with sample size used for training. Occurrence hours of the four threshold's values in training data define dummy variables (new feature vectors) which are later assigned weights appropriately from improved peak or trough prediction accuracy. As the sample size increases, the four threshold values vary, and hence, the associated variables described below also evolve with time building a non-stationary approximation.
- X d2 is derived by extracting the time instants t from the historical output time series data at which system response time H2 ⁇ Y (t) ⁇ H1.
- X d1 and X d2 (two vectors) define the 'peaks' in the response time.
- X d3 is derived by extracting the time instants t from the historical output time series data at which the response time Y (t) ⁇ L1.
- X d4 is derived by extracting the time instants t from the historical output time series data at which the response time L1 ⁇ Y (t) ⁇ L2.
- the dummy variables X d3 and X d4 (two vectors) define the 'troughs' in the response time.
- dummy variables in addition to the above 23 dummy variables based on time in hours (2 to 24) and 6 based on day of the week (Saturday to Thursday) may also be included.
- the addition dummy variables are supported by the strong correlation in temporal patterns.
- temporal features like previous-day same-time output (response time of enterprise system) and previous week same-day same-time output, maximum of last three weeks same-day same-time output are used to capture the temporal and seasonal variations in the historical output time series data.
- Three dummy variables X d6 , X d7 , and X d8 are derived from the temporal features like previous-day same-time output (response time) and previous week same-day same-time output, maximum of last three weeks same-day same-time output of this type and are formally represented as described below.
- X d6 is derived based on previous day same-time Y and is represented as shown in equation 11.
- X d 6 t Y t ⁇ 24
- X d7 is derived based on previous week same-day same time Y and represented as shown in equation 12.
- X d 7 t Y t ⁇ 168 )
- X d8 is derived based on the maximum of the last three weeks same-day same-time, the response time Y and represented as shown in equation 13.
- X d 8 t max Y t ⁇ 168 ; Y t ⁇ 336 ; Y t ⁇ 504
- the additionally derived dummy variables (new features) as described above assist in increasing the prediction accuracy of 'peaks' in the response time of the enterprise system, which is critical to system performance.
- the prediction module 214 may generate input time series data.
- the prediction module 214 may generate the input time series data by forecasting the input time series data.
- One or more approaches may be followed to forecast the input time series data.
- the first approach from the one or more approaches uses a direct relationship between input X(t) and output Y (t).
- the input X(t) includes the original inputs X i (t) and the derived inputs X di (t) as shown in equation 14.
- Ypredicted t f X t
- SVR model predicts the individual input time series (vector) by using a combination of one day (24 hours), two days (48 hours) and one week (168 hours) lagged version of the same input time series (vector) as inputs as shown in equations 14 and 15 respectively.
- Forecast for the value of a numerical input variable at any instant t is either set equal to an average of values of that variable at (t-24), (t-48) and the like, or forecast using appropriate time series model as in Equation 15.
- Forecast for the value of a categorical input variable at any instant t is set equal to the mode or most frequent value of that variable at (t-24), (t-48) and the like, as shown in Equation 16.
- mode of the input parameter value at the corresponding time instants is used.
- X predicted categorical i t 1 p mode X categorical i t 1 wherein t1 is the time instant in hours which takes values from 1 to 24.
- the second approach for predicting the response time of the enterprise system may use a modified naive method for predicting the output Y (t) using a one day (24 hours) lagged version of the inputs and output.
- the second approach does not require the input time series data to be forecasted.
- a lag in the time series data output is the same as the prediction horizon. Since here focus is on the prediction horizon of at least 24 hours, a lag factor is taken as 24 hours as shown in Equation 17.
- the prediction module 214 may train at least one predictive model to generate at least one trained predictive model.
- the prediction module 214 may train the at least one predictive model by using 1) the historical output time series data, 2) the plurality of significant causal variables, and 3) the plurality of dummy variables to generate the at least one trained predictive model.
- the at least one predictive model may be designed using at least one machine learning technique.
- the machine learning technique may be selected based on a type of forecast methodology used for forecasting the input time series data.
- the input time series data is forecasted based on a type of the causal variables of the input time series data, wherein the type of the causal variables is either numerical or categorical.
- the machine learning technique may be selected from a Weighted Least Squares Linear Regression (WLR) technique, a Support Vector Regression (SVR) technique and an Artificial Neural Networks (ANN) technique.
- WLR Weighted Least Squares Linear Regression
- SVR Support Vector Regression
- ANN Artificial Neural Networks
- the machine learning technique may be any machine learning technique known to a person skilled in the art.
- the plurality of dummy variables, the significant causal variables, the threshold values, and the at least one machine learning technique may be used to train the predictive models to forecast an output time series data.
- the predictive models may be designed based on a first technique comprising using a direct relationship between input variables X(t) and Output variables Y (t) of the historical output time series data.
- the input variables X(t) may include the input variables Xi(t) that are the significant causal variables of the output time series data and the derived inputs Xdi(t) that are the dummy variables of the output time series data.
- Forecasting the input time series of numerical data is based on seasonal mean of input time series value, which is the average of the input variable value at the corresponding time instants in the history. For history, all the data collected from the system backwards from the current time is considered. Forecasting the input time series of categorical data is based on the mode of the input time series values at the corresponding time instants in the history.
- the predictive models may be designed based on a second technique comprising use of a modified naive method for predicting the output Y (t) using a time period lagged version of the inputs variables (causal variables) along with lagged output variables.
- Three different predictive models may be trained for both the approaches by applying historical data to form a basket of solutions for the prediction of system response time of the enterprise.
- a Weighted Least Squares Linear Regression technique may be used to train the at least one predictive model.
- a linear model given below is optimized for weighted error described below.
- the observations in the historical output time series data that exceeded the thresholds are assigned weights differentially based on the criticality of the threshold for use in weighted least squared method.
- Y ⁇ t + 1 ⁇ 1 Y Actual t + ⁇ 0 + ⁇ 1 X 1 t + ⁇ + ⁇ n X n ⁇ t + ⁇ 1 X d 1 t + ⁇ + ⁇ m X dm ⁇ t
- Equation (18) X i are the significant causal variables (influential factors) obtained from dimensionality reduction and X di are the derived input variables that is dummy variables.
- the coefficients ⁇ 1 , ⁇ i , and ⁇ i as mentioned in Equation 18 are obtained by optimizing the weighted error given below on training data.
- 'n' in equation 18 represents the lag and equals to 1 if the SVR based input forecasts model is used to forecast the input time series data, and equals to 24 if modified naive method is used instead.
- w t are the weights assigned based on the importance of observation at time t.
- Support Vector Regression (SVR) technique is an extension of Support Vector Machines-based classification to real-valued functions.
- ⁇ - insensitive loss function is used to measure deviations, and the goal is to find a function fSV R(X(t)) that has at most ⁇ deviation from the actual Y (t) for all training data, and at the same time as flat as possible.
- the input variables that is plurality of significant causal variables are appended with weekday, and time of the day to dummy variables to model temporal affects and hence, to model non-stationary property indirectly in the function approximation.
- the dummy variable representation allows for unbiased representation of time variables in Radial Basis Function (RBF) kernels.
- the machine learning technique used to design the predictive model is Artificial Neural Network (ANN).
- ANN Artificial Neural Network
- One hidden-layer feed-forward network is considered with 15 hidden neurons having sigmoidal activation function.
- the novelty of using this technique is in arriving at the appropriate inputs for the ANN, where apart from using system inputs that is significant causal variables (Xi), historical inputs Xd6, Xd7 and Xd8 are also used. Additionally, the maximum of the response time out of the previous three weeks (on the same day) and which week day, are also fed as inputs.
- the ANN technique designed predictive model helps in capturing information (data) relevant to peaks. For ANN models in time series, refer equations (6) and (7).
- Y ⁇ f NN Y lag , X 1 , ⁇ , X n , X d 6 , X d 7 , X d 8
- Equation (21) X i are the significant causal variables (influential factors) obtained from dimensionality reduction and Xdi are the derived input variables that is the dummy variables as described above. Note that for Neural Networks (NN) only the derived features X d6 ; X d7 ; X d8 are used in prediction.
- the prediction models are developed on 26 weeks of enterprise system data comprising the causal variables and the output time series data, and tested for a span of 8 weeks (56 days) using a sliding window of 1 week to arrive at a detailed performance evaluation.
- Figure 5 show actual system response time with the predicted ones using the system 102 with Average Mean Absolute Percent Error (AMAPE) values over a span of one week.
- Figure 6 shows performance of the trained predictive models of the system 102 in tracking 'peaks'.
- the 'peaks' here are defined by those values of Y (t) which go beyond the user defined 'critical threshold' (taken as 1500).
- Weighted linear regression (WLR) model outperforms the rest of the predictive models in tracking the 'peaks' as is observed from the plot shown in Figures 5 and 6 .
- a Percentage Error (PE) distribution across models is analyzed to understand the discriminative capability of the prediction models.
- Tables II to IV present results on PE distribution.
- Overall SVR has high concentration of low individual errors compared to other prediction models.
- Weighted Linear Regression offers good prediction accuracy for peaks predicting with 90% of the cases having less than 20% error.
- a recommendation methodology may be suggested to choose an appropriate predictive model or a mix of predictive model depending on a service on demand.
- the discriminative performance of the different prediction models can be ascertained to be robust.
- SVR based prediction model can be recommended and if the service requires good accuracy for peaks, WLR based prediction model is recommended.
- the response time of the enterprise system is predicted by using the at least one trained predictive model and an input time series data or a lag between the input time series data and the historical output time series data.
- the predictions from all three techniques are fused appropriately to create a mix, such as using SVR method on weekdays and WLR on weekends.
- Table 2 shows Enterprise system response time prediction performance of the system 102 on 24 hrs rolling horizon.
- Table 3 shows enterprise system's response time prediction performance of the system 102 at peaks, and Table 4 shows enterprise system response time prediction performance of the system 102 over the weekends.
- Table 2 Response time prediction performance of the system 102 on 24 hrs rolling horizon Algorithm Error ⁇ 5% ⁇ 10% ⁇ 15% ⁇ 20% ⁇ 25% ⁇ 30% WLR 15% 35% 50% 65% 75% 84% SVR 21% 42% 60% 70% 79% 85% ANN 19% 38% 53% 65% 73% 80%
- Table 3 Response time Prediction performance of the system 102 at peak Algorithm Error ⁇ 5% ⁇ 10% ⁇ 15% ⁇ 20% ⁇ 25% ⁇ 30% WLR 8% 57% 77% 91% 94% 94% SVR 25% 53% 62% 68% 81% 81% ANN 7.7% 18% 46% 56% 59% 62%
- Table 4 Response time prediction performance of the system 102 over the weekends
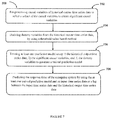
- a method 700 for predicting response time of an enterprise system is shown, in accordance with an embodiment of the present subject matter.
- the method 700 may be described in the general context of computer executable instructions.
- computer executable instructions can include routines, programs, objects, components, data structures, procedures, modules, functions, etc., that perform particular functions or implement particular abstract data types.
- the method 700 may also be practiced in a distributed computing environment where functions are performed by remote processing devices that are linked through a communications network.
- computer executable instructions may be located in both local and remote computer storage media, including memory storage devices.
- the method can be implemented in suitable hardware, software, firmware, or combination thereof. However, in present embodiments the method 700 may be considered as implemented in above mentioned system 102.
- a historical output time series data and a plurality of causal variables of the historical output time series data may be pre-processed.
- the historical output time series data shows the response time of the enterprise system.
- the historical output time series data may be measured at predefined sampling time intervals or may be computed using an aggregation scheme for long intervals.
- the plurality of causal variables may be measured simultaneously with respect to a time measurement frame of the historical output time series data.
- the historical output time series data may be a multivariate time series data of the enterprise system indexed by 't' with independent variables (input) labeled as X i ( t ) and the dependent variable (output) labeled as Y ( t ), where 'i' takes values from 1 to n with 'n' being the total number of independent variables that affect the response time Y ( t ).
- the plurality of causal variables of the historical output time series data may affect a response time of an enterprise system.
- the plurality of causal variables may be preprocessed by applying one or more regression techniques to select a subset of the plurality of causal variables to obtain significant causal variables.
- the significant causal variables affect the response time of an enterprise system considerably. Applying the one or more regression techniques comprises selecting the subset of the plurality of causal variables by evaluating the temporal relationship among the plurality of causal variables.
- the historical output time series data may also be pre-processed, at step 702, to add one or more missing values in the historical output time series data.
- the addition of missing values into the historical output time series data improves prediction accuracy in predicting the response time of the enterprise system by system 102.
- the one or more missing values may be added to the historical output time series data at one or more historical instants depending on an enterprise system state at that instant, or at one or more previous instants, or at subsequent instants in the historical output time series data.
- a plurality of dummy variables may be derived from the historical output time series data, by using a threshold value based method.
- the plurality of dummy variables may be specific to at least one of a peak detection and/or a trough detection in the output time series data.
- the threshold values may be either preset values, based on historical knowledge, or design specifications of the enterprise system, or dynamically adjusted as the output time series data evolves with time.
- the plurality of dummy variables may be selected based on capturing temporal and seasonal patterns in the historical output time series data, and the plurality of dummy variables may further assist in capturing temporal and seasonal patterns in the historical output time series data while predicting the response time of the enterprise system.
- At step 706, at least one predictive model may be trained using 1) the historical output time series data, 2) the plurality of significant causal variables, and 3) the plurality of dummy variables to generate at least one trained predictive model.
- the at least one predictive model is designed using at least one machine learning technique.
- the at least one machine learning technique is selected based on a type of forecast methodology used for forecasting input time series data.
- the response time of the enterprise system may be predicted by using the at least one trained predictive model and input time series data or a lag between the input time series data and the historical output time series data.
Landscapes
- Engineering & Computer Science (AREA)
- Theoretical Computer Science (AREA)
- Business, Economics & Management (AREA)
- Software Systems (AREA)
- Physics & Mathematics (AREA)
- General Physics & Mathematics (AREA)
- General Engineering & Computer Science (AREA)
- Strategic Management (AREA)
- Economics (AREA)
- Human Resources & Organizations (AREA)
- Data Mining & Analysis (AREA)
- Evolutionary Computation (AREA)
- Mathematical Physics (AREA)
- Computing Systems (AREA)
- Artificial Intelligence (AREA)
- Computer Vision & Pattern Recognition (AREA)
- Development Economics (AREA)
- Game Theory and Decision Science (AREA)
- Medical Informatics (AREA)
- Entrepreneurship & Innovation (AREA)
- Marketing (AREA)
- Operations Research (AREA)
- Quality & Reliability (AREA)
- Tourism & Hospitality (AREA)
- General Business, Economics & Management (AREA)
- Computational Linguistics (AREA)
- Management, Administration, Business Operations System, And Electronic Commerce (AREA)
Applications Claiming Priority (1)
| Application Number | Priority Date | Filing Date | Title |
|---|---|---|---|
| IN4928MU2015 | 2015-12-29 |
Publications (1)
| Publication Number | Publication Date |
|---|---|
| EP3188093A1 true EP3188093A1 (de) | 2017-07-05 |
Family
ID=57178205
Family Applications (1)
| Application Number | Title | Priority Date | Filing Date |
|---|---|---|---|
| EP16189812.7A Ceased EP3188093A1 (de) | 2015-12-29 | 2016-09-21 | System und verfahren zur vorhersage der reaktionszeit eines unternehmenssystems |
Country Status (2)
| Country | Link |
|---|---|
| US (1) | US10467533B2 (de) |
| EP (1) | EP3188093A1 (de) |
Cited By (3)
| Publication number | Priority date | Publication date | Assignee | Title |
|---|---|---|---|---|
| CN108984369A (zh) * | 2018-07-13 | 2018-12-11 | 厦门美图移动科技有限公司 | 卡顿预测方法、装置及移动终端 |
| EP3499375A1 (de) * | 2017-10-09 | 2019-06-19 | Qentinel Oy | Vorhersagen der qualität eines informationssystems unter verwendung von systemdynamikmodellierung und maschinenlernen |
| CN114154696A (zh) * | 2021-11-19 | 2022-03-08 | 中国建设银行股份有限公司 | 资金流预测方法、系统、计算机设备及存储介质 |
Families Citing this family (20)
| Publication number | Priority date | Publication date | Assignee | Title |
|---|---|---|---|---|
| US11113337B2 (en) * | 2016-09-08 | 2021-09-07 | Indian Institute Of Technology Bombay | Method for imputing missed data in sensor data sequence with missing data |
| US20210350910A1 (en) * | 2017-02-17 | 2021-11-11 | Shahram Shawn DASTMALCHI | System and method for supporting healthcare cost and quality management |
| KR102025145B1 (ko) * | 2017-09-01 | 2019-09-25 | 두산중공업 주식회사 | 플랜트 데이터 예측 장치 및 방법 |
| CN107943861A (zh) * | 2017-11-09 | 2018-04-20 | 北京众荟信息技术股份有限公司 | 一种基于时间序列的缺失数据补充方法与系统 |
| CN109978172B (zh) * | 2017-12-27 | 2021-08-06 | 中国移动通信集团设计院有限公司 | 一种基于极限学习机的资源池利用率预测方法及装置 |
| CN109298989A (zh) * | 2018-09-14 | 2019-02-01 | 北京市天元网络技术股份有限公司 | 业务指标阈值获取方法及装置 |
| CN109389329A (zh) * | 2018-11-13 | 2019-02-26 | 平安科技(深圳)有限公司 | 测试系统的测试性能预测方法、装置、介质及电子设备 |
| CN110110375A (zh) * | 2019-04-09 | 2019-08-09 | 天津大学 | 预测系统状态变量突变的判别方法 |
| CN111461384B (zh) * | 2019-12-10 | 2024-04-05 | 阿里巴巴集团控股有限公司 | 对象流量预测方法、装置及设备 |
| CN111240282B (zh) * | 2019-12-31 | 2021-12-24 | 联想(北京)有限公司 | 一种工艺优化方法、装置、设备及计算机可读存储介质 |
| CN111275579B (zh) * | 2020-02-21 | 2022-10-18 | 浙江大学 | 基于皮尔森相关系数和移动平均法的供热系统热延迟时间辨识方法 |
| US11586983B2 (en) * | 2020-03-02 | 2023-02-21 | Nxp B.V. | Data processing system and method for acquiring data for training a machine learning model for use in monitoring the data processing system for anomalies |
| CN113627867A (zh) * | 2020-05-08 | 2021-11-09 | 百度在线网络技术(北京)有限公司 | 一种人才需求预测方法、装置、设备和存储介质 |
| US11941497B2 (en) * | 2020-09-30 | 2024-03-26 | Alteryx, Inc. | System and method of operationalizing automated feature engineering |
| CN112418534B (zh) * | 2020-11-26 | 2022-10-14 | 上海东普信息科技有限公司 | 揽件量预测方法及装置、电子设备、计算机可读存储介质 |
| CN112712113B (zh) * | 2020-12-29 | 2024-04-09 | 广州品唯软件有限公司 | 一种基于指标的告警方法、装置及计算机系统 |
| US11509732B2 (en) * | 2021-01-15 | 2022-11-22 | Dell Products L.P. | Smart service orchestrator |
| CN113239314A (zh) * | 2021-04-09 | 2021-08-10 | 国网河北省电力有限公司沧州供电分公司 | 用于碳排放量预测的方法、装置、终端及计算机可读存储介质 |
| CN114841474B (zh) * | 2022-07-01 | 2022-09-09 | 南京匠拓电力科技有限公司 | 适用于智能水电气采控终端的数据处理方法及系统 |
| CN115775088B (zh) * | 2023-02-13 | 2023-05-05 | 成都秦川物联网科技股份有限公司 | 一种智慧燃气巡检计划确定方法与物联网系统 |
Family Cites Families (17)
| Publication number | Priority date | Publication date | Assignee | Title |
|---|---|---|---|---|
| US7318051B2 (en) * | 2001-05-18 | 2008-01-08 | Health Discovery Corporation | Methods for feature selection in a learning machine |
| US7624074B2 (en) * | 2000-08-07 | 2009-11-24 | Health Discovery Corporation | Methods for feature selection in a learning machine |
| US7353215B2 (en) * | 2001-05-07 | 2008-04-01 | Health Discovery Corporation | Kernels and methods for selecting kernels for use in learning machines |
| US7389204B2 (en) * | 2001-03-01 | 2008-06-17 | Fisher-Rosemount Systems, Inc. | Data presentation system for abnormal situation prevention in a process plant |
| US7107187B1 (en) * | 2003-11-12 | 2006-09-12 | Sprint Communications Company L.P. | Method for modeling system performance |
| EP1831795A4 (de) * | 2004-12-17 | 2010-01-20 | Univ Queensland | Merkmalreduktionsverfahren für entscheidungsmaschinen |
| EP1913506A4 (de) * | 2005-07-11 | 2008-08-13 | Brooks Automation Inc | Intelligente zustandsüberwachung und fehlerdiagnosesystem für prädiktive wartung |
| JP4948118B2 (ja) * | 2005-10-25 | 2012-06-06 | ソニー株式会社 | 情報処理装置、情報処理方法、およびプログラム |
| US7693608B2 (en) * | 2006-04-12 | 2010-04-06 | Edsa Micro Corporation | Systems and methods for alarm filtering and management within a real-time data acquisition and monitoring environment |
| US7756799B2 (en) * | 2006-10-27 | 2010-07-13 | Hewlett-Packard Development Company, L.P. | Feature selection based on partial ordered set of classifiers |
| US8510252B1 (en) | 2007-12-07 | 2013-08-13 | Google, Inc. | Classification of inappropriate video content using multi-scale features |
| WO2010030794A1 (en) * | 2008-09-10 | 2010-03-18 | Digital Infuzion, Inc. | Machine learning methods and systems for identifying patterns in data |
| US8190537B1 (en) * | 2008-10-31 | 2012-05-29 | Google Inc. | Feature selection for large scale models |
| US8015276B2 (en) | 2008-11-18 | 2011-09-06 | At&T Intellectual Property I, L.P. | Method to identify performance and capacity bottlenecks of complex systems |
| US20140200951A1 (en) | 2013-01-11 | 2014-07-17 | International Business Machines Corporation | Scalable rule logicalization for asset health prediction |
| US9189750B1 (en) * | 2013-03-15 | 2015-11-17 | The Mathworks, Inc. | Methods and systems for sequential feature selection based on significance testing |
| CN103197983B (zh) | 2013-04-22 | 2015-04-29 | 东南大学 | 基于概率图模型的服务组件可靠性在线时间序列预测方法 |
-
2016
- 2016-09-21 US US15/272,025 patent/US10467533B2/en active Active
- 2016-09-21 EP EP16189812.7A patent/EP3188093A1/de not_active Ceased
Non-Patent Citations (1)
| Title |
|---|
| No relevant documents disclosed * |
Cited By (4)
| Publication number | Priority date | Publication date | Assignee | Title |
|---|---|---|---|---|
| EP3499375A1 (de) * | 2017-10-09 | 2019-06-19 | Qentinel Oy | Vorhersagen der qualität eines informationssystems unter verwendung von systemdynamikmodellierung und maschinenlernen |
| US10762165B2 (en) | 2017-10-09 | 2020-09-01 | Qentinel Oy | Predicting quality of an information system using system dynamics modelling and machine learning |
| CN108984369A (zh) * | 2018-07-13 | 2018-12-11 | 厦门美图移动科技有限公司 | 卡顿预测方法、装置及移动终端 |
| CN114154696A (zh) * | 2021-11-19 | 2022-03-08 | 中国建设银行股份有限公司 | 资金流预测方法、系统、计算机设备及存储介质 |
Also Published As
| Publication number | Publication date |
|---|---|
| US10467533B2 (en) | 2019-11-05 |
| US20170185902A1 (en) | 2017-06-29 |
Similar Documents
| Publication | Publication Date | Title |
|---|---|---|
| US10467533B2 (en) | System and method for predicting response time of an enterprise system | |
| WO2020259421A1 (zh) | 一种业务系统的监控方法及装置 | |
| US11403164B2 (en) | Method and device for determining a performance indicator value for predicting anomalies in a computing infrastructure from values of performance indicators | |
| US20200380335A1 (en) | Anomaly detection in business intelligence time series | |
| Zliobaite et al. | Adaptive preprocessing for streaming data | |
| US11675643B2 (en) | Method and device for determining a technical incident risk value in a computing infrastructure from performance indicator values | |
| Chakraborty et al. | Building an automated and self-aware anomaly detection system | |
| US20200213202A1 (en) | System and method for predicting key performance indicator (kpi) in a telecommunication network | |
| Vitt et al. | The impact of patent activities on stock dynamics in the high-tech sector | |
| Hema et al. | Robust soft sensor systems for industry: Evaluated through real-time case study | |
| Iftikhar et al. | Industry 4.0: Sensor data analysis using machine learning | |
| Naveiro et al. | Large‐scale automated forecasting for network safety and security monitoring | |
| Sudan et al. | Prediction of success and complex event processing in E-learning | |
| Chandrasekaran et al. | Uncertainty-Aware Functional Analysis for Electricity Consumption Prediction Using Multi-Task Optimization Learning Model | |
| Husain et al. | Predictive maintenance of single phase ac motor using iot sensor data and machine learning (simple linear regression and multiple linear regression algorithms) | |
| Palaskar et al. | Automixer for improved multivariate time-series forecasting on business and it observability data | |
| US20220277263A1 (en) | System and method for predictive inventory | |
| US20230409460A1 (en) | System and method for optimizing performance of a process | |
| Santos et al. | Bayesian estimation of decay parameters in Hawkes processes | |
| Asanka et al. | Identifying Unusual Human Movements Using Multi-Agent and Time-Series Outlier Detection Techniques | |
| Duan et al. | Accurate analysis and prediction of enterprise service-level performance | |
| US20230120896A1 (en) | Systems and methods for detecting modeling errors at a composite modeling level in complex computer systems | |
| US20220222167A1 (en) | Automated feature monitoring for data streams | |
| Sseguya | Forecasting anomalies in time series data from online production environments | |
| Li et al. | HiMuV: Hierarchical framework for modeling multi-modality multi-resolution data |
Legal Events
| Date | Code | Title | Description |
|---|---|---|---|
| PUAI | Public reference made under article 153(3) epc to a published international application that has entered the european phase |
Free format text: ORIGINAL CODE: 0009012 |
|
| AK | Designated contracting states |
Kind code of ref document: A1 Designated state(s): AL AT BE BG CH CY CZ DE DK EE ES FI FR GB GR HR HU IE IS IT LI LT LU LV MC MK MT NL NO PL PT RO RS SE SI SK SM TR |
|
| AX | Request for extension of the european patent |
Extension state: BA ME |
|
| 17P | Request for examination filed |
Effective date: 20180105 |
|
| RBV | Designated contracting states (corrected) |
Designated state(s): AL AT BE BG CH CY CZ DE DK EE ES FI FR GB GR HR HU IE IS IT LI LT LU LV MC MK MT NL NO PL PT RO RS SE SI SK SM TR |
|
| 17Q | First examination report despatched |
Effective date: 20180810 |
|
| STAA | Information on the status of an ep patent application or granted ep patent |
Free format text: STATUS: THE APPLICATION HAS BEEN REFUSED |
|
| 18R | Application refused |
Effective date: 20191114 |