EP3187821A1 - A data processor and a data processing method - Google Patents
A data processor and a data processing method Download PDFInfo
- Publication number
- EP3187821A1 EP3187821A1 EP16205942.2A EP16205942A EP3187821A1 EP 3187821 A1 EP3187821 A1 EP 3187821A1 EP 16205942 A EP16205942 A EP 16205942A EP 3187821 A1 EP3187821 A1 EP 3187821A1
- Authority
- EP
- European Patent Office
- Prior art keywords
- optical fiber
- strain
- distribution data
- strain distribution
- measured
- Prior art date
- Legal status (The legal status is an assumption and is not a legal conclusion. Google has not performed a legal analysis and makes no representation as to the accuracy of the status listed.)
- Granted
Links
Images







Classifications
-
- G—PHYSICS
- G01—MEASURING; TESTING
- G01L—MEASURING FORCE, STRESS, TORQUE, WORK, MECHANICAL POWER, MECHANICAL EFFICIENCY, OR FLUID PRESSURE
- G01L1/00—Measuring force or stress, in general
- G01L1/24—Measuring force or stress, in general by measuring variations of optical properties of material when it is stressed, e.g. by photoelastic stress analysis using infrared, visible light, ultraviolet
- G01L1/242—Measuring force or stress, in general by measuring variations of optical properties of material when it is stressed, e.g. by photoelastic stress analysis using infrared, visible light, ultraviolet the material being an optical fibre
-
- G—PHYSICS
- G01—MEASURING; TESTING
- G01B—MEASURING LENGTH, THICKNESS OR SIMILAR LINEAR DIMENSIONS; MEASURING ANGLES; MEASURING AREAS; MEASURING IRREGULARITIES OF SURFACES OR CONTOURS
- G01B11/00—Measuring arrangements characterised by the use of optical techniques
- G01B11/16—Measuring arrangements characterised by the use of optical techniques for measuring the deformation in a solid, e.g. optical strain gauge
- G01B11/161—Measuring arrangements characterised by the use of optical techniques for measuring the deformation in a solid, e.g. optical strain gauge by interferometric means
- G01B11/162—Measuring arrangements characterised by the use of optical techniques for measuring the deformation in a solid, e.g. optical strain gauge by interferometric means by speckle- or shearing interferometry
-
- G—PHYSICS
- G01—MEASURING; TESTING
- G01D—MEASURING NOT SPECIALLY ADAPTED FOR A SPECIFIC VARIABLE; ARRANGEMENTS FOR MEASURING TWO OR MORE VARIABLES NOT COVERED IN A SINGLE OTHER SUBCLASS; TARIFF METERING APPARATUS; MEASURING OR TESTING NOT OTHERWISE PROVIDED FOR
- G01D5/00—Mechanical means for transferring the output of a sensing member; Means for converting the output of a sensing member to another variable where the form or nature of the sensing member does not constrain the means for converting; Transducers not specially adapted for a specific variable
- G01D5/26—Mechanical means for transferring the output of a sensing member; Means for converting the output of a sensing member to another variable where the form or nature of the sensing member does not constrain the means for converting; Transducers not specially adapted for a specific variable characterised by optical transfer means, i.e. using infrared, visible, or ultraviolet light
- G01D5/32—Mechanical means for transferring the output of a sensing member; Means for converting the output of a sensing member to another variable where the form or nature of the sensing member does not constrain the means for converting; Transducers not specially adapted for a specific variable characterised by optical transfer means, i.e. using infrared, visible, or ultraviolet light with attenuation or whole or partial obturation of beams of light
- G01D5/34—Mechanical means for transferring the output of a sensing member; Means for converting the output of a sensing member to another variable where the form or nature of the sensing member does not constrain the means for converting; Transducers not specially adapted for a specific variable characterised by optical transfer means, i.e. using infrared, visible, or ultraviolet light with attenuation or whole or partial obturation of beams of light the beams of light being detected by photocells
- G01D5/353—Mechanical means for transferring the output of a sensing member; Means for converting the output of a sensing member to another variable where the form or nature of the sensing member does not constrain the means for converting; Transducers not specially adapted for a specific variable characterised by optical transfer means, i.e. using infrared, visible, or ultraviolet light with attenuation or whole or partial obturation of beams of light the beams of light being detected by photocells influencing the transmission properties of an optical fibre
- G01D5/35338—Mechanical means for transferring the output of a sensing member; Means for converting the output of a sensing member to another variable where the form or nature of the sensing member does not constrain the means for converting; Transducers not specially adapted for a specific variable characterised by optical transfer means, i.e. using infrared, visible, or ultraviolet light with attenuation or whole or partial obturation of beams of light the beams of light being detected by photocells influencing the transmission properties of an optical fibre using other arrangements than interferometer arrangements
- G01D5/35354—Sensor working in reflection
- G01D5/35358—Sensor working in reflection using backscattering to detect the measured quantity
- G01D5/35364—Sensor working in reflection using backscattering to detect the measured quantity using inelastic backscattering to detect the measured quantity, e.g. using Brillouin or Raman backscattering
-
- G—PHYSICS
- G01—MEASURING; TESTING
- G01B—MEASURING LENGTH, THICKNESS OR SIMILAR LINEAR DIMENSIONS; MEASURING ANGLES; MEASURING AREAS; MEASURING IRREGULARITIES OF SURFACES OR CONTOURS
- G01B11/00—Measuring arrangements characterised by the use of optical techniques
- G01B11/16—Measuring arrangements characterised by the use of optical techniques for measuring the deformation in a solid, e.g. optical strain gauge
- G01B11/18—Measuring arrangements characterised by the use of optical techniques for measuring the deformation in a solid, e.g. optical strain gauge using photoelastic elements
-
- G—PHYSICS
- G01—MEASURING; TESTING
- G01H—MEASUREMENT OF MECHANICAL VIBRATIONS OR ULTRASONIC, SONIC OR INFRASONIC WAVES
- G01H9/00—Measuring mechanical vibrations or ultrasonic, sonic or infrasonic waves by using radiation-sensitive means, e.g. optical means
- G01H9/004—Measuring mechanical vibrations or ultrasonic, sonic or infrasonic waves by using radiation-sensitive means, e.g. optical means using fibre optic sensors
Definitions
- the embodiments of the present invention relate to a data processor and a data processing method for processing strain distribution data which is measured by a distributed optical fiber sensor.
- a Fiber Bragg Grating (FBG) sensor is generally used in the field of an optical fiber sensing for measuring a strain by using an optical fiber sensor.
- the FBG sensor is disclosed in, for example, Non-Patent Document " The Optical Fiber Sensors Guide - Fundamentals & Applications -, Micron Optics” which is available at http://www.micronoptics.com/wp-content/uploads/2015/06/Updated Optical Fiber Se nsors Guide 130529.pdf .
- the FBG sensor is the sensor in which plural FBG elements (a diffraction grating) are formed inside a core of the optical fiber.
- the strain of the position where the FBG elements are formed in the optical fiber can be measured by analyzing an optical spectrum of a reflected beam of light of a Bragg wavelength inside the optical fiber by using the FBG sensor.
- the FBG sensor is referred to as a quasi-distributed optical fiber sensor.
- the FBG elements are discretized in the FBG sensor, and the position of the FBG element cannot be changed by workers. Therefore, the strain distribution data at an arbitrary position cannot be acquired with the FBG sensor.
- a set of strain distribution data can be acquired with the distributed optical fiber sensor using such as the Brillouin scattering phenomenon by measuring the strain at each position while switching (with random access) the position to be measured.
- the optical fiber sensor is referred to as a random access optical fiber sensor.
- the random access optical fiber sensor can measure the strain at only one point of position at a certain point of time. It means the strain distribution data of each point acquired by the random access optical fiber sensor has mutually different measured times. Thus, the random access optical fiber sensor is not used to observe the strain distribution at the same time. Furthermore, the random access optical fiber sensor is not used to observe the vibration mode of a measurement target even if a displacement of the measurement target is acquired from the measured strain.
- the present invention relates to a data processor and a data processing method which is capable of acquiring strain distribution data at the same time.
- a data processor having an acquirer for acquiring strain distribution data in which a distributed optical fiber sensor measures strains at a set of positions of an optical fiber at different times; and an interpolator for calculating the strains at the set of positions of the optical fiber at the same time by interpolating the positions and the times of the strain distribution data acquired by the acquirer.
- the interpolator is for calculating the strain at the set of positions of the optical fiber at the same time by interpolating the times and the positions of the strain distribution data acquired by the acquirer.
- the interpolator is for calculating the strain at the set of times of the optical fiber at the same position by interpolating the strains and the positions of the strain distribution data acquired by the acquirer.
- the data processor further includes a calculator for calculating a temporal change of the strain distribution of a measurement target having the optical fiber attached thereto from the strain distribution data interpolated by the interpolator.
- the data processor includes an output unit for outputting the strain distribution data interpolated by the interpolator.
- a data processing method having acquiring strain distribution data in which a distributed optical fiber sensor measures a strain at a set of positions of an optical fiber at different times; and calculating the strains at the set of positions of the optical fiber at the same time by interpolating positions and times of the strain distribution data.
- the data processing method acquiring strain distribution data in which a distributed optical fiber sensor measures a strain at a set of positions of an optical fiber at different times; and calculating the strains at the set of positions of the optical fiber at the same time by interpolating positions and times of the strain distribution data.
- the data processing method acquiring strain distribution data in which a distributed optical fiber sensor measures a strain at a set of positions of an optical fiber at different times; and calculating the strains at the set of times of the optical fiber at the same position by interpolating positions and times of the strain distribution data.
- the present invention is capable of acquiring the strain distribution data in the same or identical time.
- FIG. 1 is a schematic configuration diagram showing a data processor included in a data processor according to an embodiment of the present invention.
- a data processor 1 includes an optical fiber sensor 2 and a strain distribution data processor 3.
- the optical fiber sensor 2 measures a strain at plural positions of a measurement target 4 at mutually different times.
- the optical fiber sensor 2 is a distributed optical fiber sensor.
- the distributed optical fiber sensor 2 includes such as the BOCDA (Brillouin Optical Correlation Domain Analysis), the BOCDR (Brillouin Optical Correlation Domain Reflectometry), and the BOTDR (Brillouin Optical Time Domain Reflectometer) using the Brillouin scattering phenomenon.
- the BOCDA and the BOCDR are referred to as a random access optical fiber sensor, and are particularly suitable for the present embodiment.
- the optical fiber sensor 2 includes an optical fiber 21 and a measurer 22.
- the optical fiber 21 is attached to the measurement target 4.
- the strain of the measurement target 4 occurs in the optical fiber 21 in a pseudo manner.
- the optical fiber 21 is preferably brought into close contact with the measurement target 4 and installed in a linear shape or a loop shape in order to improve a measurement sensitivity of the strain.
- the measurer 22 measures a strain of the optical fiber 21.
- the measurer 22 measures a strain at the plural positions of the optical fiber 21 by using such as the stimulated Brillouin scattering phenomenon. It is known that the frequency difference between an incident beam of light and a Brillouin backscattering beam of light depends on a strain amount at where the stimulated Brillouin scattering beam of light generated. For example, using BOCDA to detect the frequency difference at a specific position, the measurer 22 generates the stimulated Brillouin scattering beam of light by the pump beam of light incident on the optical fiber 21, and modulates a frequency of the light source (not shown).
- the measurer 22 selects the stimulated Brillouin scattering beam of light at a specific position and observes the stimulated Brillouin scattering beam of light. Then, the measurer 22 detects the stimulated Brillouin scattering beam of light which is locally generated, and calculates the strain of the optical fiber 21 at the position where the stimulated Brillouin scattering beam of light is generated.
- the measurer 22 can measure only one point of the strain at one time. Therefore, the measurer 22 continuously changes the position at which the stimulated Brillouin scattering is locally generated by changing the modulation frequency of the light source. According to the above operation, the measurer 22 can measure the strain distribution over the entire length of the optical fiber 21. That is, the optical fiber sensor 2 measures the strain of the plural positions of the optical fiber 21 at plural different times. As a result, it can be the acquired strain distribution data which is acquired by measuring the strains at the plural positions of the optical fiber 21 at the mutually plural different times. The strain distribution data is composed of the plural strain measurement values measured by the measurer 22.
- the strain distribution data is composed of at least mutually different four or more strain measurement values acquired by measuring the strains of the two or more positions of the optical fiber 21 at the mutually different two or more times.
- the mutually different six or more strain measurement values which are acquired by measuring the strains at the two or more positions of the optical fiber 21 at the mutually different three or more times, it is suitable for observing the vibration mode of the measurement target 4 described below.
- the strain distribution data processor 3 is constructed by a computer device such as a personal computer.
- the strain distribution data processor 3 is capable of connecting with the optical fiber sensor 2, and calculates the strain at the plural positions of the measurement target 4 at the same (identical) time based on the strain distribution data acquired from the optical fiber sensor 2.
- FIG. 2 is a schematic block diagram showing the strain distribution data processor 3. As shown in FIG. 2 , the strain distribution data processor 3 includes an acquirer 31, an interpolator 32, a calculator 33, and an output unit 34.
- the acquirer 31 acquires the strain distribution data of the optical fiber 21 acquired by the optical fiber sensor 2. Then, the acquirer 31 transmits the acquired strain distribution data to the interpolator 32.
- the interpolator 32 calculates the strain of the plural positions of the optical fiber 21 at the same time by the interpolation (a surface interpolation) of the time and the position of the strain distribution data acquired by the acquirer 31.
- This interpolation can be carried out by various known methods, for example, it can be carried out by following formula 1 or formula 2.
- the formula 1 is an Exact Method that interpolates so that the observation value is always passed, and the formula 2 is an Approximate Method that the observation value is not passed ( Lam, Nina Siu-Ngan. "Spatial interpolation methods: are view.” The American Cartographer 10.2 (1983): 129-150 .).
- the "p” represents the strain
- the "x” represents the position
- the “y” represents the time
- the "a” represents the coefficient
- the "z” represents the observed strain.
- the "N” is an integer of 2 or more, and preferably an integer of 3 or more.
- FIG. 3 is a diagram showing the strain distribution data acquired by the optical fiber sensor 2.
- the thick line represents the actual strain which is occurring in the optical fiber 21 measured by a strain gauge 16 shown in FIG. 6
- the black dot represents the strain distribution data acquired by the optical fiber sensor.
- the black dots as the strain distribution data are connected by thin lines.
- FIG. 4 is a diagram showing the strain distribution data interpolated by the interpolator.
- the strain distribution data acquired by the optical fiber sensor 2 is a strain measurement value which is measured at the plural positions, neither strain measurement value is synchronized, and is measured at the mutually different times. For this reason, it cannot observe the measured strain values at the plural positions at a certain time. In other words, the strain distribution data of the optical fiber 21 acquired by the optical fiber sensor 2 is different from the state of the strain of the optical fiber 21 at a specific time.
- the interpolator 32 calculates or acquires the strain (the distribution of strain) of the optical fiber 21 at every predetermined time interval and at every predetermined position by interpolating the strain distribution data acquired by the acquirer 31 in terms of the time and the position (a time axis direction and/or a position axis direction).
- the interpolator 32 calculates the strain of the mutually different plural positions of the optical fiber 21 at the same time (hereinafter, including the meaning of the specific time).
- FIG. 4 shows data acquired by calculating the strain of the optical fiber 21 in every 14 millisecond and every 0.25m.
- the interpolated strain distribution data set can be expressed in a curved surface shown in FIG. 4 .
- the interpolator 32 calculates the strain at the mutually different plural times of the optical fiber 21 at the same position (hereinafter, including the meaning of the specific position) by interpolation (the surface interpolation) of the strain and the position of the strain distribution data of which the acquirer 31 acquired.
- This interpolation can be carried out by various known methods and can be carried out, for example, by the above formula 1 or formula 2.
- the calculator 33 calculates the temporal change of the strain distribution of the measurement target 4 having the optical fiber 21 attached thereto from the strain distribution data (interpolated strain distribution data) generated or interpolated by the interpolator 32. As described above, the interpolator 32 interpolates the strain distribution data at the plural positions and the mutually different plural times of the measurement target 4. The calculator 33 calculates the temporal change of the strain distribution of the measurement target 4 from the strain distribution data.
- the temporal change of the strain distribution of the measurement target 4 can be represented by, for example, the natural frequency of the measurement target 4 and the vibration mode of the measurement target 4. The natural frequency and the vibration mode can be calculated by a well-known method.
- the output unit 34 outputs the strain at the mutually different plural positions at the same time of the optical fiber 21 and the strain at the mutually different plural times at the same position of the optical fiber 21 as the strain distribution data. That is, the output unit 34 outputs the strain distribution data generated or interpolated by the interpolator 32 (see FIG. 3 ).
- the output form of the output unit 34 is not limited to the present embodiment.
- the strain distribution data may be output as image from a display device.
- the strain distribution data may be output as a character from a printer.
- the output unit 34 may output the temporal change and positional data of the measurement target 4 calculated by the calculator 33 as the strain distribution data.
- the measurer 22 measures the strain at the plural positions of the optical fiber 21 at the mutually different plural times.
- the optical fiber sensor 2 acquires the strain distribution data acquired by measuring the strain at the plural positions of the optical fiber 21 at the mutually different plural times.
- the acquirer 31 acquires the strain distribution data acquired in the measuring step S 1.
- the acquirer 31 acquires the strain distribution data in which the optical fiber sensor 2 measures the strain at the plural positions of the optical fiber 21 at the mutually different plural times respectively.
- the interpolator 32 interpolates the strain distribution data acquired in the acquiring step S2 in the time direction and in the position direction, and calculates the strain at the mutually different plural positions of the optical fiber 21 at the same time. Furthermore, the interpolator 32 interpolates the strain distribution data acquired in the acquisition step S2 in the time direction and in the position direction, and calculates the strain at the mutually different plural times of the optical fiber 21 at the same position.
- the calculator 33 calculates the temporal change or the positional change of the strain distribution of the measurement target 4 based on the strain distribution data generated or interpolated in the interpolating step S3.
- the output unit 34 outputs the strain of the mutually different plural positions at the same time of the optical fiber 21 calculated in the interpolating step S3 and the strain at the mutually different plural times at the same position of the optical fiber 21 calculated in the interpolating step S3.
- it may output the temporal change or the positional change of the strain distribution of the measurement target 4 which is calculated in the calculating step S4.
- the distributed optical fiber sensor 2 measures the strain at the plural positions of the optical fiber 21 at the mutually different plural times, and the acquirer 31 acquires the strain distribution data based on the data of the strain.
- the interpolator 32 calculates the strain at the mutually different plural positions of the optical fiber 21 at the same time by interpolating the strain distribution data in the time direction and in the position direction.
- it is possible to acquire the strain distribution data at the same time of the measurement target 4 by attaching the one or more optical fibers 21 to one or more positions of the measurement target 4.
- the interpolator 32 interpolates the strain distribution data in the position direction and the time direction, and calculates the strain at the mutually different plural times at the same position of the optical fiber 21.
- the interpolator 32 can acquire the temporal change of the strain at the same position of the optical fiber 21.
- the interpolator 32 can acquire the temporal change of the strain at the same position of the measurement target 4 by attaching the one or more optical fibers 21 to plural points of the measurement target 4.
- the calculator 33 calculates the temporal change of the strain distribution of the measurement target 4 from the strain distribution data generated or interpolated by the interpolator 32. The worker can easily observe such as the vibration mode of the measurement target 4.
- the output unit 34 outputs the strain distribution data calculated by the interpolator 32. The worker can easily observe the strain distribution data at the same time of the measurement target 4 and the temporal change of the strain at the same position. The output unit 34 outputs the displacement calculated from the strain. The worker can easily observe the vibration mode of the measurement target 4.
- FIG. 5A is a plan view
- FIG. 5B is a left side view
- FIG. 5C is a front view of the experimental device according to the example of the data processor.
- the length of the beam member 14 (the dimension in the lateral direction in FIG. 5A ) is 2.1m
- the width of the beam member 14 (the dimension in the vertical direction in FIG. 5A ) is 32mm
- the thickness of the beam member 14 (the dimension in the vertical direction in FIG. 5C ) is 6mm.
- the right end portion of the beam member 14 in the major axis direction is supported by the right support portion 15R.
- the left end portion of the beam member 14 in the longitudinal direction is supported by the left support portion 15L.
- the interval between the right support portion 15R and the left support portion 15L is 2.0m.
- FIG. 6 is a view showing the beam member 14.
- FIG. 6A is a plan view
- FIG. 6B is a bottom view.
- nine strain gauges 16 are attached to the upper surface of the beam member 14 at intervals of 0.25m. More specifically, the center position in the longitudinal direction of the beam member 14 is set as the 0m point, the right support portion 15R side from the 0m point is the positive (+) side, and the left support portion 15L side is the negative (-) side respectively.
- the strain gauge 16 is installed at nine points reactively, which are the -1m point, the -0.75m point, the -0.50m point, the -0.25m point, the 0m point, the 0.25m point, the 0.50m point, the 0.75m point, and the 1m point respectively.
- An optical fiber 18 of the optical fiber sensor 17 is attached to the lower surface of the beam member 14 on a position facing the strain gauge 16 along the longitudinal direction of the beam member 14.
- the beam member 14 vibrates by changing the conditions of the right support portion 15R and the left support portion 15L as shown in a table 1, and by the central portion of the beam member 14 being pushed.
- the conditions in the table 1 are the conditions which are used when reproducing the situation of which the support portion (the right support portion 15R and the left support portion 15L) of the bridge model among the bridge models are deteriorating when the beam member 14 is used as a bridge model in accordance with proceeding from the conditions 1 to the conditions 4.
- left support portion right support portion rotating horizontal moving rotating horizontal moving conditions 1 free fixed free free conditions 2
- free fixed free spring buffer conditions free fixed free fixed conditions 4 free fixed fixed fixed fixed fixed fixed fixed fixed fixed fixed fixed fixed fixed
- the strain is measured by each strain gauge 16 at a rate of 200 Hz synchronously. Distribution data of the measurement value is referred to as measured strain distribution data of the strain gauge 16.
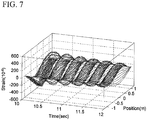
- FIG. 7 shows the measured strain distribution data of the strain gauge 16 under the conditions 1.
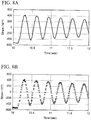
- FIG. 8 shows the temporal change of the strain at the 0m point shown in FIG. 7 .
- FIG. 8A shows the measured strain distribution data of which the strains measured in the time axis direction at the 0m point connected by a line.
- FIG. 8B shows the measured strain distribution data of which the strains measured in the time axis direction at the 0m point represented by a set of points.
- FIG. 9 shows the measured strain distribution data of the optical fiber sensor 17 under the conditions 1 in the table 1. Since the strain gauge 16 and the optical fiber 18 are respectively attached to the opposite surfaces with respect to the beam member 14, the sign of the measured strain distribution data of the strain gauge 16 and the sign of the measured strain distribution data of the optical fiber sensor 17 are opposite to each other.
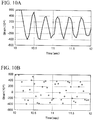
- FIG. 10 shows the temporal change of the strain at the 0m point shown in FIG. 9 .
- FIG. 10A shows the measured strain distribution data in which the strain measured in the time axis direction at the 0m point connected by a line
- FIG. 10B shows the measured strain distribution data in which the strain measured strain measured in the time axis direction at the 0m point shown as a set of points.
- the strain at the position corresponding to each strain gauge 16 of the optical fiber 18 at the same time is calculated by interpolating the strain distribution data acquired by the optical fiber sensor 17 in the time direction and the position direction.
- the calculated strain distribution data is referred to as interpolated strain distribution data of the optical fiber sensor 17.
- FIG. 11 shows the interpolated strain distribution data of the optical fiber sensor 17 under the conditions 1 in the table 1.
- FIG. 12 shows the temporal change of the strain at the 0m point shown in FIG. 11 .
- FIG. 12A shows the measured strain distribution data in which the strains calculated in the time axis direction connected by lines
- FIG. 12B shows the measured strain distribution data in which the strains calculated in the time axis direction represented as a set of points.
- the measured strain distribution data of the strain gauge 16 is the strain distribution data in which the strain is measured at each position of the beam member 14 at the same time. Therefore, it is possible to observe the strain distribution at the same time of the beam member 14, and to observe the temporal change of the strain of the entire beam member 14.
- the measured strain distribution data of the optical fiber sensor 17 is discrete strain distribution data acquired by measuring the strain at each position of the beam member 14 at mutually different plural times. Therefore, it is impossible to observe the strain distribution of the beam member 14 at the same time, and the temporal change of the strain of the entire beam member 14 cannot be observed.
- the interpolated strain distribution data of the optical fiber sensor 17 is the strain distribution data of which the strain at each position of the beam member 14 at the same time is calculated by interpolation. Therefore, it is possible to observe the strain distribution of the beam member 14 at the same time, and to observe the temporal change of the strain of the entire beam member 14 similarly to the measured strain distribution data of the strain gauge 16.
- the measured strain distribution data of the strain gauge 16 is measured the strain of the beam member 14 at the same position at all measurement times, it is possible to accurately observe the temporal change of the strain at the same position.
- the measured strain distribution data of the optical fiber sensor 17 is not the data which is acquired by measuring the strain at the same position at all measurement times, it is impossible to accurately observe the temporal change of the strain at the same position in compared with the measured strain distribution data of the strain gauge 16 (see FIG. 8A, and FIG. 8B ).
- Fig. 10B it is impossible to observe the temporal change of the strain at the same point since the measurement points are shown as dispersed if the measured strain is represented by a set of points instead of a connected line.
- the interpolated strain distribution data of the optical fiber sensor 17 is calculated by interpolating the strain of each position of the beam member 14 at the same time, it can be observed the temporal change of the strain at the same position more accurately than the measured strain distribution data of the fiber sensor 17.
- the table 2 shows the compared result acquired by comparing the natural frequency of the beam member 14 calculated based on the measured strain distribution data of the strain gauge 16 and the natural vibration of the beam member 14 calculated based on the interpolated strain distribution data of the optical fiber sensor 17.
- the comparison result shows the natural vibration of the beam member 14 in 10 seconds after the beam member 14 was vibrated.
- the natural vibration of the beam member 14 corresponds to the temporal change of the strain of the entire beam member 14.
- the value of the natural vibration of the beam member 14 calculated based on the measured strain distribution data of the strain gauge 16 is same in the conditions 2 and in the conditions 3, and the value of the natural vibration of the beam member 14 calculated based on the interpolated strain distribution of the optical fiber sensor 17 is same in the conditions 2 and in the conditions 3. For this reason, it is difficult to distinguish the conditions 2 from the conditions 3 by the natural vibration.
- the value of the natural vibration of the beam member 14 calculated based on the measured strain distribution data of the strain gauge 16 and the value of the natural vibration of the beam member 14 calculated based on the interpolated strain distribution data of the optical fiber sensor 17 are very close together under all conditions. Therefore, it is understood that the interpolated strain distribution data of the optical fiber sensor 17 has sufficient accuracy as the parameter representing the change in the natural vibration.
- a table 3 shows the compared result acquired by comparing a damping ratio of the beam member 14 calculated based on the measured strain distribution data of the strain gauge 16 and the damping ratio of the beam member 14 calculated based on the interpolated strain distribution data of the optical fiber sensor 17.
- the comparison result shows the damping ratio of the beam member 14 in 10 seconds after the beam member 14 was vibrated.
- the damping ratio based on the measured strain distribution data of the strain gauge [Hz] the damping ratio based on the measured strain distribution data of the optical fiber sensor [Hz] a margin of error [%] conditions 1 5.69 5.57 2.11 conditions 2 4.13 4.32 4.60 conditions 3 4.19 3.64 13.12 conditions 4 3.86 3.27 15.28
- the damping ratio of the beam member 14 calculated based on the measured strain distribution data of the strain gauge 16 and the damping ratio of the beam member 14 calculated based on the interpolated strain distribution data of the optical fiber sensor 17 goes away as the conditions progresses from the conditions 1 to the conditions 4.
- this condition reproduces the situation where the bridge model deteriorates according to the conditions 1 go to the conditions 4, it is possible to estimate the chronological change tendency of the damping ratio in the bridge model from this comparison result.
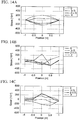
- FIGS. 13 to 16 show the compared results which compare the measured strain distribution data of the strain gauge 16, the measured strain distribution data of the optical fiber sensor 17, and the interpolated strain distribution data of the optical fiber sensor 17 under each of conditions.
- the strain of the beam member 14 at the vibration periods of 0, ⁇ /3, 2 ⁇ /3, and ⁇ were compared.
- FIG. 13 is a diagram showing a compared result in the conditions 1.
- FIG. 14 is a diagram showing a compared result in the conditions 2.
- FIG. 15 is a diagram showing a compared result in the conditions 3.
- FIG. 16 is a diagram showing a compared result in the conditions 4.
- FIG. 13A , FIG. 14A , FIG. 15A , and FIG. 16A respectively show the measured strain distribution data of the strain gauge 16.
- FIG. 13B , FIG. 14B , FIG. 15B , and FIG. 16B respectively show the measured strain distribution data of the optical fiber sensor 17.
- FIG. 13C , FIG. 14C , FIG. 15C , and FIG. 16C respectively show the interpolated strain distribution data of the optical fiber sensor 17.
- the optical fiber sensor 17 can measure the strain at only one point at a certain time, the previous measured value remains unchanged except for the values measured at the 0, ⁇ /3, 2 ⁇ /3, and ⁇ in the FIG. 13B , FIG. 14B , FIG. 15B and FIG. 16B .
- the measured strain distribution data of the optical fiber sensor 17 is very different from the measured strain distribution data of the strain gauge 16. Therefore, it is impossible to observe the strain distribution of the beam member 14 at the same time and to observe the temporal change of the strain of the entire beam member 14 in any conditions.
- the interpolated strain distribution data of the optical fiber sensor 17 is close to the measured strain distribution data of the strain gauge 16. Therefore, it is possible to observe the strain distribution of the beam member 14 at the same time, and to observe the temporal change of the strain of the entire beam member 14.
- FIG. 17 shows the compared result of each the strain distribution data under the conditions 1.
- the measured strain distribution data of the strain gauge 16 in each oscillation period and the interpolated strain distribution data of the optical fiber sensor 17 are plotted on the same graph.
- the horizontal axis shows the measured strain distribution data of the strain gauge 16
- the vertical axis shows the interpolated strain distribution data of the optical fiber sensor 17.
- the measured strain distribution data of the strain gauge 16 and the interpolated strain distribution data of the optical fiber sensor 17 are inversely proportional. As described above, the sign of the value of the measured strain distribution data of the strain gauge 16 and the sign of the value of the measured strain distribution data of the optical fiber sensor 17 are opposite to each other. Therefore, it is understood that the interpolated strain distribution data of the optical fiber sensor 17 has sufficient accuracy from this relationship.
- the two correlation coefficients R 2 , the discrepancy in natural frequency between the natural frequency based on the measured strain distribution data of the strain gauge 16 and the natural frequency based on the interpolated strain distribution data of the optical fiber sensor 17, and the discrepancy in the damping ratio between the damping ratio based on the measured strain distribution data of the strain gauge 16 and the damping ratio based on the measured strain distribution data of the optical fiber sensor 17 are plotted on FIG. 18 .
- the horizontal axis shows the normalized natural frequency
- the left vertical axis shows the discrepancy
- the right vertical axis shows the correlation coefficient R 2 .
- the correlation between the interpolated strain distribution data of the optical fiber sensor 17 and the measured strain distribution data of the strain gauge 16 is higher than the measured strain distribution data of the optical fiber sensor 17. According to the relation, it is understood that the interpolated strain distribution data of the optical fiber sensor 17 has sufficient accuracy.
Landscapes
- Physics & Mathematics (AREA)
- General Physics & Mathematics (AREA)
- Length Measuring Devices By Optical Means (AREA)
- Optical Transform (AREA)
- Testing Of Optical Devices Or Fibers (AREA)
Abstract
Description
- The embodiments of the present invention relate to a data processor and a data processing method for processing strain distribution data which is measured by a distributed optical fiber sensor.
- Priority is claimed on
Japanese Patent Application No. 2015-256344, filed on December 28, 2015 - A Fiber Bragg Grating (FBG) sensor is generally used in the field of an optical fiber sensing for measuring a strain by using an optical fiber sensor. The FBG sensor is disclosed in, for example, Non-Patent Document "The Optical Fiber Sensors Guide - Fundamentals & Applications -, Micron Optics" which is available at http://www.micronoptics.com/wp-content/uploads/2015/06/Updated Optical Fiber Se nsors Guide 130529.pdf. The FBG sensor is the sensor in which plural FBG elements (a diffraction grating) are formed inside a core of the optical fiber. The strain of the position where the FBG elements are formed in the optical fiber can be measured by analyzing an optical spectrum of a reflected beam of light of a Bragg wavelength inside the optical fiber by using the FBG sensor. The FBG sensor is referred to as a quasi-distributed optical fiber sensor.
- The FBG elements are discretized in the FBG sensor, and the position of the FBG element cannot be changed by workers. Therefore, the strain distribution data at an arbitrary position cannot be acquired with the FBG sensor.
- In contrast, a set of strain distribution data can be acquired with the distributed optical fiber sensor using such as the Brillouin scattering phenomenon by measuring the strain at each position while switching (with random access) the position to be measured. Such the optical fiber sensor is referred to as a random access optical fiber sensor.
- The random access optical fiber sensor can measure the strain at only one point of position at a certain point of time. It means the strain distribution data of each point acquired by the random access optical fiber sensor has mutually different measured times. Thus, the random access optical fiber sensor is not used to observe the strain distribution at the same time. Furthermore, the random access optical fiber sensor is not used to observe the vibration mode of a measurement target even if a displacement of the measurement target is acquired from the measured strain.
- The present invention relates to a data processor and a data processing method which is capable of acquiring strain distribution data at the same time.
- One aspect of the present invention, a data processor having an acquirer for acquiring strain distribution data in which a distributed optical fiber sensor measures strains at a set of positions of an optical fiber at different times; and an interpolator for calculating the strains at the set of positions of the optical fiber at the same time by interpolating the positions and the times of the strain distribution data acquired by the acquirer.
- The data processor according to the aspect of the present invention, the interpolator is for calculating the strain at the set of positions of the optical fiber at the same time by interpolating the times and the positions of the strain distribution data acquired by the acquirer.
- The data processor according to the aspect of the present invention, the interpolator is for calculating the strain at the set of times of the optical fiber at the same position by interpolating the strains and the positions of the strain distribution data acquired by the acquirer.
- The data processor according to the aspect of the present invention further includes a calculator for calculating a temporal change of the strain distribution of a measurement target having the optical fiber attached thereto from the strain distribution data interpolated by the interpolator.
- The data processor according to the aspect of the present invention includes an output unit for outputting the strain distribution data interpolated by the interpolator.
- One aspect of the present invention, a data processing method having acquiring strain distribution data in which a distributed optical fiber sensor measures a strain at a set of positions of an optical fiber at different times; and calculating the strains at the set of positions of the optical fiber at the same time by interpolating positions and times of the strain distribution data.
- The data processing method according to the aspect of the present invention acquiring strain distribution data in which a distributed optical fiber sensor measures a strain at a set of positions of an optical fiber at different times; and calculating the strains at the set of positions of the optical fiber at the same time by interpolating positions and times of the strain distribution data.
- The data processing method according to the aspect of the present invention acquiring strain distribution data in which a distributed optical fiber sensor measures a strain at a set of positions of an optical fiber at different times; and calculating the strains at the set of times of the optical fiber at the same position by interpolating positions and times of the strain distribution data.
- According to the present invention, it is capable of acquiring the strain distribution data in the same or identical time.
-
-
FIG. 1 is a schematic configuration diagram showing a data processor according to an embodiment of the present invention. -
FIG. 2 is a schematic block diagram showing the data processor according to the embodiment of the present invention. -
FIG. 3 is a diagram showing the strain distribution data acquired by using an optical fiber sensor in the data processor according to the embodiment of the present invention. -
FIG. 4 is a diagram showing the strain distribution data interpolated by an interpolator in the data processor according to the embodiment of the present invention. -
FIG. 5A is a plan view showing an experimental device which is used in an example of the data processor according to the embodiment of the present invention. -
FIG. 5B is a left side view showing the experimental device used in the example of the data processor according to the embodiment of the present invention. -
FIG. 5C is a front view showing the experimental device used in the example of the data processor according to the embodiment of the present invention. -
FIG. 6A is a plan view showing a beam member of the experimental device used in the example of the data processor according to the embodiment of the present invention. -
FIG. 6B is a bottom view showing the beam member of the experimental device used in the example of the data processor according to the embodiment of the present invention. -
FIG. 7 is a diagram showing the strain distribution data acquired by measuring the strain of the beam member underconditions 1 by strain gauges attached to the beam member. -
FIG. 8 is a diagram showing a temporal change of the strain at 0m point in the strain distribution data shown inFIG. 7 . -
FIG. 9 is a diagram showing the strain distribution data acquired by measuring the strain of the beam member underconditions 1 by the optical fiber sensor attached to the beam member in the data processor according to the embodiment of the present invention. -
FIG. 10 is a diagram showing the temporal change of the strain at 0m point in the strain distribution data shown inFIG. 9 in the data processor according to the embodiment of the present invention. -
FIG. 11 is a diagram showing the strain distribution data interpolated the strain distribution data at time and position acquired by the optical fiber sensor used in the data processor according to the embodiment of the present invention. -
FIG. 12 is a diagram showing the temporal change of the strain at 0m point in the strain distribution data shown inFIG. 11 in the data processor according to the embodiment of the present invention. -
FIG. 13A is a diagram showing a comparison result of the measured strain distribution data of the strain gauge inconditions 1. -
FIG. 13B is a diagram showing the comparison result of the measured strain distribution data of the optical fiber sensor in theconditions 1 in the data processor according to the embodiment of the present invention. -
FIG. 13C is a diagram showing the comparison result of the interpolated strain distribution data of the optical fiber sensor in theconditions 1 in the data processor according to the embodiment of the present invention. -
FIG. 14A is a diagram showing the comparison result of the measured strain distribution data of the strain gauge inconditions 2. -
FIG. 14B is a diagram showing the comparison result of the measured strain distribution data of the optical fiber sensor in theconditions 2 in the data processor according to the embodiment of the present invention. -
FIG. 14C is a diagram showing the comparison result of the interpolated strain distribution data of the optical fiber sensor in theconditions 2 in the data processor according to the embodiment of the present invention. -
FIG. 15A is a diagram showing the comparison result of the measured strain distribution data of the strain gauge inconditions 3. -
FIG. 15B is a diagram showing the comparison result of the measured strain distribution data of the optical fiber sensor in theconditions 3 in the data processor according to the embodiment of the present invention. -
FIG. 15C is a diagram showing the comparison result of the interpolated strain distribution data of the optical fiber sensor in theconditions 3 in the data processor according to the embodiment of the present invention. -
FIG. 16A is a diagram showing the comparison result of the measured strain distribution data of the strain gauge inconditions 4. -
FIG. 16B is a diagram showing the comparison result of the measured strain distribution data of the optical fiber sensor in theconditions 4 in the data processor according to the embodiment of the present invention. -
FIG. 16C is a diagram showing the comparison result of the interpolated strain distribution data of the optical fiber sensor in theconditions 4 in the data processor according to the embodiment of the present invention. -
FIG. 17 is a diagram showing the comparison result between the measured strain distribution data of the strain gauge and the interpolated strain distribution data of the optical fiber sensor in the data processor according to the embodiment of the present invention in each vibration cycle. -
FIG. 18 is a diagram showing a correlation between the measured strain distribution data of the optical fiber sensor and the interpolated strain distribution data of the optical fiber sensor both in the data processor according to the embodiment of the present invention with respect to the measured strain distribution data of the strain gauges. - Hereinafter, a detailed description of a preferred embodiment of a data processor, a data processing method according to the present invention will be described in detail below with reference to the drawings. In all figures, the same reference numerals are attached to such as the same or corresponding configuration and the same or corresponding part.
-
FIG. 1 is a schematic configuration diagram showing a data processor included in a data processor according to an embodiment of the present invention. As shown inFIG. 1 , adata processor 1 includes anoptical fiber sensor 2 and a straindistribution data processor 3. - The
optical fiber sensor 2 measures a strain at plural positions of ameasurement target 4 at mutually different times. Theoptical fiber sensor 2 is a distributed optical fiber sensor. The distributedoptical fiber sensor 2 includes such as the BOCDA (Brillouin Optical Correlation Domain Analysis), the BOCDR (Brillouin Optical Correlation Domain Reflectometry), and the BOTDR (Brillouin Optical Time Domain Reflectometer) using the Brillouin scattering phenomenon. The BOCDA and the BOCDR are referred to as a random access optical fiber sensor, and are particularly suitable for the present embodiment. Theoptical fiber sensor 2 includes anoptical fiber 21 and a measurer 22. - The
optical fiber 21 is attached to themeasurement target 4. The strain of themeasurement target 4 occurs in theoptical fiber 21 in a pseudo manner. Theoptical fiber 21 is preferably brought into close contact with themeasurement target 4 and installed in a linear shape or a loop shape in order to improve a measurement sensitivity of the strain. - The measurer 22 measures a strain of the
optical fiber 21. The measurer 22 measures a strain at the plural positions of theoptical fiber 21 by using such as the stimulated Brillouin scattering phenomenon. It is known that the frequency difference between an incident beam of light and a Brillouin backscattering beam of light depends on a strain amount at where the stimulated Brillouin scattering beam of light generated. For example, using BOCDA to detect the frequency difference at a specific position, the measurer 22 generates the stimulated Brillouin scattering beam of light by the pump beam of light incident on theoptical fiber 21, and modulates a frequency of the light source (not shown). The measurer 22 selects the stimulated Brillouin scattering beam of light at a specific position and observes the stimulated Brillouin scattering beam of light. Then, the measurer 22 detects the stimulated Brillouin scattering beam of light which is locally generated, and calculates the strain of theoptical fiber 21 at the position where the stimulated Brillouin scattering beam of light is generated. - However, the measurer 22 can measure only one point of the strain at one time. Therefore, the measurer 22 continuously changes the position at which the stimulated Brillouin scattering is locally generated by changing the modulation frequency of the light source. According to the above operation, the measurer 22 can measure the strain distribution over the entire length of the
optical fiber 21. That is, theoptical fiber sensor 2 measures the strain of the plural positions of theoptical fiber 21 at plural different times. As a result, it can be the acquired strain distribution data which is acquired by measuring the strains at the plural positions of theoptical fiber 21 at the mutually plural different times. The strain distribution data is composed of the plural strain measurement values measured by the measurer 22. Specifically, the strain distribution data is composed of at least mutually different four or more strain measurement values acquired by measuring the strains of the two or more positions of theoptical fiber 21 at the mutually different two or more times. In this case, if it is acquired the mutually different six or more strain measurement values which are acquired by measuring the strains at the two or more positions of theoptical fiber 21 at the mutually different three or more times, it is suitable for observing the vibration mode of themeasurement target 4 described below. - The strain
distribution data processor 3 is constructed by a computer device such as a personal computer. The straindistribution data processor 3 is capable of connecting with theoptical fiber sensor 2, and calculates the strain at the plural positions of themeasurement target 4 at the same (identical) time based on the strain distribution data acquired from theoptical fiber sensor 2. -
FIG. 2 is a schematic block diagram showing the straindistribution data processor 3. As shown inFIG. 2 , the straindistribution data processor 3 includes anacquirer 31, aninterpolator 32, acalculator 33, and anoutput unit 34. - The
acquirer 31 acquires the strain distribution data of theoptical fiber 21 acquired by theoptical fiber sensor 2. Then, theacquirer 31 transmits the acquired strain distribution data to theinterpolator 32. - The
interpolator 32 calculates the strain of the plural positions of theoptical fiber 21 at the same time by the interpolation (a surface interpolation) of the time and the position of the strain distribution data acquired by theacquirer 31. This interpolation can be carried out by various known methods, for example, it can be carried out by followingformula 1 orformula 2. Theformula 1 is an Exact Method that interpolates so that the observation value is always passed, and theformula 2 is an Approximate Method that the observation value is not passed (Lam, Nina Siu-Ngan. "Spatial interpolation methods: are view." The American Cartographer 10.2 (1983): 129-150.). In theformula 1 and theformula 2, the "p" represents the strain, the "x" represents the position, the "y" represents the time, the "a" represents the coefficient, and the "z" represents the observed strain. In theformula 1 and theformula 2, the "N" is an integer of 2 or more, and preferably an integer of 3 or more.
[Formula 1]
[Formula 2]
- Hereinafter, an interpolation processing by the
interpolator 32 will be described with reference toFIG. 3 and FIG. 4 . -
FIG. 3 is a diagram showing the strain distribution data acquired by theoptical fiber sensor 2. InFIG. 3 , the thick line represents the actual strain which is occurring in theoptical fiber 21 measured by astrain gauge 16 shown inFIG. 6 , and the black dot represents the strain distribution data acquired by the optical fiber sensor. InFIG. 3 , the black dots as the strain distribution data are connected by thin lines.FIG. 4 is a diagram showing the strain distribution data interpolated by the interpolator. - As shown in
FIG. 3 , however the strain distribution data acquired by theoptical fiber sensor 2 is a strain measurement value which is measured at the plural positions, neither strain measurement value is synchronized, and is measured at the mutually different times. For this reason, it cannot observe the measured strain values at the plural positions at a certain time. In other words, the strain distribution data of theoptical fiber 21 acquired by theoptical fiber sensor 2 is different from the state of the strain of theoptical fiber 21 at a specific time. - Therefore, the
interpolator 32 calculates or acquires the strain (the distribution of strain) of theoptical fiber 21 at every predetermined time interval and at every predetermined position by interpolating the strain distribution data acquired by theacquirer 31 in terms of the time and the position (a time axis direction and/or a position axis direction). Theinterpolator 32 calculates the strain of the mutually different plural positions of theoptical fiber 21 at the same time (hereinafter, including the meaning of the specific time).FIG. 4 shows data acquired by calculating the strain of theoptical fiber 21 in every 14 millisecond and every 0.25m. The interpolated strain distribution data set can be expressed in a curved surface shown inFIG. 4 . - Furthermore, the
interpolator 32 calculates the strain at the mutually different plural times of theoptical fiber 21 at the same position (hereinafter, including the meaning of the specific position) by interpolation (the surface interpolation) of the strain and the position of the strain distribution data of which theacquirer 31 acquired. This interpolation can be carried out by various known methods and can be carried out, for example, by theabove formula 1 orformula 2. - The
calculator 33 calculates the temporal change of the strain distribution of themeasurement target 4 having theoptical fiber 21 attached thereto from the strain distribution data (interpolated strain distribution data) generated or interpolated by theinterpolator 32. As described above, theinterpolator 32 interpolates the strain distribution data at the plural positions and the mutually different plural times of themeasurement target 4. Thecalculator 33 calculates the temporal change of the strain distribution of themeasurement target 4 from the strain distribution data. The temporal change of the strain distribution of themeasurement target 4 can be represented by, for example, the natural frequency of themeasurement target 4 and the vibration mode of themeasurement target 4. The natural frequency and the vibration mode can be calculated by a well-known method. - The
output unit 34 outputs the strain at the mutually different plural positions at the same time of theoptical fiber 21 and the strain at the mutually different plural times at the same position of theoptical fiber 21 as the strain distribution data. That is, theoutput unit 34 outputs the strain distribution data generated or interpolated by the interpolator 32 (seeFIG. 3 ). The output form of theoutput unit 34 is not limited to the present embodiment. For example, the strain distribution data may be output as image from a display device. The strain distribution data may be output as a character from a printer. Further, theoutput unit 34 may output the temporal change and positional data of themeasurement target 4 calculated by thecalculator 33 as the strain distribution data. - Next, a strain distribution data processing method will be described.
- First, in the measuring step S1, the measurer 22 measures the strain at the plural positions of the
optical fiber 21 at the mutually different plural times. Theoptical fiber sensor 2 acquires the strain distribution data acquired by measuring the strain at the plural positions of theoptical fiber 21 at the mutually different plural times. - Next, in the acquiring step S2, the
acquirer 31 acquires the strain distribution data acquired in the measuringstep S 1. In other words, theacquirer 31 acquires the strain distribution data in which theoptical fiber sensor 2 measures the strain at the plural positions of theoptical fiber 21 at the mutually different plural times respectively. - Next, in the interpolating step S3, the
interpolator 32 interpolates the strain distribution data acquired in the acquiring step S2 in the time direction and in the position direction, and calculates the strain at the mutually different plural positions of theoptical fiber 21 at the same time. Furthermore, theinterpolator 32 interpolates the strain distribution data acquired in the acquisition step S2 in the time direction and in the position direction, and calculates the strain at the mutually different plural times of theoptical fiber 21 at the same position. - Next, in the calculating step S4, the
calculator 33 calculates the temporal change or the positional change of the strain distribution of themeasurement target 4 based on the strain distribution data generated or interpolated in the interpolating step S3. - Next, in the outputting step S5, the
output unit 34 outputs the strain of the mutually different plural positions at the same time of theoptical fiber 21 calculated in the interpolating step S3 and the strain at the mutually different plural times at the same position of theoptical fiber 21 calculated in the interpolating step S3. In the outputting step S5, it may output the temporal change or the positional change of the strain distribution of themeasurement target 4 which is calculated in the calculating step S4. - As described above, in the present embodiment, the distributed
optical fiber sensor 2 measures the strain at the plural positions of theoptical fiber 21 at the mutually different plural times, and theacquirer 31 acquires the strain distribution data based on the data of the strain. Theinterpolator 32 calculates the strain at the mutually different plural positions of theoptical fiber 21 at the same time by interpolating the strain distribution data in the time direction and in the position direction. Thus, it is possible to acquire the strain distribution data at the plural positions of theoptical fiber 21 at the same time. Further, it is possible to acquire the strain distribution data at the same time of themeasurement target 4 by attaching the one or moreoptical fibers 21 to one or more positions of themeasurement target 4. As a result, it is possible to observe the strain distribution of themeasurement target 4 at the same time. In this case, it is possible to observe the vibration mode of themeasurement target 4 by calculating the displacement from the strain. - The
interpolator 32 interpolates the strain distribution data in the position direction and the time direction, and calculates the strain at the mutually different plural times at the same position of theoptical fiber 21. Theinterpolator 32 can acquire the temporal change of the strain at the same position of theoptical fiber 21. Theinterpolator 32 can acquire the temporal change of the strain at the same position of themeasurement target 4 by attaching the one or moreoptical fibers 21 to plural points of themeasurement target 4. - The
calculator 33 calculates the temporal change of the strain distribution of themeasurement target 4 from the strain distribution data generated or interpolated by theinterpolator 32. The worker can easily observe such as the vibration mode of themeasurement target 4. - The
output unit 34 outputs the strain distribution data calculated by theinterpolator 32. The worker can easily observe the strain distribution data at the same time of themeasurement target 4 and the temporal change of the strain at the same position. Theoutput unit 34 outputs the displacement calculated from the strain. The worker can easily observe the vibration mode of themeasurement target 4. - Although preferred embodiments of the present invention have been described above, the present invention is not limited to the above-described embodiments.
- Next, examples of a data processor according to the present invention will be described. However, the present invention is not limited to the following examples.
-
FIG. 5A is a plan view,FIG. 5B is a left side view, andFIG. 5C is a front view of the experimental device according to the example of the data processor. As shown inFIG. 5 , it is used anelongated beam member 14 made of duralumin as a measurement target in the experiment by theexperimental apparatus 10 or theexperimental device 10. The length of the beam member 14 (the dimension in the lateral direction inFIG. 5A ) is 2.1m, the width of the beam member 14 (the dimension in the vertical direction inFIG. 5A ) is 32mm, and the thickness of the beam member 14 (the dimension in the vertical direction inFIG. 5C ) is 6mm. The right end portion of thebeam member 14 in the major axis direction is supported by theright support portion 15R. The left end portion of thebeam member 14 in the longitudinal direction is supported by theleft support portion 15L. The interval between theright support portion 15R and theleft support portion 15L is 2.0m. -
FIG. 6 is a view showing thebeam member 14.FIG. 6A is a plan view, andFIG. 6B is a bottom view. As shown inFIG. 5 andFIG. 6 , ninestrain gauges 16 are attached to the upper surface of thebeam member 14 at intervals of 0.25m. More specifically, the center position in the longitudinal direction of thebeam member 14 is set as the 0m point, theright support portion 15R side from the 0m point is the positive (+) side, and theleft support portion 15L side is the negative (-) side respectively. Then, thestrain gauge 16 is installed at nine points reactively, which are the -1m point, the -0.75m point, the -0.50m point, the -0.25m point, the 0m point, the 0.25m point, the 0.50m point, the 0.75m point, and the 1m point respectively. Anoptical fiber 18 of theoptical fiber sensor 17 is attached to the lower surface of thebeam member 14 on a position facing thestrain gauge 16 along the longitudinal direction of thebeam member 14. Thebeam member 14 vibrates by changing the conditions of theright support portion 15R and theleft support portion 15L as shown in a table 1, and by the central portion of thebeam member 14 being pushed. The conditions in the table 1 are the conditions which are used when reproducing the situation of which the support portion (theright support portion 15R and theleft support portion 15L) of the bridge model among the bridge models are deteriorating when thebeam member 14 is used as a bridge model in accordance with proceeding from theconditions 1 to theconditions 4.[Table 1] left support portion right support portion rotating horizontal moving rotating horizontal moving conditions 1 free fixed free free conditions 2 free fixed free spring buffer conditions 3 free fixed free fixed conditions 4 free fixed fixed fixed - The strain is measured by each
strain gauge 16 at a rate of 200 Hz synchronously. Distribution data of the measurement value is referred to as measured strain distribution data of thestrain gauge 16.FIG. 7 shows the measured strain distribution data of thestrain gauge 16 under theconditions 1.FIG. 8 shows the temporal change of the strain at the 0m point shown inFIG. 7 .FIG. 8A shows the measured strain distribution data of which the strains measured in the time axis direction at the 0m point connected by a line.FIG. 8B shows the measured strain distribution data of which the strains measured in the time axis direction at the 0m point represented by a set of points. - The strain at the position corresponding to each
strain gauge 16 was measured while traveling the positions at a rate of 70Hz by using theoptical fiber sensor 17 simultaneously. The distribution data of the measurement value is referred to as a measured strain distribution data of theoptical fiber sensor 17.FIG. 9 shows the measured strain distribution data of theoptical fiber sensor 17 under theconditions 1 in the table 1. Since thestrain gauge 16 and theoptical fiber 18 are respectively attached to the opposite surfaces with respect to thebeam member 14, the sign of the measured strain distribution data of thestrain gauge 16 and the sign of the measured strain distribution data of theoptical fiber sensor 17 are opposite to each other.FIG. 10 shows the temporal change of the strain at the 0m point shown inFIG. 9 .FIG. 10A shows the measured strain distribution data in which the strain measured in the time axis direction at the 0m point connected by a line, andFIG. 10B shows the measured strain distribution data in which the strain measured strain measured in the time axis direction at the 0m point shown as a set of points. - The strain at the position corresponding to each
strain gauge 16 of theoptical fiber 18 at the same time is calculated by interpolating the strain distribution data acquired by theoptical fiber sensor 17 in the time direction and the position direction. The calculated strain distribution data is referred to as interpolated strain distribution data of theoptical fiber sensor 17.FIG. 11 shows the interpolated strain distribution data of theoptical fiber sensor 17 under theconditions 1 in the table 1.FIG. 12 shows the temporal change of the strain at the 0m point shown inFIG. 11 .FIG. 12A shows the measured strain distribution data in which the strains calculated in the time axis direction connected by lines, andFIG. 12B shows the measured strain distribution data in which the strains calculated in the time axis direction represented as a set of points. - As shown in
FIG. 7 , the measured strain distribution data of thestrain gauge 16 is the strain distribution data in which the strain is measured at each position of thebeam member 14 at the same time. Therefore, it is possible to observe the strain distribution at the same time of thebeam member 14, and to observe the temporal change of the strain of theentire beam member 14. - On the other hand, as shown in
FIG. 9 , the measured strain distribution data of theoptical fiber sensor 17 is discrete strain distribution data acquired by measuring the strain at each position of thebeam member 14 at mutually different plural times. Therefore, it is impossible to observe the strain distribution of thebeam member 14 at the same time, and the temporal change of the strain of theentire beam member 14 cannot be observed. - As shown in
FIG. 11 , the interpolated strain distribution data of theoptical fiber sensor 17 is the strain distribution data of which the strain at each position of thebeam member 14 at the same time is calculated by interpolation. Therefore, it is possible to observe the strain distribution of thebeam member 14 at the same time, and to observe the temporal change of the strain of theentire beam member 14 similarly to the measured strain distribution data of thestrain gauge 16. - As shown in
FIG. 8A and FIG. 8B , since the measured strain distribution data of thestrain gauge 16 is measured the strain of thebeam member 14 at the same position at all measurement times, it is possible to accurately observe the temporal change of the strain at the same position. - On the other hand, as shown in
FIG. 10A and FIG. 10B , since the measured strain distribution data of theoptical fiber sensor 17 is not the data which is acquired by measuring the strain at the same position at all measurement times, it is impossible to accurately observe the temporal change of the strain at the same position in compared with the measured strain distribution data of the strain gauge 16 (seeFIG. 8A, and FIG. 8B ). In particular, as shown inFig. 10B , it is impossible to observe the temporal change of the strain at the same point since the measurement points are shown as dispersed if the measured strain is represented by a set of points instead of a connected line. - As shown in
FIG. 12A and FIG. 12B , since the interpolated strain distribution data of theoptical fiber sensor 17 is calculated by interpolating the strain of each position of thebeam member 14 at the same time, it can be observed the temporal change of the strain at the same position more accurately than the measured strain distribution data of thefiber sensor 17. - Next, the table 2 shows the compared result acquired by comparing the natural frequency of the
beam member 14 calculated based on the measured strain distribution data of thestrain gauge 16 and the natural vibration of thebeam member 14 calculated based on the interpolated strain distribution data of theoptical fiber sensor 17. The comparison result shows the natural vibration of thebeam member 14 in 10 seconds after thebeam member 14 was vibrated. The natural vibration of thebeam member 14 corresponds to the temporal change of the strain of theentire beam member 14.[Table 2] the natural vibration based on the measured strain distribution data of the strain gauge [Hz] the natural vibration based on the measured strain distribution data of the optical fiber sensor [Hz] a margin of error [%] conditions 13.125 3.162 1.18 conditions 25.078 5.022 1.10 conditions 35.078 5.022 1.08 conditions 46.836 6.882 0.67 - As shown in the table 2, the value of the natural vibration of the
beam member 14 calculated based on the measured strain distribution data of thestrain gauge 16 is same in theconditions 2 and in theconditions 3, and the value of the natural vibration of thebeam member 14 calculated based on the interpolated strain distribution of theoptical fiber sensor 17 is same in theconditions 2 and in theconditions 3. For this reason, it is difficult to distinguish theconditions 2 from theconditions 3 by the natural vibration. However, the value of the natural vibration of thebeam member 14 calculated based on the measured strain distribution data of thestrain gauge 16 and the value of the natural vibration of thebeam member 14 calculated based on the interpolated strain distribution data of theoptical fiber sensor 17 are very close together under all conditions. Therefore, it is understood that the interpolated strain distribution data of theoptical fiber sensor 17 has sufficient accuracy as the parameter representing the change in the natural vibration. - A table 3 shows the compared result acquired by comparing a damping ratio of the
beam member 14 calculated based on the measured strain distribution data of thestrain gauge 16 and the damping ratio of thebeam member 14 calculated based on the interpolated strain distribution data of theoptical fiber sensor 17. The comparison result shows the damping ratio of thebeam member 14 in 10 seconds after thebeam member 14 was vibrated.[Table 3] the damping ratio based on the measured strain distribution data of the strain gauge [Hz] the damping ratio based on the measured strain distribution data of the optical fiber sensor [Hz] a margin of error [%] conditions 15.69 5.57 2.11 conditions 24.13 4.32 4.60 conditions 34.19 3.64 13.12 conditions 43.86 3.27 15.28 - As shown in the table 3, the damping ratio of the
beam member 14 calculated based on the measured strain distribution data of thestrain gauge 16 and the damping ratio of thebeam member 14 calculated based on the interpolated strain distribution data of theoptical fiber sensor 17 goes away as the conditions progresses from theconditions 1 to theconditions 4. However, as described above, since this condition reproduces the situation where the bridge model deteriorates according to theconditions 1 go to theconditions 4, it is possible to estimate the chronological change tendency of the damping ratio in the bridge model from this comparison result. - Next,
FIGS. 13 to 16 show the compared results which compare the measured strain distribution data of thestrain gauge 16, the measured strain distribution data of theoptical fiber sensor 17, and the interpolated strain distribution data of theoptical fiber sensor 17 under each of conditions. In these figures, the strain of thebeam member 14 at the vibration periods of 0, π/3, 2 π /3, and π were compared. -
FIG. 13 is a diagram showing a compared result in theconditions 1.FIG. 14 is a diagram showing a compared result in theconditions 2.FIG. 15 is a diagram showing a compared result in theconditions 3.FIG. 16 is a diagram showing a compared result in theconditions 4.FIG. 13A ,FIG. 14A ,FIG. 15A , andFIG. 16A respectively show the measured strain distribution data of thestrain gauge 16.FIG. 13B ,FIG. 14B ,FIG. 15B , andFIG. 16B respectively show the measured strain distribution data of theoptical fiber sensor 17.FIG. 13C ,FIG. 14C ,FIG. 15C , andFIG. 16C respectively show the interpolated strain distribution data of theoptical fiber sensor 17. Since theoptical fiber sensor 17 can measure the strain at only one point at a certain time, the previous measured value remains unchanged except for the values measured at the 0, π/3, 2π/3, and π in theFIG. 13B ,FIG. 14B ,FIG. 15B andFIG. 16B . - As shown in
FIGS. 13A ,14A ,15A and16A , it is possible to observe the strain distribution at the same time of thebeam member 14 and to observe the temporal change of the strain of theentire beam member 14 based on the measured strain distribution data of thestrain gauge 16 under any conditions. - On the other hand, as shown in
FIGS. 13B ,14B ,15B and16B , the measured strain distribution data of theoptical fiber sensor 17 is very different from the measured strain distribution data of thestrain gauge 16. Therefore, it is impossible to observe the strain distribution of thebeam member 14 at the same time and to observe the temporal change of the strain of theentire beam member 14 in any conditions. - Then, as shown in
FIGS. 13C ,14C ,15C and16C , the interpolated strain distribution data of theoptical fiber sensor 17 is close to the measured strain distribution data of thestrain gauge 16. Therefore, it is possible to observe the strain distribution of thebeam member 14 at the same time, and to observe the temporal change of the strain of theentire beam member 14. - Next, the measured strain distribution data of the
strain gauge 16 and the interpolated strain distribution data of theoptical fiber sensor 17 are compared.FIG. 17 shows the compared result of each the strain distribution data under theconditions 1. InFIG. 17 , the measured strain distribution data of thestrain gauge 16 in each oscillation period and the interpolated strain distribution data of theoptical fiber sensor 17 are plotted on the same graph. InFIG. 17 , the horizontal axis shows the measured strain distribution data of thestrain gauge 16, and the vertical axis shows the interpolated strain distribution data of theoptical fiber sensor 17. - As shown in
FIG. 17 , the measured strain distribution data of thestrain gauge 16 and the interpolated strain distribution data of theoptical fiber sensor 17 are inversely proportional. As described above, the sign of the value of the measured strain distribution data of thestrain gauge 16 and the sign of the value of the measured strain distribution data of theoptical fiber sensor 17 are opposite to each other. Therefore, it is understood that the interpolated strain distribution data of theoptical fiber sensor 17 has sufficient accuracy from this relationship. - Next, in order to ascertain the interpolation accuracy of the interpolated strain distribution data of the
optical fiber sensor 17, it is calculated that the correlation coefficient R2 between the measured strain distribution data of thestrain gauge 16 and the measured strain distribution data of theoptical fiber sensor 17, and the correlation coefficient R2 between the measured strain distribution data of thestrain gauge 16 and the interpolated strain distribution data of theoptical fiber sensor 17. The calculated results are shown in a table 4.[Table 4] the correlation coefficient R2 between the measured strain distribution data of the strain gauge and the interpolated strain distribution data of the optical fiber sensor [Hz] the correlation coefficient R2 between the measured strain distribution data of the strain gauge and the measured strain distribution data of the optical fiber sensor [Hz] conditions 10.912 0.772 conditions 20.773 0.054 conditions 30.713 0.072 conditions 40.540 0.226 - Further, the two correlation coefficients R2, the discrepancy in natural frequency between the natural frequency based on the measured strain distribution data of the
strain gauge 16 and the natural frequency based on the interpolated strain distribution data of theoptical fiber sensor 17, and the discrepancy in the damping ratio between the damping ratio based on the measured strain distribution data of thestrain gauge 16 and the damping ratio based on the measured strain distribution data of theoptical fiber sensor 17 are plotted onFIG. 18 . InFIG. 18 , the horizontal axis shows the normalized natural frequency, the left vertical axis shows the discrepancy, and the right vertical axis shows the correlation coefficient R2. - As shown in the table 4 and
FIG. 18 , the correlation between the interpolated strain distribution data of theoptical fiber sensor 17 and the measured strain distribution data of thestrain gauge 16 is higher than the measured strain distribution data of theoptical fiber sensor 17. According to the relation, it is understood that the interpolated strain distribution data of theoptical fiber sensor 17 has sufficient accuracy.
Claims (14)
- A data processor comprising:an acquirer configured to acquire strain distribution data in which a distributed optical fiber sensor measures strains at a set of positions of an optical fiber at different times; andan interpolator configured to calculate the strains at the set of positions of the optical fiber at the same time by interpolating the positions and the times of the strain distribution data acquired by the acquirer.
- The data processor according to claim 1, wherein
the interpolator is configured to calculate the strain at the set of times of the optical fiber at the same position by interpolating the strains and the positions of the strain distribution data acquired by the acquirer. - The data processor according to claims 1 or 2, further comprising:a calculator configured to calculate a temporal change of the strain distribution of a measurement target having the optical fiber attached thereto from the strain distribution data interpolated by the interpolator.
- The data processor according to any one of claims 1 to 3, further comprising:an output unit configured to output the strain distribution data interpolated by the interpolator.
- A data processing method comprising:acquiring strain distribution data in which a distributed optical fiber sensor measures a strain at a set of positions of an optical fiber at different times; andcalculating the strains at the set of positions of the optical fiber at the same time by interpolating positions and times of the strain distribution data.
- The data processing method according to claim 5, wherein
calculating the strain at the set of times of the optical fiber at the same position by interpolating the strains and the positions of the strain distribution data. - A data processor capable of connecting with an optical fiber, the data processor comprising:an acquirer configured to acquire measured strain distribution data including measured strains, each of the measured strains being associated with respective positions over the optical fiber and with respective times when each strain was measured at the respective positions; andan interpolator configured to interpolate the measured strain distribution data acquired by the acquirer at one or more points of time at the position of the optical fiber to generate a interpolated strain distribution data over time at the point of position.
- The data processor according to claim 7, wherein
the interpolator is configured to calculate the strains at a set of positions and at a set of times of the optical fiber based on the interpolated strain distribution data generated in the interpolation process. - The data processor according to claims 7 or 8, further comprising:a calculator configured to calculate a temporal change of the strain distribution of a measurement target having the optical fiber attached thereto from the strain distribution data interpolated by the interpolator.
- The data processor according to any one of claims 7 to 9, further comprising:an output unit configured to output the strain distribution data interpolated by the interpolator.
- A data processing method comprising:acquiring measured strain distribution data including measured strains; whereineach of the measured strains being associated with respective positions over the optical fiber and with respective times when each strain was measured at the respective positions; andinterpolating the measured strain distribution data at one or more points of time at the position of the optical fiber and generating a interpolated strain distribution data over time at the point of position by the acquirer.
- The data processing method according to claim 11, wherein
the step of the interpolating is calculating the strains at a set of positions and at a set of times of the optical fiber based on the interpolated strain distribution data generated in the interpolating. - The data processing method according to claims 11 or 12, further comprising:calculating a temporal change of the strain distribution of a measurement target having the optical fiber attached thereto from the strain distribution data interpolated by the interpolator.
- The data processing method according to any one of claims 11 to 13, further comprising outputting the strain distribution data.
Applications Claiming Priority (1)
| Application Number | Priority Date | Filing Date | Title |
|---|---|---|---|
| JP2015256344A JP6486820B2 (en) | 2015-12-28 | 2015-12-28 | Strain distribution data processing apparatus and strain distribution data processing method |
Publications (2)
| Publication Number | Publication Date |
|---|---|
| EP3187821A1 true EP3187821A1 (en) | 2017-07-05 |
| EP3187821B1 EP3187821B1 (en) | 2018-08-22 |
Family
ID=57906387
Family Applications (1)
| Application Number | Title | Priority Date | Filing Date |
|---|---|---|---|
| EP16205942.2A Active EP3187821B1 (en) | 2015-12-28 | 2016-12-21 | A data processor and a data processing method |
Country Status (4)
| Country | Link |
|---|---|
| US (1) | US20170184463A1 (en) |
| EP (1) | EP3187821B1 (en) |
| JP (1) | JP6486820B2 (en) |
| CN (1) | CN106918293B (en) |
Families Citing this family (3)
| Publication number | Priority date | Publication date | Assignee | Title |
|---|---|---|---|---|
| CN110207804B (en) * | 2019-06-21 | 2020-07-14 | 华中科技大学 | A Discrete Processing Method of Distributed Acoustic Sensing Based on Single-mode Optical Fiber |
| WO2022201526A1 (en) * | 2021-03-26 | 2022-09-29 | 日本電気株式会社 | Data processing device, measurement system, and data processing method |
| WO2023275911A1 (en) * | 2021-06-28 | 2023-01-05 | Nec Corporation | Monitoring system, method of monitoring and storage medium |
Citations (2)
| Publication number | Priority date | Publication date | Assignee | Title |
|---|---|---|---|---|
| US20080145049A1 (en) * | 2006-12-13 | 2008-06-19 | Yahei Koyamada | Apparatus for measuring the characteristics of an optical fiber |
| US20100040108A1 (en) * | 2007-01-10 | 2010-02-18 | Sumitomo Electric Industries, Ltd. | Method for measuring temperature distribution of object, and sensor unit |
Family Cites Families (11)
| Publication number | Priority date | Publication date | Assignee | Title |
|---|---|---|---|---|
| JP3106443B2 (en) * | 1992-07-09 | 2000-11-06 | 住友電気工業株式会社 | Temperature distribution measuring method and device therefor |
| JP2001194191A (en) * | 2000-01-14 | 2001-07-19 | Nippon Koei Yokohama Works Co Ltd | Method and apparatus for measuring displacement of civil engineering structure |
| JP2002243588A (en) * | 2001-02-20 | 2002-08-28 | Ando Electric Co Ltd | Measuring instrument for wavelength dispersion distribution and measuring method therefor |
| JP2004020314A (en) * | 2002-06-14 | 2004-01-22 | Nippon Telegr & Teleph Corp <Ntt> | High sensitivity strain measurement device |
| DE102006023588B3 (en) * | 2006-05-17 | 2007-09-27 | Sächsisches Textilforschungsinstitut eV | Use of a geo-textile system made from a textile structure and integrated sensor fibers for improving and monitoring a dam |
| JP5168839B2 (en) * | 2006-07-31 | 2013-03-27 | 横河電機株式会社 | Optical fiber characteristic measuring device |
| ITRM20070135A1 (en) * | 2007-03-15 | 2008-09-16 | Space Software Italia S P A | APPARATUS FOR DETECTING OBJECTS IMMERSED IN INCOERENT MATERIALS AND DETECTION METHOD |
| JP2008256462A (en) * | 2007-04-03 | 2008-10-23 | Fanuc Ltd | Image display method of shape data |
| US8699009B2 (en) * | 2008-11-27 | 2014-04-15 | Neubrex Co., Ltd. | Distributed optical fiber sensor |
| RU2013138287A (en) * | 2011-01-27 | 2015-03-10 | Рамот Ат Тель Авив Юниверсити Лтд. | DETECTION OF DISTRIBUTED AND DYNAMIC SCATTERING OF MANDELSHTAM-BRILLUENE IN FIBER FIBERS |
| CN102519502B (en) * | 2011-10-25 | 2014-07-23 | 合肥工业大学 | Fiber bragg grating sensing method and system based on wavelength-division multiplexing multichannel output time-domain address finding technology |
-
2015
- 2015-12-28 JP JP2015256344A patent/JP6486820B2/en active Active
-
2016
- 2016-12-21 EP EP16205942.2A patent/EP3187821B1/en active Active
- 2016-12-26 CN CN201611218268.8A patent/CN106918293B/en active Active
- 2016-12-27 US US15/390,773 patent/US20170184463A1/en not_active Abandoned
Patent Citations (2)
| Publication number | Priority date | Publication date | Assignee | Title |
|---|---|---|---|---|
| US20080145049A1 (en) * | 2006-12-13 | 2008-06-19 | Yahei Koyamada | Apparatus for measuring the characteristics of an optical fiber |
| US20100040108A1 (en) * | 2007-01-10 | 2010-02-18 | Sumitomo Electric Industries, Ltd. | Method for measuring temperature distribution of object, and sensor unit |
Non-Patent Citations (2)
| Title |
|---|
| IMAI M ET AL: "Highly dense strain measurement of concrete retrofitted with smart fabric", NONDESTRUCTIVE CHARACTERIZATION FOR COMPOSITE MATERIALS, AEROSPACE ENGINEERING, CIVIL INFRASTRUCTURE, AND HOMELAND SECURITY 2011, SPIE, 1000 20TH ST. BELLINGHAM WA 98225-6705 USA, vol. 7983, no. 1, 24 March 2011 (2011-03-24), pages 1 - 15, XP060011251, DOI: 10.1117/12.878394 * |
| LAM; NINA SIU-NGAN: "Spatial interpolation methods: are view", vol. 10.2, 1983, THE AMERICAN CARTOGRAPHER, pages: 129 - 150 |
Also Published As
| Publication number | Publication date |
|---|---|
| US20170184463A1 (en) | 2017-06-29 |
| CN106918293B (en) | 2022-02-22 |
| EP3187821B1 (en) | 2018-08-22 |
| CN106918293A (en) | 2017-07-04 |
| JP2017120210A (en) | 2017-07-06 |
| JP6486820B2 (en) | 2019-03-20 |
Similar Documents
| Publication | Publication Date | Title |
|---|---|---|
| US10488311B2 (en) | Rigidity measurement apparatus and rigidity measurement method | |
| CN111854811A (en) | Registering measured fiber optic interference data using reference fiber optic interference data | |
| US8514382B2 (en) | Optical device and method for measuring the rotation of an object | |
| US20240142355A1 (en) | Thickness correction for video extensometer systems and methods | |
| EP3187821B1 (en) | A data processor and a data processing method | |
| EP2420796B1 (en) | Shape measuring method and shape measuring apparatus using white light interferometry | |
| KR101668788B1 (en) | Structural health assessment method and system based on rigid rink | |
| EP3575740A1 (en) | Measuring device and processing device | |
| JP2008249515A (en) | Temperature distribution measuring system and temperature distribution measuring method | |
| Moona et al. | Evaluation of measurement uncertainty for absolute flatness measurement by using Fizeau interferometer with phase-shifting capability | |
| CN105606338A (en) | Central wavelength error compensation method based on white light interference testing system | |
| JP6700699B2 (en) | Refractive index distribution measuring method, refractive index distribution measuring apparatus, and optical element manufacturing method | |
| EP3021095B1 (en) | Spectroscopy system with displacement compensation and spectroscopy method using the spectroscopy system | |
| KR101816418B1 (en) | Displacement and inclination data fusion method for estimating structural deformation | |
| CN104748699A (en) | Optical measurement system and method | |
| JP2019049566A (en) | Distortion distribution data processing device and distortion distribution data processing method | |
| KR20090098225A (en) | Coordinate Measuring Machine Using Reference Plate | |
| KR101033031B1 (en) | Strain measuring device | |
| JP6797439B2 (en) | 3D white light scanner calibration method | |
| JP2008286598A (en) | Wavelength estimation method of tracking laser interferometer | |
| KR101919141B1 (en) | Optical sensor based blood pressure measuring device | |
| JP5008029B2 (en) | Temperature distribution measuring system and temperature distribution measuring method | |
| JPH0428686A (en) | Installation error measuring device for elevator guide rail | |
| EP3693694B1 (en) | Method for gauging surfaces with classification of measurements as valid or non-valid | |
| KR102103600B1 (en) | Logistics system |
Legal Events
| Date | Code | Title | Description |
|---|---|---|---|
| PUAI | Public reference made under article 153(3) epc to a published international application that has entered the european phase |
Free format text: ORIGINAL CODE: 0009012 |
|
| AK | Designated contracting states |
Kind code of ref document: A1 Designated state(s): AL AT BE BG CH CY CZ DE DK EE ES FI FR GB GR HR HU IE IS IT LI LT LU LV MC MK MT NL NO PL PT RO RS SE SI SK SM TR |
|
| AX | Request for extension of the european patent |
Extension state: BA ME |
|
| 17P | Request for examination filed |
Effective date: 20180105 |
|
| RBV | Designated contracting states (corrected) |
Designated state(s): AL AT BE BG CH CY CZ DE DK EE ES FI FR GB GR HR HU IE IS IT LI LT LU LV MC MK MT NL NO PL PT RO RS SE SI SK SM TR |
|
| GRAP | Despatch of communication of intention to grant a patent |
Free format text: ORIGINAL CODE: EPIDOSNIGR1 |
|
| RIC1 | Information provided on ipc code assigned before grant |
Ipc: G01B 11/16 20060101AFI20180215BHEP Ipc: G01L 1/24 20060101ALI20180215BHEP Ipc: G01D 5/353 20060101ALI20180215BHEP |
|
| INTG | Intention to grant announced |
Effective date: 20180309 |
|
| GRAS | Grant fee paid |
Free format text: ORIGINAL CODE: EPIDOSNIGR3 |
|
| GRAA | (expected) grant |
Free format text: ORIGINAL CODE: 0009210 |
|
| AK | Designated contracting states |
Kind code of ref document: B1 Designated state(s): AL AT BE BG CH CY CZ DE DK EE ES FI FR GB GR HR HU IE IS IT LI LT LU LV MC MK MT NL NO PL PT RO RS SE SI SK SM TR |
|
| REG | Reference to a national code |
Ref country code: GB Ref legal event code: FG4D |
|
| REG | Reference to a national code |
Ref country code: CH Ref legal event code: EP |
|
| REG | Reference to a national code |
Ref country code: AT Ref legal event code: REF Ref document number: 1033012 Country of ref document: AT Kind code of ref document: T Effective date: 20180915 |
|
| REG | Reference to a national code |
Ref country code: IE Ref legal event code: FG4D |
|
| REG | Reference to a national code |
Ref country code: DE Ref legal event code: R096 Ref document number: 602016004998 Country of ref document: DE |
|
| REG | Reference to a national code |
Ref country code: NL Ref legal event code: MP Effective date: 20180822 |
|
| REG | Reference to a national code |
Ref country code: LT Ref legal event code: MG4D |
|
| PG25 | Lapsed in a contracting state [announced via postgrant information from national office to epo] |
Ref country code: RS Free format text: LAPSE BECAUSE OF FAILURE TO SUBMIT A TRANSLATION OF THE DESCRIPTION OR TO PAY THE FEE WITHIN THE PRESCRIBED TIME-LIMIT Effective date: 20180822 Ref country code: IS Free format text: LAPSE BECAUSE OF FAILURE TO SUBMIT A TRANSLATION OF THE DESCRIPTION OR TO PAY THE FEE WITHIN THE PRESCRIBED TIME-LIMIT Effective date: 20181222 Ref country code: LT Free format text: LAPSE BECAUSE OF FAILURE TO SUBMIT A TRANSLATION OF THE DESCRIPTION OR TO PAY THE FEE WITHIN THE PRESCRIBED TIME-LIMIT Effective date: 20180822 Ref country code: NL Free format text: LAPSE BECAUSE OF FAILURE TO SUBMIT A TRANSLATION OF THE DESCRIPTION OR TO PAY THE FEE WITHIN THE PRESCRIBED TIME-LIMIT Effective date: 20180822 Ref country code: BG Free format text: LAPSE BECAUSE OF FAILURE TO SUBMIT A TRANSLATION OF THE DESCRIPTION OR TO PAY THE FEE WITHIN THE PRESCRIBED TIME-LIMIT Effective date: 20181122 Ref country code: SE Free format text: LAPSE BECAUSE OF FAILURE TO SUBMIT A TRANSLATION OF THE DESCRIPTION OR TO PAY THE FEE WITHIN THE PRESCRIBED TIME-LIMIT Effective date: 20180822 Ref country code: GR Free format text: LAPSE BECAUSE OF FAILURE TO SUBMIT A TRANSLATION OF THE DESCRIPTION OR TO PAY THE FEE WITHIN THE PRESCRIBED TIME-LIMIT Effective date: 20181123 Ref country code: FI Free format text: LAPSE BECAUSE OF FAILURE TO SUBMIT A TRANSLATION OF THE DESCRIPTION OR TO PAY THE FEE WITHIN THE PRESCRIBED TIME-LIMIT Effective date: 20180822 Ref country code: NO Free format text: LAPSE BECAUSE OF FAILURE TO SUBMIT A TRANSLATION OF THE DESCRIPTION OR TO PAY THE FEE WITHIN THE PRESCRIBED TIME-LIMIT Effective date: 20181122 |
|
| REG | Reference to a national code |
Ref country code: AT Ref legal event code: MK05 Ref document number: 1033012 Country of ref document: AT Kind code of ref document: T Effective date: 20180822 |
|
| PG25 | Lapsed in a contracting state [announced via postgrant information from national office to epo] |
Ref country code: HR Free format text: LAPSE BECAUSE OF FAILURE TO SUBMIT A TRANSLATION OF THE DESCRIPTION OR TO PAY THE FEE WITHIN THE PRESCRIBED TIME-LIMIT Effective date: 20180822 Ref country code: LV Free format text: LAPSE BECAUSE OF FAILURE TO SUBMIT A TRANSLATION OF THE DESCRIPTION OR TO PAY THE FEE WITHIN THE PRESCRIBED TIME-LIMIT Effective date: 20180822 Ref country code: AL Free format text: LAPSE BECAUSE OF FAILURE TO SUBMIT A TRANSLATION OF THE DESCRIPTION OR TO PAY THE FEE WITHIN THE PRESCRIBED TIME-LIMIT Effective date: 20180822 |
|
| PG25 | Lapsed in a contracting state [announced via postgrant information from national office to epo] |
Ref country code: IT Free format text: LAPSE BECAUSE OF FAILURE TO SUBMIT A TRANSLATION OF THE DESCRIPTION OR TO PAY THE FEE WITHIN THE PRESCRIBED TIME-LIMIT Effective date: 20180822 Ref country code: RO Free format text: LAPSE BECAUSE OF FAILURE TO SUBMIT A TRANSLATION OF THE DESCRIPTION OR TO PAY THE FEE WITHIN THE PRESCRIBED TIME-LIMIT Effective date: 20180822 Ref country code: CZ Free format text: LAPSE BECAUSE OF FAILURE TO SUBMIT A TRANSLATION OF THE DESCRIPTION OR TO PAY THE FEE WITHIN THE PRESCRIBED TIME-LIMIT Effective date: 20180822 Ref country code: EE Free format text: LAPSE BECAUSE OF FAILURE TO SUBMIT A TRANSLATION OF THE DESCRIPTION OR TO PAY THE FEE WITHIN THE PRESCRIBED TIME-LIMIT Effective date: 20180822 Ref country code: AT Free format text: LAPSE BECAUSE OF FAILURE TO SUBMIT A TRANSLATION OF THE DESCRIPTION OR TO PAY THE FEE WITHIN THE PRESCRIBED TIME-LIMIT Effective date: 20180822 Ref country code: ES Free format text: LAPSE BECAUSE OF FAILURE TO SUBMIT A TRANSLATION OF THE DESCRIPTION OR TO PAY THE FEE WITHIN THE PRESCRIBED TIME-LIMIT Effective date: 20180822 Ref country code: PL Free format text: LAPSE BECAUSE OF FAILURE TO SUBMIT A TRANSLATION OF THE DESCRIPTION OR TO PAY THE FEE WITHIN THE PRESCRIBED TIME-LIMIT Effective date: 20180822 |
|
| REG | Reference to a national code |
Ref country code: DE Ref legal event code: R097 Ref document number: 602016004998 Country of ref document: DE |
|
| PG25 | Lapsed in a contracting state [announced via postgrant information from national office to epo] |
Ref country code: SK Free format text: LAPSE BECAUSE OF FAILURE TO SUBMIT A TRANSLATION OF THE DESCRIPTION OR TO PAY THE FEE WITHIN THE PRESCRIBED TIME-LIMIT Effective date: 20180822 Ref country code: DK Free format text: LAPSE BECAUSE OF FAILURE TO SUBMIT A TRANSLATION OF THE DESCRIPTION OR TO PAY THE FEE WITHIN THE PRESCRIBED TIME-LIMIT Effective date: 20180822 Ref country code: SM Free format text: LAPSE BECAUSE OF FAILURE TO SUBMIT A TRANSLATION OF THE DESCRIPTION OR TO PAY THE FEE WITHIN THE PRESCRIBED TIME-LIMIT Effective date: 20180822 |
|
| PLBE | No opposition filed within time limit |
Free format text: ORIGINAL CODE: 0009261 |
|
| STAA | Information on the status of an ep patent application or granted ep patent |
Free format text: STATUS: NO OPPOSITION FILED WITHIN TIME LIMIT |
|
| 26N | No opposition filed |
Effective date: 20190523 |
|
| PG25 | Lapsed in a contracting state [announced via postgrant information from national office to epo] |
Ref country code: SI Free format text: LAPSE BECAUSE OF FAILURE TO SUBMIT A TRANSLATION OF THE DESCRIPTION OR TO PAY THE FEE WITHIN THE PRESCRIBED TIME-LIMIT Effective date: 20180822 Ref country code: LU Free format text: LAPSE BECAUSE OF NON-PAYMENT OF DUE FEES Effective date: 20181221 Ref country code: MC Free format text: LAPSE BECAUSE OF FAILURE TO SUBMIT A TRANSLATION OF THE DESCRIPTION OR TO PAY THE FEE WITHIN THE PRESCRIBED TIME-LIMIT Effective date: 20180822 |
|
| REG | Reference to a national code |
Ref country code: IE Ref legal event code: MM4A |
|
| REG | Reference to a national code |
Ref country code: BE Ref legal event code: MM Effective date: 20181231 |
|
| PG25 | Lapsed in a contracting state [announced via postgrant information from national office to epo] |
Ref country code: IE Free format text: LAPSE BECAUSE OF NON-PAYMENT OF DUE FEES Effective date: 20181221 |
|
| PG25 | Lapsed in a contracting state [announced via postgrant information from national office to epo] |
Ref country code: BE Free format text: LAPSE BECAUSE OF NON-PAYMENT OF DUE FEES Effective date: 20181231 |
|
| PG25 | Lapsed in a contracting state [announced via postgrant information from national office to epo] |
Ref country code: MT Free format text: LAPSE BECAUSE OF NON-PAYMENT OF DUE FEES Effective date: 20181221 |
|
| PG25 | Lapsed in a contracting state [announced via postgrant information from national office to epo] |
Ref country code: TR Free format text: LAPSE BECAUSE OF FAILURE TO SUBMIT A TRANSLATION OF THE DESCRIPTION OR TO PAY THE FEE WITHIN THE PRESCRIBED TIME-LIMIT Effective date: 20180822 |
|
| PG25 | Lapsed in a contracting state [announced via postgrant information from national office to epo] |
Ref country code: PT Free format text: LAPSE BECAUSE OF FAILURE TO SUBMIT A TRANSLATION OF THE DESCRIPTION OR TO PAY THE FEE WITHIN THE PRESCRIBED TIME-LIMIT Effective date: 20180822 |
|
| PG25 | Lapsed in a contracting state [announced via postgrant information from national office to epo] |
Ref country code: HU Free format text: LAPSE BECAUSE OF FAILURE TO SUBMIT A TRANSLATION OF THE DESCRIPTION OR TO PAY THE FEE WITHIN THE PRESCRIBED TIME-LIMIT; INVALID AB INITIO Effective date: 20161221 Ref country code: MK Free format text: LAPSE BECAUSE OF NON-PAYMENT OF DUE FEES Effective date: 20180822 Ref country code: CY Free format text: LAPSE BECAUSE OF FAILURE TO SUBMIT A TRANSLATION OF THE DESCRIPTION OR TO PAY THE FEE WITHIN THE PRESCRIBED TIME-LIMIT Effective date: 20180822 |
|
| REG | Reference to a national code |
Ref country code: CH Ref legal event code: PL |
|
| PG25 | Lapsed in a contracting state [announced via postgrant information from national office to epo] |
Ref country code: LI Free format text: LAPSE BECAUSE OF NON-PAYMENT OF DUE FEES Effective date: 20191231 Ref country code: CH Free format text: LAPSE BECAUSE OF NON-PAYMENT OF DUE FEES Effective date: 20191231 |
|
| P01 | Opt-out of the competence of the unified patent court (upc) registered |
Effective date: 20230603 |
|
| PGFP | Annual fee paid to national office [announced via postgrant information from national office to epo] |
Ref country code: DE Payment date: 20251126 Year of fee payment: 10 |
|
| PGFP | Annual fee paid to national office [announced via postgrant information from national office to epo] |
Ref country code: GB Payment date: 20251119 Year of fee payment: 10 |
|
| PGFP | Annual fee paid to national office [announced via postgrant information from national office to epo] |
Ref country code: FR Payment date: 20251120 Year of fee payment: 10 |